Embed Size (px)
Citation preview
Neural Nets and Genetic Algorithms in Data Mining
Muhammad Ali Yousuf

References
• Based on Lectures by M. Zaki
• http://www.cs.rpi.edu/~zaki/dmcourse/
• and
• David Squire
• http://www.csse.monash.edu.au
Lecture Outline
• Why study neural networks?• What are neural networks and how do
they work?• History of artificial neural networks
(NNs)• Applications and advantages• Choosing and preparing data • An illustrative example
Why Study Neural Networks? - 1
• Two basic motivations for NN research:– to model brain function– to solve engineering (and business) problems
Why Study Neural Networks? - 1
• So far as modeling the brain goes, it is worth remembering:
“… metaphors for the brain are usually based on the most complex device currently available: in the seventeenth century the brain was compared to a hydraulic system, and in the early twentieth century to a telephone switchboard. Now, of course, we compare the brain to a digital computer.”
Why Study Neural Networks? - 2
• Historically, NN theories were first developed by neurophysiologists.
• For engineers (and others), the attractions of NN processing include:– inherent parallelism– speed (avoiding the von Neumann bottleneck)– distributed “holographic” storage of information– robustness– generalization– learning by example rather than having to understand
the underlying problem (a double-edged sword!)
Why Study Neural Networks? - 3
• It is important to be wary of the black-box characterization of NNs as “artificial brains”
Why Study Neural Networks? - 3
• Beware of the anthropomorphisms common in the field (let alone in popular coverage of NNs!)– learning
– memory
– training
– forgetting
• Remember that every NN is a mathematical model. There is usually a good statistical explanation of NN behaviour
What Is a Neuron? - 1
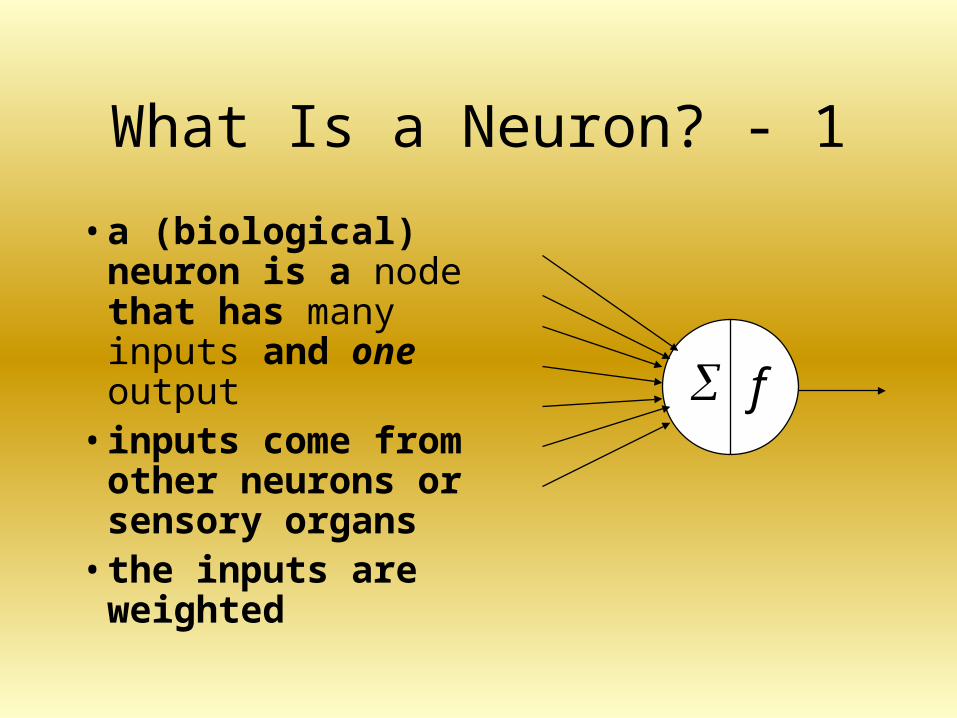
• a (biological) neuron is a node that has many inputs and one output
• inputs come from other neurons or sensory organs
• the inputs are weighted
f
What Is a Neuron? - 1
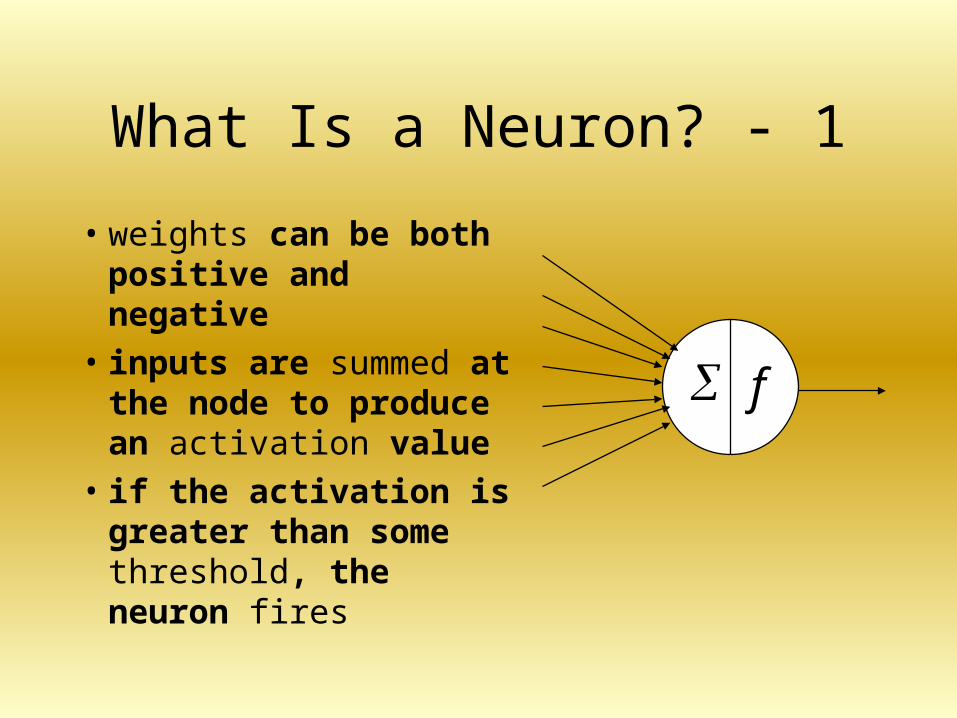
• weights can be both positive and negative
• inputs are summed at the node to produce an activation value
• if the activation is greater than some threshold, the neuron fires
f
What Is a Neuron? - 2
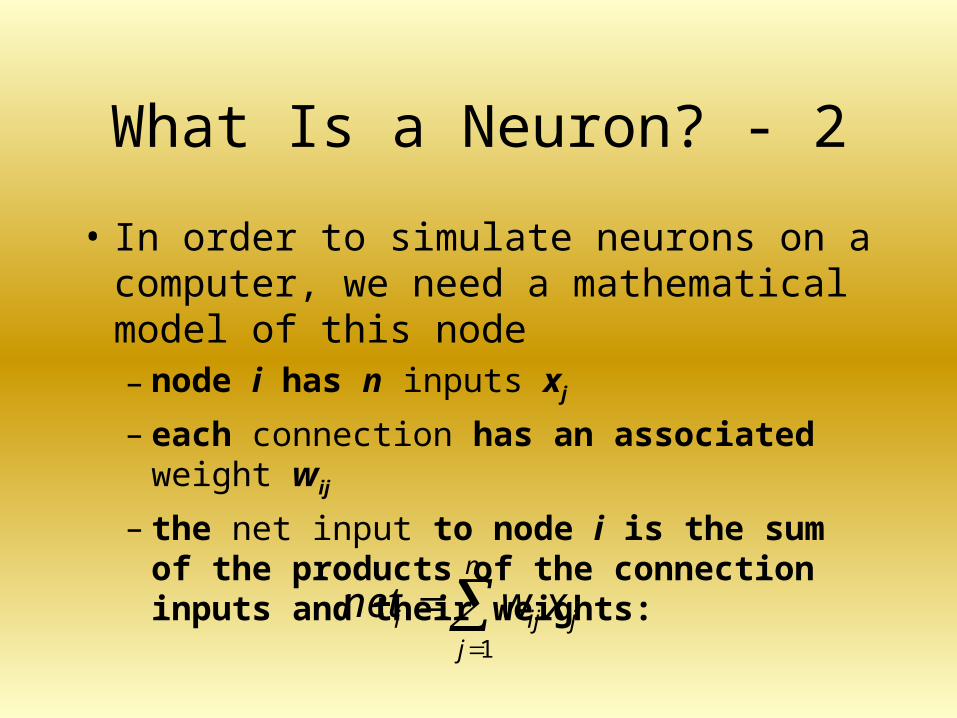
• In order to simulate neurons on a computer, we need a mathematical model of this node– node i has n inputs xj
– each connection has an associated weight wij
– the net input to node i is the sum of the products of the connection inputs and their weights:
n
jjiji xwnet
1
What Is a Neuron? - 2
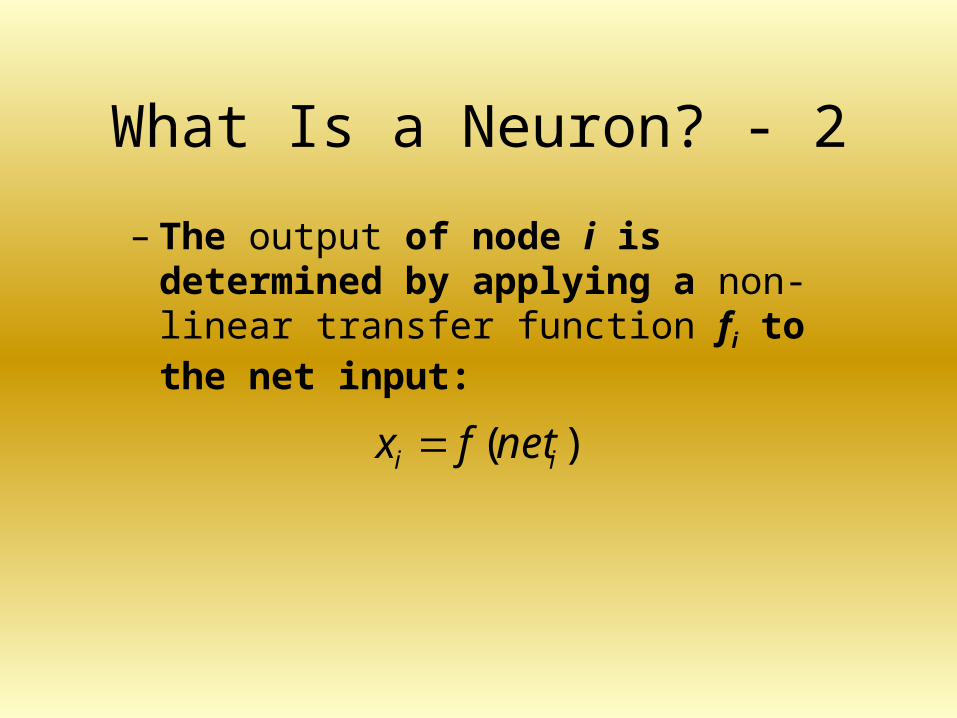
– The output of node i is determined by applying a non-linear transfer function fi to the net input:
)( ii netfx
What Is a Neuron? - 3
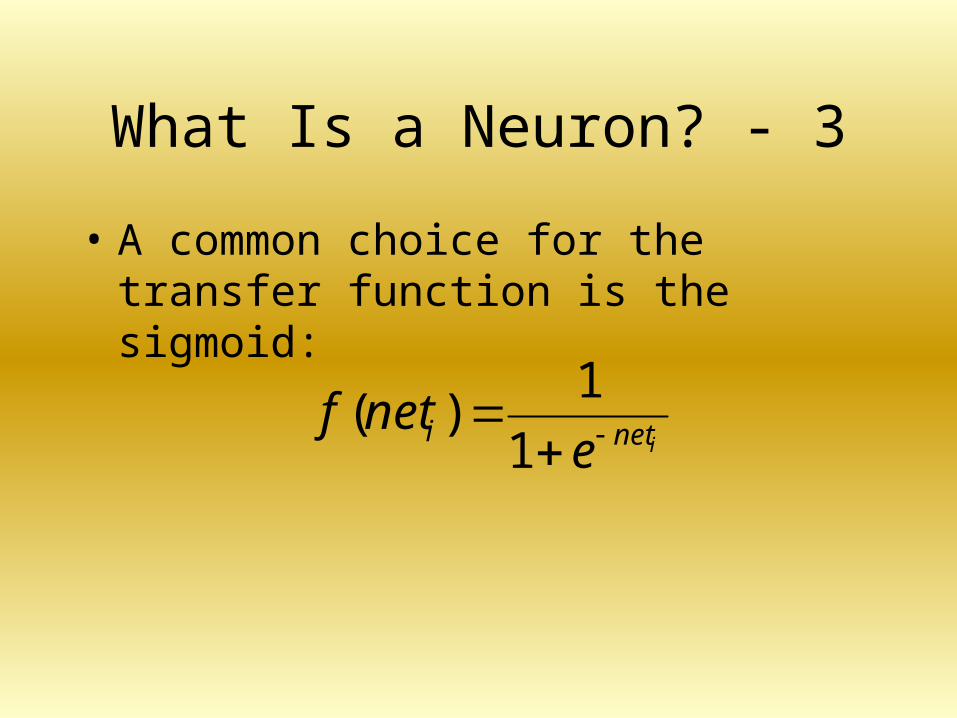
• A common choice for the transfer function is the sigmoid:
ineti enetf
1
1)(
What Is a Neuron? - 3
• The sigmoid has similar non-linear properties to the transfer function of real neurons:– bounded below by 0– saturates when input becomes large– bounded above by 1
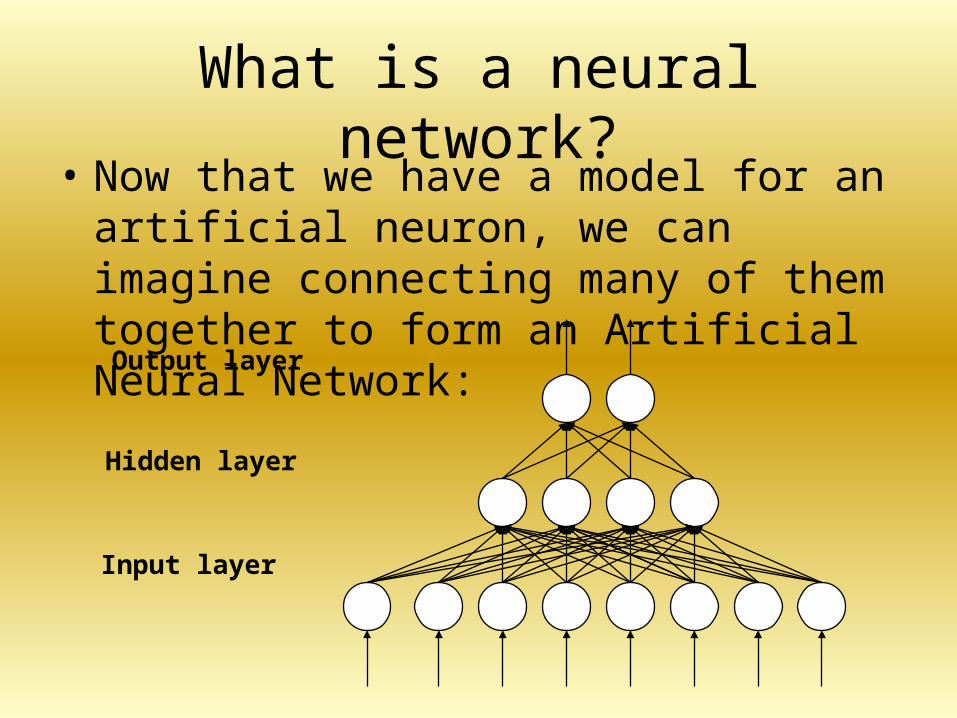
What is a neural network?• Now that we have a model for an artificial
neuron, we can imagine connecting many of them together to form an Artificial Neural Network:
Input layer
Hidden layer
Output layer
Applications of NNs
• Predicting financial time series• Diagnosing medical conditions• Identifying clusters in customer databases• Identifying fraudulent credit card transactions• Hand-written character recognition (cheques)• Predicting the failure rate of machinery• and many more….
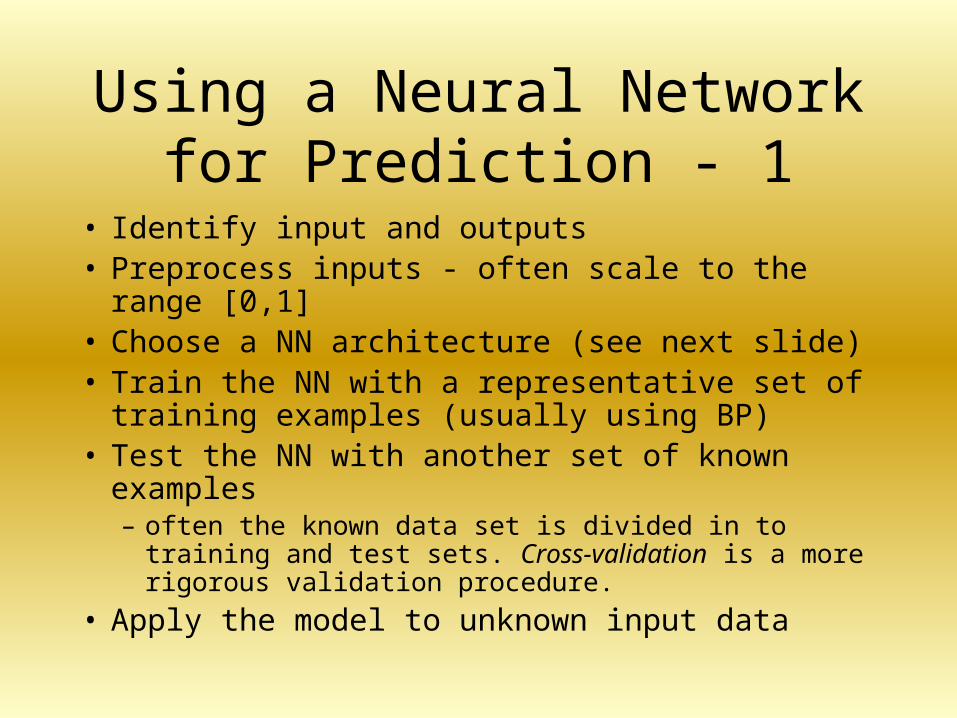
Using a Neural Network for Prediction - 1
• Identify input and outputs• Preprocess inputs - often scale to the range [0,1]• Choose a NN architecture (see next slide)• Train the NN with a representative set of training
examples (usually using BP)• Test the NN with another set of known examples
– often the known data set is divided in to training and test sets. Cross-validation is a more rigorous validation procedure.
• Apply the model to unknown input data
Using a Neural Network for Prediction - 2
• The network designer must decide the network architecture for a given application
• It has been proven that one hidden layer is sufficient to handle all situations of practical interest
Using a Neural Network for Prediction - 2
• The number of nodes in the hidden layer will determine the complexity of the NN model (and thus its capacity to recognize patterns)
• BUT, too many hidden nodes will result in the memorization of individual training patterns, rather than generalization
• Amount of available training data is an important factor - must be large for a complex model
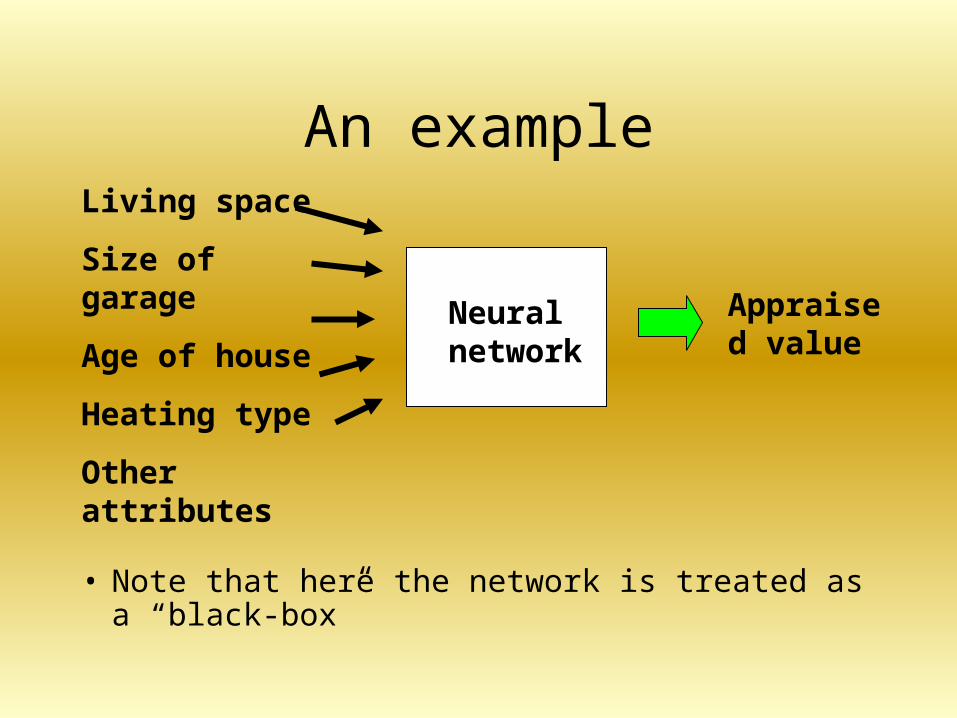
An example
• Note that here the network is treated as a “black-box”
Living space
Size of garage
Age of house
Heating type
Other attributes
Neural network
Appraised value
Issues in choosing the training data set
• The neural network is only as good as the data set with which it is trained upon
• When selecting training data, the designer should consider:– Whether all important features are covered
– What are the important/necessary features
– The number of inputs
– The number of outputs
– Availability of hardware

Preparing Data
• Preprocessing is usually the most complicated and time-consuming issue when working with NNs (as with any DM tool)
Preparing Data
• Main types of data encountered:– Continuous data with known min/max values
(range/domain known). There problems with skewed distributions: solutions include removing values or using log function to filter
– Ordered, discrete values: e.g. low, medium, high
– Categorical values (no order): e.g. {“Male”, “Female”, “Unknown”} ( use “1 of N coding” or “1 of N-1 coding”)

Preparing Data
• There will always be other problems where the analyst’s experience and ingenuity must be used

Illustrative Example – 1(Following
http://www.geog.leeds.ac.uk/courses/level3/geog3110/week6/sld047.htm Ff.)
• Organization– a building society with 5 million customers and
using a direct mailing campaign to promote a new investment product to existing savers
Illustrative Example – 1(Following
http://www.geog.leeds.ac.uk/courses/level3/geog3110/week6/sld047.htm Ff.)
• Available data– The 5 million customer database
– Results of an initial test mailing where 50,000 customers (randomly selected) were mailed. There were 1000 responses (2%) in terms of product take up
• Objective– Find a way of targeting the mailing so that:
• the response rate is doubled to 4%
• at least 40,000 new investment holders are brought in
Illustrative Example - 2
• For simplicity we assume that only two attributes (features) of a customer are relevant for this situation:– TIMEAC: time (in years) that the account has
been open– AVEBAL: average account balance over the
past 3 months
Illustrative Example - 2
• Examining the data, it was obvious to analysts that the pattern of respondents is different from the non-respondents. But what are the reasons for this?
• We need to know the reasons to select/develop a model for identifying such responding customers
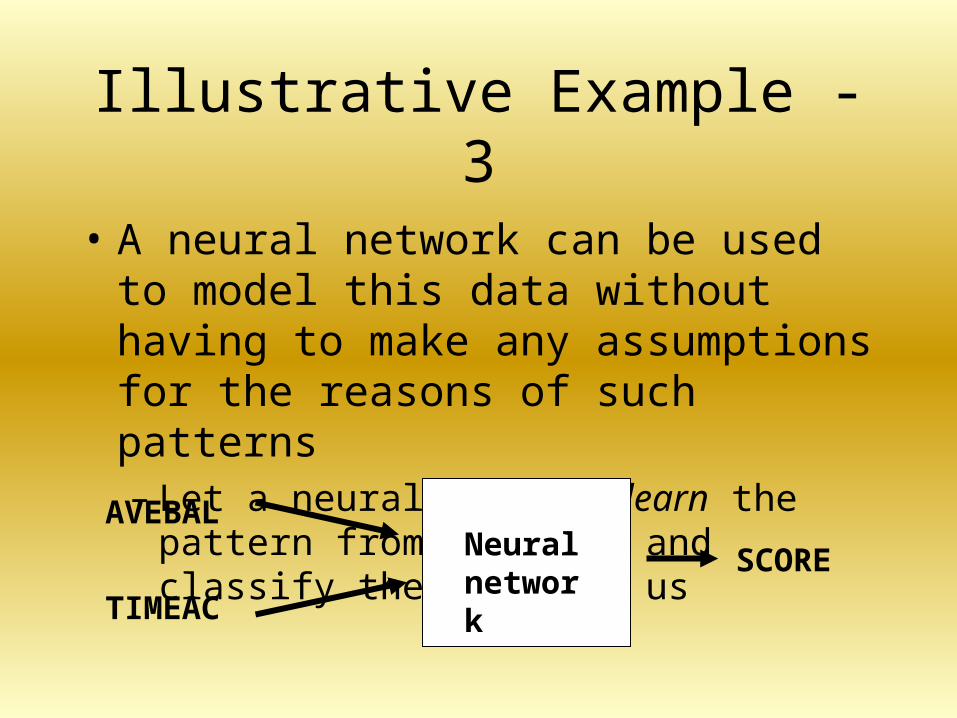
Illustrative Example - 3
• A neural network can be used to model this data without having to make any assumptions for the reasons of such patterns– Let a neural network learn the pattern from the
data and classify the data for us
Neural network
AVEBAL
TIMEAC
SCORE
Illustrative Example - 4 Preparing the training and test data sets
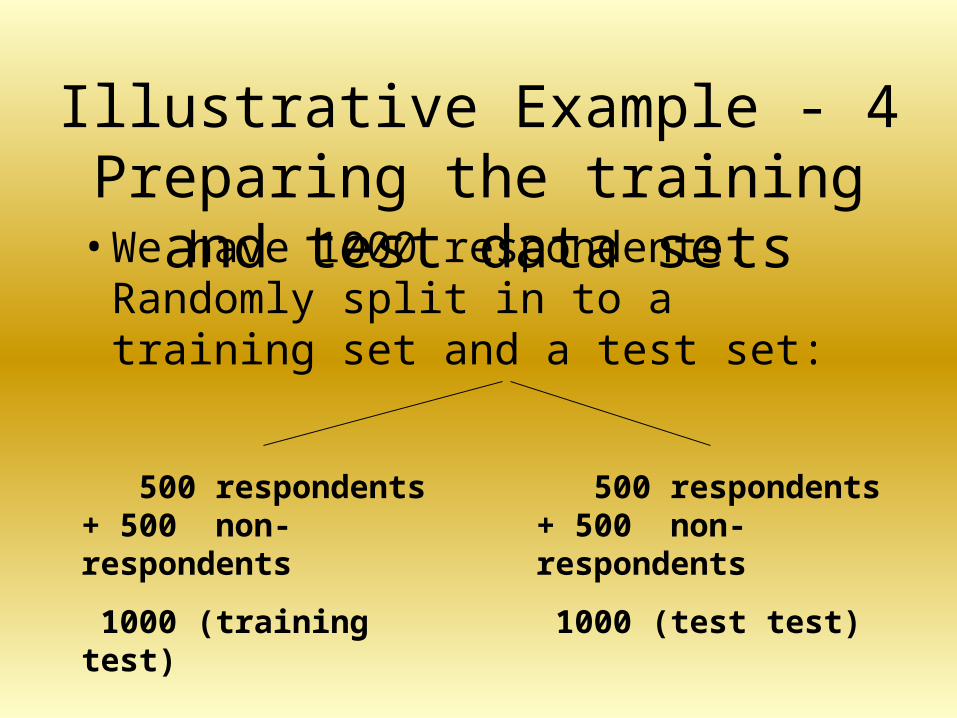
• We have 1000 respondents. Randomly split in to a training set and a test set:
500 respondents+ 500 non-respondents
1000 (training test)
500 respondents+ 500 non-respondents
1000 (test test)
Illustrative Example - 4: Preparing the training and test data sets
• The network is trained by making repeated passes over the training data, adjusting weights using the BP algorithm
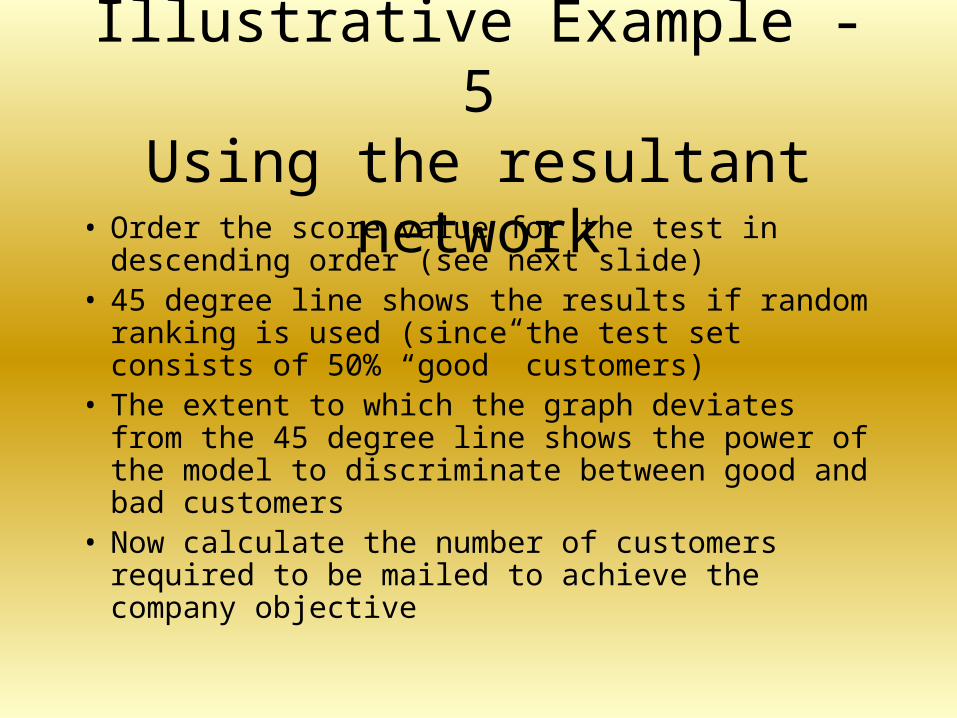
Illustrative Example - 5Using the resultant network
• Order the score value for the test in descending order (see next slide)
• 45 degree line shows the results if random ranking is used (since the test set consists of 50% “good” customers)
• The extent to which the graph deviates from the 45 degree line shows the power of the model to discriminate between good and bad customers
• Now calculate the number of customers required to be mailed to achieve the company objective
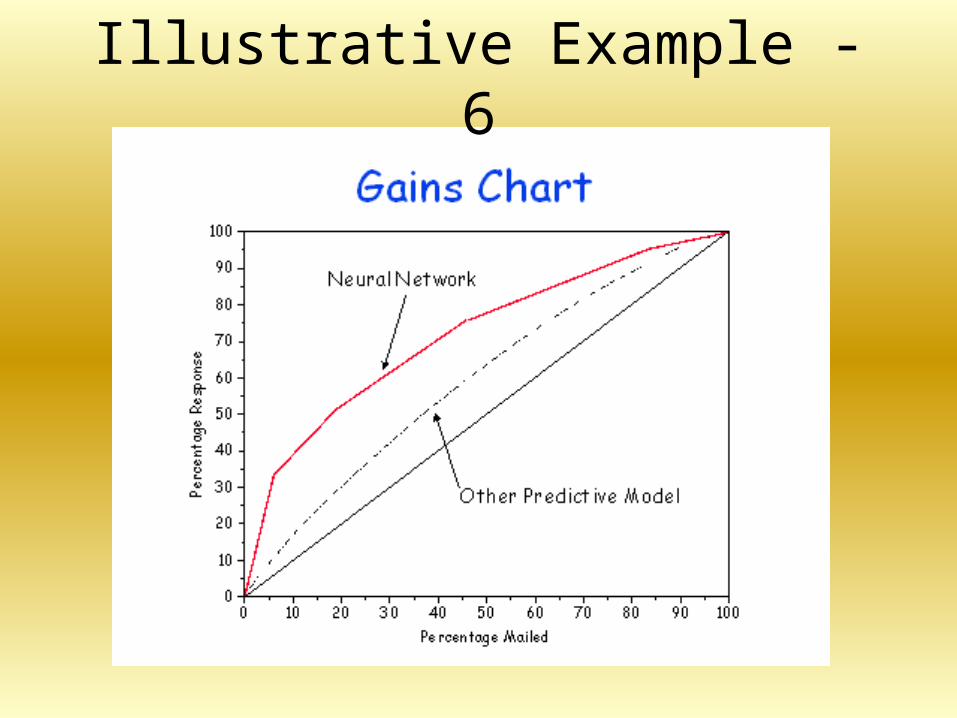
Illustrative Example - 6

Illustrative Example - 7
• Analysis shows that company objectives are achievable:
40,000 product holders at 4% response
• Can save hundreds of thousands of dollars in mailing costs
• Better than the other model in this example
Unsupervised Learning - Motivation - 1
• The feed-forward back-propagation NNs discussed last week are an example of a supervised learning technique
• In supervised learning, the aim is to discover a relationship between the inputs and outputs of a system
Unsupervised Learning - Motivation - 1
• This relationship can be used for tasks such as prediction, estimation or classification
• A known training set of input/output pairs is used to train the network
Motivation - Unsupervised Learning
• Many data mining tasks are not suited to this approach
• Often the data mining task is to discover structure in the data set, without any prior knowledge of what is there
Motivation - Unsupervised Learning
• This is an example of unsupervised learning (we have already seen the example of the K-means clustering algorithm)
• A class of neural networks called Self-Organizing Maps (SOMs) can be used for this task
The Cortex - 1
• SOMs research was inspired by the observation of topologically correct sensory maps in the cortex
• In humans, the cortex consists of a layer of nerve tissue about 0.2m2 in area and 2-3mm in thickness
• It is highly convoluted to save space, and forms the exterior of the brain - it’s the folded, wrinkled stuff we see when we look at a brain
The Cortex - 2
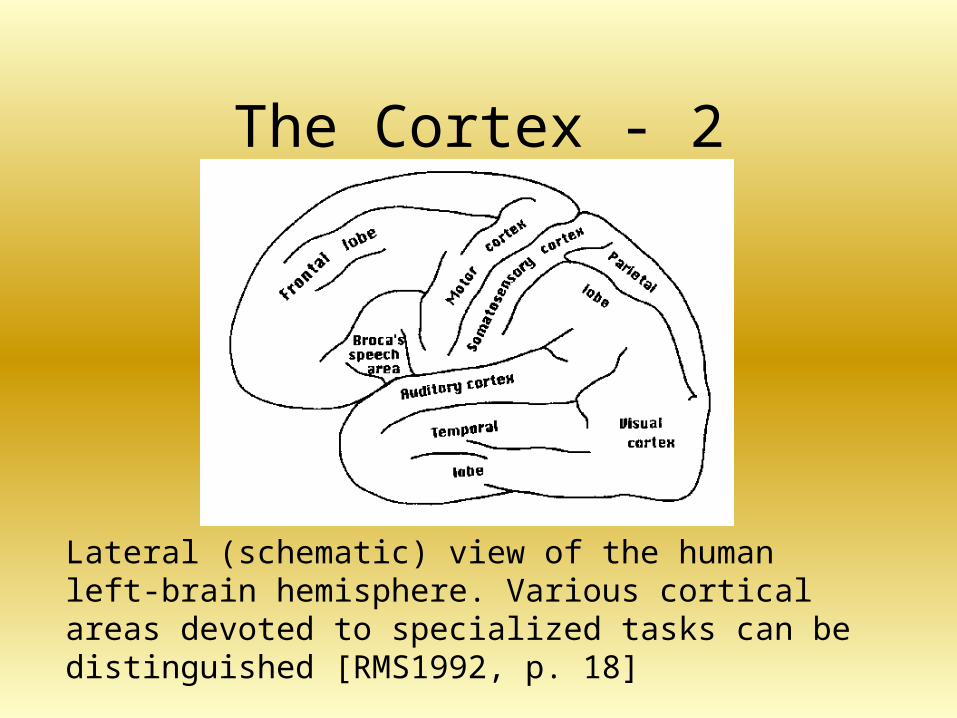
Lateral (schematic) view of the human left-brain hemisphere. Various cortical areas devoted to specialized tasks can be distinguished [RMS1992, p. 18]
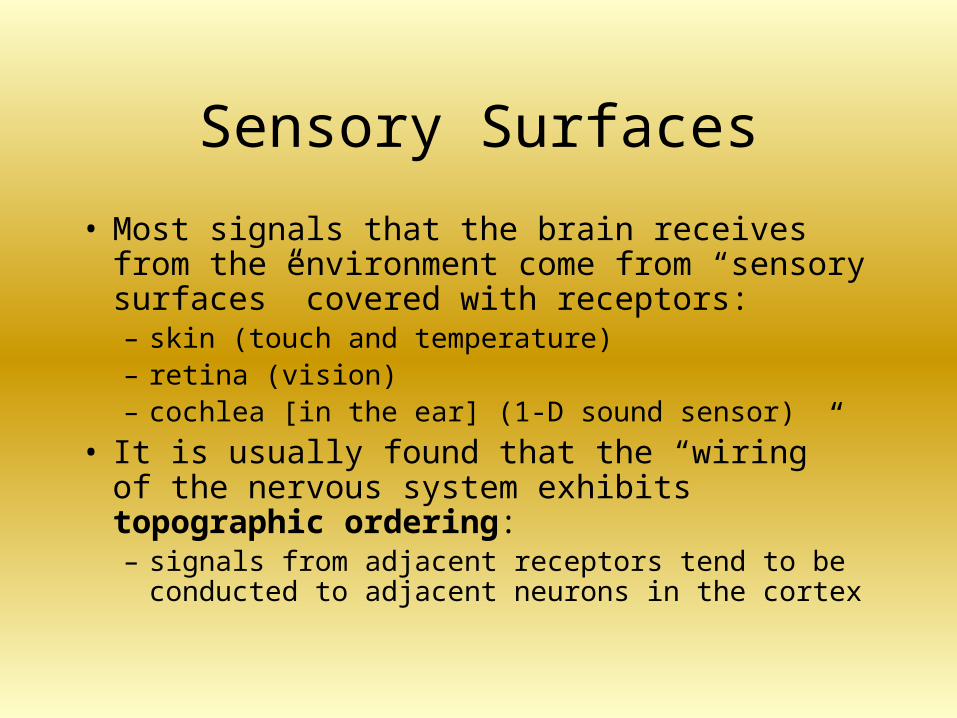
Sensory Surfaces
• Most signals that the brain receives from the environment come from “sensory surfaces” covered with receptors:– skin (touch and temperature)– retina (vision)– cochlea [in the ear] (1-D sound sensor)
• It is usually found that the “wiring” of the nervous system exhibits topographic ordering:– signals from adjacent receptors tend to be conducted to
adjacent neurons in the cortex
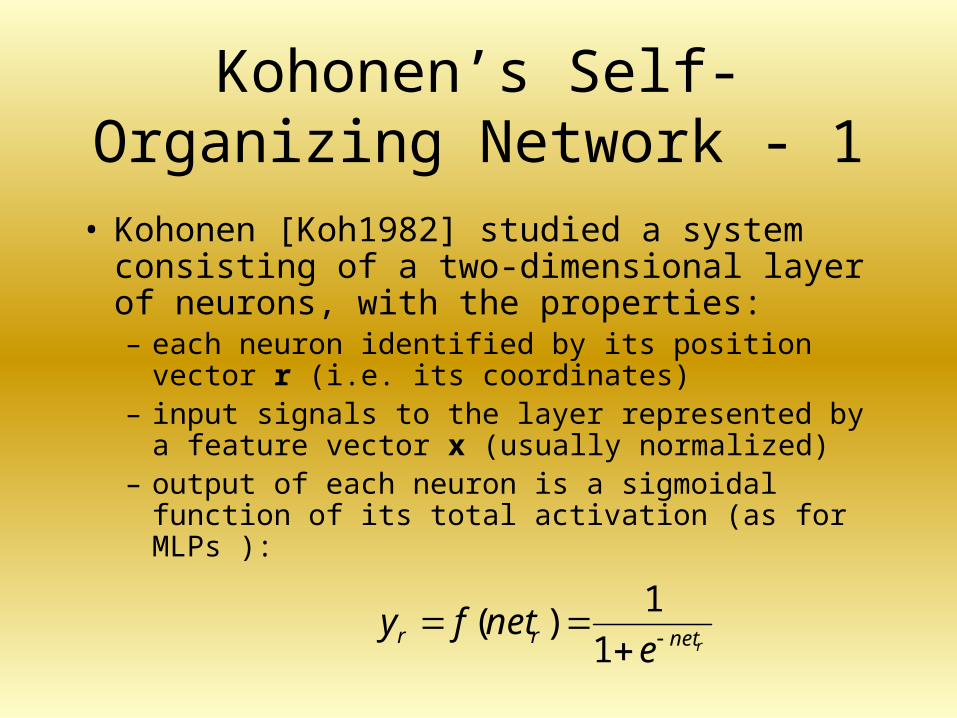
Kohonen’s Self-Organizing Network - 1
• Kohonen [Koh1982] studied a system consisting of a two-dimensional layer of neurons, with the properties:– each neuron identified by its position vector r (i.e. its
coordinates)– input signals to the layer represented by a feature vector
x (usually normalized)– output of each neuron is a sigmoidal function of its
total activation (as for MLPs ):
rnetrr enetfy
1
1)(
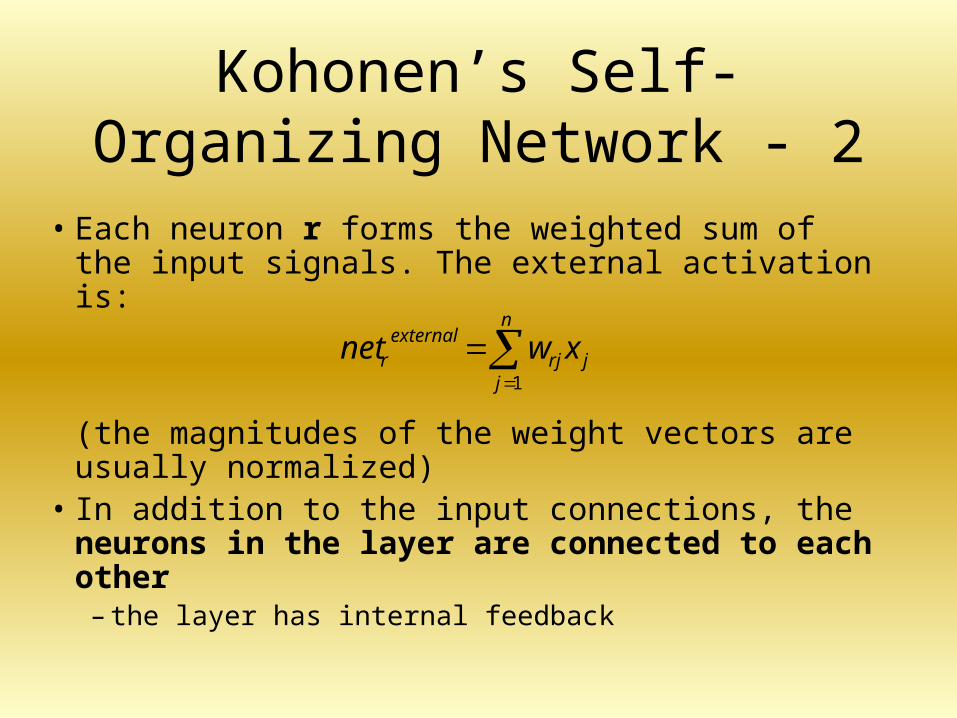
Kohonen’s Self-Organizing Network - 2
• Each neuron r forms the weighted sum of the input signals. The external activation is:
(the magnitudes of the weight vectors are usually normalized)
• In addition to the input connections, the neurons in the layer are connected to each other
– the layer has internal feedback
n
jjrj
externalr xwnet
1
Kohonen’s Self-Organizing Network - 2
• The weight from neuron r’ to neuron r is labelled grr’
• These lateral inputs are superimposed on the external input signal:
Kohonen’s Self-Organizing Network - 3
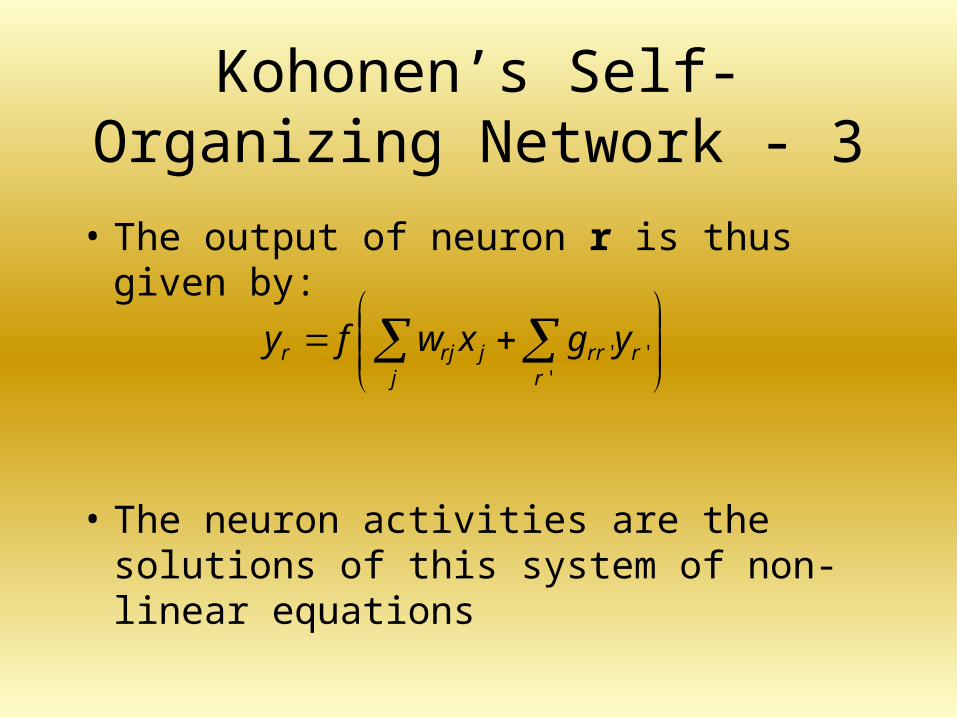
• The output of neuron r is thus given by:
• The neuron activities are the solutions of this system of non-linear equations
j rrrrjrjr ygxwfy
'''
Kohonen’s Self-Organizing Network - 3
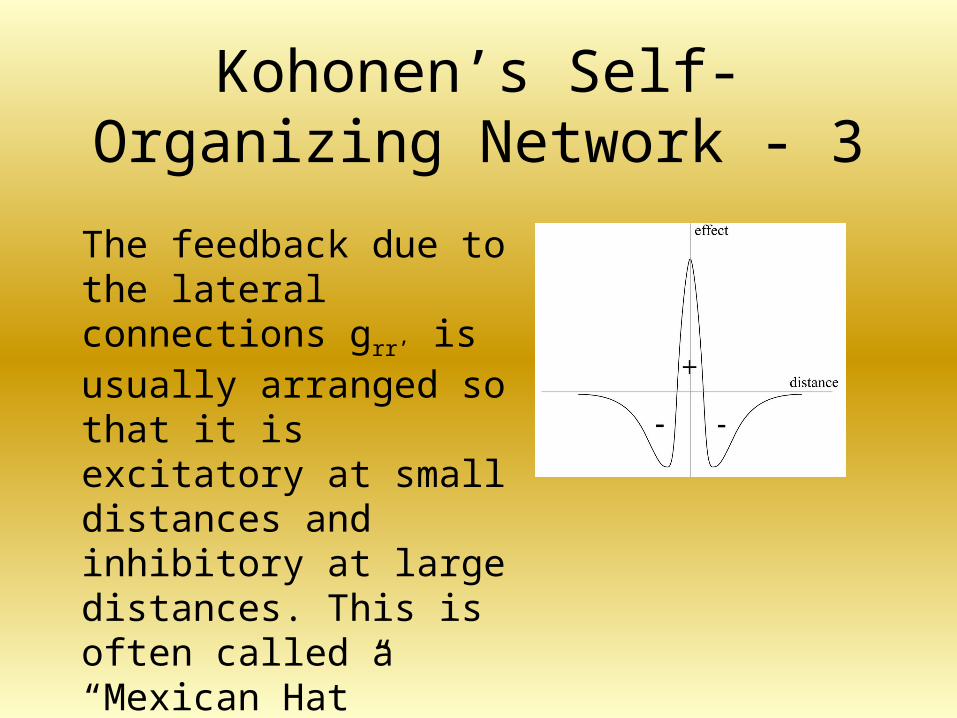
The feedback due to the lateral connections grr’ is usually arranged so that it is excitatory at small distances and inhibitory at large distances. This is often called a “Mexican Hat” response
Kohonen’s Self-Organizing Network - 4
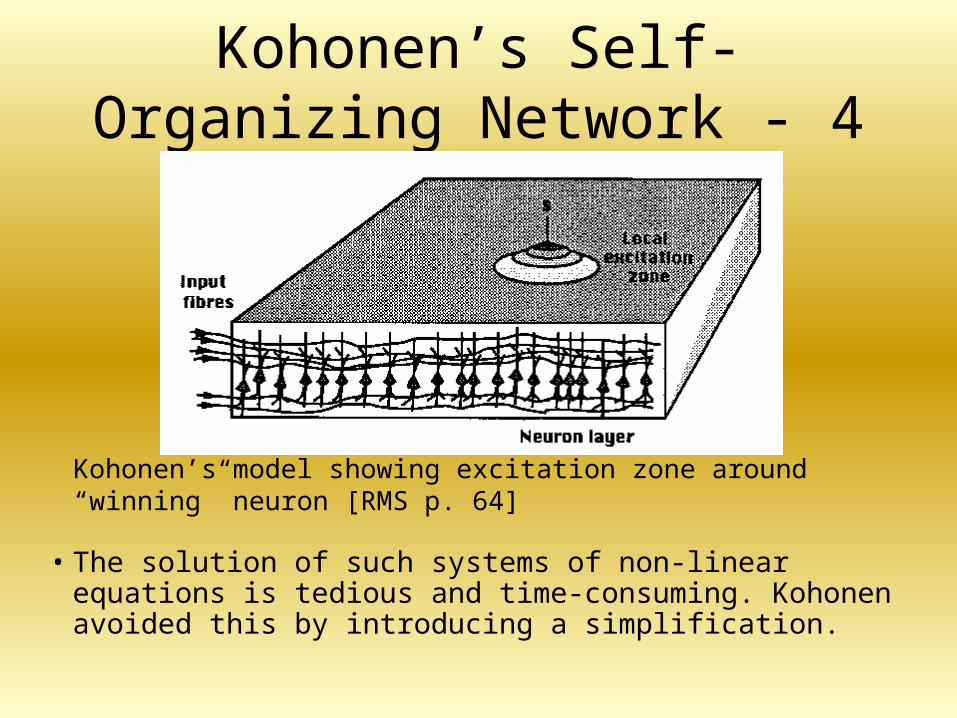
• The solution of such systems of non-linear equations is tedious and time-consuming. Kohonen avoided this by introducing a simplification.
Kohonen’s model showing excitation zone around “winning” neuron [RMS p. 64]
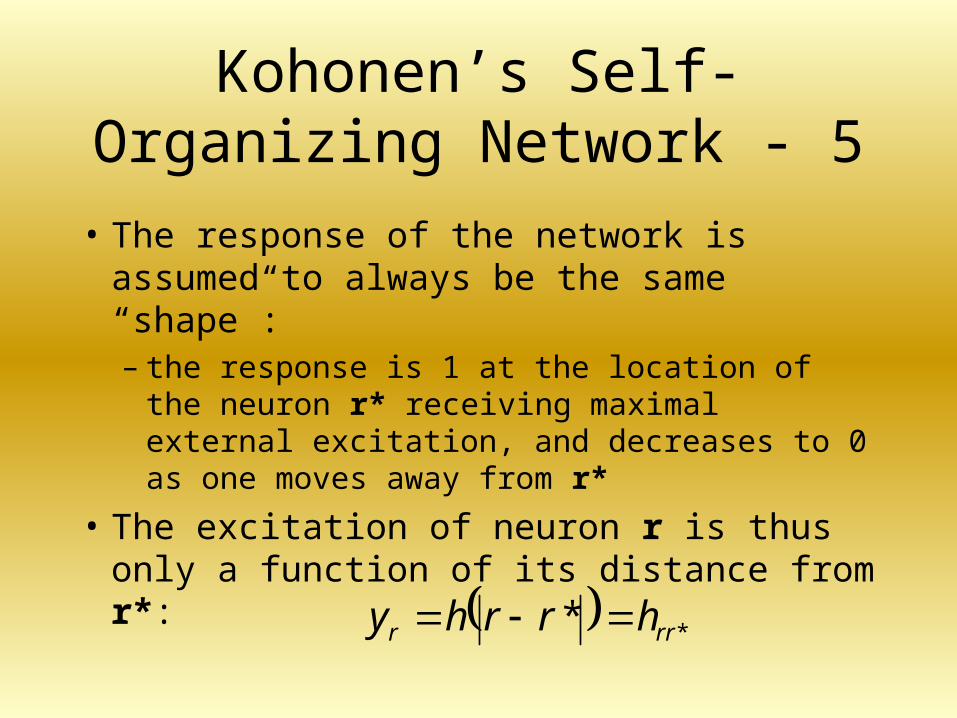
Kohonen’s Self-Organizing Network - 5
• The response of the network is assumed to always be the same “shape”:– the response is 1 at the location of the neuron
r* receiving maximal external excitation, and decreases to 0 as one moves away from r*
• The excitation of neuron r is thus only a function of its distance from r*:
** rrr hrrhy
Kohonen’s Self-Organizing Network - 5
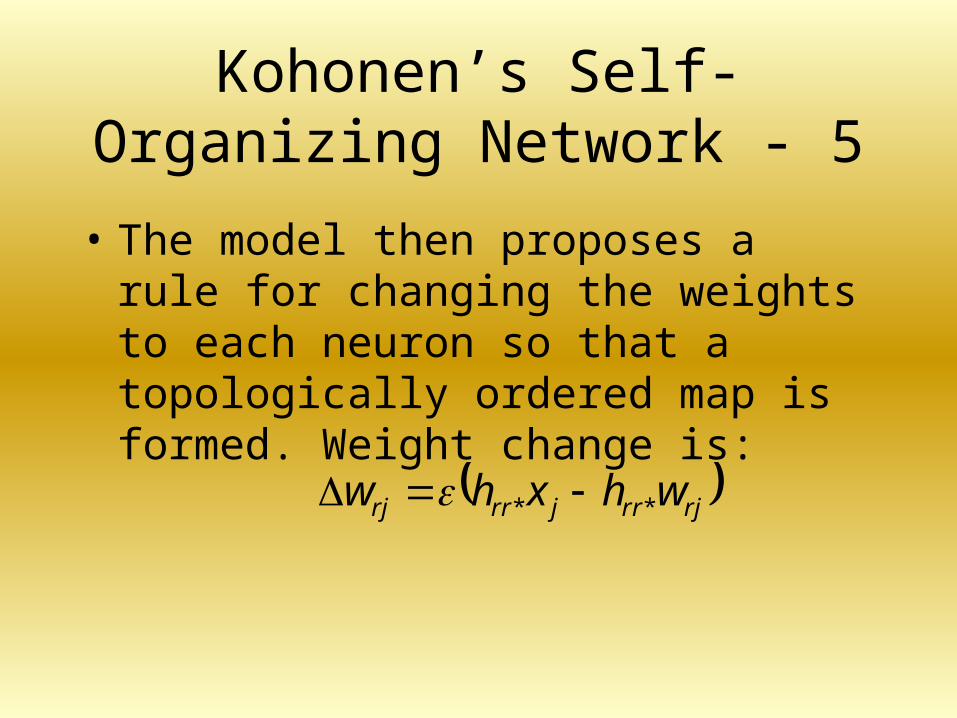
• The model then proposes a rule for changing the weights to each neuron so that a topologically ordered map is formed. Weight change is:
rjrrjrrrj whxhw **
Kohonen’s Self-Organizing Network - 6
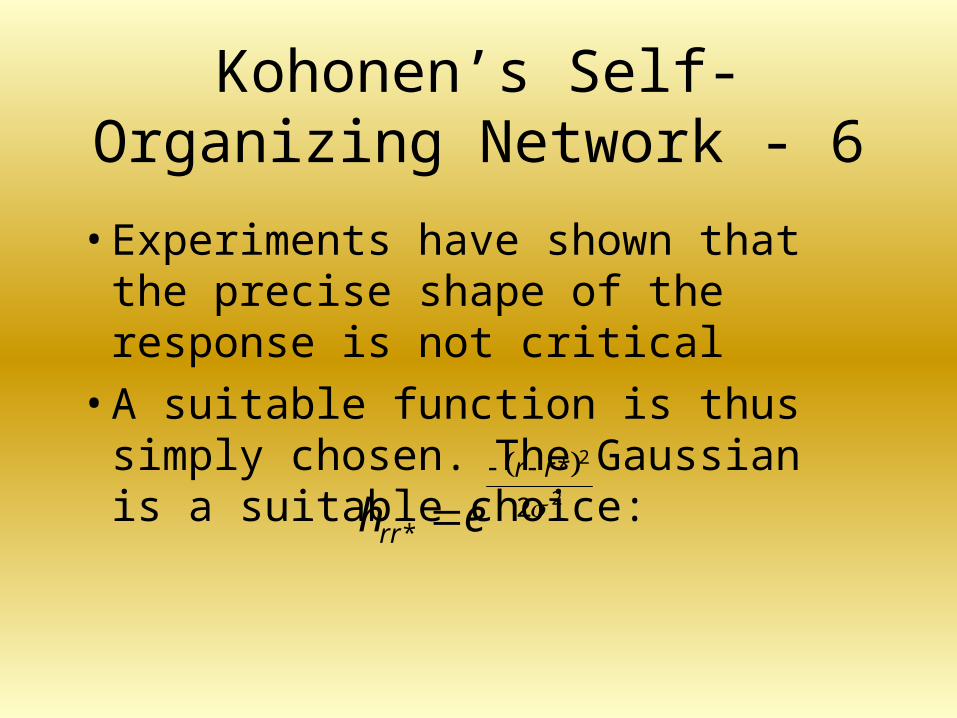
• Experiments have shown that the precise shape of the response is not critical
• A suitable function is thus simply chosen. The Gaussian is a suitable choice:
2
2
2
*
*rr
rr eh
Kohonen’s Self-Organizing Network - 6
• The parameter determines the length scale on which input stimuli cause changes in the map– usually learn coarse structure first and then the
fine structure. This is done by letting s decrease over time
on the previous slide, which specifies the size of each change, usually also decreases over time
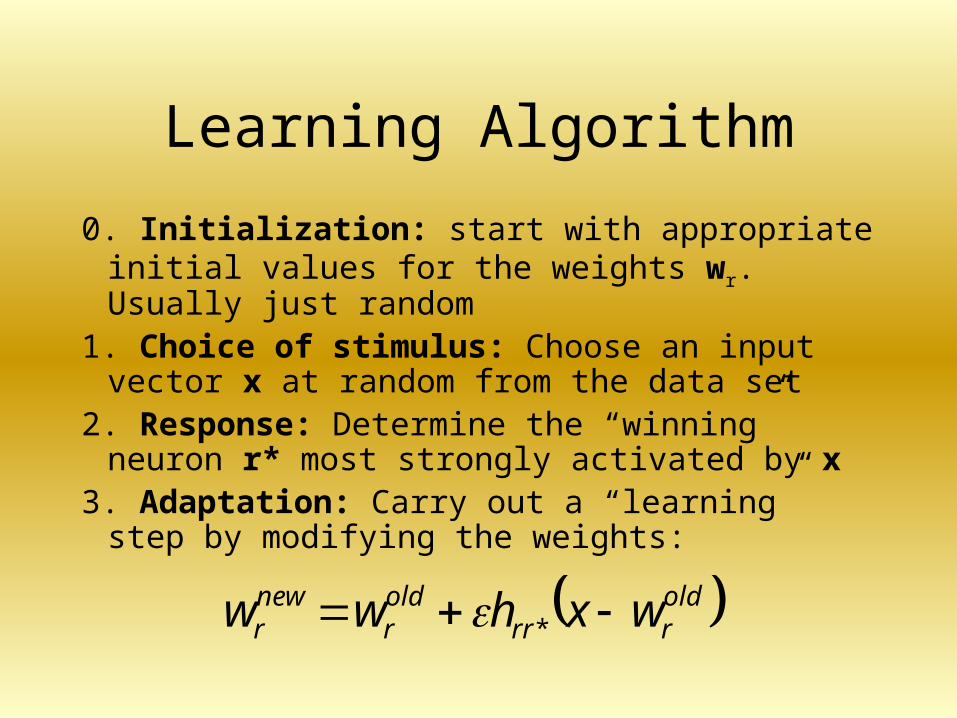
Learning Algorithm
0. Initialization: start with appropriate initial values for the weights wr. Usually just random
1. Choice of stimulus: Choose an input vector x at random from the data set
2. Response: Determine the “winning” neuron r* most strongly activated by x
3. Adaptation: Carry out a “learning” step by modifying the weights:
oldrrr
oldr
newr wxhww *
Learning Algorithm
(Normalize weights if required)
4. Continue with step 1 until specified number of learning steps are completed
Examples - 1
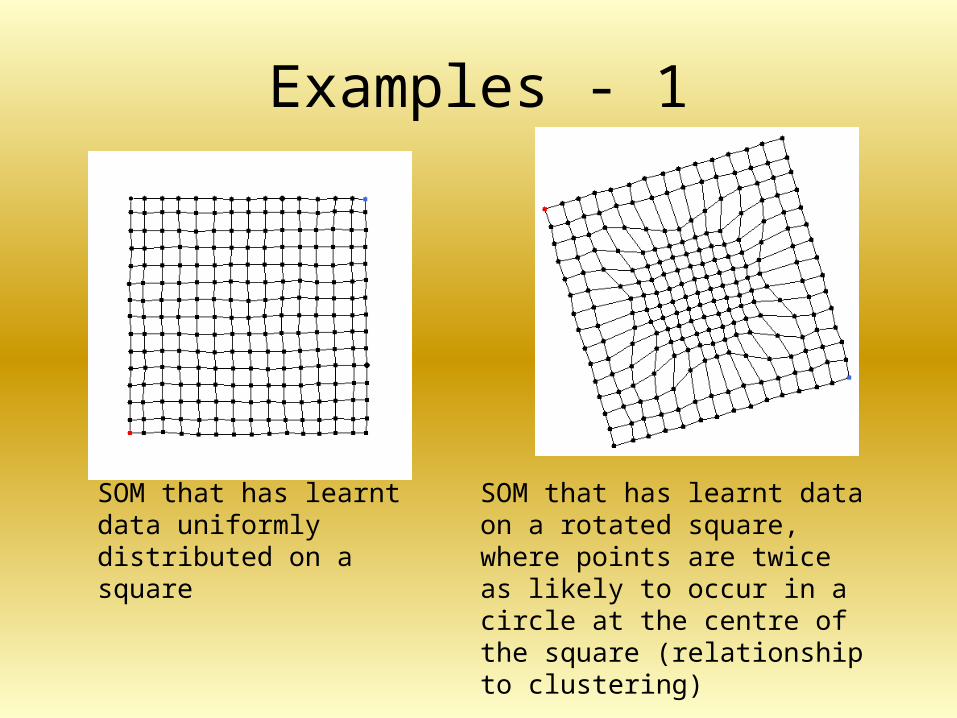
SOM that has learnt data uniformly distributed on a square
SOM that has learnt data on a rotated square, where points are twice as likely to occur in a circle at the centre of the square (relationship to clustering)
Examples - 2
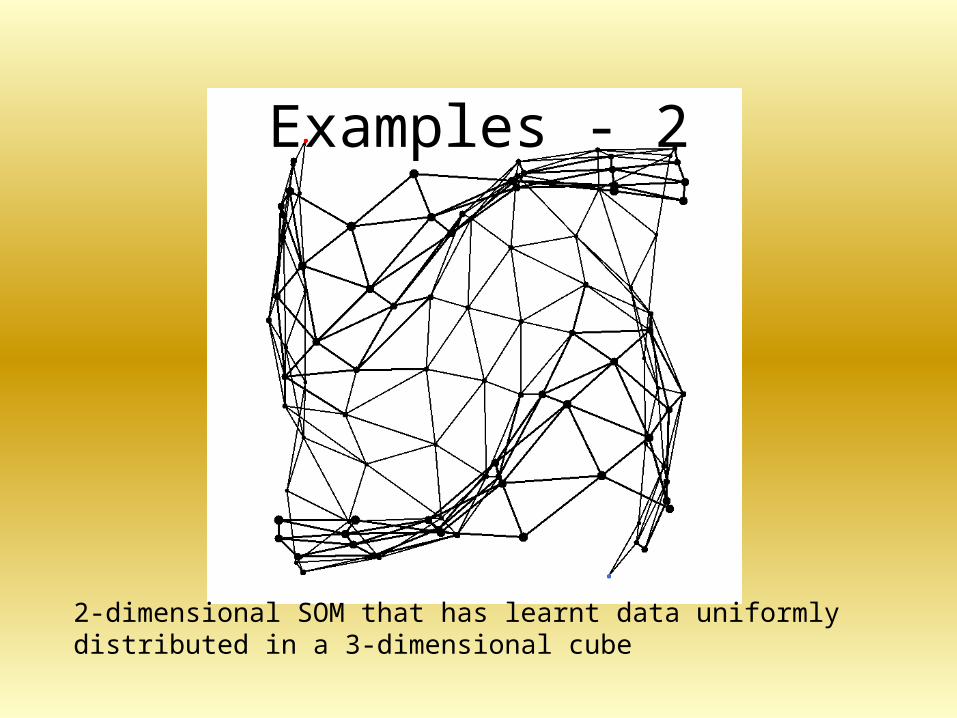
2-dimensional SOM that has learnt data uniformly distributed in a 3-dimensional cube
Examples - 3
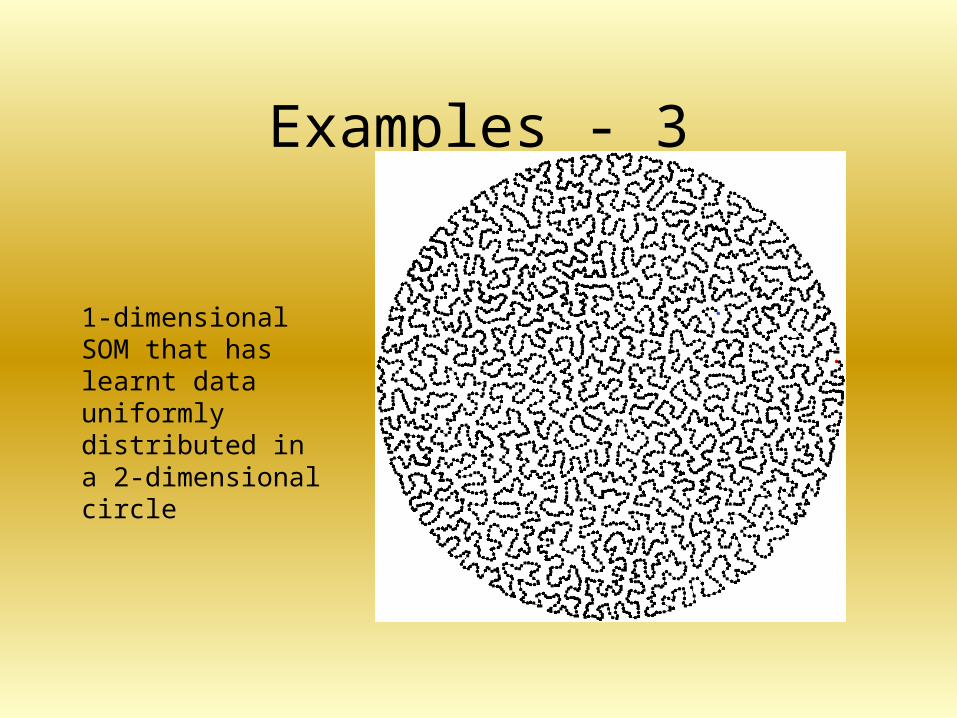
1-dimensional SOM that has learnt data uniformly distributed in a 2-dimensional circle
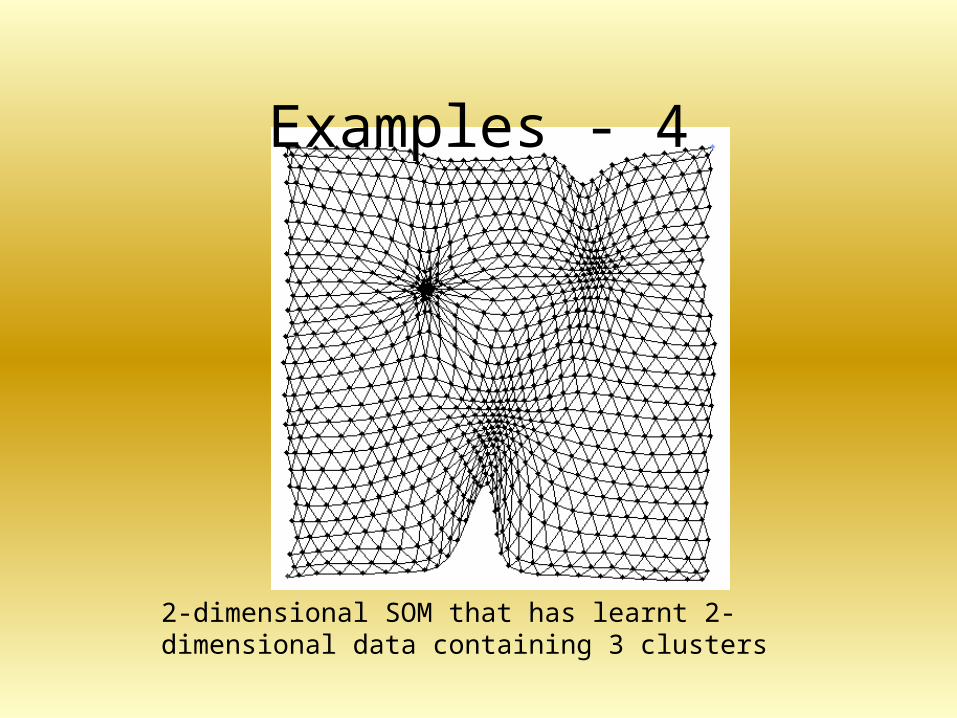
2-dimensional SOM that has learnt 2-dimensional data containing 3 clusters
Examples - 4
The SOM for Data Mining
• The SOM is a good method for obtaining an initial understanding of a set of data about which the analyst does not have any opinion (e.g. no need to estimate number of clusters)
The SOM for Data Mining
• The map can be used as an initial unbiased starting point for further analysis.
• Once the clusters are selected from the map, they are analyzed to find out the reasons for such clustering– It may be possible to determine which attributes were
responsible for the clusters
– It may also be possible to identify some attributes which do not contribute to the clustering

Example - Text Mining with a SOM - 1
• This example comes from the WEBSOM project in Finland: http://websom.hut.fi/websom/
• WEBSOM is a method for organizing miscellaneous text documents onto meaningful maps for exploration and search. WEBSOM automatically organizes the documents onto a two-dimensional grid so that related documents appear close to each other
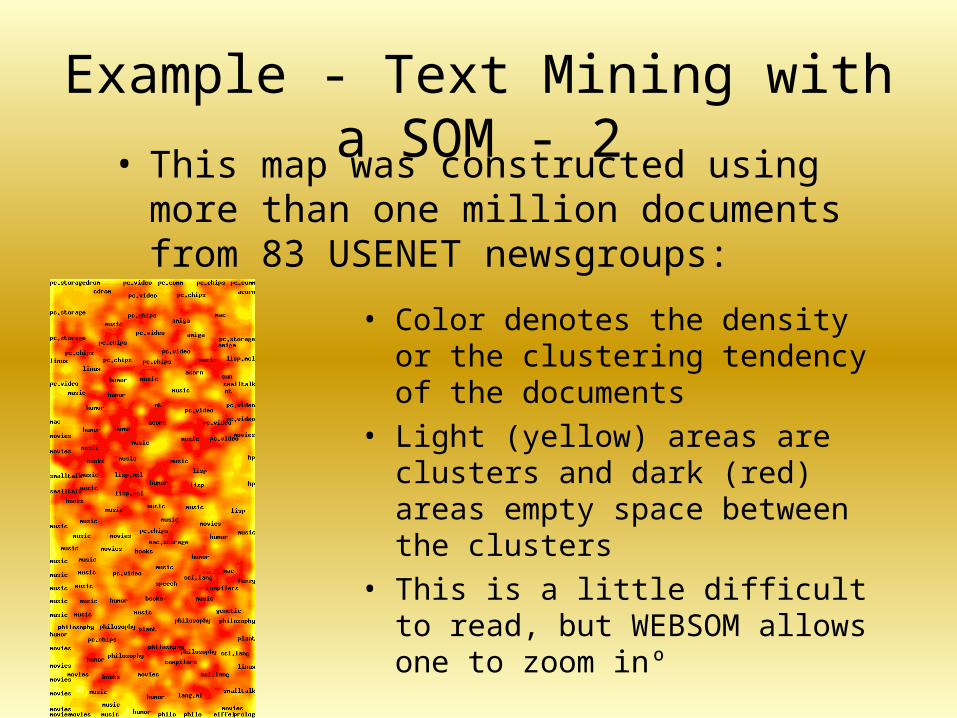
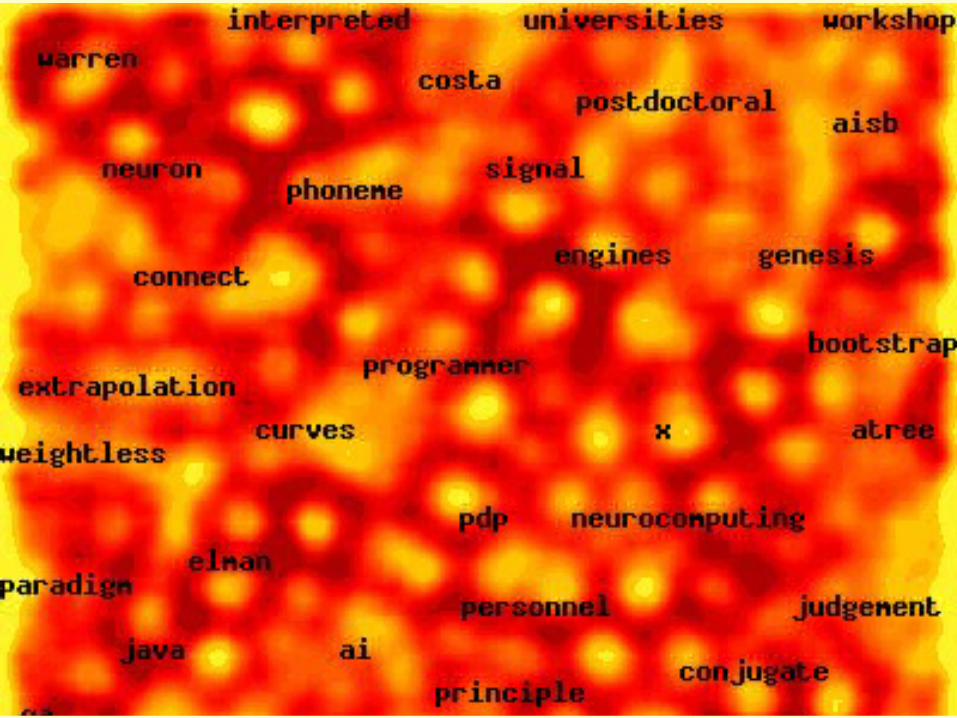
Example - Text Mining with a SOM - 2• This map was constructed using more than
one million documents from 83 USENET newsgroups:
• Color denotes the density or the clustering tendency of the documents
• Light (yellow) areas are clusters and dark (red) areas empty space between the clusters
• This is a little difficult to read, but WEBSOM allows one to zoom inº
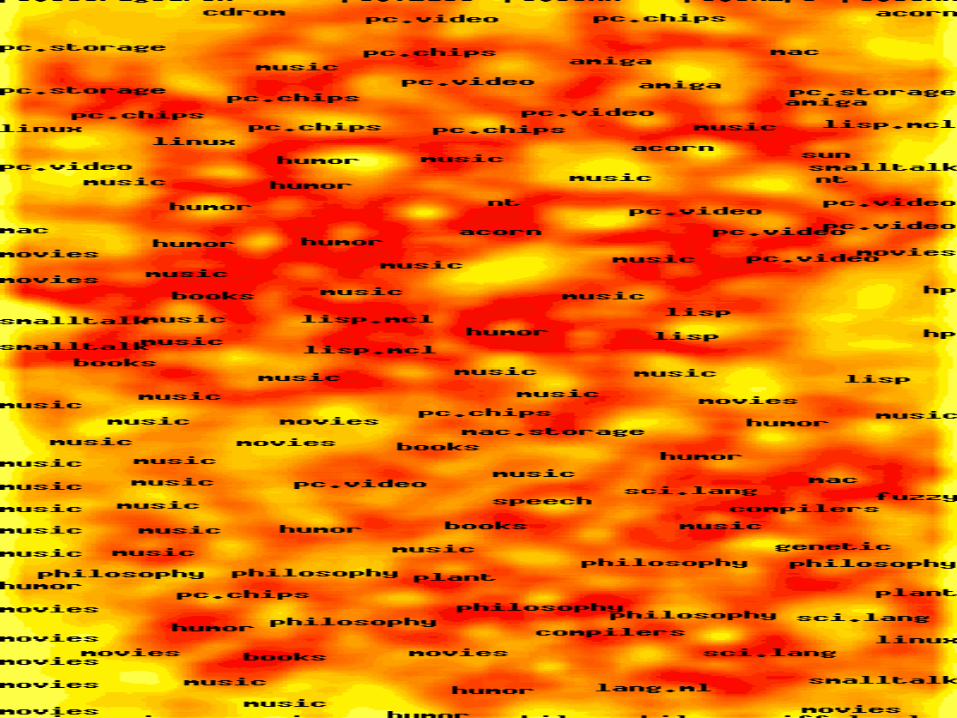

Example - Text Mining with a SOM - 3
• Zoomed view of the WEBSOM map:blues - rec.music.bluenotebooks - rec.arts.books classical -rec.music.classical humor - rec.humor lang.dylan -comp.lang.dylan music - music shostakovich - alt.fan.shostakovich


![analysis of 741-OP-AMP-IC by Muhammad Irfan Yousuf [Peon of Holy Prophet (P.B.U.H)] Volume 2](https://img.pdfslide.us/doc/110x75/55cfe3b55503467d968b5b5a/analysis-of-741-op-amp-ic-by-muhammad-irfan-yousuf-peon-of-holy-prophet-pbuh-5634fd051ac51.jpg)


![Analysis of Differential Amplifiers by Muhammad Irfan Yousuf [Peon of Holy Prophet (P.B.U.H)]](https://img.pdfslide.us/doc/110x75/55cfe3aa5503467d968b57cf/analysis-of-differential-amplifiers-by-muhammad-irfan-yousuf-peon-of-holy.jpg)