Embed Size (px)
Citation preview
Research ArticleNeural Energy Supply-Consumption Properties Based onHodgkin-Huxley Model
Yihong Wang, Rubin Wang, and Xuying Xu
Institute for Cognitive Neurodynamics, East China University of Science and Technology, 130 Meilong Road, Shanghai, China
Correspondence should be addressed to Rubin Wang; [email protected]
Received 24 June 2016; Revised 29 December 2016; Accepted 23 January 2017; Published 16 February 2017
Academic Editor: Lin Xu
Copyright © 2017 Yihong Wang et al. This is an open access article distributed under the Creative Commons Attribution License,which permits unrestricted use, distribution, and reproduction in any medium, provided the original work is properly cited.
Electrical activity is the foundation of the neural system. Coding theories that describe neural electrical activity by the roles ofaction potential timing or frequency have been thoroughly studied. However, an alternative method to study coding questions isthe energy method, which is more global and economical. In this study, we clearly defined and calculated neural energy supplyand consumption based on the Hodgkin-Huxley model, during firing action potentials and subthreshold activities using ion-counting and power-integral model. Furthermore, we analyzed energy properties of each ion channel and found that, under the twocircumstances, power synchronization of ion channels and energy utilization ratio have significant differences. This is particularlytrue of the energy utilization ratio, which can rise to above 100% during subthreshold activity, revealing an overdraft propertyof energy use. These findings demonstrate the distinct status of the energy properties during neuronal firings and subthresholdactivities. Meanwhile, after introducing a synapse energy model, this research can be generalized to energy calculation of a neuralnetwork. This is potentially important for understanding the relationship between dynamical network activities and cognitivebehaviors.
1. Introduction
Coding and decoding of neural information have been thecore problem in cognitive neural science [1–6]. Phase coding,frequency coding, and group coding have been established todeal with this problem [1]. These issues have been of interestto scientists from around the world. Unfortunately, thesetechniques are limited in scope and are difficult to completesuccessfully [7, 8]. Currently, there is no complete theory forneural coding and decoding to direct the research of globalbrain activities. The reason is that these local coding theoriesdo not include the cross influence of large-scale neuralactivities. The neurodynamics are nonlinear, which makes itvery hard to perfectly analyze the neural coding and decodingproblem [8–18].Neural activities andneural information pro-cesses should follow the principles of energy minimizationand information transmission efficiency maximization [19];in other words, neural system should be restricted by energyminimization regardless of suprathreshold or subthresholdactivity. This is the economical essence of neural systembecause of evolution. Information transmission efficiency
must maximize the energy utilization in a neural system; thisproperty is determined by the high efficiency of neural system[19]. However, it is difficult to describe on a quantitativebasis neural metabolic energy, neural electric energy, andthe relationship between them. Some research has calculatedneural energy, but these descriptions are restricted on theelectrochemistry level [20, 21].Thus, neural energy cannot becoupled to neural coding at the network level. This researchhas helped us to understand the neural energy consumptionand transformation, but they are not related to informationcoding by neuron group activity.
Researchers have proposed a newmethod to study neuralcoding through the use of energy levels to compensate forthe problems mentioned above [22]. A biophysical modelhas been constructed to describe the relationship betweenbioenergy of the brain and the neural information processesof the prefrontal cortex. Furthermore, quantitative connec-tions between firing patterns and neural energy evolutionaryprocess have been found. Based on these unique connections,researchers have proposed the concept of energy coding [19,23] and calculated the energy of a single neuron [24]. Some
HindawiNeural PlasticityVolume 2017, Article ID 6207141, 11 pageshttps://doi.org/10.1155/2017/6207141
2 Neural Plasticity
interesting discoveries have been found during the studyof the energy distribution properties of structural neuralnetworks [24]: (1) the theory of neural energy coding is basedon the use of a global concept of energy; (2) neurons releasetheir stored energy within a very short time (negative energy)at the beginning of firing action potential, after which theoxyhemoglobin provides them with biological energy, andthis mechanism contradicts the traditional theory of pureenergy consumption in neurons; (3) the distribution of thenegative energy, as assessed by parameter studies, reflects theneural network parameters and neural oscillation with a highconsistency. These ideas have laid the foundation for energycoding research of the functional neural network.
Scientists studying neural energy consumption [6, 20, 25–27] have analyzed the demand of adenosine triphosphate(ATP) in the coding of certain bits of information fromexperiments and computational model and provided theefficiency relationship between information transformationand energymetabolism in certain conditions. However, theseremarkable works focused only on one single prospectiveof energy consumption of a neuron, or the energy supportduring neural information process. They ignored the otherequally important reversal problem, which is, from energymetabolism and utilization properties, whether we candecode some information of stimulus and neural response.In this research, we analyze this problem by energy codingmethod. The most important neural activity is the changingof membrane potential of a neuron, which depends on thework of ion pumps. Among these pumps, the Na+/K+ pumpis themost crucial one and it consumesmost of themetabolicenergy. Thus, energy consumption by the Na+/K+ pumpreflects the metabolic energy used by neurons at the sametime. This energy transforms to potential energy to maintainmembrane potential and is consumed by electrical activity.Finally, the energy dissipates and turns into heat.Thus, energyis supplied to the ion pump by ATP; then the ion pumpworks to transport ions against the concentration gradient topreserve electrical potential energy.This process is equivalentto charging a battery. When an action potential occurs, ionsmove along the electric potential difference, and the potentialenergy preserved in the membrane is released and turnedinto joule heat due to the resistance effect of ion channels.In general, energy is supplied by ATP and consumed by theion channel. Apparently, energy should be conserved duringlager scale of time, but in small time interval energy supplyand consumption are not really matched every moment.Thisproperty makes it possible to study brain activity status basedon energy supply.
2. Model and Method
From the former discussion, it can be deducted that energysupplied to a neuron could be measured by the amountof ATP consumed by the ion pump, which is the directenergy source of a neuron. The energy consumed by aneuron can be measured by the joule heat transformed fromelectric potential energy, so that we can calculate this energyconsumption from membrane potential, Nernst potential,and ion current. Most metabolic energy released by ATP is
Vm
EK
RK
iKiNa
RNa
ENa
il
Rl
El
Cm
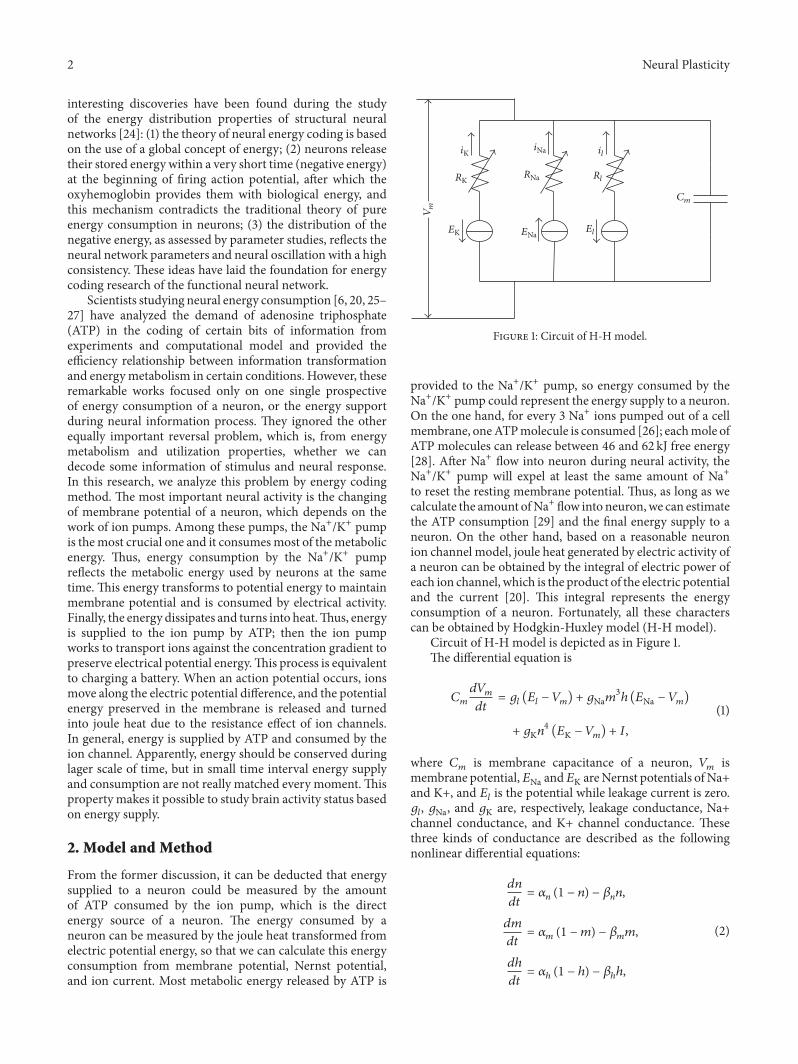
Figure 1: Circuit of H-H model.
provided to the Na+/K+ pump, so energy consumed by theNa+/K+ pump could represent the energy supply to a neuron.On the one hand, for every 3 Na+ ions pumped out of a cellmembrane, oneATPmolecule is consumed [26]; eachmole ofATP molecules can release between 46 and 62 kJ free energy[28]. After Na+ flow into neuron during neural activity, theNa+/K+ pump will expel at least the same amount of Na+to reset the resting membrane potential. Thus, as long as wecalculate the amount ofNa+ flow into neuron,we can estimatethe ATP consumption [29] and the final energy supply to aneuron. On the other hand, based on a reasonable neuronion channel model, joule heat generated by electric activity ofa neuron can be obtained by the integral of electric power ofeach ion channel, which is the product of the electric potentialand the current [20]. This integral represents the energyconsumption of a neuron. Fortunately, all these characterscan be obtained by Hodgkin-Huxley model (H-H model).
Circuit of H-H model is depicted as in Figure 1.The differential equation is
𝐶𝑚 𝑑𝑉𝑚𝑑𝑡 = 𝑔𝑙 (𝐸𝑙 − 𝑉𝑚) + 𝑔Na𝑚3ℎ (𝐸Na − 𝑉𝑚)+ 𝑔K𝑛4 (𝐸K − 𝑉𝑚) + 𝐼,
(1)
where 𝐶𝑚 is membrane capacitance of a neuron, 𝑉𝑚 ismembrane potential,𝐸Na and𝐸K areNernst potentials ofNa+and K+, and 𝐸𝑙 is the potential while leakage current is zero.𝑔𝑙, 𝑔Na, and 𝑔K are, respectively, leakage conductance, Na+channel conductance, and K+ channel conductance. Thesethree kinds of conductance are described as the followingnonlinear differential equations:
𝑑𝑛𝑑𝑡 = 𝛼𝑛 (1 − 𝑛) − 𝛽𝑛𝑛,𝑑𝑚𝑑𝑡 = 𝛼𝑚 (1 − 𝑚) − 𝛽𝑚𝑚,𝑑ℎ𝑑𝑡 = 𝛼ℎ (1 − ℎ) − 𝛽ℎℎ,
(2)

Neural Plasticity 3
where
𝛼𝑛 = 0.01 (10 + 𝑉𝑚 − 𝑉𝑟)exp [((10 + 𝑉𝑚 − 𝑉𝑟) /10) − 1] ,
𝛽𝑛 = 0.125 exp(𝑉𝑚 − 𝑉𝑟80 ) ,
𝛼𝑚 = 0.1 (25 + 𝑉𝑚 − 𝑉𝑟)exp [((25 + 𝑉𝑚 − 𝑉𝑟) /10) − 1] ,
𝛽𝑚 = 4 exp(𝑉𝑚 − 𝑉𝑟18 ) ,
𝛼ℎ = 0.07 exp(𝑉𝑚 − 𝑉𝑟20 ) ,
𝛽ℎ = 1exp [(30 + 𝑉𝑚 − 𝑉𝑟) /10 + 1] .
(3)
And 𝑉𝑟 is the resting membrane potential.The action potential firing process is as follows: (1) After
postsynaptic neuron receiving impulse from presynapticneuron, the neuron membrane increases its permeability toNa+ changes and begins to depolarize (subthreshold activ-ity); (2) permeability further increases, with enormous Na+flow inward, and membrane potential rises rapidly (supra-threshold activity); (3) permeability toNa+ decreases andper-meability to K+ increases, and repolarization begins; (4) per-meability to K+ continues to increase and K+ flows outwarduntil hyperpolarization; (5) after permeability to K+ decrea-ses, membrane potential rises to a resting level.
As a result, energy supplied by ATP during actionpotential or subthreshold activity can be calculated based onthe H-H model:
𝐸𝑠 = 𝜆𝑒𝑁𝐴 ∫𝑡 𝑔Na𝑚
3ℎ (𝐸Na − 𝑉𝑚) 𝑑𝑡, (4)
where 𝜆 is amount of energy released by one-mole ATP, 𝑒 isthe elementary charge, which is 1.6×10⁻¹⁹ coulombs, and𝑁𝐴is Avogadro constant, and the integrand is the current of theNa+ channel.
Energy consumption by a neuron based on H-H modelcan be determined by the following method [20].
At a particular moment, electric energy contained by aneuron is accumulated in membrane capacitor and equiva-lent batteries generated by Nernst potentials of ions, whichis
𝐸 (𝑡) = 12𝐶𝑚𝑉
2𝑚 + 𝐻Na + 𝐻K + 𝐻𝑙, (5)
where 𝐶𝑚 and 𝑉𝑚 are membrane capacity and potential andthe last three terms are energy accumulated in batteries whichare difficult to calculate directly. Thus, we focus on electricalpower which is the time rate of change of total energy:
𝑑𝐸𝑑𝑡 = 𝐶𝑚𝑉𝑚 𝑑𝑉𝑑𝑡 + 𝑖Na𝐸Na + 𝑖K𝐸K + 𝑖𝑙𝐸𝑙, (6)
where the last three terms are ion currents and Nernstpotentials, respectively. After applying (1) we obtain thefollowing:
𝑑𝐸𝑑𝑡 = 𝑉𝑚𝐼 + 𝑖Na (𝐸Na − 𝑉𝑚) + 𝑖K (𝐸K − 𝑉𝑚)
+ 𝑖𝑙 (𝐸𝑙 − 𝑉𝑚) .(7)
Integrating this equation at a particular time interval, weare able to calculate the energy consumed by a neuron duringthis time-period:
𝐸𝑐 = ∫𝑡[𝑉𝑚𝐼 + 𝑖Na (𝐸Na − 𝑉𝑚) + 𝑖K (𝐸K − 𝑉𝑚)
+ 𝑖𝑙 (𝐸𝑙 − 𝑉𝑚)] 𝑑𝑡.(8)
Apparently, 𝐸𝑐 = 𝐸(𝑡) + 𝐶, where 𝐶 is an unknown con-stant determined by the electrophysiological features of neu-ron. This means we can calculate energy consumption ofa neuron during a time interval (especially during elec-tric activity), although total energy contained in neuron isunknown to us.
As soon as energy supply and consumption are calculated,energy efficiency can be defined by percentage of energyconsumption over supply:
𝜂 = 𝐸𝑐𝐸𝑠 × 100%. (9)
Energy efficiency may differ a lot at different neuralactivity status, so it can be applied to reflect activity stateof a neuron and even neural networks. In our work, wefound that this parameter can serve to distinguish supra- andsubthreshold activity.
Besides, by calculation it is easy to find that Na+ and K+currents consumemost of electric potential energy.Thus, it isvaluable to analyze energy usage detail of these two ion curr-ents, energy consumption relationship between them, and itsevolution over time. This will help us grasp the details ofenergy transformation in a neuron. We will analyze powerratio of these two ion currents (Na+ power over K+ power)and the change over time of power percentage over totalpower (ion power over total power). Furthermore, the innerproduct of Hilbert space can be applied to define the syn-chronicity of their energy consumptions to analyze their spa-tiotemporal relationship. Synchronicity of energy consump-tion 𝜏(𝐸) is
𝜏 (𝐸)
= ∫𝑡𝑖Na (𝐸Na − 𝑉𝑚) × 𝑖K (𝐸K − 𝑉𝑚) 𝑑𝑡
√∫𝑡[𝑖Na (𝐸Na − 𝑉𝑚)]2 𝑑𝑡 × √∫
𝑡[𝑖K (𝐸K − 𝑉𝑚)]2 𝑑𝑡
. (10)

4 Neural Plasticity
And Ψ(𝐸) = arccos(𝜏(𝐸)) is the phase difference of energyconsumption. Similarly, ion currents synchronicity 𝜏(𝐼) andphase difference Ψ(𝐼) are
𝜏 (𝐼) = ∫𝑡𝑖Na × 𝑖K 𝑑𝑡
√∫𝑡𝑖2Na 𝑑𝑡 × √∫
𝑡𝑖2K 𝑑𝑡
,
Ψ (𝐼) = arccos (𝜏 (𝐼)) .(11)
Besides the energy contributed to Na+/K+ pump by ATPhydrolysis, the external stimulus current also provides someenergy. This amount of energy is so small that it can beignored during the calculation of energy supply. However,this stimulus energy is like a blasting fuse. If it leads to a spikeor action potential, this energy change can be ignored. If theneuronmerely activates subthreshold, it will beworthwhile toconsider how much this energy contributes to subthresholdactivity. As a result, we can calculate the ratio of stimulusenergy over total energy consumption to detect whether thisenergy can be ignored and determine if this ratio can bedistinguished from supra- and subthreshold activity.
3. Results
According to the described method, we use MATLAB(R2013a) to perform numerical simulation. Parameters in H-H model are taken the typical value: maximum Na+ con-ductance 𝑔Na = 120mS/cm2, maximum K+ conductance𝑔K = 36mS/cm2, leakage conductance 𝑔𝑙 = 0.3mS/cm2,andNernst potentials are 50mV,−80mV, and−56mV, respec-tively. Resting membrane potential is 67.3mV.
3.1. Ion Currents and Energy during Firing. Initially, we set thestimulus current at 𝐼 = 3 𝜇A/cm2 and the last at 5ms. A typi-cal action potential is generated, which is represented inFigure 1.
During the action potential, the ion currents thatoccurred in each of the ion channels are shown in Figure 3.If the outward direction is positive, Na+ current should benegative. However, in Figure 3 it is depicted in absolute value(reversed) to be compared more easily. The lines with colorof red, black, yellow, and fuchsia represent Na+, K+, leakage,and stimulus currents, respectively. As shown in Figure 3,Na+ and K+ currents are much stronger than leakage andstimulus currents; thus it is reasonable to focus on the ioncurrents and energy consumption of these two ion channels.Meanwhile, the waveforms of these two currents result inthe cross-membrane charge being largely neutralized. Thesynchronicity of ion currents defined previously is 𝜏(𝐼) =−0.987, and negative value means that the current directionsare opposite, overall. Phase difference Ψ(𝐼) = 170.7∘, whichmeans the phases of these currents are almost completelyopposite. The net current is depicted in Figure 4. In addition,we set the outward direction as positive. After about 4.5ms,the net current has an inward spike, because Na+ burstinto the membrane and K+ conductance across the mem-brane have not risen. The integral of this net current (areabetween the curve and time axis) shows that the net electric
−80
−60
−40
−20
0
20
40
60
Mem
bran
e pot
entia
l (m
V)
5 10 15 20 25 300Time (ms)
Figure 2: A typical action potential.
5 10 15 20 25 300Time (ms)
−1000
100200300400500600700800900
Ion
curr
ents
(𝜇A
/cm
2)
Figure 3: Different ion currents during action potential.
charge across the membrane during this action potential is15 nC/cm2. In other words, 15 nC of positive charge transfersout of the membrane per cm2. Interestingly, the stimuluscurrent injected into neuron is 3 𝜇A/cm2 and lasted 5ms,and 3 𝜇A/cm2 times 5ms equals 15 nC/cm2, which means,by stimulus current, same amount of electric charge wasinjected into cell and the cell stayed in electric neutrality.Thissuggests the following fact: all the ion migration across themembrane during the whole phases of action potential servesto neutralize the external stimulus charge injected into thecell.
Energy consumption of each ion channel during actionpotential is one of the most important problems. Figure 5shows the electric power of each ion channel during thisprocess. Green line is the total power and red, black, yellow,and fuchsia lines are powers of Na+, K+, leakage, and stimuluscurrents, respectively. It is evident that most of the energyis consumed by Na+ and K+ channel. Meanwhile, comparedwith Figure 2 it is apparent that the waveforms of Na+ and K+are quite different from current waveforms. Currents climbto the peak almost at the same time, and peak values arebarely different. Meanwhile, the power peak of Na+ clearlylags behind K+, and the value is lower. The synchronicityof power 𝜏(𝐸) is 0.782, and the phase difference Ψ(𝐸) is
Neural Plasticity 5
−300−250−200−150−100−50
050
100
Net
curr
ent (
𝜇A
/cm
2)
5 10 15 20 25 300Time (ms)
Figure 4: Net current (suprathreshold).
Total and ion channel energy consumptions
5 10 15 20 25 300Time (ms)
−20
0
20
40
60
80
100
120
Ion
ener
gy co
nsum
ptio
ns (𝜇
J/s)
Figure 5: Energy consumption of each ion channel (suprathresh-old).
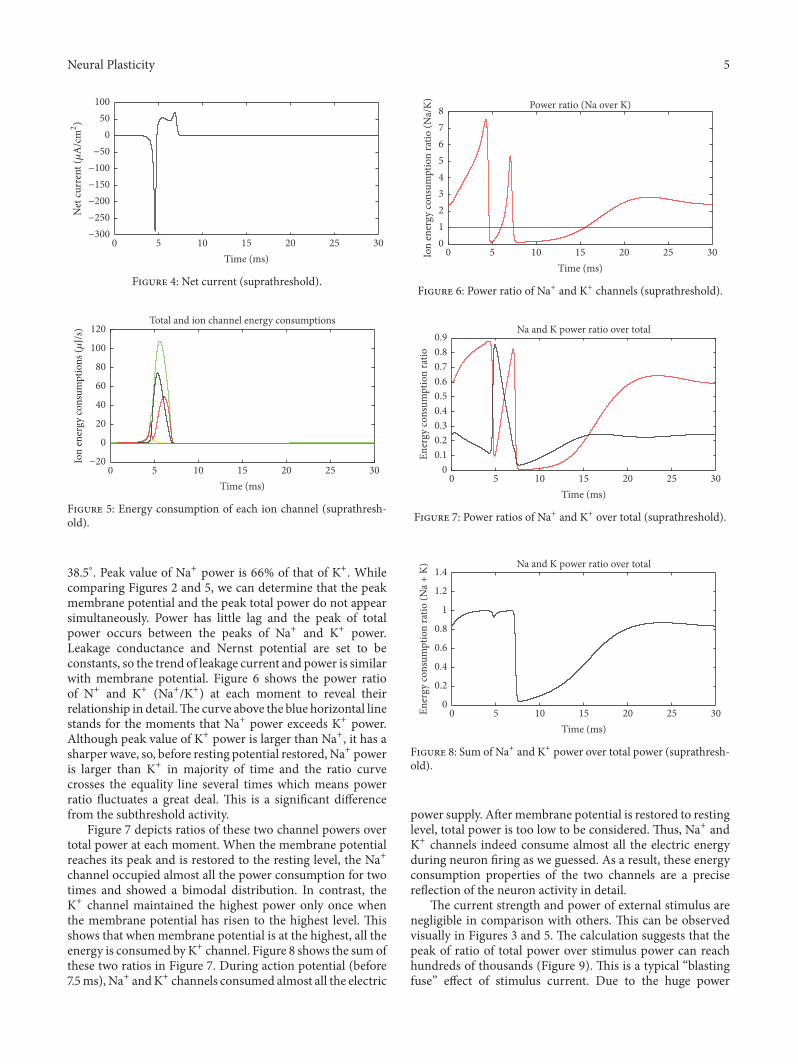
38.5∘. Peak value of Na+ power is 66% of that of K+. Whilecomparing Figures 2 and 5, we can determine that the peakmembrane potential and the peak total power do not appearsimultaneously. Power has little lag and the peak of totalpower occurs between the peaks of Na+ and K+ power.Leakage conductance and Nernst potential are set to beconstants, so the trend of leakage current and power is similarwith membrane potential. Figure 6 shows the power ratioof N+ and K+ (Na+/K+) at each moment to reveal theirrelationship in detail.The curve above the blue horizontal linestands for the moments that Na+ power exceeds K+ power.Although peak value of K+ power is larger than Na+, it has asharper wave, so, before resting potential restored, Na+ poweris larger than K+ in majority of time and the ratio curvecrosses the equality line several times which means powerratio fluctuates a great deal. This is a significant differencefrom the subthreshold activity.
Figure 7 depicts ratios of these two channel powers overtotal power at each moment. When the membrane potentialreaches its peak and is restored to the resting level, the Na+channel occupied almost all the power consumption for twotimes and showed a bimodal distribution. In contrast, theK+ channel maintained the highest power only once whenthe membrane potential has risen to the highest level. Thisshows that when membrane potential is at the highest, all theenergy is consumed byK+ channel. Figure 8 shows the sum ofthese two ratios in Figure 7. During action potential (before7.5ms),Na+ andK+ channels consumed almost all the electric
Power ratio (Na over K)
5 10 15 20 25 300Time (ms)
012345678
Ion
ener
gy co
nsum
ptio
n ra
tio (N
a/K)
Figure 6: Power ratio of Na+ and K+ channels (suprathreshold).
Na and K power ratio over total
5 10 15 20 25 300Time (ms)
00.10.20.30.40.50.60.70.80.9
Ener
gy co
nsum
ptio
n ra
tio
Figure 7: Power ratios of Na+ and K+ over total (suprathreshold).
Na and K power ratio over total
302520151050Time (ms)
0
0.2
0.4
0.6
0.8
1
1.2
1.4
Ener
gy co
nsum
ptio
n ra
tio (N
a + K
)
Figure 8: Sum of Na+ and K+ power over total power (suprathresh-old).
power supply. Aftermembrane potential is restored to restinglevel, total power is too low to be considered. Thus, Na+ andK+ channels indeed consume almost all the electric energyduring neuron firing as we guessed. As a result, these energyconsumption properties of the two channels are a precisereflection of the neuron activity in detail.
The current strength and power of external stimulus arenegligible in comparison with others. This can be observedvisually in Figures 3 and 5. The calculation suggests that thepeak of ratio of total power over stimulus power can reachhundreds of thousands (Figure 9). This is a typical “blastingfuse” effect of stimulus current. Due to the huge power

6 Neural Plasticity
Total power over stimulus power×105
−0.5
0
0.5
1
1.5
2
2.5
3
Pow
er ra
tio (t
otal
/stim
ulus
)
5 10 15 20 25 300Time (ms)
Figure 9: Ratio of total power and stimulus power (suprathreshold).
difference, stimulus energy can be ignored when we considerthe energy supply to a neuron. Meanwhile, net ion currentacross the cellmembrane can only neutralize electrical chargeinjected by a stimulus current. Such a large difference occursduring analyzing relationship between neural activity andstimulus current in perspectives of electric charge and electricpower. This is quite an interesting phenomenon.
By ion-counting method, which integrates Na+ current,we can get that 1.429 𝜇C (per cm2) of positive electric chargeflows into cell membrane in the form of Na+ during an actionpotential. These are 8.918 × 10¹² of Na+ ions. Na+/K+ pumpshave to pump all these influx Na+ out of membrane againto maintain resting potential and electric neutrality, so one-third of number of Na+ is the number of ATP moleculesconsumed. Then, the number of moles of ATP is 4.94 ×10⁻¹²mol. In final, the energy supply to a neuron by ATPduring one action potential is 2.468 × 10⁻⁷ J (every moleof ATP releases 50 kJ free energy). Meanwhile, integratingthe total power with respect to time (the area below greenline in Figure 5), we obtain the consumed electric power,which is 1.879 × 10⁻⁷ J in this case. Thus, it can be concludedthat, during action potential, electric power consumed by ionchannels is approximately 76% of the energy supplied by ATPat the same time. This is the energy efficiency of a neuronduring suprathreshold activity.
3.2. Ion Currents and Energy during Subthreshold Activity. Inthis section, we will examine the subthreshold current andenergy properties of a neuron when stimulus is weak andno action potential was fired. As stimulus current strength is2.5 𝜇A/cm2 and lasts 3ms, the membrane potential is shownin Figure 10, which rises to 5mV first and then drops to aresting level. Similar to Figure 3, Na+ current is shown asan absolute value in Figure 11 for comparison. The meaningof colored lines is the same as before. The strength of thetwo ion currents is almost the same order of magnitudeas stimulus and leakage currents, which is clearly differentfrom the firing state (Figure 3). Another difference is Na+current is weaker than K+ for the entire time-period forthe comparison of Figure 3, in which the two curves crosseach other several times. However, their waveforms overlap.The synchronicity is −0.90 and phase difference is 154.16∘,
−70−69−68−67−66−65−64−63−62
Mem
bran
e pot
entia
l (m
V)
5 10 15 20 25 300Time (ms)
Figure 10: Subthreshold membrane potential.
−4
−2
0
2
4
6
8
10
Ion
curr
ents
(𝜇A
/cm
2)
5 10 15 20 25 300Time (ms)
Figure 11: Subthreshold currents of different ions.
meaning that the antiphase is deduced a little. Net current isdepicted in Figure 12, the curve is smoother, and the negativepeak disappeared compared with Figure 4. This is becauseNa+ channel is not fully open and Na+ current is not strongenough. Similarity, the peak occurs after 5ms, which is themoment that Na+ and K+ current have decayed. The integralof this net current shows the net positive electric chargecrossing out of the membrane during this action potentialis 7.52 nC/cm2. Notice that 2.5 𝜇A/cm2 of stimulus currentlasts 3ms and 7.5 nC/cm2 positive charge is injected intothe cell membrane. They are still the same, basically. Thissuggests that during subthreshold activity the cell maintainselectric neutrality at suprathreshold.The ionmigration acrossthe membrane during subthreshold activity also serves toneutralize the external stimulus charge injected into the cell.
Figure 13 shows the electric power consumption of aneuron during subthreshold activity. Meanings of colors aresame as Figure 5.The differences are the fact that Na+ channelpower is higher than K+ all the time and occupies mostof the total power. The strengths of stimulus and leakagecurrents are the same order of magnitude as ion currents.The synchronicity of power 𝜏(𝐸) is 0.96, and phase differenceΨ(𝐸) is 16.26∘, suggesting that changing trends of these twoion powers are similar. Ignoring current directions, we cansee that at firing state current synchronicity is higher thanpower (𝜏(𝐼) = −0.987, 𝜏(𝐸) = 0.782), but, at subthreshold,it is just the opposite (𝜏(𝐼) = −0.90, 𝜏(𝐸) = 0.96). Thedifferences between current and power synchronicities aregreater in the firing state than at subthreshold. The peak

Neural Plasticity 7
5 10 15 20 25 300Time (ms)
−0.5
0
0.5
1
1.5
2
2.5
3
Net
curr
ent (
𝜇A
/cm
2)
Figure 12: Subthreshold net current.
Total and ion channel energy consumptions
5 10 15 20 25 300Time (ms)
−0.2
0
0.2
0.4
0.6
0.8
1
1.2
Ion
ener
gy co
nsum
ptio
ns (𝜇
J/s)
Figure 13: Energy consumption of each ion channel (subthreshold).
value of Na+ power is four times of K+, which is only 66%during action potential, suggesting further that Na+ channeluses most of the electric energy during subthreshold activity.Figure 14 shows the power ratio of Na+ over K+, which isabove the equality blue line all the time comparing withFigure 6 with four intersections. This proves again that theNa+ channel dominates the energy usage at subthreshold.However, Figure 11 suggests that K+ consumes less energy,and K+ currents are stronger than Na+ all the time. Itis another interesting feature of the subthreshold activity.A strong current consumes less energy; this may be theeffect of Nernst potential and voltage-gated channel. Powerpercentages of two channels are illustrated in Figure 15. Na+power percentage is higher than 40% all the time while thatof K+ is lower than 35%. It is clearly different from Figure 7.The sum of power percentages of Na+ and K+ is shownin Figure 16; the power stays above 70%. The rapid dropin Figure 8 never occurs. “Blasting fuse” effect of stimuluscurrent does not occur either (Figure 17). Over time, the ratioof total power over stimulus power increases, suggesting thatthe more stimulus energy is provided to a neuron, the moreelectric power can be stimulated. However, the maximum ofthe ratio is <6, much less than the value of several hundred ofthousand in Figure 9.
By the ion-counting method which integrates Na+ cur-rent we can get to 48.1 nC (per cm2) of positive electriccharge flow into the cell membrane in the form of Na+during subthreshold activity. These are 3.0 × 10¹¹ of Na+ions; then the number of moles of ATP is 1.66 × 10⁻¹³mol.
Power ratio (Na over K)
0123456789
10
Ion
ener
gy co
nsum
ptio
n ra
tio (N
a/K)
5 10 15 20 25 300Time (ms)
Figure 14: Power ratio of Na+ and K+ channels (subthreshold).
Na and K power ratio over total
0.10.20.30.40.50.60.70.80.9
Ener
gy co
nsum
ptio
n ra
tio
5 10 15 20 25 300Time (ms)
Figure 15: Power ratios of Na+ and K+ over total (subthreshold).
Na and K power ratio over total
0.65
0.7
0.75
0.8
0.85
0.9
0.95
1
Ener
gy co
nsum
ptio
n ra
tio (N
a + K
)
5 10 15 20 25 300Time (ms)
Figure 16: Sum ofNa+ andK+ power over total power (suprathresh-old).
Total power over stimulus power
5 10 15 20 25 300Time (ms)
11.5
22.5
33.5
44.5
55.5
Pow
er ra
tio (t
otal
/stim
ulus
)
Figure 17: Ratio of total power and stimulus power (subthreshold).

8 Neural Plasticity
Energy efficiency as a function of stimulus current
0.50.60.70.80.9
11.11.21.3
Ener
gy effi
cien
cy
1 2 3 4 5 6 7 80Stimulus strength
Figure 18: Energy efficiency as function of stimulus current stren-gth.
Energy efficiency as a function of stimulus time
0.50.60.70.80.9
11.11.21.3
Ener
gy effi
cien
cy
1 2 3 4 5 6 7 8 9 100Stimulus time
Figure 19: Energy efficiency as function of stimulus current dura-tion.
Finally, the energy supply to a neuron by ATP is 8.31 × 10⁻⁹ J.Meanwhile, integrating the total power with respect to timewe will get the consumed electric power, which is 8.75 ×10⁻⁹ J.This is more energy than the ATP supplied.The energyefficiency is 105.3%. This is an anomaly during subthresholdactivity that energy consumption is larger than energy supply.It can be explained that after stimulus current arrived andmembrane potential fluctuate subthreshold, ion channelsoverdraft energy supply by ATP in advance during limitedtime for electric activity, which causes metabolic energydebt. Afterward, ATP should be consumed to repay theenergy debt even during resting potential. However, a neuronreceives stimulus randomly at any moment, so the energydebt remains. This may reveal the energy flow directionsupplied to Na+/K+ pump by ATP on the ion and energymetabolism level. Part of this energy is used for repaying theenergy debt, which is consumed in advance. This means aneuron consumes more energy than we anticipated duringsubthreshold activity.
3.3. Comprehensive Analysis. Furthermore, we adjusted thestrength and duration of the stimulus currents detect thechange in energy efficiency. Figure 18 shows the change inenergy efficiency as a stimulus strength grows, while durationstays in 3ms. It is the same in Figure 19, but the stimuluscurrent keeps in 2.5 𝜇A and duration grows. These twofigures have the following common features: (1) the trends
are similar. Energy efficiency suddenly drops in the middleof the figures. This is the sign of switch from subthresholdto suprathreshold activity. (2)The figures decrease before thesudden drop and barely change after that. This is becausemembrane potential, ion currents vary a lot subthresholdwhile the action potential is identical. (3) Energy efficienciesare all above 100% subthreshold and remain approximately76% suprathreshold.
4. Discussion
Based on the H-H model, we have studied currents andenergy features of a neuron during different activity stateswith different stimulus. Regarding the neuron as a systemwith energy exchange with the environment, we distin-guished, defined, and calculated the energy supply and energyconsumption of a neuron. Then, the synchronicities of ioncurrents and ion channel power were defined. Furthermore,we studied the features and differences of ion currents andion channel power at different neural activity states and foundthe following conclusions: All the ion migration across themembrane serves to neutralize the external stimulus chargeinjected into the cell during both sub- and suprathresholdactivities. During suprathreshold activity, the strength rela-tionship of Na+ and K+ currents fluctuates a great deal, whileduring subthreshold activity Na+ current is weaker than K+all the time. The power relationship of these two channelsfluctuates the suprathreshold and peak value of Na+ as 66%of K+. With subthreshold activity, Na+ power is stronger thanK+ the entire time and the peak value is four times thatof K+. Current synchronicity of these two ion channels ishigher in suprathreshold than subthreshold activity, whilepower synchronicity is just the opposite. These two channelsoccupy most of the electric energy in both cases, but powerratio of Na+ is always larger than K+ at subthreshold state.Stimulus current shows a “blasting fuse” effect at both states,but the power ratio is much larger in suprathreshold casethan the other. It is a very important feature that energyefficiency in subthreshold activity is close to or even morethan 100%, which suggests that ion channels usually consumemore energy than we thought and get into energy debt.Meanwhile, energy efficiency during an action potentialis keeping around 76%. This essential difference could beregarded as the criterion of switch between subthreshold andsuprathreshold activity; it can be observed from the energyefficiency figures that the efficiencies are divided into twogroups automatically; the switch between two states can beeasily found. In subthreshold activity, the more energy isinjected by stimulus current, the lower energy efficiency is.However, the efficiency at firing state is stable.
The calculation suggested that the energy efficiencyduring an action potential is about 76%. This is consistentwith published research by Attwell and Laughlin [26]. Theirresearch revealed that 75% of energy expenditure in greymatter is devoted to signaling. Since action potential is thebasis for signaling, our result perfectly matches their data.Research byPartadiredja et al. shows that a typical diameter ofan axon is 10−4mm [30]. Axon length is approximately 1mm.Thus, the surface of an axon is about 3.14 × 10⁻⁶ cm2. Our

Neural Plasticity 9
Average energy dissipation ≡ consumption Average energy dissipation
Membrane
Synapse
Average energy input from glucose Average energy input from glucoseAverage energy contribution from synapse
Figure 20: Global energy flow of neurons and synapse.
calculation shows that 4.94 × 10⁻¹²mol of ATP is consumedper cm2 during an AP (action potential). So the total numberATPmolecules cost to transmit anAP along the axon is about9 × 106. This is close to the estimation made by Laughlin etal. that the metabolic cost for sensory information in insectretinas is 7 × 10⁶ ATP molecules per bit [25].
The total energy cost of one pump cycle, which pumps3 Na+ ions out of the cell and two potassium ions in, canbe estimated to be 0.37 eV [31]. During an AP, based on ourcalculation, in order to pump out the 8.918 × 10¹² of Na+ions which flow into the membrane, 2.468 × 10⁻⁷ J energyis consumed. It is easy to get that every 3 Na+ consumed0.519 eV energy. The results are perfectly supported by pub-lished researches, both theoretical and experimental.
The amount of free energy released by per mole of ATPmay vary in different situations, and this parameter valuecould perturb the calculation of energy efficiency. However,the distinct contrast of efficiency between the two statesis certain. Neural subthreshold activity could overdraft themetabolic energy released by ATP; there may be some otherunknown energy processes, except in ion channel consump-tion. How these unknown processes influence subthresholdenergy debt should be further studied.
Neural activity andneural plasticity are the keys to solvingthe coding and decoding problems of neural information.Unfortunately, research techniques such as phase coding,frequency coding, and group coding have different kind oflimitations and difficulties; there is still no complete theoryfor neural coding and decoding to direct the research ofglobal brain activities. Under this circumstance, energy cod-ing may be an alternative. Neuron and synaptic connectionare the basic elements of neural system. So the energyproperties of both neuron and synapsis should be studied.Andonly if the neural activity is thoroughly investigated, thenthe energy of synapsis and neural plasticity can be studied.
In this paper, we carefully revealed the energy propertiesof neural activity. It is the foundation of the further study of
energy of synapsis and neural network. Neural energy andneural plasticity are closely related.
First, the synapse contributes energy to neural activity. Itcould be represented by the stimulus current in the model.Research has shown that some production of energy atthe synaptic site is necessary for the neuron to keep itssignaling [32]. There is biological evidence that links thegeneration of metabolic energy to the inflow of glucosethrough the membrane to produce ATP. Both facts could bereconciled assuming that the electrical energy produced atthe synaptic site is conveniently transformed and reabsorbedby the neuron through its membrane for the generation ofnew spikes. A schema of the global energy flow of bothneurons and synapse is provided in Figure 20 [32]. Energyof the synapse contributes significantly to the signaling andcoding. As a result, neural plasticity links the neural energyto information signaling and transmission.
Second, synapse strength could be changed by neuralenergy. Neural plasticity is the basic mechanism of cognitivefunction of brain. The role of neural plasticity in energycoding method and how the neural energy affects synapseconnections should be studied. In another work, we haveproposed a synapse model to describe the strength change ofsynapse connection in energy level [33].
𝑘𝑑𝜔𝑗𝑖𝑑𝑡 = ∫∞
0[𝑃𝑖 (𝜏)𝐻 (𝜏) 𝑃𝑗 (𝑡 − 𝜏)
+ 𝑃𝑖 (𝑡 − 𝜏)𝐻 (−𝜏) 𝑃𝑗 (𝜏)] 𝑑𝜏.(12)
This is a Hebbian learning rule in energy form. 𝑃𝑖(𝑡) and𝑃𝑗(𝑡) are the power of neurons 𝑖 and 𝑗 at moment 𝑡; 𝑘 is aconstant and 𝐻(𝑡) is a time window. It has been proven tobe effective towards the construction of a neural network inenergy form to solve certain cognitive problems [33].
Finally, to reveal the relationship of neural energy andneural plasticity is an important topic. The functional con-nection of brain area is defined by the simultaneous brain

10 Neural Plasticity
activity, which is observed by fMRI experimentally. AndfMRI is based on the measurement of BOLD signal, which isessentially a reflection of neural energy. Thus, the theoreticalresearch of neural energy benefits the study of synapticconnection of neurons.
To conclude, neural energy is closely related to neuralplasticity. Synapse contributes energy to neural activity, andthe activity energy of pre- and postsynaptic neurons changesthe connection strength. Furthermore, a better understand-ing of neural energy will potentially support the research offunctional brain connections.
Energy coding is a new coding method proposed fromthe perspective of global brain activity. The most importantproperty of this method is linear additivity [19]. Almostevery known process in nature can be seen as a certainkind of energy transformation or transmission. So can neuralactivity. However, countless neural processes are consumingenergy. The linear additivity of the energy coding methodmay provide a possibility to obtain energy properties of globalbrain activity. Energy supply and consumption of a singleneuron have been considered in this research. Combinedwith a proper synapsis energy consumption, more complexneural network energy properties can be studied. Under cer-tain circumstances, the neural network energy should exhibitemerging properties, which contain more information aboutthe neural system in the activemode and in neural coding. Toconclude, energy method has a great potential, which couldbring new surprises to the research of neural informationcoding and decoding.
Competing Interests
The authors declare that they have no competing interests.
Acknowledgments
Thiswork is supported by theNational Natural Science Foun-dation of China (nos. 11232005, 11472104) andTheMinistry ofEducation Doctoral Foundation (no. 20120074110020).
References
[1] A. Borst and F. E. Theunissen, “Information theory and neuralcoding,” Nature Neuroscience, vol. 2, no. 11, pp. 947–957, 1999.
[2] M. S. Gazzaniga, R. B. Ivry, andG. R.Mangun,Cognitive Neuro-science. The Biology of the Mind, Norton & Company Inc, 3rdedition, 2009.
[3] S.-i. Amari and H. Nakahara, “Difficulty of singularity in popu-lation coding,” Neural Computation, vol. 17, no. 4, pp. 839–858,2005.
[4] S.-i. Amari and H. Nakahara, “Difficulty of singularity in popu-lation coding,” Neural Computation, vol. 17, no. 4, pp. 839–858,2005.
[5] D. S. Bassett, E. T. Bullmore, A. Meyer-Lindenberg, J. A. Apud,D. R. Weinberger, and R. Coppola, “Cognitive fitness of cost-efficient brain functional networks,” Proceedings of the NationalAcademy of Sciences of the United States of America, vol. 106, no.28, pp. 11747–11752, 2009.
[6] B. Sengupta, M. Stemmler, S. B. Laughlin, and J. E. Niven,“Action potential energy efficiency varies among neuron typesin vertebrates and invertebrates,” PLoS Computational Biology,vol. 6, no. 7, e1000840, 16 pages, 2010.
[7] D.W.McLaughlin, “Ruling out and ruling in neural codes,” Pro-ceedings of the National Academy of Sciences of the United Statesof America, vol. 106, no. 14, pp. 5936–5941, 2009.
[8] G. Purushothaman and D. C. Bradley, “Neural population codefor fine perceptual decisions in area MT,” Nature Neuroscience,vol. 8, no. 1, pp. 99–106, 2005.
[9] S. B. Laughlin and T. J. Sejnowski, “Communication in neuronalnetworks,” Science, vol. 301, no. 5641, pp. 1870–1874, 2003.
[10] W. Singer, “Distributed processing and temporal codes in neu-ronal networks,”Cognitive Neurodynamics, vol. 3, no. 3, pp. 189–196, 2009.
[11] M.D. Fox andM. E. Raichle, “Spontaneous fluctuations in brainactivity observedwith functionalmagnetic resonance imaging,”Nature Reviews Neuroscience, vol. 8, no. 9, pp. 700–711, 2007.
[12] J. F. Hipp, A. K. Engel, and M. Siegel, “Oscillatory synchroniza-tion in large-scale cortical networks predicts perception,” Neu-ron, vol. 69, no. 2, pp. 387–396, 2011.
[13] J. Han, S. Zhao, X. Hu, L. Guo, and T. Liu, “Encoding brainnetwork response to free viewing of videos,” Cognitive Neuro-dynamics, vol. 8, no. 5, pp. 389–397, 2014.
[14] W. Duch and K. Dobosz, “Visualization for understanding ofneurodynamical systems,” Cognitive Neurodynamics, vol. 5, no.2, pp. 145–160, 2011.
[15] D. J. Strauss, F. I. Corona-Strauss, C. Trenado et al., “Electro-physiological correlates of listening effort: neurodynamicalmodeling and measurement,” Cognitive Neurodynamics, vol. 4,no. 2, pp. 119–131, 2010.
[16] N. Sato and Y. Yamaguchi, “Spatial-area selective retrieval ofmultiple object-place associations in a hierarchical cognitivemap formed by theta phase coding,” Cognitive Neurodynamics,vol. 3, no. 2, pp. 131–140, 2009.
[17] C. R. Huyck, “A psycholinguisticmodel of natural language par-sing implemented in simulated neurons,” Cognitive Neurody-namics, vol. 3, no. 4, pp. 317–330, 2009.
[18] H.Wagatsuma and Y. Yamaguchi, “Neural dynamics of the cog-nitive map in the hippocampus,” Cognitive Neurodynamics, vol.1, no. 2, pp. 119–141, 2007.
[19] R. Wang, I. Tsuda, and Z. Zhang, “A new work mechanism onneuronal activity,” International Journal of Neural Systems, vol.25, no. 3, Article ID 1450037, 2015.
[20] A. Moujahid, A. d’Anjou, F. J. Torrealdea, and F. Torrealdea,“Energy and information in Hodgkin-Huxley neurons,” Phys-ical Review E. Statistical, Nonlinear, and SoftMatter Physics, vol.83, no. 3, Article ID 031912, 11 pages, 2011.
[21] H. Alle, A. Roth, and J. R. P. Geiger, “Energy-efficient actionpotentials in hippocampal mossy fibers,” Science, vol. 325, no.5946, pp. 1405–1408, 2009.
[22] R. Wang and Z. Z. X. Jiao, “Mechanism on brain informationprocessing: energy coding,” Applied Physics Letters, vol. 89, no.12, 2006.
[23] H. Zheng, R. Wang, L. Qiao, and Y. Du, “The molecular dyna-mics of neural metabolism during the action potential,” ScienceChina Technological Sciences, vol. 57, no. 5, pp. 857–863, 2014.
[24] Z. Wang, R. Wang, and R. Fang, “Energy coding in neural net-work with inhibitory neurons,”Cognitive Neurodynamics, vol. 9,no. 2, pp. 129–144, 2015.

Neural Plasticity 11
[25] S. B. Laughlin, R. R. De Ruyter Van Steveninck, and J. C.Anderson, “The metabolic cost of neural information,” NatureNeuroscience, vol. 1, no. 1, pp. 36–41, 1998.
[26] D. Attwell and S. B. Laughlin, “An energy budget for signalingin the grey matter of the brain,” Journal of Cerebral Blood Flowand Metabolism, vol. 21, no. 10, pp. 1133–1145, 2001.
[27] P. Crotty, T. Sangrey, and W. B. Levy, “Metabolic energy costof action potential velocity,” Journal of Neurophysiology, vol. 96,no. 3, pp. 1237–1246, 2006.
[28] M. A. Jansen, H. Shen, L. Zhang, P. E. Wolkowicz, and J.A. Balschi, “Energy requirements for the Na+ gradient in theoxygenated isolated heart: effect of changing the free energyof ATP hydrolysis,” American Journal of Physiology—Heart andCirculatory Physiology, vol. 285, no. 6, pp. H2437–H2445, 2003.
[29] A. Moujahid, A. D’Anjou, and M. Grana, “Energy demandsof diverse spiking cells from the neocortex, hippocampus, andthalamus,” Frontiers in Computational Neuroscience, vol. 8, no.1, article 41, 2014.
[30] G. Partadiredja, R. Miller, and D. E. Oorschot, “The number,size, and type of axons in rat subcortical white matter on leftand right sides: A Stereological, Ultrastructural Study,” Journalof Neurocytology, vol. 32, no. 9, pp. 1165–1179, 2003.
[31] P. Nelson, Biological Physics, Freeman and Company, NewYork,NY, USA, 2004.
[32] F. J. Torrealdea, C. Sarasola, A. d’Anjou, A. Moujahid, and N. V.de Mendizabal, “Energy efficiency of information transmissionby electrically coupled neurons,” BioSystems, vol. 97, no. 1, pp.60–71, 2009.
[33] Y. Wang, R. Wang, and Y. Zhu, “Optimal path-finding throughmental exploration based on neural energy field gradients,”Cognitive Neurodynamics, vol. 11, no. 1, pp. 99–111, 2017.

Submit your manuscripts athttps://www.hindawi.com
Neurology Research International
Hindawi Publishing Corporationhttp://www.hindawi.com Volume 2014
Alzheimer’s DiseaseHindawi Publishing Corporationhttp://www.hindawi.com Volume 2014
International Journal of
ScientificaHindawi Publishing Corporationhttp://www.hindawi.com Volume 2014
Hindawi Publishing Corporationhttp://www.hindawi.com Volume 2014
BioMed Research International
Hindawi Publishing Corporationhttp://www.hindawi.com Volume 2014
Research and TreatmentSchizophrenia
The Scientific World JournalHindawi Publishing Corporation http://www.hindawi.com Volume 2014
Hindawi Publishing Corporationhttp://www.hindawi.com Volume 2014
Neural Plasticity
Hindawi Publishing Corporationhttp://www.hindawi.com Volume 2014
Parkinson’s Disease
Hindawi Publishing Corporationhttp://www.hindawi.com Volume 2014
Research and TreatmentAutism
Sleep DisordersHindawi Publishing Corporationhttp://www.hindawi.com Volume 2014
Hindawi Publishing Corporationhttp://www.hindawi.com Volume 2014
Neuroscience Journal
Epilepsy Research and TreatmentHindawi Publishing Corporationhttp://www.hindawi.com Volume 2014
Hindawi Publishing Corporationhttp://www.hindawi.com Volume 2014
Psychiatry Journal
Hindawi Publishing Corporationhttp://www.hindawi.com Volume 2014
Computational and Mathematical Methods in Medicine
Depression Research and TreatmentHindawi Publishing Corporationhttp://www.hindawi.com Volume 2014
Hindawi Publishing Corporationhttp://www.hindawi.com Volume 2014
Brain ScienceInternational Journal of
StrokeResearch and TreatmentHindawi Publishing Corporationhttp://www.hindawi.com Volume 2014
Neurodegenerative Diseases
Hindawi Publishing Corporationhttp://www.hindawi.com Volume 2014
Journal of
Cardiovascular Psychiatry and NeurologyHindawi Publishing Corporationhttp://www.hindawi.com Volume 2014