Embed Size (px)
Citation preview

Cognitive Brain Research 12 (2001) 19–31www.elsevier.com/ locate /bres
Research report
Neural activities during Wisconsin Card Sorting Test — MEGobservation
*Lihong Wang , Ryusuke Kakigi, Minoru HoshiyamaDepartment of Integrative Physiology, National Institute for Physiological Sciences, Myodaiji, Okazaki, 444-8585, Japan
Accepted 23 January 2001
Abstract
The present study recorded activities of magnetoencephalography (MEG) to the presentation of cards, and to the presentation offeedback signals in 12 normal subjects while they performed the Wisconsin Card Sorting Test (WCST), to observe temporal and spatialprocessing during the task. The MEG responses were compared between two different conditions in the presentation both of cards and offeedback signals: the cards proceeded by the first wrong [W1st(C)] and by the 4th correct feedback signals [C4th(C)]; and the feedback ofthe first wrong [W1st(FB)] and the 4th correct signals [C4th(FB)]. A multi-dipole model, brain electric source analysis (BESA), was usedto explore the dipole sources responsible for the MEG activities. We found that MEG activity differences between the W1st(C) and theC4th(C) condition occurred in the period of 190–220 ms (M190 and M200), and 300–440 ms (M300 and M370) mainly at thesupramarginal gyrus, the dorsolateral prefrontal, and the middle and inferior frontal gyrus. MEG differences between the W1st(FB) andthe C4th(FB) condition occurred 460–640 ms (M460) after the presentation of the feedback signals, with the activation of the dorsolateralprefrontal cortex and the middle frontal cortex. No significant location differences were found between the frontal responses (M370) ofthe W1st(C) and M460 of the W1st(FB). Our results proved that the WCST task activates a broad frontal area and the parieto-frontalnetwork across time streaming. Both shifting attention to the wrong feedback and enhanced visual working memory to the sorting shiftingcondition of the card presentation occur in the same areas at different time points. 2001 Elsevier Science B.V. All rights reserved.
Theme: Neural basis of behavior
Topic: Cognition
Keywords: Wisconsin Card Sorting Test; Magnetoencephalography; Shifting attention; Working memory; Prefrontal cortex; Supramarginal gyrus
1. Introduction [17,27], the WCST has for many years been widely used asa neuropsychological index of prefrontal cortical function,
The Wisconsin Card Sorting Test (WCST) is a task especially shifting attention. However, its specificity haswhich requires subjects to match ‘target’ to ‘reference’ been questioned, since in some studies, the WCST wascards on the basis of one of three possible categories found incapable to discriminate patients with prefrontal(color, number, or form). The correct sorting principle lesions from those with lesions in other regions [1,20,29].changes in a prescribed way (usually after 10 correct Multiple areas related to various functions are found to bechoices) which is known by the experimenter but not the activated during the task in addition to the prefrontalsubject. cortex. Positron emission tomography (PET) and func-
As patients with prefrontal lobe damage were found to tional magnetic resonance imaging (fMRI) showed that thehave particular difficulty in shifting from one category bilateral inferior parietal lobe and inferior posterior tempo-sorting principle to another during performance of the task ral lobe [5], bilateral inferior parietal lobe and left superior
occipital gyrus [30], and bilateral supramarginal gyrus andanterior cingulate cortex [22] were also activated during*Corresponding author. Tel.: 181-564-55-7769; fax: 181-564-52-the WCST task. In other words, previous findings of fMRI7913.
E-mail address: [email protected] (L. Wang). and PET studies were not quite consistent and they
0926-6410/01/$ – see front matter 2001 Elsevier Science B.V. All rights reserved.PI I : S0926-6410( 01 )00022-2

20 L. Wang et al. / Cognitive Brain Research 12 (2001) 19 –31
suggested that there is a good possibility that the task cards disappeared when the subject responded, and 100 msinvolved many areas in addition to the frontal lobe. later, a feedback signal (s) or (3) which indicated
Another problem is that the WCST is such a compli- whether the subject’s decision fit the examiner’s (com-cated task that it involves many cognitive operations puter’s) category or not was presented. The feedbackbesides shifting attention, such as working memory, inhibi- signal lasted for 200 ms, and there was an interval oftion, reasoning, and decision making. The working mem- 700–900 ms from the disappearance of the signal to theory, inhibition and decision making processing may take next trial (Fig. 1). In the beginning, the correct categoryplace after the presentation of cards, whereas the attention was told to be color. When the subject maintained a correctshift processing might start immediately after the presenta- progression through six to nine (random) trials during onetion of the feedback indicating change of the sorting run, the principle was changed without warning. Theprinciple [22]. Little is known, however, about the spatial subject had to search for the new correct category whenchanges with time during the WCST. Although an event- the wrong feedback signal (3) was shown, indicating therelated fMRI study suggested that the peak of MRI signals subject’s choice was different from the principle (Fig. 1).was at 5–9 s after the neuronal activity during the WCST One recording for a subject included approximately 120[22], it is impossible by PET and fMRI to observe neural runs, and took in total about 40 min with a brief break afteractivation in a sub-second scale. every five to seven runs. Before recording, all subjects
Magnetoencephalography (MEG), which has a rather were given a training period until they could presshigh temporal and estimated spatial resolution and allows appropriate buttons without difficulty.one to record brain activities on a scale of ms and mm, The stimuli were presented by a video projector (XV-might provide important information on how the cognitive T2Z, Sharp) outside of the magnetically shielded roomprocessing occurs during the WCST. In the present study, (Vacuumschmelze GmbH). The stimulus presentation waswe recorded MEG after the presentation of cards and after controlled by a personal computer (PC-9801B52, NEC). Athe presentation of the feedback signals, to understand the crystal liquid shutter (LUMP6, Nippon Sheet Grass) wascognitive processing related to the WCST task temporally set in front of the video projector and adjusted the stimulusand spatially in detail. onset time. It took about 20 ms for the projector to present
the stimuli. The luminance of the stimuli was about 79.62 2cd /m , with a background of about 2.2 cd/m from the
2. Methods viewpoint. The fixation point was in the center of the targetcard, which enabled the subjects to look straight ahead.
2.1. Subjects The subjects were asked to gaze at the fixation pointduring the experiment.
Eight male and four female healthy members of our staff(mean age 31.962.9 years, range 25–37 years) participated 2.3. Data acquisitionin the study. None of the subjects had any history ofneurological, psychological or opthalmological disorders. MEG recordings were carried out with dual 37-channelAll had normal or corrected to normal visual acuity. All biomagnetometers (Magnes, Biomagnetic Technologiessubjects were right-handed. Informed consent to participate Inc. San Diego, CA). The device was 144 mm in diameterin this study, which was first approved by the Ethical and its radius was 122 mm. The outer coils were 72.58
Committee of the National Institute for Physiological apart. Each coil was 22 mm. Each coil was connected to aSciences, Okazaki, Japan, was obtained from all particip- superconducting quantum interference device (SQUID). Inants. order to exclude the artifacts caused by eye movement, we
simultaneously recorded a vertical-horizontal elec-2.2. Stimulation (Fig. 1) trooculogram (EOG) from the left eye. The epochs of
EOG with signals larger than 80 mV were excluded fromThis modified WCST task was based on the modified averaging. MEG recordings in which more than 20% of the
version of Nelson [33]. The subjects were asked to match epochs were rejected were excluded from analysis. Re-the target card to the reference cards on the basis of one of sponses were filtered with a 0.1–100 Hz bandpass filter,three categories: number, color or shape. Four reference and digitized at a sampling rate of 297.6 Hz. About 120cards in the upper part of the screen and a target below the trials were averaged for each recording condition in bothreference cards were presented. The shapes and colors of the card presentation and the feedback signal presentationthe four reference cards were exactly the same as the experiment.Nelson’s version. The subject was required to decidewhich reference card matched the target card and press one 2.3.1. The card presentation experiment
2of the four buttons held in his /her hands. The four buttons Stimuli (0.1330.13 m ) were projected on the ceiling in(two in each hand) were arranged in an array corre- front of the subjects. The distance of the stimuli from thesponding to the layout of the four reference cards. The eyes was about 1.5 m. Since our device was not a whole-
L.W
anget
al./
Cognitive
Brain
Research
12(2001)
19–31
21
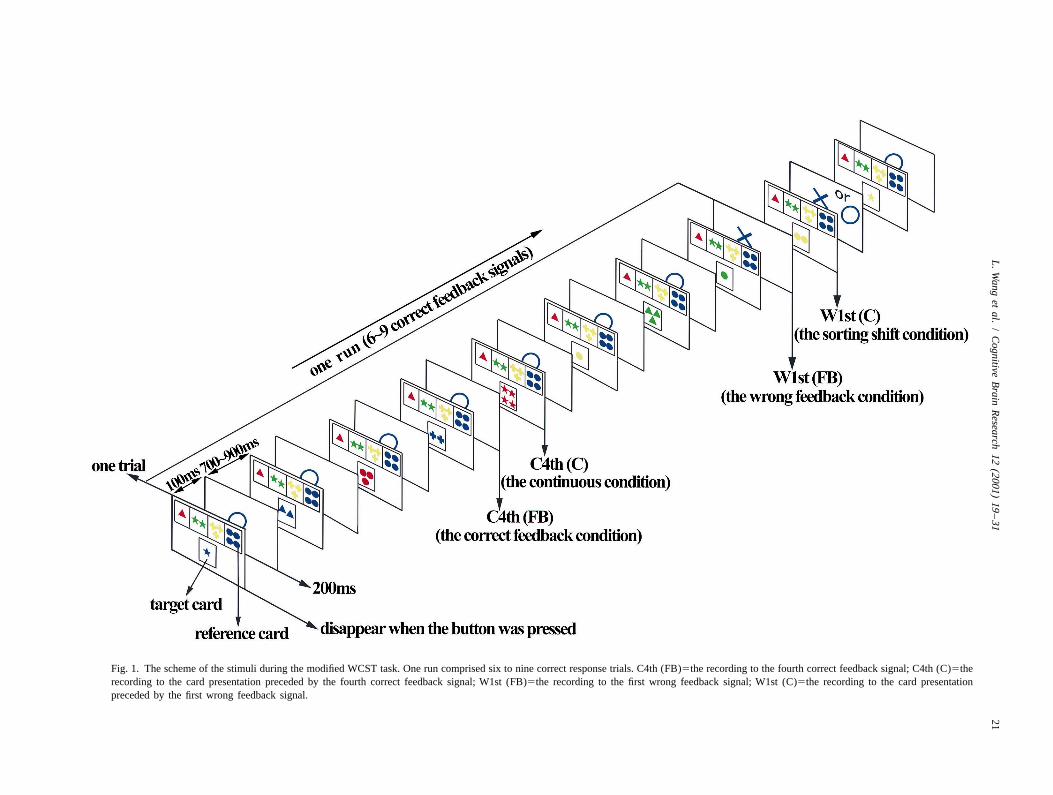
Fig. 1. The scheme of the stimuli during the modified WCST task. One run comprised six to nine correct response trials. C4th (FB)5the recording to the fourth correct feedback signal; C4th (C)5therecording to the card presentation preceded by the fourth correct feedback signal; W1st (FB)5the recording to the first wrong feedback signal; W1st (C)5the recording to the card presentationpreceded by the first wrong feedback signal.
22 L. Wang et al. / Cognitive Brain Research 12 (2001) 19 –31
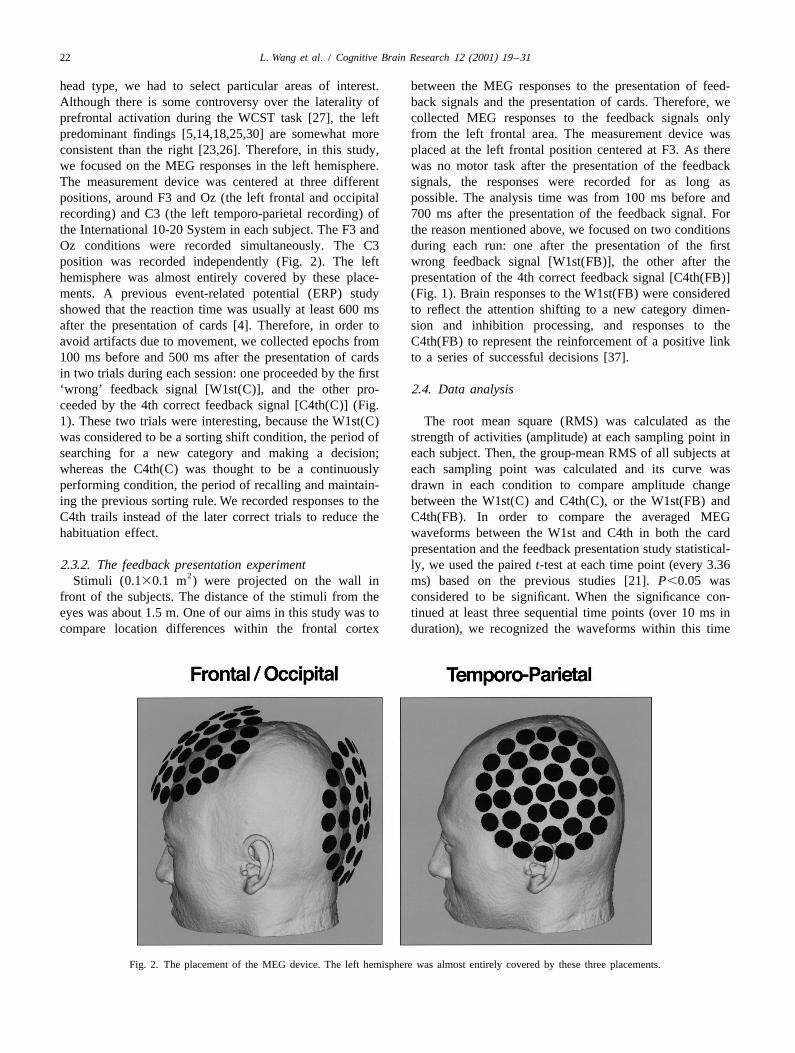
head type, we had to select particular areas of interest. between the MEG responses to the presentation of feed-Although there is some controversy over the laterality of back signals and the presentation of cards. Therefore, weprefrontal activation during the WCST task [27], the left collected MEG responses to the feedback signals onlypredominant findings [5,14,18,25,30] are somewhat more from the left frontal area. The measurement device wasconsistent than the right [23,26]. Therefore, in this study, placed at the left frontal position centered at F3. As therewe focused on the MEG responses in the left hemisphere. was no motor task after the presentation of the feedbackThe measurement device was centered at three different signals, the responses were recorded for as long aspositions, around F3 and Oz (the left frontal and occipital possible. The analysis time was from 100 ms before andrecording) and C3 (the left temporo-parietal recording) of 700 ms after the presentation of the feedback signal. Forthe International 10-20 System in each subject. The F3 and the reason mentioned above, we focused on two conditionsOz conditions were recorded simultaneously. The C3 during each run: one after the presentation of the firstposition was recorded independently (Fig. 2). The left wrong feedback signal [W1st(FB)], the other after thehemisphere was almost entirely covered by these place- presentation of the 4th correct feedback signal [C4th(FB)]ments. A previous event-related potential (ERP) study (Fig. 1). Brain responses to the W1st(FB) were consideredshowed that the reaction time was usually at least 600 ms to reflect the attention shifting to a new category dimen-after the presentation of cards [4]. Therefore, in order to sion and inhibition processing, and responses to theavoid artifacts due to movement, we collected epochs from C4th(FB) to represent the reinforcement of a positive link100 ms before and 500 ms after the presentation of cards to a series of successful decisions [37].in two trials during each session: one proceeded by the first‘wrong’ feedback signal [W1st(C)], and the other pro- 2.4. Data analysisceeded by the 4th correct feedback signal [C4th(C)] (Fig.1). These two trials were interesting, because the W1st(C) The root mean square (RMS) was calculated as thewas considered to be a sorting shift condition, the period of strength of activities (amplitude) at each sampling point insearching for a new category and making a decision; each subject. Then, the group-mean RMS of all subjects atwhereas the C4th(C) was thought to be a continuously each sampling point was calculated and its curve wasperforming condition, the period of recalling and maintain- drawn in each condition to compare amplitude changeing the previous sorting rule. We recorded responses to the between the W1st(C) and C4th(C), or the W1st(FB) andC4th trails instead of the later correct trials to reduce the C4th(FB). In order to compare the averaged MEGhabituation effect. waveforms between the W1st and C4th in both the card
presentation and the feedback presentation study statistical-2.3.2. The feedback presentation experiment ly, we used the paired t-test at each time point (every 3.36
2Stimuli (0.130.1 m ) were projected on the wall in ms) based on the previous studies [21]. P,0.05 wasfront of the subjects. The distance of the stimuli from the considered to be significant. When the significance con-eyes was about 1.5 m. One of our aims in this study was to tinued at least three sequential time points (over 10 ms incompare location differences within the frontal cortex duration), we recognized the waveforms within this time
Fig. 2. The placement of the MEG device. The left hemisphere was almost entirely covered by these three placements.

L. Wang et al. / Cognitive Brain Research 12 (2001) 19 –31 23
period as meaningful components. The peak latency of were followed both for the card presentation study and foreach recognizable component was measured. the feedback presentation study.
The residual variance (%RV) indicated the percentage of2.5. Source analysis data which could not be explained by the model. The
goodness-of-fit (GOF) was expressed in percentage asThe source analysis was done for each component (1002%RV). Since the signal-to-noise ratio of the MEG
determined as mentioned above. At first, we estimated the recording was much smaller than that of the EEG record-position of an assumed single source for each component ing, GOF values larger than 90% are considered to indicateusing the single equivalent current dipole (ECD) model in a good multiple dipole model.a spherical volume conduction [39]. Two criteria were Magnetic resonance imaging (MRI) was performed withused in the application of the ECD model to calculate the a Magnex 150XT 1.5 T system (Shimadzu, Kyoto, Japan).single source for a magnetic response. One is that the T1-weighted coronal, axial and sagittal images with adipole location determined by the ECD model must remain continuous 1.5 mm slice thickness were used for overlaysstationary (lasting at least 10 ms) during the period of the with the theoretical sources calculated by BESA. Theresponse; the other is that the correlation between the common MEG and MRI landmarks (the nasion andrecording field and the estimated field is .0.95. As the bilateral preauricular points) allowed easy transformationcomponents recorded in the present study did not meet the of the head-based 3D coordinate system used by MEGcriteria in the application of a single ECD model, probably source analysis for the MRI. The MEG source locationsdue to overlapping activities in multiple areas, we used a were converted into pixels and slice values using the MRIbrain electric source analysis (BESA) software package transformation matrix and inserted onto the corresponding(NeuronScan, McLean, VA) for the computation of theoret- MR image.ical source generators of the MEG activities in a 3-layerspherical head model. This method allows the spatio-temporal modeling of multiple sources over defined inter- 3. Resultsvals. The location (x, y, and z positions) and orientation ofthe dipoles were calculated by an iterative least-squares fit. 3.1. Behavior and reaction timeThe origin of the head-based coordinate system was thepoint exactly halfway between the preauricular points. The All the subjects understood and performed the task wellx-axis indicated the coronal plane with positive values to with perseverative errors (failed to shift from one categorythe nasion; the y-axis, the sagittal plane with positive to another) and mistake errors of less than 1%. Meanvalues to the left; and the z-axis, the transaxial plane with reaction time to the W1st(C) condition (914.66306.0 ms)positive values up [32]. A four-step strategy was applied after the card presentation was not significantly differentindependently to the waveforms recorded from different from that to the C4th(C) condition (920.46287.0areas. We basically adopted a robust repeatable procedure ms)(paired t-test).to refine limited dipole sources, since fewer valid sourcesshould be more reliable than many potentially questionable 3.2. MEG to the card presentationsources. Only if a good model was not obtained using thetwo-dipole analysis, did we try to add another dipole. Four subjects were excluded from the study due to largeTherefore, at first, we analyzed the two-dipole localization eye movement artifacts. Therefore, we analyzed the resultsin each time period. of eight subjects. At first, we describe results recorded
In step 1, one dipole source for the activity was from the frontal and temporo-parietal recordings, sincecalculated in the frontal and the parietal area when the they were relatively similar. Although there were MEGdevice was placed at the F3 and C3 position, respectively. waveform variations among individuals, the activitiesIts orientation was calculated with the first location started approximately from 100 ms after the stimuli andconstraint in the prefrontal or parietal area. Then, the continued until the end of the analysis (500 ms) in thelocation constraint was released and re-fitted, retaining the recordings of both regions. From 100 to 500 ms, fourorientation obtained. In step 2, after determining the major peaks could be recognized (Fig. 3): 1M (mean peaktemporary location and orientation of the first source, the at 150 ms), 2M (220 ms), 3M (320 ms), and 4M (400 ms).second dipole was added with no constraint. In step 3, From the occipital recording, there were two or threeretaining the orientation and location of the second source, components peaking at about 150, 300 and 400 ms.the location and orientation of the first source were We compared the group-mean RMS at each time pointreleased and re-calculated. Then in step 4, the orientations between the two conditions (Fig. 4). In the frontal record-for both sources were fitted with the new location con- ing, the RMS at 200–220 ms (M200) and 370–440 msstraint. Finally, in order to compare the sources among (M370) to the sorting shift condition [the W1st(C)] wasindividuals, we named the major source as S1, and the significantly larger than that to the continuously perform-other as S2. The same procedures with a two-dipole model ing condition [the C4th(C)] (paired t-test, P,0.05). In the

24 L. Wang et al. / Cognitive Brain Research 12 (2001) 19 –31
Fig. 3. The MEG waveforms following the card presentation and the feedback signal recorded from each area in subject 1. The waveforms recorded at 37channels were superimposed to clarify each recognizable component. Obvious waveform differences between the sorting shift condition [W1st(C)] and thecontinuous condition [C4th(C)] were found from the frontal and temporo-parietal recordings. However, the waveforms were very similar to each other inthe occipital areas. The waveform difference was also found between the 1st wrong feedback condition [W1st(FB)] and the 4th correct feedback condition[C4th(FB)].
temporo-parietal recording, the RMS at 190–210 ms M190 component from the temporo-parietal recording(M190) to the W1st(C) was significantly smaller than that [TP(C)] was mainly located at the supramarginal gyrusto the C4th(C) (paired t-test, P,0.05). The RMS at (SMG, Brodmann’s area 40), and source 2 (S2) was300–440 ms (M300) to the W1st(C) was significantly located in the hand region of the primary sensori-motorlarger than that to the C4th(C) (paired t-test, P,0.05). No cortex. Both the S1 and S2 for M200 from the frontalsignificant difference in RMS at any time point was found recording [F(C)] were found to be located at the dorsola-between the two conditions in the occipital recording. teral, middle, and inferior frontal cortex. For M300 from
A two-dipole model for analyzing the M190, M200, the TP(C) recording, S1 was at the SMG and S2 was at theM300, and M370 components in the W1st(C) condition middle and inferior frontal gyrus. For the M370 com-was successfully made for each subject. The dipole ponent from the F(C) recording, S1 was found at thelocations varied among individuals. Table 1 summarizes dorsolateral prefrontal and middle frontal gyrus. S2 wasthe locations of the two sources responsible for these located at the dorsolateral prefrontal, middle frontal, andcomponents in all eight subjects. The source 1 (S1) of the inferior frontal gyrus. Fig. 5 shows the BESA results at the

L. Wang et al. / Cognitive Brain Research 12 (2001) 19 –31 25
Fig. 4. The group-averaged RMS of all subjects following the card presentation and the feedback signal recorded from each area. An obvious waveformdifference between the sorting shift condition [W1st(C)] and the continuous condition [C4th(C)] was found at 200 ms (M200) and 370 ms (M370) afterthe card presentation from the Frontal recording, and at 190 ms (M190) and 300 ms (M300) from the Temporo-Parietal recording. The waveformdifference between the 1st wrong feedback condition [W1st(FB)] and the 4th correct feedback condition [C4th(FB)] was from about 460 ms (M460) afterthe presentation of the feedback signal. The periods that showed significance by the paired t-test are shaded.
above times in one subject. We overlaid the sources the end of the recording (700 ms) with three major peaks:calculated by BESA onto MRI. Fig. 6 shows the dipole 180–250 ms (mean peak at 220 ms), 280–400 (350 ms)sources on MRI in six subjects. There were no significant and 400–650 ms (540 ms) (Fig. 3). The RMS at 460–640location differences between the S1 or the S2 of M200 and ms (M460) after the presentation of the 1st wrong feed-M370 (paired t-test) (Table 2). back [W1st(FB)] was significantly larger than that after the
The two-dipole model for analyzing the M200, M300, 4th correct feedback [C4th(FB)] (paired t-test, P,0.05)and M370 components in the C4th(C) condition at the (Fig. 4).same locations as the W1st(C) condition showed a low Analyzing the sources for M460 from the frontalvalue of GOF (approximately 70%) which did not reach recording in the W1st(FB) condition [F(FB)], we foundthe criteria of significance. However, only M190 in the that the S1 located at the dorsolateral prefrontal and middleTP(C) recording showed a significant two-dipole model at frontal gyrus. S2 was at the dorsolateral prefrontal, middle,the same locations as the W1st(C) condition (Fig. 5). and inferior frontal gyrus (Table 1, Fig. 6). There were no
significant differences in location of either the S1 or the S23.3. MEG to the feedback signals between the M460 component to the presentation of the
feedback signals and the M370 component to the cardMEG activities started from 180 ms and continued until presentation experiment (paired t-test) (Table 2).
26 L. Wang et al. / Cognitive Brain Research 12 (2001) 19 –31
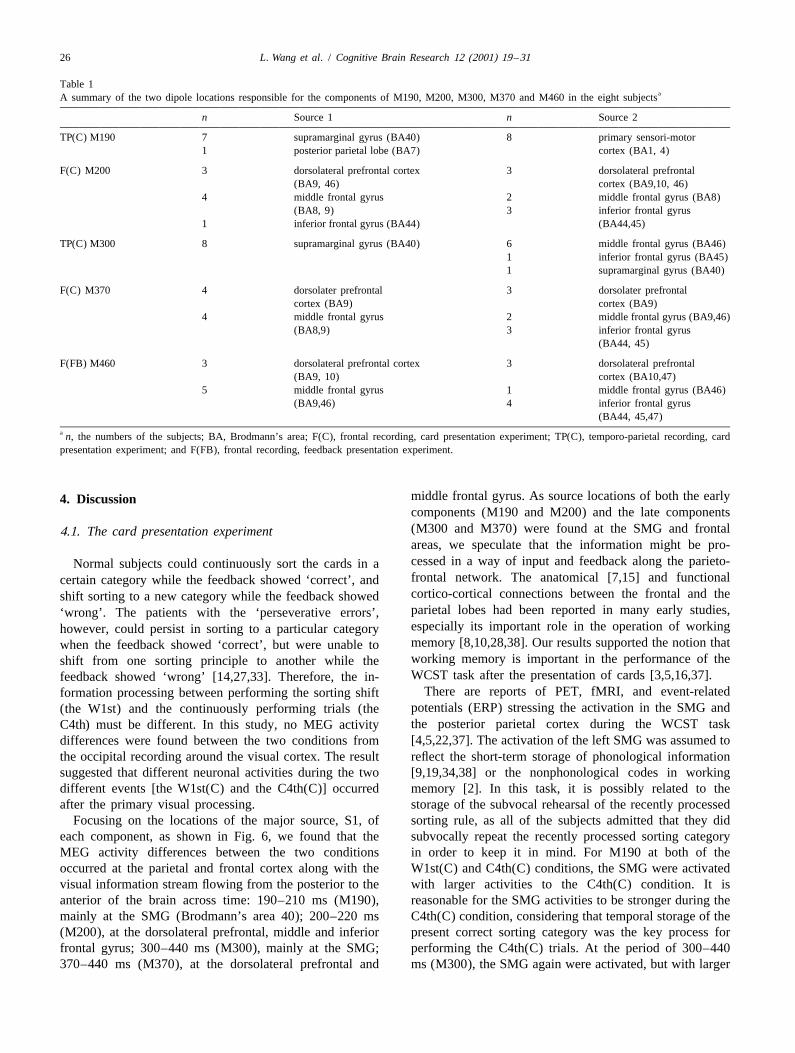
Table 1aA summary of the two dipole locations responsible for the components of M190, M200, M300, M370 and M460 in the eight subjects
n Source 1 n Source 2
TP(C) M190 7 supramarginal gyrus (BA40) 8 primary sensori-motor1 posterior parietal lobe (BA7) cortex (BA1, 4)
F(C) M200 3 dorsolateral prefrontal cortex 3 dorsolateral prefrontal(BA9, 46) cortex (BA9,10, 46)
4 middle frontal gyrus 2 middle frontal gyrus (BA8)(BA8, 9) 3 inferior frontal gyrus
1 inferior frontal gyrus (BA44) (BA44,45)
TP(C) M300 8 supramarginal gyrus (BA40) 6 middle frontal gyrus (BA46)1 inferior frontal gyrus (BA45)1 supramarginal gyrus (BA40)
F(C) M370 4 dorsolater prefrontal 3 dorsolater prefrontalcortex (BA9) cortex (BA9)
4 middle frontal gyrus 2 middle frontal gyrus (BA9,46)(BA8,9) 3 inferior frontal gyrus
(BA44, 45)
F(FB) M460 3 dorsolateral prefrontal cortex 3 dorsolateral prefrontal(BA9, 10) cortex (BA10,47)
5 middle frontal gyrus 1 middle frontal gyrus (BA46)(BA9,46) 4 inferior frontal gyrus
(BA44, 45,47)a n, the numbers of the subjects; BA, Brodmann’s area; F(C), frontal recording, card presentation experiment; TP(C), temporo-parietal recording, cardpresentation experiment; and F(FB), frontal recording, feedback presentation experiment.
middle frontal gyrus. As source locations of both the early4. Discussioncomponents (M190 and M200) and the late components(M300 and M370) were found at the SMG and frontal4.1. The card presentation experimentareas, we speculate that the information might be pro-cessed in a way of input and feedback along the parieto-Normal subjects could continuously sort the cards in afrontal network. The anatomical [7,15] and functionalcertain category while the feedback showed ‘correct’, andcortico-cortical connections between the frontal and theshift sorting to a new category while the feedback showedparietal lobes had been reported in many early studies,‘wrong’. The patients with the ‘perseverative errors’,especially its important role in the operation of workinghowever, could persist in sorting to a particular categorymemory [8,10,28,38]. Our results supported the notion thatwhen the feedback showed ‘correct’, but were unable toworking memory is important in the performance of theshift from one sorting principle to another while theWCST task after the presentation of cards [3,5,16,37].feedback showed ‘wrong’ [14,27,33]. Therefore, the in-
There are reports of PET, fMRI, and event-relatedformation processing between performing the sorting shiftpotentials (ERP) stressing the activation in the SMG and(the W1st) and the continuously performing trials (thethe posterior parietal cortex during the WCST taskC4th) must be different. In this study, no MEG activity[4,5,22,37]. The activation of the left SMG was assumed todifferences were found between the two conditions from
the occipital recording around the visual cortex. The result reflect the short-term storage of phonological informationsuggested that different neuronal activities during the two [9,19,34,38] or the nonphonological codes in workingdifferent events [the W1st(C) and the C4th(C)] occurred memory [2]. In this task, it is possibly related to theafter the primary visual processing. storage of the subvocal rehearsal of the recently processed
Focusing on the locations of the major source, S1, of sorting rule, as all of the subjects admitted that they dideach component, as shown in Fig. 6, we found that the subvocally repeat the recently processed sorting categoryMEG activity differences between the two conditions in order to keep it in mind. For M190 at both of theoccurred at the parietal and frontal cortex along with the W1st(C) and C4th(C) conditions, the SMG were activatedvisual information stream flowing from the posterior to the with larger activities to the C4th(C) condition. It isanterior of the brain across time: 190–210 ms (M190), reasonable for the SMG activities to be stronger during themainly at the SMG (Brodmann’s area 40); 200–220 ms C4th(C) condition, considering that temporal storage of the(M200), at the dorsolateral prefrontal, middle and inferior present correct sorting category was the key process forfrontal gyrus; 300–440 ms (M300), mainly at the SMG; performing the C4th(C) trials. At the period of 300–440370–440 ms (M370), at the dorsolateral prefrontal and ms (M300), the SMG again were activated, but with larger

L. Wang et al. / Cognitive Brain Research 12 (2001) 19 –31 27
Fig. 5. The theoretical sources calculated by BESA for the MEG activities in the different time periods and different task conditions in subject 1. Thesources were estimated at a particular period (shown by green shading) for each component. Therefore, waveforms of S1 and S2 for M190 in the TP(C)recording different from those for M300 in the TP(C), since the source locations for each period were different, although they were taken from the samerecording. In other words, waveforms in non-shaded periods were not meaningful. The relation between M200 and M370 was the same as that betweenM190 and M300.
responses to the W1st(C) condition. In order to find out the at the SMG during the period of 300–440 ms confined tonew sorting category, subjects must subvocally rehearse the W1st(C) condition might reflect the feedback process-the recently presented wrong sorting category (such as ing of these subvocal rehearsals. We did not find thesecolor) and consider the other two possibilities (shape and areas to be activated in response to the C4th(C) condition,number). Therefore, the continuous or reactivated response possibly because no feedback occurred, as there was no
28 L. Wang et al. / Cognitive Brain Research 12 (2001) 19 –31
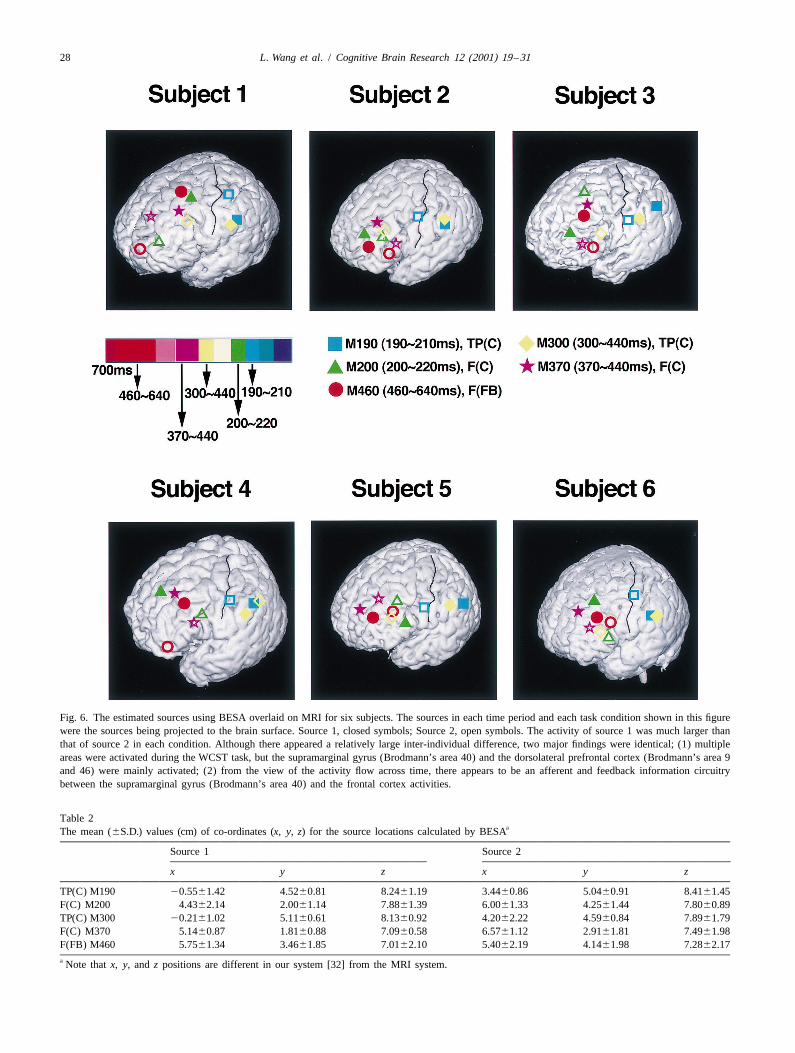
Fig. 6. The estimated sources using BESA overlaid on MRI for six subjects. The sources in each time period and each task condition shown in this figurewere the sources being projected to the brain surface. Source 1, closed symbols; Source 2, open symbols. The activity of source 1 was much larger thanthat of source 2 in each condition. Although there appeared a relatively large inter-individual difference, two major findings were identical; (1) multipleareas were activated during the WCST task, but the supramarginal gyrus (Brodmann’s area 40) and the dorsolateral prefrontal cortex (Brodmann’s area 9and 46) were mainly activated; (2) from the view of the activity flow across time, there appears to be an afferent and feedback information circuitrybetween the supramarginal gyrus (Brodmann’s area 40) and the frontal cortex activities.
Table 2aThe mean (6S.D.) values (cm) of co-ordinates (x, y, z) for the source locations calculated by BESA
Source 1 Source 2
x y z x y z
TP(C) M190 20.5561.42 4.5260.81 8.2461.19 3.4460.86 5.0460.91 8.4161.45F(C) M200 4.4362.14 2.0061.14 7.8861.39 6.0061.33 4.2561.44 7.8060.89TP(C) M300 20.2161.02 5.1160.61 8.1360.92 4.2062.22 4.5960.84 7.8961.79F(C) M370 5.1460.87 1.8160.88 7.0960.58 6.5761.12 2.9161.81 7.4961.98F(FB) M460 5.7561.34 3.4661.85 7.0162.10 5.4062.19 4.1461.98 7.2862.17a Note that x, y, and z positions are different in our system [32] from the MRI system.

L. Wang et al. / Cognitive Brain Research 12 (2001) 19 –31 29
necessity to search for a new sorting category in the tion of working memory system which is a criticalC4th(C) condition. processing in sorting cards. Insofar as we know, this is the
Although the M200 component from the frontal record- first MEG study on the WCST to investigate the spatialing had some time overlap with the M190 (10 ms earlier and temporal course during the performance of the task.than M200) from the temporo-parietal recording, weconsidered the two components to reflect different neuro-nal activities, as their source locations were very different.
4.2. The feedback presentation experimentMoreover, the M200 to the W1st(C) condition was largerthan that to the C4th(C) condition (Fig. 4). The activitiesto the W1st(C) condition varied among subjects widely at In the analysis of the feedback series, MEG differencesthe dorsolateral prefrontal cortex, and the middle and between the responses to the wrong feedback and those toinferior frontal gyrus (Brodmann’s area 44 and 45). the correct feedback were found at 460–640 ms after theActivities in the same area in response to the C4th(C) presentation of feedback signals, located in the dorsolateralcondition were not found. As it took about 20 ms for our prefrontal and the middle frontal gyrus (mainly Brod-projector to present the stimuli, the M200 component was mann’s area 9, source 1). The inferior frontal gyrus wasthought to start actually at 180–200 ms after the presenta- also activated in some subjects (source 2). As the process-tion of the cards. This is consistent with a previous ERP ing of shifting attention to other categories and inhibitionstudy [3], which showed a negative field potential in the of the previous category might occur shortly after theleft frontal area (F7 of the international 10-20 system) at presentation of the wrong feedback [22], the activity at170 ms after the onset of the card presentation. The reason 460–640 ms after the feedback signals in the dorsolateralfor the difference in MEG amplitude between the W1st(C) prefrontal and middle frontal gyrus could reflect theand C4th(C) in this time period might be: selective processing of shifting attention. There is also the possi-attentional shift to a new category and inhibition of an bility that this was only a response to the ‘wrong’ signalongoing reaction to the previous category similar to a itself, or only a response to surprise and an odd event, like‘no-go’ reaction. Evidence has proved that the dorsolateral the P300 component. A recent fMRI study found someprefrontal cortex (Brodmann’s area 9) operates attentional transient increase of neural activities in the medial superiorshift processing [13,37]. A frontal negativity specific to the frontal gyrus and precuneus gyrus with the attention shift‘no-go’ trial was found to occur as early as 150 ms after task, but no activities to the feedback itself without thethe stimulus onset [40,41]. Therefore, M200 activity in a attention shift requirement [31]. Moreover, a visual P300relatively wide area of the frontal cortex could reflect the component usually starts from 350 ms and ends at 500 msselective attention or inhibition processing. with a peak at about 400 ms. The MEG response at
The S1 for the M370 component was found mainly at 460–640 ms was a little delayed as a P300 potential.the Brodmann’s area 9 during the W1st(C) condition. The Therefore, the activities in the dorsolateral prefrontal andsame location was not activated during the C4th(C) the middle frontal areas at 460–640 ms to the wrongcondition. The M370 activity to the W1st(C) condition at feedback could reflect the shifting attention processingthe dorsolateral frontal areas (Brodmann’s area 9) could instead of a P300 component. We did not find the sourcereflect the increased workload of visual working memory location differences between the M460 to the feedbackfor making a decision for a new sorting principle during experiment and the M370 to the card presentation experi-the W1st(C) condition, an interpretation supported by a ment. Both of the components were found to be widelynumber of earlier studies that reported dorsolateral prefron- distributed in the frontal area. This is not surprising, givental activities specific to working memory [6,11,12,24]. that a widely spread area including the dorsolateral frontal,That the WCST task engages the working memory systems middle frontal, and inferior frontal areas was reported to behas already been proposed by many authors as we men- involved in working memory processing [8,35,36].tioned above. In summary, the present study proved the activation of
As a minor source, S2 of M190, the primary sensori- the fronto-parietal network, mainly at the supramarginalmotor area was activated. The activation in the primary gyrus and the dorsolateral frontal region, during thesensori-motor area for hand might be related to some performance of WCST across time streaming. The specificprocessing for the motor preparation. The S2 of M200, activities to the wrong feedback happened at 200 ms afterM300 and M370 were also found to be widely distributed the presentation of cards, and at 460 ms after the presenta-in the frontal area, which might imply a complicated tion of the feedback. There were no significant differencescognitive processing during this task, although their ac- in location between the MEG activities to the cardtivities were not so large (Fig. 5). presentation and that to the feedback presentation. Our
In general, we found the specific activities of the fronto- results suggested that both shifting attention to the wrongparietal network during the W1st(C) condition started from feedback signal and enhanced visual working memory to200 ms after the presentation of cards. The activation of sorting shift condition of the card presentation occur in athe fronto-parietal network might be related to the opera- broad frontal area at different time points.

30 L. Wang et al. / Cognitive Brain Research 12 (2001) 19 –31
(Eds.), Pyschopathology and the Brain, Raven Press, New York,Acknowledgements1991, pp. 1–23.
[17] D.A. Grant, E.A. Berg, A behavioral analysis of degree of re-We are grateful to Mr O. Nagata and Mr Y. Takeshima inforcement and ease of shifting to new responses in a Weigl-type
for technical help. We also thank Dr Watanabe, Dr Gunji, card-sorting problem, J. Exp. Psychol. 38 (1948) 404–411.and Dr Koyama for technical help and comments. This [18] J. Grafman, A. Salazar, H. Weingartner, S. Vance, D. Amin, The
relationship of brain-tissue loss volume and lesion location tostudy was supported by Grants-in-Aid for Scientific Re-cognitive deficit, J. Neurosci. 6 (1986) 301–307.search (07458215, 09558102, and C10670614), a Grant-in-
[19] R.N. Henson, N. Burgess, C.D. Frith, Recoding, storage, rehearsalAid for Scientific Research on Priority Areas (08279244) and grouping in verbal short-term memory: an fMRI study, Neuro-and a Grant-in-Aid for Exploratory Research (08878160) psychologia 38 (2000) 426–440.from the Ministry of Education, Science, Sports and [20] B.P. Hermann, A.R. Wyler, E.T. Richey, Wisconsin Card Sorting
Test performance in patients with complex partial seizures ofCulture of Japan.temporal-lobe origin, J. Clin. Exp. Neuropsychol. 10 (1988) 467–476.
[21] S.J. Jones, J.-P. Halone, F. Shawkat, Centrifugal and centripetalReferences mechanisms involved in the ‘gating’ of cortical SEPs during
movement, Electroencephalogr. Clin. Neurophysiol. 74 (1989) 36–45.[1] S.W. Anderson, H. Damasio, R.D. Jones, D. Tranel, Wisconsin Card
[22] S. Konishi, K. Nakajima, I. Uchida, M. Kameyama, K. Nakahara, K.Sorting Test performance as a measure of frontal lobe damage, J.Sekihara, Y. Miyashita, Transient activation of inferior prefrontalClin. Exp. Neuropsychol. 13 (1991) 909–922.cortex during cognitive set shifting, Nat. Neurosci. 1 (1998) 80–84.[2] A. Baddeley (Ed.), Working Memory, Clarendon Press, Oxford,
[23] S. Konishi, K. Nakajima, I. Uchida, H. Kikyo, M. Kameyama, Y.1986.Miyashita, Common inhibitory mechanism in human inferior pre-´[3] F. Barcelo, M. Sanz, V. Molina, F.J. Rubia, The Wisconsin Cardfrontal cortex revealed by event-related functional MRI, Brain 122Sorting Test and the assessment of frontal function: a validation(1999) 981–991.study with event-related potentials, Neuropsychologia 35 (1997)
[24] G. McCarthy, A.M. Blamire, A. Puce, A.C. Nobre, G. Bloch, F.399–408.Hyder, P. Goldman-Rakic, R.G. Shulman, Functional magnetic´[4] F. Barcelo, F.J. Rubia, Non-frontal P3b-like activity evoked by theresonance imaging of human prefrontal cortex activation during aWisconsin Card Sorting Test, NeuroReport 9 (1998) 747–751.spatial working memory task, Proc. Natl. Acad. Sci. USA 91 (1994)[5] K.F. Berman, J.L. Ostrem, C. Randolph, J. Gold, T.E. Goldberg, R.8690–8694.Coppola, R.E. Carson, P. Herscovitch, D.R. Weinberger, Physiologi-
[25] J. McFie, M.F. Piercy, The relation of laterality of lesion tocal activation of a cortical network during performance of theperformance on Weigl’s Sorting Test, J. Ment. Sci. 98 (1952)Wisconsin Card Sorting Test: a positron emission tomography299–308.study, Neuropsychologia 33 (1995) 1027–1046.
¨[26] H.J. Mentzel, C. Gaser, H.P. Volz, R. Rzanny, F. Hager, H. Sauer,[6] T.S. Braver, J.D. Cohen, L.E. Nystrom, J. Jonides, E.E. Smith, D.C.W.A. Kaiser, Cognitive stimulation with the Wisconsin Card SortingNoll, A parametric study of prefrontal cortex involvement in humanTest: functional MR imaging at 1.5 T, Radiology 207 (1998)working memory, Neuroimage 5 (1997) 49–62.399–404.[7] C. Cavada, P.S. Goldman-Rakic, Posterior parietal cortex in rhesus
[27] B. Milner, Effects of different brain lesions on card sorting: the rolemonkey: II. Evidence for segregated corticocortical networks linkingof the frontal lobes, Arch. Neurol. 9 (1963) 100–110.sensory and limbic areas with the frontal lobe, J. Comp. Neurol. 287
[28] C. Moscovitch, S. Kapur, S. Kohler, S. Houle, Distinct neural(1989) 422–445.correlates of visual long-term memory for spatial location and object[8] C.R. Clark, G.F. Egan, A.C. McFarlane, P. Morris, D. Weber, C.identity: a positron emission tomography study in humans, Proc.Sonkkilla, J. Marcina, H.J. Tochon-Danguy, Updating workingNatl. Acad. Sci. USA 92 (1995) 3721–3725.memory for words: a PET activation study, Hum. Brain Mapp. 9
[29] M.A. Mountain, W.G. Snow, Wisconsin Card Sorting Test as a(2000) 42–54.measure of frontal pathology: a review, Clin. Neuropsychol. 7[9] J.D. Cohen, W.M. Perlstein, T.S. Braver, L.E. Nystrom, D.C. Noll, J.(1993) 108–118.Jonides, E.E. Smith, Temporal dynamics of brain activation during a
[30] Y. Nagahama, H. Fukuyama, H. Yamauchi, S. Matsuzaki, J. Konishi,working memory task, Nature 386 (1997) 604–608.H. Shibasaki, J. Kimura, Cerebral activation during performance of[10] M. Corbetta, G.L. Shulman, F.M. Miezin, S.E. Petersen, Superiora card sorting test, Brain 119 (1996) 1667–1675.parietal cortex activation during spatial attention shifts and visual
[31] Y. Nagahama, T. Okada, Y. Katsumi, T. Hayashi, H. Yamauchi, N.feature conjunction, Science 270 (1995) 802–805.Sawamoto, K. Toma, K. Nakamura, T. Hanakawa, J. Konishi, H.[11] S.M. Courtney, L.G. Ungerleider, K. Keil, J.V. Haxby, Object andFukuyama, H. Sibasaki, Transient neural activity in the medialspatial visual working memory activate separate neural systems insuperior frontal gyrus and precuneus time locked with attention shifthuman cortex, Cereb. Cortex 6 (1996) 39–49.between object features, NeuroImage 10 (1999) 193–199.[12] M. D’Esposito, J.A. Detre, D.C. Alsop, R.K. Shin, S. Atlas, M.
[32] A. Nakamura, R. Kakigi, M. Hoshiyama, S. Koyama, Y. Kitamura,Grossman, The neural basis of the central executive system ofM. Shimojo, Visual evoked cortical magnetic fields to patternworking memory, Nature 378 (1995) 279–281.reversal stimulation, Brain Res. Cogn. Brain Res. 6 (1997) 9–22.[13] R. Dias, T.W. Robbins, A.C. Roberts, Dissociation in prefrontal
[33] H.E. Nelson, A modified card sorting test sensitive to frontal lobecortex of affective and attentional shifts, Nature 380 (1996) 69–72.defects, Cortex 12 (1976) 313–324.[14] E.A. Drewe, The effect of type and area of brain lesion on
[34] E. Paulesu, C.D. Frith, R.S. Frackowiak, The neural correlates of theWisconsin Card Sorting Test performance, Cortex 10 (1974) 159–verbal component of working memory, Nature 362 (1993) 342–345.170.
[35] M. Petrides, B. Alivisatos, A.C. Evans, E. Meyer, Dissociation of[15] J.M. Fuster (Ed.), The Prefrontal Cortex: Anatomy, Physiology, Andhuman mid-dorsolateral from posterior dorsolateral frontal cortex inNeuropsychology of the Frontal Lobe, Lippincott-Raven, Philadel-memory processing, Proc. Natl. Acad. Sci. USA 90 (1993) 873–phia, 1997, pp. 18–33.877.[16] P.S. Goldman-Rakic, Prefrontal cortical dysfunction in schizophre-
nia: The relevance of working memory, in: B.J. Carroll, J.E. Barrett [36] B.R. Postle, M. D’Esposito, ‘‘What’’-Then-‘‘Where’’ in visual

L. Wang et al. / Cognitive Brain Research 12 (2001) 19 –31 31
working memory: an event-related fMRI study, J. Cogn. Neurosci. [39] J. Sarvas, Basic mathematical and electromagnetic concepts of the11 (1999) 585–597. biomagnetic inverse problem, Phys. Med. Biol. 32 (1987) 11–22.
[37] R.D. Rogers, T.C. Andrews, P.M. Grasby, D.J. Brooks, T.W. [40] K. Sasaki, H. Gemba, A. Nambu, R. Matsuzaki, No-go activity inRobbins, Contrasting cortical and subcortical activations produced the frontal association cortex of human subjects, Neurosci. Res. 18by attentional-set shifting and reversal learning in humans, J. Cog. (1993) 249–252.Neurosci. 12 (2000) 142–162. [41] S. Thorpe, D. Fize, C. Marlot, Speed of processing in the human
[38] E. Salmon, M. Van der Linden, F. Collette, G. Delfiore, P. Maquet, visual system, Nature 381 (1996) 520–522.C. Degueldre, A. Luxen, G. Franck, Regional brain activity duringworking memory tasks, Brain 119 (1996) 1617–1625.