Embed Size (px)
Citation preview
Eurographics Conference on Visualization (EuroVis) 2014H. Carr, P. Rheingans, and H. Schumann(Guest Editors)
Volume 33 (2014), Number 3
Networks of Names: Visual Exploration and Semi-AutomaticTagging of Social Networks from Newspaper Articles
A. Kochtchi1, T. von Landesberger2, and C. Biemann1
1Language Technology Group, TU Darmstadt, Germany & 2Interactive Graphics Systems Group, TU Darmstadt, Germany
AbstractUnderstanding relationships between people and organizations by reading newspaper articles is difficult to man-age for humans due to the large amount of data. To address this problem, we present and evaluate a new visualanalytics system, which offers interactive exploration and tagging of social networks extracted from newspapers.For the visual exploration of the network, we extract “interesting” neighbourhoods of nodes, using a new degreeof interest (DOI) measure based on edges instead of nodes. It improves the seminal definition of DOI, which wefind to produce the same “globally interesting” neighbourhoods in our use case, regardless of the query. Ourapproach allows answering different user queries appropriately, avoiding uniform search results.We propose a user-driven pattern-based classifier for discovery and tagging of non-taxonomic semantic relations.Our approach does not require any a-priori user knowledge, such as expertise in syntax or pattern creation. Anevaluation shows that our classifier is capable of identifying known lexico-syntactic patterns as well as variousdomain-specific patters. Our classifier yields good results already with a small amount of training, and continu-ously improves through user feedback.We conduct a user study to evaluate whether our visual interactive system has an impact on how users tag rela-tionships, as compared to traditional text-based interfaces. Study results suggest that users of the visual systemtend to tag more concisely, avoiding too abstract or overly specific relationship labels.
Categories and Subject Descriptors (according to ACM CCS): H.5.2 [Information Interfaces and Presentation]: UserInterfaces (D.2.2, H.1.2, I.3.6)—Interaction styles (e. g. , commands, menus, forms, direct manipulation) I.3.6[Computer Graphics]: Methodology and Techniques—Graphics data structures and data types
1. Introduction
People and organizations interact and influence their envi-ronment, the society, and public policy. Information on theinteractions of people and organizations is encoded by printmedia as natural language text. To extract the informationon relations from these texts, it is necessary to read and un-derstand them. However, with more than 350 daily newspa-pers published in Germany alone [Bun11] and rising num-bers of online publications, the task of conducting extensiveresearch in newspaper articles of even a single day becomesincreasingly difficult.
In the late 20th century, Mark Lombardi analysed polit-ical and financial scandals by collecting and organizing in-formation from newspapers into a collection of hand-writtencards [Smi00]. He showed his results in so-called narrativestructures, a form that is more accessible and aesthetically
pleasing for humans. Conceptually, narrative structures arenode-link-diagrams of an underlying social network.
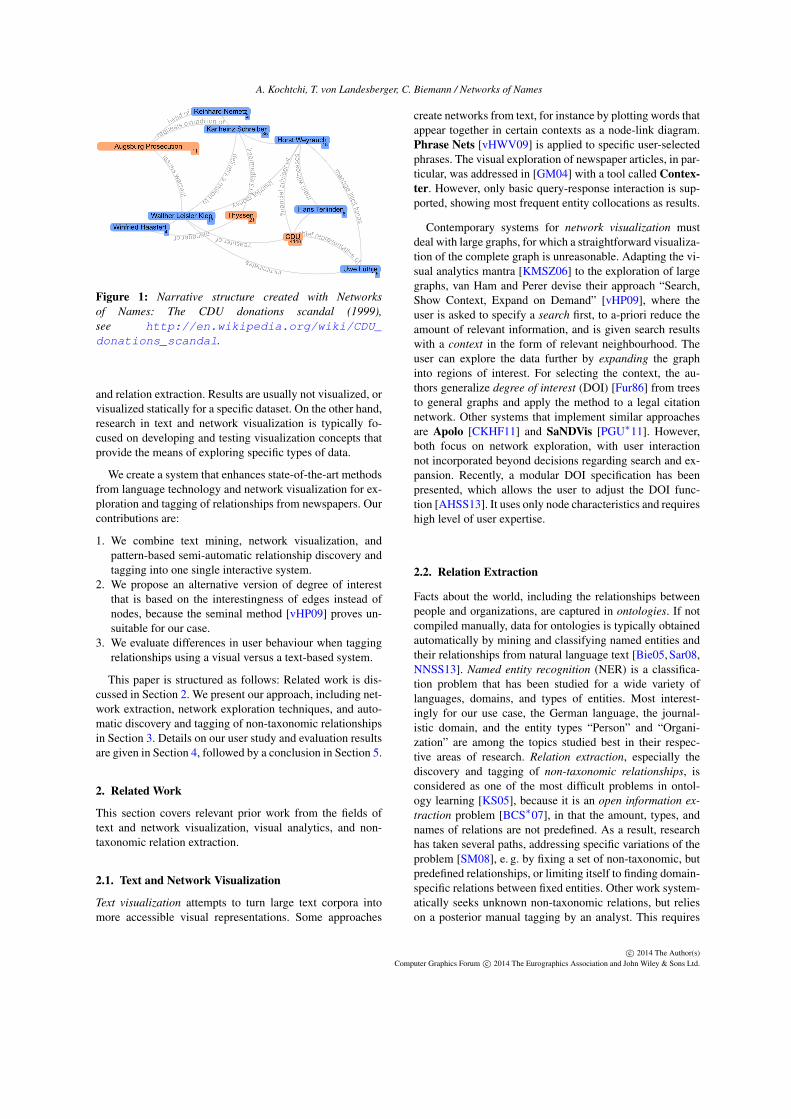
Following Lombardi’s approach, we extract and visualizesocial network information derived from newspapers. Un-like Lombardi, we collect, organize, and visualize the infor-mation automatically (for a narrative structure created withNetworks of Names, see Figure 1). This approach poses anumber of computational problems: First, the understand-ing of social relationships remains a challenging automationtask [KS05]. Second, the underlying social network is po-tentially large and thus cannot be visualized in a straight-forward manner [KMSZ06].
Most research in natural language processing and textmining focuses on development, application, and quantita-tive evaluation of specific methods in specific domains. Inparticular, the same is true for the fields of entity recognition
c© 2014 The Author(s)Computer Graphics Forum c© 2014 The Eurographics Association and JohnWiley & Sons Ltd. Published by John Wiley & Sons Ltd.
A. Kochtchi, T. von Landesberger, C. Biemann / Networks of Names
Figure 1: Narrative structure created with Networksof Names: The CDU donations scandal (1999),see http://en.wikipedia.org/wiki/CDU_donations_scandal.
and relation extraction. Results are usually not visualized, orvisualized statically for a specific dataset. On the other hand,research in text and network visualization is typically fo-cused on developing and testing visualization concepts thatprovide the means of exploring specific types of data.
We create a system that enhances state-of-the-art methodsfrom language technology and network visualization for ex-ploration and tagging of relationships from newspapers. Ourcontributions are:
1. We combine text mining, network visualization, andpattern-based semi-automatic relationship discovery andtagging into one single interactive system.
2. We propose an alternative version of degree of interestthat is based on the interestingness of edges instead ofnodes, because the seminal method [vHP09] proves un-suitable for our case.
3. We evaluate differences in user behaviour when taggingrelationships using a visual versus a text-based system.
This paper is structured as follows: Related work is dis-cussed in Section 2. We present our approach, including net-work extraction, network exploration techniques, and auto-matic discovery and tagging of non-taxonomic relationshipsin Section 3. Details on our user study and evaluation resultsare given in Section 4, followed by a conclusion in Section 5.
2. Related Work
This section covers relevant prior work from the fields oftext and network visualization, visual analytics, and non-taxonomic relation extraction.
2.1. Text and Network Visualization
Text visualization attempts to turn large text corpora intomore accessible visual representations. Some approaches
create networks from text, for instance by plotting words thatappear together in certain contexts as a node-link diagram.Phrase Nets [vHWV09] is applied to specific user-selectedphrases. The visual exploration of newspaper articles, in par-ticular, was addressed in [GM04] with a tool called Contex-ter. However, only basic query-response interaction is sup-ported, showing most frequent entity collocations as results.
Contemporary systems for network visualization mustdeal with large graphs, for which a straightforward visualiza-tion of the complete graph is unreasonable. Adapting the vi-sual analytics mantra [KMSZ06] to the exploration of largegraphs, van Ham and Perer devise their approach “Search,Show Context, Expand on Demand” [vHP09], where theuser is asked to specify a search first, to a-priori reduce theamount of relevant information, and is given search resultswith a context in the form of relevant neighbourhood. Theuser can explore the data further by expanding the graphinto regions of interest. For selecting the context, the au-thors generalize degree of interest (DOI) [Fur86] from treesto general graphs and apply the method to a legal citationnetwork. Other systems that implement similar approachesare Apolo [CKHF11] and SaNDVis [PGU∗11]. However,both focus on network exploration, with user interactionnot incorporated beyond decisions regarding search and ex-pansion. Recently, a modular DOI specification has beenpresented, which allows the user to adjust the DOI func-tion [AHSS13]. It uses only node characteristics and requireshigh level of user expertise.
2.2. Relation Extraction
Facts about the world, including the relationships betweenpeople and organizations, are captured in ontologies. If notcompiled manually, data for ontologies is typically obtainedautomatically by mining and classifying named entities andtheir relationships from natural language text [Bie05, Sar08,NNSS13]. Named entity recognition (NER) is a classifica-tion problem that has been studied for a wide variety oflanguages, domains, and types of entities. Most interest-ingly for our use case, the German language, the journal-istic domain, and the entity types “Person” and “Organi-zation” are among the topics studied best in their respec-tive areas of research. Relation extraction, especially thediscovery and tagging of non-taxonomic relationships, isconsidered as one of the most difficult problems in ontol-ogy learning [KS05], because it is an open information ex-traction problem [BCS∗07], in that the amount, types, andnames of relations are not predefined. As a result, researchhas taken several paths, addressing specific variations of theproblem [SM08], e. g. by fixing a set of non-taxonomic, butpredefined relationships, or limiting itself to finding domain-specific relations between fixed entities. Other work system-atically seeks unknown non-taxonomic relations, but relieson a posterior manual tagging by an analyst. This requires
c© 2014 The Author(s)Computer Graphics Forum c© 2014 The Eurographics Association and John Wiley & Sons Ltd.

A. Kochtchi, T. von Landesberger, C. Biemann / Networks of Names
expertise that is not available in our scenario, as we assumeusers without specific knowledge in language technology.
Our work is also related to finding lexico-syntactic pat-terns. This has originally been performed manually, typi-cally for hyponym relations [Hea92, SJN05]. Later, semi-automatic approaches for other kinds of relations, such ascausation [GM02], were developed. This includes the fab-rication of common and generalized grammatical construc-tions like “<NP1> such as <NP2> and <NP3>” (whereNP stands for “noun phrase”). The pattern implies a hy-ponym relationship between <NP1> and <NP2>, and be-tween <NP1> and <NP3>. Since manual creation of suchpatterns is tedious, automatic methods have also been sug-gested [Sar08]. However, these approaches rely on prede-fined and possibly also pre-named relationships and thuscannot be applied to our use case. While manual patterncreation is more flexible, it is unsuitable for non-expertusers, since it requires knowledge about syntax and lexico-syntactic patterns as well as reasoning about pattern quality.
3. Approach
Our system Networks of Names can be divided into twomain parts: the preprocessor and the visual interactive sys-tem. The visual interactive system consists of three compo-nents: the interactive visualization (the system’s frontend) aswell as the server and classifier (the system’s backend).
The system workflow is depicted in Figure 2: It extracts asocial network from a natural language text corpus prior tothe operation of the visual interactive system (1) (see Sec-tion 3.1 for details).
The visual interactive systems allows for exploration ofthe extracted network and tagging of the relationships basedon the sentences from the underlying corpus (see Figure 2).Using the query dialogue of the visualization, users defineone or two focal entities (2a). A subgraph containing theusers’ search terms is determined by the server (3). Userscan then explore the graph visually by expanding or remov-ing nodes (2b). Clicking on a link brings up the sourcesview (2c), which shows the sentences the relationship wasextracted from. In this view, users can create tags for therelationship. Tag labels appear on the respective link in thevisualization. At the same time, user-created tags are used asinput for training a classifier, which subsequently generatestags for other similar relationships automatically (4). Detailson the components of the visualization, server, and classifierare found in Sections 3.2, 3.3, and 3.4, respectively.
3.1. Preprocessor: Network Extraction
The preprocessor mines a social network from natural lan-guage corpora. We focus on German newspaper articlesand use corpora from the “Leipzig Corpora Collection”(LCC) [QRB06]. The LCC compiles roughly 70 millions
Figure 2: Networks of Names: The preprocessor extracts anetwork from the corpus (1). Users search (2a) for an in-teresting subgraph that contains the query and expand ondemand (2b). Search and expansion is handled by the server(3). Users tag source sentences (2c). User-created tags areused for classifier training and application (4).
sentences from German online newspaper publications cov-ering the timeframe from 1995 to 2010. Although we useonly one language and only a single data source in the scopeof this work, this is no design limitation and the data couldbe extended in the future.
Vertices of the network represent either people or orga-nizations. Edges indicate binary relationships. To recognizethe names of people and organizations and their type (personor organization) we employ the Stanford Names Entity Rec-ognizer (Stanford NER) [FGM05]. Specifically, we use theGerman NER [FP10]. We aggregate and count the numberof occurrences of each entity.
For relationship extraction, we regard two entities to sharea connection if they appear together in a sentence, i. e. co-occur. Like with entities, we aggregate and count their oc-currences. We follow this approach for two reasons:
1. We take a user-driven approach where classification fol-lows user decisions. Therefore, we do not focus on rela-tionship classification during network extraction.
2. Most methods for relationship extraction classify rela-tionships into a set of predefined relations. We overcomethis limitation by allowing for arbitrary types of relation-ships, defined by a user-created folksonomy.
To ameliorate the quality of output, we perform datapreprocessing and cleaning: Prior to the extraction, wesearch/replace “corrupt” symbols and remove sentences thatcontain non-recognisable characters. This randomly samplesthe dataset without any substantial influence on the size orexpressiveness of the original sample. After extraction, we
c© 2014 The Author(s)Computer Graphics Forum c© 2014 The Eurographics Association and John Wiley & Sons Ltd.

A. Kochtchi, T. von Landesberger, C. Biemann / Networks of Names
remove entities that occur less than twice, have very shortor generic names, or contain special characters. We removenews agencies, because their occurrence in sentences usu-ally denotes the origin of the news rather than a relationship.Lastly, we whitelist and blacklist a small number of entitiesthat appear frequently, but are commonly misclassified.
The resulting network has 47,939 vertices and 184,053edges, an average vertex degree of 7.68 and a network clus-tering coefficient of 0.46. The diameter is 20 and the aver-age shortest path length is 4.56. The power-law exponentis 2.51 (according to [CSN09]). The network shows prop-erties of a scale-free and small-world network. Scale-freenetworks contain hubs, high-degree nodes that heavily con-tribute to graph connectivity. In our network, hubs are usu-ally celebrities and politicians, multi-national corporations,famous sports clubs, or political parties. In small-world net-works, paths between any two vertices are very short and thediameter is small regardless overall network size. It followsthat there usually exists a path between any two entities ofthe network and the shortest path between them is short.
Since we use a German corpus, the system displays sen-tences in German and users create German tags duringthe user study. For better understandability by internationalreaders, all text examples and figures in this paper have beenmanually translated into English.
3.2. Visualization: Exploring and Tagging Relationships
The interface of Networks of Names is designed for userswith no special background knowledge. Thus, it does notcontain exhaustive possibilities of parametrisation, but fo-cuses on decisions related to the exploration and analysisprocess itself.
The exploration process starts by a search for one or twoentity names. The network view then displays the respectivenodes and their context within the network. The user can ex-plore the network further by expanding or removing nodes(for details on search and expansion, see Section 3.2.1).Clicking on a link in the graph displays the sources view(see Figure 6), which allows the user to view and tag the un-derlying news sentences, which were used for extracting therelationship represented by the link (see Section 3.2.2).
3.2.1. Network View: Exploring the Network
We visualize the network as a node-link diagram, since itis believed to be a particularly intuitive representation ofgraphs [GFC04] and allows the users to follow paths. Exam-ple visualizations can be seen in Figures 1 and 3. A node ofthe graph represents a person (blue) or an organization (or-ange). Entity names are depicted as a label within the node.Since not all nodes are shown (see Section 3.3.1), the num-ber of hidden neighbours is indicated in the right bottom cor-ner of each node. A link represents a relationship between
Figure 3: Visual aid for graph exploration: Hovering a nodehighlights incident edges and adjacent nodes.
two nodes. If the relationship is tagged, the label appears astext on the link.
We use a force-directed layout algorithm for graph draw-ing. We improve the user’s ability to quickly perceive the in-formation drawn onto the screen by initially positioning thesame nodes at the same place. For that, we hash entity namesonto (x,y) coordinates. This results in similar searches arriv-ing at similar layouts.
Once the search result is displayed, the user has severalpossibilities to adjust the layout and the view: panning andzooming, dragging and dropping nodes, and hovering nodesand edges to highlight incident edges and/or adjacent nodes(see Figure 3).
The user may also remove nodes and links or display ad-ditional nodes. The latter is achieved by expanding moreneighbours of on-screen nodes using our extended DOI func-tion (see Section 3.3).
3.2.2. Sources View: Viewing and Tagging Sources
The user can open the sources view by clicking a link in thenetwork view (see Figure 6). The sources view shows thesentences used by the preprocessor to extract the respectiverelationship. While the existence of a link indicates the exis-tence of a relationship, viewing the sources allows the userto gain an understanding of the relationship’s semantics.
Users can add tags to source sentences in order to char-acterise the relationship’s semantics. The user enters the taginto the tagging widget that accompanies every sentence (seeFigure 6). For the user, this serves the purpose of making thetag appear as a label of the link in the displayed graph.
In order to ensure diversity of sentences, we aggregate thesentences in clusters and only show a few representants percluster (see Section 3.3.2 for details).
c© 2014 The Author(s)Computer Graphics Forum c© 2014 The Eurographics Association and John Wiley & Sons Ltd.

A. Kochtchi, T. von Landesberger, C. Biemann / Networks of Names
3.3. Server: Computations
The server answers user queries that require calculations onthe (complete) network structure or are computationally ex-pensive. This is used for searching entities and returningan “interesting” subgraph to the network view (see Sec-tion 3.3.1). If the user requests to see sources for a relation-ship, the respective sentences are clustered by similarity toreduce the textual load on users (see Section 3.3.2).
3.3.1. Expansion: Extracting Interesting Contexts
The user initiates exploration by entering an entity name.Our aim is to return the corresponding vertex (called the fo-cal vertex) and a context – its “interesting” neighbourhood.More formally, given a focal vertex y from a large graph G,we extract a connected subgraph F of G that contains y, hassome predefined size n, and maximal total “interestingness”.
We quantify the interestingness of a subgraph by using adegree of interest (DOI) function. The seminal node-baseddefinition of DOI [vHP09] defines vertex interestingness bya combination of an a-priori vertex interestingness (in ourcase the entity’s frequency in the corpus), the distance to thefocal node, and possibly additional user criteria. Based onDOI, an algorithm can select an interesting neighbourhoodof the focal vertex. However, we find that this node-baseddefinition of DOI uniformly produces the same “globally in-teresting” results, regardless of the query term (see Figure 4).This is most likely caused by the scale-free and small-worldproperties described in Section 3.1, as high-frequency nodesdrive the expansion away from the original search.
To counteract this problem, we propose an alternativeDOI function that operates on edges instead of nodes. Wedefine DOIedge in Equation 1, where {u,v} is the edge ofwhich the DOI is to be evaluated and y is the focal vertex;API defines an a-priori interest of the edge and D the dis-tance of the edge from the focal vertex; the factors α and γ
can be used to weight the components. Using our measure,we obtain the result seen in Figure 5.
DOIedge({u,v}|y,z) = α ·APIedge({u,v})+ γ ·Dedge({u,v},y)
(1)
This variant allows us to employ a larger variety of mea-sures to quantify a-priori interestingness. Inspired by infor-mation theory, we express APIedge by normalized pointwisemutual information (NPMI) [Bou09], a significance mea-sure for co-occurrence. We define positive NPMI by scalingits interval from [−1,1] to [0,1]. Hence, applying positiveNPMI to an edge {u,v} yields 1 if and only if u and v al-ways appear together and 0 if u and v never co-occur.
We define the elements of DOIedge as follows:
APIedge({u,v}) = npmi+({u,v})
Dedge({u,v},y) =−(0.5d({u,v},y) ·npmi+({u,v}))
(a) Search for Angela Merkel with seminal node-based DOI
(b) Search for Stefan Raab with seminal node-based DOI
Figure 4: Search and expand using a DOI measure based onnode frequency. Two very different searches, Angela Merkel(the chancellor of Germany) and Stefan Raab (an enter-tainer and TV host) have very similar results due to a strongbias towards high-frequency nodes.
where npmi+({u,v}) is our positive NPMI measure andd({u,v},y) denotes the shortest path distance of the edge{u,v} to the focal vertex y (meaning min(d(u,y),d(v,y))).The definition of Dedge is defined to discount the value ofAPIedge based on distance to the focal node (discounting byabsolute values is not possible for NPMI). We weight thecomponents equally by setting α = γ = 1.
We extract the subgraph as follows: The set of selected
c© 2014 The Author(s)Computer Graphics Forum c© 2014 The Eurographics Association and John Wiley & Sons Ltd.

A. Kochtchi, T. von Landesberger, C. Biemann / Networks of Names
Figure 5: Search for Stefan Raab using our edge-based DOImeasure. The result shows a neighbourhood containing ver-tices that are closely related to the focal node (instead of ex-panding globally interesting nodes such as political partiesand politicians, as seen in Figure 4 (b)).
vertices S initially contains the focal vertex y. We maintaina priority queue of candidate edges Q, ordered by DOIedge.Initially, Q is filled with all edges incident to y. In every step,the algorithm pops the edge with highest DOI from Q andadds the endpoint v that is not yet in S to S. All incident edgesof v are added to Q. This step is repeated until S reaches thedesired size n or until no candidates are left in Q. The resultis the subgraph induced by all vertices in S.
In addition to the search for one entity, we allow theuser to enter two focal entities. In this case, we startby searching a path that connects the two entities. Sinceshortest paths have limited expressiveness in small-worldgraphs [HMLH10], we construct paths of maximum inter-estingness instead. We obtain such paths by calculating a(preferably short) maximum-capacity path [Pun91, MC02],i. e. a path where the capacity of the minimum-capacity edgeis maximal. For edge capacity, we use the a-priory interestAPIedge rounded to two decimal digits (to prevent small dif-ferences in capacity having an impact). An interesting sub-graph is extracted with the algorithm for one focal node, butwith S initialized to all vertices on the max-capacity path.
Regardless the definition of DOI, low-quality expansioncan be caused by the presence of hubs (i. e. high-frequencynodes such as political parties). Hubs are frequent in our net-work due to the scale-free property (see Section 3.1). Ex-panding a hub introduces a large number of candidates forfurther expansion (e. g. the members of the party), whichare likely to include relationships of high DOI. This favoursthe expansion of vertices that are only marginally related tothe original search. Preferring direct connections to connec-tions via hubs instead, we do not add the neighbours of hubs
Figure 6: The sources view shows source sentences for a re-lationship. Sentences appear grouped by similarity and canbe tagged by users. Tag labels appear on the correspondinggraph edge. User-created tags are utilized to train an auto-matic relationship classifier.
as candidates for expansion (they may still be expanded asneighbours of other nodes or manually by user interaction).
3.3.2. Clustering Sentences
In the sources view, sentences are displayed clustered bysimilarity. We determine clusters using the Markov Cluster-ing Algorithm [vD00], comparing sentences by cosine simi-larity of their vector representation based on tf-idf [MRS08],a measure that gives the importance of a term in a documentcollection by relating the number of times a word appears ina single document to the frequency of the word in the corpus.
We display three representative sentences from each clus-ter: First, the earliest source for the cluster. Second, a sen-tence in which the two entities appear close to each other.Third, a sentence with an automatic tag that was not yetaccepted or rejected by a user (see Section 3.4). All othersentences from the cluster are hidden and can be shown ondemand (see Figure 6).
3.4. Classifier: User-driven Automatic Tagging
During network exploration, users produce tags that describea semantic relationship between two entities. Thereby, usersproduce three sorts of interesting data:
1. They signal that a semantic relationship exists betweentwo entities.
2. They identify a sentence that contains or implies the se-mantic relationship between them.
c© 2014 The Author(s)Computer Graphics Forum c© 2014 The Eurographics Association and John Wiley & Sons Ltd.
A. Kochtchi, T. von Landesberger, C. Biemann / Networks of Names
3. They name the relationship by entering a label.
We implement a classifier that exploits this data. The clas-sifier is trained and applied during the system’s operation.Initially, training data is scarce. Thus, the classifier mustwork with little supervision and almost no feedback on itsdecisions.
According to Sarawagi’s taxonomy [Sar08], our problemis similar to the case where “given one or more relation-ship types, [...] our goal is to find all occurrences of thoserelationships”. Our case is slightly different in that we ob-tain not only an entity pair and a relationship label, but alsothe accompanying source sentence. Using this, we build ourclassifier to extract lexico-syntactic patterns directly fromthat sentences. We propose a high-precision low-recall ap-proach: The pattern is the shortest phrase from the sentencethat contains both entity names and possibly a non-stopwordkeyword from the label. Both phrase and label are gener-alized by substituting names and keyword by placeholders.For instance, given the sentence
However, head of the Augsburg Prosecution, Rein-hard Nemetz, relies on the extradition of Schreiber,who holds not only a German but also a Canadiancitizenship.
and the user-entered label “head of” for the relationshipbetween Reinhard Nemetz and the Augsburg Prosecution,the system derives the pattern “<W> of the <O>, <P>”,where <W>, <P>, and <O> are respective placeholders forthe keyword, person, and organization (the system also en-codes tag direction, but we omit this detail for brevity). Anal-ogously to the pattern, the label is generalized to “<W> of”,i. e. replacing the only non-stopword keyword “head” by aplaceholder for any expression.
If a pattern is extracted, the classifier proceeds by apply-ing the newly learned pattern to the whole corpus. For that, itinstantiates the generalized label to new tags for every matchby replacing the placeholder <W> by the expression that ap-pears in the matched sentence. For instance, the classifierwould tag a sentence that contains the phrase “treasurer ofthe CDU, Walter Leisler Kiep” by instantiating the above la-bel to “treasurer of” for the relationship between the CDUand Kiep.
Automatic tags that were already user-created are in-stantly accepted as correct. Other automatic tags can be man-ually accepted or rejected by users. In addition, the systemassumes a user to accept a tag if he selects its label to ap-pear on the corresponding link or if creates another tag withthe same label for the same relationship. Using the numberof accepted and rejected applications of pattern i, it is possi-ble to calculate the pattern’s precision [MRS08] p(i), whichdenotes the fraction of correct applications on a [0,1] scale:
p(i) =# accepted applications
# accepted applications+# rejected applications
With regard to the metric’s meaning, two factors should beconsidered: First, since the calculation is based only on thenumber of applications that were accepted or rejected, it isimportant that the sample be sufficiently large and represen-tative. Second, due to lack of a gold standard, the precision isa result of posterior evaluation (i. e. evaluation that includesuser decisions) and is thus susceptible to user bias.
4. Evaluation and Results
In order to evaluate the capabilities of our visual interactivesystem, we conducted a user study (Section 4.1). Based ondata from the study, we also evaluated our classifier (Sec-tion 4.2).
4.1. User Study
The study aim was threefold:
1. We wanted to test the system with users that have nospecial knowledge on networks, network visualization, orlanguage technology, and no knowledge about the work-ing of the system. We wanted to see how users choose tointeract with the system and collect feedback on how todevelop it further in the future.
2. We wanted to obtain authentic data needed to train, applyand evaluate our classifier.
3. We wanted to analyse whether our visual interactive sys-tem impacts how users create tags, as opposed to a com-parable text-based tool.
4.1.1. User Study Setup
We conducted the user study with 26 participants using abetween-group design: The users were split into two groupsof 13 participants each. Users from the first group wereasked to use the visual interactive system (the visual study),users from the second group were confronted with a text-based system (the text study). The text-based system corre-sponds to the sources view of our visual interactive system,but lacks the graph visualization and all possibilities of inter-action related to graph exploration. Instead, it successivelyopens sources views for a number of relationships.
Participants of the visual study were asked explore one ofthe example searches, conduct at least one search of theirown choice, and to accept or reject automatic labels, shouldthey encounter any. Users were given several degrees of free-dom: For searches, users could choose how many searchesthey conduct and what names they search for. In the graphexploration, they could navigate the graph freely and choosewhat they explore and present. Users could freely open thesources view, tag sentences, as well as decide how many tagsthey produce and how they word tag labels. Users could de-termine how much time they spend with the system.
In the text study, users were presented the sources viewfor relationships that directly corresponded to relationships
c© 2014 The Author(s)Computer Graphics Forum c© 2014 The Eurographics Association and John Wiley & Sons Ltd.
A. Kochtchi, T. von Landesberger, C. Biemann / Networks of Names
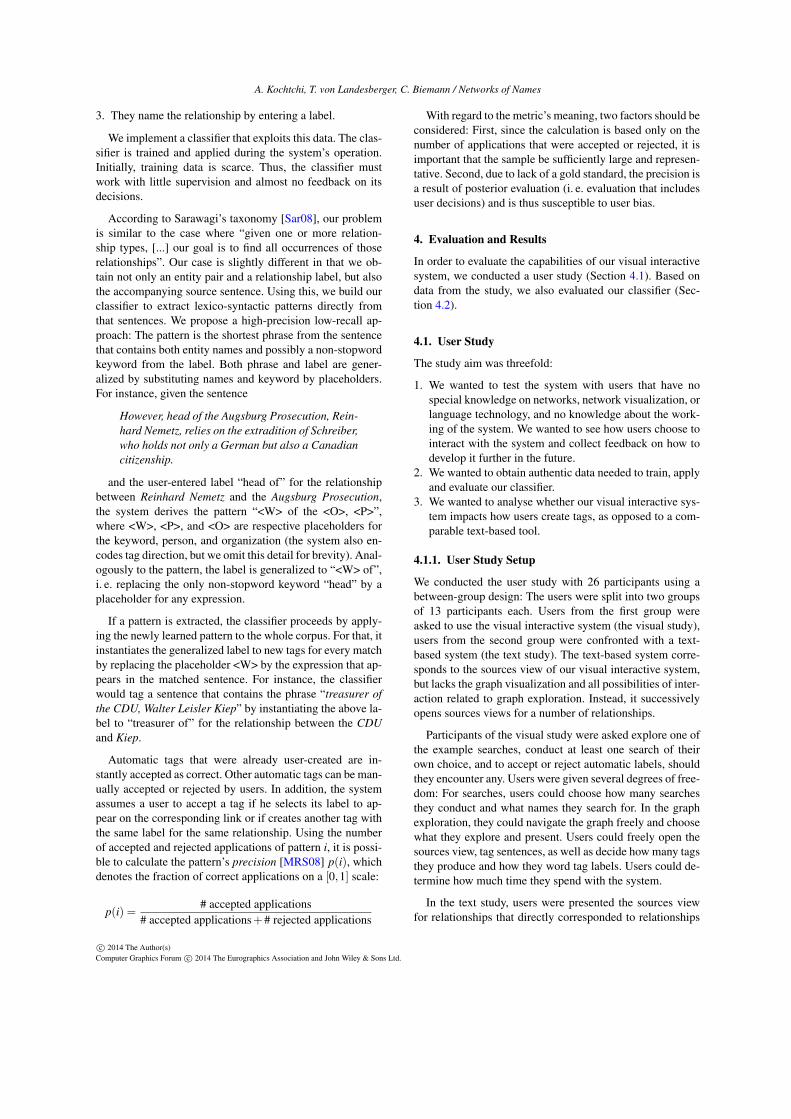
Visualization Text-Only
Average time [min] 55 85Average number of tags 20.77 86.77Average number accepted tags 10.15 59.30Average number rejected tags 4.92 15.23
Table 1: Metrics on user interaction per user for the visualversus the text study.
viewed by a participant of the visual study (with duplicatesremoved). Using the sources view only, participants wereasked to characterize relationships displayed to them as awhole by tagging relevant sentences, and to accept or rejectautomatic labels, should they encounter any. Apart from thelack of visual graph exploration, their degrees of freedomswere similar: Users could decide whether they create newtags or decide that existing tags – created by other users orautomatically by the system – are sufficient. Analogously toparticipants of the visual study, users could choose whichsentences they tag, how many tags they produce, and howthey word tag labels.
Although a study of larger scale was not within the scopeof this work, we attempted to mitigate group difference ef-fects: All participants were between the ages of 23 and 34.Most participants did not have specific knowledge about lan-guage technology, networks, or network visualization. Bothgroups had few participants with basic knowledge of com-puter science and the aforementioned fields. Both groupswere given an introduction on how to operate the system.
4.1.2. User Study Results
We recorded the number of manual and automatic tags aftereach test. As expected, the amount of automatically gener-ated tags greatly outnumbers manual tags (by a factor of 143in both studies). While the number of manual tags growscontinuously between participants, the number of auto-tagsis subject to regular steep jumps. Such jumps occur whenusers tag sentences that happen to be well-suited for patterngeneration and the resulting pattern is sufficiently commonin the corpus to facilitate frequent application.
Table 1 shows per-user metrics for both studies. In the textstudy, users created more than four times as many tags thanparticipants of the visual study. In relation to the averagetime, this also means that the number of tags per minute washigher in the text study. We assume that this difference canconclusively be attributed to the circumstance that in the textstudy, users spent their time exclusively in the part of thesystem where tags can be created and were given the explicitanalytical task of creating tags.
The exact wording of labels was free user’s choice in bothgroups. Table 2 shows the number of labels and the averagenumber of words per label in the visual and text study, re-
Visual Textual
Number of manual labels 171 877Average number of words 1.53 2.67
Table 2: Metrics on tag labels created by users in the visualversus the textual study. Users of a textual system create con-siderably more and longer labels.
spectively. With five times as many unique labels in the textstudy, the difference with respect to the number of labelsis even larger than the difference with respect to the num-ber of tags. Not only the number of different labels, but alsothe number of words per label is higher in the text study.By direct comparison, the two sets of labels share only 30labels. To explore the similarity of the sets, we consider la-bels similar if they are phrases of each other (e. g. “head of”and “is head of”), differ in grammatical gender, number, orcase, are modified by temporal markers (e. g. “former”, “cur-rent”, or “ex-”), or have suffixes that signal membership orpresidency. Using this notion, 73 and 112 labels have similarcounterparts it the other set, respectively. This correspondsto 42.69% of labels from the visual study, but only 12.77%of labels from the text study.
This discrepancy initiated detailed analysis of the labelsin the text study. We found that several labels are consider-ably longer than labels from the visual study. They expressa reasonable relationship, but are very verbose (“is currentmember of the supervisory board just like”). Other labels de-scribe very high-level relationships (“women”) or rephrasequotes from the respective sentences (“authors of text aboutthe complicated ecosystem called forest”).
We assume that the visualization has an impact on this re-sult for two reasons: First, with the context of a larger graphvisualization in mind, concise labels are easier to imagine asedge labels. Second, the examples suggest that users of thetext-based system may have been concerned with less rel-evant details of sentences, resulting in more under-specificand over-specific labels.
These observations suggest that the presence of a visual-ization has a regulating effect on the emerging folksonomy.
4.2. Classifier Evaluation
The user study provided authentic classifier data (i. e. databy users not involved in the design and development of Net-works of Names). However, this data is too sparse to beused for the evaluation of classifier performance. In addi-tion, the data is biased towards certain regions of the graph(e. g. those provided as example searches), and thus is dis-tributed neither evenly, nor randomly. As a consequence, weevaluate the classifier manually and in a more controlled en-vironment.
c© 2014 The Author(s)Computer Graphics Forum c© 2014 The Eurographics Association and John Wiley & Sons Ltd.

A. Kochtchi, T. von Landesberger, C. Biemann / Networks of Names
4.2.1. Classifier Evaluation Setup
We used the dataset obtained from the text study for its largersize. We note that differences in tagging behaviour betweenvisual and text study do not directly affect classifier perfor-mance for two reasons: First, training and application is per-formed triggered by user input, but without user interactionor knowledge about how the process works in detail. Second,tagging of peculiar sentences typically results in patterns thatcan be applied only to the sentence they are extracted from.Excluding all patterns that were applied less than five times,133 patterns were left for evaluation.
In addition to accepting or rejecting tags, we annotatedtags to be “close” if they resulted from proper application,but were oddly worded or contained grammatical mistakes.Randomly sampling 1000 tags created by the 133 patterns,we assigned them manually into the categories “accepted”,“rejected”, “close”, or “undecided”. From the annotations,we derived a precision for the classifier. The value is a pos-terior precision, since it is based on user decisions (instead ofa reference ontology). We attempted to validate the data ob-jectively, but note that as discussed previously in Section 3.4,posterior values can be subject to user bias.
4.2.2. Classifier Performance
The classifier’s accuracy is 53% for accepted tags only, and61% including “close” matches. This precision is reasonablecompared to other approaches that use lexico-syntactic pat-terns [SJN05], especially given our straightforward methodof pattern extraction.
Several high-precision patterns emerge from the valida-tion. Such patterns cover many lexico-syntactic patterns usu-ally stated and used in literature [Hea92, SJN05, BCS∗07,OT10]. For instance, the most frequent patterns are patternssuch as “<W> of <O>, <P>” or “<O>-<W> <P>” that de-scribe positions of people in organizations (with <W> sub-stituted by terms like “chairman” or “expert”).
Problems with patterns of moderate or low precision stemfrom our approach of pattern generation and application,which does not take into account part of speech, sentencestructure, and grammatical dependencies. Furthermore, theprecision of the classifier is given as an average of individ-ual pattern precisions. Since our classifier is trained, applied,and evaluated during operation of the system, individual pat-terns could be identified and their application revoked oncethe system has enough evidence to conclude that their preci-sion is low, leading to eventual self-improvement.
The advantage of our approach is that pattern are extractedwithout explicit construction or evaluation of the pattern bythe user. Especially, no knowledge about morpho-syntacticdetails or reasoning about the potential feasibility and qual-ity of patterns is required. Since our approach does not relyon any language-specific methods, it is directly applicable toother languages.
5. Conclusion and Future Work
We designed and developed Networks of Names, a systemthat is capable of extracting relationship information fromlarge text corpora and making it available for visual explo-ration and interactive tagging. The system incorporates andenhances current research from visual analytics and inte-grates methods from language technology and other fieldsof computer science.
Within the scope of this work, we focused on the extrac-tion of people and organizations as entities. Working withthe system reveals that performing disambiguation and nor-malizing names would look more natural and contribute tothe quality of the dataset as well as the usability of the sys-tem. Another useful type of entity in the context of relation-ships between people and organizations are events. Espe-cially for abstract events (such as a financial crisis), the addi-tion would require significant work in both research and im-plementation. Furthermore, visualizing the time dimensioncould enable users to not only explore relationships betweenentities, but also their change over time.
We presented a new edge-based DOI function, utiliz-ing normalized pointwise mutual information to expressthe interestingness of edges. We found it to work substan-tially better for our scenario than the seminal version ofDOI [vHP09]. Additionally, we extended the original ex-pansion algorithm to work with not only one, but two fo-cal vertices (using maximum-capacity paths for calculatinginteresting connections between vertices).
We conducted a user study to test the system, generatedata for the classifier, and explore the impact of a visualiza-tion on the tagging behaviour of users. We found that usersof the visual interactive system tagged more concisely andrefrained from tagging extremely abstract or over-specificrelationships. This allows the assumption that the presenceof a visualization may have a regulating effect on the emerg-ing folksonomy.
Evaluating the performance of our classifier, we foundthat our semi-automatic approach has reasonably high preci-sion. Without being predefined or manually crafted, our clas-sifier produced high-precision patterns that are known fromresearch literature. The classifier could be improved in thefuture by implementing more sophisticated methods for re-lationship extraction. For this, part of speech, syntactic parsetrees, or dependency trees could be considered [Sar08].
Acknowledgements and Companion Website
This work has been partially supported by DFG within aproject in SPP Visual Analytics (SPP 1335), and by LOEWEas part of the research center Digital Humanities.
A companion website with source code and demoinstallation is located at http://maggie.lt.informatik.tu-darmstadt.de/thesis/master/NetworksOfNames/.
c© 2014 The Author(s)Computer Graphics Forum c© 2014 The Eurographics Association and John Wiley & Sons Ltd.

A. Kochtchi, T. von Landesberger, C. Biemann / Networks of Names
References
[AHSS13] ABELLO J., HADLAK S., SCHUMANN H., SCHULZH.-J.: A Modular Degree-of-Interest Specification for the VisualAnalysis of Large Dynamic Networks. IEEE Transactions onVisualization and Computer Graphics (2013). 2
[BCS∗07] BANKO M., CAFARELLA M. J., SODERLAND S.,BROADHEAD M., ETZIONI O.: Open Information Extractionfrom the Web. In IJCAI (Hyderabad, 2007), pp. 2670–2676. 2, 9
[Bie05] BIEMANN C.: Ontology Learning from Text: A Surveyof Methods. LDV Forum 20, 2 (2005), 75–93. 2
[Bou09] BOUMA G.: Normalized (Pointwise) Mutual Informa-tion in Collocation Extraction. In GSCL (Potsdam, 2009), pp. 31–40. 5
[Bun11] BUNDESVERBAND DEUTSCHER ZEITUNGSVERLEGERE.V.: Die deutschen Zeitungen in Zahlen und Daten, 2011. 1
[CKHF11] CHAU D. H., KITTUR A., HONG J. I., FALOUTSOSC.: Apolo: Making Sense of Large Network Data by CombiningRich User Interaction and Machine Learning. In CHI (Vancou-ver, 2011), pp. 167–176. 2
[CSN09] CLAUSET A., SHALIZI C. R., NEWMAN M. E.:Power-law Distributions in Empirical Data. SIAM Review 51,4 (2009), 661–703. 4
[FGM05] FINKEL J. R., GRENAGER T., MANNING C.: Incor-porating Non-local Information into Information Extraction Sys-tems by Gibbs Sampling. In ACL (Ann Arbor, 2005), pp. 363–370. 3
[FP10] FARUQUI M., PADÓ S.: Training and Evaluating a Ger-man Named Entity Recognizer with Semantic Generalization. InKONVENS (Saarbrücken, 2010). 3
[Fur86] FURNAS G. W.: Generalized Fisheye Views. In CHI(Boston, 1986), pp. 16–23. 2
[GFC04] GHONIEM M., FEKETE J.-D., CASTAGLIOLA P.: AComparison of the Readability of Graphs Using Node-Link andMatrix-Based Representations. In InfoVis (Austin, 2004), pp. 17–24. 4
[GM02] GIRJU R., MOLDOVAN D. I.: Text Mining for CausalRelations. In FLAIRS (Pensacola, 2002), pp. 360–364. 3
[GM04] GROBELNIK M., MLADENIC D.: Visualization of NewsArticles. Informatica 28, 4 (2004). 2
[Hea92] HEARST M. A.: Automatic Acquisition of Hyponymsfrom Large Text Corpora. In COLING (Nantes, 1992), pp. 539–545. 3, 9
[HMLH10] HANGAL S., MACLEAN D., LAM M. S., HEER J.:All Friends are Not Equal: Using Weights in Social Graphs toImprove Search. In SNAKDD (Washington, D.C., 2010). 6
[KMSZ06] KEIM D. A., MANSMANN F., SCHNEIDEWIND J.,ZIEGLER H.: Challenges in Visual Data Analysis. In IV (Lon-don, 2006), pp. 9–16. 1, 2
[KS05] KAVALEC M., SVATÉK V.: A Study on Automated Rela-tion Labelling in Ontology Learning. In Ontology Learning fromText: Methods, Evaluation and Applications, Buitelaar P., Cimi-ano P., Magnini B., (Eds.), Frontiers in Artificial Intelligence andApplications. IOS Press, Amsterdam, 2005, pp. 44–58. 1, 2
[MC02] MALPANI N., CHEN J.: A Note on Practical Construc-tion of Maximum Bandwidth Paths. Information Processing Let-ters 83, 3 (2002), 175–180. 6
[MRS08] MANNING C. D., RAGHAVAN P., SCHÜTZE H.: Intro-duction to Information Retrieval. Cambridge University Press,Cambridge, 2008. 6, 7
[NNSS13] NASTASE V., NAKOV P., SÉAGHDHA D. Ó., SZ-PAKOWICZ S.: Semantic relations between nominals. SynthesisLectures on Human Language Technologies 6, 1 (2013), 1–119.2
[OT10] OHSHIMA H., TANAKA K.: High-speed Detection ofOntological Knowledge and Bi-directional Lexico-Syntactic Pat-terns from the Web. JSW 5, 2 (2010), 195–205. 9
[PGU∗11] PERER A., GUY I., UZIEL E., RONEN I., JACOVI M.:Visual Social Network Analytics for Relationship Discovery inthe Enterprise. In VAST (Providence, 2011), pp. 71–79. 2
[Pun91] PUNNEN A. P.: A Linear Time Algorithm for the Maxi-mum Capacity Path Problem. European Journal of OperationalResearch 53, 3 (1991), 402–404. 6
[QRB06] QUASTHOFF U., RICHTER M., BIEMANN C.: CorpusPortal for Search in Monolingual Corpora. In LREC (Genoa,2006), pp. 1799–1802. 3
[Sar08] SARAWAGI S.: Information Extraction. Foundations andTrends in Databases 1, 3 (2008), 261–377. 2, 3, 7, 9
[SJN05] SNOW R., JURAFSKY D., NG A. Y.: Learning SyntacticPatterns for Automatic Hypernym Discovery. In Advances inNeural Information Processing Systems 17, Saul L. K., Weiss Y.,Bottou L., (Eds.). MIT Press, Cambridge, 2005, pp. 1297–1304.3, 9
[SM08] SÁNCHEZ D., MORENO A.: Learning Non-taxonomicRelationships from Web Documents for Domain Ontology Con-struction. Data & Knowledge Engineering 64, 3 (2008), 600–623. 2
[Smi00] SMITH R.: Mark Lombardi, 48, an Artist Who WasInspired by Scandals. The New York Times, 2000. http://www.nytimes.com/2000/03/25/arts/mark-lombardi-48-an-artist-who-was-inspired-by-scandals.html, accessed on September 23rd 2013. 1
[vD00] VAN DONGEN S. M.: Graph Clustering by Flow Simula-tion. PhD thesis, University of Utrecht, 2000. 6
[vHP09] VAN HAM F., PERER A.: “Search, Show Context, Ex-pand on Demand”: Supporting Large Graph Exploration withDegree-of-Interest. IEEE Transactions on Visualization andComputer Graphics 15, 6 (2009), 953–960. 2, 5, 9
[vHWV09] VAN HAM F., WATTENBERG M., VIÉGAS F. B.:Mapping Text with Phrase Nets. IEEE Transactions on Visual-ization and Computer Graphics 15, 6 (2009), 1169–1176. 2
c© 2014 The Author(s)Computer Graphics Forum c© 2014 The Eurographics Association and John Wiley & Sons Ltd.


![Automatic 3D reconstruction: An exploration of the state ...paulbourke.net/papers/GSTF_10/paper.pdf · archaeology [3] and heritage. Semi-automated 3D surveys are often performed](https://img.pdfslide.us/doc/110x75/6041a16ad5624f614839f6b3/automatic-3d-reconstruction-an-exploration-of-the-state-archaeology-3-and.jpg)