Embed Size (px)
Citation preview
Networks in Finance and Marketing I
Prof. Dr. Daning Hu Department of Informatics University of Zurich Nov 26th, 2012
2
Outline n Introduction: Networks in Finance n Stock Correlation Networks
n Stock Ownership Networks
n Board Director Networks
n Bank Networks
n Ref Book: The Network Challenge: Strategy, Profit, and Risk in an Interlinked World, Paul R. Kleindorfer, Yoram J Wind, Robert E. Gunther
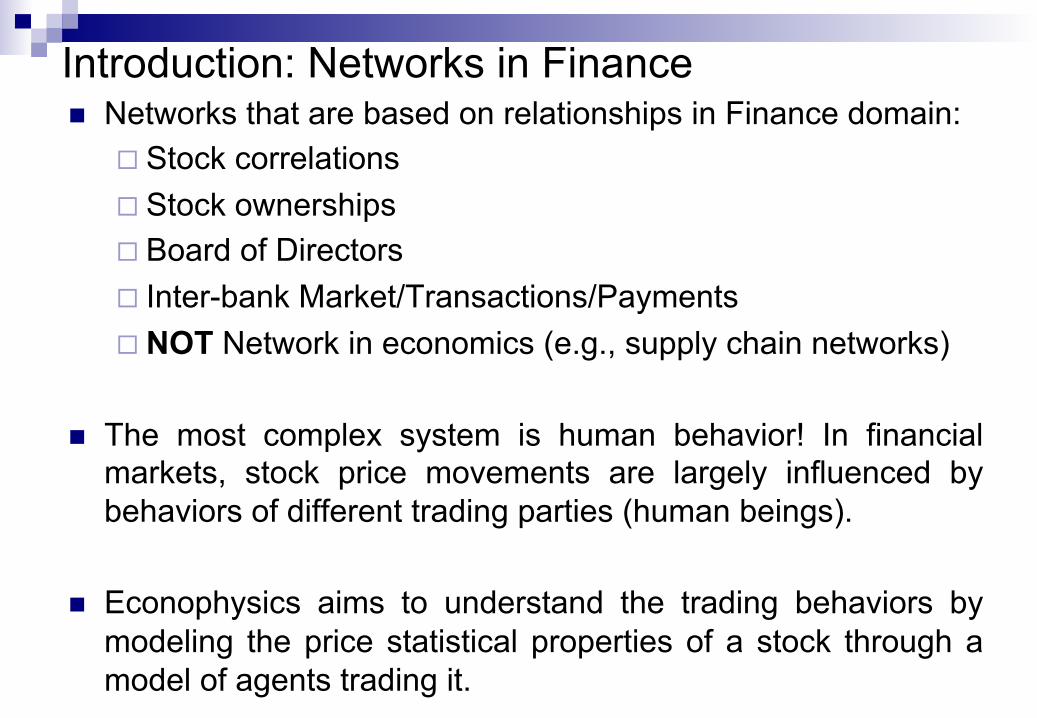
Introduction: Networks in Finance n Networks that are based on relationships in Finance domain:
¨ Stock correlations ¨ Stock ownerships ¨ Board of Directors ¨ Inter-bank Market/Transactions/Payments ¨ NOT Network in economics (e.g., supply chain networks)
n The most complex system is human behavior! In financial markets, stock price movements are largely influenced by behaviors of different trading parties (human beings).
n Econophysics aims to understand the trading behaviors by modeling the price statistical properties of a stock through a model of agents trading it.
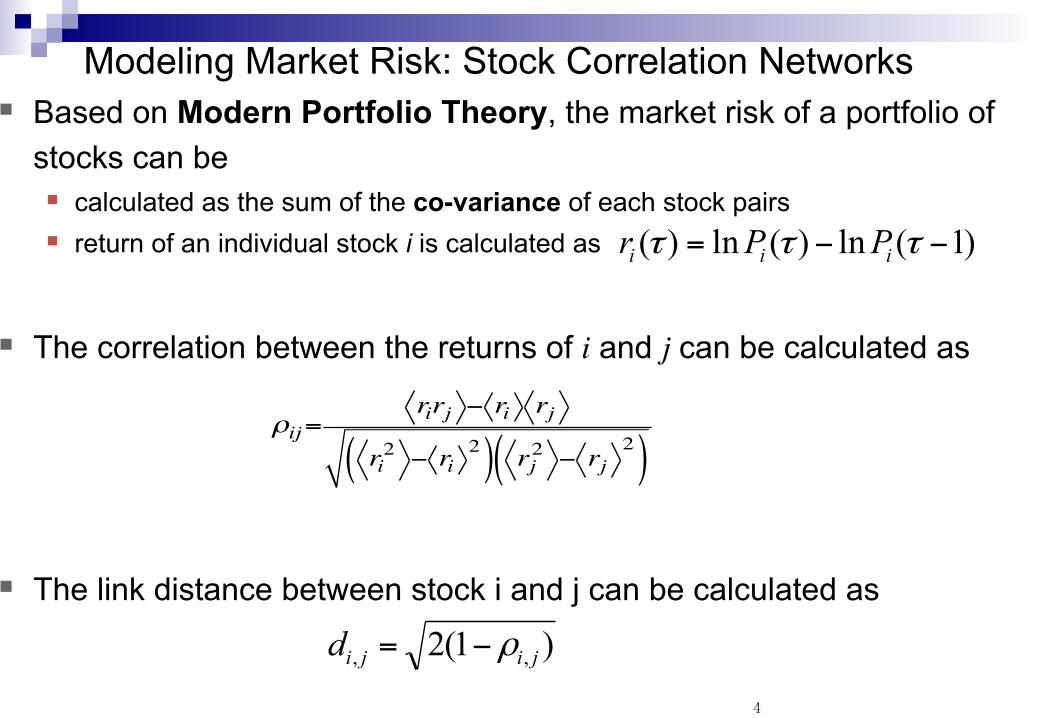
Modeling Market Risk: Stock Correlation Networks § Based on Modern Portfolio Theory, the market risk of a portfolio of
stocks can be § calculated as the sum of the co-variance of each stock pairs § return of an individual stock i is calculated as
§ The correlation between the returns of i and j can be calculated as
§ The link distance between stock i and j can be calculated as
4
ρij=rirj − ri rj
ri2 − ri
2( ) rj2 − rj
2( )
)1(ln)(ln)( −−= τττ iii PPr
)1(2 ,, jijid ρ−=
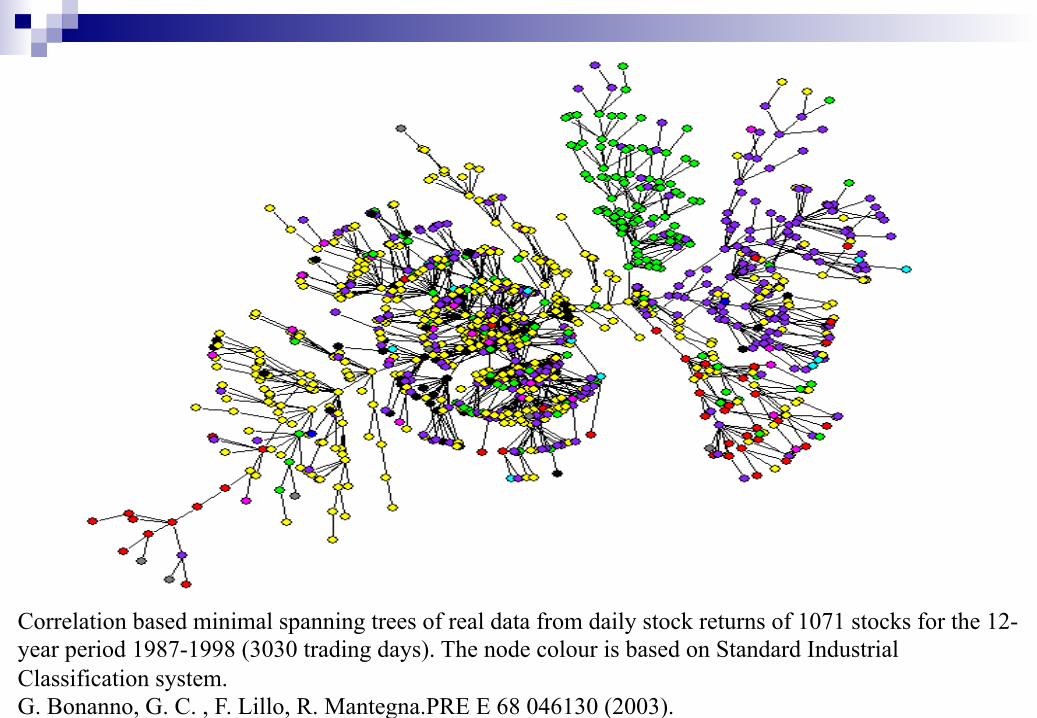
Correlation based minimal spanning trees of real data from daily stock returns of 1071 stocks for the 12-year period 1987-1998 (3030 trading days). The node colour is based on Standard Industrial Classification system. G. Bonanno, G. C. , F. Lillo, R. Mantegna.PRE E 68 046130 (2003).
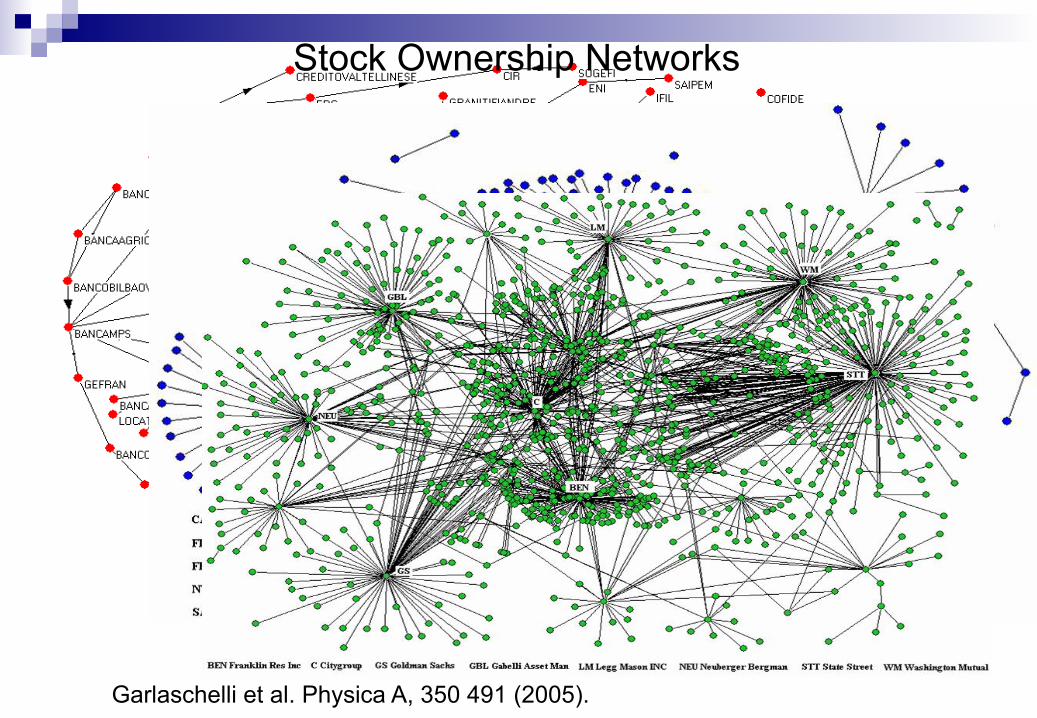
Garlaschelli et al. Physica A, 350 491 (2005).
Stock Ownership Networks
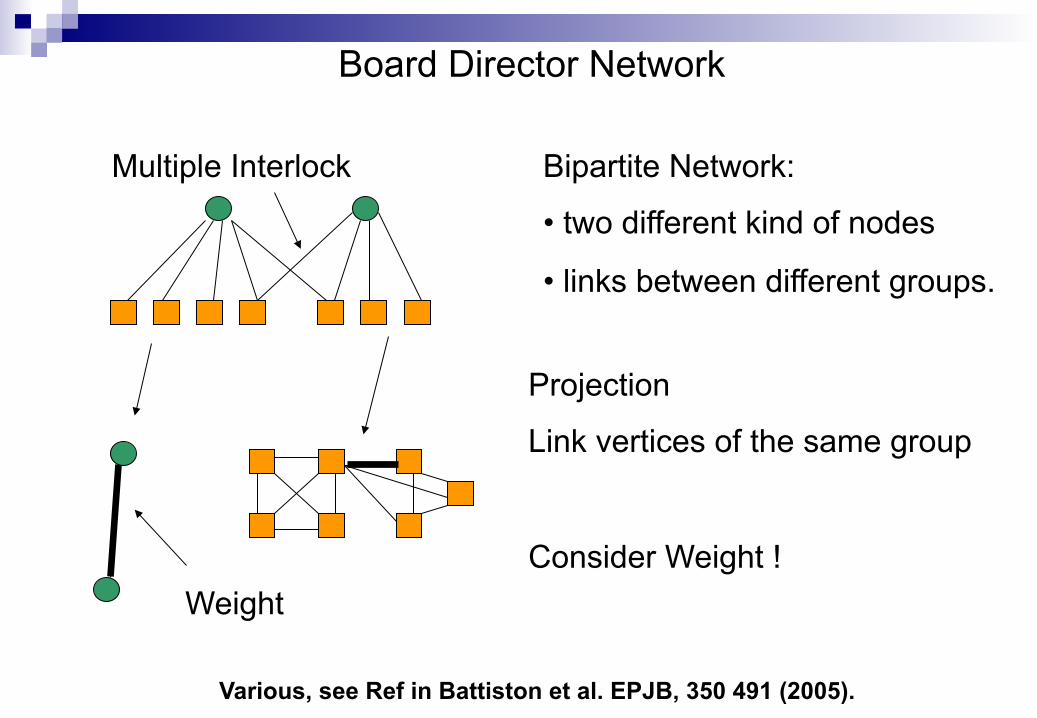
Bipartite Network:
• two different kind of nodes
• links between different groups.
Projection
Link vertices of the same group
Consider Weight !
Multiple Interlock
Weight
Various, see Ref in Battiston et al. EPJB, 350 491 (2005).
Board Director Network
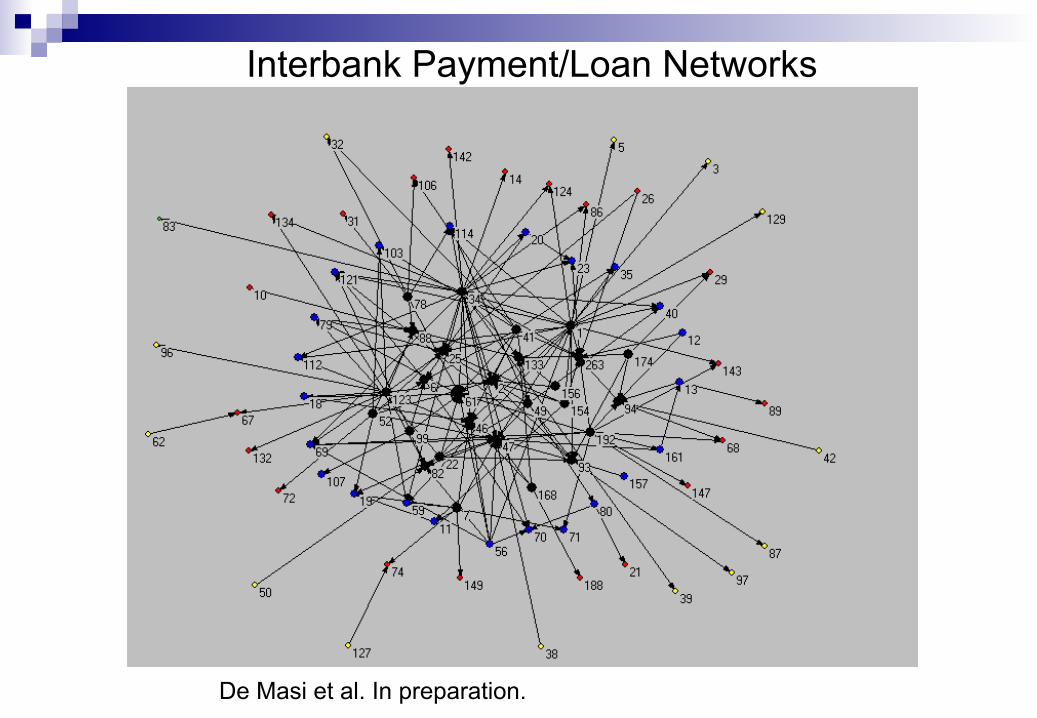
De Masi et al. In preparation.
Interbank Payment/Loan Networks
Financial Network Analysis n Financial Networks Analysis can help
¨ In distinguishing behaviors of different markets
¨ In visualizing important features as the chain of control
¨ In testing the validity of market models
n Many of these financial networks are scale-free networks. Thus different network models can be tested against such empirical financial networks.
Case I: The Small-World of Investing n Social Networks on Information Transfer in Stock Market
¨ connections between mutual fund managers and corporate board members via shared education networks.
¨ academic institutions attended for both undergraduate and graduate degrees as our network measure
n The major findings are
¨ portfolio managers place larger bets on firms they are connected to through their network
¨ perform significantly better on these holdings relative to their non-connected holdings. (7.8% per year)
¨ positive returns concentrated on news announcements
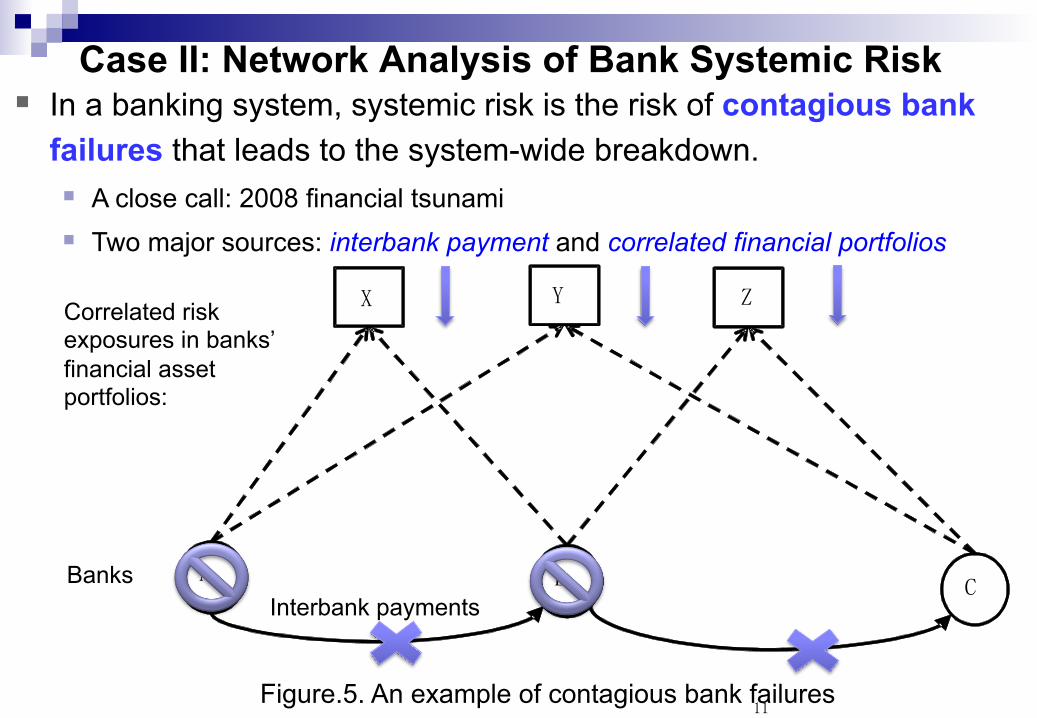
Correlated risk exposures in banks’ financial asset portfolios:
Interbank payments A B C
X Z Y
Banks
Case II: Network Analysis of Bank Systemic Risk
11
§ In a banking system, systemic risk is the risk of contagious bank failures that leads to the system-wide breakdown. § A close call: 2008 financial tsunami § Two major sources: interbank payment and correlated financial portfolios
Figure.5. An example of contagious bank failures
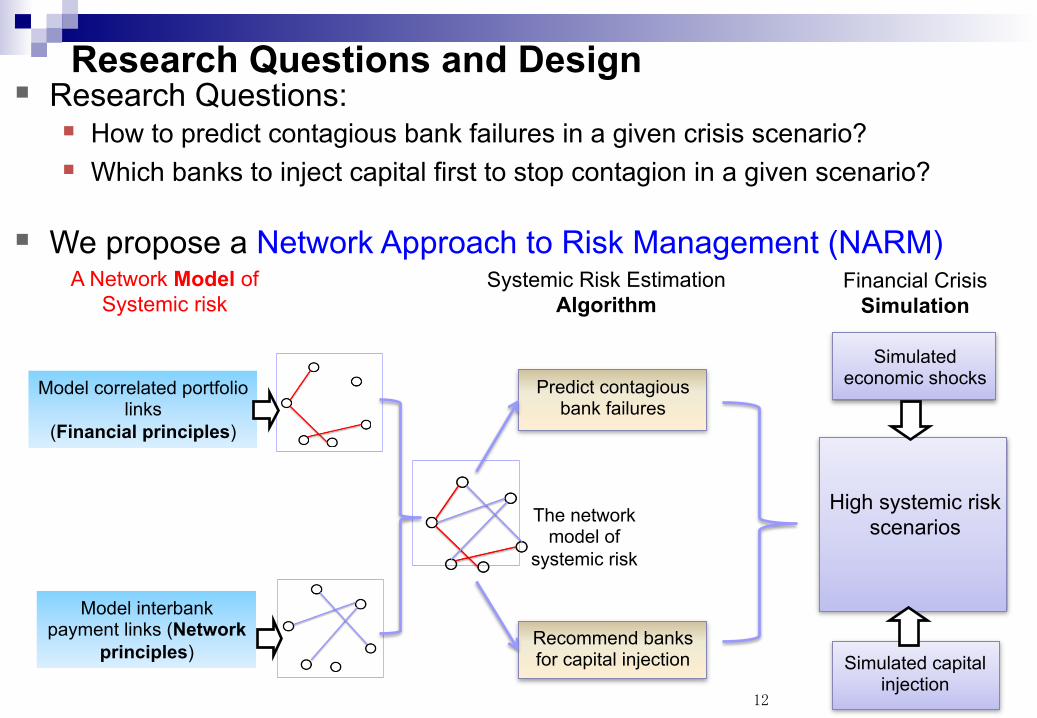
Research Questions and Design § Research Questions:
§ How to predict contagious bank failures in a given crisis scenario? § Which banks to inject capital first to stop contagion in a given scenario?
§ We propose a Network Approach to Risk Management (NARM)
12
A Network Model of Systemic risk
Systemic Risk Estimation Algorithm
Model correlated portfolio links
(Financial principles)
Model interbank payment links (Network
principles)
Financial Crisis Simulation
Simulated economic shocks
Simulated capital injection
High systemic risk scenarios
Predict contagious bank failures
Recommend banks for capital injection
The network model of
systemic risk
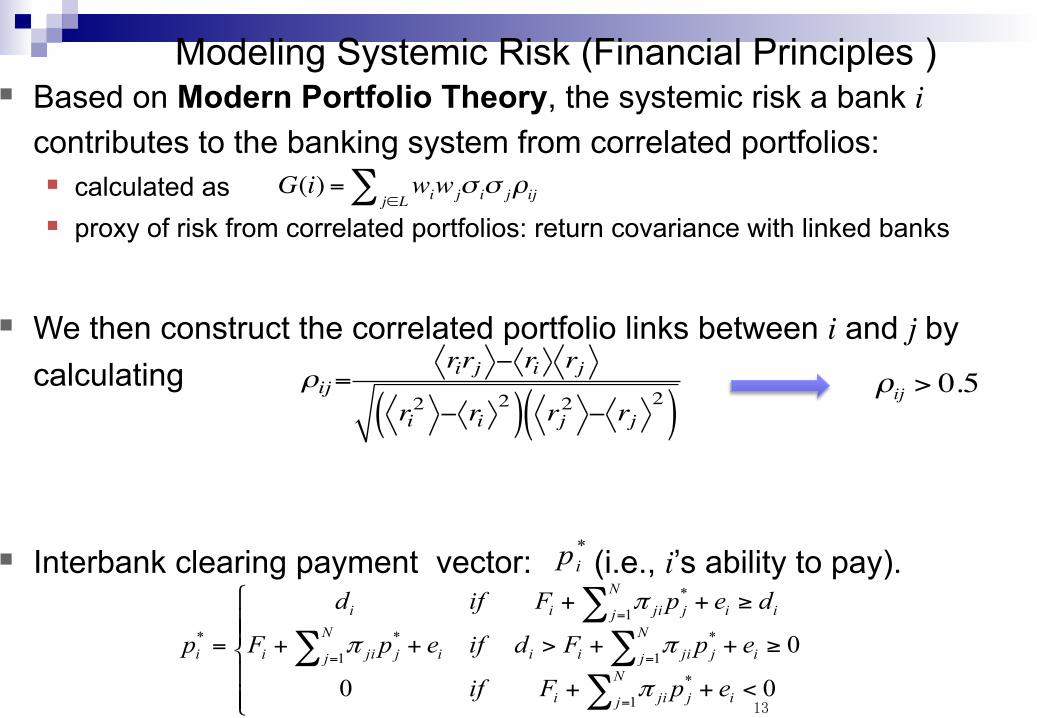
Modeling Systemic Risk (Financial Principles ) § Based on Modern Portfolio Theory, the systemic risk a bank i
contributes to the banking system from correlated portfolios: § calculated as § proxy of risk from correlated portfolios: return covariance with linked banks
§ We then construct the correlated portfolio links between i and j by calculating
§ Interbank clearing payment vector: (i.e., i’s ability to pay).
13
*ip
⎪⎪⎩
⎪⎪⎨
⎧
<++
≥++>++
≥++
=
∑∑∑
∑
=
==
=
N
j ijjii
N
j ijjiiiN
j ijjii
N
j iijjiii
i
epFif
epFdifepF
depFifd
p
1*
1*
1*
1*
*
00
0
π
ππ
π
G(i) = wiwjσ iσ jρijj∈L∑
ρij=rirj − ri rj
ri2 − ri
2( ) rj2 − rj
2( )ρij > 0.5
14
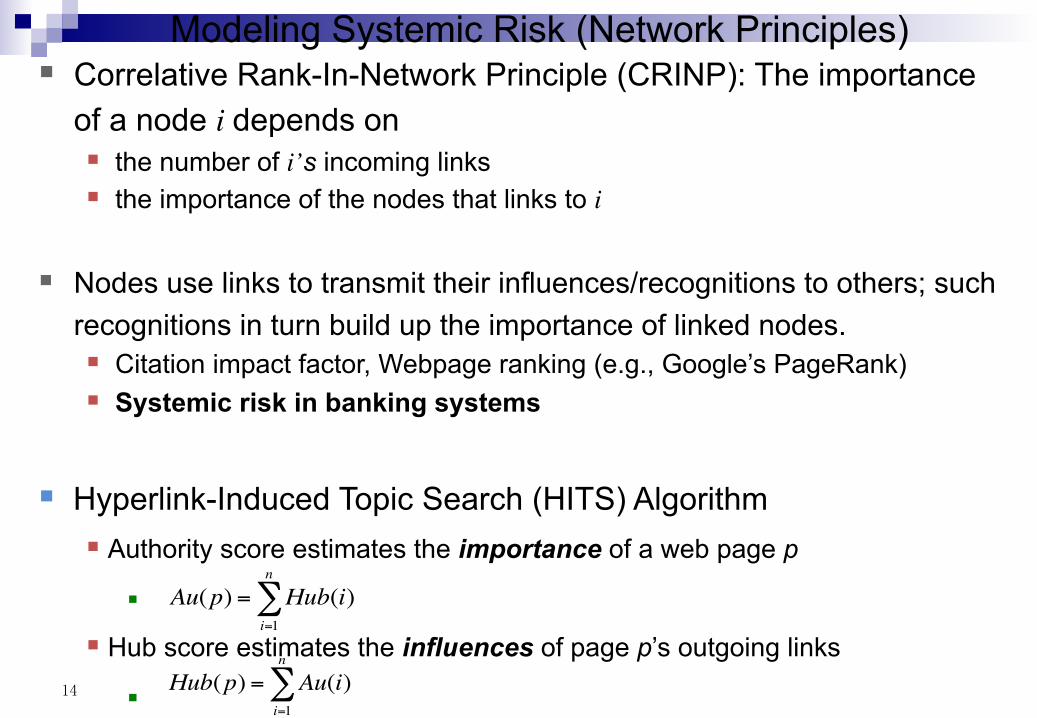
§ Correlative Rank-In-Network Principle (CRINP): The importance of a node i depends on § the number of i’s incoming links § the importance of the nodes that links to i
§ Nodes use links to transmit their influences/recognitions to others; such recognitions in turn build up the importance of linked nodes. § Citation impact factor, Webpage ranking (e.g., Google’s PageRank) § Systemic risk in banking systems
§ Hyperlink-Induced Topic Search (HITS) Algorithm § Authority score estimates the importance of a web page p
§
§ Hub score estimates the influences of page p’s outgoing links
§
Au(p) = Hub(i)i=1
n
∑
Hub(p) = Au(i)i=1
n
∑
Modeling Systemic Risk (Network Principles)
BI Algorithm Development
15
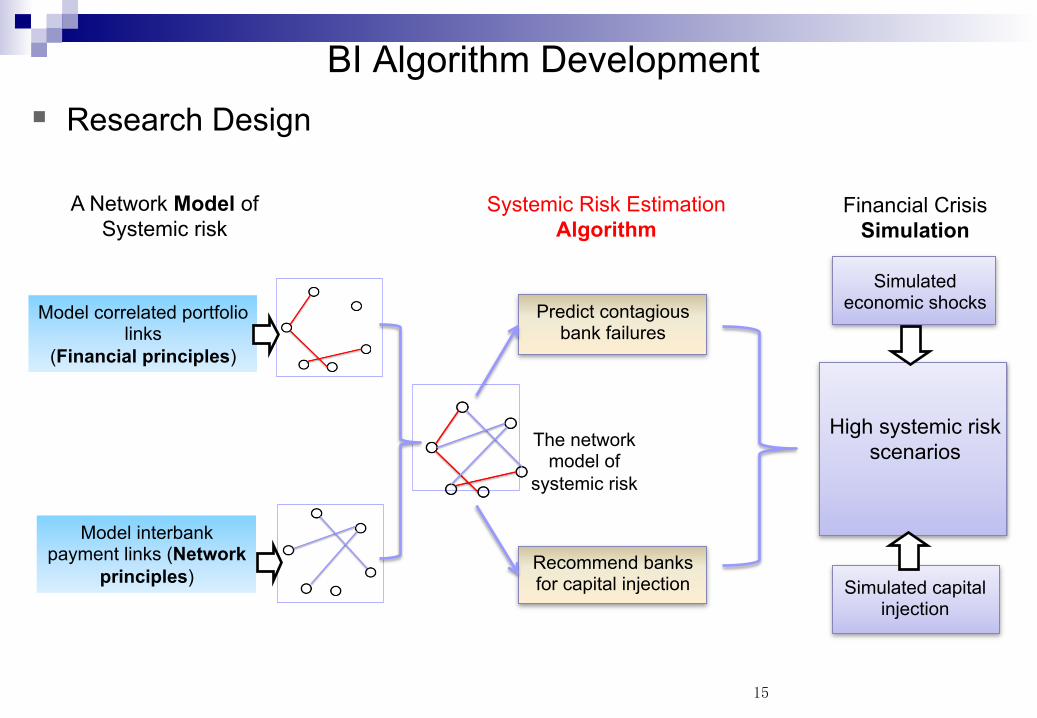
§ Research Design
15
A Network Model of Systemic risk
Systemic Risk Estimation Algorithm
Model correlated portfolio links
(Financial principles)
Model interbank payment links (Network
principles)
Financial Crisis Simulation
Simulated economic shocks
Simulated capital injection
High systemic risk scenarios
Predict contagious bank failures
Recommend banks for capital injection
The network model of
systemic risk
Link-Aware Systemic Estimation of Risks (LASER) Algorithm
16
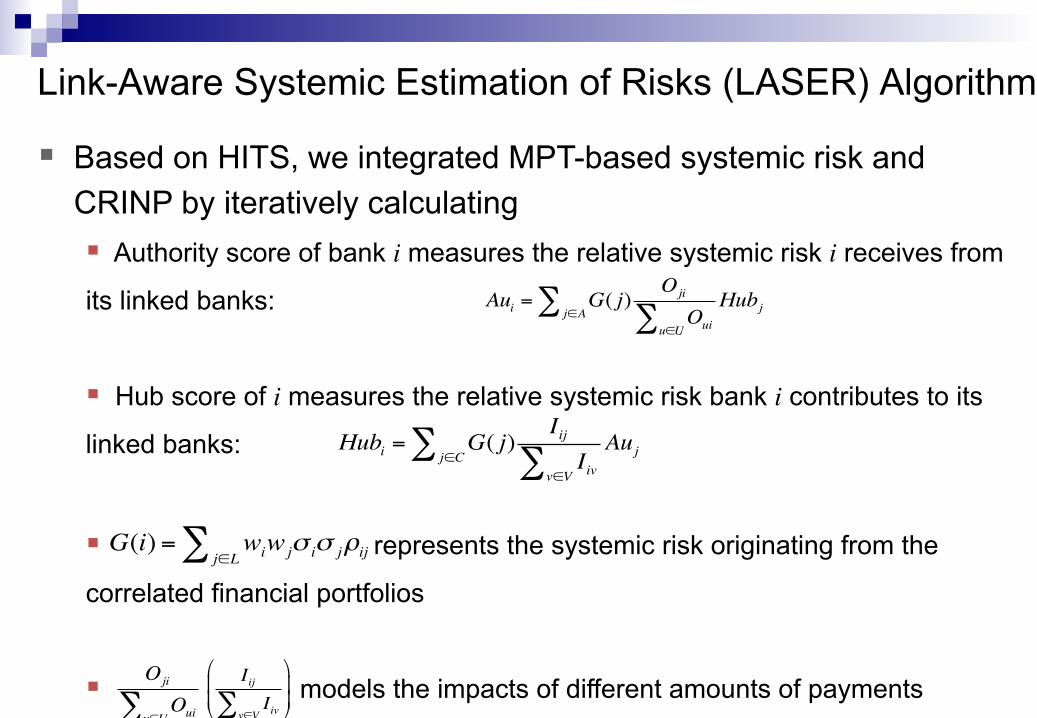
§ Based on HITS, we integrated MPT-based systemic risk and CRINP by iteratively calculating § Authority score of bank i measures the relative systemic risk i receives from
its linked banks:
§ Hub score of i measures the relative systemic risk bank i contributes to its
linked banks:
§ represents the systemic risk originating from the
correlated financial portfolios
§ models the impacts of different amounts of payments
Aui = G( j)Oji
Ouiu∈U∑Hubjj∈A∑
Hubi = G( j)IijIivv∈V∑Aujj∈C∑
G(i) = wiwjσ iσ jρijj∈L∑
Oji
Ouiu∈U∑IijIivv∈V∑
#
$
%%
&
'
((
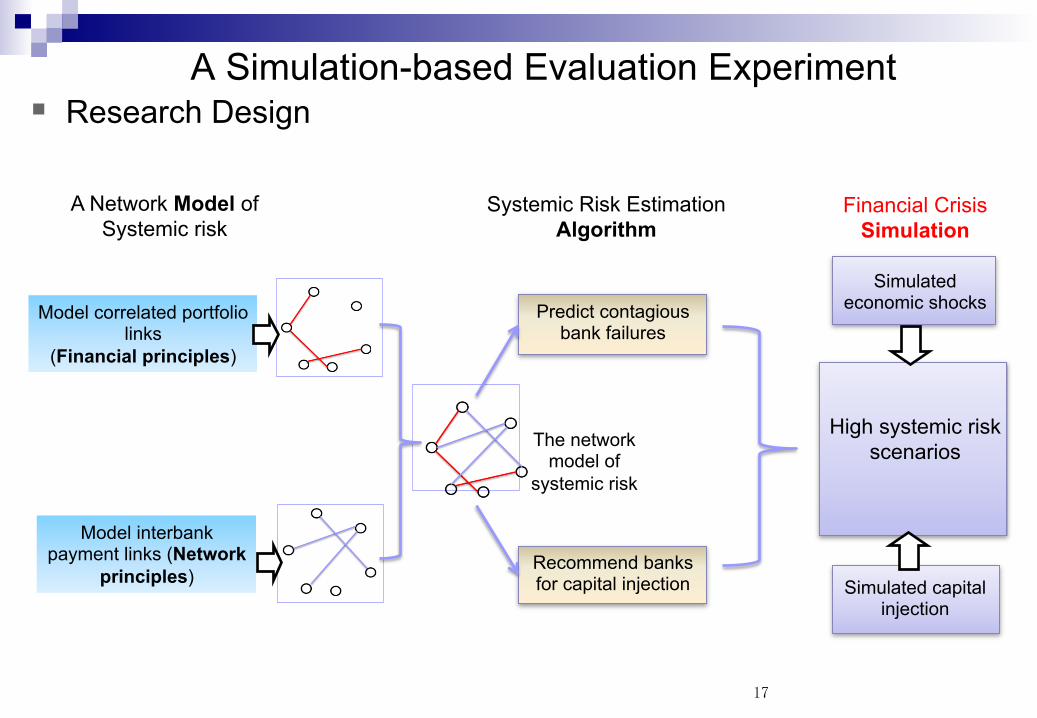
A Simulation-based Evaluation Experiment
17
§ Research Design
17
A Network Model of Systemic risk
Systemic Risk Estimation Algorithm
Model correlated portfolio links
(Financial principles)
Model interbank payment links (Network
principles)
Financial Crisis Simulation
Simulated economic shocks
Simulated capital injection
High systemic risk scenarios
Predict contagious bank failures
Recommend banks for capital injection
The network model of
systemic risk
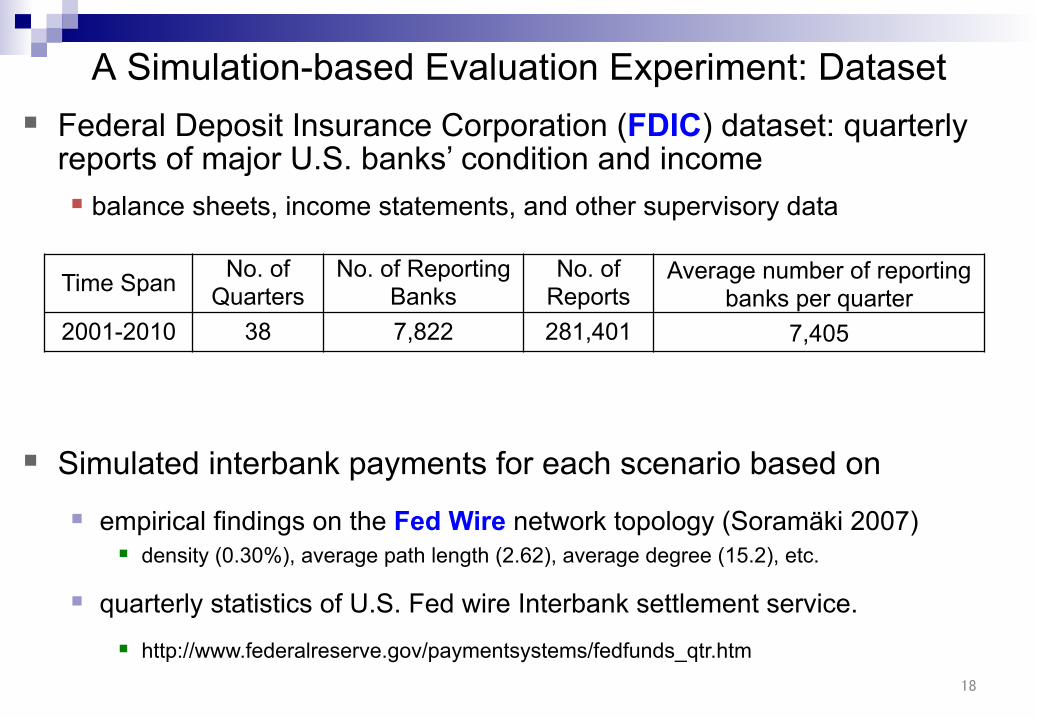
A Simulation-based Evaluation Experiment: Dataset § Federal Deposit Insurance Corporation (FDIC) dataset: quarterly
reports of major U.S. banks’ condition and income § balance sheets, income statements, and other supervisory data
§ Simulated interbank payments for each scenario based on
§ empirical findings on the Fed Wire network topology (Soramäki 2007) § density (0.30%), average path length (2.62), average degree (15.2), etc.
§ quarterly statistics of U.S. Fed wire Interbank settlement service.
§ http://www.federalreserve.gov/paymentsystems/fedfunds_qtr.htm 18
Time Span No. of Quarters
No. of Reporting Banks
No. of Reports
Average number of reporting banks per quarter
2001-2010 38 7,822 281,401 7,405
19
0%10%20%30%40%50%60%70%80%90%
100%
0 0.5 1 1.5 2 2.5 3 3.5 4 4.5 5
Ave
rage
Ban
k Fa
ilure
Rat
e γ
Shock Rate β
Average Bank Failure Rates of Generated Scenarios at Different Shock Rates
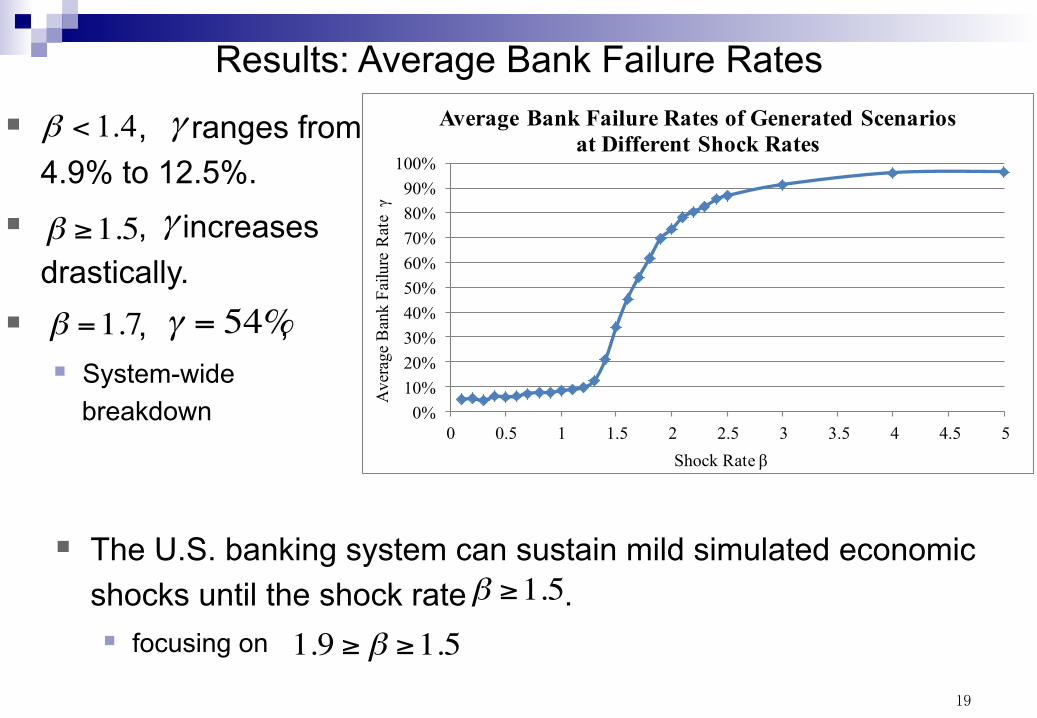
Results: Average Bank Failure Rates
§ , ranges from 4.9% to 12.5%.
§ , increases drastically.
§ , , § System-wide
breakdown
4.1<β γ
β ≥1.5 γ
β =1.7 γ = 54%
§ The U.S. banking system can sustain mild simulated economic shocks until the shock rate . § focusing on
β ≥1.5
1.9 ≥ β ≥1.5
20
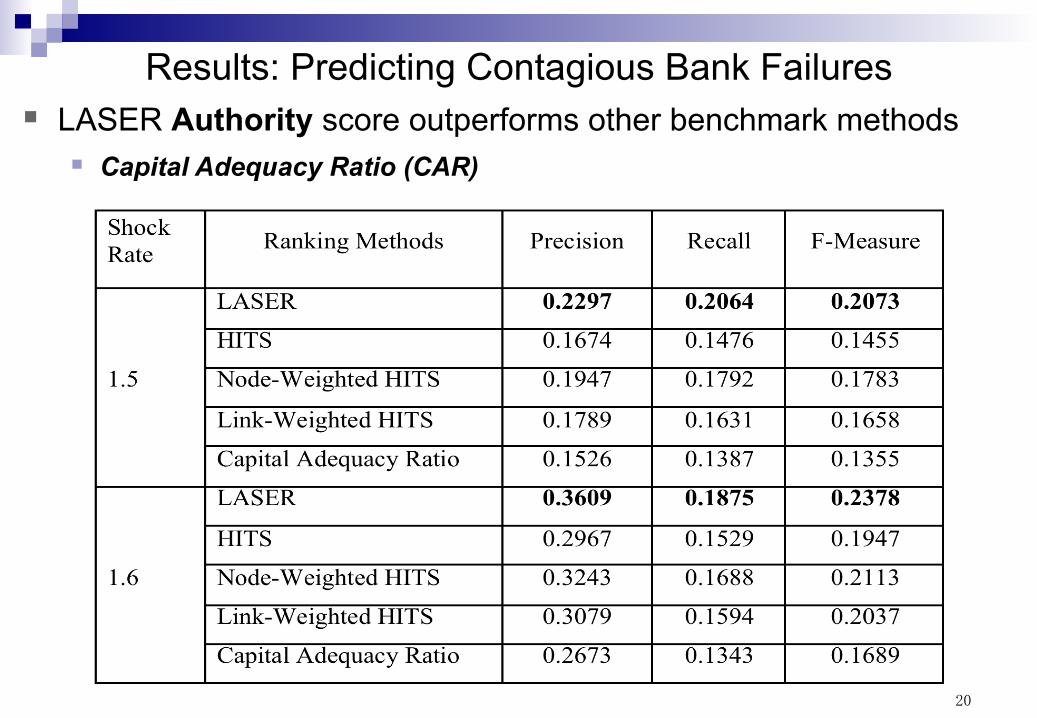
Results: Predicting Contagious Bank Failures § LASER Authority score outperforms other benchmark methods
§ Capital Adequacy Ratio (CAR)
21
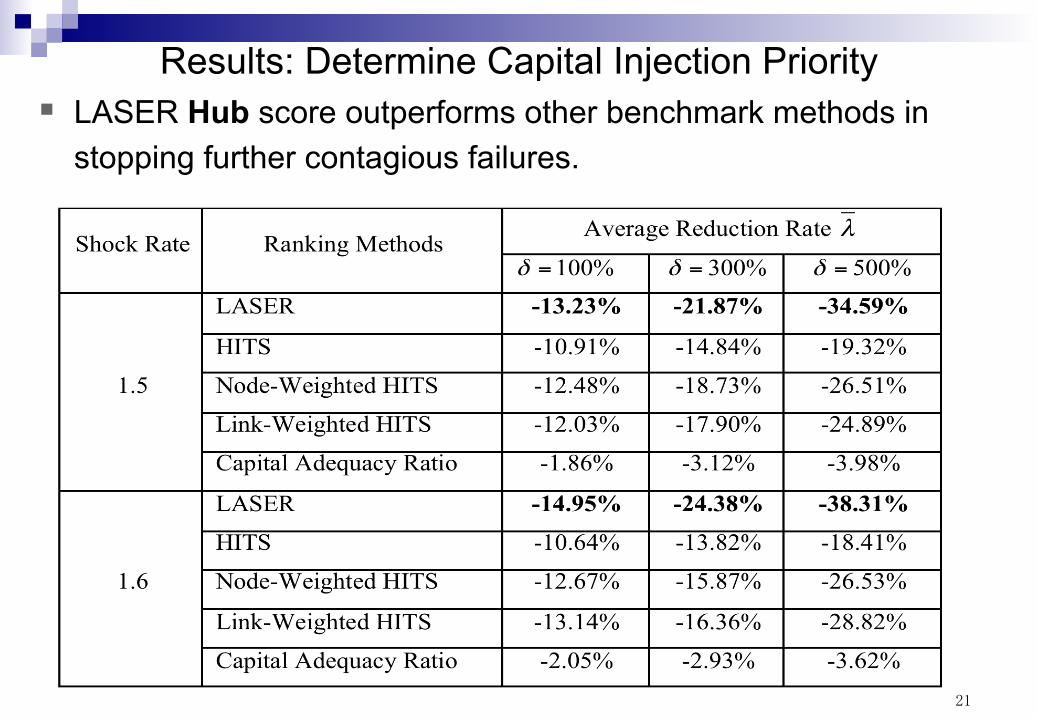
Results: Determine Capital Injection Priority § LASER Hub score outperforms other benchmark methods in
stopping further contagious failures.
22
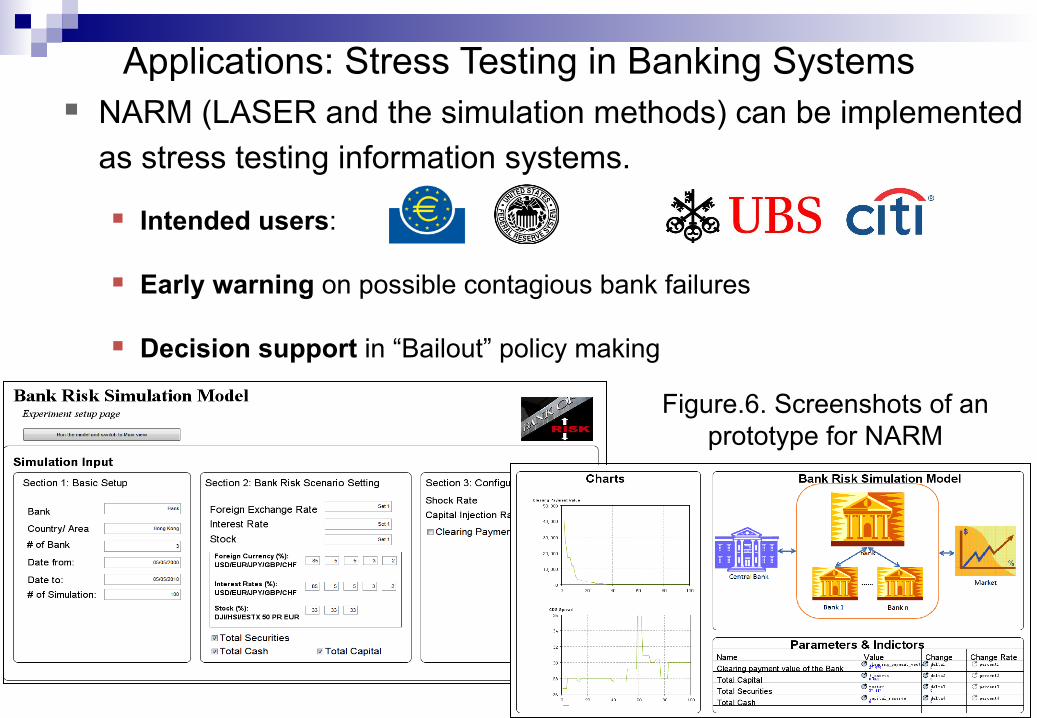
Applications: Stress Testing in Banking Systems § NARM (LASER and the simulation methods) can be implemented
as stress testing information systems.
§ Intended users:
§ Early warning on possible contagious bank failures
§ Decision support in “Bailout” policy making
Figure.6. Screenshots of an prototype for NARM


![iNTHECHANCERYCOURTFORDAVIDSONCOUNTY,TENNESSEE, …inthechancerycourtfordavidsoncounty,tennessee, atnashville i l terryr.clayton, 1 i i ‘ petitioner, ‘ ] i.. '] w_ _ fl vs. ] no.09—1801~11]](https://img.pdfslide.us/doc/110x75/60bc75f8c00a2768f44f0d43/inthechancerycourtfordavidsoncountytennessee-inthechancerycourtfordavidsoncountytennessee.jpg)