Embed Size (px)
Citation preview
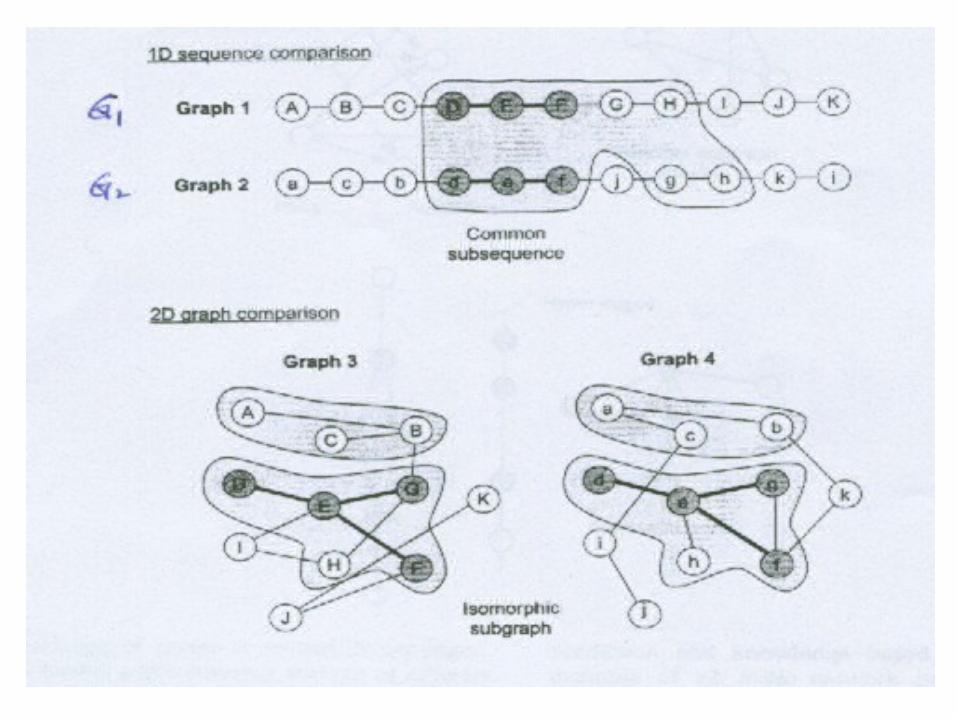
Networks and Algorithms in Bio-informatics
D. Frank HsuFordham University
*Joint work with Stuart Brown; NYU Medical School Hong Fang Liu; Columbia School of Medicineand Students at Fordham, Columbia, and NYU
Outlines
(1) Networks in Bioinformatics
(2) Micro-array Technology
(3) Data Analysis and Data Mining
(4) Rank Correlation and Data Fusion
(5) Remarks and Further Research
(1) Networks in Bioinformatics
(A)Real NetworksGene regulatory networks, Metabolic networks, Protein-interaction networks.
(B) Virtual NetworksNetwork of interacting organisms, Relationship networks.
(C)Abstract NetworksCayley networks, etc.
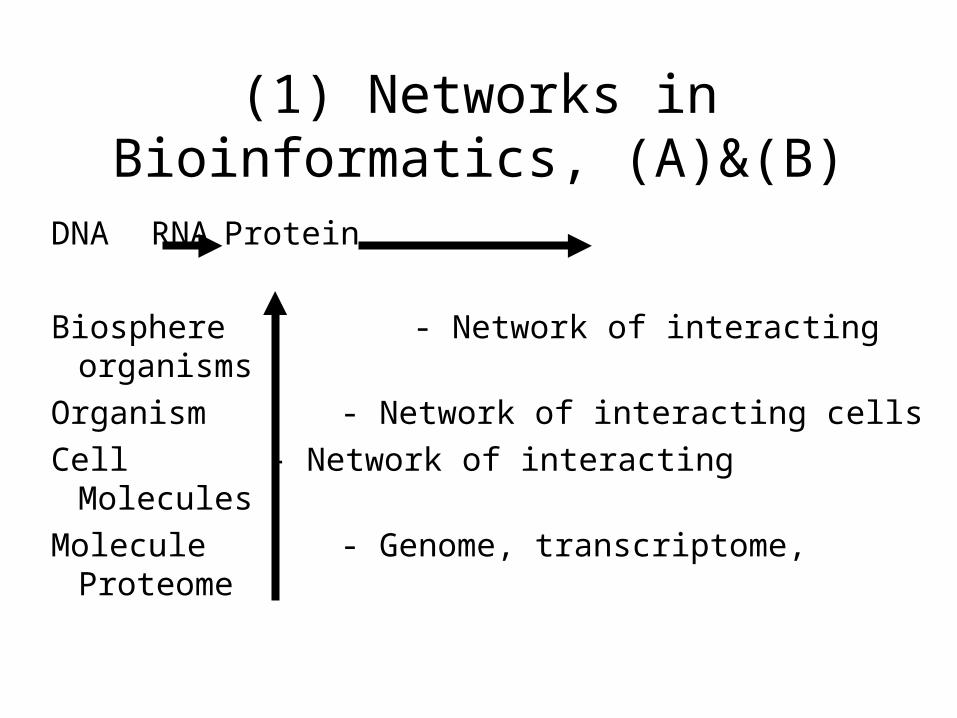
(1) Networks in Bioinformatics, (A)&(B)
DNA RNA Protein
Biosphere - Network of interacting organisms
Organism - Network of interacting cells
Cell - Network of interacting Molecules
Molecule - Genome, transcriptome, Proteome
The DBRF Method for Inferring a Gene Network
S. Onami, K. Kyoda, M. Morohashi, H. KitanoIn “Foundations of Systems Biology,” 2002
Presented by Wesley Chuang
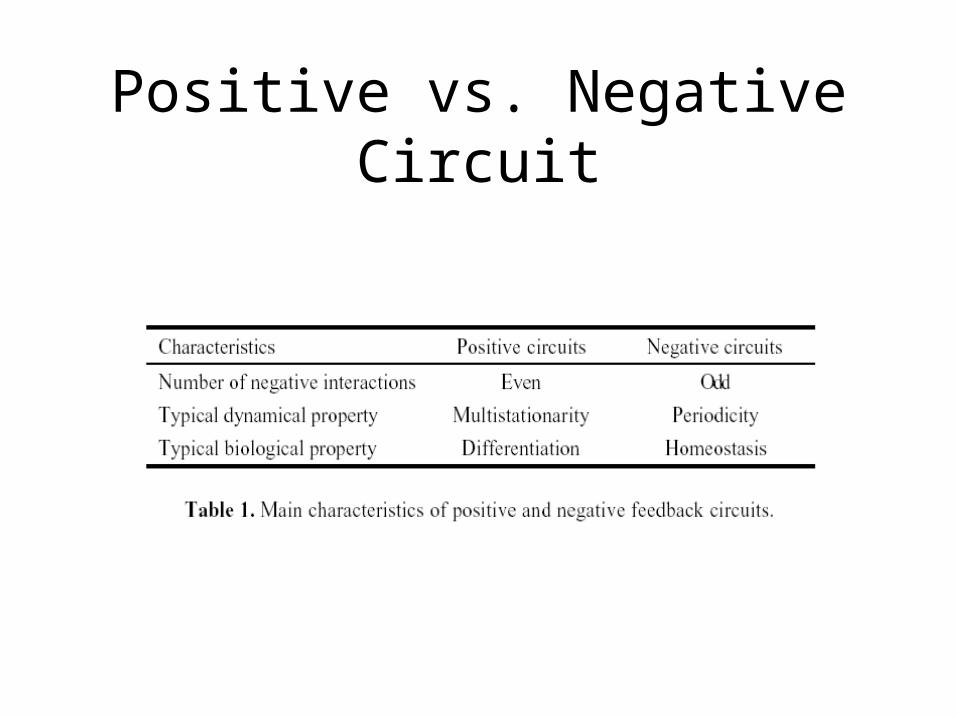
Positive vs. Negative Circuit
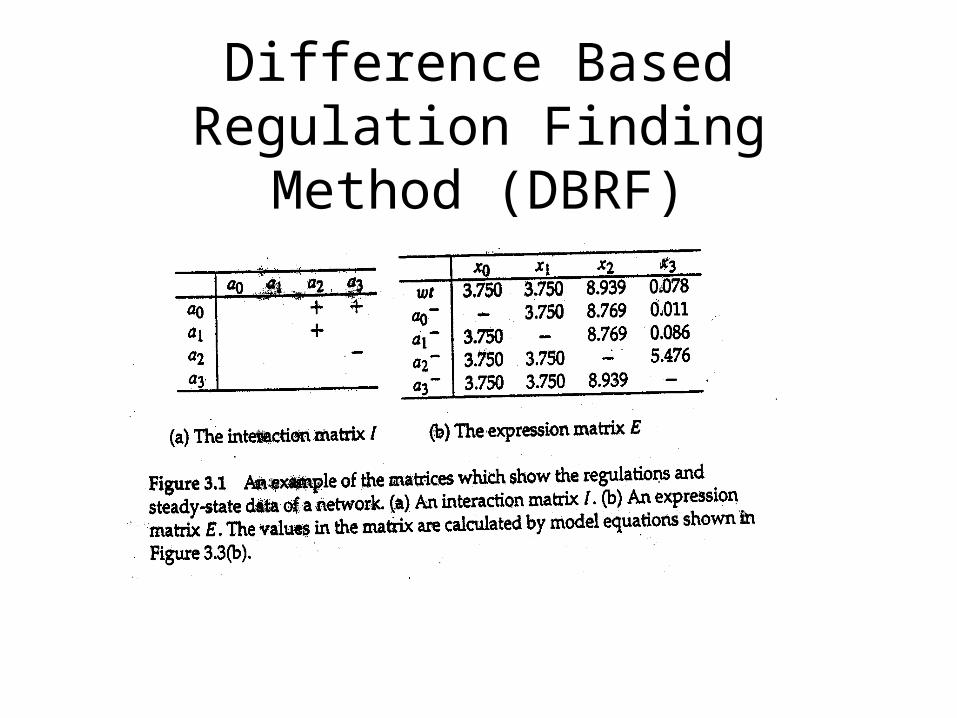
Difference Based Regulation Finding Method (DBRF)
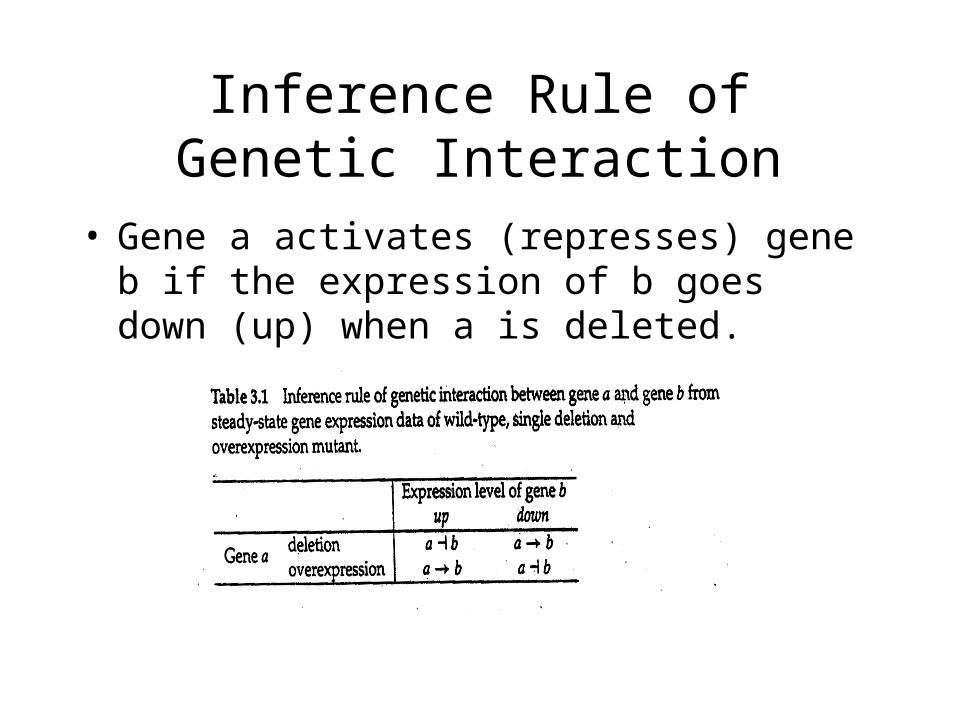
Inference Rule of Genetic Interaction
• Gene a activates (represses) gene b if the expression of b goes down (up) when a is deleted.

Parsimonious Network
• The route consists of the largest number of genes is the parsimonious route; others are redundant.
• The regulatory effect only depends on the parity of the number negative regulations involved in the route.
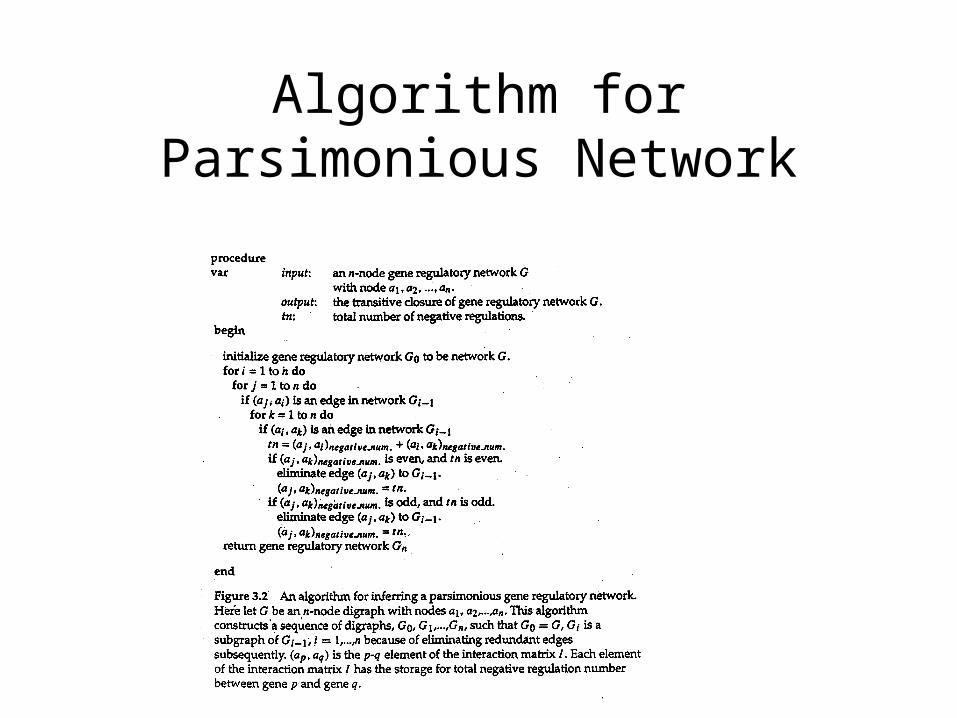
Algorithm for Parsimonious Network
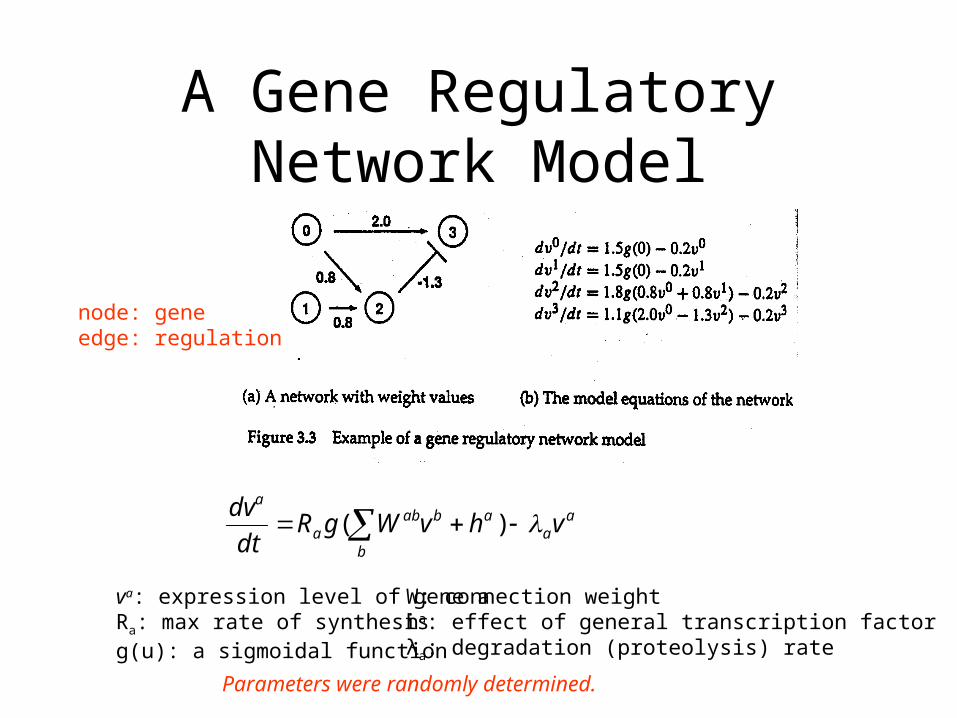
A Gene Regulatory Network Model
b
aa
ababa
a
vhvWgRdt
dv )(
W: connection weightha: effect of general transcription factorλa: degradation (proteolysis) rate
va: expression level of gene aRa: max rate of synthesisg(u): a sigmoidal function
node: geneedge: regulation
Parameters were randomly determined.
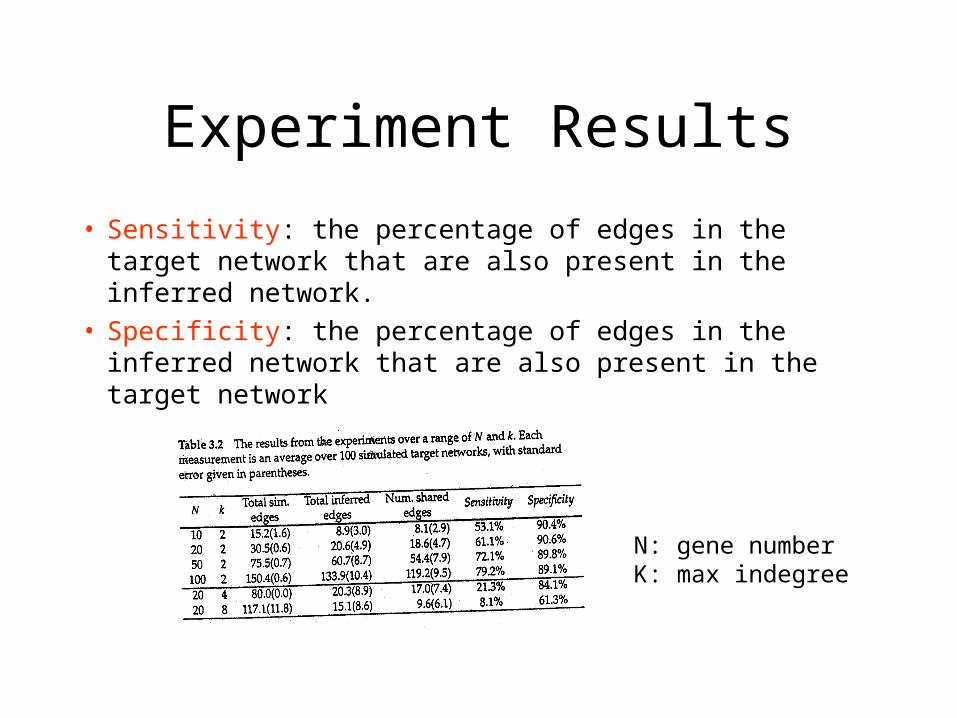
Experiment Results
• Sensitivity: the percentage of edges in the target network that are also present in the inferred network.
• Specificity: the percentage of edges in the inferred network that are also present in the target network
N: gene numberK: max indegree
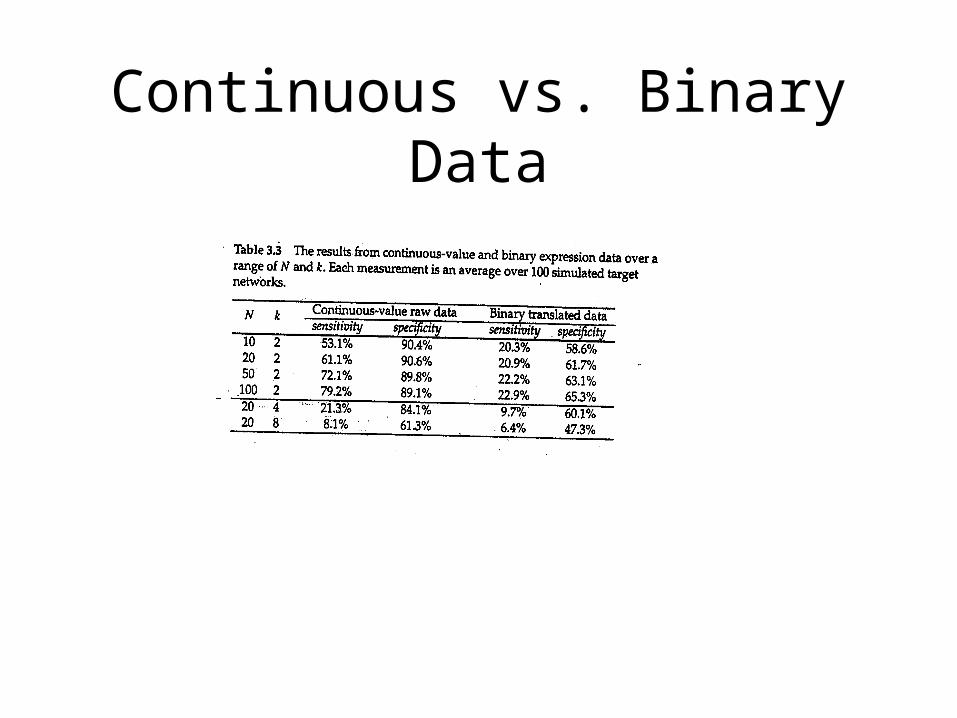
Continuous vs. Binary Data

DBRF vs. Predictor Method

Inferred (Yeast) Gene Network
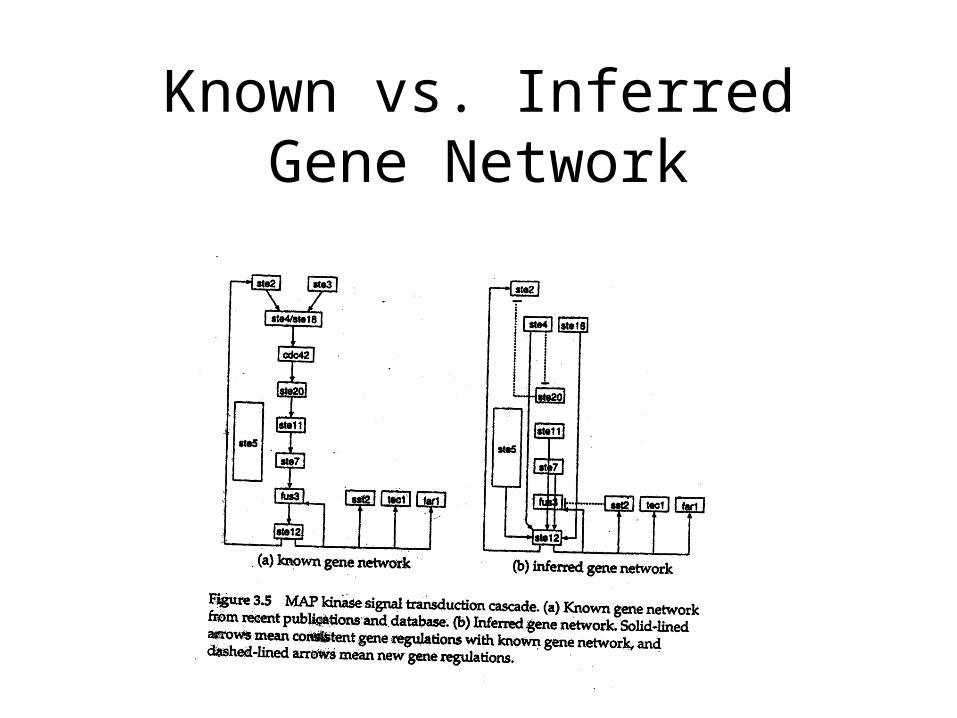
Known vs. Inferred Gene Network

Conclusion
• Applicable to continuous values of expressions.• Scalable for large-scale gene expression data.• DBRF is a powerful tool for genome-wide gene
network analysis.
(3) Data Analysis and Data Mining
• cDNA microarray & high-clesity oligonucleotide chips
• Gene expression levels,• Classification of tumors, disease and
disorder (already known or yet to be discovered)
• Drug design and discovery, treatment of cancer, etc.
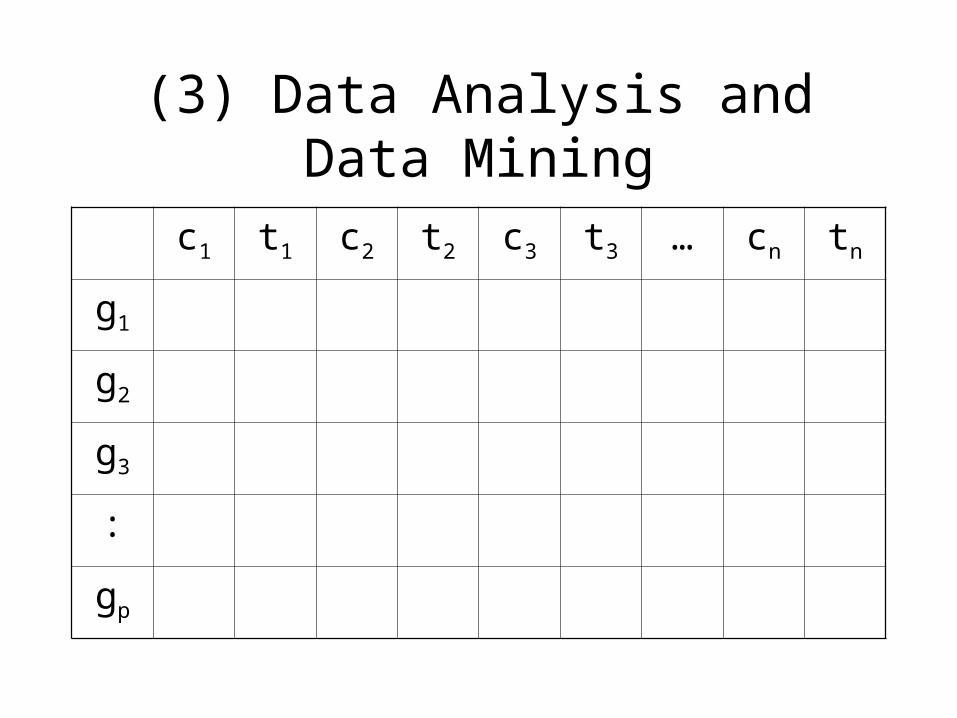
(3) Data Analysis and Data Mining
c1 t1 c2 t2 c3 t3 … cn tn
g1
g2
g3
:
gp
(3) Data Analysis and Data Mining
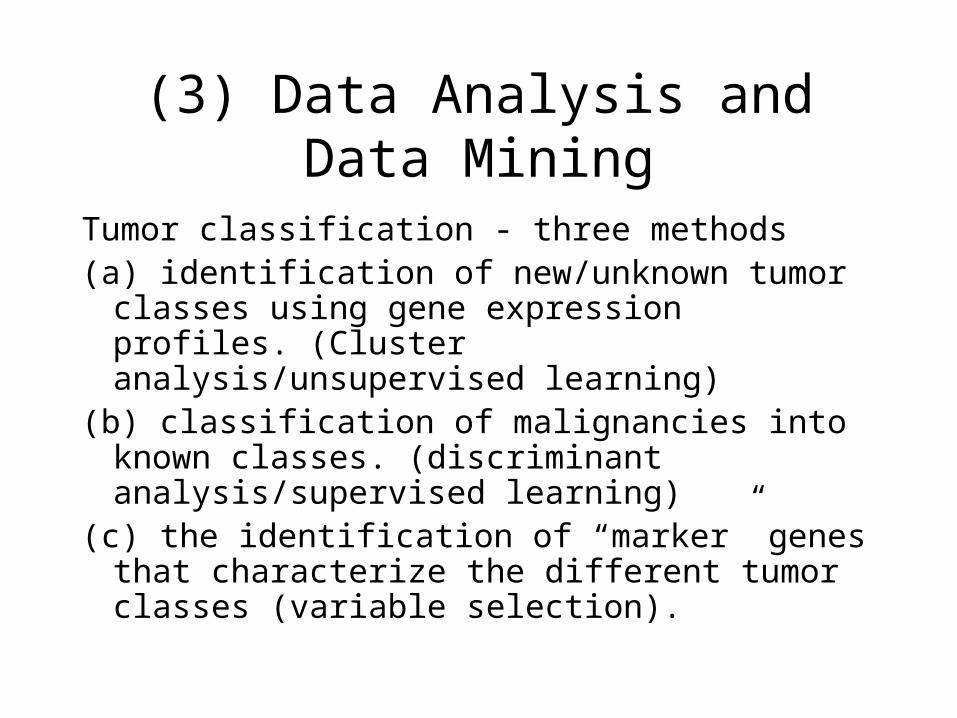
Tumor classification - three methods(a) identification of new/unknown tumor classes
using gene expression profiles. (Cluster analysis/unsupervised learning)
(b) classification of malignancies into known classes. (discriminant analysis/supervised learning)
(c) the identification of “marker” genes that characterize the different tumor classes (variable selection).
(3) Data Analysis and Data Mining
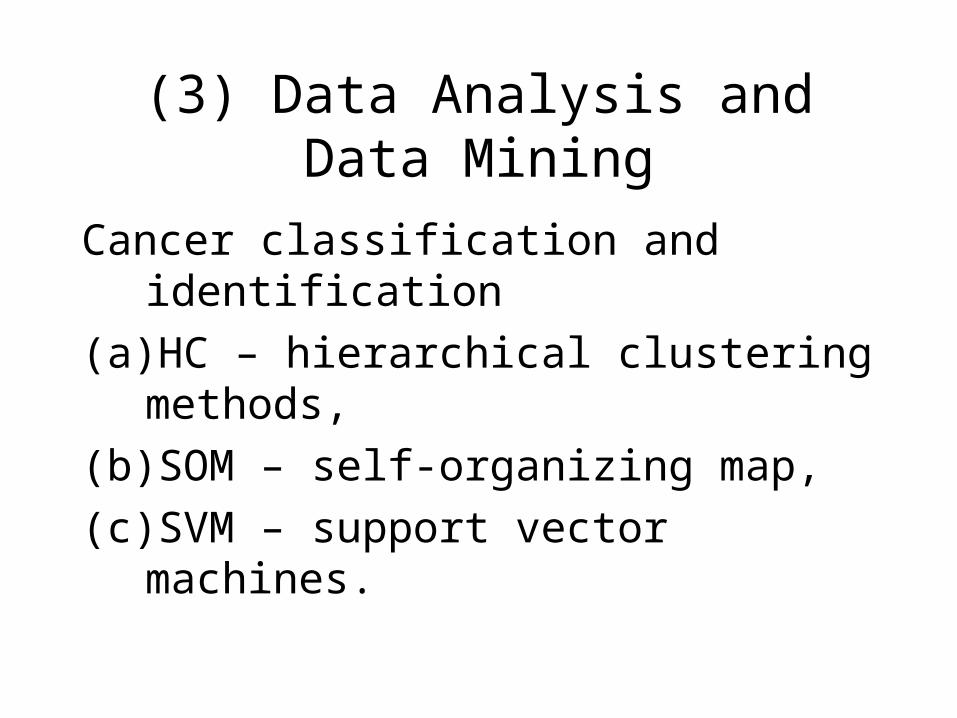
Cancer classification and identification
(a) HC – hierarchical clustering methods,
(b) SOM – self-organizing map,
(c) SVM – support vector machines.

(3) Data Analysis and Data Mining
Prediction methods (Discrimination methods)(a) FLDA – Fisher’s linear discrimination
analysis(b) ML – Maximum likelihood discriminat
rule,(c) NN – nearest neighbor,(d) Classification trees,(e) Aggregating classifiers.
Rank Correlation and Data Fusion
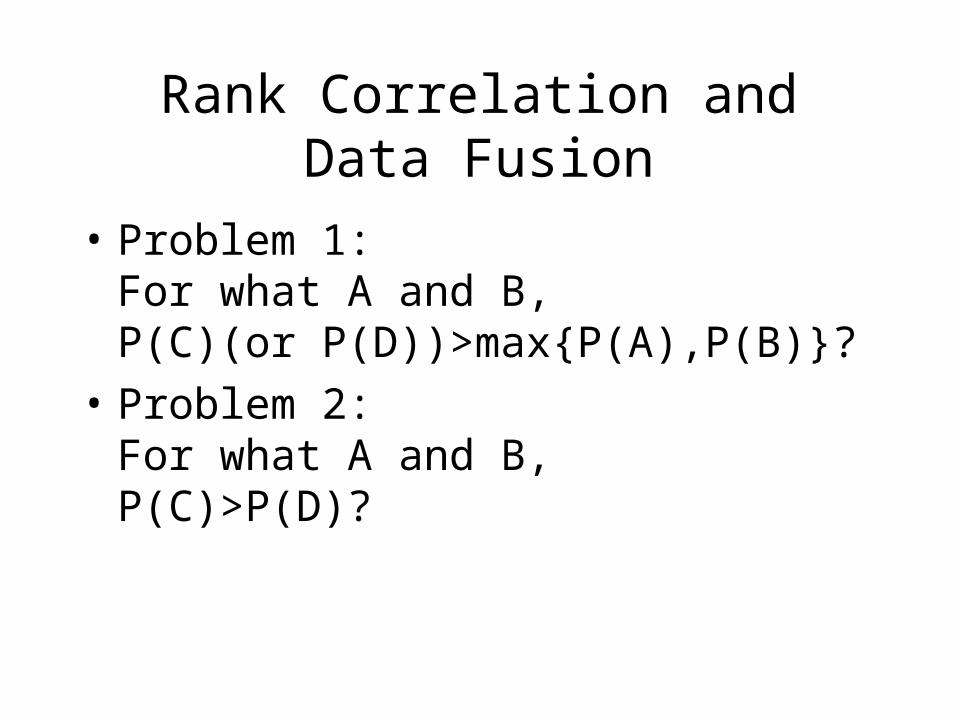
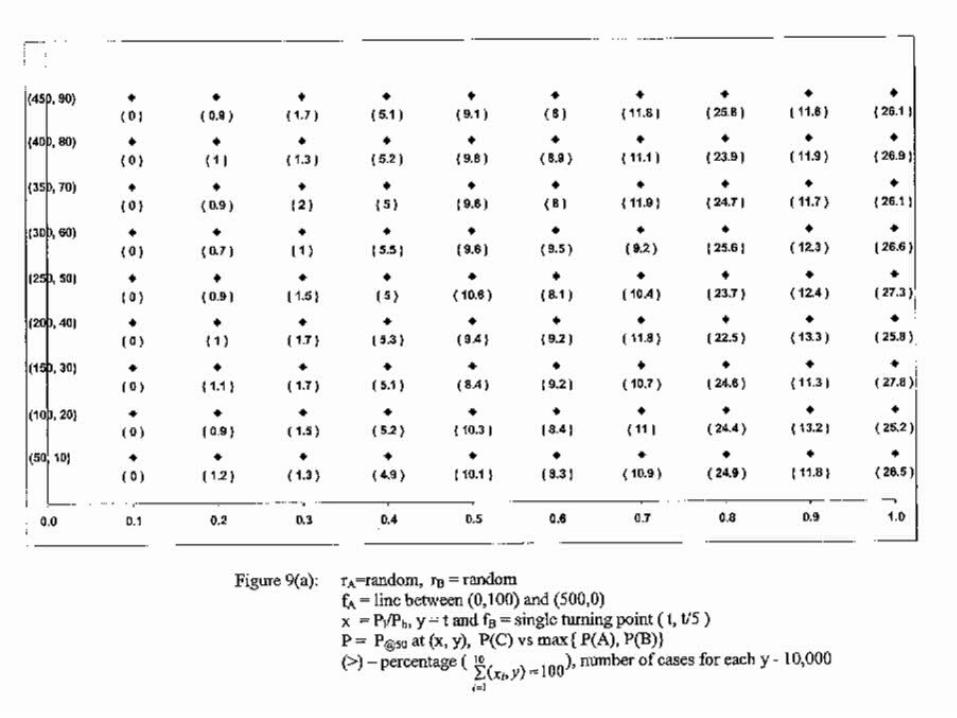
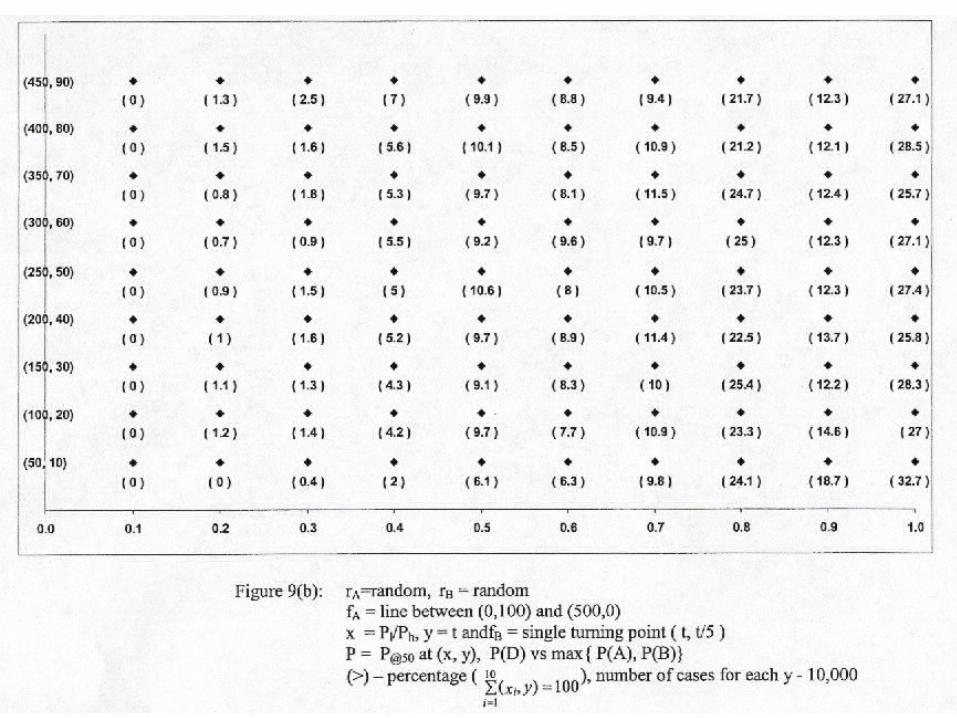
• Problem 1: For what A and B, P(C)(or P(D))>max{P(A),P(B)}?
• Problem 2: For what A and B, P(C)>P(D)?
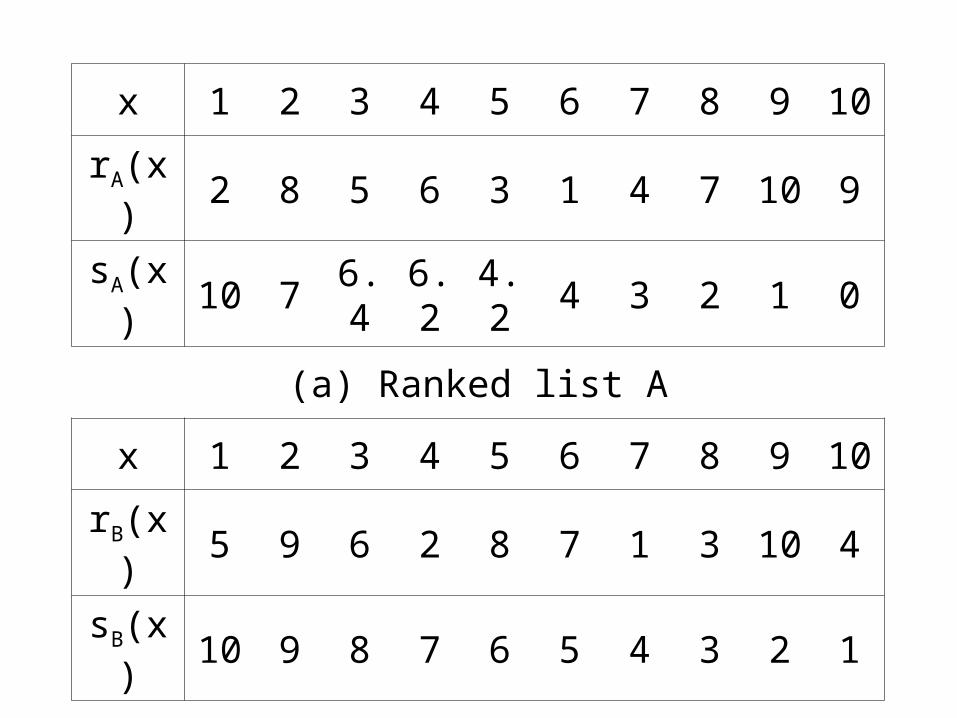
x 1 2 3 4 5 6 7 8 9 10
rA(x) 2 8 5 6 3 1 4 7 10 9
sA(x) 10 7 6.4 6.2 4.2 4 3 2 1 0
(a) Ranked list A
x 1 2 3 4 5 6 7 8 9 10
rB(x) 5 9 6 2 8 7 1 3 10 4
sB(x) 10 9 8 7 6 5 4 3 2 1
(b) Ranked list B

x 1 2 3 4 5 6 7 8 9 10
fAB(x) 6.5 2.5 4 8.5 2 3.5 7 6.5 6 9
sf(x) 2 2.5 3.5 4 6 6.5 6.5 7 8.5 9
rC(x) 5 2 6 3 9 1 8 7 4 10
(c) Combination of A and B by rank
x 1 2 3 4 5 6 7 8 9 10
gAB(x) 4.0 8.5 3.6 2.0 8.2 7.1 3.5 5 4.5 1.5
sg(x) 8.5 8.2 7.1 5.0 4.5 4.0 3.6 3.5 2.0 1.5
rD(x) 2 5 6 8 9 1 3 7 4 0
(d) Combinations of A and B by score
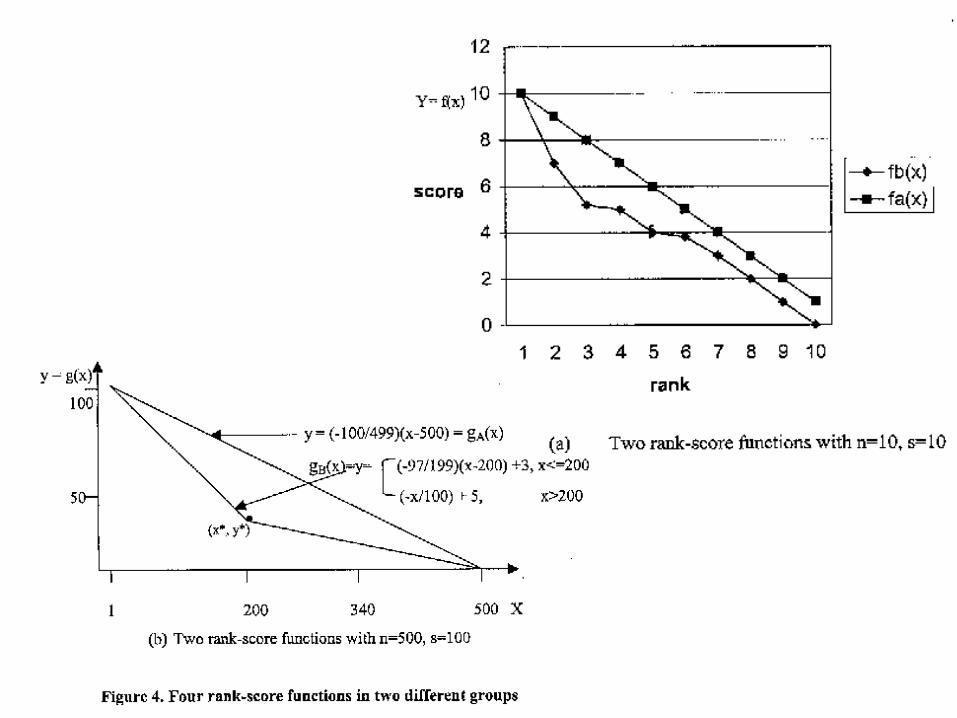


• Theorem 3: Let A, B, C and D be defined as before. Let sA=L and sB=L1L2 (L1 and L2 meet at (x*, y*) be defined as above). Let rA=eA be the identity permutation. If rB=t 。 eA, where t= the transposition (i,j), (i<j), and q<x*, then P@q(C) P@q(D).


(S4,S) where S={(1,2),(2,3),(3,4)}
4321
431242313421
3241 2431 3412 41324213
3142 14322413 412323413214
2314 3124 13422143 1423
124313242134
1234
0 %
50%
100%
Precision at 2

(S4,T) where T={(i,j)|ij}43214312
4231
3421
3241
24313412
4132
4213
1432
2413
41232341
3214
2314
31241342 2143
1423
1243
1324
1234 2134
3142
References
1. Lenwood S. Heath; Networks in Bioinformatics, I-SPAN’02, May 2002, IEEE Press, (2002), 141-150
2. Minoru Kanehisa; Prediction of higher order functional networks from genomie data, Bharnacogonomics (2)(4), (2001), 373-385.
3. D. F. Hsu, J. Shapiro and I. Taksa; Methods of data fusion in information retrieval; rank vs. score combination, DIMACS Technical Report 2002-58, (2002)
4. M. Grammatikakis, D. F. Hsu, and M. Kratzel; Parallel system interconnection and communications, CRC Press(2001).
5. S. Dudoit, J. Fridlyand and T. Speed; Comparison of discrimination methods for the classification of tumors using gene expressions data, UC Berkeley, Technical Report #576, (2000).