Embed Size (px)
Citation preview
© 2018 - ntop.org 1
Luca Deri <[email protected]>@lucaderi
Luca Deri <[email protected]>@lucaderi
Network Traffic and Security MonitoringUsing ntopng and InfluxDB

© 2018 - ntop.org 2
Part I:Welcome to ntopng

© 2018 - ntop.org
About ntop.org [1/2]
• ntop develops of open source network traffic monitoring applications.
• ntop (circa 1998) is the first app we released and it is a web-based network monitoring application.
• Today our products range from traffic monitoring, high-speed packet processing, deep-packet inspection, and IDS/IPS acceleration (bro and suricata).
3
© 2018 - ntop.org
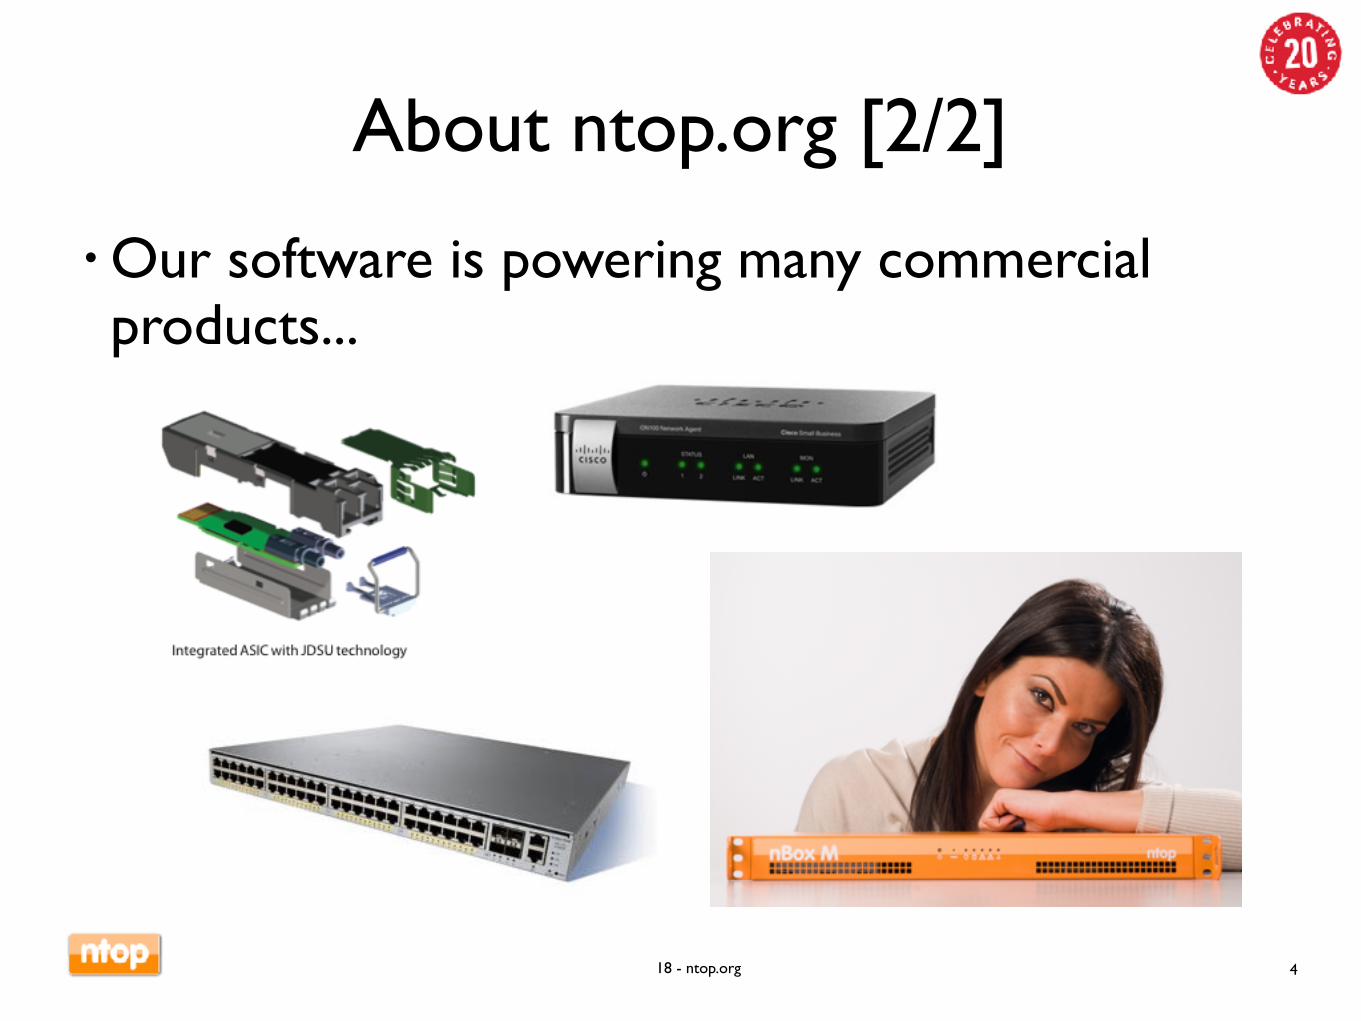
About ntop.org [2/2]
• Our software is powering many commercial products...
4
© 2018 - ntop.org
ntop Goals
• Provide better, yet price effective, traffic monitoring solution by enabling users to have increased traffic visibility.
• Go beyond standard metrics and increase traffic visibility by analysing key protocols in detail.
• Promote open-source software, while protecting selected IPRs.
• All commercial ntop tools are available at no cost for research and education.
5

© 2018 - ntop.org
ntop’s Approach to Traffic Monitoring
• Ability to capture, process and (optionally) transmit traffic at line rate, any packet size.
• Leverage on modern multi-core/NUMA architectures in order to promote scalability.
• Use commodity hardware for producing affordable, long-living (no vendor lock), scalable (use new hardware by the time it is becoming available) monitoring solutions.
• Use open-source to spread the software, and let the community test it on unchartered places.
6

© 2018 - ntop.org
Motivation For Traffic Monitoring
7
If you can’t measure it, you can’t improve it(Lord Kelvin, 1824 – 1907)
If you can’t measure it, you can’t manage it(Peter Drucker, 1909 – 2005)
© 2018 - ntop.org
What Happens in Our Network?
• Do we have control over our network?• It’s not possible to imagine a healthy network without a clear understanding of traffic flowing on our network.
• Knowledge is the first step towards evaluation of potential network security issues.
• Event correlation can provide us timely information about our network health.
8
© 2018 - ntop.org
Packets Never Lie
• Packet analysis provide useful information for understanding:◦Network traffic issues.◦Network usage not compliant with network policies (note: firewalls cannot help here).◦Performances less than expected.◦Potential security flaws.◦Ongoing (latent) attacks.◦Data breach.
• But… packets are too fine grained so we need to aggregate them into flows (5 tuple IP/port src/dst, protocol).
9
© 2018 - ntop.org
How To Install ntopng
• Source codehttps://github.com/ntop/ntopng
• DistributionsUbuntu/Debian, FreeBSD…. (included in the distro) OSX (brew)
• Binary Packages (nightly + stable) http://packages.ntop.org (Debian/Ubuntu/CentOS, OSX, RaspberryPI/ARM)
10
© 2018 - ntop.org
Some History
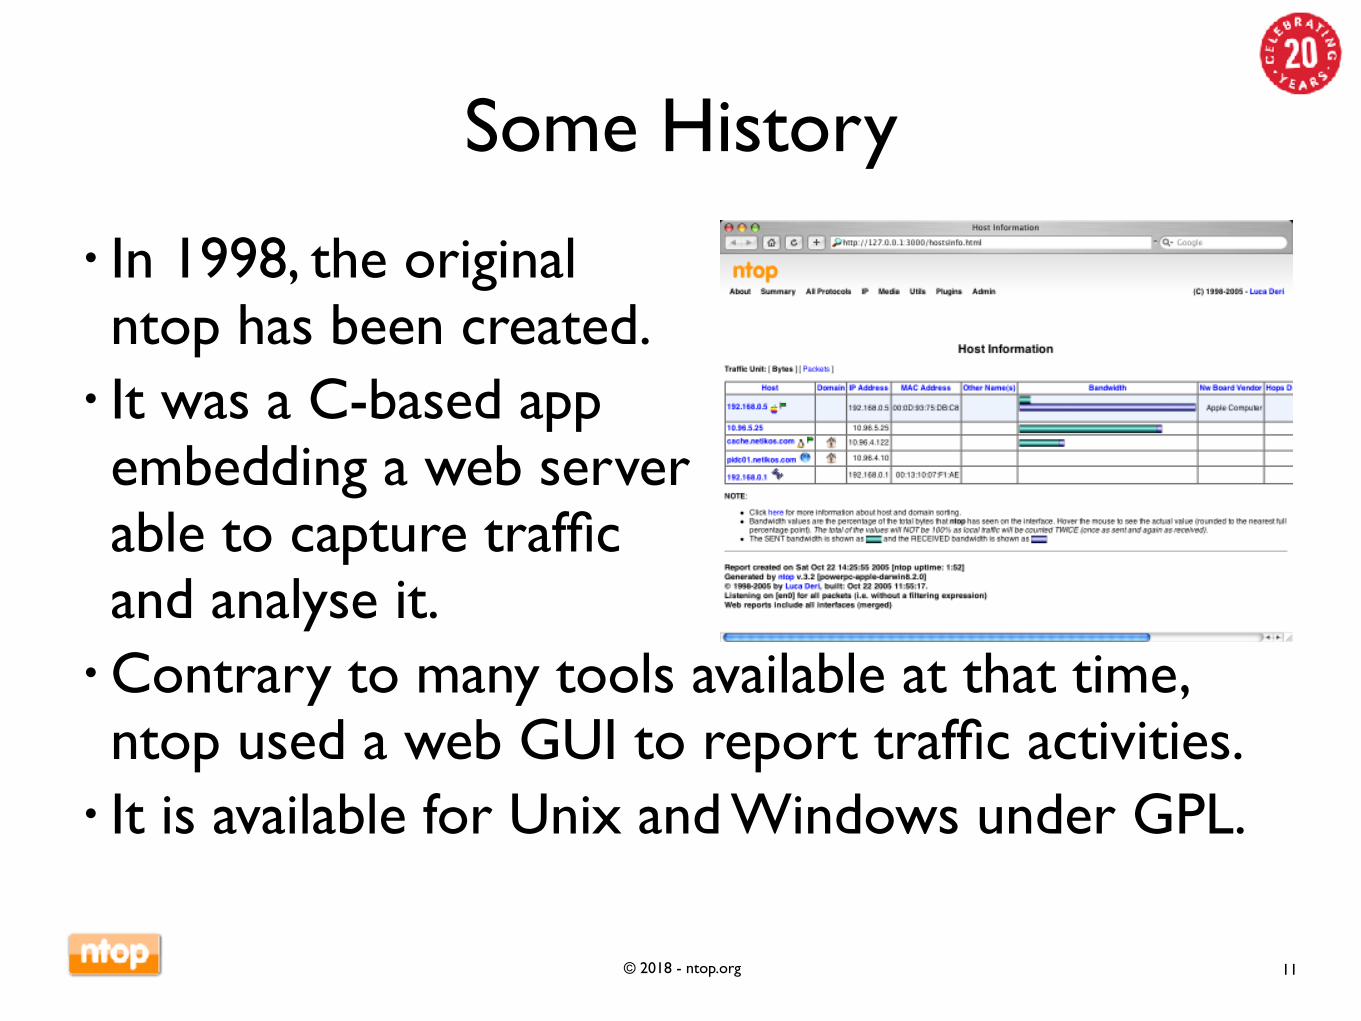
• In 1998, the original ntop has been created.
• It was a C-based appembedding a web serverable to capture trafficand analyse it.
• Contrary to many tools available at that time, ntop used a web GUI to report traffic activities.
• It is available for Unix and Windows under GPL.
11
© 2018 - ntop.org
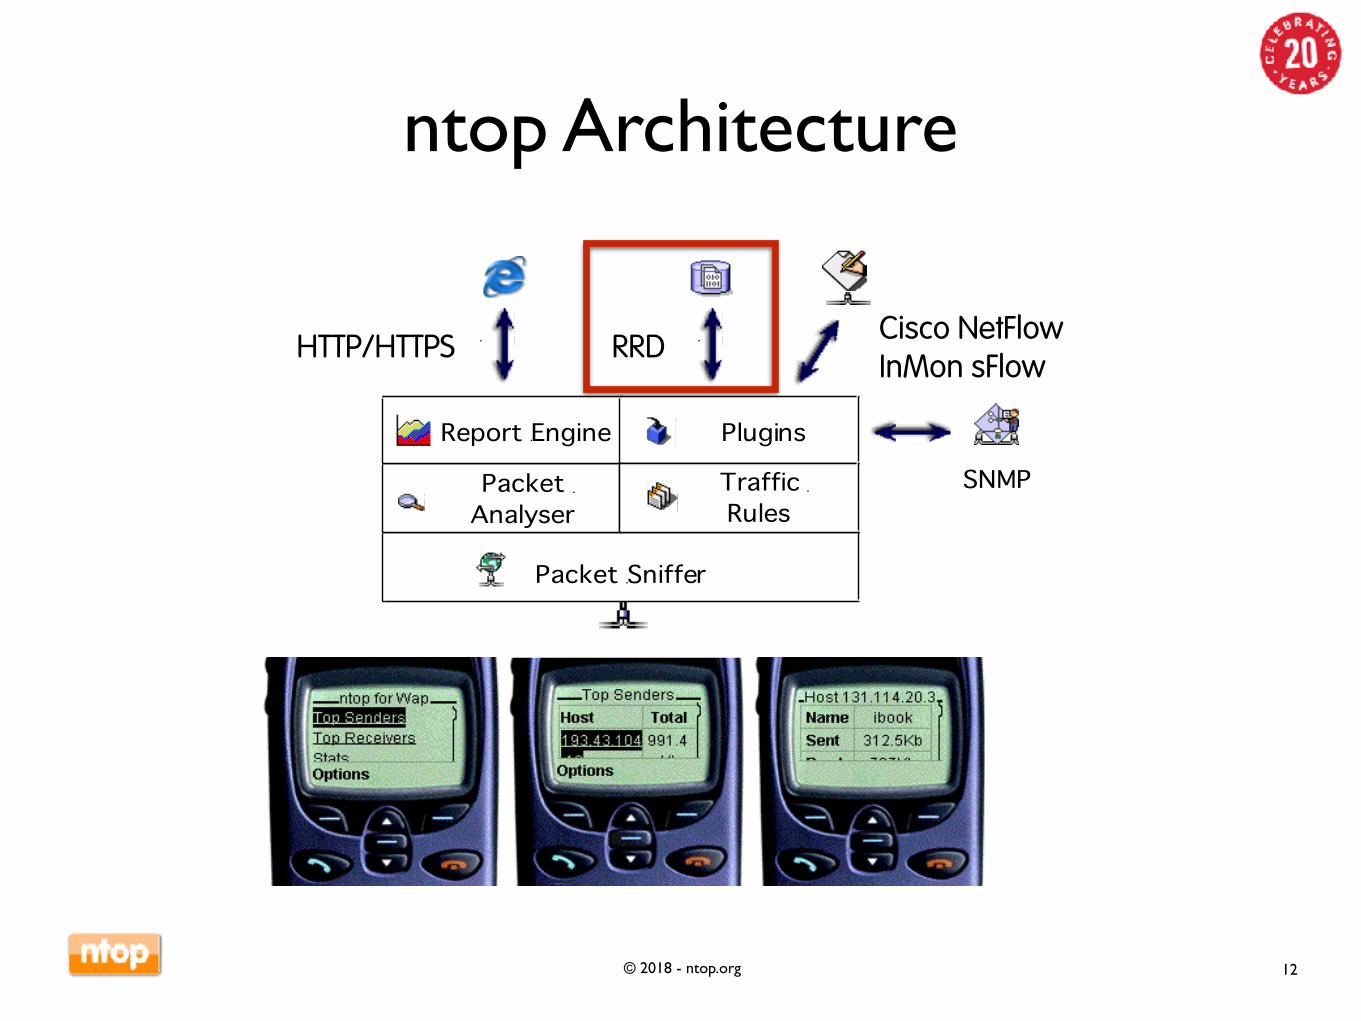
ntop Architecture
12
HTTP/HTTPS RRDCisco NetFlow InMon sFlow
© 2018 - ntop.org
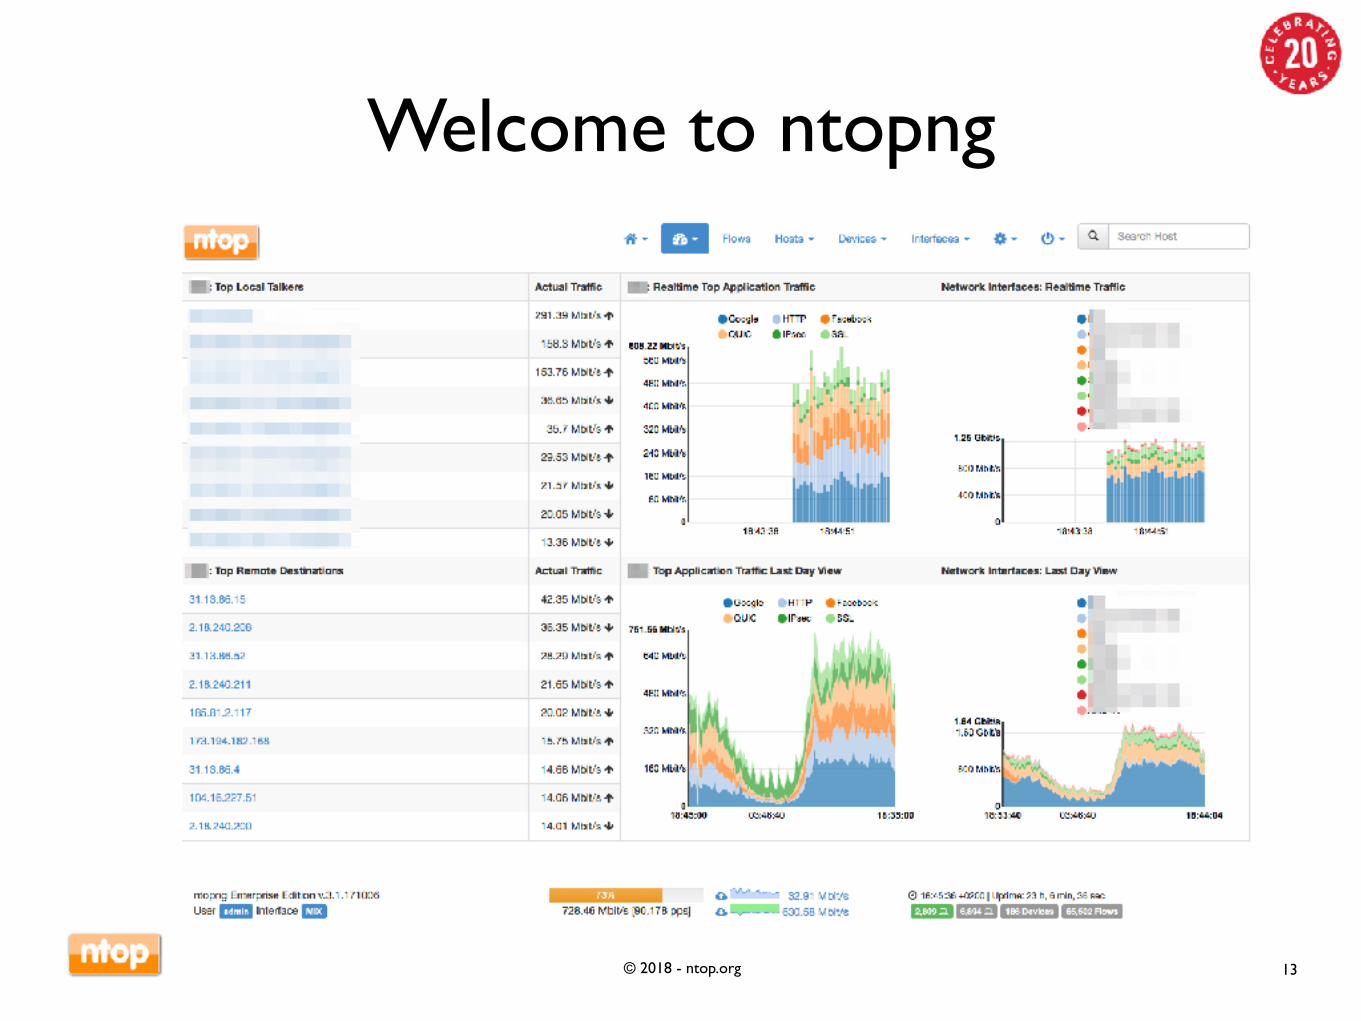
Welcome to ntopng
13
© 2018 - ntop.org
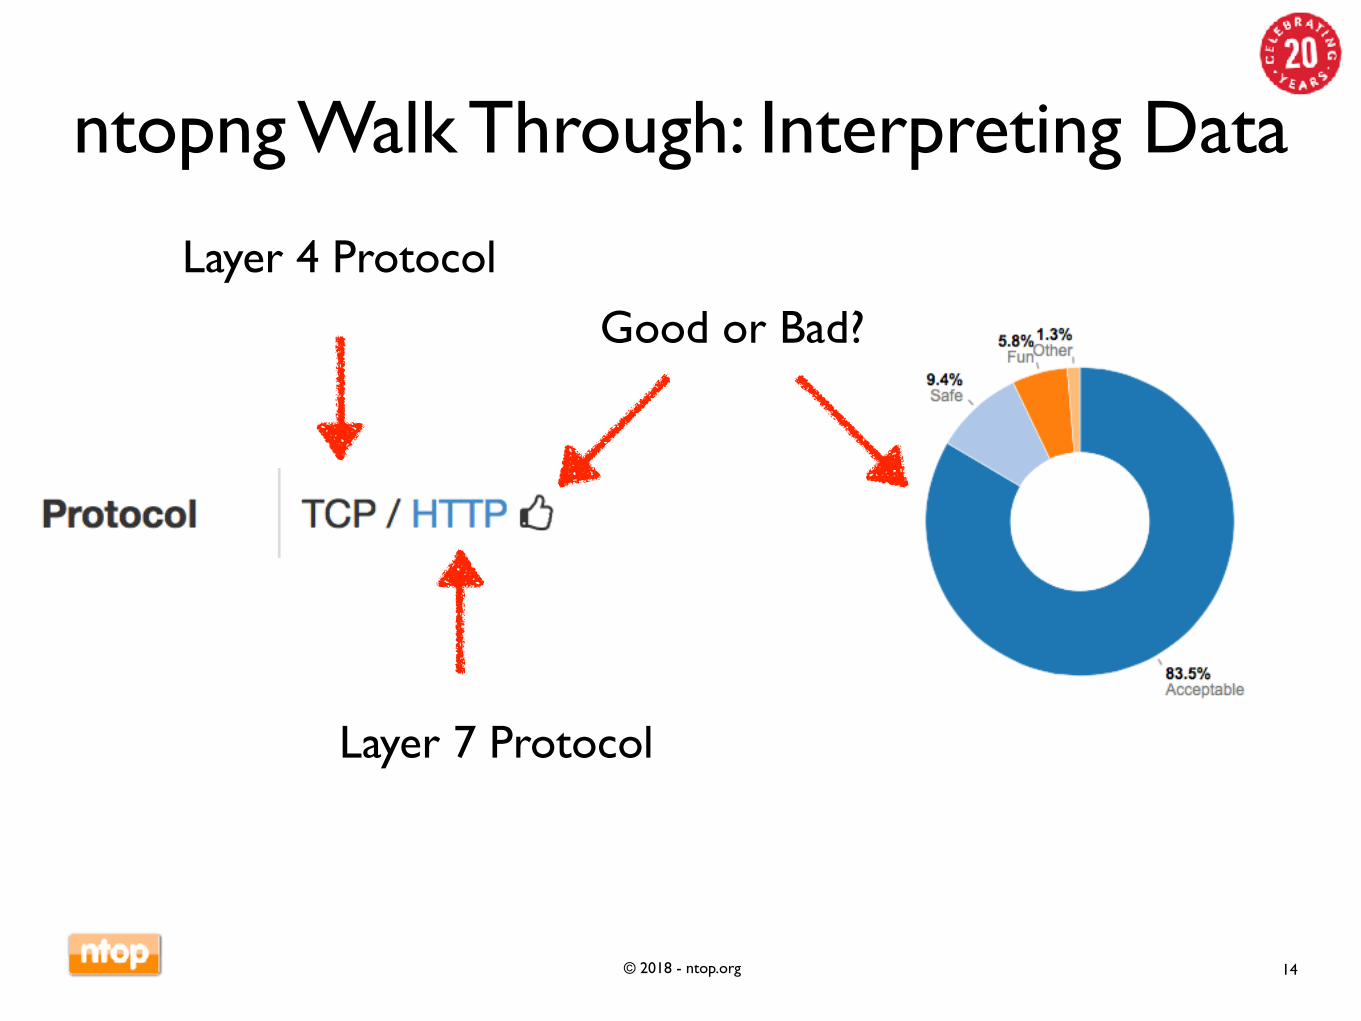
ntopng Walk Through: Interpreting Data
14
Layer 4 Protocol
Layer 7 Protocol
Good or Bad?
© 2018 - ntop.org
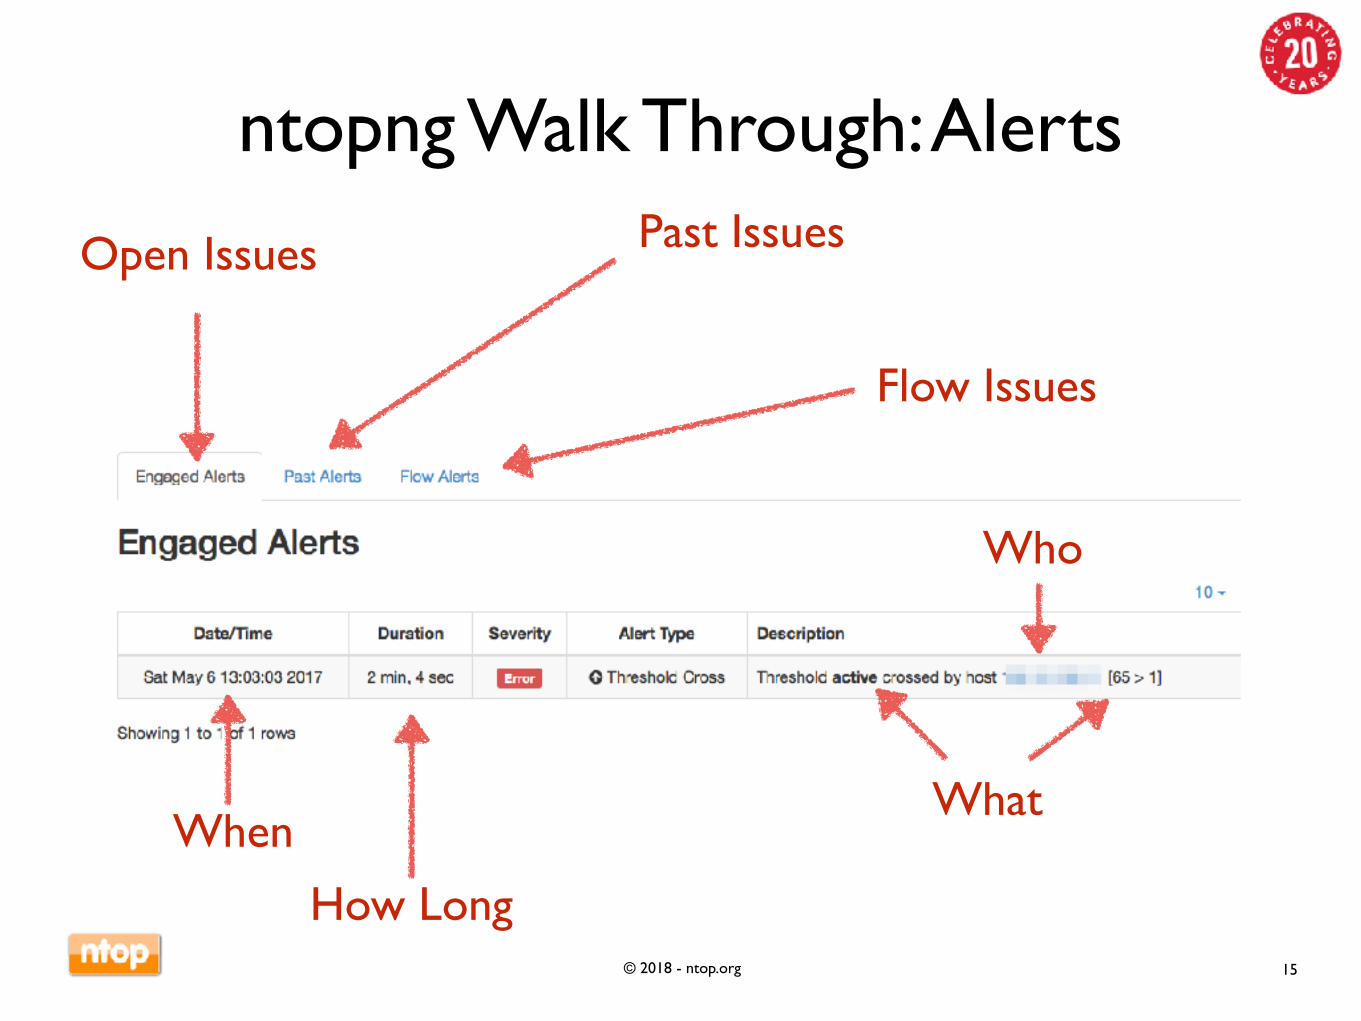
ntopng Walk Through: Alerts
15
Open Issues Past Issues
Flow Issues
What
Who
When
How Long
© 2018 - ntop.org
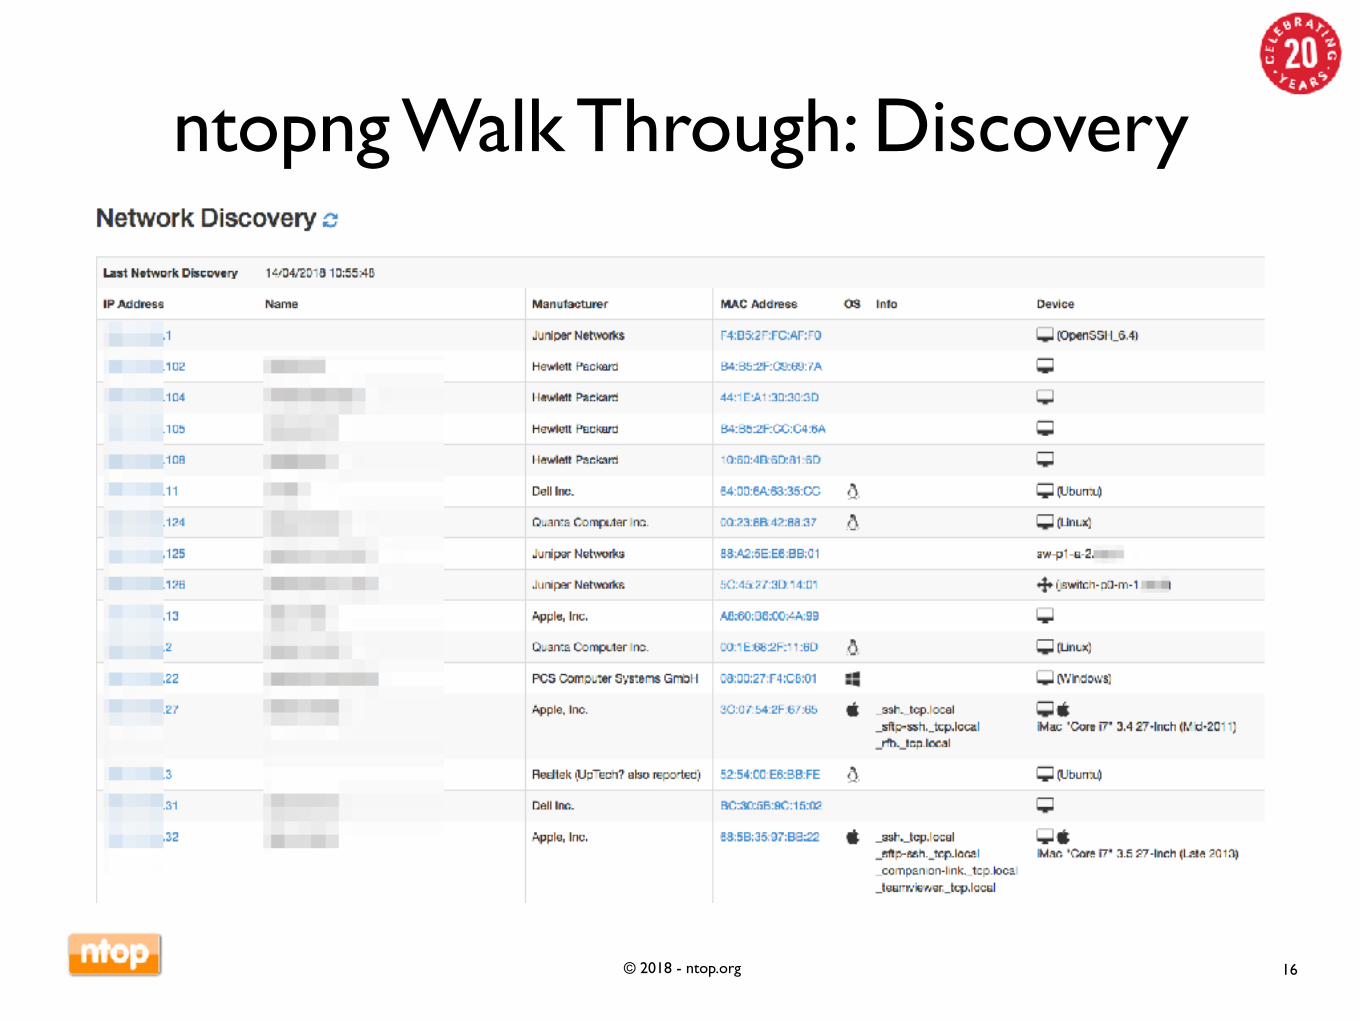
ntopng Walk Through: Discovery
16
© 2018 - ntop.org
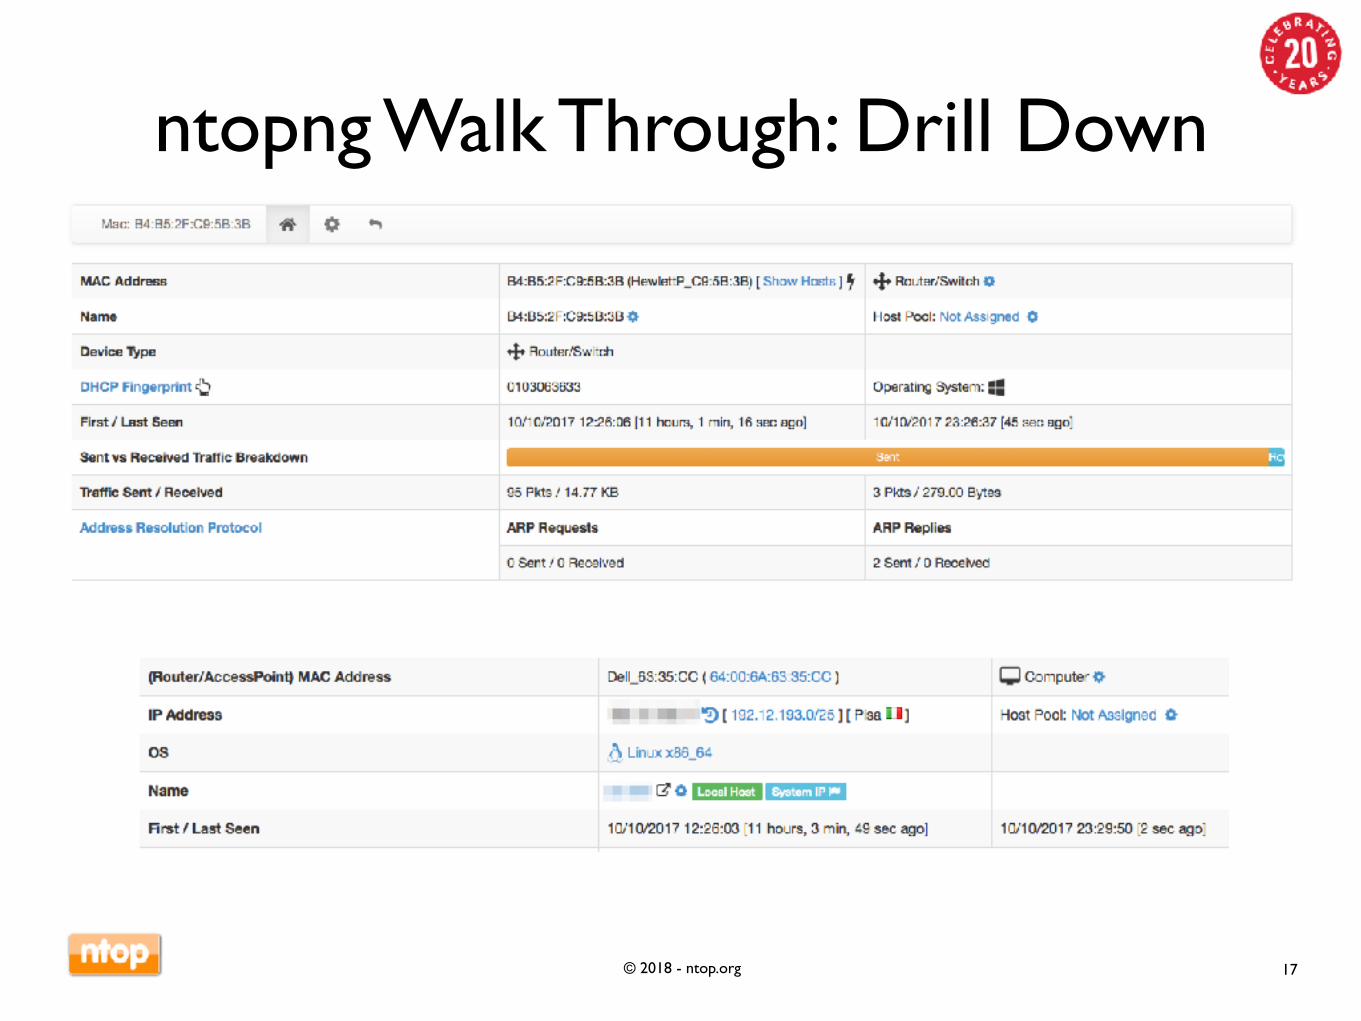
ntopng Walk Through: Drill Down
17

© 2018 - ntop.org
ntopng Walk Through: Monitoring
18
Invalid Configuration or Threat ? Service Down or Scan?
© 2018 - ntop.org
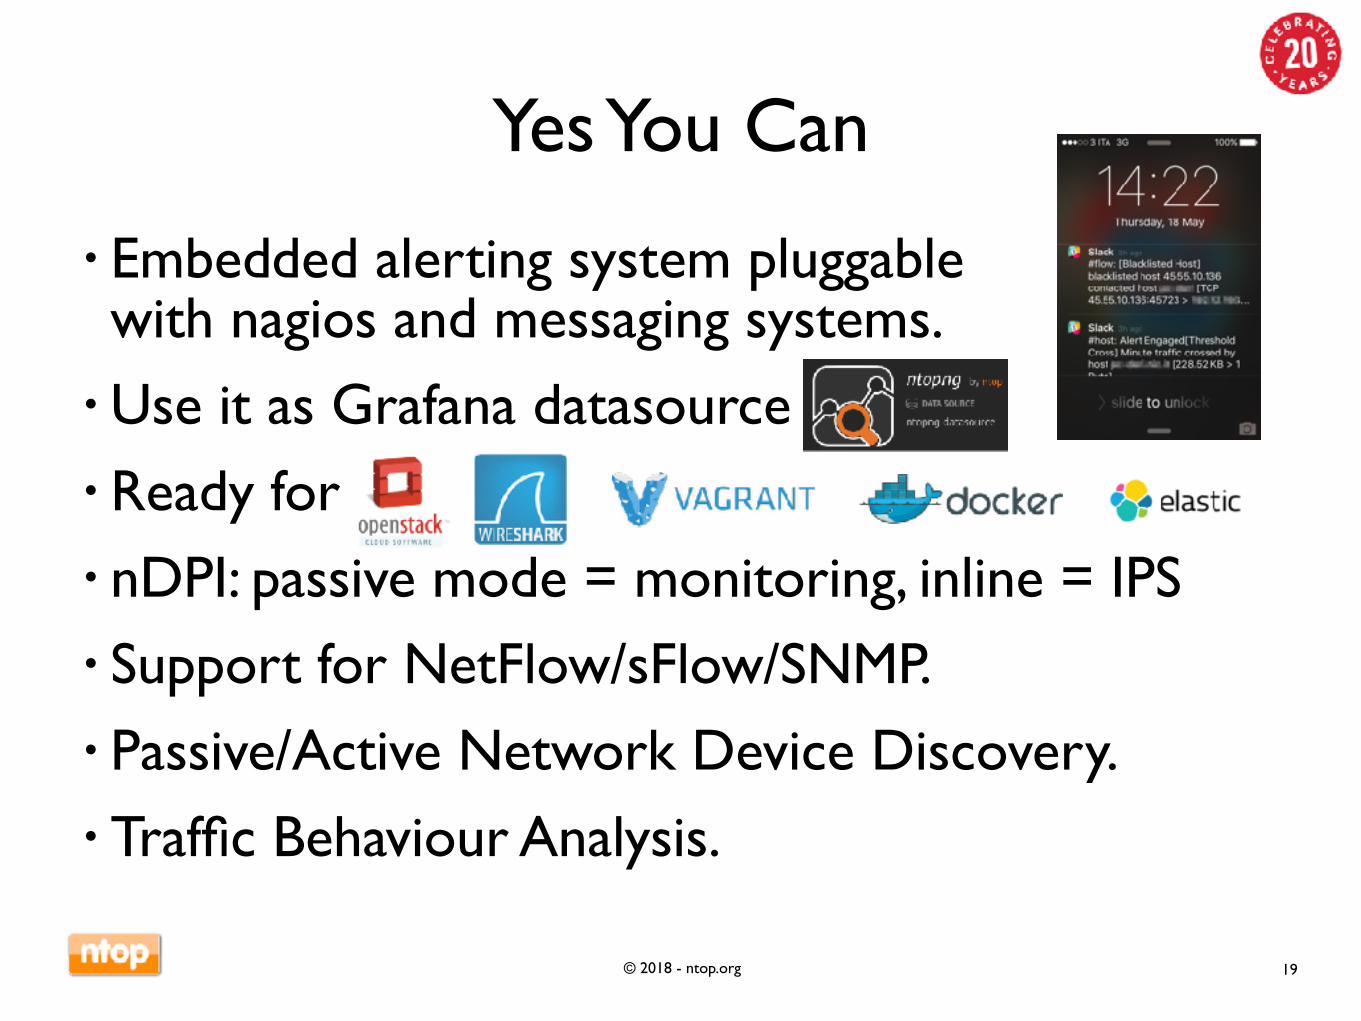
• Embedded alerting system pluggablewith nagios and messaging systems.
• Use it as Grafana datasource• Ready for • nDPI: passive mode = monitoring, inline = IPS• Support for NetFlow/sFlow/SNMP.• Passive/Active Network Device Discovery.• Traffic Behaviour Analysis.
Yes You Can
19
© 2018 - ntop.org
ntopng Design Goals
• Clean separation between the monitoring engine and the reporting facilities.
• Robust, crash-free engine.• Platform scriptability for enabling extensions or changes at runtime without restart.
• Realtime: most monitoring tools aggregate data (5 mins usually) and present it when it’s too late.
• Many new features including HTML 5-based dynamic GUI, categorisation, DPI.
20
© 2018 - ntop.org
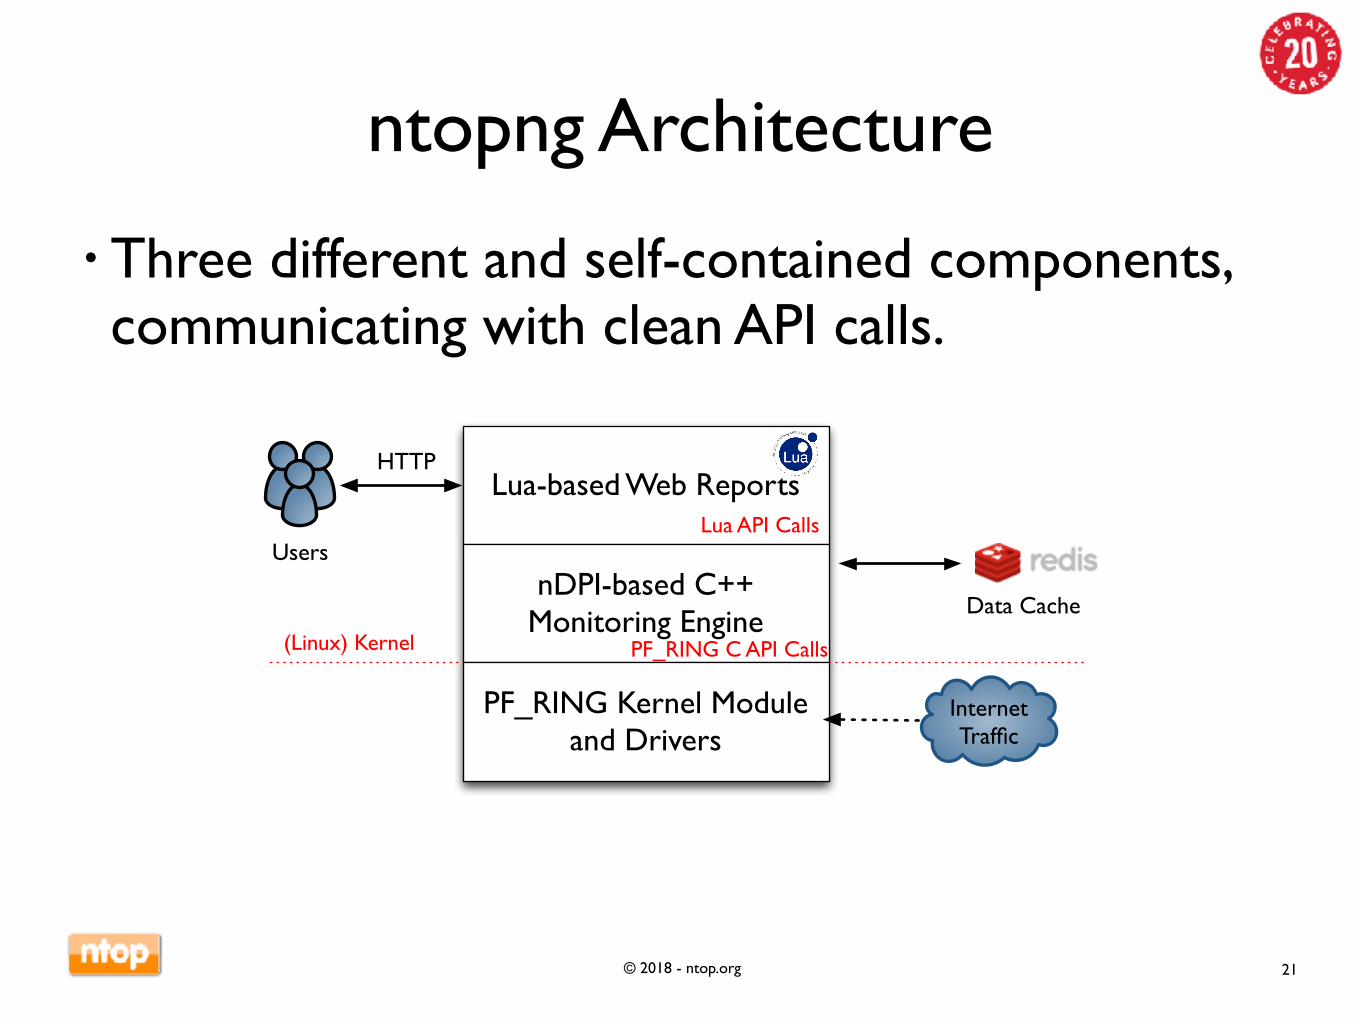
ntopng Architecture
• Three different and self-contained components, communicating with clean API calls.
21
Users
HTTPLua-based Web Reports
nDPI-based C++ Monitoring Engine
PF_RING Kernel Module and Drivers
InternetTraffic
Lua API Calls
PF_RING C API Calls(Linux) Kernel
Data Cache
© 2018 - ntop.org
ntopng Monitoring Engine
• Coded in C++ and based the concept of flow (set of packets with the same 6-tuple).
• Flows are inspected with a home-grown DPI-library named nDPI aiming to discover the “real” application protocol (no ports are used).
• Information is clustered per:! (Capture) Network Device! Flow!Host
22
© 2018 - ntop.org
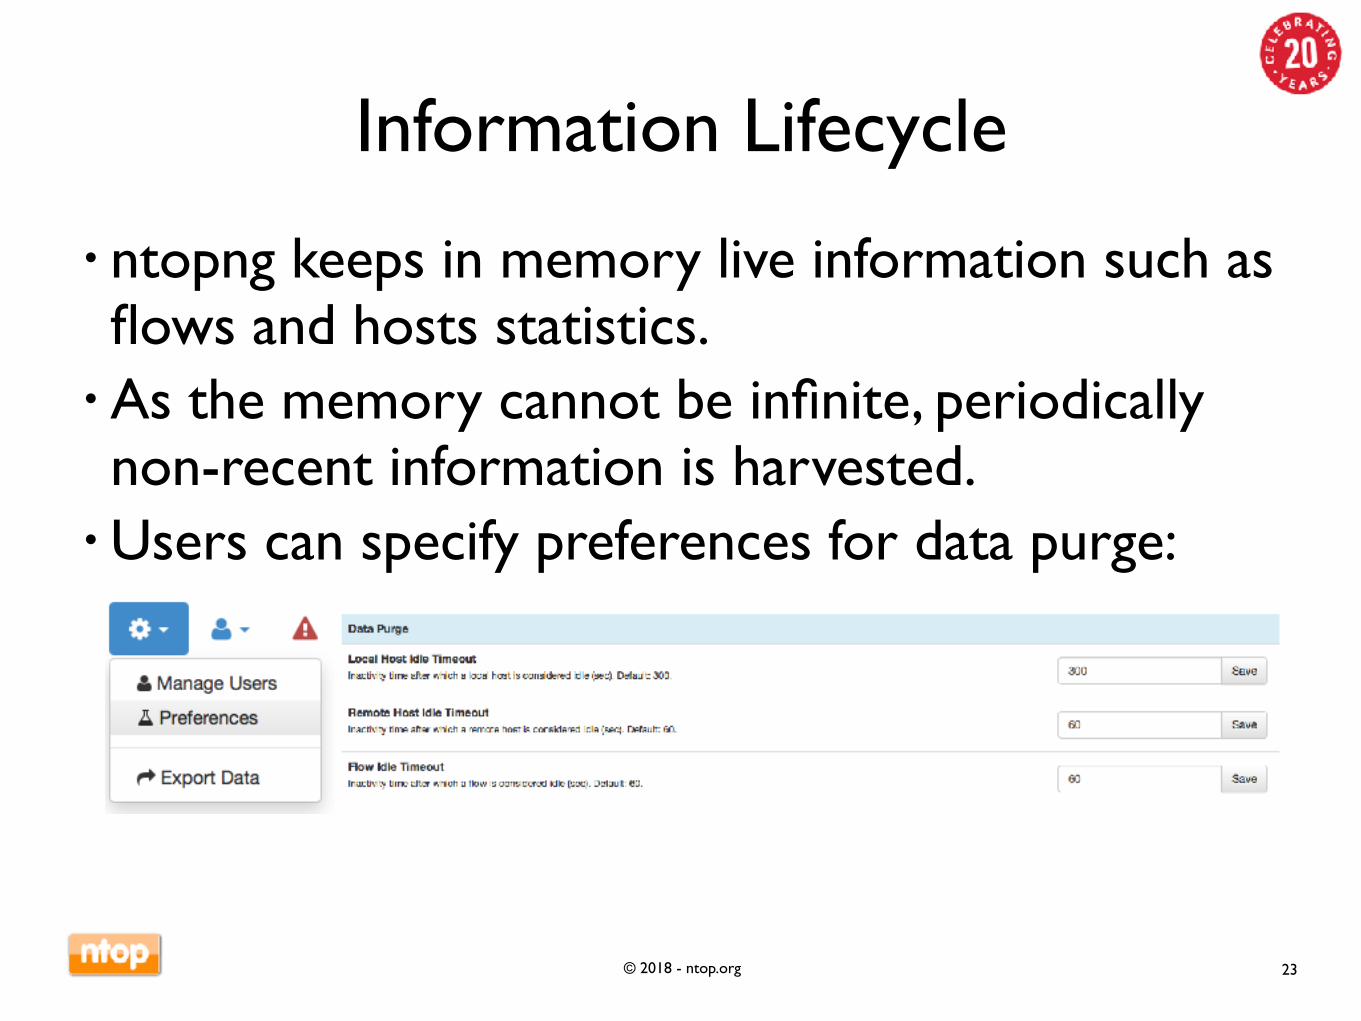
Information Lifecycle
• ntopng keeps in memory live information such as flows and hosts statistics.
• As the memory cannot be infinite, periodically non-recent information is harvested.
• Users can specify preferences for data purge:
23
© 2018 - ntop.org
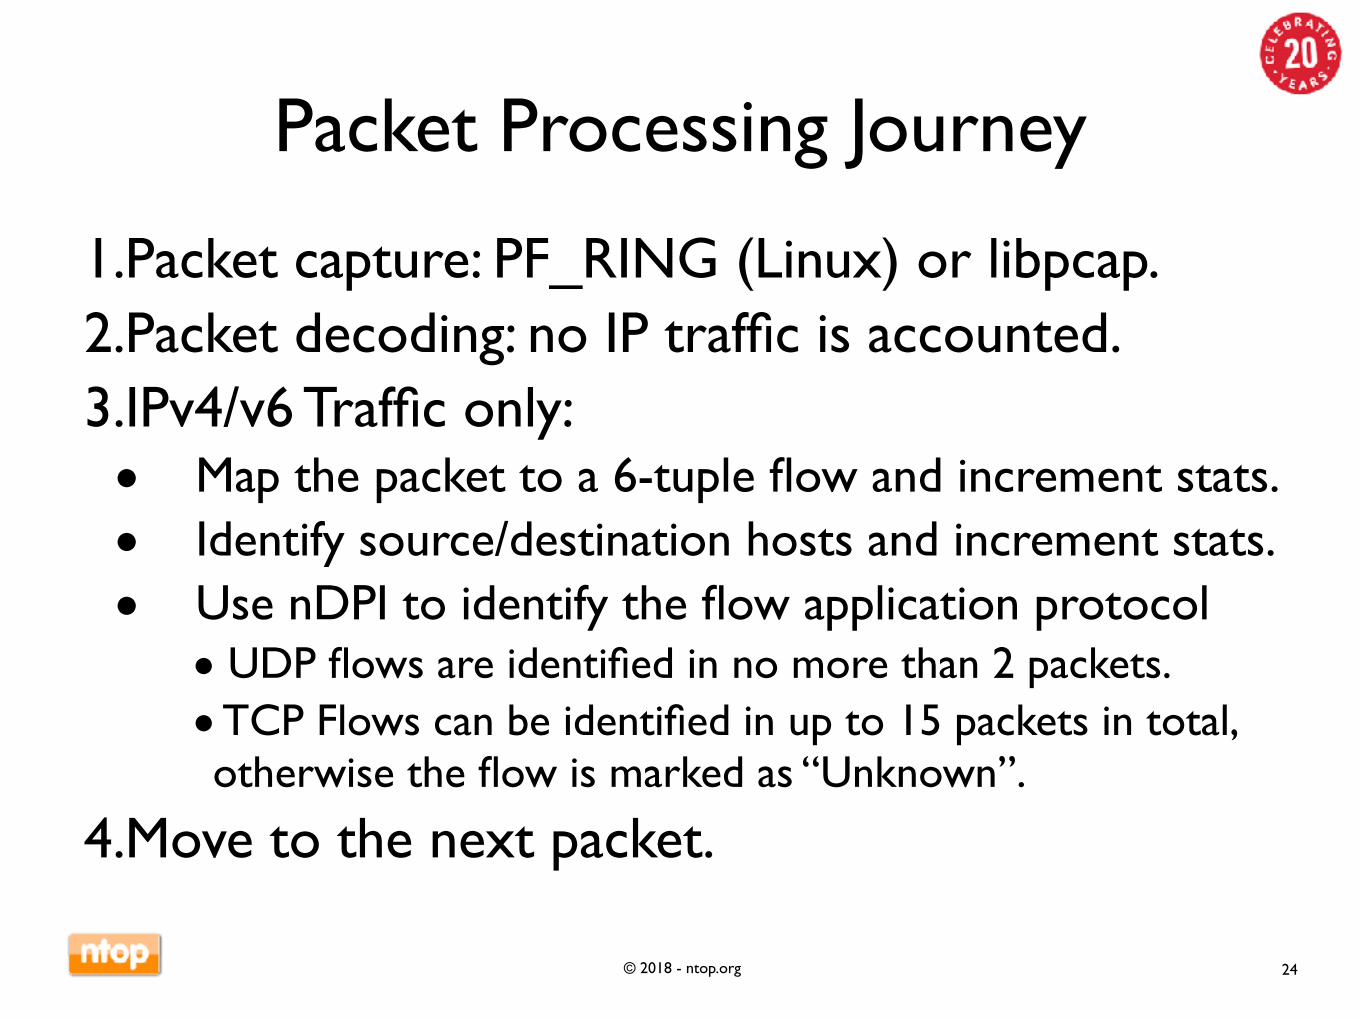
Packet Processing Journey
1.Packet capture: PF_RING (Linux) or libpcap.2.Packet decoding: no IP traffic is accounted.3.IPv4/v6 Traffic only:• Map the packet to a 6-tuple flow and increment stats.• Identify source/destination hosts and increment stats.• Use nDPI to identify the flow application protocol• UDP flows are identified in no more than 2 packets.• TCP Flows can be identified in up to 15 packets in total, otherwise the flow is marked as “Unknown”.
4.Move to the next packet.
24
© 2018 - ntop.org
The need for DPI in Monitoring [1/2]
• Limit traffic analysis at packet header level it is no longer enough (nor cool).
• Network administrators want to know the real protocol without relying on the port being used.
• Selected protocols can be “precisely dissected” (e.g. HTTP) in order to extract information, but on the rest of the traffic it is necessary to tell network administrators what is the protocol flowing in their network.
25
© 2018 - ntop.org
The need for DPI in Monitoring [2/2]
• DPI (Deep Packet Inspection) is a technique for inspecting the packet payload for the purpose of extracting metadata (e.g. protocol).
• There are many DPI toolkits available but they are not what we looked for as:◦ They are proprietary (you need to sign an NDA to use them), and
costly for both purchase and maintenance.◦ Adding a new protocol requires vendor support (i.e. it has a high
cost and might need time until the vendor supports it) = you’re locked-in.
• On a nutshell DPI is a requirement but the market does not offer an alternative for open-source.
26
© 2018 - ntop.org
Say hello to nDPI
• ntop has decided to develop its own GPL DPItoolkit in order to build an open DPI layer for ntop and third party applications.
• Supported protocols (> 240) include:◦P2P (Skype, BitTorrent)◦Messaging (Viber, Whatsapp, MSN, The Facebook)◦Multimedia (YouTube, Last.gm, iTunes)◦Conferencing (Webex, CitrixOnLine)◦Streaming (Zattoo, Icecast, Shoutcast, Netflix)◦Business (VNC, RDP, Citrix, *SQL)
27
© 2018 - ntop.org
nDPI on ntopng
• In ntopng all flows are analysed through nDPI to associate an application protocol to them.
• L7 statistics are available per flow, host, and interface (from which monitoring data is received).
• For network interfaces and local hosts, nDPI statistics are saved persistently to disk.
28
© 2018 - ntop.org
ntopng as a NetFlow/sFlow Collector
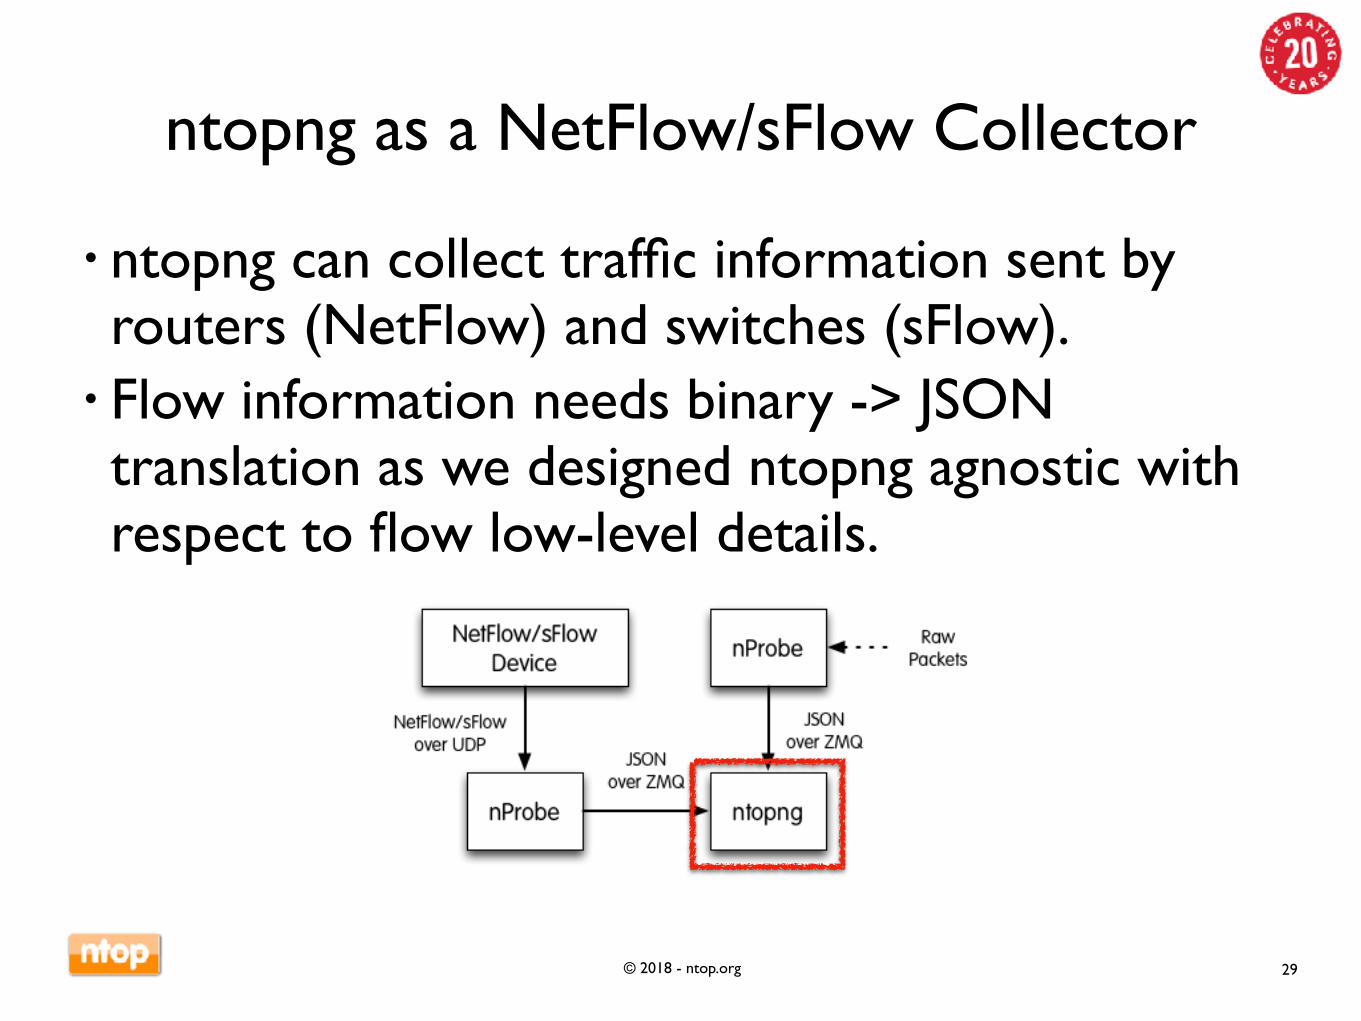
• ntopng can collect traffic information sent by routers (NetFlow) and switches (sFlow).
• Flow information needs binary -> JSON translation as we designed ntopng agnostic with respect to flow low-level details.
29
© 2018 - ntop.org
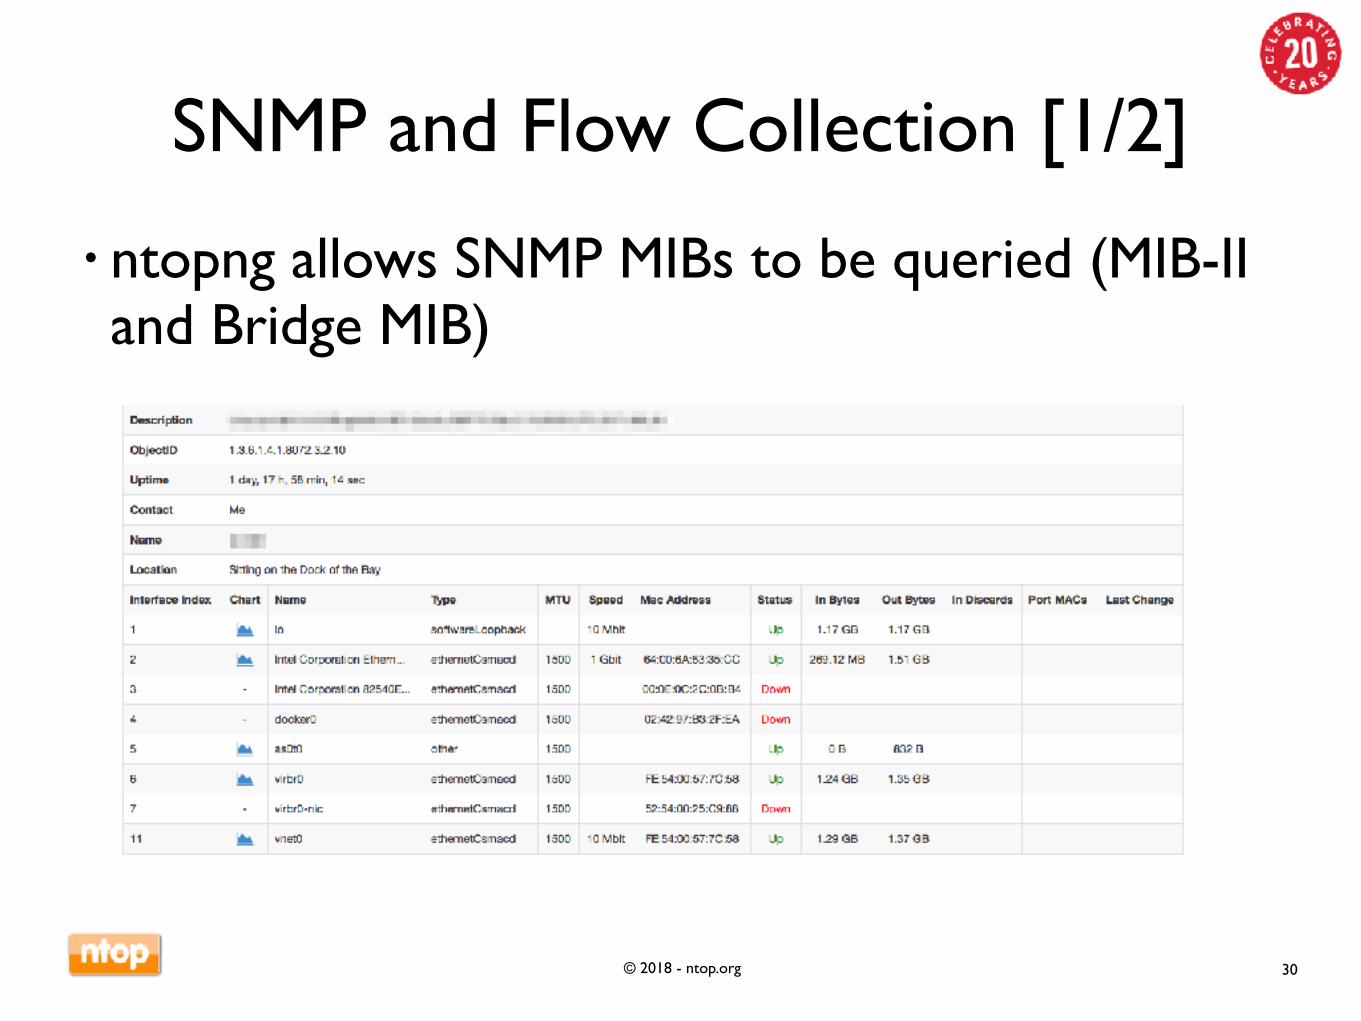
SNMP and Flow Collection [1/2]
• ntopng allows SNMP MIBs to be queried (MIB-II and Bridge MIB)
30
© 2018 - ntop.org
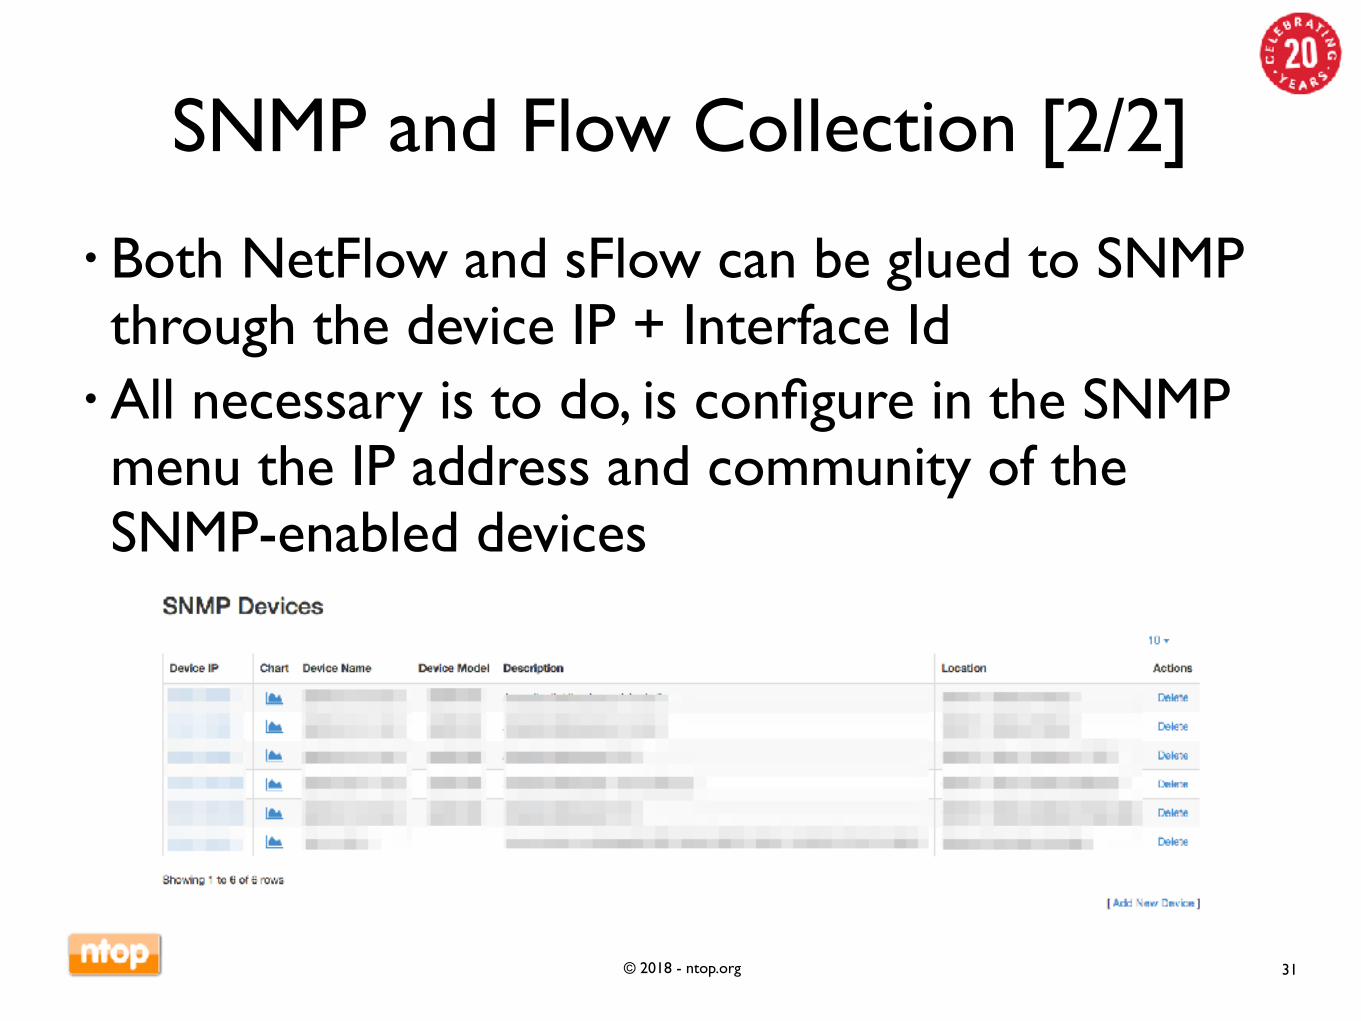
SNMP and Flow Collection [2/2]
• Both NetFlow and sFlow can be glued to SNMP through the device IP + Interface Id
• All necessary is to do, is configure in the SNMP menu the IP address and community of the SNMP-enabled devices
31
© 2018 - ntop.org
ntopng and Big Data [1/2]
• Using a local SQL database to save flows persistently is good when flows are not too many and the system that runs ntopng has storage.
• For large deployments or disk-less systems (e.g. ARM-based PCs) it is desirable to upload flows on remote, cloud-based, systems able to scale with the number of flows.
• In essence ntopng has been opened to what is currently defined as “big data” systems that can scale with data in volume and speed.
32
© 2018 - ntop.org
ntopng and Big Data [2/2]
• Currently ntopng is able to export monitoring information in JSON format towards various systems including◦ElasticSearch / Logstash◦ZMQ
• In essence ntopng is a sort of gateway that can collect, self-produce (from packets), and export monitoring information by normalising it in format (JSON).
33
© 2018 - ntop.org
Part II:Network Monitoring and TimeSeries
34
© 2018 - ntop.org
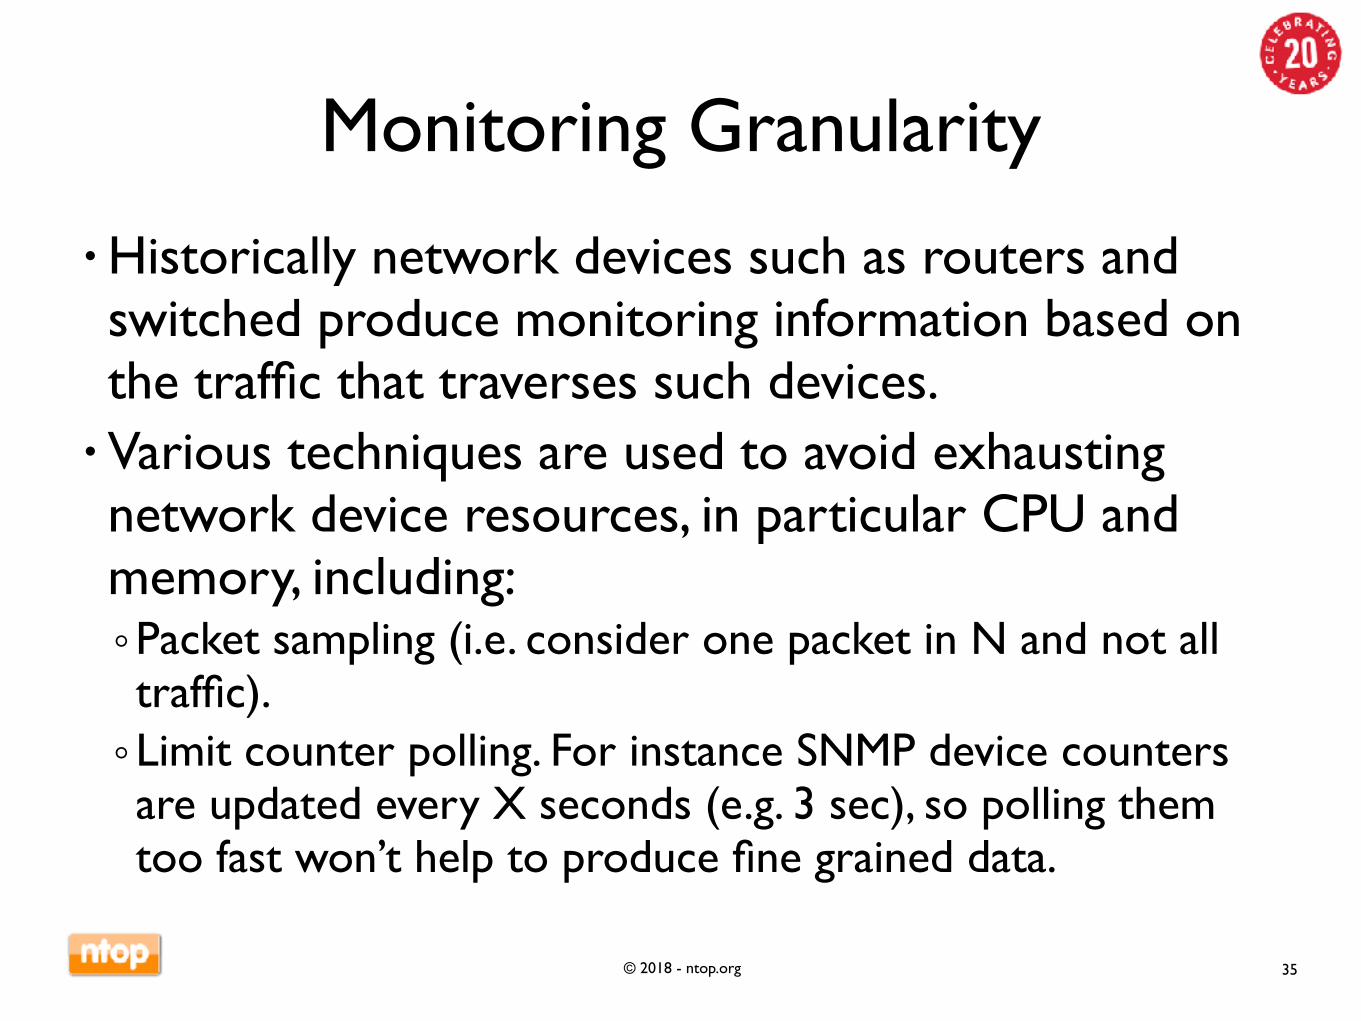
Monitoring Granularity
• Historically network devices such as routers and switched produce monitoring information based on the traffic that traverses such devices.
• Various techniques are used to avoid exhausting network device resources, in particular CPU and memory, including:◦Packet sampling (i.e. consider one packet in N and not all traffic).◦Limit counter polling. For instance SNMP device counters are updated every X seconds (e.g. 3 sec), so polling them too fast won’t help to produce fine grained data.
35
© 2018 - ntop.org
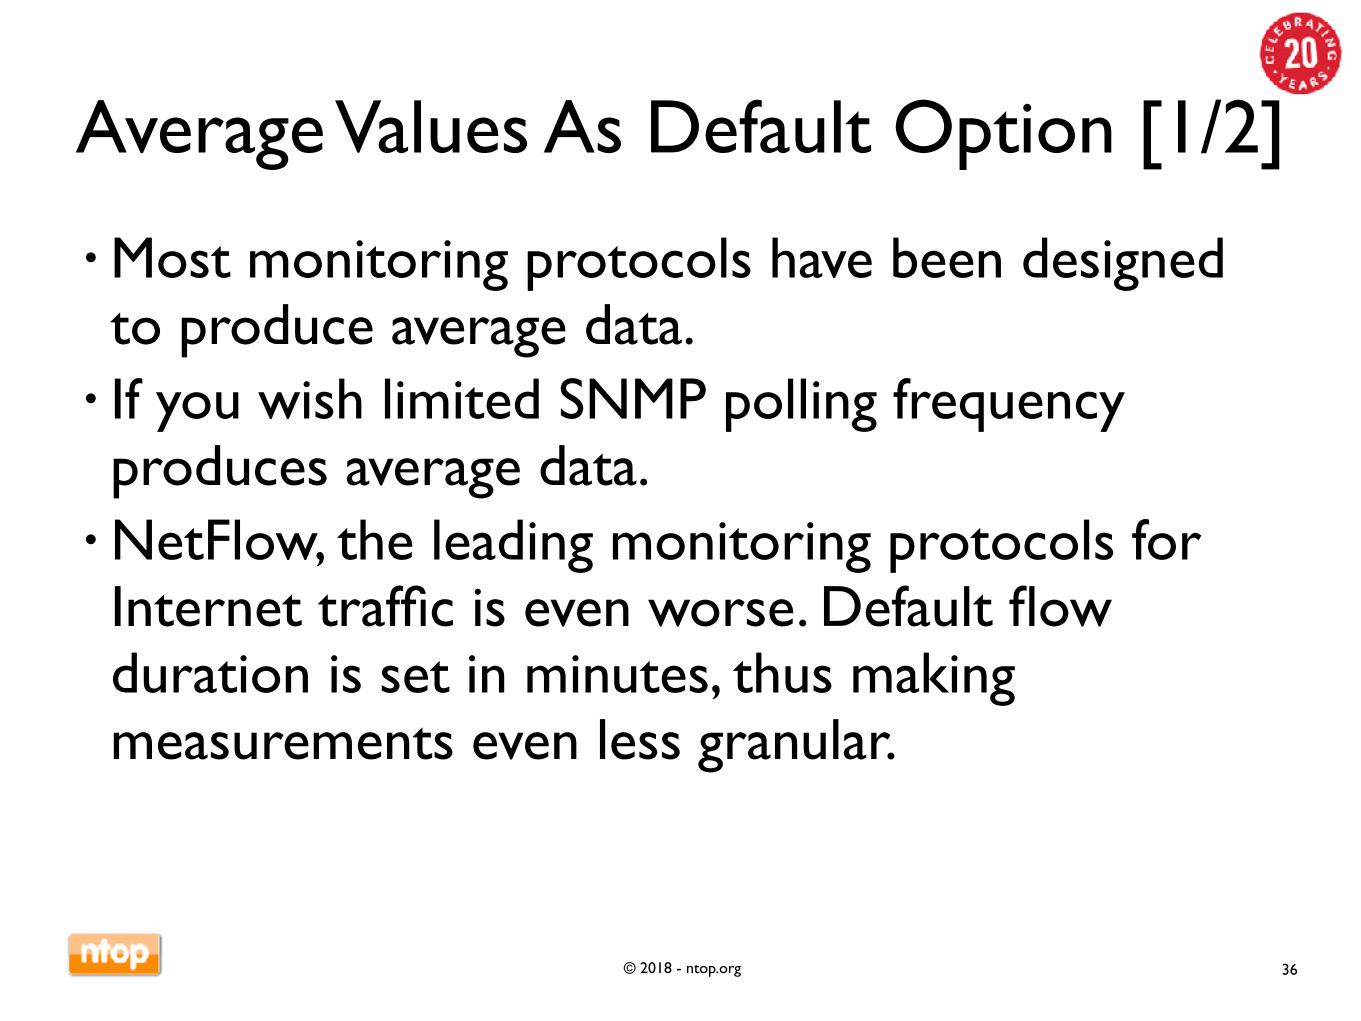
Average Values As Default Option [1/2]
• Most monitoring protocols have been designed to produce average data.
• If you wish limited SNMP polling frequency produces average data.
• NetFlow, the leading monitoring protocols for Internet traffic is even worse. Default flow duration is set in minutes, thus making measurements even less granular.
36
© 2018 - ntop.org
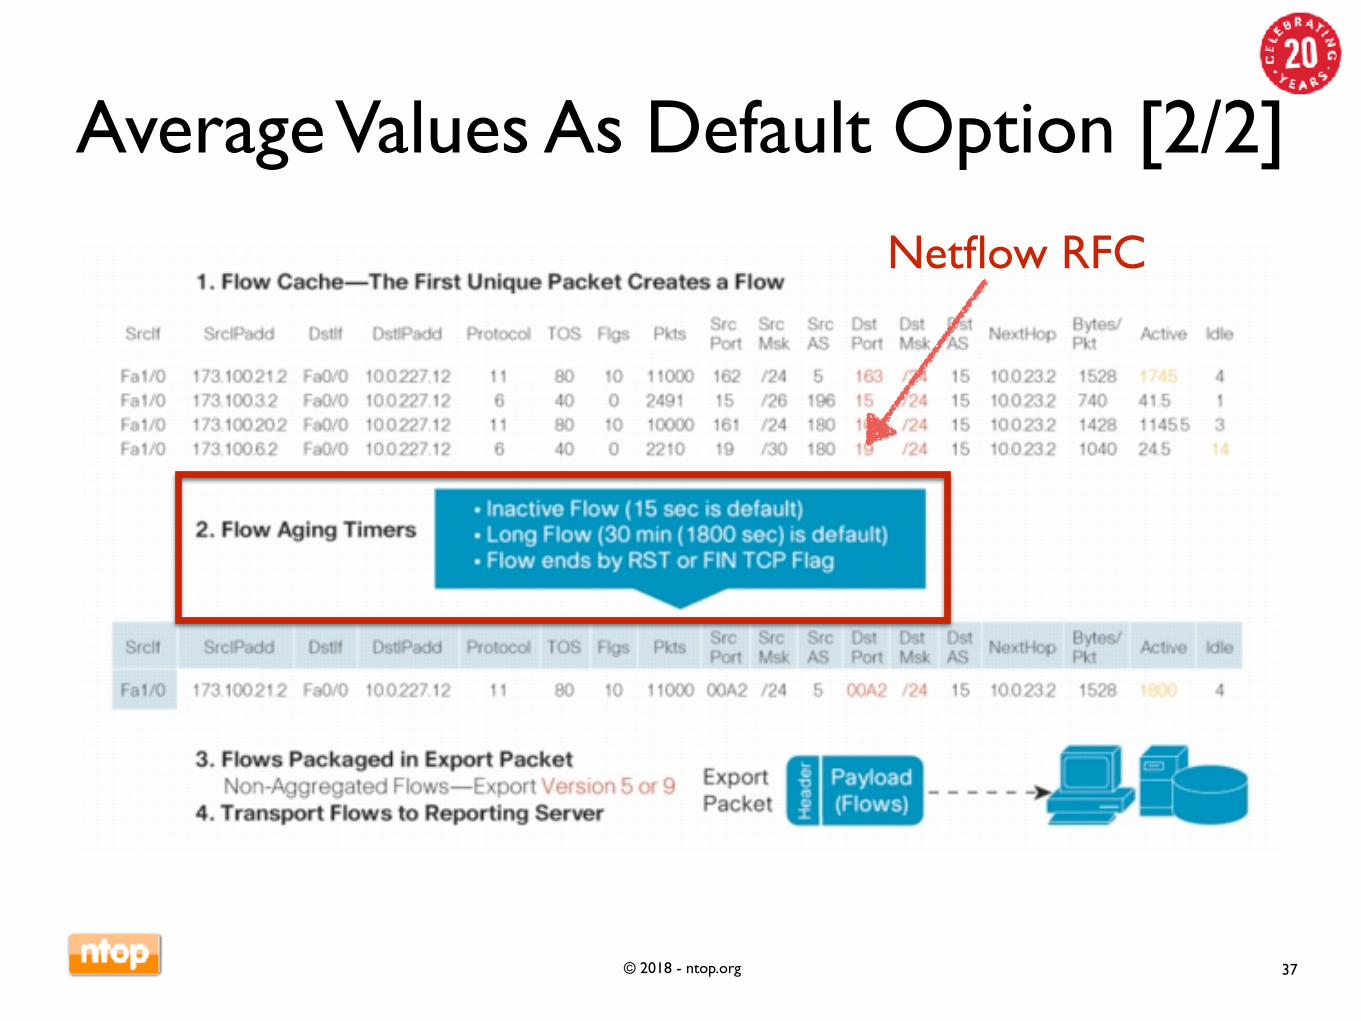
Average Values As Default Option [2/2]
37
Netflow RFC
© 2018 - ntop.org
ntopng Realtime Measurement
• The ntopng engine has been designed for realtime traffic measurement. It can report packet-based information in realtime and the engine can be polled continuously while processing traffic.
• While the user interface can be refreshed from 1-5 sec via Ajax/WebSocket, writing time series to disk can be difficult when the number of metrics is high in cardinality.
38
© 2018 - ntop.org
Metrics Cardinality: SNMP• Each interface has 5 counters (ifIn/outPackets, ifIn/outBytes, ifInErrors).
• Switches can have have a few ports (e.g. 24) or 500+ ports on core switches.
• SMEs can have a few (e.g. 4) switches, while ISP can have hundred of them.
• In summary ntopng has been designed to poll thousand ports across multiple switches. For this reason, unless sFlow is used, it is not possible to implement sub-minute polling (small networks) or sub-5 minute on larger networks in order to avoid putting too much load on devices or producing too much network traffic due to SNMP.
39
© 2018 - ntop.org
Metrics Cardinality: Internet Traffic [1/3]
• Usually traffic counters are kept one for local hosts (i.e. those that belong to the company being monitored).
• SMEs can have as low as 20 hosts (today this is the typical number of connected devices of a home, when considering IoT, tables, phones etc) or thousand of them.
• Even though nDPI supports ~240 protocols, most hosts do not use all of them, and usually they are limited to about 30 protocols/host.
40
© 2018 - ntop.org
Metrics Cardinality: Internet Traffic [2/3]
• In total a host has:◦4 counters in/out packets + in/out bytes per nDPI protocol (so in average 4 x 30 = 120)◦About 20 counters for other metrics such as retransmission, packets-out-of-order,…◦ In total in average 120+20 counters/host.
• In addition we need to add counters for additional elements such as visited autonomous systems, networks, countries etc.
41
© 2018 - ntop.org
Metrics Cardinality: Internet Traffic [3/3]
• In summary on a network with 254 hosts (a /24 CIDR) we have ~35-50k counters to save every minute.
• Further challenges:◦The number of these counters changes overtime (e.g. when a host is disconnected, no traffic is reported, so no counters are produced).◦Counters granularity is not homogeneous: interface counters are per second, host per minute, SNMP every 5 mins.◦ It would be desirable to have more find grained counters (a value every 5/10 sec) but this can significantly increase the complexity of our problem.
42
© 2018 - ntop.org
ntopng and Timeseries [1/4]
• ntopng has an embedded “crontab” that executes tasks:◦Per system (singleton), monitored interface (physical 1-3, logical up to 128).◦Every second, minute, 5 minute, hour, day.
• Tasks◦Second: Interface counters in/out packets/bytes, drops, packets out-of-order….◦5 Minutes: hosts and SNMP counters.
43
© 2018 - ntop.org
ntopng and Timeseries [2/4]
• RRD-based system used for historical reasons (ntop used it) and because it is file based (pro) that allows us to run it on the same host where ntopng runs with no external service dependency.
• Cons:◦Unable to cope with large number of hosts (5 mins are not enough) so we are unable to save all the data to disk.◦High load on the filesystem in particular on low-end/embedded devices that feature slow disks.
44
© 2018 - ntop.org
ntopng and Timeseries [3/4]
• RRD cons (cont).◦…old programming library designed as a tool rather than a library: every function call uses argc/argv.◦Thread support works but it is mostly a hack.◦Too many library dependencies even if ntopng uses it as time series database with no graph generation. ◦The library is not moving forward since a long time (5+ years) in terms of new developments and we do not expect this to change anytime soon. In essence this is at the moment a project in maintenance mode.
45
© 2018 - ntop.org
ntopng and Timeseries [4/4]
• Beside all these limitation in RRD design, the main driving force for replacing it in ntopng are:◦ Inability to easily compare timeseries! Select all hosts that in the past hour has made 20% up of traffic with respect to the previous hour.
!Trigger an alert when host X is sending/receiving double the traffic of the second top-sender in the last hour.
◦ Inability to handle long-term measurements without aggregation and “native” loss of precision (RRD basically implements always an average and if you insert 1 you will extract 0.999999999 that can be annoying sometimes).
46
© 2018 - ntop.org
What Alternatives to RRD? [1/2]
• Since a few years, timeseries databases are becoming popular, and there are many interesting projects.
• In 2014 ntop started to evaluate InfluxDB 0.x but we decided to wait a bit longer before integrating it into the project as it was not mature enough (the engine was under heavy changes, we had data loss during developments).
• In 2017, we decided that RRD was becoming a real bottleneck to ntopng evolution so we started to find a solution to this problem.
47
© 2018 - ntop.org
What Alternatives to RRD? [2/2]
• Out to the many timeseries databases we believe that the only two real options are InfluxDB and Prometheus, otherwise better to stay on RRD.
• ntopng currently supports both of them for data dump, but we have decided to bet in InfluxDB for a few reasons:◦Ecosystem (Chronograf….), vibrant community and company behind the project.◦Flexibility: we prefer to push data to Influx, rather than ntopng to be pulled as Prometheus does.◦Other ntop users use it in various projects and they are happy of performance and stability.◦Generic DB, not targeting a specific domain such as Prometheus.
48
© 2018 - ntop.org
How to Further Improve Influx
• Change the application design in LibInflux + InfluxDB (that uses libInflux and adds an ingest layer).
• Let local applications push data through LibInflux using a C/C++ API:◦No need of an intermediate text-based format.◦Less security headaches as there is no need to perform DB authentication or data encryption when pushing data to the database.◦Less overhead due to HTTP, no data loss when using UDP.
49
© 2018 - ntop.org
Influx Migration Implications [1/2]
• Create a timeseries Lua layer inside ntopng to allow people to use both RRD and Influx until the migration is completed.
• Mask RRD/Influx differences during data extraction:◦RRD has automatic data consolidation/rollup that instead we need to configure in Influx with continuous queries.◦RRD handles natively counters/gauges whereas on Influx we need to do that in queries.
50
© 2018 - ntop.org
Influx Migration Implications [2/2]
• Mask RRD/Influx differences (cont)◦ In RRD we set time the policy and data value boundaries at archive creation: in case our data is out of range, measurements are automatically discarded. In Influx we need to do that during data extraction so applications need to be aware of that.◦RRD normalises automatically (and sometimes this is not a plus) data at a specific resolution based on the query time-range: with Influx we have more precise measurements that are a good thing, but that have to be properly handled otherwise we end up having too many data points in graphs that will result in slow Ajax-based rendering.
51
© 2018 - ntop.org
Migration Progress
• Completed◦Data export to Influx via HTTP for all counters
• In progress (due this summer)◦ntopng rework to avoid periodic tasks and thus move from 5-min host counters to 1 minute or less. On small/medium networks we would like to go down to 5/10 seconds.◦Timeseries Lua library for hiding RRD/InfluxDB differences so that existing ntopng users can migrate to Influx and we can handle seamlessly RRD/InfluxDB in the ntopng GUI (completed data writing, missing reading).
52
© 2018 - ntop.org
Final Remarks
• InfluxDB is definitively a step forward with respect to RRD.
• The changes we had to do in our code to handle it were mostly due to the fact that ntopng was not sitting on top of a generic timeseries layer as it assumed RRD was living underneath.
• Removing the inability to monitor large networks with many counters and with low granularity is compulsory, and InfluxDB is definitively adequate for this task.
53


![High-speed Traffic Analysis Using ntopng: The New Features ... · Packets Never Lie [1/3] • Suppose that for specific hosts (e.g. for which an IDS has reported security issues)](https://img.pdfslide.us/doc/110x75/5fda8518a8434628f27d4a7e/high-speed-trafic-analysis-using-ntopng-the-new-features-packets-never-lie.jpg)


![Nagios core vs. nagios xi presentation power point.pptx [diperbaiki]](https://img.pdfslide.us/doc/110x75/58a44c4b1a28ab55068b48bb/nagios-core-vs-nagios-xi-presentation-power-pointpptx-diperbaiki.jpg)