Embed Size (px)
Citation preview
Proceedings of IOE Graduate Conference, 2015pp. 94–104
Network Structure and Economy: Modeling the Effect of RoadNetwork Connectivity on Gross Domestic ProductsBishnu Prasad Devkota1*1Nepal Engineering College, Centre for Post Graduate Studies, Pokhara University, Nepal*Corresponding author: [email protected]
AbstractThe effect on Gross Domestic Product (GDP) due to road network development in the territory is evaluated and amodel for the relationship between GDP and the road network development is being calibrated. Area of the landand the population plays an instrumental role for the development of road network. Two set of indicators, includinglink connectivity indices, road length, population, land coverage and physiographical regions as independent andGDP or economy as dependent are linked by statistical approach. The model thus formed is validated by usingcoefficient of determination or R2 value and the result was again validated for two districts. The population of thedistricts was found multiplicative effect to the GDP while the road network connectivity has exponential effects.Thus the results of this study have important implications for future road project investments. The results of thisresearch are also supported by the decision taken by Nepal government to develop ten new cities along the hillyregions of the country.
KeywordsRoad Network – Planar Graph Theory – Economy – Regression Analysis – Policy Implications
1. Introduction
1.1 Background
The connectivity of the road network has different eco-nomic and societal consequences. For the developmentof economy, transportation system, especially the roadsystem, plays an important role to the countries likeNepal. Road system undertakes the transport tasks ofhuman beings and goods. The most of the social and eco-nomic activities including working, recreation, freight,should use road networks and the success of these activi-ties highly depends on the performance of road systems.So the existence of a connected road network is essentialfor economic success of the country. However, rural roadnetwork in most of the developing countries like Nepalare still in poor condition and under developed. In ruralarea people spend much time and efforts on transportactivities to fulfill their basic needs, for example, ruralcommunities in Nigeria still do not have reliable accessto main road networks and or easily connected to motor-ized routes within their locality [1]. The rural transportnetwork system is, therefore, an essential requirement
for rural economic development.
If are affordable and appropriated for accessibility andconnectivity from farms-to-farms, farmstead-to-villagesas well as farmstead-to-local markets, provisions of allweather motorized roads is the essential conditions forrural development [2]. Rural road accessibility and con-nectivity as a set of policies seeks to promote the wellbeing of the rural and non-rural inhabitants by the meansof supplying agricultural products both to the local mar-kets as well as secondary industries in the sub-urbanand in the urban centers [3]. It is also pointed out that,improved accessibility as well as highly connected roadwill create market for agricultural products, opens upnew land for economic opportunities and at the sametime encourages farmers to improved on their variousfarming in other to increase agricultural productivity andas well reduces spoilage and wastage of agricultural pro-duce at various collection centers in Kolanut productionin Nigeria [4]. It is obvious that the development of roadinfrastructure generate more income thereby enhancingthe gross product of selected territory. However, themain concern of the researcher is to assess how these
Proceedings of IOE Graduate Conference, 2015
road networks and their connectivity affects the economyof the territory.
The most significant finding from [5] is that rural roadshave benefit-cost ratios for national GDP that are aboutfour times greater than benefit-cost ratios for high qualityroads. Nepal’s road network annually increased by 6.7%between fiscal year 1995/96 and fiscal year 2003/04,with the largest expansion occurring in roads classifiedas ”district or rural roads”, which grew annually by 11%during this period [6]. Road density expressed in lengthper unit area of land (km/km2) or length in thousandof population (km/1,000 population) or length per uniteconomic activity (km/1 million of GDP) has been usedcommonly as a proxy for rural accessibility and the per-centage of paved road as a measure of the quality of ruralaccess. Bangladesh is well endowed with rural roads(a road density of 1.84km/km2 compared to an averageof 0.84km/km2 for South Asia). In Sri Lanka, 81% ofthe road network is paved. It is also possible to haveaccessibility without “good” mobility (as characterizedby motorable all-weather roads), as in Nepal’s mountaindistricts where a system of engineered trails and suspen-sion foot bridges, pioneered with Swiss assistance, hasradically cut down on travel time and improved access tomarkets and services [7]. Accessibility is not dependenton mobility, and neither is good mobility a sufficient ornecessary condition for good accessibility [6].
1.2 Objectives
objective of this study is to model the effect of the roadnetwork connectivity with the economy of the territory.The specific objectives are:
• To assess the indicators of road network connec-tivity in terms of measures and indices based onplanner graph theory.
• To assess the effect of instrumental parameters:population and area of land and the factored vari-ables on the economy
• To develop regression models between districteconomy and road network connectivity and fi-nally recommend a best fit model
2. Literature Review
2.1 Road Network and Economy
As the road links districts, regions and people together,it shall be taken as a means of social and economicdevelopment [8]. The development of efficient road net-work is the way for enhancing mobility and accessibilitywhich reduces the ravel time and cost. Thus transport net-work is important for social development [9] along witheconomic development [10]. The social and economicdevelopment associated with road network provides bet-ter access to education, health, delivery, employmentopportunities and thus increasing the household incomethere by reducing poverty [5]. Moreover, road develop-ment shall also enhance an area’s economic developmentby providing basic infrastructure for investment and har-nessing of local and regional economic developmentpotential [11] and also increases tourism flow [12]. Thefindings by [13] reveal that the total road network hassignificant growth spurring impact. When the network isdisaggregated, asphalt road also has a positive sectoralimpact, but gravel roads fail to significantly affect bothoverall and sectoral GDP growth, including agriculturalGDP.
Despite of these in social and economic benefits, theroad networks are also perceived as negative ecologicaleffects on culture. Transportation infrastructure affectsthe structure of ecosystems, the dynamics of ecosystemfunction, and has direct effects on ecosystem compo-nents, including their species composition. Clearly, theconstruction of transport lines results in the direct de-struction and removal of existing ecosystems, and thereconfiguration of local landforms. However, transporta-tion systems, and more specifically, roads, have a widevariety of primary, or direct, ecological effects as wellas secondary, or indirect, ecological effects on the land-scapes that they penetrate. The effects of roads canbe measured in both abiotic and biotic components ofterrestrial and aquatic ecosystems [14].
Besides these threats, transportation network providesaccess to farmlands, school, work zone and settlementzones there by reducing travel time and cost. Thus,farmers tend to increase agricultural productivity by ex-panding crop production along developed roads whichultimately results in changed land use and thus growingthe region’s economy [11]. Alvarez and Blazquez, 2014[15] were recommend that the both public and privatesectors actively encourage investment in transport infras-
95
Network Structure and Economy: Modeling the Effect of Road Network Connectivity on Gross DomesticProducts
tructures in order to improve productivity growth andeconomic activity. The rapid development of road inNepal is found growing since 1950. Tribhuwan Rajpathwas opened to traffic since 1956 AD as a fist highwayin Nepal. In 2014 cabinet has amended 12424 km asstrategic road network [16]. However the history of ruralroads is short and is started after 1993. Based on ruralroad statistics by DoLIDAR in 2013 AD, about 51,000km of local roads is being constructed in Nepal [17].However most of them are fair weather tracks, theseroads plays important role for the development of therural part of the country.
2.2 Network Robustness
Road network robustness is the insusceptibility of a roadnetwork to disturbing incidents, and could be understoodas the opposite of network vulnerability. In other words,road network robustness is the ability of a road networkto continue to operate correctly across a wide range ofoperational conditions [18] and [19].
2.3 Network Reliability
Several understandings about road network reliabilityexist from different interests in the research objectives.The most accepted definition of the network reliability isgiven by Billington and Allan 1992 as cited by li 2008[20] as: “Reliability is the probability of a road networkperforming its proposed service level adequately for theperiod of time intended under the operating conditionsencountered.” The prioritization of investments in roadnetworks based on vulnerability indicators is still a rela-tively underexplored approach [21].
3. Methodology
3.1 Study Area
The population for the study covers all 75 districts ofNepal. The the study rely on road network data pre-sented on District Transport Master Plan (DTMP) asdeveloped by Ministry of Local Development and Fed-eral Affairs (MoLDFA). So the random systematic ran-dom sampling technique is applied to for the selectionof districts, DTMP of which are available by May, 2015including all physiographical and development regionsof the country. The location of physiographical regions
as given in [22] for total 25 districts that were consideredfor the development of the models are:
Mountainous Region: Sangkhuwasabha, Sindhupal-chowk, Manang, Humla, JumlaHilly Region: Dadelkhura, Doti, Achham, Dailekh,Rukum Palpa, Parbat, Kaski, Bhaktapur, Ramechhhap,Kathmandu, Okhaldhunga, Khotang, Bhojpur, PanchtharTerai Region: Sunsari, Saptari, Sindhuli, Chitwan,Makawanpur, Kapilvastu, Kailali
The validation of the model thus developed is done basedon statistical approach. Again the results of the model istested for Sindhuli and Bhojpur districts.
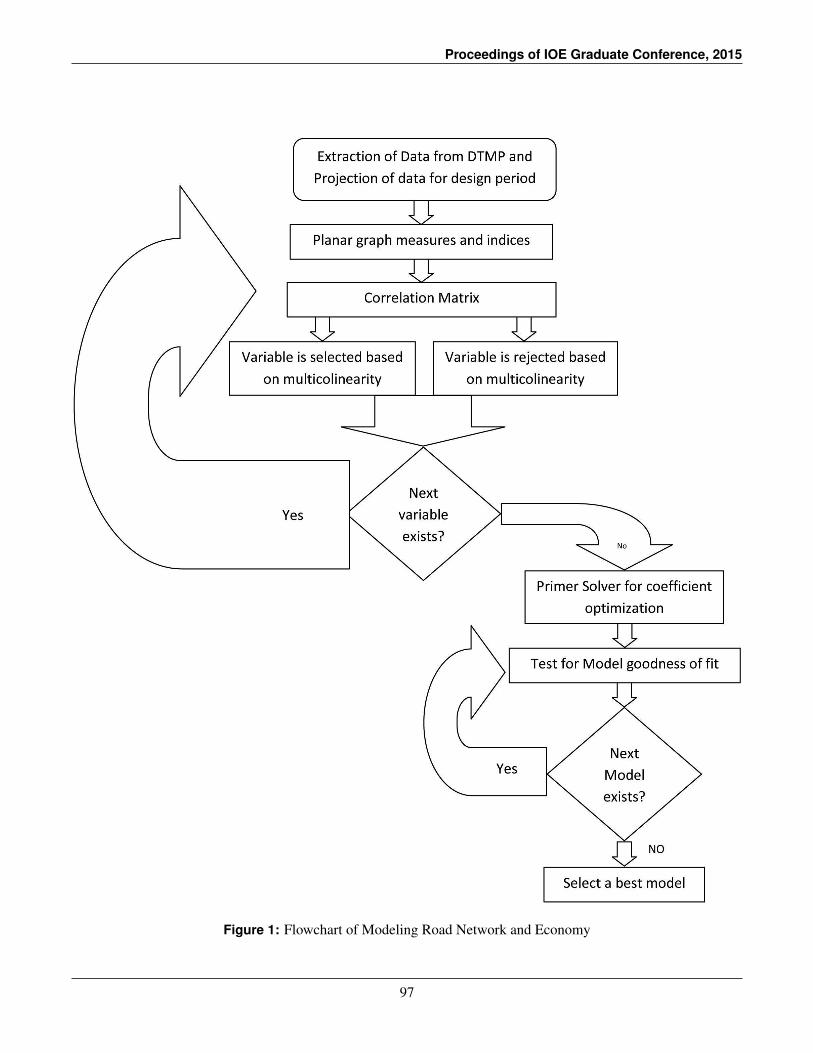
3.2 Research Design
The Flow Chart of Modeling Road Network and Econ-omy has shown in Figure 1.
3.3 Graph theory-based measures and indices
The connection and arrangement of a road network isusually abstracted in network analysis as a directed pla-nar graph G=(v,e), where ’v’ is a collection of nodesor vertices that are connected by directional links ’e’(edges) [23]. The study by Patarasuk 2013 [11] usesgraph theory-based concepts in Lop Buri province, Thai-land by employing alpha (a), beta (b), and gamma (c)indices to determine road connectivity. These indicesare commonly used as measures of the levels of circuitry,complexity, or connectivity, respectively, in a network.In general, the higher the values of these indices, thehigher degree of circuitry, complexity, and connectiv-ity. Connectivity index algorithms used in the study arebased on planar graphs, or graphs that can be made tolie in a plane such that no edges intersect at a point otherthan a node or vertex [24]. Network indices: a, b, and chave the following equations:
al phaindex,a =C
Cmax=
e− v+12v−5
(1)
betaindex,b =ev
(2)
gammaindex,c =e
emax=
e3v−6
(3)
96
Proceedings of IOE Graduate Conference, 2015
Figure 1: Flowchart of Modeling Road Network and Economy
97
Network Structure and Economy: Modeling the Effect of Road Network Connectivity on Gross DomesticProducts
Where e is the number of links and v is the number ofnodes of the road network system.
In this study, an edge or link refers to a road segment anda node or vertex refers a point of an intersection whereat least two road segments meet. Each of these indiceswas calculated for each district to measure the dynamicsof road connectivity in districts.
Minimum Spanning Tree
In the graph theory, the minimum spanning tree is thenetwork or connectivity in which there is one and onlyone, sequence of edges between any two pairs of nodes.In MST network removal of any edge from the graphwill divide the network into two disconnected parts andthe number of edges will always be one less than num-ber of vertices/nodes. If number of nodes are ‘v’ thencorresponding edges in MST network would be
emin = (v–1) (4)
From the distance sheet extracted from the network di-agram, minimum spanning tree is obtained. Prim’s al-gorithm is a greedy algorithm that finds a minimumspanning tree for a weighted undirected graph. Thismeans it finds a subset of the edges that forms a treethat includes every vertex, where the total weight of allthe edges in the tree is minimized. The algorithm oper-ates by building this tree one vertex at a time, from anarbitrary starting vertex, at each step adding the cheap-est possible connection from the tree to another vertex.The connectivity coefficients for MST would were deter-mined using the equation 1, 2, 3 and 4.
3.4 Gross Domestic Products
Gross domestic product (GDP) at market prices is theexpenditure on final goods and services minus imports:final consumption expenditures, gross capital formation,and exports less imports. GDP is one of the primaryindicators used to gauge the health of a country’s econ-omy. It represents the total monetary value of all goodsand services produced over a specific time period - asthe size of the economy. This indicator is measured incurrency amount (Local Currency or USD) per capita(GDP per capita) [25]. Gross domestic product can becalculated using the following formula [26]
GDP =C+G+ I +NX (5)
Where, ”C” is equal to all private consumption, or con-sumer spending, in a nation’s economy, ”G” is the sum ofgovernment spending, ”I” is the sum of all the country’sbusinesses spending on capital and ”NX” is the nation’stotal net exports, calculated as total exports minus totalimports (NX = Exports - Imports).
3.5 Statistical Analysis
Regression analysis is a statistical process for estimat-ing the relationships among variables. It includes manytechniques for modeling and analyzing several variables,when the focus is on the relationship between a depen-dent variable and one or more independent variables (or’predictors’). Simple regression, Multiple regression,Factorial regression, Polynomial regression, Responsesurface regression, Mixture surface regression, One-wayANOVA, Main effect ANOVA, Factorial ANOVA, Anal-ysis of covariance (ANCOVA), Homogeneity of slopesare the frequently used tools of regression analysis. Theconcept of these analysis shall be formulated as:
Y = f (X1,X2,X3,X4, . . . . . .Xn) (6)
Where, Y=Dependent Variable, based on economy andX1,X2,X3............ are independent variables based onnetwork connectivity and salient features of the districtor region The analysis shall be performed by using SPSSversion 16 and Microsoft Office Excel-2007.
Building the Whole Model:Partitioning Sums of Squares
A fundamental principle of least squares methods is thatthe variation on a dependent variable can be partitioned,or divided into parts, according to the sources of thevariation. Suppose that a dependent variable is regressedon one or more predictor variables, and that for conve-nience the dependent variable is scaled so that its meanis ’zero’. Then a basic least squares identity is that thetotal sum of squared values on the dependent variableequals the sum of squared predicted values plus the sumof squared residual values. Stated more generally,
∑(y− y)2 = ∑(y− y)2 +∑(y− y)2 (7)
where the term on the left is the total sum of squared de-viations of the observed values on the dependent variablefrom the dependent variable mean, and the respectiveterms on the right are (1) the sum of squared deviations
98
Proceedings of IOE Graduate Conference, 2015
of the predicted values for the dependent variable fromthe dependent variable mean and (2) the sum of thesquared deviations of the observed values on the depen-dent variable from the predicted values, that is, the sumof the squared residuals. Stated yet another way,
TotalSS = ModelSS+ErrorSS (8)
Note that the Total SS is always the same for any par-ticular data set, but that the Model SS and the Error SSdepend on the regression equation. Again the coefficientof determination value shall be computed as:
R2 =ModelSSErrorSS
(9)
Building the Whole Model: Testing the Whole Model
Given the Model SS and the Error SS, one can perform atest that all the regression coefficients for the X variablesare zero. This test is equivalent to a comparison of the fitof the regression surface defined by the predicted values(computed from the whole model regression equation)to the fit of the regression surface defined solely by thedependent variable mean (computed from the reducedregression equation containing only the intercept). Thewhole model hypothesis mean square
MSH = (ModelSS)/k (10)
where k is the number of columns of X (excluding theintercept column), is an estimate of the variance of thepredicted values. The error mean square
s2 = MSE = (ErrorSS)/(n− k−1) (11)
where n is the number of observations, is an unbiased es-timate of the residual or error variance. The test statisticis
F = MSH/MSE (12)
where F has (k, n - k - 1) degrees of freedom. The step-wise regression is used by [27] to calibrate the regressionmodel. The basic procedures of stepwise regression in-volve
1 Identifying an initial model,
2 Iteratively ”stepping,” that is, repeatedly alteringthe model at the previous step by adding or re-moving a predictor variable in accordance withthe ”stepping criteria,” and
3 Terminating the search when stepping is no longerpossible given the stepping criteria, or when aspecified maximum number of steps has beenreached.
Building Models via Best-Subset Regression All-possible-subset regression can be used as an alternative to orin conjunction with stepwise methods for finding the”best” possible submodel. Neter, Wasserman, and Kut-ner (1985) [28] discuss the use of all-possible-subsetregression in conjunction with stepwise regression ”Alimitation of the stepwise regression search approach isthat it presumes there is a single ”best” subset of X vari-ables and seeks to identify it. As noted earlier, there isoften no unique ”best” subset. Hence, some statisticianssuggest that all possible regression models with a similarnumber of X variables as in the stepwise regression solu-tion be fitted subsequently to study whether some othersubsets of X variables might be better.” This reasoningsuggests that after finding a stepwise solution, the ”best”of all the possible subsets of the same number of effectsshould be examined to determine if the stepwise solu-tion is among the ”best.” If not, the stepwise solution issuspect.
All-possible-subset regression can also be used as analternative to stepwise regression. Using this approach,one first decides on the range of subset sizes that couldbe considered to be useful. Several different criteria canbe used for ordering subsets in terms of ”goodness.” Themost often used criteria are the subset multiple R-square,adjusted R-square, and Mallow’s Cp statistics. When all-possible-subset regression is used in conjunction withstepwise methods, the subset multiple R-square statisticsallows direct comparisons of the ”best” subsets identifiedusing each approach[28].
4. Data collection
Following continues and categorical data were collected
• Road Network data
– Road length (SRN, DCRN, VCRN)
– Number of Nodes and Linkages
• Demographic Data
– Population
99
Network Structure and Economy: Modeling the Effect of Road Network Connectivity on Gross DomesticProducts
• Geographic data
– Terrain Type
– Area of Land
• Economic data
– GDP
Total 30 DTMPs are collected from DoLIDAR [29]in 2015. All the existing road network data were ex-tracted including number of linkages and road classifica-tion (SRN, DCRN, VR, UR). Demographic and physio-graphic data were taken from Central Bureau of Statistics(CBS) reports-2011. The population data thus collectedwas made projection to the period at which the existingDTMP report was prepared. Again the GDP data werecollected from United Nation Development Program(UNDP) [30] and was projected to the year just nextof the year mentioned on DTMP reports using nationalgrowth rate. Thus the aggregate of the variable on whichthe research is based on shall be presented as:
• Dependent Variable
– GDP of the districts
• Independent Variables
– Alpha, beta and gamma indices of exist-ing, delta and MST network including 9-variables
– Population
– Land area
– Road Length (SRN, DCRN, VR, UR)
– Total road length
– Total road length
– Physiographical region: mountainous, hillsand terai
• Factored Variables
– Alpha, beta and gamma
– indices for (delta-existing), (existing- MST),(delta-existing-MST) network including 9-variables
– Product of Alpha*beta*gamma indices
– Road density per square kilometer area
– Road density per 1000 population
5. Results and Discussions
5.1 Variable Selection Process
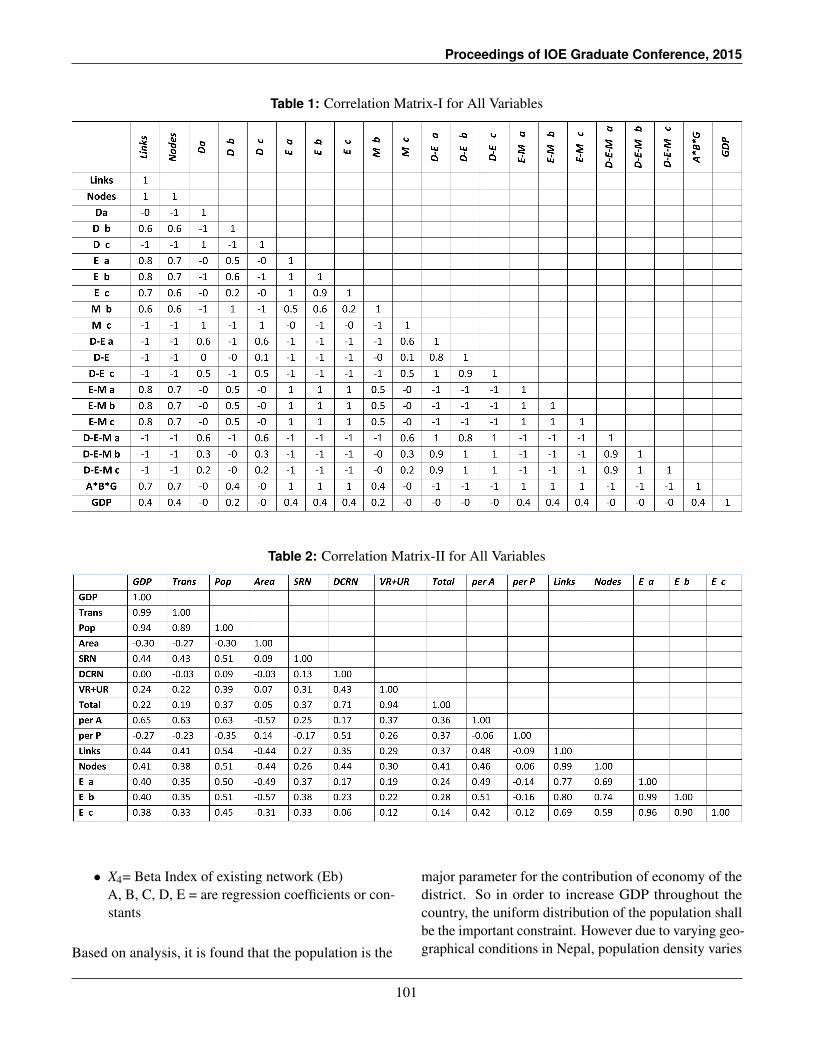
Based on correlation matrix, it has observed that most ofthe network indicators are correlated: links, nodes, alpha,beta, gamma indices for delta, existing and MST networkand their factored variables. So, it is good decision toconsider only one network indicator in order to preventmulticolinearity effect. The variable selected for thisstudy is the ‘beta’ index, which has found with higherrelation to GDP of the district and also used by [31] inhis model. Road density per square kilometer area wasfound highly related with GDP than per 1000 popula-tion. However, the population itself is found stronglyrelated with the economy of the district, so it is consid-ered for model calibration. Among different classifiedroads, SRN was found high relation with GDP whetherthe VR and UR are strongly related with the local peoplebenefits. This is also supported by the findings of [5]in china that the high priority roads are important foroverall economic development and local roads are forpoverty reduction. Thus the selected variables consider-ing higher effect with economy and preventing multicol-inearity based on correlation matrix tables presented inTable 1 and Table 2, are:
• Population (pop)
• Existing Beta index (Eb)
• Road density per square kilometer area (PerA)
• Length of SRN (SRN)
5.2 Model Calibration
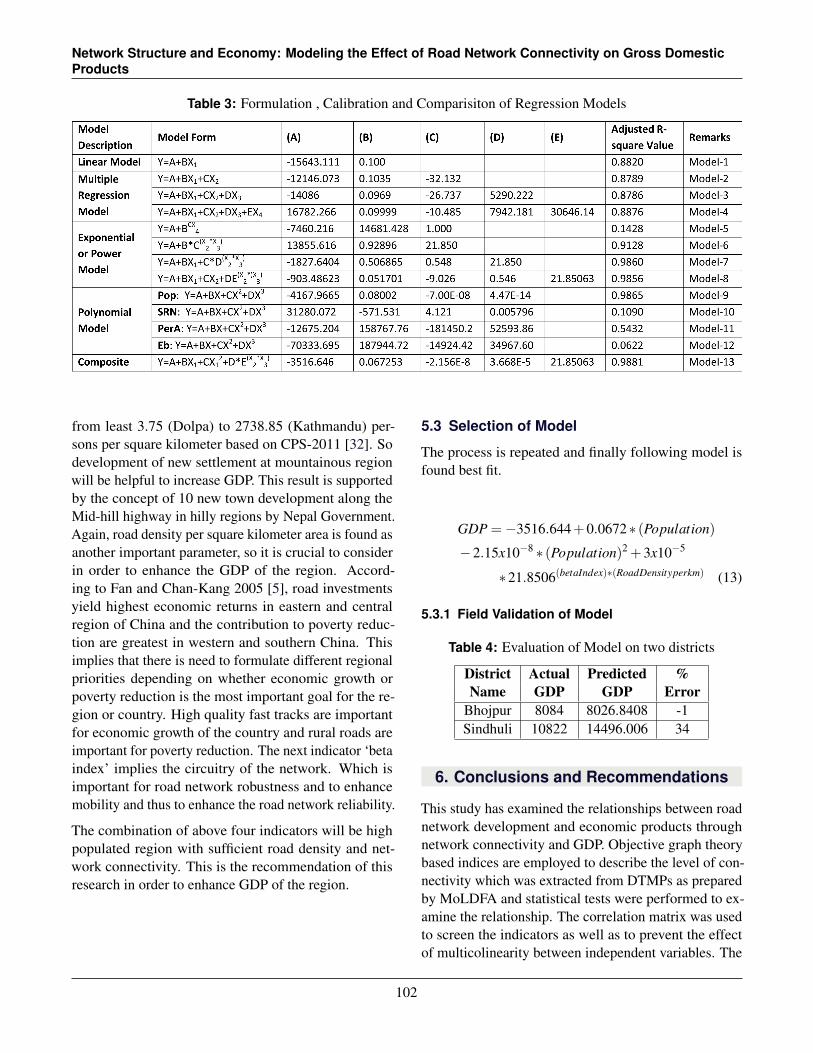
The regression analysis is performed for various formof the model and the goodness of fit is tested in order todetermine the best fit model. The result statistics of thevarious models are presented in Table 3, where
• X1=Population (Pop)
• X2= Length of SRN (SRN)
• X3= Road density per square kilometer area (PerA)
100
Proceedings of IOE Graduate Conference, 2015
Table 1: Correlation Matrix-I for All Variables
Table 2: Correlation Matrix-II for All Variables
• X4= Beta Index of existing network (Eb)A, B, C, D, E = are regression coefficients or con-stants
Based on analysis, it is found that the population is the
major parameter for the contribution of economy of thedistrict. So in order to increase GDP throughout thecountry, the uniform distribution of the population shallbe the important constraint. However due to varying geo-graphical conditions in Nepal, population density varies
101
Network Structure and Economy: Modeling the Effect of Road Network Connectivity on Gross DomesticProducts
Table 3: Formulation , Calibration and Comparisiton of Regression Models
from least 3.75 (Dolpa) to 2738.85 (Kathmandu) per-sons per square kilometer based on CPS-2011 [32]. Sodevelopment of new settlement at mountainous regionwill be helpful to increase GDP. This result is supportedby the concept of 10 new town development along theMid-hill highway in hilly regions by Nepal Government.Again, road density per square kilometer area is found asanother important parameter, so it is crucial to considerin order to enhance the GDP of the region. Accord-ing to Fan and Chan-Kang 2005 [5], road investmentsyield highest economic returns in eastern and centralregion of China and the contribution to poverty reduc-tion are greatest in western and southern China. Thisimplies that there is need to formulate different regionalpriorities depending on whether economic growth orpoverty reduction is the most important goal for the re-gion or country. High quality fast tracks are importantfor economic growth of the country and rural roads areimportant for poverty reduction. The next indicator ‘betaindex’ implies the circuitry of the network. Which isimportant for road network robustness and to enhancemobility and thus to enhance the road network reliability.
The combination of above four indicators will be highpopulated region with sufficient road density and net-work connectivity. This is the recommendation of thisresearch in order to enhance GDP of the region.
5.3 Selection of Model
The process is repeated and finally following model isfound best fit.
GDP =−3516.644+0.0672∗ (Population)
−2.15x10⁻⁸ ∗ (Population)2 +3x10−5
∗21.8506(betaIndex)∗(RoadDensityperkm) (13)
5.3.1 Field Validation of Model
Table 4: Evaluation of Model on two districts
District Actual Predicted %Name GDP GDP Error
Bhojpur 8084 8026.8408 -1Sindhuli 10822 14496.006 34
6. Conclusions and Recommendations
This study has examined the relationships between roadnetwork development and economic products throughnetwork connectivity and GDP. Objective graph theorybased indices are employed to describe the level of con-nectivity which was extracted from DTMPs as preparedby MoLDFA and statistical tests were performed to ex-amine the relationship. The correlation matrix was usedto screen the indicators as well as to prevent the effectof multicolinearity between independent variables. The
102
Proceedings of IOE Graduate Conference, 2015
results show that even though the total length of roadsin the study area increases, the economy not always so.Which shall be due to the fact that the connectivity shallnot increases as length increases as the network indicesare related with circuitry and complexity of the road net-work structures rather than the length and type of road.The most evident relationships are found between popu-lations with GDP and finally the study has shown thatthe road network indices in combination with the roaddensity per unit area of land greatly affect the economyof the districts. The population of the districts was foundmultiplicative effect to the GDP while the road networkindices have exponential effects. Thus the study have im-portant implications for future road project investmentsand the results are also supported by the decision takenby Nepal government to develop ten new cities along thehilly regions of the country.
Acknowledgments
The author would like express sincere thank to Assoc.Prof. Dr. Thusitha Chandani Shahi for continues motiva-tion and guidance during preparation of this paper. Theauthor would like to thank the following research groupfor collecting data from respective districts: AdityaPaudel (Dailekh), Akash Khanal (Palpa), Apsara Shrestha(Kailali), Ashok Dhakal (Manang), Bel Bhahadur Nepali(Kathmandu), Betan Raj Sharma Dumre (Dadeldhura),Bimal Khadka (Panchthar), Binod Shrestha (Ramech-hap), Deependra Adhikari (Sindhupalchowk), DipendraLamichhane (Sindhuli), Janardan Bhandari (Makawan-pur), Manda Panta (Parbat), Manish Kumar Shah (Morang),Manohar Sedhain (Humla), Naba Raj KC (Khotang),Narayan Prasad Lamichhane (Chitwan), Navin Sunam(Jhapa), Nirmal K.B. Chaudhari (Saptari) Pradeep ManiNiraula (Sankhuwasabha), Prakash Ghimire (Dolakha),Ram Chandra Chaudhary (Jumla), Sabin Ghimire (Sun-sari), Sabin Pokhrel (Doti), Satkar Shrestha (Rukum),Shekahr Jha (Okhaldhunga), Suman Gautam (Bhojpur),Sunita kharbuja (Bhaktapur), Suraj Bhattarai (Kapil-vastu), Suresh Baral (Kaski), Trilok Chandra Bist (Achham).
References
[1] Ale Adeniyi. Graph measurement of road network con-ncetivity and accessibility on farming activities in akokosouth west local government area of ondo state, nigeria.9:1258–1265, 2014.
[2] International Bank for Reconstruction and World BankDevelopment. Forests sourcebook practical guidancefor sustaining forests in development cooperation, 2008.
[3] A. S. Ale. Rural transportation and food crop productionin akoko south west local government area of ondo state.Jornal of Environment, 02(05):112–120, 2013.
[4] A. O. Ajiboye and O. Afolayan. The impact of trans-portation on agricultural production in a developingcountry: A case of kolanut production in nigeria. Inter-national Journal of Agricultural Economics and RuralDevelopment, pages 49–57, 2009.
[5] Shenggen Fan and Connie Chan-Kang. Road develop-ment, economic growth, and poverty reduction in china.2005.
[6] The World Bank SA 1 Infrastructure Division.Bangladesh: Rural infrastructure strategy study, 1996.
[7] Asif Faiz. The Promise of Rural Roads Review ofthe Role of Low-Volume Roads in Rural Connectivity,Poverty Reduction, Crisis Management, and Livability.TRB Low-Volume Roads Committee, 2012.
[8] Ricardo Hausmann and Cesar A Hidalgo. The networkstructure of economic output. Springer Science andBusiness Media, 2011.
[9] P. Fouracre. SOCIAL BENEFITS OF RURAL TRANS-PORT. TRL Limited, 2001.
[10] Michael Iacono and David Levinson. Mutual causalityin road network growth and economic development.Transport Policy, 2015.
[11] Risa Patarasuk. Road network connectivity and land-cover dynamics in lop buri province, thailand. Roadnetwork connectivity and land-cover dynamics in LopBuri province, Thailand, pages 111–123, 2013.
[12] Tzung-Cheng Huanb Tao Hong, Tao Ma. Networkbehavior as driving forces for tourism flows. Journal ofBusiness Research, 2014.
[13] Ibrahim Worku. Road sector development and eco-nomic growth in ethiopia. EDRI Working Paper 4. Ad-dis Ababa, Ethiopia: Ethiopian Development ResearchInsitute, 2012.
[14] A. W. Coffin. From roadkill to road ecology: A reviewof the ecological effects of roads. Journal of TransportGeography, 15:396–406, 2007.
[15] Inmaculada C. Alvarez and Reyes Blazquez. The influ-ence of the road network on private productivity mea-sures using data envelopment analysis: A case studyfrom spain. Transportation Research Part A, 65:33–43,2012.
[16] DoR. Statistics of strategic road network. Technicalreport, Department of Roads, 2014.
[17] A. J. Thapa. Status paper on road safety in nepal. Tech-nical report, Department of Roads, 2013.
[18] W. Ellensa and R.E. Kooij. Graph measures and networkrobustness. 2013.
103
Network Structure and Economy: Modeling the Effect of Road Network Connectivity on Gross DomesticProducts
[19] I. Yperman B. Immers, J. Stada and A. Bleukx. Towardsrobust road network structures. Slovak Journal of CivilEngineering, 4:10–17, 2004.
[20] Minwei Li. Robustness Analysis for Road Networks,A framework with combined DTA models. PhD thesis,Delft University of Technology, 2008.
[21] Eduardo Leal de Oliveira, Licınio da Silva Portugal, andWalter Porto Junior. Determining critical links in a roadnetwork: vulnerability and congestion indicators. InPANAM 2014, editor, Social and Behavioral Sciences,162, pages 157–167, 2014.
[22] Jitendra Sahayogee. Geography of nepal : Himalayas,hills and terai region, 2015.
[23] Feng Xie and David Levinson. Measuring the structureof road networks. Geographical Analysis, 2006.
[24] E K Morlok. An analysis of transport technology andnetwork structure. Transportation Center NorthwesternUniversity, 1967.
[25] Organisation for Economic Co-operation and Develop-ment (OECD). Gross domestic product (gdp). Technicalreport, OECD, 2015 December 2014.
[26] Experimental Economics Center. National income ac-counting, calculating gdp, 2006.
[27] Muhammad A. Razi and Kuriakose Athappilly. A com-parative predictive analysis of neural networks (nns),nonlinear regression and classification and regressiontree (cart) models. Expert Systems with Applications,29:65–74, 2005.
[28] J. Neter, W. Wasserman, and M.H. Kutner. Appliedlinear statistical models: regression, analysis of vari-ance, and experimental designs. Number no. 469 inApplied Linear Statistical Models: Regression, Analy-sis of Variance, and Experimental Designs. R.D. Irwin,1985.
[29] Department of Local Infrastructure Development andAgriculture Roads. District transport master plan,March 2015.
[30] Nepal Gonernment National Planning Commission andUnited Nation Development Program. Nepal human de-velopment report beyond geography, unlocking humanpotential, 2014.
[31] E. Jenelius. Network structure and travel patterns: Ex-plaining the geographical disparities of road networkvulnerability. 2008.
[32] ICIMOD. Mapping nepal census indicators 2001 andtrends. Technical report, ICIMOD, 2003.
104