Embed Size (px)
Citation preview

NETWORK PLANNING
IN ASSOCIATION WITH
2019

NETWORK PLANNING 2019
FlightGlobal | 3 2 | FlightGlobal
NETWORK PLANNING 2019
CONTENTSAirline profits 4-5Leading airline groups by traffic 6-9Airport leaders 10-11Top 100 airports by traffic 12-13Airline start-ups and suspensions 14-15
The information contained in our databases and used in this presentation has been assembled from many sources, and whilst reasonable care has been taken to ensure accuracy, the information is supplied on the understanding that no legal liability whatsoever shall attach to FlightGlobal, its offices, or employees in respect of any error or omission that may have occurred.
© 2019 FlightGlobal,part of DVV Media International
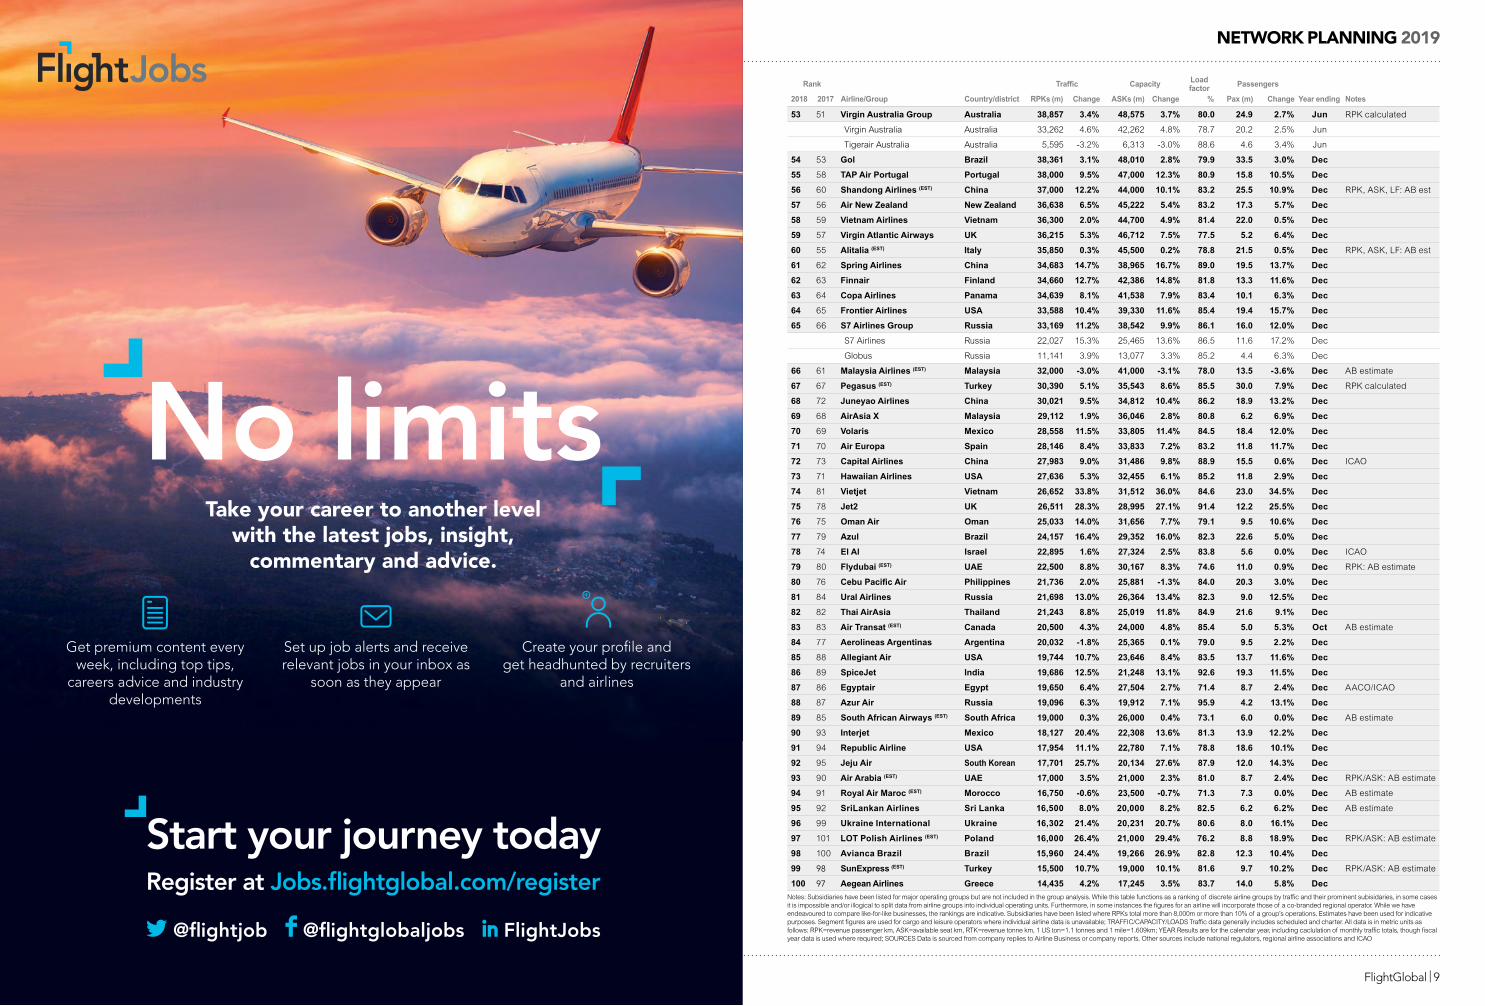
Seattle-Tacoma International Airport
Hub of Innovation
Seattle Spheres, Amazon Global Headquarters
AER LINGUS • AEROMEXICO • AIR CANADA • AIR FRANCE • ALASKAAMERICAN • ANA • ASIANA • BRITISH AIRWAYS • CATHAY PACIFIC
CONDOR • DELTA • EMIRATES • EVA • FRONTIER • HAINANHAWAIIAN • ICELANDAIR • JAPAN AIRLINES • JETBLUE • KOREANLUFTHANSA • NORWEGIAN • SINGAPORE • SOUTHWEST • SPIRIT
SUN COUNTRY • THOMAS COOK • UNITED • VIRGIN ATLANTIC • VOLARIS

NETWORK PLANNING 2019
FlightGlobal | 5 4 | FlightGlobal
NETWORK PLANNING 2019WORLD AIRLINE RANKINGS OVERVIEW
22 | Airline Business | July-August 2019 July-August 2019 | Airline Business | 23flightglobal.com/airlinesflightglobal.com/airlinesTo
ny G
utie
rrez
/AP/
Shut
ters
tock
Financial gains failed to keep pace with increased revenues and passenger traffic during 2018 as higher oil costs in particular clipped the industry’s recent run of strong results, the annual Airline Business World Airline Rankings show. Collective profits among leading carriers slipped last year – even though revenues among the 100 biggest operators grew another 8% to top $780 billion. Analysis of the data, collected by Cirium, also shows passenger traffic climbed 7%
Profits stall
8.4%Rise in revenues in US dollar terms across the 100 biggest airline groups to total over $780 billion
6.9%Collective operating margin of biggest carrier groups in 2018, down almost one percentage point on 2017
7.1%Increase in passenger traffic in RPKS across the 100 biggest groups, at a load factor of 82.2%
3.81bnTotal passengers carried among leading airlines in 2018, an increase of 6.6% on the previous year
American Airlines Group $44.5bn
Delta Air Lines $44.4bn
Lufthansa Group $42.2bn
United Continental $41.3bn
FedEx $37.3bn
Air France-KLM Group $31.2bn
Emirates Group $29.7bn
IAG $28.7bn
Southwest Airlines $22.0bn
China Southern Air Holdings $21.6bn
UNITED STATES
UNITED STATES
FRANCE
UNITED STATES
UNITED STATES
UNITED STATES
GERMANY
UNITED ARAB EMIRATES
UNITED KINGDOM
CHINA
Delta Air Lines $5.26bn
IAG $4.33bn
Lufthansa Group $3.34bn
United Continental $3.29bn
Southwest Airlines $3.21bn
American Airlines Group $2.66bn
Air China Group $2.16bn
FedEx $2.12bn
Japan Airlines Group $1.59bn
Air France-KLM Group $1.57bn
GERMANY
UNITED STATES
UNITED STATES
UNITED STATES
UNITED STATES
UNITED STATES
UNITED KINGDOM
JAPAN
CHINA
FRANCE
GERMANY
UNITED KINGDOM
Delta Air Lines Group 192.5m
Southwest Airlines 163.6m
United Continental 158.3m
Lufthansa Group 142.3m
Ryanair 142.1m
China Southern Air Holdings 140.0m
China Eastern Airlines Holdings 122.5m
IAG 113.0m
Air China Group 110.0m
xxxxxxx xxxxm
UNITED STATES
UNITED STATES
UNITED STATES
CHINA
CHINA
CHINA
CHINA
IRELAND
UNITED STATES
American Airlines Group 203.7m
GERMANY
UNITED KINGDOM
United Continental 370,319m
Delta Air Lines Group 362,489m
Emirates Airline 299,967m
Lufthansa Group 284,561m
IAG 270,657m
China Southern Air Holdings 259,194m
Air France-KLM Group 255,406m
Air China Group 220,728m
Southwest Airlines 214,515m
xxxxxxx xxxxxxm
UNITED STATES
UNITED STATES
UNITED STATES
CHINA
CHINA
UNITED ARAB EMIRATES
FRANCE
UNITED STATES
American Airlines Group 372,015m
1%
5%10%
33%26%
25%
Total7,590bn
Airline traffic by region – RPKs
Asia-Pacific2,522,877m
Europe2,016,252m
Africa38,650m
Middle East753,618m
North America1,891,386m
Latin America367,953m
1% 8%4%
32%
25%
30%
Total$780.6bn
Airline revenues by region
Asia-Pacific$230.9bn
Europe$199.1bn
Africa$7.3bn
Middle East$60.7bn
North America$251.3bn
Latin America$31.4bn
Top 10 airline groups by revenue, 2018 Top 10 airline groups by operating profit, 2018 Top 10 airline groups by traffic, 2018 (RPKs) Top 10 airline groups by passenger numbers, 2018

NETWORK PLANNING 2019
FlightGlobal | 7 6 | FlightGlobal
NETWORK PLANNING 2019
LEADING AIRLINE GROUPS BY TRAFFIC
flightglobal.com/airlines flightglobal.com/airlines
WORLD AIRLINE RANKINGS TRAFFIC
32 | Airline Business | July-August 2019
Leading airline groups by trafficDATA COMPILED BY SILVA ISHAK CIRIUM DATA RESEARCH TEAM
This ranking lists the 100 biggest airline groups by RPKs flown in 2018, together with their key subsidiaries where separate data is available. The use of different sources and because not all units are listed means subsidiary totals do not necessarily match group figures. Data for the top 150 biggest airline groups is available at cirium.com/dashboard
July-August 2019 | Airline Business | 33
Leading airline groups by RPKs, 2018Rank Traffic Capacity Load
factor Passengers
2018 2017 Airline/Group Country/district RPKs (m) Change ASKs (m) Change % Pax (m) Change Year ending Notes
1 1 American Airlines Group USA 372,015 2.1% 453,921 2.0% 82.0 203.7 2.1% Dec
American Airlines USA 330,575 2.0% 399,956 1.9% 82.7 148.2 2.3% Dec
Envoy Air USA 10,461 11.1% 13,399 9.6% 78.1 13.6 15.8% Dec
1 2 United Continental USA 370,319 6.4% 442,892 4.9% 83.6 158.3 6.9% Dec
United Airlines USA 329,692 5.9% 393,836 4.4% 83.7 113.3 5.3% Dec
3 3 Delta Air Lines Group USA 362,489 3.5% 423,845 3.6% 85.5 192.5 3.3% Dec
Delta Air Lines USA 330,364 4.3% 383,888 4.5% 86.1 152.3 4.4% Dec Mainline only
Endeavor Air USA 11,024 17.8% 13,892 17.6% 79.4 13.8 16.8% Dec
4 4 Emirates Airline UAE 299,967 2.7% 390,582 3.6% 76.8 58.6 0.2% Mar
5 5 Lufthansa Group Germany 284,410 8.9% 349,450 8.3% 81.4 142.3 9.6% Dec
Lufthansa Germany 160,074 4.5% 196,768 4.8% 81.4 70.1 5.9% Dec
Eurowings Germany 52,609 23.4% 64748 21.3% 81.3 38.5 18.0% Dec Inc Brussels Airlines
Swiss Switzerland 50,048 9.9% 60,595 8.4% 82.6 20.4 8.8% Dec
Austrian Austria 21,973 9.6% 27,703 6.2% 79.3 13.9 8.4% Dec
6 6 IAG UK 270,657 7.1% 324,808 6.1% 83.3 112.9 7.7% Dec
British Airways UK 152,177 3.3% 184,547 2.5% 82.5 44.9 4.9% Dec
Iberia Spain 60,526 10.2% 70,685 8.2% 85.6 21.0 10.5% Dec Pax: ICAO
Vueling Airlines (EST) Spain 31,973 9.8% 37,431 8.8% 85.4 32.5 9.8% Dec Pax: AB estimate 2018
Aer Lingus Ireland 23,516 9.8% 29,030 10.0% 81.0 11.6 5.5% Dec Pax: ICAO
7 7 China Southern Air China 259,194 12.4% 314,421 12.0% 82.4 139.9 10.8% Dec
China Southern Airlines China 195,480 11.2% 236,218 11.3% 82.8 100.3 9.7% Dec
Xiamen Airlines China 58,879 17.2% 72,270 15.0% 81.5 35.9 12.9% Dec
8 8 Air France-KLM France 255,406 2.8% 292,188 2.1% 87.4 85.6 2.0% Dec
Air France France 147,734 1.9% 171,363 1.3% 86.2 51.4 0.4% Dec
KLM Netherlands 107,678 4.0% 120,815 3.2% 89.1 34.2 4.5% Dec
Transavia Group Netherlands 28,392 11.2% 30,850 9.2% 92.0 15.8 7.6% Dec
9 9 Air China Group China 220,728 9.8% 273,855 10.4% 80.6 109.7 8.0% Dec
Air China China 161,759 9.9% 201,903 11.0% 80.1 71.0 7.4% Dec
Shenzhen Airlines China 53,855 9.1% 65,564 9.7% 82.1 30.7 8.5% Dec
10 10 Southwest Airlines USA 214,508 3.3% 257,004 3.8% 83.5 163.6 3.8% Dec
11 11 China Eastern Airlines China 201,486 10.0% 244,841 8.3% 83.1 121.1 9.3% Dec
China Eastern Airlines China 167,574 11.8% 203,687 9.8% 82.3 97.7 11.4% Dec
Shanghai Airlines China 24,788 9.6% 31,250 9.7% 79.3 17.2 11.7% Dec ASK: AB estimate
12 12 Ryanair (EST) Ireland 178,000 9.5% 186,000 9.3% 95.7 142.1 9.1% Mar RPK/ASK/LF: AB est
13 13 Qatar Airways Qatar 154,080 5.5% 231,094 13.5% 67.0 29.5 1.0% Mar LF: AB estimate
14 15 Turkish Airlines Turkey 149,169 8.9% 182,031 5.2% 81.9 75.2 9.6% Dec
15 14 Air Canada Group Canada 148,607 8.5% 178,383 7.1% 83.3 50.9 5.8% Dec
16 16 Aeroflot Group Russia 143,151 9.9% 173,075 10.1% 82.7 55.7 11.1% Dec
Aeroflot Russia 97,956 6.7% 121,616 8.3% 80.5 35.8 8.9% Dec
Rossiya Airlines Russia 29,601 5.3% 34,181 2.6% 86.6 11.1 -0.1% Dec
Pobeda Russia 13,105 65.3% 13,925 65.4% 94.1 7.2 56.8% Dec
17 18 Singapore Airlines Singapore 140,838 8.5% 169,607 6.4% 83.0 36.1 7.1% Dec
Singapore Airlines Singapore 102,572 7.0% 123,486 4.5% 83.1 20.7 6.2% Dec
Scoot Singapore 29,325 14.6% 34,388 15.1% 85.3 10.5 10.5% Dec
SilkAir Singapore 8,850 9.2% 11,751 6.2% 75.3 4.9 5.9% Dec
18 17 Hainan Airlines Group China 138,731 14.4% 164,055 16.5% 84.6 79.9 11.5% Dec
Hainan Airlines China 74,402 18.4% 89,735 20.7% 82.9 35.0 14.4% Dec
Tianjin Airlines (EST) China 19,500 7.1% 22,500 6.6% 86.7 14.5 5.1% Dec AB estimate
Lucky Air (EST) China 15,250 8.9% 17,500 8.7% 87.1 11.5 9.5% Dec AB estimate
19 19 Cathay Pacific Group Hong Kong 130,626 3.1% 155,361 3.5% 84.1 35.5 1.9% Dec
Cathay Pacific Hong Kong 114,697 2.6% 135,078 3.0% 84.9 24.3 0.8% Dec
Cathay Dragon Hong Kong 15,718 5.5% 20,018 5.4% 78.5 11.1 3.7% Dec
20 20 Qantas Group Australia 126,814 4.7% 152,428 1.4% 83.2 55.3 3.0% Jun
Qantas Australia 85,057 5.4% 103,665 2.0% 82.0 30.5 2.3% Jun
Jetstar Group Australia 35,076 3.6% 40,806 0.5% 86.0 20.3 3.6% Jun
21 21 LATAM Airlines Group Chile 119,077 2.9% 143,265 5.0% 83.1 68.8 2.5% Dec
LATAM Airlines Brazil Brazil 59,903 3.6% 72,988 6.4% 82.1 34.2 1.0% Dec
LATAM Airlines Chile Chile 24,667 1.2% 29,595 3.7% 83.3 8.4 3.1% Dec
22 23 EasyJet UK 98,522 9.9% 104,800 9.4% 94.0 88.5 10.3% Sep
23 24 ANA Holdings Japan 91,481 2.3% 124,451 1.3% 73.5 54.4 0.9% Dec
24 25 Alaska Air Group USA 87,970 4.5% 105,124 5.3% 83.7 45.8 4.0% Dec
Horizon Air USA 4,172 10.6% 5,264 11.1% 79.2 7.2 2.8% Dec
25 27 Norwegian Norway 85,124 34.4% 99,219 37.2% 85.8 37.3 12.7% Dec
26 22 Etihad Airways UAE 84,269 -6.7% 110,300 -4.1% 76.4 17.8 -4.3% Dec
27 28 JetBlue Airways USA 81,720 7.5% 96,347 6.9% 84.8 42.1 5.4% Dec
28 26 Korean Air South Korea 80,154 3.0% 99,943 1.8% 80.2 27.0 0.4% Dec
29 30 Japan Airlines Group Japan 70,855 4.7% 91,043 4.0% 77.8 44.0 3.3% Mar
Japan Airlines Japan 65,912 4.8% 83,856 3.9% 78.6 35.1 2.9% Mar
30 31 Saudia (EST) Saudi Arabia 68,500 8.4% 102,000 8.0% 67.2 34.0 8.3% Dec RPK/ASK/LF is AB est
31 29 Thai Airways International Thailand 68,164 0.1% 87,290 2.3% 78.1 19.7 -0.8% Dec
32 32 Thomas Cook Group UK 66,707 6.0% 73,954 5.4% 90.2 20.2 7.4% Sep
Condor Germany 31,555 10.4% 35,395 10.1% 89.2 9.1 19.7% Dec ICAO
Thomas Cook Airlines UK 28,417 7.2% 31,416 6.9% 90.5 8.1 10.6% Dec UK CAA
33 33 IndiGo India 65,996 25.7% 76,001 25.5% 86.8 61.9 25.8% Dec
34 34 AirAsia Group Malaysia 55,962 10.2% 66,261 13.6% 84.5 44.4 13.7% Dec
AirAsia Malaysia 41,225 8.3% 48,452 12.0% 85.1 32.3 10.8% Dec
35 35 Wizz Air Hungary 54,433 20.8% 58,836 19.6% 92.5 33.8 19.6% Dec
36 36 Spirit Airlines USA 49,222 24.3% 58,359 22.6% 84.3 28.7 18.6% Dec
37 37 Air India India 48,625 9.0% 61,074 7.6% 79.6 22.2 8.5% Dec
38 38 Jet Airways India 48,542 8.7% 57,988 7.1% 83.7 27.4 4.6% Dec Grounded April 2019
39 39 Garuda Indonesia Indonesia 48,506 4.8% 64,453 3.9% 75.3 38.4 6.1% Dec
Garuda Indonesia Indonesia 35,597 -2.5% 49,506 1.3% 71.9 23.5 -1.8% Dec
Citilink Indonesia Indonesia 11,901 21.5% 14,369 17.1% 82.8 14.8 20.3% Dec
40 40 EVA Air Taiwan 48,368 5.5% 59,835 2.2% 80.8 12.5 3.4% Dec
41 42 Asiana Airlines South Korea 46,837 5.9% 55,598 3.1% 84.2 19.9 3.1% Dec
=42 43 Lion Group (EST) Indonesia 45,000 2.5% 57,000 1.9% 78.9 52.5 1.4% Dec AB estimate
Lion Air (EST) Indonesia 36,000 3.4% 44,500 2.6% 80.9 36.0 1.7% Dec AB estimate
=42 44 Sichuan Airlines (EST) China 45,000 6.4% 53,500 6.1% 84.1 26.0 6.1% Dec AB estimate
44 45 WestJet Canada 44,389 6.5% 53,002 6.3% 83.7 25.5 5.8% Dec
45 46 Avianca Colombia 43,729 8.8% 52,624 8.0% 83.1 30.5 3.5% Dec
46 47 Grupo Aeromexico Mexico 43,439 9.1% 52,936 8.3% 82.1 21.5 5.9% Dec
Aeromexico Mexico 35,382 8.3% 46,381 9.2% 76.3 12.2 4.3% Dec
47 48 Ethiopian Airlines Ethiopia 42,624 22.0% 57,842 19.6% 73.7 11.5 20.2% Dec
48 49 China Airlines China 41,748 3.9% 52,490 4.6% 79.5 15.6 3.2% Dec
49 41 SkyWest Inc USA 40,728 -4.3% 50,740 -4.3% 80.3 48.2 -6.4% Dec
SkyWest Airlines USA 33,419 10.3% 41,502 11.0% 80.5 39.0 8.9% Dec
ExpressJet Airlines USA 7,309 -40.3% 9,238 -40.9% 79.1 9.3 -40.3% Dec
50 54 Philippine Airlines Philippines 40,003 8.2% 51,683 -0.2% 77.4 15.9 10.4% Dec
51 50 SAS Sweden 39,821 0.1% 52,626 0.8% 75.7 30.0 1.0% Dec
52 52 TUI Airways UK 39,163 5.6% 42,199 6.4% 92.8 11.2 -0.8% Dec
Rank Traffic Capacity Load factor
%
Passengers
2018 2017 Airline/Group Country/district RPKs (m) Change ASKs (m) Change Pax (m) Change Year ending Notes
NETWORK PLANNING 2019
FlightGlobal | 9 8 | FlightGlobal
NETWORK PLANNING 2019
flightglobal.com/airlines
WORLD AIRLINE RANKINGS TRAFFIC
53 51 Virgin Australia Group Australia 38,857 3.4% 48,575 3.7% 80.0 24.9 2.7% Jun RPK calculated
Virgin Australia Australia 33,262 4.6% 42,262 4.8% 78.7 20.2 2.5% Jun
Tigerair Australia Australia 5,595 -3.2% 6,313 -3.0% 88.6 4.6 3.4% Jun
54 53 Gol Brazil 38,361 3.1% 48,010 2.8% 79.9 33.5 3.0% Dec
55 58 TAP Air Portugal Portugal 38,000 9.5% 47,000 12.3% 80.9 15.8 10.5% Dec
56 60 Shandong Airlines (EST) China 37,000 12.2% 44,000 10.1% 83.2 25.5 10.9% Dec RPK, ASK, LF: AB est
57 56 Air New Zealand New Zealand 36,638 6.5% 45,222 5.4% 83.2 17.3 5.7% Dec
58 59 Vietnam Airlines Vietnam 36,300 2.0% 44,700 4.9% 81.4 22.0 0.5% Dec
59 57 Virgin Atlantic Airways UK 36,215 5.3% 46,712 7.5% 77.5 5.2 6.4% Dec
60 55 Alitalia (EST) Italy 35,850 0.3% 45,500 0.2% 78.8 21.5 0.5% Dec RPK, ASK, LF: AB est
61 62 Spring Airlines China 34,683 14.7% 38,965 16.7% 89.0 19.5 13.7% Dec
62 63 Finnair Finland 34,660 12.7% 42,386 14.8% 81.8 13.3 11.6% Dec
63 64 Copa Airlines Panama 34,639 8.1% 41,538 7.9% 83.4 10.1 6.3% Dec
64 65 Frontier Airlines USA 33,588 10.4% 39,330 11.6% 85.4 19.4 15.7% Dec
65 66 S7 Airlines Group Russia 33,169 11.2% 38,542 9.9% 86.1 16.0 12.0% Dec
S7 Airlines Russia 22,027 15.3% 25,465 13.6% 86.5 11.6 17.2% Dec
Globus Russia 11,141 3.9% 13,077 3.3% 85.2 4.4 6.3% Dec
66 61 Malaysia Airlines (EST) Malaysia 32,000 -3.0% 41,000 -3.1% 78.0 13.5 -3.6% Dec AB estimate
67 67 Pegasus (EST) Turkey 30,390 5.1% 35,543 8.6% 85.5 30.0 7.9% Dec RPK calculated
68 72 Juneyao Airlines China 30,021 9.5% 34,812 10.4% 86.2 18.9 13.2% Dec
69 68 AirAsia X Malaysia 29,112 1.9% 36,046 2.8% 80.8 6.2 6.9% Dec
70 69 Volaris Mexico 28,558 11.5% 33,805 11.4% 84.5 18.4 12.0% Dec
71 70 Air Europa Spain 28,146 8.4% 33,833 7.2% 83.2 11.8 11.7% Dec
72 73 Capital Airlines China 27,983 9.0% 31,486 9.8% 88.9 15.5 0.6% Dec ICAO
73 71 Hawaiian Airlines USA 27,636 5.3% 32,455 6.1% 85.2 11.8 2.9% Dec
74 81 Vietjet Vietnam 26,652 33.8% 31,512 36.0% 84.6 23.0 34.5% Dec
75 78 Jet2 UK 26,511 28.3% 28,995 27.1% 91.4 12.2 25.5% Dec
76 75 Oman Air Oman 25,033 14.0% 31,656 7.7% 79.1 9.5 10.6% Dec
77 79 Azul Brazil 24,157 16.4% 29,352 16.0% 82.3 22.6 5.0% Dec
78 74 El Al Israel 22,895 1.6% 27,324 2.5% 83.8 5.6 0.0% Dec ICAO
79 80 Flydubai (EST) UAE 22,500 8.8% 30,167 8.3% 74.6 11.0 0.9% Dec RPK: AB estimate
80 76 Cebu Pacific Air Philippines 21,736 2.0% 25,881 -1.3% 84.0 20.3 3.0% Dec
81 84 Ural Airlines Russia 21,698 13.0% 26,364 13.4% 82.3 9.0 12.5% Dec
82 82 Thai AirAsia Thailand 21,243 8.8% 25,019 11.8% 84.9 21.6 9.1% Dec
83 83 Air Transat (EST) Canada 20,500 4.3% 24,000 4.8% 85.4 5.0 5.3% Oct AB estimate
84 77 Aerolineas Argentinas Argentina 20,032 -1.8% 25,365 0.1% 79.0 9.5 2.2% Dec
85 88 Allegiant Air USA 19,744 10.7% 23,646 8.4% 83.5 13.7 11.6% Dec
86 89 SpiceJet India 19,686 12.5% 21,248 13.1% 92.6 19.3 11.5% Dec
87 86 Egyptair Egypt 19,650 6.4% 27,504 2.7% 71.4 8.7 2.4% Dec AACO/ICAO
88 87 Azur Air Russia 19,096 6.3% 19,912 7.1% 95.9 4.2 13.1% Dec
89 85 South African Airways (EST) South Africa 19,000 0.3% 26,000 0.4% 73.1 6.0 0.0% Dec AB estimate
90 93 Interjet Mexico 18,127 20.4% 22,308 13.6% 81.3 13.9 12.2% Dec
91 94 Republic Airline USA 17,954 11.1% 22,780 7.1% 78.8 18.6 10.1% Dec
92 95 Jeju Air South Korean 17,701 25.7% 20,134 27.6% 87.9 12.0 14.3% Dec
93 90 Air Arabia (EST) UAE 17,000 3.5% 21,000 2.3% 81.0 8.7 2.4% Dec RPK/ASK: AB estimate
94 91 Royal Air Maroc (EST) Morocco 16,750 -0.6% 23,500 -0.7% 71.3 7.3 0.0% Dec AB estimate
95 92 SriLankan Airlines Sri Lanka 16,500 8.0% 20,000 8.2% 82.5 6.2 6.2% Dec AB estimate
96 99 Ukraine International Ukraine 16,302 21.4% 20,231 20.7% 80.6 8.0 16.1% Dec
97 101 LOT Polish Airlines (EST) Poland 16,000 26.4% 21,000 29.4% 76.2 8.8 18.9% Dec RPK/ASK: AB estimate
98 100 Avianca Brazil Brazil 15,960 24.4% 19,266 26.9% 82.8 12.3 10.4% Dec
99 98 SunExpress (EST) Turkey 15,500 10.7% 19,000 10.1% 81.6 9.7 10.2% Dec RPK/ASK: AB estimate
100 97 Aegean Airlines Greece 14,435 4.2% 17,245 3.5% 83.7 14.0 5.8% Dec
Rank Traffic Capacity Load factor Passengers
2018 2017 Airline/Group Country/district RPKs (m) Change ASKs (m) Change % Pax (m) Change Year ending Notes
Notes: Subsidiaries have been listed for major operating groups but are not included in the group analysis. While this table functions as a ranking of discrete airline groups by traffic and their prominent subisidaries, in some cases it is impossible and/or illogical to split data from airline groups into individual operating units. Furthermore, in some instances the figures for an airline will incorporate those of a co-branded regional operator. While we have endeavoured to compare like-for-like businesses, the rankings are indicative. Subsidiaries have been listed where RPKs total more than 8,000m or more than 10% of a group’s operations. Estimates have been used for indicative purposes. Segment figures are used for cargo and leisure operators where individual airline data is unavailable; TRAFFIC/CAPACITY/LOADS Traffic data generally includes scheduled and charter. All data is in metric units as follows: RPK=revenue passenger km, ASK=available seat km, RTK=revenue tonne km, 1 US ton=1.1 tonnes and 1 mile=1.609km; YEAR Results are for the calendar year, including caclulation of monthly traffic totals, though fiscal year data is used where required; SOURCES Data is sourced from company replies to Airline Business or company reports. Other sources include national regulators, regional airline associations and ICAO
34 | Airline Business | July-August 2019
Get premium content every week, including top tips,
careers advice and industry developments
Set up job alerts and receive relevant jobs in your inbox as
soon as they appear
Create your profi le and get headhunted by recruiters
and airlines
No limitsTake your career to another level
with the latest jobs, insight, commentary and advice.
Start your journey todayRegister at Jobs.flightglobal.com/register
@fl ightjob @fl ightglobaljobs FlightJobs
FIN_200819_036.indd 36 13/08/2019 14:29

NETWORK PLANNING 2019
FlightGlobal | 11 10 | FlightGlobal
NETWORK PLANNING 2019
AIRPORT LEADERS
AIRPORTS TRAFFIC
24 | Airline Business | May 2019 May 2019 | Airline Business | 25flightglobal.com/airlinesflightglobal.com/airlines
JOINING THE CENTURY CLUBDelta Air Lines’ main hub at Atlanta Hartsfield-Jackson International remains the largest airport in the world. It handled 107.4 million passen-gers in 2018, an increase of 3.3%.
Beijing Capital became the second airport in the world to pass the 100 million passenger mark. The airport enjoyed a further 5.4% rise in traffic as passenger numbers reached 100.9 mil-lion. That comes in a big year for the Beijing air-port system, as the city’s new Daxing facility is set to open later in 2019.
Beijing and another Chinese hub, Shanghai Pudong, were the only two of the 10 biggest airports to report passenger growth in excess of 5% last year. Passenger levels rose 5.8% at Pu-dong, the ninth-biggest airport in the world, handling just over 74 million passengers.
Los Angeles and Tokyo Haneda were the only airports among the top 10 to change posi-tions. Passenger growth of 3.5% at Los Angeles
to 87.5 million ranked the US hub fourth-big-gest in the world, putting it ahead of Haneda, which handled 87.1 million.
Dubai International is the third-biggest air-port in the world, catering for just over 89 mil-lion passengers last year. But this marked growth of only a little over 1% – the slowest rate at the airport for well over a decade.
Airports in Asia-Pacific account for more than one-third of the top 100 and the largest share of passengers, with more than 1.7 billion. The next biggest category, North American air-ports, which accounted for 1.3 billion passen-gers, has 26 hubs in the top 100. Europe com-prises 29 of the 100 biggest facilities, which between them account for almost 1.2 billion passengers. There remain no African airports among the 100 biggest in the world.
There are 24 US airports among the 100 big-gest, the next-highest number for a country being the 17 Chinese hubs that feature in the top 100.
Preliminary figures collated by Cirium covering the biggest 100 airports in the world show passenger numbers increased by 5.3% during 2018. While that is slightly down on the 5.6% rise across the largest gateways the previous year, it still represents healthy growth
Hubs on the rise
Max
im S
hipe
nkov
/EPA
-EFE
/REX
/Shu
tter
stoc
k
MAT
T C
AM
PBEL
L/EP
A-E
FE/R
EX/S
hutt
erst
ock
Imag
inec
hina
/REX
/Shu
tter
stoc
k
Europe
Middle East
Asia-Pacific
North America
LatinAmerica
1.27bn+2.9%
187m+2.4%
186m+7.1%
1.71bn+6.0%
1.17bn+5.6%
Total4.52bn+5.3%
Regional split by passengers, top 100 airports
Note: No African airports featured in the top 100
Note: Ranking based on year-on-year change in passenger traffic from the top 100 airports
Fastest-growing passenger traffic among top 100 airports
AntalyaInternational
22 %
2018 pax 32m
Lukou International (Nanjing)
10.7 %
2018 pax 29m
Kempegowda International (Bengaluru)
29.1 %
2018 pax 32m
Guarulhos International (Sao Paulo)
11.8 %
2018 pax 42m
Sheremetyevo International (Moscow)
14.4 %
2018 pax 45m
XinzhengInternational (Zhengzhou)
12.5 %
2018 pax 27m
Malpensa (Milan)
11.5 %
2018 pax 25m
AthensInternational
11%
2018 pax 25m
ViennaInternational
10.8 %
2018 pax 27m
Hollywood International (Fort Lauderdale)
10.6 %
2018 pax 36m
0 1 2 3 4 5
2.82bn
3.00bn
3.16bn
3.30bn
3.45bn
3.63bn
3.86bn
4.07bn
4.52bn
4.29bn2017
2018
2016
2015
2014
2013
2012
2011
2010
2009
10-year trend: traffic at top 100 airports
RAPID RISERSFigures show that 11 of the 100 biggest airports boosted passenger numbers at a double-digit rate in 2018, including a 29% jump at Bengalu-ru’s Kempegowda airport. It handled 32.3 mil-lion passengers, placing it 65th in the rankings.
The recovery in Turkish tourism after the chal-lenges of recent years was again evident in pas-senger growth of more than one-fifth at Antalya airport in 2018, reaching a total of 31.6 million.
Moscow Sheremetyevo International airport, which added 23 new routes and six carriers dur-ing 2018 – recorded the third-highest growth rate of leading hubs last year. Passenger numbers climbed 14% to over 45 million at the Russian air-port, ranking it in 41st place in the table for 2018.
Low-cost and leisure traffic helped deliver dou-ble-digit growth at European airports Athens, Milan Malpensa and Vienna, while Chinese air-ports Zhengzhou Xinzheng and Nanjing Lukou logged growth of 13% and 11% respectively.
Sao Paulo Guarulhos and Fort Lauderdale were the only Latin American and North Ameri-can airports to record double-digit growth in the top 100 last year.
Passenger numbers fell at just five of the 100 biggest airports last year.
Top 100 airports total
4.52bn passengers
Top 10 airports by passenger traffic
Atlanta Hartsfield
107m
1 Beijing Captital
101m
2 DubaiInternational
89m
3 Tokyo HanedaInternational
87m
4 Los AngelesInternational
88m
5 Chicago O’HareInternational
83m
6 LondonHeathrow
80m
7 Hong KongInternational
75m
8 Shanghai Pudong
74m
9 Paris Charlesde Gaulle
72m
10
Beijing’s second airport, Daxing, opens this year
Atlanta remains the biggest airport in the world
Passengers increased 14% at Moscow’ Sheremetyevo

NETWORK PLANNING 2019
FlightGlobal | 13 12 | FlightGlobal
NETWORK PLANNING 2019
TOP 100 AIRPORTS BY TRAFFIC
AIRPORTS TRAFFIC AIRPORTS TRAFFIC
28 | Airline Business | May 2019 May 2019 | Airline Business | 29flightglobal.com/airlinesflightglobal.com/airlines
Airport traffic rankingsPassenger numbers among the 100 biggest global hubs increased by more than 5% during 2018, according to Cirium analysis of preliminary figures for last year, including a second airport passing the landmark 100 million mark
DATA COMPILED BY SILVA ISHAK CIRIUM DATA RESEARCH TEAM
Top 100 airports: preliminary passenger ranking 2018 (51-100) Rank 2018 passengers Seat share of two leading carriers (marketing airline)
2018 2017 City Airport Code Country Number (000) Change % Carrier 1 Carrier 2
51 54 Sao Paulo Guarulhos Int'l GRU Brazil 42,230 11.8 LATAM Airlines Brazil 33% Gol 22%
52 51 Chongqing Jiangbei Int'l CKG China 41,596 7.4 Sichuan Airlines 12% Air China 12%
53 52 Boston Logan International BOS USA 40,942 6.6 JetBlue 31% Delta Air Lines 19%
54 55 Bangkok Don Mueang Int'l DMK Thailand 40,564 9.1 Thai AirAsia 41% Thai Lion Air 25%
55 57 Hangzhou Xiaoshan Int'l HGH China 38,242 7.5 Air China 15% China Southern Airlines 13%
56 56 Melbourne Tullamarine MEL Australia 38,073 4.3 Qantas Airways 30% Virgin Australia 24%
57 53 Minneapolis-St Paul International MSP USA 38,037 0.0 Delta Air Lines 70% Sun Country 8%
58 61 Fort Lauderdale Hollywood Int'l FLL USA 35,963 10.6 JetBlue 22% Southwest Airlines 22%
59 60 Jeddah King Abdulaziz Int'l JED Saudi Arabia 35,800 5.4 Saudia 51% Flynas 8%
60 59 Detroit Wayne County DTW USA 35,237 1.5 Delta Air Lines 73% Spirit 11%
61 58 Doha International DOH Qatar 34,500 -2.2 Qatar Airways 89% Indigo 2%
62 63 Istanbul Sabiha Gokcen Int'l SAW Turkey 34,137 8.8 Pegasus 64% Turkish Airlines 31%
63 62 Paris Orly ORY France 33,121 3.4 Air France 32% Transavia France 14%
64 64 Bogota El Dorado Int'l BOG Colombia 32,716 5.6 Avianca 61% LATAM Airlines Chile 14%
65 83 Bengaluru Kempegowda Int'l BLR India 32,332 29.1 Indigo 47% AirAsia India 11%
66 68 Philadelphia International PHL USA 31,700 7.1 American Airlines 71% Southwest Airlines 7%
67 79 Antalya International AYT Turkey 31,566 22.0 Turkish Airlines 25% SunExpress 23%
68 67 Dublin International DUB Ireland 31,500 6.4 Ryanair 40% Aer Lingus 36%
69 70 Zurich Zurich ZRH Switzerland 31,113 5.8 Swiss 54% Edelweiss 6%
70 71 Copenhagen Kastrup CPH Denmark 30,299 3.8 SAS 40% Norwegian 16%
71 69 New York LaGuardia LGA USA 30,094 2.0 Delta Air Lines 42% American Airlines 27%
72 66 Jeju International CJU South Korea 29,455 -0.5 Asiana Airlines 19% Jeju Air 16%
73 65 Moscow Domodedovo Int'l DME Russia 29,404 -4.1 S7 Airlines 47% Ural Airlines 16%
74 73 Palma de Mallorca Palma de Mallorca PMI Spain 29,082 4.0 Vueling Airlines 17% Ryanair 17%
75 76 Lisbon Lisbon LIS Portugal 29,032 8.9 TAP Portugal 52% Ryanair 11%
76 72 Osaka Kansai Int'l KIX Japan 28,936 3.4 Peach 12% All Nippon Airways 9%
77 81 Nanjing Lukou Int'l NKG China 28,582 10.7 China Eastern Airlines 27% China Southern Airlines 12%
78 75 Oslo Gardermoen OSL Norway 28,500 3.8 SAS 64% Norwegian 8%
79 74 Manchester International MAN UK 28,300 1.7 Ryanair 18% EasyJet 17%
80 80 London Stansted STN UK 28,000 8.1 Ryanair 78% EasyJet 11%
81 84 Riyadh King Khalid Int'l RUH Saudi Arabia 27,900 9.7 Saudia 57% Flynas 13%
82 89 Zhengzhou Xinzheng Int'l CGO China 27,335 12.5 China Southern Airlines 26% Hainan Airlines 8%
83 78 Baltimore Washington Int'l BWI USA 27,146 2.9 Southwest Airlines 67% Spirit 11%
84 88 Vienna Vienna VIE Austria 27,037 10.8 Austrian 44% Eurowings 8%
85 77 Stockholm Arlanda ARN Sweden 26,847 0.9 SAS 56% Norwegian 8%
86 87 Xiamen Gaoqi International XMN China 26,553 8.4 Xiamen Airlines 40% Shangdong Airlines 14%
87 91 Vancouver International YVR Canada 25,937 7.3 Air Canada 49% WestJet 21%
88 85 Brussels National BRU Belgium 25,676 3.6 Brussels Airlines 39% Ryanair 8%
89 90 Salt Lake City International SLC USA 25,554 5.6 Delta Air Lines 71% Southwest Airlines 11%
90 93 Changsha Huanghua Int'l CSX China 25,266 6.3 China Southern Airlines 21% Hainan Airlines 12%
91 99 Cancun International CUN Mexico 25,202 6.8 Volaris 11% American Airlines 10%
92 107 Milan Malpensa MXP Italy 24,725 11.5 EasyJet 25% Ryanair 9%
93 82 Seoul Gimpo International GMP South Korea 24,603 -2.0 Korean Air Lines 23% Asiana Airlines 20%
94 104 Fukuoka International FUK Japan 24,600 3.4 All Nippon Airways 34% Japan Airlines 17%
95 104 Qingdao Liuting International TAO China 24,536 5.7 Shangdong Airlines 27% China Eastern Airlines 21%
96 100 Wuhan Tianhe International WUH China 24,500 5.9 China Southern Airlines 30% China Eastern Airlines 21%
97 86 Dusseldorf International DUS Germany 24,284 -1.4 Eurowings 41% Lufthansa 9%
98 106 San Diego International SAN USA 24,238 9.3 Southwest Airlines 42% Alaska Airlines 14%
99 109 Athens International ATH Greece 24,136 11.0 Olympic Air 25% Aegean Airlines 21%
100 102 Haikou Meilan International HAK China 24,124 6.8 Hainan Airlines 25% China Southern Airlines 18%
Total 4,516,463 5.3
Notes: EST* Airline Business estimate used where full-year figures not available for indicative purposes. Source: Cirium research based on preliminary traffic figures published by airports/regulators, which are in many cases reported on a terminal passenger basis and exclude a small number of transit passengers. Airline capacity shares based on Cirium schedules data for March 2019, based on seats offered by marketing airline
Top 100 airports: preliminary passenger ranking 2018 (1-50) Rank 2018 passengers Seat share of two leading carriers (marketing airline)
2018 2017 City Airport Code Country Number (000) Change % Carrier 1 Carrier 2
1 1 Atlanta Hartsfield Int'l ATL USA 107,394 3.3 Delta Air Lines 78% Southwest Airlines 11%
2 2 Beijing Capital PEK China 100,983 5.4 Air China 39% China Southern Airlines 14%
3 3 Dubai International DXB UAE 89,149 1.0 Emirates Airline 65% Flydubai 13%
4 5 Los Angeles International LAX USA 87,534 3.5 American Airlines 20% Delta Air Lines 16%
5 4 Tokyo Haneda Int'l HND Japan 87,099 2.1 All Nippon Airways 50% Japan Airlines 33%
6 6 Chicago O'Hare International ORD USA 83,400 4.5 United Airlines 48% American Airlines 34%
7 7 London Heathrow LHR UK 80,102 2.7 British Airways 46% Virgin Atlantic 5%
8 8 Hong Kong International HKG Hong Kong 74,688 2.5 Cathay Pacific Airways 31% Cathay Dragon 16%
9 9 Shanghai Pudong International PVG China 74,054 5.8 China Eastern Airlines 28% Shanghai Airlines 9%
10 10 Paris Charles de Gaulle CDG France 72,230 4.0 Air France 51% EasyJet 7%
11 11 Amsterdam Schiphol AMS Netherlands 70,957 3.7 KLM 50% EasyJet 9%
12 16 Delhi Indira Gandhi Int'l DEL India 69,867 10.1 Indigo 28% Air India 20%
13 13 Guangzhou Baiyun International CAN China 69,720 5.9 China Southern Airlines 46% China Eastern Airlines 8%
14 14 Frankfurt International FRA Germany 69,510 7.8 Lufthansa 63% Condor 3%
15 12 Dallas/Fort Worth International DFW USA 69,113 3.0 American Airlines 87% Spirit 3%
16 19 Seoul Incheon International ICN South Korea 68,260 10.0 Korean Air Lines 26% Asiana Airlines 17%
17 15 Istanbul Ataturk International IST Turkey 67,981 6.0 Turkish Airlines 81% Atlasglobal 4%
18 17 Jakarta EST* Soekarno Hatta Int'l CGK Indonesia 66,908 6.2 Garuda Indonesia 29% Lion Airlines 23%
19 18 Singapore Changi SIN Singapore 65,630 5.5 Singapore Airlines 29% Scoot 12%
20 20 Denver International DEN USA 64,495 5.1 United Airlines 46% Southwest Airlines 29%
21 22 Bangkok Suvarnabhumi BKK Thailand 62,815 6.3 Thai Airways 29% Bangkok Airways 9%
22 21 New York JFK JFK USA 61,909 4.2 Delta Air Lines 28% JetBlue Airways 23%
23 23 Kuala Lumpur International KUL Malaysia 59,959 2.4 AirAsia 37% Malaysia Airlines 23%
24 25 Madrid Barajas MAD Spain 57,891 8.4 Iberia 33% Air Europa 16%
25 24 San Francisco International SFO USA 57,793 3.5 United Airlines 46% Alaska Airlines 12%
26 26 Chengdu Shuangliu Int'l CTU China 52,951 6.3 Air China 25% Sichuan Airlines 20%
27 28 Barcelona El Prat BCN Spain 50,172 6.1 Vueling Airlines 39% Ryanair 15%
28 29 Mumbai International BOM India 49,877 5.7 Jet Airways 24% Indigo 22%
29 31 Seattle Tacoma International SEA USA 49,850 6.2 Alaska Airlines 52% Delta Air Lines 25%
30 27 Las Vegas McCarran Int'l LAS USA 49,717 2.5 Southwest Airlines 40% Delta Air Lines 10%
31 30 Toronto Pearson International YYZ Canada 49,507 5.0 Air Canada 57% WestJet 17%
32 33 Shenzhen Baoan International SZX China 49,349 8.2 Shenzhen Airlines 27% China Southern Airlines 25%
33 36 Mexico City Benito Juarez Int'l MEX Mexico 47,701 6.6 Aeromexico 44% InterJet 22%
34 38 Orlando International MCO USA 47,697 6.9 Southwest Airlines 24% Delta Air Lines 13%
35 37 Kunming Changshui Int'l KMG China 47,088 5.3 China Eastern Airlines 39% Lucky Air 13%
36 35 Taipei Taoyuan International TPE Taiwan 46,530 3.7 China Airlines 25% EVA Air 22%
37 32 Charlotte Douglas CLT USA 46,444 1.2 American Airlines 91% Delta Air Lines 4%
38 39 Munich International MUC Germany 46,254 3.8 Lufthansa 61% Eurowings 5%
39 34 London Gatwick LGW UK 46,075 1.1 EasyJet 42% British Airways 17%
40 42 Newark Liberty International EWR USA 46,065 6.2 United Airlines 66% JetBlue Airways 6%
41 50 Moscow Sheremetyevo Int'l SVO Russia 45,348 14.4 Aeroflot 85% Nordwind 6%
42 44 Manila Ninoy Aquino Int'l MNL Philippines 45,054 7.2 Cebu Pacific Air 32% Philippine Airlines 30%
43 40 Miami International MIA USA 45,044 2.2 American Airlines 67% Delta Air Lines 6%
44 41 Phoenix Sky Harbor PHX USA 44,944 2.3 American Airlines 44% Southwest Airlines 35%
45 46 Xian Xianyang Int'l XIY China 44,654 6.7 China Eastern Airlines 30% Hainan Airlines 10%
46 43 Sydney Kingsford Smith Int'l SYD Australia 44,400 2.5 Qantas Airways 34% Virgin Australia 21%
47 48 Houston George Bush IAH USA 43,808 7.6 United Airlines 77% American Airlines 6%
48 45 Shanghai Hongqiao Int'l SHA China 43,646 4.2 China Eastern Airlines 33% Shanghai Airlines 16%
49 47 Rome Fiumicino FCO Italy 42,995 4.9 Alitalia 41% Vueling Airlines 7%
50 49 Tokyo Narita International NRT Japan 42,601 4.7 All Nippon Airways 17% Japan Airlines 13%

NETWORK PLANNING 2019
FlightGlobal | 15 14 | FlightGlobal
NETWORK PLANNING 2019
After a challenging first few months of the year in which a number
of high-profile carriers were forced to suspend operations amid
mounting financial problems, the summer months have largely
proved a stable period in which activity has focused on start-up
projects.
It does, however, remain to be seen to what extent that proves a
pause, rather than a shift in the dynamic – notably in Europe where
the busy summer period is always kinder on airline cash-flows – while
efforts to revive some of the big-name casualties have struggled for
momentum.
AIRLINE GROUNDINGS
India’s Jet Airways is the largest airline failure of the year. The carrier
had been forced to ground an increasing portion of its fleet – as its
liquidity problems continued to mount – over the start of the year
before ultimately ceasing operations in mid-April.
Subsequent efforts to secure fresh investment in the airline have thus
far failed to secure concrete commitments.
A deadline for the latest expressions of interest initiative is the end
of August, under a process which envisages final bids submitted by
mid-October.
A teaser document released on 20 July to prospective applicants
shows that the airline still has 12 aircraft in its fleet, comprising six
Boeing 777-300ERs, three Airbus A330-300s and three 737s. The
widebody jets are under finance leases, while the 737s are owned by
the company. Most of its other aircraft have since been repossessed
by lessors and banks.
NEW ENTRANTS
But new – or in some cases familiar – entrants have taken to the skies
over the summer.
Uganda Airlines in late August completed a flight from Entebbe to
Nairobi’s Jomo Kenyatta International. A previous incarnation of the
carrier ceased flights in 2001, following 24 years of operations. The
new Uganda Airlines operates two Bombardier CRJ900s, Cirium
fleets data shows, and has two Airbus A330-800s on order.
The carrier’s booking engine on its website indicates it plans to fly
to several other countries in Africa, including Tanzania, South Sudan,
Somalia and Burundi.
Earlier in August, Ecuadorian start-up AeroRegional launched its
inaugural route, connecting Quito with Cuenca. The airline, which will
operate two Boeing 737-500s, obtained its air operator’s certificate in
May and is based in Quito.
A month earlier in July, Chinese start-up carrier Genghis Khan
Airlines launched operations with the Comac ARJ21 aircraft. Genghis
Khan Airlines has received two ARJ21s and plans to operate 25 of the
type by 2024.
New Japanese budget carrier Zipair Tokyo meanwhile is on track for
a 2020 launch, having in July been granted an air transport business
license by Japan’s Ministry of Land, Infrastructure, Transport and
Tourism.
The budget arm of Japan Airlines will operate two Boeing 787-8
aircraft, each with 290 seats, on two daily services: Tokyo Narita-
Bangkok Suvarnabhumi starting 14 May 2020, and Tokyo Narita-
Seoul Incheon from 1 July 2020.
Dominican start-up Flycana plans to finalise its capitalisation and
recertification processes by year-end, as it also targets an operational
start next year. The carrier has aspirations to reach a 32-strong jet
fleet by 2025.
Chief executive Frederik Jacobsen says the airline has selected a US-
based investment bank to place Flycana shares worth $80 million with
both international and Dominican private and institutional investors.
“We will announce a lead investor soon,” Jacobsen says. “Our
capitalisation will be sufficient to stem the financial burden of quickly
growing to a fleet size with a critical mass for a highly profitable ultra-
low-cost business model.”
Another project in Latin America in July saw newly constituted
company Aerovias Internacionales del Uruguay file a request with
national civil aviation authority DINACIA to get certificated as a
commercial airline.
Start-up Great Dane Airlines has outlined plans for rapid growth,
after launching scheduled flights in the summer initially with one
Embraer 195. Great Dane has already begun charter flights before
inaugurating scheduled services from Aalborg to Dublin, Edinburgh
and Nice in June. The nascent carrier intends to take one to two
additional E195s each year.
Nigerian start-up Ibom Air also began operating flights in June,
across a number of domestic routes. The carrier says its inaugural
service took off from Uyo’s Victor Attah International airport, bound
for Lagos. Ibom’s website shows that it offers multiple flights per day
from its Uyo base to Lagos and Abuja. The carrier is operating a pair
of Bombardier CRJ900s, of which it took delivery in February.
In September, start-up carrier Air Antwerp will operate its first flight
to London City airport, following the granting of its air operator’s
certificate by Belgium’s civil aviation authority.
The Belgian airline, a joint venture between KLM and CityJet, will
use a 50-seat Fokker 50 turboprop to operate three return weekday
flights plus one Sunday evening service. KLM will be a codeshare
partner on the route.
Air Antwerp was created to fill the space left by the collapse of VLM,
which collapsed last autumn. The new carrier is 75% owned by Irish
operator CityJet and 25% owned by KLM.
Another new European operator flew its first commercial flight in
May: FlyBosnia launched initially from Sarajevo to Kuwait.
Air Astana’s new budget arm operation, FlyArystan, also began
operations in May. It has been operating six routes from Almaty using
a pair of A320 narrowbodies, and has now identified Karaganda as
a second base. It will begin operations from Kazakhstan’s fourth-
largest city in the second quarter of 2020.
Airline Country Launched ops
Bamboo Airways Vietnam 16/01/2019
FlyArystan Kazhakstan 01/05/2019
FlyBosnia Bosnia-Herzogovina 02/05/2019
Genghis Khan Airlines China 26/07/2019
Great Dane Airlines Denmark 14/06/2019
Ibom Air Nigeria 07/06/2019
JetSMART Argentina Argentina 10/04/2019
Manta Air Maldives 24/02/2019
Sky Airline Peru Peru 08/04/2019
Star Air India 25/01/2019
Airlines launching flights during 2019 (selected)
Source: Cirium; Airlines launching operations during during 2019 as of 31 August 2019
AIRLINE START-UPS AND SUSPENSIONSIf a new investor and resolution plan can be found, it looks unlikely
that a revived Jet would be able to take back some of the route
authorities and slots that have been temporarily farmed out to other
carriers before the start of the northern winter scheduling season.
Brazil’s aviation regulator meanwhile in May suspended Avianca
Brazil’s authority to operate commercial flights, prompting the
redistribution of its take-off and landing slots. The move came after
ANAC grounded Avianca Brazil in May due to safety concerns.
Ocean Air, the airline company that operates Avianca Brazil, entered
bankruptcy administration in December 2018 with debt reportedly
close to $500 million.
The airline also formally leaves Star Alliance at the end of August –
proving third-time unlucky for the alliance in Brazil. Its first alliance
member from the country, founding member Varig, left in 2006
shortly before its collapse, while its replacement TAM was a member
for only four years before moving to Oneworld following its merger
with LAN.
Elsewhere, Avianca’s Argentinian affiliate has filed for bankruptcy
protection in an attempt to avoid liquidation and the cancellation
of its air operator’s certificate as a potential consequence of its
prolonged grounding.
Avian Lineas Aereas, which operates under the Avianca Argentina
brand and is part-owned by Avianca’s Colombian parent Synergy
Group, had announced on 9 June that it was suspending operations
for 90 days, only 18 months after its launch in late 2017. It grounded
its two ATR 72-600 turboprops, which were deployed on its two
remaining domestic routes.
Chief executive Carlos Colunga says the airline will use the
bankruptcy process to “reformulate its business model” while
attempting to keep alive its only major asset, the AOC.
One brand in Europe to disappear over the summer was Air France’s
short-lived millennial adventure Joon, which completed its last flight
on 26 June.
Plans for the unit had been drawn up in 2016 by Air France-KLM’s
then-chief executive Jean-Marc Janaillac amid a costly conflict
between the French flag carrier and aircrew that was stymieing
expansion ambitions.
European carriers had been among the hardest hit during first
quarter of the year, notably including the likes of Wow Air, Flybmi
and Germania.
Airline Country Suspended ops
Avianca Argentina Argentina 09/06/2019
Avianca Brazil Brazil 24/05/2019
Flybmi United Kingdom 16/02/2019
Germania Germany 04/02/2019
InselAir Curacao 26/02/2019
Jet Airways India 27/04/2019
Joon France 27/06/2019
Pskovavia Russia 12/03/2019
Shaheen Air International Pakistan 08/02/2019
Tajik Air Tajikistan 10/01/2019
Wow Air Iceland 28/03/2019
Airline failures 2019 year to date (selected)
Source: Cirium data; carriers grounded as of 31 August 2019
16 | FlightGlobal
Seattle-Tacoma International Airport
Your Global Gateway
AER LINGUS • AEROMEXICO • AIR CANADA • AIR FRANCE • ALASKAAMERICAN • ANA • ASIANA • BRITISH AIRWAYS • CATHAY PACIFIC
CONDOR • DELTA • EMIRATES • EVA • FRONTIER • HAINANHAWAIIAN • ICELANDAIR • JAPAN AIRLINES • JETBLUE • KOREANLUFTHANSA • NORWEGIAN • SINGAPORE • SOUTHWEST • SPIRIT
SUN COUNTRY • THOMAS COOK • UNITED • VIRGIN ATLANTIC • VOLARIS