Embed Size (px)
Citation preview
Network Performance Monitor in OMS This document describes how to set-up and use the Network Performance Monitor solution in OMS,
which helps you monitor the performance of your networks-in near real-time-to detect and locate
network performance bottlenecks. With the Network Performance Monitor solution, you can monitor
the loss and latency between two networks, subnets or servers. Network Performance Monitor detects
network issues like traffic blackholing, routing errors, and issues that conventional network monitoring
methods are not able to detect. Network performance monitor generates alerts and notifies as and
when a threshold has breached for a network link. These thresholds can be learned automatically by the
system or you can configure them to use custom alert rules. Network Performance Monitor ensures
timely detection of network performance issues and localizes the source of the problem to a particular
network segment or device.
You can detect network issues by the solution dashboard which displays summary of your network
including recent network health events, unhealthy network links, and subnetwork links that are facing
high packet loss and latency. You can drill-down into a network link to view the current health status of
subnetwork links as well as node-to-node links. You can also view the historical trend of loss and latency
at the network, subnetwork, and node-to-node level. You can detect transient network issues by
viewing historical trend charts for packet loss and latency and locate network bottlenecks on a topology
map. The interactive topology graph allows you to visualize the hop-by-hop network routes and
determine the source of the problem. Like any other OMS solutions, you can use Log Search for various
analytics requirements to create custom reports based on the data collected by Network Performance
Monitor.
The solution uses synthetic transactions as a primary mechanism to detect network faults. So, you can
use it without regard for a specific network device’s vendor or model. It works across on-premises, cloud
(IaaS), and hybrid environments. The solution automatically discovers the network topology and various
routes in your network.
Typical network monitoring products focus on monitoring the network device (routers, switches etc.)
health but do not provide insights into the actual quality of network connectivity between two points,
which Network Performance Monitor does.
Using Network Performance Monitor standalone If you want to monitor the quality of network connections between their critical workloads, networks,
datacenters or office sites, then you can use the Network Performance Monitor solution by itself to
monitor connectivity health between:
multiple datacentres or office sites that are connected using a public or private network
critical workloads that are running line of business applications
public cloud services like Microsoft Azure or Amazon Web Services (AWS) and on-premises
networks, if you have IaaS (VM) available and you have gateways configured to allow
communication between on-premises networks and cloud networks
Azure and on-premises networks when you use Express Route
Using Network Performance Monitor with other networking tools If you want to monitor a line of business application, you can use the Network Performance Monitor
solution as a companion solution to other network tools. A slow network can lead to slow applications
and Network Performance Monitor can help you investigate application performance issues that are
caused by underlying networking issues. Because the solution does not require any access to network
devices, the application administrator doesn’t need to rely on a networking team to provide information
about how the network is affecting applications.
Also, if you already invest in other network monitoring tools, then the solution can complement those
tools because most traditional network monitoring solutions do not provide insights into end-to-end
network performance metrics like loss and latency. The Network Performance Monitor solution can
help fill that gap.
Preview status of the Network Performance Monitor solution The Network Performance Monitor is in Public Preview. During public preview, the solution is available
to all OMS subscribers in all regions supported by OMS. Although the solution is publicly available, the
preview status of the solution means that there may be potential bugs or possible limitations in the
solution in certain cases. If problems are found, we’ll investigate them, triage them, and fix them as
promised in our service level agreements.
Installing and configuring agents for the Network Performance Monitor Use the basic processes to install agents at Connect Windows computers to Log Analytics and Connect
Operations Manager to Log Analytics.
Note: You’ll need to install at least 2 agents in order to have enough data to discover and monitor your
network resources. Otherwise, the solution will remain in a configuring state until you install and
configure additional agents.
Where to install the agents Before you install agents, consider the topology of your network and what parts of the network you
want to monitor. We recommend that you install more than one agent for each subnet that you want to
monitor. In other words, for every subnet that you want to monitor, choose two or more servers or VMs
and install the agent on them.
If you are unsure about the topology of your network, install the agents on servers with critical
workloads where you want to monitor the network performance. For example, you might want to keep
track of a network connection between a Web Server and a SQL server. In this example, you’d install an
agent on both servers.
Agents monitor network connectivity (links) between hosts -- not the hosts themselves. So, to monitor a
network link, you must install agents on both endpoints of that link.
Configure agents After you’ve installed agents, you’ll need to open firewall ports for those computers to ensure that
agents can communicate. You need to download and then run the EnableRules.ps1 PowerShell script
without any parameters in a power shell window with administrative privileges
The script creates registry keys required by the Network Performance Monitor and it creates Windows
firewall rules to allow agents to create TCP connections with each other. The registry keys created by
the script also specify whether to log the debug logs and the path for logs file. It also defines the agent
TCP port used for communication. The values for these keys are automatically set by the script, so you
should not manually change these keys.
The port opened by default would be 8084. You have the option of using a custom port by providing the parameter ‘portNumber’ to the script. However, the same port should be used on all the machines where the script is executed.
The EnableRules.ps1 script configures Windows firewall rules only on the machine
where the script is run. If you have a network firewall you should make sure that it is
allowing traffic destined for the TCP port being used by NPM.
Configuring the solution Use the following information to install and configure the solution.
1. The Network Performance Monitor solution acquires data from computers running Windows
Server 2008 SP 1 or later or Windows 7 SP1 or later, which are the same requirements as the
Microsoft Monitoring Agent (MMA).
2. Add the Network Performance Monitor solution to your OMS workspace using the process
described in Add Log Analytics solutions from the Solutions Gallery.
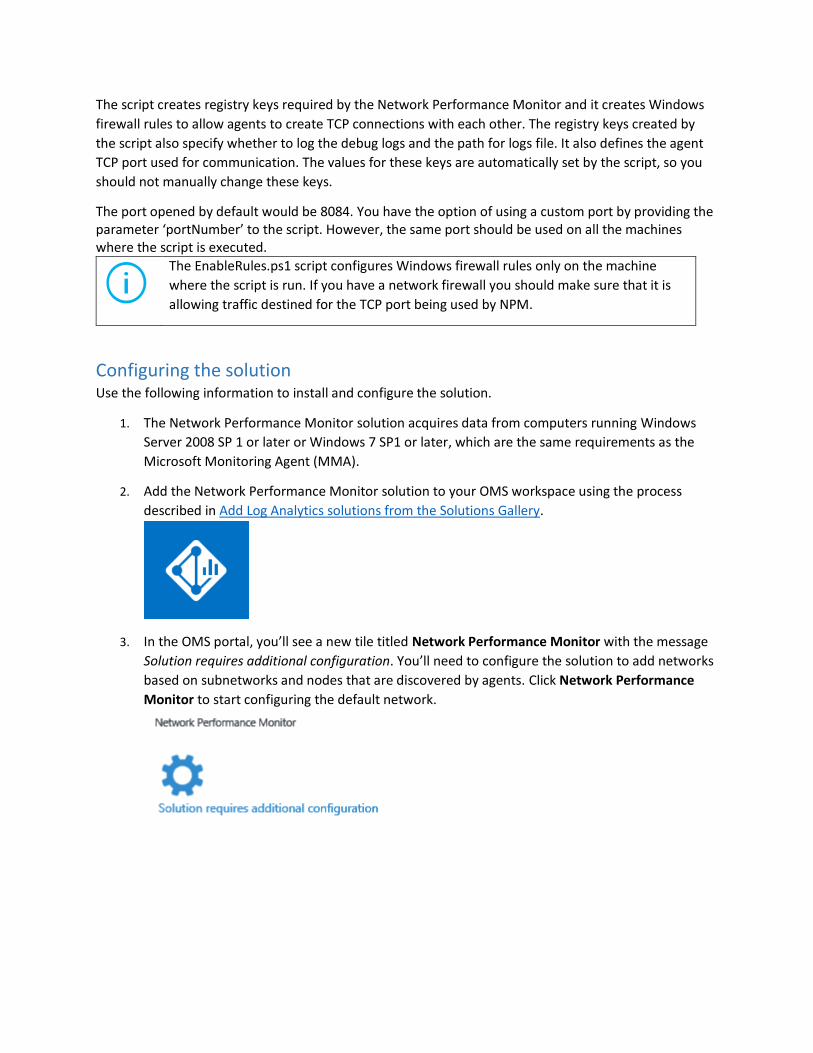
3. In the OMS portal, you’ll see a new tile titled Network Performance Monitor with the message
Solution requires additional configuration. You’ll need to configure the solution to add networks
based on subnetworks and nodes that are discovered by agents. Click Network Performance
Monitor to start configuring the default network.
Configure the solution with a default network On the configuration page, you’ll see a single network named Default. When you haven’t defined any
networks, all the automatically-discovered subnets are placed in the Default network.
Whenever you create a network, you add a subnet to it and that subnet is removed from the Default
network. If you delete a network, all its subnets are automatically returned to the Default network.
In other words, the Default network is the container for all the subnets that are not contained in any
user-defined network. You cannot edit or delete the Default network. It always remains in the system.
However, you can create as many networks as you need.
In most cases, the subnets in your organization will be arranged in more than one network and you
should create one or more networks to logically group your subnets.
Create new networks A network in Network Performance Monitor is a container for subnets. You can create a network with
any name that you want and add subnets to the network. For example, you can create a network named
Building1 and then add subnets, or you can create a network named DMZ and then add all subnets
belonging to demilitarized zone to this network.
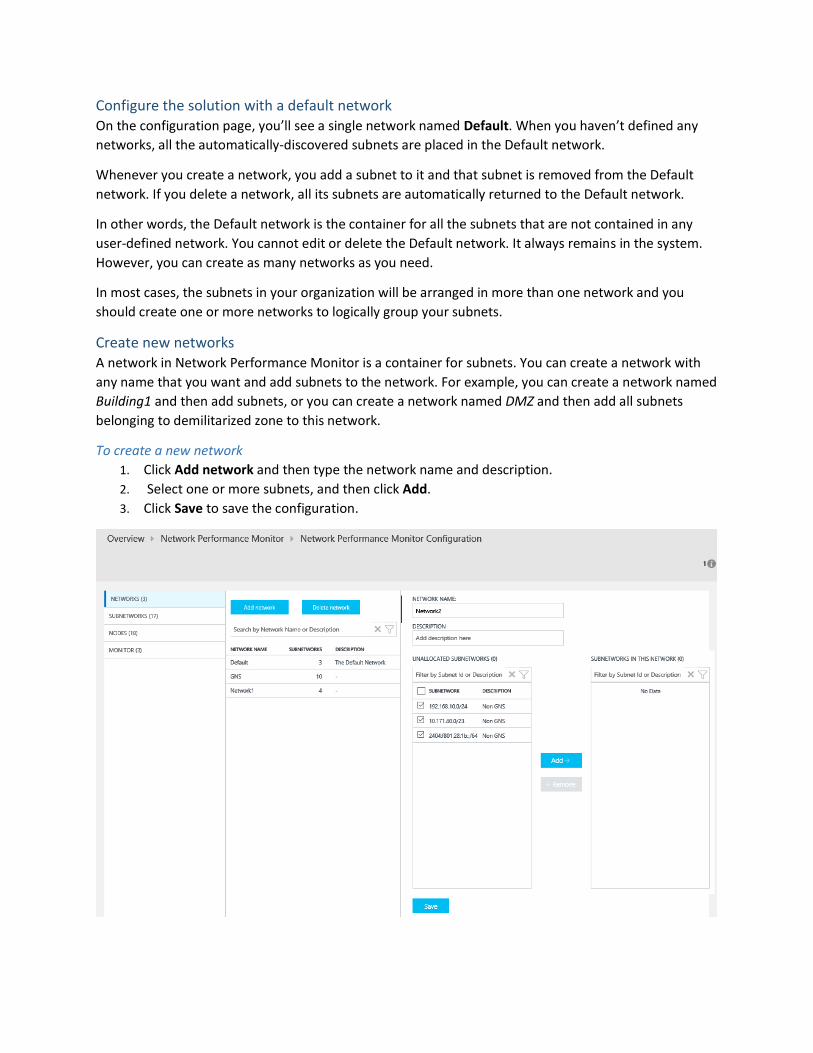
To create a new network
1. Click Add network and then type the network name and description.
2. Select one or more subnets, and then click Add.
3. Click Save to save the configuration.
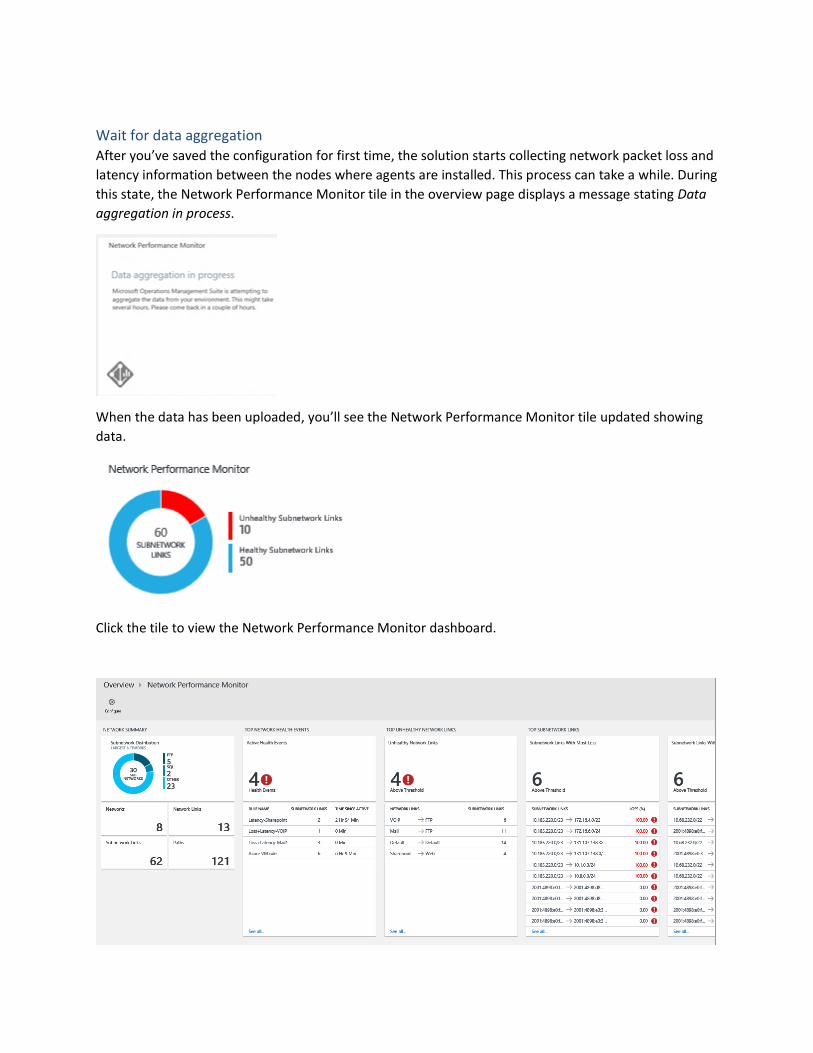
Wait for data aggregation After you’ve saved the configuration for first time, the solution starts collecting network packet loss and
latency information between the nodes where agents are installed. This process can take a while. During
this state, the Network Performance Monitor tile in the overview page displays a message stating Data
aggregation in process.
When the data has been uploaded, you’ll see the Network Performance Monitor tile updated showing
data.
Click the tile to view the Network Performance Monitor dashboard.
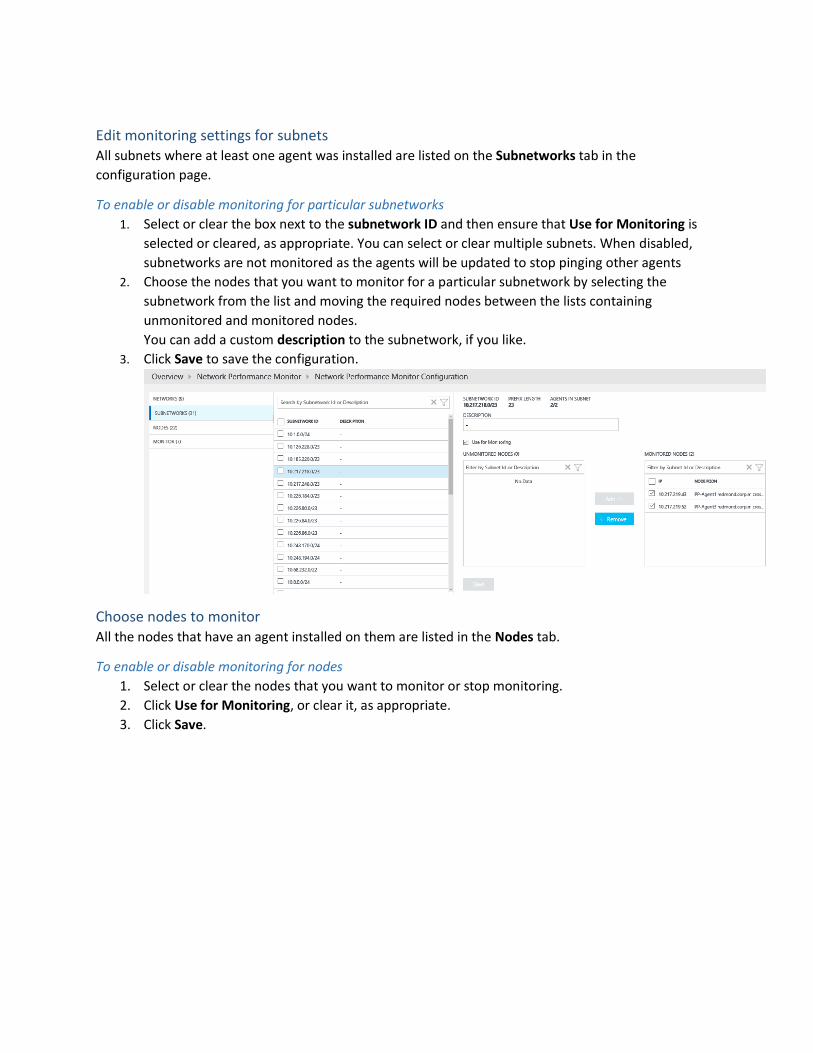
Edit monitoring settings for subnets All subnets where at least one agent was installed are listed on the Subnetworks tab in the
configuration page.
To enable or disable monitoring for particular subnetworks
1. Select or clear the box next to the subnetwork ID and then ensure that Use for Monitoring is
selected or cleared, as appropriate. You can select or clear multiple subnets. When disabled,
subnetworks are not monitored as the agents will be updated to stop pinging other agents
2. Choose the nodes that you want to monitor for a particular subnetwork by selecting the
subnetwork from the list and moving the required nodes between the lists containing
unmonitored and monitored nodes.
You can add a custom description to the subnetwork, if you like.
3. Click Save to save the configuration.
Choose nodes to monitor All the nodes that have an agent installed on them are listed in the Nodes tab.
To enable or disable monitoring for nodes
1. Select or clear the nodes that you want to monitor or stop monitoring.
2. Click Use for Monitoring, or clear it, as appropriate.
3. Click Save.
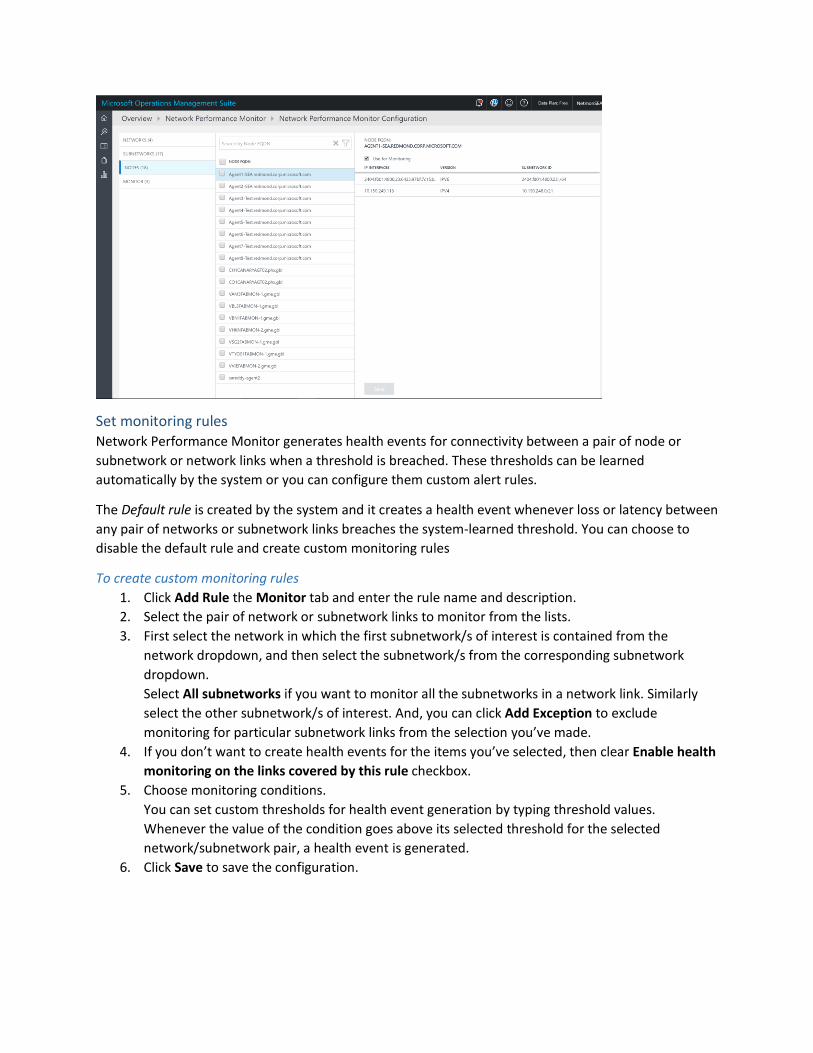
Set monitoring rules Network Performance Monitor generates health events for connectivity between a pair of node or
subnetwork or network links when a threshold is breached. These thresholds can be learned
automatically by the system or you can configure them custom alert rules.
The Default rule is created by the system and it creates a health event whenever loss or latency between
any pair of networks or subnetwork links breaches the system-learned threshold. You can choose to
disable the default rule and create custom monitoring rules
To create custom monitoring rules
1. Click Add Rule the Monitor tab and enter the rule name and description.
2. Select the pair of network or subnetwork links to monitor from the lists.
3. First select the network in which the first subnetwork/s of interest is contained from the
network dropdown, and then select the subnetwork/s from the corresponding subnetwork
dropdown.
Select All subnetworks if you want to monitor all the subnetworks in a network link. Similarly
select the other subnetwork/s of interest. And, you can click Add Exception to exclude
monitoring for particular subnetwork links from the selection you’ve made.
4. If you don’t want to create health events for the items you’ve selected, then clear Enable health
monitoring on the links covered by this rule checkbox.
5. Choose monitoring conditions.
You can set custom thresholds for health event generation by typing threshold values.
Whenever the value of the condition goes above its selected threshold for the selected
network/subnetwork pair, a health event is generated.
6. Click Save to save the configuration.
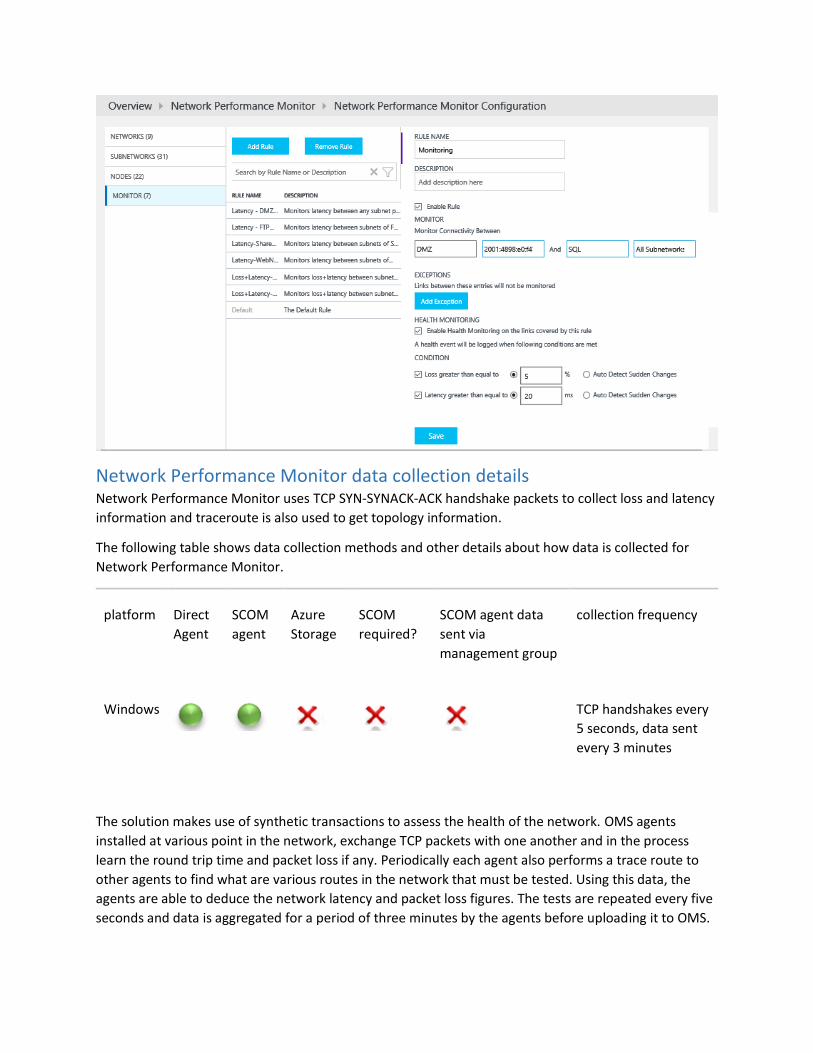
Network Performance Monitor data collection details Network Performance Monitor uses TCP SYN-SYNACK-ACK handshake packets to collect loss and latency
information and traceroute is also used to get topology information.
The following table shows data collection methods and other details about how data is collected for
Network Performance Monitor.
platform Direct
Agent
SCOM
agent
Azure
Storage
SCOM
required?
SCOM agent data
sent via
management group
collection frequency
Windows
TCP handshakes every
5 seconds, data sent
every 3 minutes
The solution makes use of synthetic transactions to assess the health of the network. OMS agents
installed at various point in the network, exchange TCP packets with one another and in the process
learn the round trip time and packet loss if any. Periodically each agent also performs a trace route to
other agents to find what are various routes in the network that must be tested. Using this data, the
agents are able to deduce the network latency and packet loss figures. The tests are repeated every five
seconds and data is aggregated for a period of three minutes by the agents before uploading it to OMS.
Although agents communicate with each other frequently, they do not generate a lot of network traffic while conducting the tests. Agents rely only on TCP SYN-SYNACK-ACK handshake packets to determine the loss and latency -- no data packets are exchanged. During this process, agents communicate with each other only when needed and the agent communication topology is optimized to reduce network traffic.
Using the Network Performance Monitor solution This section explains all the dashboard functions and how to use them.
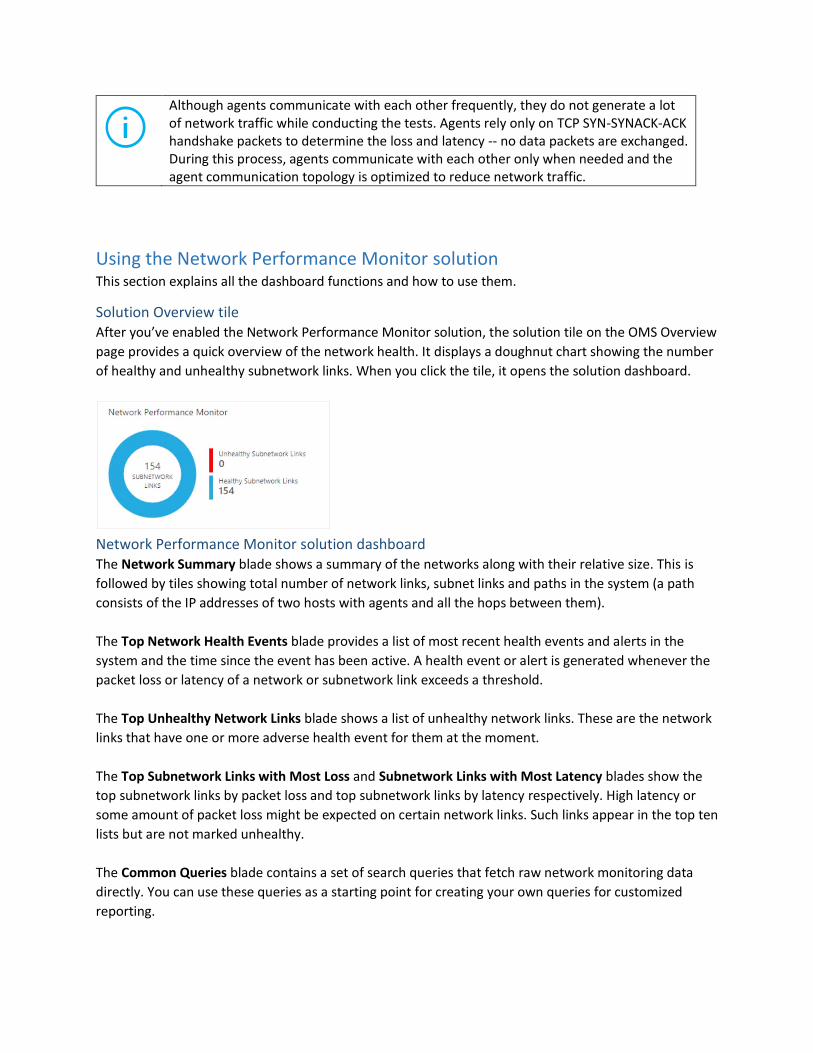
Solution Overview tile After you’ve enabled the Network Performance Monitor solution, the solution tile on the OMS Overview
page provides a quick overview of the network health. It displays a doughnut chart showing the number
of healthy and unhealthy subnetwork links. When you click the tile, it opens the solution dashboard.
Network Performance Monitor solution dashboard The Network Summary blade shows a summary of the networks along with their relative size. This is
followed by tiles showing total number of network links, subnet links and paths in the system (a path
consists of the IP addresses of two hosts with agents and all the hops between them).
The Top Network Health Events blade provides a list of most recent health events and alerts in the
system and the time since the event has been active. A health event or alert is generated whenever the
packet loss or latency of a network or subnetwork link exceeds a threshold.
The Top Unhealthy Network Links blade shows a list of unhealthy network links. These are the network
links that have one or more adverse health event for them at the moment.
The Top Subnetwork Links with Most Loss and Subnetwork Links with Most Latency blades show the
top subnetwork links by packet loss and top subnetwork links by latency respectively. High latency or
some amount of packet loss might be expected on certain network links. Such links appear in the top ten
lists but are not marked unhealthy.
The Common Queries blade contains a set of search queries that fetch raw network monitoring data
directly. You can use these queries as a starting point for creating your own queries for customized
reporting.

Drill-down for depth You can click various links on the solution dashboard to drill-down deeper into any area of interest. For
example, when you see an alert or an unhealthy network link appear on the dashboard, you can click it
to investigate further. You’ll be taken to a page that lists all the subnetwork links for the particular
network link. You will be able to see the loss, latency and health status of each subnetwork link and
quickly find out what subnetwork links are causing the problem. You can then click View node links to
see all the node links for the unhealthy subnet link. Then, you can see individual node-to-node links and
find the unhealthy node links.
You can click View topology to view the hop-by-hop topology of the routes between the source and
destination nodes and the unhealthy routes or hops are shown in red show that you can quickly identify
the problem to a particular portion of the network.
Trend charts
At each level that you the drill-down, you’ll can see the trend of loss and latency for a network link.
Trend charts are also available for Subnetwork and Node links. You can change the time interval for the
graph to plot by using the time control at the top of the chart.
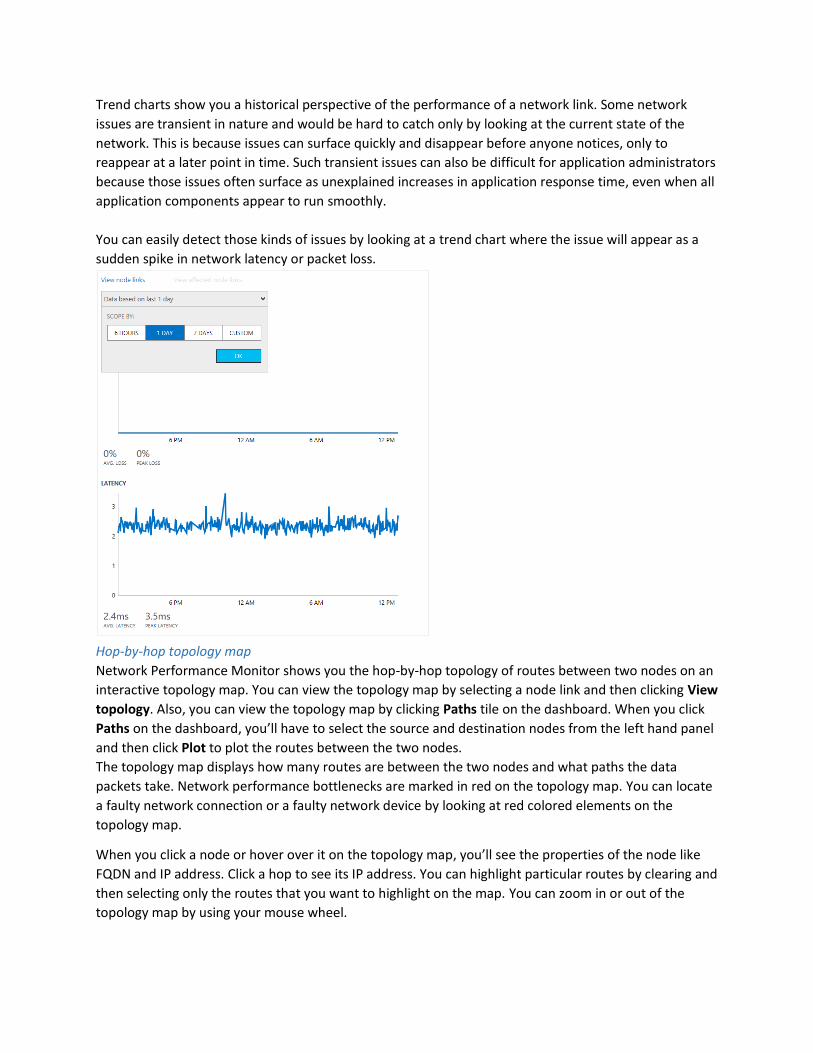
Trend charts show you a historical perspective of the performance of a network link. Some network
issues are transient in nature and would be hard to catch only by looking at the current state of the
network. This is because issues can surface quickly and disappear before anyone notices, only to
reappear at a later point in time. Such transient issues can also be difficult for application administrators
because those issues often surface as unexplained increases in application response time, even when all
application components appear to run smoothly.
You can easily detect those kinds of issues by looking at a trend chart where the issue will appear as a
sudden spike in network latency or packet loss.
Hop-by-hop topology map
Network Performance Monitor shows you the hop-by-hop topology of routes between two nodes on an
interactive topology map. You can view the topology map by selecting a node link and then clicking View
topology. Also, you can view the topology map by clicking Paths tile on the dashboard. When you click
Paths on the dashboard, you’ll have to select the source and destination nodes from the left hand panel
and then click Plot to plot the routes between the two nodes.
The topology map displays how many routes are between the two nodes and what paths the data
packets take. Network performance bottlenecks are marked in red on the topology map. You can locate
a faulty network connection or a faulty network device by looking at red colored elements on the
topology map.
When you click a node or hover over it on the topology map, you’ll see the properties of the node like
FQDN and IP address. Click a hop to see its IP address. You can highlight particular routes by clearing and
then selecting only the routes that you want to highlight on the map. You can zoom in or out of the
topology map by using your mouse wheel.
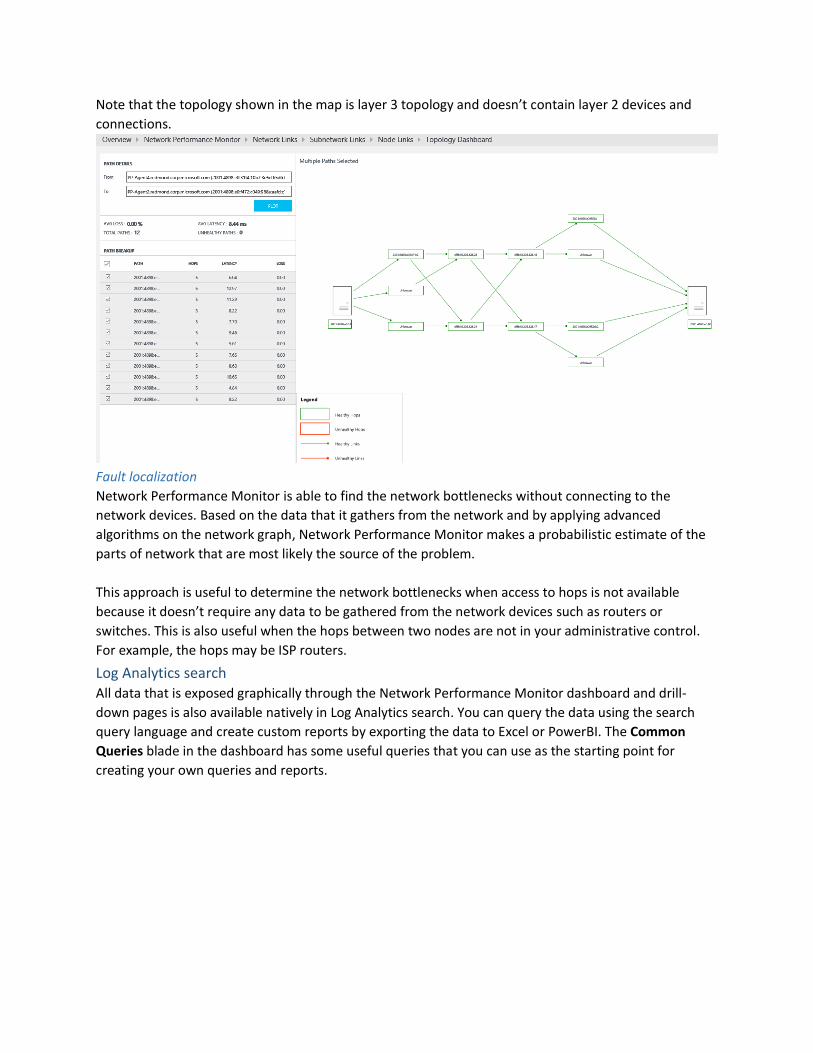
Note that the topology shown in the map is layer 3 topology and doesn’t contain layer 2 devices and
connections.
Fault localization
Network Performance Monitor is able to find the network bottlenecks without connecting to the
network devices. Based on the data that it gathers from the network and by applying advanced
algorithms on the network graph, Network Performance Monitor makes a probabilistic estimate of the
parts of network that are most likely the source of the problem.
This approach is useful to determine the network bottlenecks when access to hops is not available
because it doesn’t require any data to be gathered from the network devices such as routers or
switches. This is also useful when the hops between two nodes are not in your administrative control.
For example, the hops may be ISP routers.
Log Analytics search All data that is exposed graphically through the Network Performance Monitor dashboard and drill-
down pages is also available natively in Log Analytics search. You can query the data using the search
query language and create custom reports by exporting the data to Excel or PowerBI. The Common
Queries blade in the dashboard has some useful queries that you can use as the starting point for
creating your own queries and reports.
Conduct a simple investigation for root-causing a health alert Now that you’ve read about Network Performance Monitor, let’s look at a simple investigation into the
root-cause for a health event.
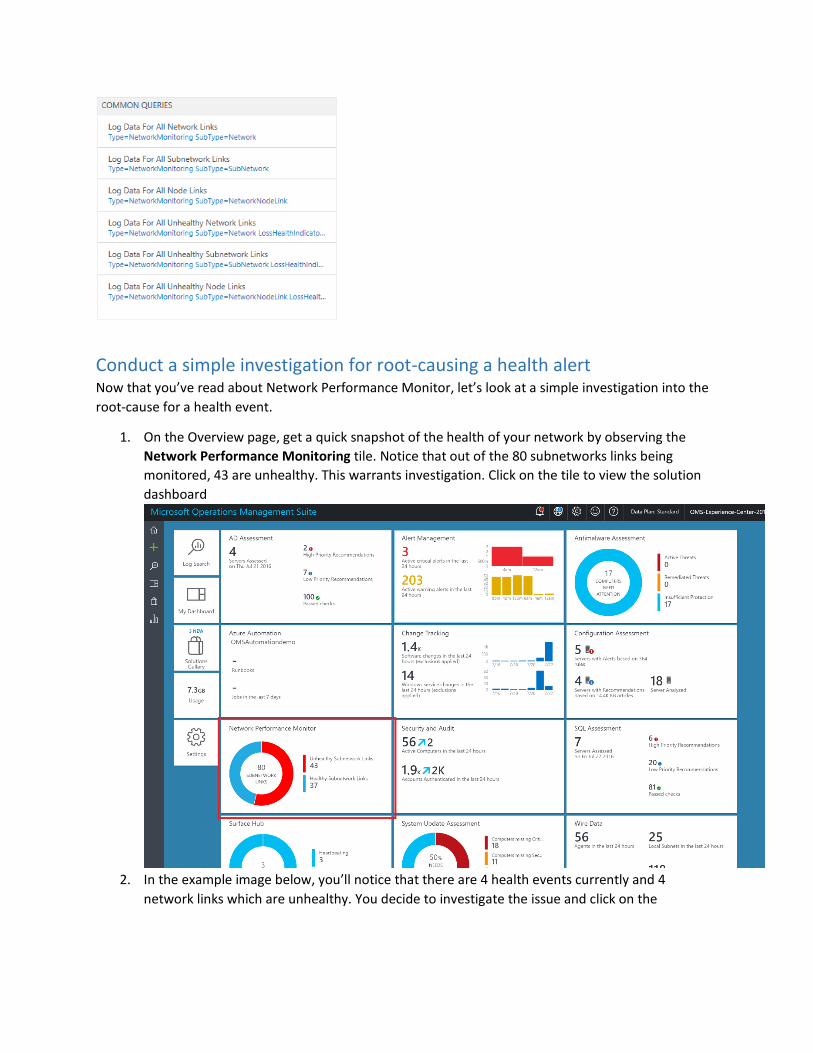
1. On the Overview page, get a quick snapshot of the health of your network by observing the
Network Performance Monitoring tile. Notice that out of the 80 subnetworks links being
monitored, 43 are unhealthy. This warrants investigation. Click on the tile to view the solution
dashboard
2. In the example image below, you’ll notice that there are 4 health events currently and 4
network links which are unhealthy. You decide to investigate the issue and click on the
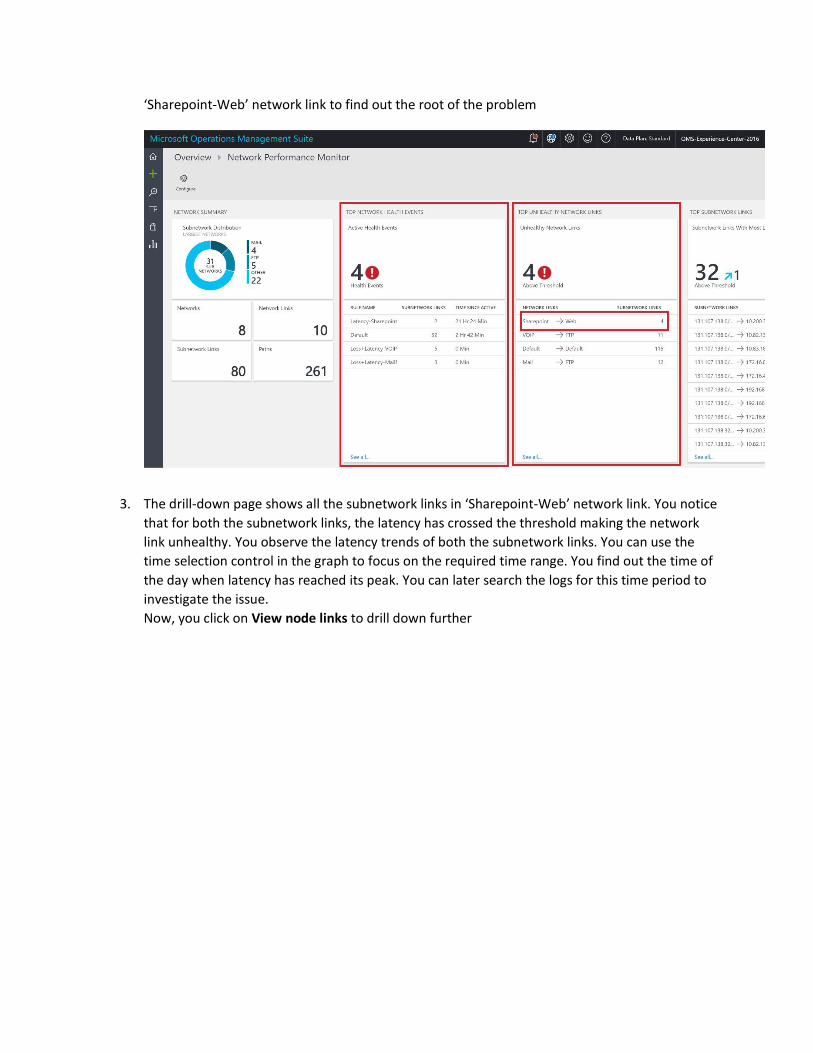
‘Sharepoint-Web’ network link to find out the root of the problem
3. The drill-down page shows all the subnetwork links in ‘Sharepoint-Web’ network link. You notice
that for both the subnetwork links, the latency has crossed the threshold making the network
link unhealthy. You observe the latency trends of both the subnetwork links. You can use the
time selection control in the graph to focus on the required time range. You find out the time of
the day when latency has reached its peak. You can later search the logs for this time period to
investigate the issue.
Now, you click on View node links to drill down further
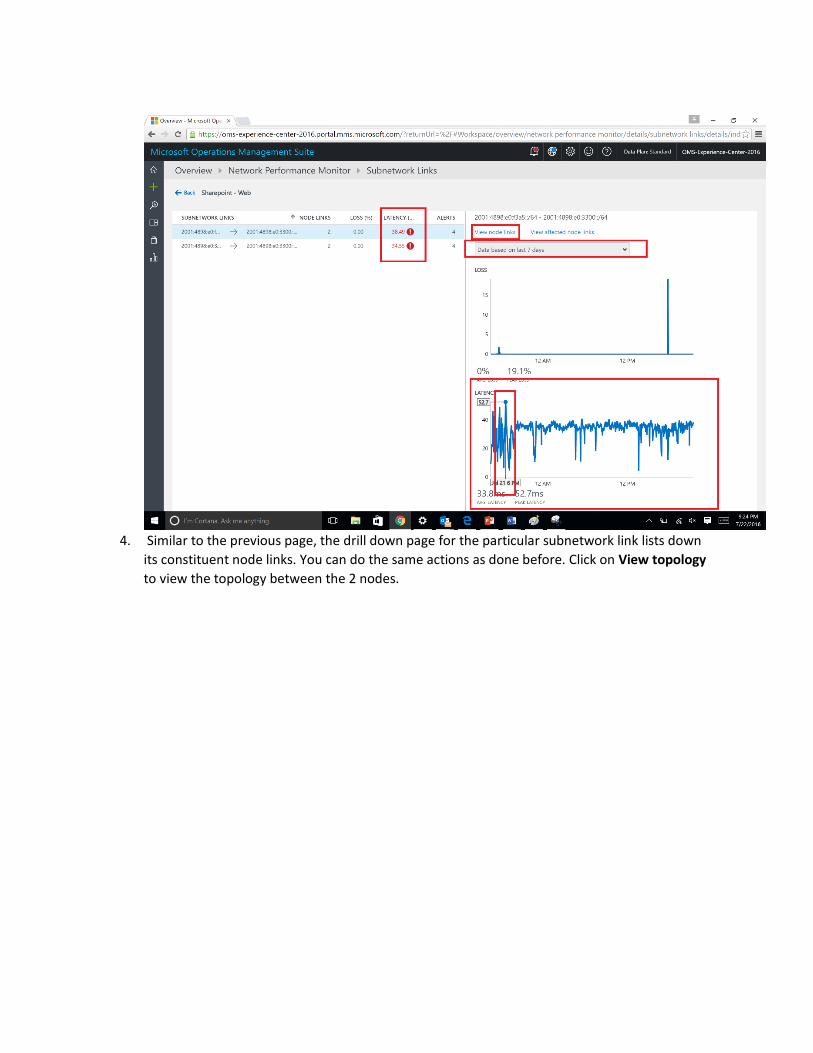
4. Similar to the previous page, the drill down page for the particular subnetwork link lists down
its constituent node links. You can do the same actions as done before. Click on View topology
to view the topology between the 2 nodes.
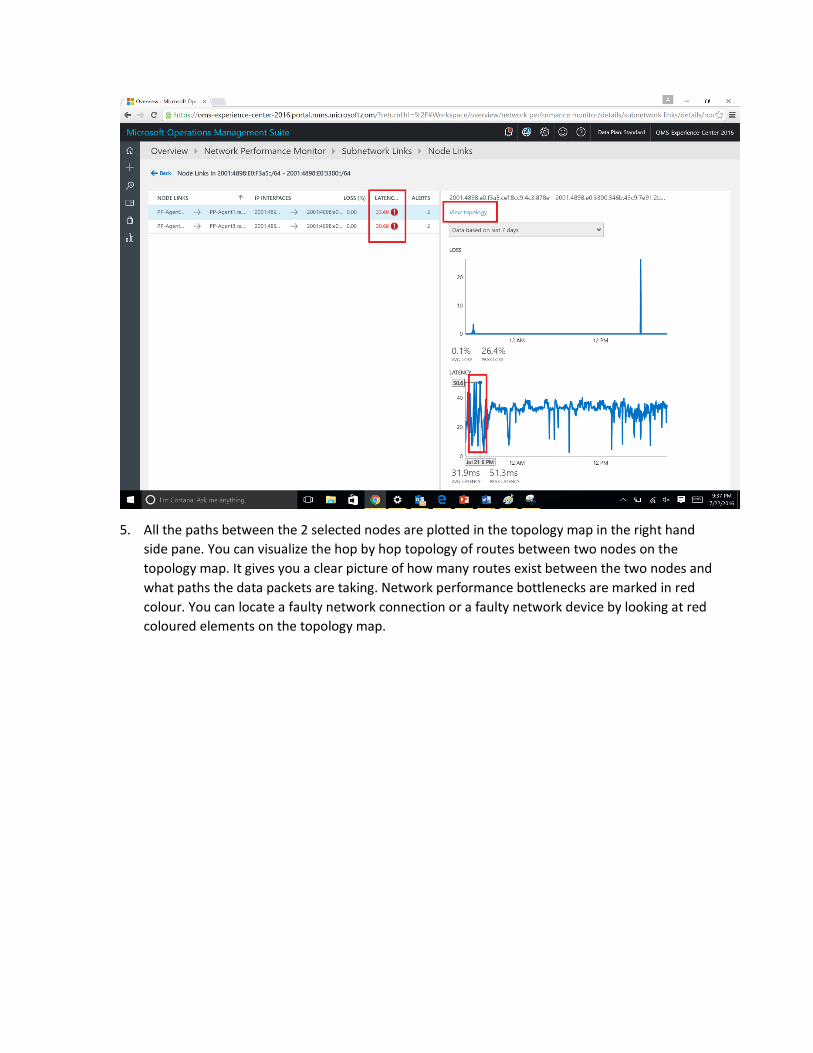
5. All the paths between the 2 selected nodes are plotted in the topology map in the right hand
side pane. You can visualize the hop by hop topology of routes between two nodes on the
topology map. It gives you a clear picture of how many routes exist between the two nodes and
what paths the data packets are taking. Network performance bottlenecks are marked in red
colour. You can locate a faulty network connection or a faulty network device by looking at red
coloured elements on the topology map.
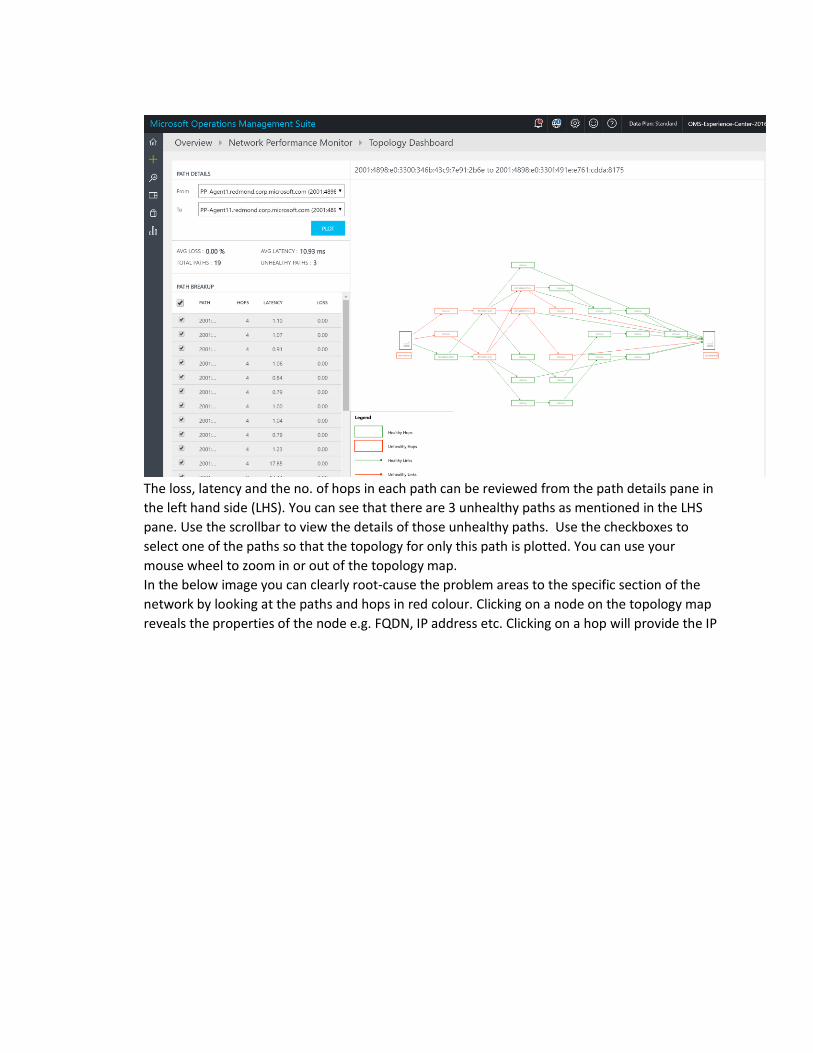
The loss, latency and the no. of hops in each path can be reviewed from the path details pane in
the left hand side (LHS). You can see that there are 3 unhealthy paths as mentioned in the LHS
pane. Use the scrollbar to view the details of those unhealthy paths. Use the checkboxes to
select one of the paths so that the topology for only this path is plotted. You can use your
mouse wheel to zoom in or out of the topology map.
In the below image you can clearly root-cause the problem areas to the specific section of the
network by looking at the paths and hops in red colour. Clicking on a node on the topology map
reveals the properties of the node e.g. FQDN, IP address etc. Clicking on a hop will provide the IP
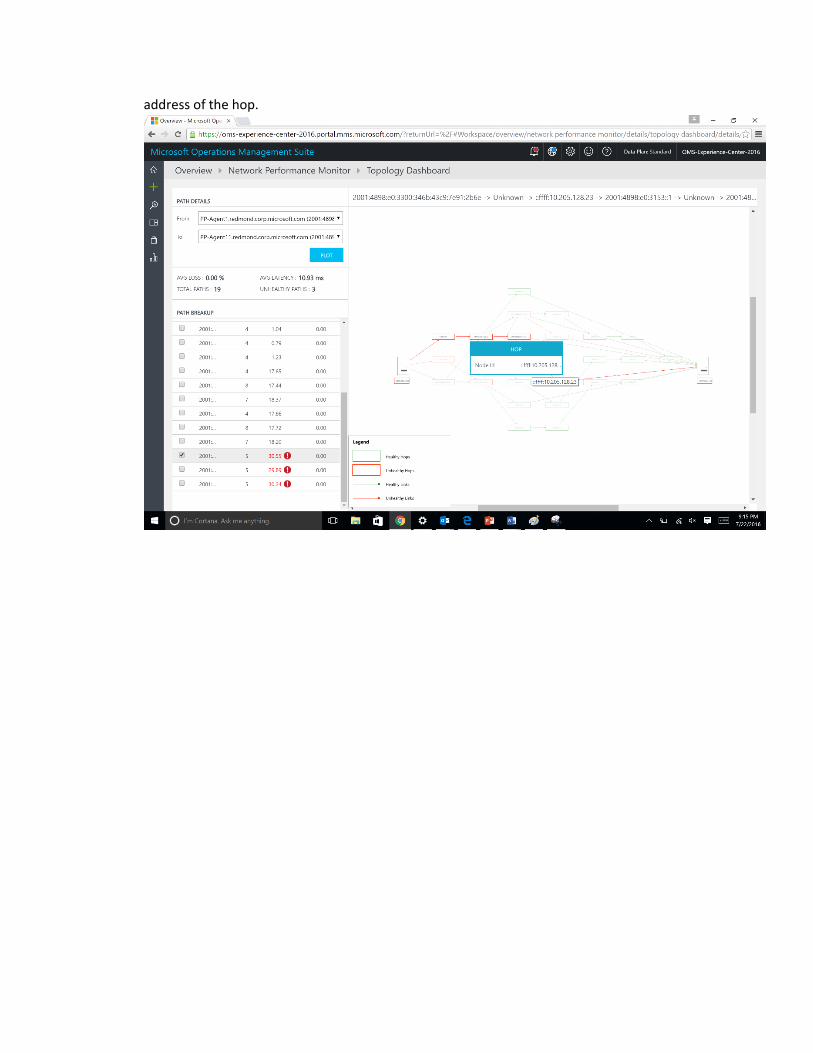
address of the hop.


![Performance Monitor RedPaper[1]](https://img.pdfslide.us/doc/110x75/5520172a4a79595e718b4621/performance-monitor-redpaper1.jpg)