Embed Size (px)
DESCRIPTION
network monitoring tool, adalah aplikasi untuk memonitoring jaringan.
Citation preview
Network Monitoring On Debian With Nagios
By:
Robema Nainggola
0872268
Fakultas Teknologi Informasi
Jurusan Teknik Informatika
Universitas Kristen Maranatha
Bandung
2011

1.NAGIOS(Nagios Ain't Gonna Insist On Sainthood)
-Instalasi
#apt-get install nagios3
-Masuk ke folder konfigurasi nagios
#cd /etc/nagios3.
- Bikin username dan password untuk akses nagios
#htpasswd -c htpasswd.users nagiosadmin
- restart nagios
#/etc/init.d/nagios3 restart
-Buka browser lalu browse ke http://localhost/nagios
-Masukkan username dan password yang di isi pada saat konfigurasi tadi
-untuk menambahkan atau menghapus service yang akan dipakai
#pico services_nagios2.cfg
-untuk menambahkan atau menghapus list yang akan dimonitor
#pico hostgroups_nagios2.cfg
2.DARKSTAT
Salah satu tools untuk monitoring yang ada di debian adalah darkstat
Fitur2 darkstat
Traffic graphs.
Tracks traffic per host.
Tracks traffic per TCP and UDP port for each host.
Embedded web-server with deflate compression.
Asynchronous reverse DNS resolution using a child process.
Small. Portable. Single-threaded. Efficient.
-Instalasi
#apt-get install darkstat
-edit file konfigurasi
#pico /etc/darkstat/init.cfg
-ganti start_darkstat=no
-menjadi start_darkstat=yes
-restart darkstat
#/etc/init.d/darkstat restart
-untuk memulai ketikkan perintah
# darkstat
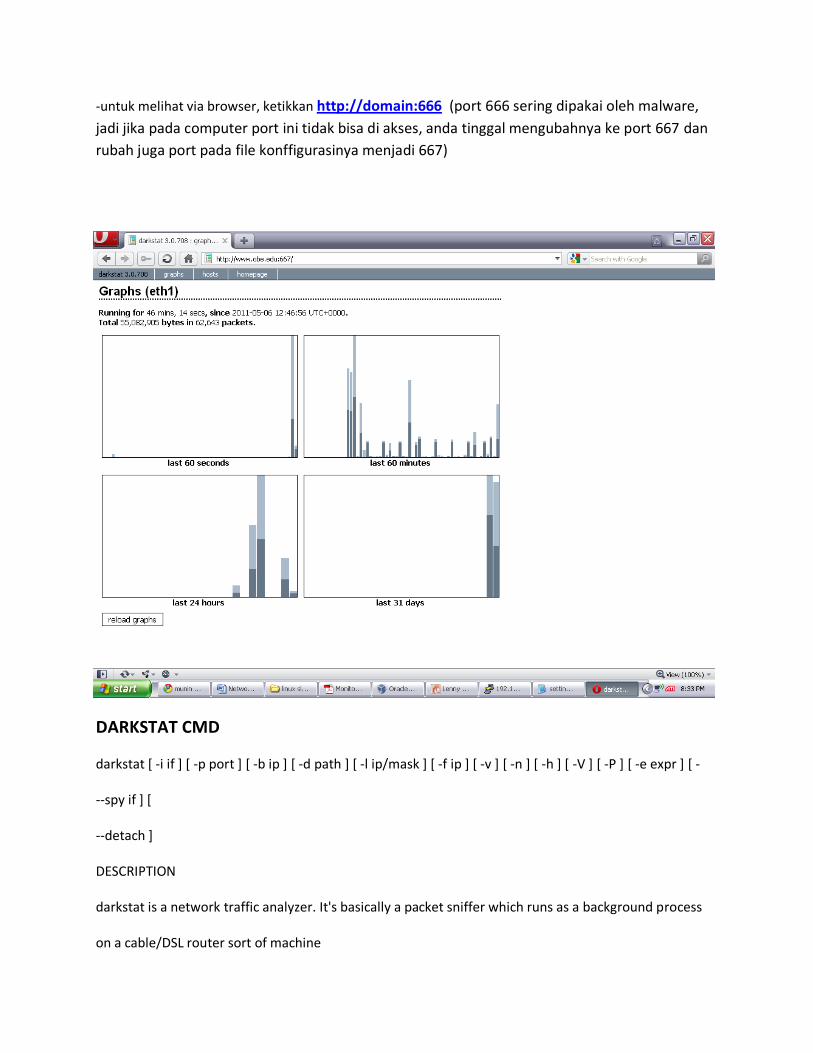
-untuk melihat via browser, ketikkan http://domain:666 (port 666 sering dipakai oleh malware,
jadi jika pada computer port ini tidak bisa di akses, anda tinggal mengubahnya ke port 667 dan
rubah juga port pada file konffigurasinya menjadi 667)
DARKSTAT CMD
darkstat [ -i if ] [ -p port ] [ -b ip ] [ -d path ] [ -l ip/mask ] [ -f ip ] [ -v ] [ -n ] [ -h ] [ -V ] [ -P ] [ -e expr ] [ -
--spy if ] [
--detach ]
DESCRIPTION
darkstat is a network traffic analyzer. It's basically a packet sniffer which runs as a background process
on a cable/DSL router sort of machine

and tallies up all sorts of useless but interesting statistics.
All settings are passed on the commandline.
OPTIONS
-i if Listen on the network interface specified by if, rather than the default interface that libpcap returns.
-p port
Serve statistics on the specified port instead of the default 666.
-b ip Bind the web interface to the specified local IP, instead of all interfaces.
-d path
Store database files in path instead of the current working directory.
-l ip/mask
When running a 2.4.x Linux kernel with NAT, packets are mangled before libpcap catches them. To get
proper accounting of transfer statis-
tics, you have to describe your local network address space.
For example, if all the local machines have an IP of 192.168.0.x, your ip/mask should be
192.168.0.0/255.255.255.0.
-f ip Force the local IP to the given value. This is mainly for multihomed servers.
-v Enable verbose mode. You will see lines of text about packets begin processed and some verbose
information about what the DNS and WWW
threads are doing.
-n Turns off DNS resolution. You can turn it back on using the web interface.
-h Displays the help/usage statement.
-V Displays the version information.
-P Prevents darkstat from putting the interface into promiscuous mode. (Default behaviour is to go
promiscuous if possible)

-e expr
Passes the specified packet filter expression to libpcap. Refer to the libpcap and tcpdump
documentation for the syntax.
--spy if
Capture packets on specified interface (hint: the local one) and look for HTTP requests and log them to
darkstat.spylog.YYMMDD
--detach
Detach from the controlling TTY and run in the background like a daemon.
3.MRTG (Multi Router Traffic Grapher)
Instalasi
#apt-get install mrtg
Hasil dari instalasi akan disimpan di dir var/www/mrtg, jika ingin mengesetnya dari konfigurasi
standard, anda bisa menempatkannya di home/www/mrtg
-install snmp
#apt-get install snmp snmpd
-direktori penginstalan akan berada di /etc/snmp
Edit berkas konfigurasi
#pico /etc/snmp/snmpd.conf
Ubah settingan dasar yang tadinya
com2sec paranoid default public
#com2sec readonly default public
#com2sec readwrite default private
#com2sec paranoid default public
com2sec readonly default public
#com2sec readwrite default private
-restart layanan snmpd

#/etc/init.d/snmpd restart
Lakukan perintah #snmpwalk -v1 -c public localhost #cfgmaker --global 'WorkDir: /var/www/mrtg' --output /etc/mrtg.cfg [email protected] #indexmaker /etc/mrtg.cfg --columns=1 --output /var/www/mrtg/index.html -kopi folder untuk work directory dari var/www/mrtg Menjadi Home/www/mrtg Lalu lakukan perintah #mrtg Untuk web based interface anda tinggal mengetikkan http://domain/mrtg
4.MUNIN
-instalasi
#apt-get install munin munin-node
File konfigurasi akan berada di /etc/munin Edit file konfigurasi #pico /etc/munin/munin.conf
-ubah
dbdir /var/lib/munin
htmldir /var/www/munin
logdir /var/log/munin
rundir /var/run/munin
# a simple host tree
[localhost.localdomain]
address 127.0.0.1
use_node_name yes
Menjadi
dbdir /var/lib/munin
htmldir /home/www/munin/www.obe.com
logdir /var/log/munin
rundir /var/run/munin
# a simple host tree
[www.obe.com]
address 127.0.0.1
use_node_name yes
Save lalu selanjutnya membuat direktori munin
#mkdir -p /home/www/munin/www.obe.edu -ganti hak akses #chown munin:munin /home/www/munin/www.apedie.com
-restart munin
/etc/init.d/munin-node restart Pada browser ketikkan http://domain/munin

5.NTOP
Unix (including Linux, *BSD, Solaris, and MacOSX)
Win32 (Win95 and above)
Download ntop for Linux,Unix and Windows
http://www.ntop.org/ntop.html
Integrating ntop with NetFlow
http://www.ntop.org/netflow.html
http://nst.sourceforge.net/nst/docs/user/ch09.html
Integrating ntop with RRD
http://www.ntop.org/RRD/index.html
ntop Documentation
http://www.ntop.org/documentation.html
Install ntop in debian
#apt-get install ntop
During the setup it will ask you to select the interface nTop will listen on (i.e. put in promiscuous mode). Note that it says that you can enter a comma-separated list of interfaces so you could install multiple NICs in a system and monitor multiple LAN segments
on the same system. Accept the ntop user name by hitting Enter. After the program is set up you'll see the message: device eth0 entered promiscuous mode
A few seconds later you'll see the message: device eth0 left promiscuous mode The NIC dropping out of promiscuous mode indicates a problem. Here the "problem" is that we need to set a password for the nTop account we created during the nTop installation (that the daemon uses). To do that, enter the command #ntop -A or # ntop --set-admin-password
The uppercase A switch is for setting the program's Admin password. After entering (and re-entering) a password, reboot the system. Just before the login prompt appears you'll see that the NIC has again gone into promiscuous mode. But now, if you were to wait and watch, it would not drop out of promiscuous mode as it did before. There is no need to log into the system because nTop runs as a daemon. Now that nTop is configured and running, just point a Web browser at port 3000 on the Debian system. For example, if the Debian system's IP address is 10.2.0.20 then you'd type in the following in the address bar of a browser running on a system on the same network: http://10.2.0.20:3000/
If you want to start and stop ntop run the following commands
#/etc/init.d/ntop stop
#/etc/init.d/ntop start
If have any problems you need to check the readme file located at /usr/share/doc/ntop/README.Debian this file details as follows
ntop admin password need to be set: =================================== When ntop is installed at the first time, you MUST set the administration password for ntop (user 'admin'). You do that by running ntop with the option -A (or --set-admin-password) as root.
# ntop --set-admin-password It will prompt you for the password and then exit. Now start the ntop daemon.
# /etc/init.d/ntop start Note that you can not run ntop as a user as it need full access to the devices and only root have such access. After it has got that access it will change user to ntop or whatever you have configured it to. You have to make sure that the user have access files in /var/lib/ntop. This is
normally fixed by the installation script but it may fail. Ntop will be started at every reboot when the admin password has been set. ntop protocol list: =================== If you start ntop in daemon mode with the supplied init script it will automatically use /etc/ntop/protocol.list to choose which TCP Protocols should be monitored. The format of this file is simply: <label>=<protocol list> where label is used to symbolically identify the <protocol list>. The
format of <protocol list> is <protocol>[|<protocol>], where <protocol> is either a valid protocol specified inside the /etc/services file or a numeric port range (e.g. 80, or 6000-6500). Dennis Schoen (Mon Dec 17 14:10:25 CET 2001) log and rotation: ================= Logs are placed in /var/log/ntop/ and will be rotated every week. The log rotation will restart the ntop server which will reset the ntop statistics. If you want to keep the statistics you have to edit or delete the /etc/logrotate.d/ntop file.
6.HTOP
-instalasi
#apt-get install htop
-menjalankan aplikasi
#htop
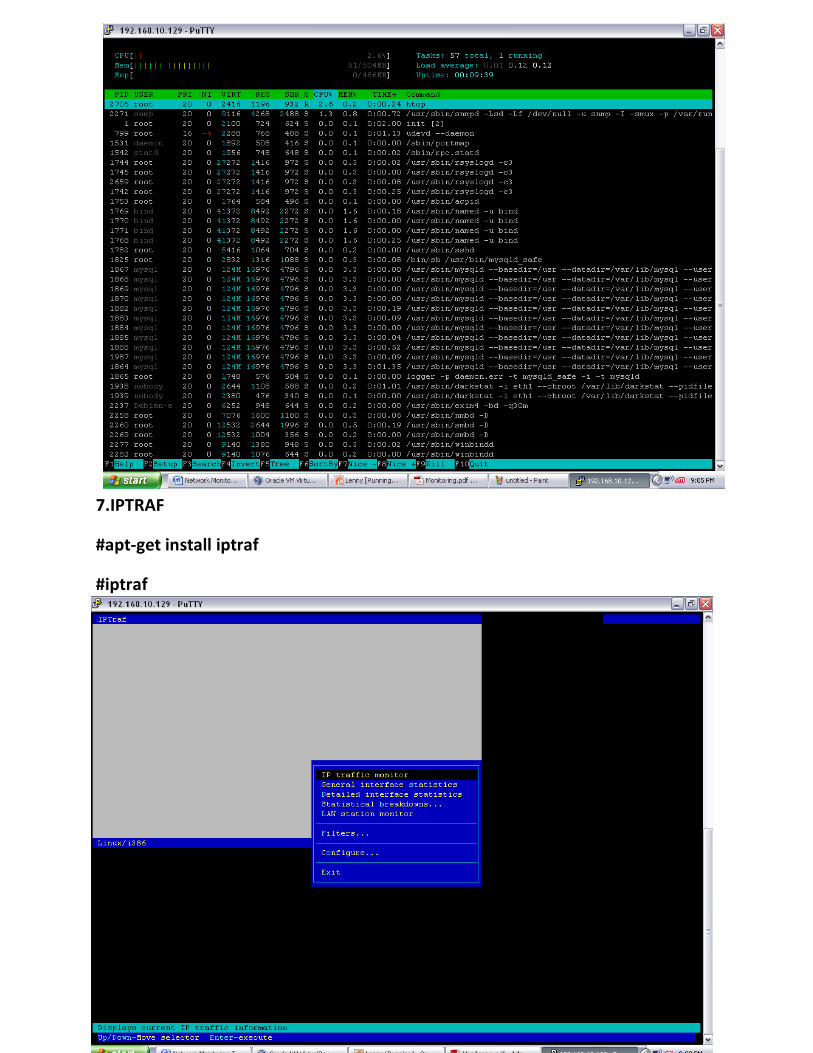
7.IPTRAF
#apt-get install iptraf
#iptraf


![LE840/LE850 Network Tool Manual Technical ReferenceCheck [Management and Monitoring Tools], then click [Details…]. 4. The [Management and Monitoring Tools] screen appears. Check](https://img.pdfslide.us/doc/110x75/5ed0924c4cbc3b53183f9744/le840le850-network-tool-manual-technical-reference-check-management-and-monitoring.jpg)