Embed Size (px)
Citation preview
LUT University
School of Engineering Science
Erasmus Mundus Master’s in Pervasive Computing and Communications
for Sustainable Development (PERCCOM)
Feruzjon MUYASSAROV
NETWORK FUNCTION VIRTUALIZATION DEPLOYMENT
SCENARIO DIMENSIONING
Examiners: Professor Eric Rondeau (University of Lorraine)Professor Jari Porras (LUT University)Associate Professor Karl Andersson (Lulea University of Technology)
Supervisors: Professor Eric Rondeau (University of Lorraine)Associate Professor Jean-Philippe Georges (University of Lorraine)Joel Penhoat (Orange Labs)Marc Vautier (Orange Labs)
This thesis is prepared as part of a European Erasmus Mundus programme PERCCOM
– Pervasive Computing & COMmunications for Sustainable Development.
This thesis has been accepted by partner institutions of the consortium (cf. UDL-DAJ,
n°1524, 2012 PERCCOM agreement).
Successful defense of this thesis is obligatory for graduation with the following national
diplomas:
• Master in Complex Systems Engineering (University of Lorraine)
• Master of Science in Technology (LUT University)
• Master of Science in Computer Science and Engineering, specialization in Pervasive
Computing and Communications for Sustainable Development (Lulea University of
Technology)
i
ABSTRACT
LUT University
School of Engineering Science
Erasmus Mundus Master’s in Pervasive Computing and Communications
for Sustainable Development (PERCCOM)
Feruzjon Muyassarov Norpulatovich
Network Function Virtualization Deployment Scenario Dimensioning
Master’s Thesis
68 pages, 25 figures, 4 tables, 2 appendices
Examiners: Professor Eric Rondeau (University of Lorraine)
Professor Jari Porras (LUT University)
Associate Professor Karl Andersson (Lulea University of Technology)
Keywords: Cloud-RAN, DVFS, virtualization, functional split, power consumption.
In this work we analyse the energy impact of commoditization and virtualization of net-
work functions with the focus on Cloud-Radio Access Network (C-RAN). Two RAN func-
tional split options are chosen to study energy variation of different deployment architec-
tures. Furthermore, we demonstrate energy consumption when executing RAN processes
on commodity hardware based on mathematical models. As such, we investigate possible
energy efficiency with energy optimization techniques like DVFS when executing n num-
ber of concurrent tasks on multicore system. As a proof of concept, we perform set of
RAN performance evaluation experiments on fully virtualized end-to-end mobile network,
implemented using OpenAirInterface (OAI) code. Observations show important results
from the energy viewpoint when deploying different functional spit options of RAN VNFs
as well possible energy gain without performance degradation.
ii
ACKNOWLEDGEMENTS
I would like start by expressing my deep gratitude to Joel Penhoat at Orange Labs, my
research supervisor for patient guidance, encouragement, ideas and of course for shar-
ing valuable and incredible research experience. Thank you for always being ready to
encourage me to come up with ideas.
Special thanks to Stephane Tuffin at Orange Labs, without whom this work would not
be possible. Thank you very much for your guidance with OpenAirInterface implementa-
tion and for letting me explore wind surfing.
To Veronica Quintuna at Orange Labs, for your contribution to this work and for
introducing me the life in Lannion. Thank you very much.
To Olivier Roger at Orange Labs, my manager. Thank you very much your suggestions
and for creating independent working environment.
To all engineers of WD department at Orange Labs, thank you for warm welcome and
for sharing friendship and letting me join to your family. I wish to have such a friendly
colleagues in the future.
I am sincerely grateful to Prof. Eric Rondeau, the PERCCOM programme[16] coor-
dinator for initiating this incredible life-changing PERCCOM program. Thank you very
much for choosing me to grant Erasmus Mundus scholarship.
To my supervisor Prof. Jean-Philippe Georges, this work would not be possible without
your guidance. Thank you for valuable suggestions and recommendations.
To Prof. Jari Porras and Prof. Karl Andersson, the country coordinators, for the
knowledge you shared during these past two years and for your valuable suggestions.
To the PERCCOM consortium, professors from all partner universities, researches, all
administrative staff and to Caroline Schrepff for guiding us from the very beginning of our
PERCCOM life.
iii

To all my PERCCOM family (Cohort 5), for sharing friendship, love and for making
lifelong memories. I wish all the best wishes to each and every one of you.
Lastly, to my mother Xismatullina Flura, for your love, endless support, care without
which I would not achieve all of these. Thank you very much.
Muyassarov Feruzjon Norpulatovich
Lannion, France
7 June, 2019
iv
TABLE OF CONTENTS
1 INTRODUCTION . . . . . . . . . . . . . . . . . . . . . . . . . . . . . . . . . 11
1.1 Research Problems . . . . . . . . . . . . . . . . . . . . . . . . . . . . . . . 14
1.2 Research Goals . . . . . . . . . . . . . . . . . . . . . . . . . . . . . . . . . 14
1.3 Research Questions . . . . . . . . . . . . . . . . . . . . . . . . . . . . . . . 15
1.4 Contribution . . . . . . . . . . . . . . . . . . . . . . . . . . . . . . . . . . . 15
1.5 Thesis Organization . . . . . . . . . . . . . . . . . . . . . . . . . . . . . . . 15
2 RELATED WORK . . . . . . . . . . . . . . . . . . . . . . . . . . . . . . . . 17
2.1 Virtualization . . . . . . . . . . . . . . . . . . . . . . . . . . . . . . . . . . 17
2.1.1 Virtual Machines . . . . . . . . . . . . . . . . . . . . . . . . . . . . 17
2.1.2 Containers . . . . . . . . . . . . . . . . . . . . . . . . . . . . . . . . 18
2.2 Cloud computing . . . . . . . . . . . . . . . . . . . . . . . . . . . . . . . . 20
2.2.1 Cloud Service Models . . . . . . . . . . . . . . . . . . . . . . . . . . 20
2.3 Network Function Virtualization . . . . . . . . . . . . . . . . . . . . . . . . 21
2.3.1 Formal Defition . . . . . . . . . . . . . . . . . . . . . . . . . . . . . 21
2.3.2 Architecture . . . . . . . . . . . . . . . . . . . . . . . . . . . . . . . 23
2.4 C-RAN . . . . . . . . . . . . . . . . . . . . . . . . . . . . . . . . . . . . . . 24
2.4.1 Functional split . . . . . . . . . . . . . . . . . . . . . . . . . . . . . 26
2.5 Performance optimization . . . . . . . . . . . . . . . . . . . . . . . . . . . 31
2.5.1 Processor Power States . . . . . . . . . . . . . . . . . . . . . . . . . 31
2.5.2 Frequency scaling . . . . . . . . . . . . . . . . . . . . . . . . . . . . 31
2.5.3 DVFS . . . . . . . . . . . . . . . . . . . . . . . . . . . . . . . . . . 32
2.6 Software-defined Power Meters . . . . . . . . . . . . . . . . . . . . . . . . . 33
2.6.1 Power Gadget . . . . . . . . . . . . . . . . . . . . . . . . . . . . . . 33
2.6.2 Joulemeter . . . . . . . . . . . . . . . . . . . . . . . . . . . . . . . . 33
2.6.3 PowerAPI . . . . . . . . . . . . . . . . . . . . . . . . . . . . . . . . 33
2.6.4 BitWatts . . . . . . . . . . . . . . . . . . . . . . . . . . . . . . . . . 34
3 METHODOLOGY . . . . . . . . . . . . . . . . . . . . . . . . . . . . . . . . . 35
3.1 System Development Research . . . . . . . . . . . . . . . . . . . . . . . . . 35
3.2 Research Process . . . . . . . . . . . . . . . . . . . . . . . . . . . . . . . . 36
4 IMPLEMENTATION . . . . . . . . . . . . . . . . . . . . . . . . . . . . . . . 38
5
4.1 Mathematical model . . . . . . . . . . . . . . . . . . . . . . . . . . . . . . 38
4.1.1 Energy model . . . . . . . . . . . . . . . . . . . . . . . . . . . . . . 38
4.1.2 Static and Dynamic power . . . . . . . . . . . . . . . . . . . . . . . 38
4.1.3 Frequency scaling factor . . . . . . . . . . . . . . . . . . . . . . . . 41
4.1.4 Results . . . . . . . . . . . . . . . . . . . . . . . . . . . . . . . . . . 44
4.2 5G Testbed Description . . . . . . . . . . . . . . . . . . . . . . . . . . . . 46
4.2.1 Open Air Interface . . . . . . . . . . . . . . . . . . . . . . . . . . . 46
4.2.2 OAI Monotolithic deployment . . . . . . . . . . . . . . . . . . . . . 47
4.2.3 OAI Functional split deployment . . . . . . . . . . . . . . . . . . . 48
4.2.4 Results . . . . . . . . . . . . . . . . . . . . . . . . . . . . . . . . . . 49
4.3 Sustainability Analysis . . . . . . . . . . . . . . . . . . . . . . . . . . . . . 52
5 DISCUSSION . . . . . . . . . . . . . . . . . . . . . . . . . . . . . . . . . . . . 55
5.1 Experimental simulations . . . . . . . . . . . . . . . . . . . . . . . . . . . . 55
5.2 Experimental setup . . . . . . . . . . . . . . . . . . . . . . . . . . . . . . . 55
5.3 Experimental parameters . . . . . . . . . . . . . . . . . . . . . . . . . . . . 56
5.4 Experimental procedures . . . . . . . . . . . . . . . . . . . . . . . . . . . . 56
6 CONCLUSION AND FUTURE WORK . . . . . . . . . . . . . . . . . . . 57
REFERENCES . . . . . . . . . . . . . . . . . . . . . . . . . . . . . . . . . . . . . 58
APPENDICES . . . . . . . . . . . . . . . . . . . . . . . . . . . . . . . . . . . . . 62
6
LIST OF FIGURES
1 Global mobile traffic between 2020-2030, [11] . . . . . . . . . . . . . . . . . 11
2 Key capabilities of IMT-2020, source ITU-R M.2083-0 . . . . . . . . . . . . . . . 13
3 Projected energy increase in 5G networks. (source Orange) . . . . . . . . . . . 14
4 Native and Hosted Virtualization . . . . . . . . . . . . . . . . . . . . . . . 18
5 Left: VM architecture; Right: Container architecture . . . . . . . . . . . . 19
6 NFV architecture[5] . . . . . . . . . . . . . . . . . . . . . . . . . . . . . . . 23
7 End-to-end service[5] . . . . . . . . . . . . . . . . . . . . . . . . . . . . . . 24
8 5G New Radio, source 3GPP TR 38.801 . . . . . . . . . . . . . . . . . . . . . . . 25
9 eNB protocol stack . . . . . . . . . . . . . . . . . . . . . . . . . . . . . . . 26
10 From 4G stand-alone to functional split in 5G [13] . . . . . . . . . . . . . . 27
11 Independent RRU, CU and DU . . . . . . . . . . . . . . . . . . . . . . . . 28
12 Co-located CU and DU[cite] . . . . . . . . . . . . . . . . . . . . . . . . . . 28
13 Functional Split . . . . . . . . . . . . . . . . . . . . . . . . . . . . . . . . . 29
14 System Development Research Methodology . . . . . . . . . . . . . . . . . 35
15 Overall energy consumption at different workload . . . . . . . . . . . . . . 40
16 CPU core energy consumption under 100 % load . . . . . . . . . . . . . . . 41
17 Execution times generated with exponential distribution . . . . . . . . . . 43
18 Batch execution time and energy consumption . . . . . . . . . . . . . . . . 44
19 scaled system with DVFS . . . . . . . . . . . . . . . . . . . . . . . . . . . 45
20 End-to-end virtualized mobile network . . . . . . . . . . . . . . . . . . . . 48
21 End-to-end virtualized mobile network . . . . . . . . . . . . . . . . . . . . 49
22 Monolithic eNB energy consumption . . . . . . . . . . . . . . . . . . . . . 49
23 Radio Cloud Control energy consumption . . . . . . . . . . . . . . . . . . . 50
24 Remote Radio Unit energy consumption . . . . . . . . . . . . . . . . . . . 50
25 Five-dimensions of Sustainability . . . . . . . . . . . . . . . . . . . . . . . 53
7
LIST OF TABLES
1 Research Process . . . . . . . . . . . . . . . . . . . . . . . . . . . . . . . . 36
2 Server specifications . . . . . . . . . . . . . . . . . . . . . . . . . . . . . . 39
3 Total energy consumption and execution time . . . . . . . . . . . . . . . . 44
4 Experimental parameters . . . . . . . . . . . . . . . . . . . . . . . . . . . . 56
8
LIST OF SYMBOLS AND ABBREVIATIONS
API Application Programming Interface.
BBU Base Band Unit.
C-RAN Cloud-Radio Access Network.
CoMP Coordinated Multipoint.
CU Central Unit.
DL Down link.
DU Distributed Unit.
DVFS Dynamic Voltage Frequency Scaling.
eMBB enhanced Mobile Broadband.
EPC Evolved Packet Core.
FDD Frequency-Division Duplexing.
HSS Home Subscriber Server.
IaaS Infrastructure as a Service.
IoT Internet of Things.
ITU International Telecommunication Union.
LTE Long-Term Evolution.
MCC Mobile Country Code.
MIMO Multiple-Input Multiple-Output.
MME Mobility Management Entity.
9
mMTC massive Machine-Type Communication.
MNC Mobile Network Code.
MSR model-specific registers.
NIST National Institute of Standards and Technology.
NR New Radio.
OAI Open Air Interface.
OS Operating System.
PaaS Platform as a Service.
QEMU Quick Emulator.
QoE Quality of Experience.
QoS Quality of Service.
RAPL Running Average Power Limit.
RRU Remote Radio Unit.
SaaS Software as a Service.
SDN Software Defined Networking.
SIM Subscriber Identity Module.
SPGW Service Provider Gateway.
TAC Tracking Area Code.
UE User Equipment.
UICC Universal Integrated Circuit Card.
UL Up Link.
URLLC Ultra-Reliable and Low-Latency Communications.
VM Virtual Machine.
10
1 INTRODUCTION
Mobile communication became an active part of our daily life and evolution of this trend
puts new demands in front of Telecommunication Providers. Emergence of Internet of
Things (IoT), Machine-to-machine (M2M) type of communications have strict time con-
straints, and current network architectures are not capable of dealing with such a critical
latency deadlines. As such, it requires advanced communication technologies to meet the
network requirements of new emerging services. Furthermore, rapid increase on mobile
data introduces new challenges and requires new advanced solutions. In fact, there are
many contributors to the increase of mobile data traffic while the following three being
the most influential categories:
a) high increase on the number of end user devices like smartphones and tablets;
b) emergence of various new video services;
c) rapid growth in software applications. [11]
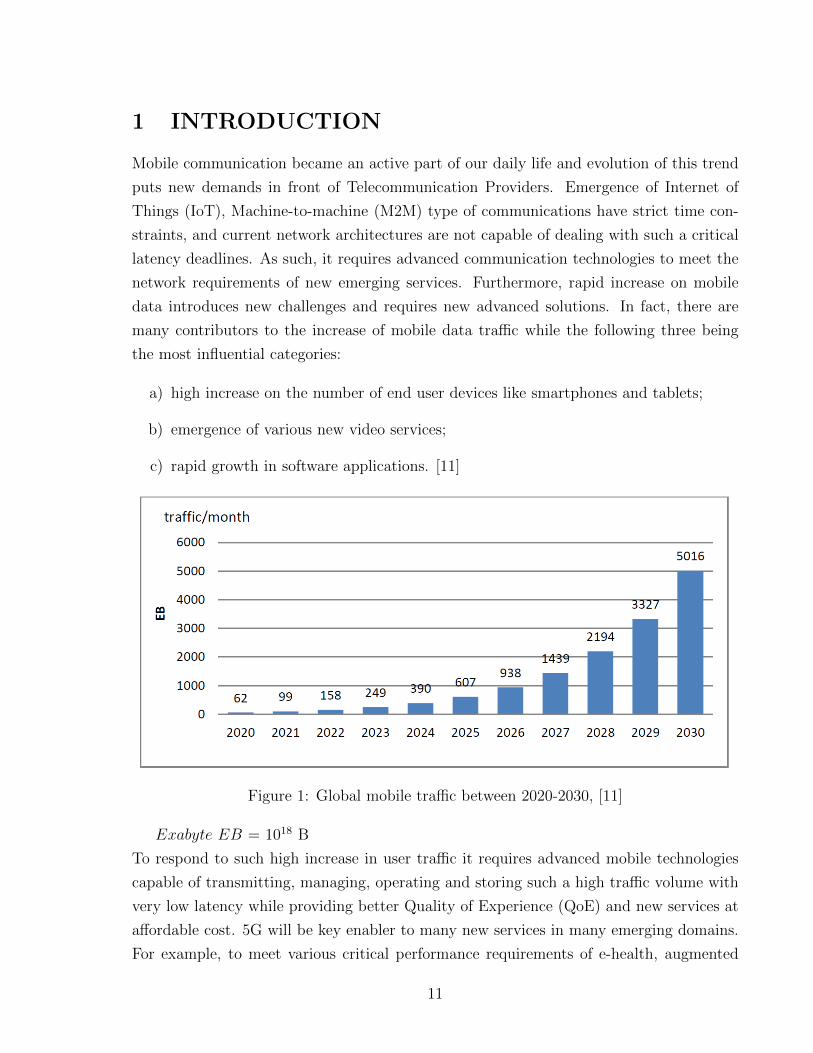
Figure 1: Global mobile traffic between 2020-2030, [11]
Exabyte EB = 1018 B
To respond to such high increase in user traffic it requires advanced mobile technologies
capable of transmitting, managing, operating and storing such a high traffic volume with
very low latency while providing better Quality of Experience (QoE) and new services at
affordable cost. 5G will be key enabler to many new services in many emerging domains.
For example, to meet various critical performance requirements of e-health, augmented
11
reality, autonomous cars, agriculture and IoT, it is necessary to build enhanced transport
networks to satisfy latency and data rate specifications of the applications. The integra-
tion of 5G with NFV and Software Defined Networking (SDN) enables to build resource
efficient, flexible, dynamic and software-based network architectures. Radio access net-
work processing units can be centralized as a pool, leading to efficient use of hardware
resources with dynamic orchestration. Energy efficiency became major concern both in
software and hardware domains and it is one of the key targets of IMT 2020 [29].
Recent increase on demand of wide range of software applications resulted on growth of
hardware resource utilization (CPU, memory, network, storage) and power consumption
eventually. In fact, Information and Communication Technologies (ICT) industry has re-
ported about 2 % contribution to the global Greenhouse Gas (GHG) emission [9][8] and it
is proportional to the carbon dioxide produced by aviation industry. The number of the
research works in the field of Green ICT have been focused on optimization of hardware
power consumption, while software optimization in terms of power usage has received less
attention. Rapid advancement on software development introduced new paradigm of ap-
plications that require more power than ever before for computational tasks. Software
plays an important role in overall system energy efficiency. Green software development
methodologies and design approaches need to be applied at each stage of life-cycle of the
software products to achieve possible efficiency in operational energy consumption and to
reduce its carbon footprint. These stages include planning, designing, development, us-
age and maintenance. Identifying energy leaks within the software and obtaining system
power consumption for each process would help software developers and VNF providers
to design and develop green, energy efficient virtualized network functions. However, it
requires tools and methodologies to measure energy consumed by each and single process
or component in a complex virtualized system.
Radio access network plays an important role in the overall energy efficiency of mobile net-
work as it is responsible for executing many real-time functions such as connection estab-
lishment, data encryption, radio resource management, etc. With conventional 4G/Long-
Term Evolution (LTE), RAN functions are hosted within dedicated stand-alone Base Band
Unit (BBU). However, C-RAN has introduced new flexible functional units, performing
RAN functions on distributed architecture as never before. Those units are Central Unit
(CU), Distributed Unit (DU) and Remote Radio Unit (RRU) each capable of executing
various BBU functions. The evolution of 4G LTE RAN from a single node to functional
12
split architecture in 5G enables to take advantage of virtualization technologies, thus al-
lowing centralization of certain functions at the central pool (e.g. data centre) with high
computing capacity. However, distributing RAN functions from stand alone BBU across
CU and DU brings following new challenges:
1. requirements on very low latency fronthaul (network between RRU and DU);
2. identifying optimal 3GPP functional split option in terms of Quality of Service (QoS)
parameters;
3. meet the IMT2020 [12] requirements on RAN energy efficiency;
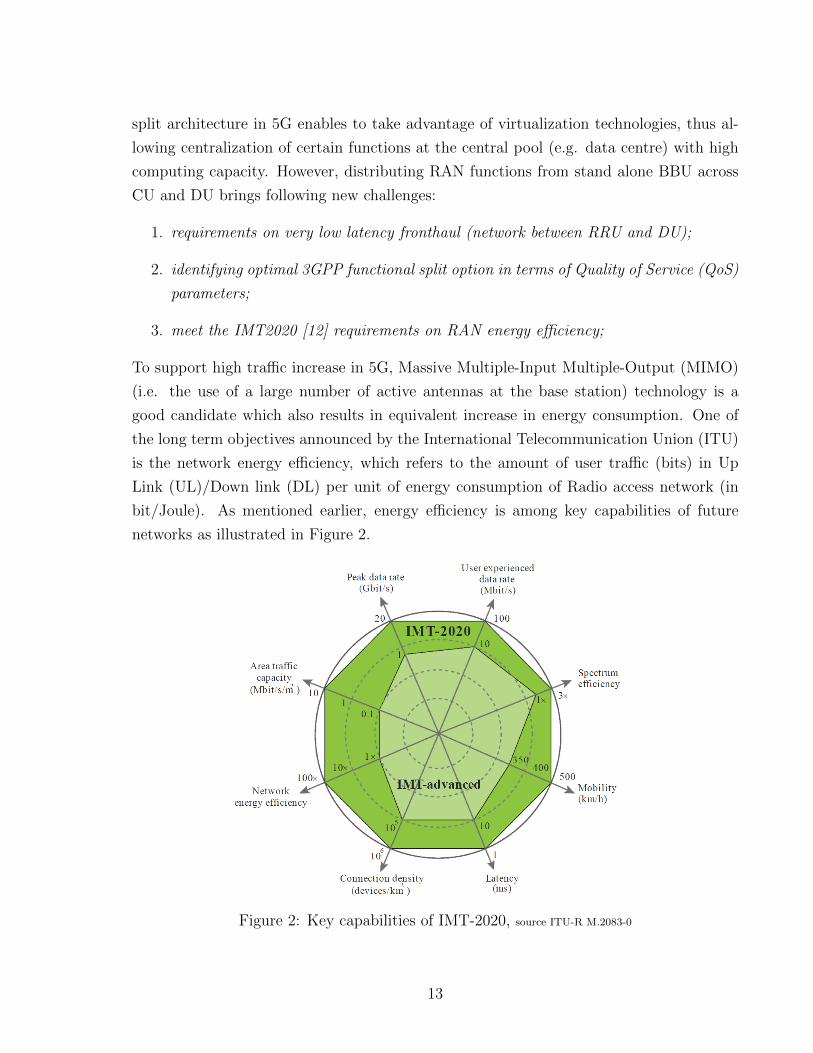
To support high traffic increase in 5G, Massive Multiple-Input Multiple-Output (MIMO)
(i.e. the use of a large number of active antennas at the base station) technology is a
good candidate which also results in equivalent increase in energy consumption. One of
the long term objectives announced by the International Telecommunication Union (ITU)
is the network energy efficiency, which refers to the amount of user traffic (bits) in Up
Link (UL)/Down link (DL) per unit of energy consumption of Radio access network (in
bit/Joule). As mentioned earlier, energy efficiency is among key capabilities of future
networks as illustrated in Figure 2.
Figure 2: Key capabilities of IMT-2020, source ITU-R M.2083-0
13
1.1 Research Problems
Several studies have proposed solutions to deal with new challenges which were introduced
in C-RAN. For example, authors in [24] proposed applying parallelism when executing C-
RAN functions which eventually leads to 70% gain in terms of latency. Authors in [3][33]
have studied fronthaul capacity in order to save fiber bandwidth during functional split
of physical layer functions. However, energy optimization of C-RAN has received less
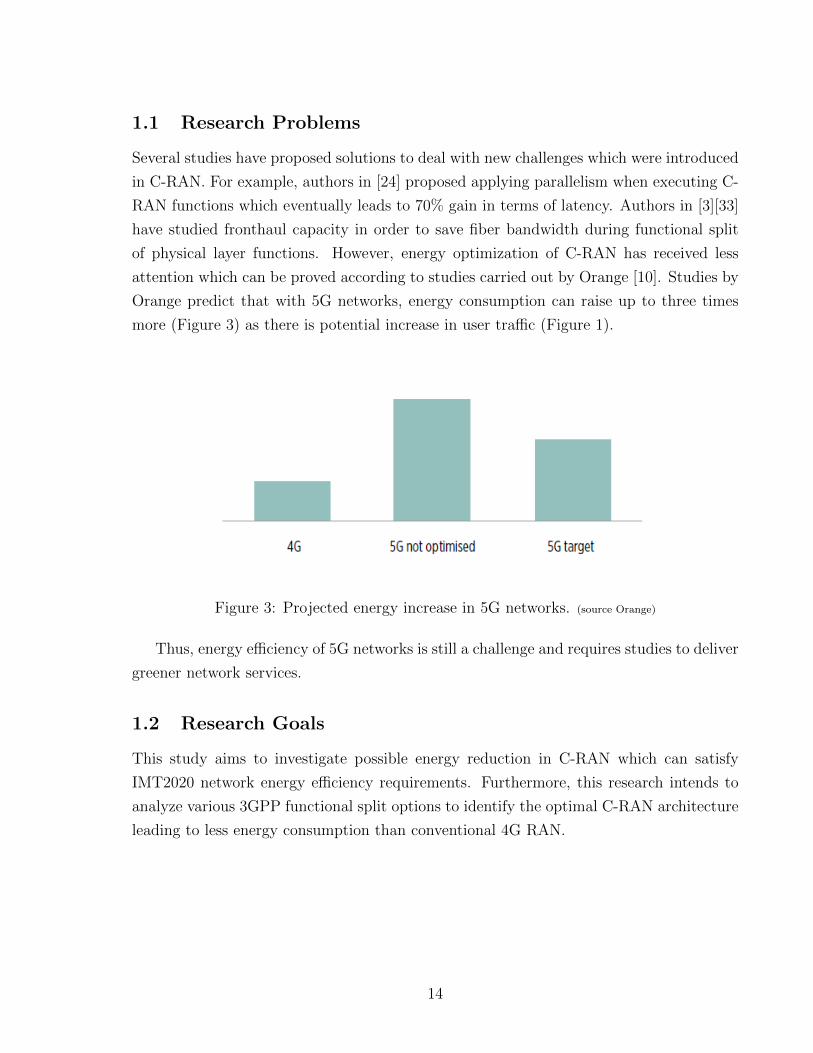
attention which can be proved according to studies carried out by Orange [10]. Studies by
Orange predict that with 5G networks, energy consumption can raise up to three times
more (Figure 3) as there is potential increase in user traffic (Figure 1).
Figure 3: Projected energy increase in 5G networks. (source Orange)
Thus, energy efficiency of 5G networks is still a challenge and requires studies to deliver
greener network services.
1.2 Research Goals
This study aims to investigate possible energy reduction in C-RAN which can satisfy
IMT2020 network energy efficiency requirements. Furthermore, this research intends to
analyze various 3GPP functional split options to identify the optimal C-RAN architecture
leading to less energy consumption than conventional 4G RAN.
14
1.3 Research Questions
Throughout this study the following research questions are analyzed:
RQ1. What is the trade-off between QoS parameters (i.e. latency) and energy
consumption when executing batch of RAN jobs running in parallel?
RQ2. How to optimize CPU energy consumption when executing C-RAN processes
without degrading performance?
RQ3. What is the energy cost of RAN functional split option8 and option6?
1.4 Contribution
Following are the contributions made with this thesis:
1. Investigation of deployment architectures of fully virtualized mobile network
2. Energy consumption measurements of virtual network functions, or to be exact vir-
tualized C-RAN
3. Analysis of two different C-RAN deployment architecture from energy consumption
viewpoint, which can be used as a reference model
4. Investigation of techniques for energy usage optimization of RAN functions when
hosted on commercial off-the-shelf servers.
1.5 Thesis Organization
The structure of this manuscript is as follows:
Chapter1: Introduces core topics, the research problem, goals and objectives.
Chapter2: Presents domain of study and review of related works on energy opti-
mization, in the context of Network Function Virtualization.
Chapter3: Describes research process, research methodology and highlights key
activities that are performed throughout the whole research.
Chapter4: Provides detailed overview of Testbed implementation and mathemati-
cal models. Analysis of performance experiments and research findings are discussed.
15

Chapter5: Provides discussion and sustainability analysis.
Chapter6: This chapter finalizes the thesis with conclusion and possible recom-
mendations for the future work.
16
2 RELATED WORK
This chapter introduces related work in following six subsections: a) virtualization, b)
cloud computing, c) network function virtualization, d) C-RAN, e) performance opti-
mization, f) software-defined power meters. Each sections provides high-level overview
of related concepts, approaches, methodologies and tools which were observed during the
literature review stage.
2.1 Virtualization
Virtualization has greatly contributed to efficient use of various hardware components at
different scale from a single PC to a rack of servers in data centres. Because of its vast ben-
efits, virtualization technology entered many domains including networking hardware like
switches, routers, storage systems and continues to accelerate. However, virtualization is
not an exception to security risks, thus it also requires to effectively secure the environment
even though it is virtualized. Virtualization is an abstraction layer which simulates various
hardware components such as CPU, memory, storage, thus enables efficient utilization of
hardware capacity.
2.1.1 Virtual Machines
Virtual Machine (VM) as the name implies, is virtual representation of physical computer
or its components (e.g. computing, network, memory and storage) which is hosted on top
of the actual physical computer. The main idea behind VMs is an efficient hardware re-
source utilization leading to reduce an additional infrastructure needed to deploy services.
VMs bring many benefits such as cost reduction, improved deployment time, portability,
easy recovery, backup and, etc. In most of the cases, only 10 % of hardware resources
are utilized for computing while 90% of it runs as an idle. However, with virtualization
technology a single physical server can be shared across multiple VMs, which are logically
isolated from each other. As such, deploying services on VMs hosted on the same physical
server improves resource utilization as well reduces cost for the additional physical server.
Each VM leverages its own Operating System (OS), including kernel which allows isolation
of VMs from each other, thus minimizes security risks. Hypervisor or so-called Virtual
Machine Monitor (VMM) is an additional layer responsible for creating and running VMs.
Particularly, native type of hypervisors are hosted directly on the host (i.e. bare metal)
while hosted hypervisors run on top of the host OS, creating an extra layer underneath the
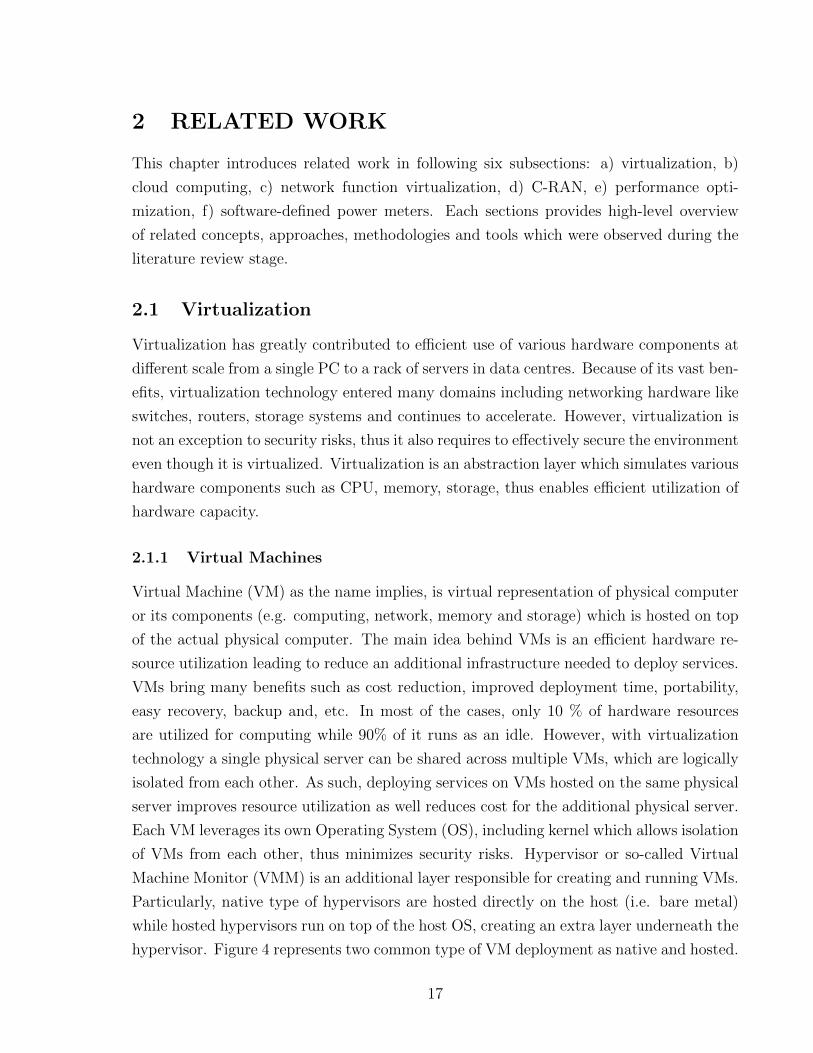
hypervisor. Figure 4 represents two common type of VM deployment as native and hosted.
17
Native Virtualization: hardware resources are fully emulated with the help of bare metal
hypervisor like open source Quick Emulator (QEMU). In this type of virtualization guest
OS is completely abstracted from the underlying infrastructure and it ensures high security
for virtual machines hosted on top of hypervisor. As such, VMs are completely unaware
of the physical host on which they are running. Hosted Virtualization: VMs are hosted on
top of the existing operating system and Application Programming Interface (API) calls
are made between guest OS and VMM. In other words, there is an extra layer underneath
the hypervisor. Calls are made between hypervisor and host OS in order to perform
hardware operations requested by each VM.
Figure 4: Native and Hosted Virtualization
2.1.2 Containers
The emergence of microservices has changed the way that software is developed, deployed
and maintained. While monolithic software development approach structures the appli-
cation as a single unit, microservices approach is focused on splitting a single unit into
packages of small functionalities. The structure of a software based on microservices archi-
tecture is composed of set of loosely coupled functionalities each running its own processes
independently. This approach allows to update, replace and scale each unit of large ap-
plication independently without affecting to the entire system. Because, in many cases
software components or units have various strict requirements/dependencies (e.g. libraries,
packages, software releases, environment, etc.) and migrating or updating some of those
units can have cascading effect on the system. Splitting a complex application into easy
manageable microservices offers scalability, rapid development, continues delivery, easy
18
management, reduced time-to market and quick adaption to technological changes.
Containers are recent concept emerged with the advancement in Linux namespaces and
it introduced more efficient way of application deployment compared to VM based in-
frastructure. Containers allow multiple isolated user space instances to run on top of a
kernel space within the same host OS. The main differences between containers and vir-
tual machines are efficiency, performance and security. Thus because, containers share the
host kernel, and don’t create it is own kernel while each virtual machine requires to have
their own kernel, thus the extra overhead. On the other hand, there are some security
constrains with containers, since they share the same kernel. Containers enable quick
application deployment and can run in any environment including bare-metal, virtual ma-
chine and cloud. Furthermore, containers remove the need to run application on dedicated
environment, since it packages all needed dependencies including runtime, source code, li-
braries and configurations. There are numerous containers available such as LXC, rktx,
Docker. Docker is the container platform widely accepted by industry and it is utilizing
containerd1 as for the container runtime. Particularly, Docker container is composed of
three main elements which are Linux Cgroups, namespaces and Docker image.
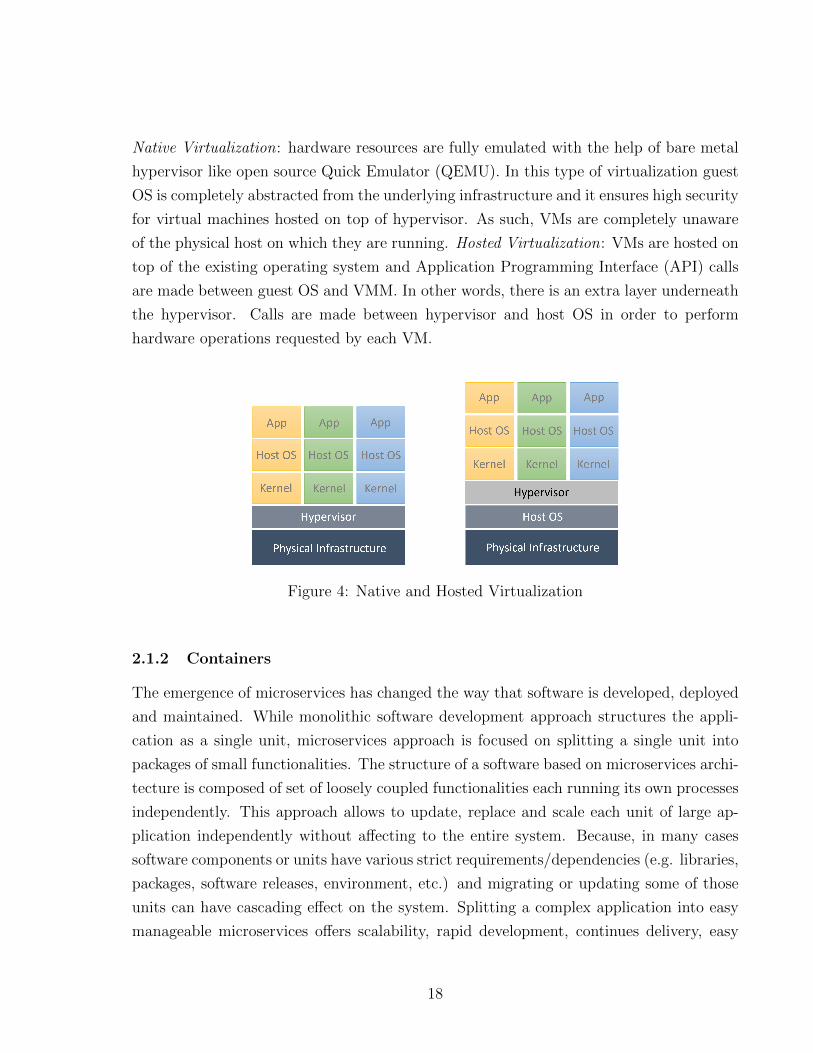
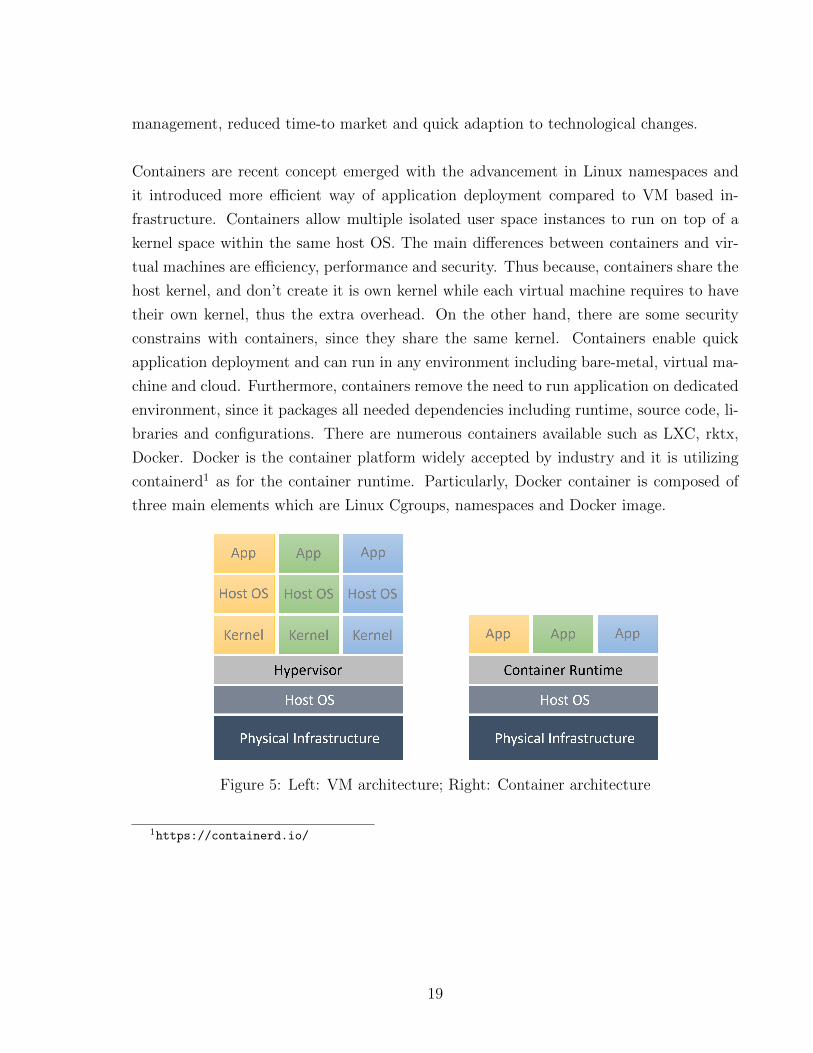
Figure 5: Left: VM architecture; Right: Container architecture
1https://containerd.io/
19
2.2 Cloud computing
2.2.1 Cloud Service Models
According to National Institute of Standards and Technology (NIST) cloud computing is
defined[18] as a model which allows ubiquitous and on-demand utilization of computing
resources (CPU, storage, network, services) in a shared manner while provisioning of the
resources can be accomplished dynamically. Typically cloud services providers offer their
services in one of the following models:
• Software as a Service (SaaS)
• Platform as a Service (PaaS)
• Infrastructure as a Service (IaaS)
Software as a Service: With Software as a Service model customers are offered with
applications hosted in a cloud environment. The way that software is delivered has rapidly
changed in the era of cloud computing. This model allows users to access to variety of
applications from anywhere at any time without requiring high computing capabilities to
utilize applications. In fact, users are not aware of hosting infrastructure and they can’t
manage hardware resources.
Platform as a Service: The next layer enables to deploy services on the cloud in-
frastructure but still does not allow management of underlying infrastructure. In other
words, customers are provided with virtualized hardware resources to run their applica-
tions. Management of physical infrastructure is abstracted to offer on-demand resource
provisioning.
Infrastructure as a Service: Unlike with PaaS, IaaS offers capability to provi-
sion hardware resources upon the need. Manageable hardware resources are still virtual,
meaning that same computing unit might be shared with another customer but virtually
isolated.
Many cloud providers have emerged and even became as the dominant infrastructure to
run various services. These cloud infrastructures can be built in one or combination of the
following models:
Public cloud : A cloud service providers offer cloud services to all its interested cus-
tomers. Actual infrastructure is shared by multiple customers and operated by a service
provider.
20
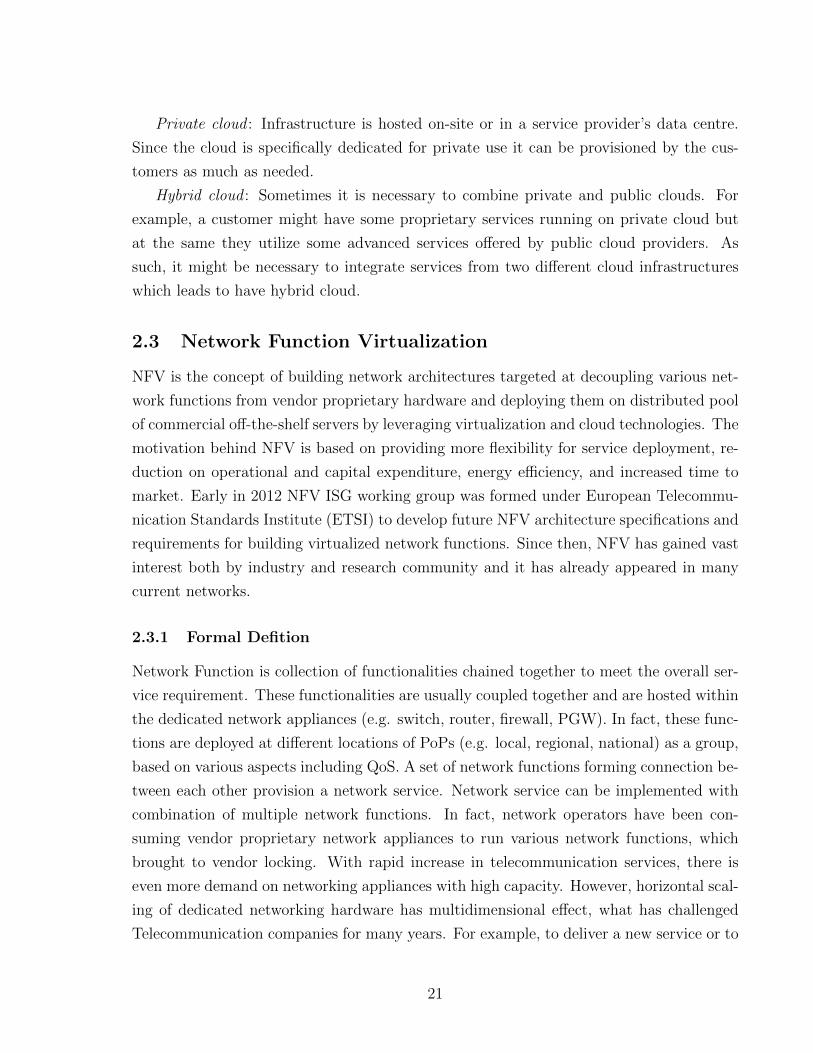
Private cloud : Infrastructure is hosted on-site or in a service provider’s data centre.
Since the cloud is specifically dedicated for private use it can be provisioned by the cus-
tomers as much as needed.
Hybrid cloud : Sometimes it is necessary to combine private and public clouds. For
example, a customer might have some proprietary services running on private cloud but
at the same they utilize some advanced services offered by public cloud providers. As
such, it might be necessary to integrate services from two different cloud infrastructures
which leads to have hybrid cloud.
2.3 Network Function Virtualization
NFV is the concept of building network architectures targeted at decoupling various net-
work functions from vendor proprietary hardware and deploying them on distributed pool
of commercial off-the-shelf servers by leveraging virtualization and cloud technologies. The
motivation behind NFV is based on providing more flexibility for service deployment, re-
duction on operational and capital expenditure, energy efficiency, and increased time to
market. Early in 2012 NFV ISG working group was formed under European Telecommu-
nication Standards Institute (ETSI) to develop future NFV architecture specifications and
requirements for building virtualized network functions. Since then, NFV has gained vast
interest both by industry and research community and it has already appeared in many
current networks.
2.3.1 Formal Defition
Network Function is collection of functionalities chained together to meet the overall ser-
vice requirement. These functionalities are usually coupled together and are hosted within
the dedicated network appliances (e.g. switch, router, firewall, PGW). In fact, these func-
tions are deployed at different locations of PoPs (e.g. local, regional, national) as a group,
based on various aspects including QoS. A set of network functions forming connection be-
tween each other provision a network service. Network service can be implemented with
combination of multiple network functions. In fact, network operators have been con-
suming vendor proprietary network appliances to run various network functions, which
brought to vendor locking. With rapid increase in telecommunication services, there is
even more demand on networking appliances with high capacity. However, horizontal scal-
ing of dedicated networking hardware has multidimensional effect, what has challenged
Telecommunication companies for many years. For example, to deliver a new service or to
21
scale an existing one it was necessary to add more appliances to meet customer demand
which would result on more hardware cost, space, energy and architecture complexity.
As such, there has been always a need to transform current legacy networks into service-
oriented architecture which would reduce the cost of service scaling and more importantly
unlock vendor dependencies.
As NFV enables to deploy network functions on commodity hardware (example data cen-
tre), there is big potential to reduce energy consumption when launching various functions
on data centre, for example by relaying on existing data centre power optimization tech-
niques[32] or by centralizing energy hungry functions on the same pool of servers, to fully
utilize hardware capacity. On other hand, softwarization of network functions allow to
take advantage of already existing software development approaches to develop green,
energy efficient VNF. Green software development methodologies and design approaches
need to be applied at each stage of lifecycle of the software to achieve possible efficiency in
operational energy consumption and to reduce its carbon footprint. These techniques can
be applied at each of the following stages: planning, designing, development, usage and
maintenance. Identifying energy leaks within the software and obtaining system power
consumption for each process or unit would help software developers and VNF providers
to design and develop green, energy efficient virtualized network functions. However, it re-
quires tools and methodologies to measure energy consumed by each software component
in a complex virtualized system. Virtual Network Function (VNF) is a network function
aimed to run on commodity hardware or on data centre environment which builds virtual-
ized ecosystem for executing VNFs. VNF can be hosted within a single VM as a whole, but
also across multiple VMs upon the requirements. Building modular VNF by splitting it
into smaller units will give better management for the purpose of scalability, upgrade and
reusability. ETSI has proposed many use case examples [7] where NFV can fit and more
importantly provide its benefits. The IP Multimedia Subsystem (IMS) is one potential
example to integrate NFV concept and build virtualized IMS for delivering multimedia
services over IP. For example, Clearwater2 is a project for implementing open source IMS
software specifically aimed to run on virtualized environments including cloud, and it has
been already integrated with current legacy networks by many telcos for providing video,
voice and messaging services over IP.
2https://www.projectclearwater.org/
22
2.3.2 Architecture
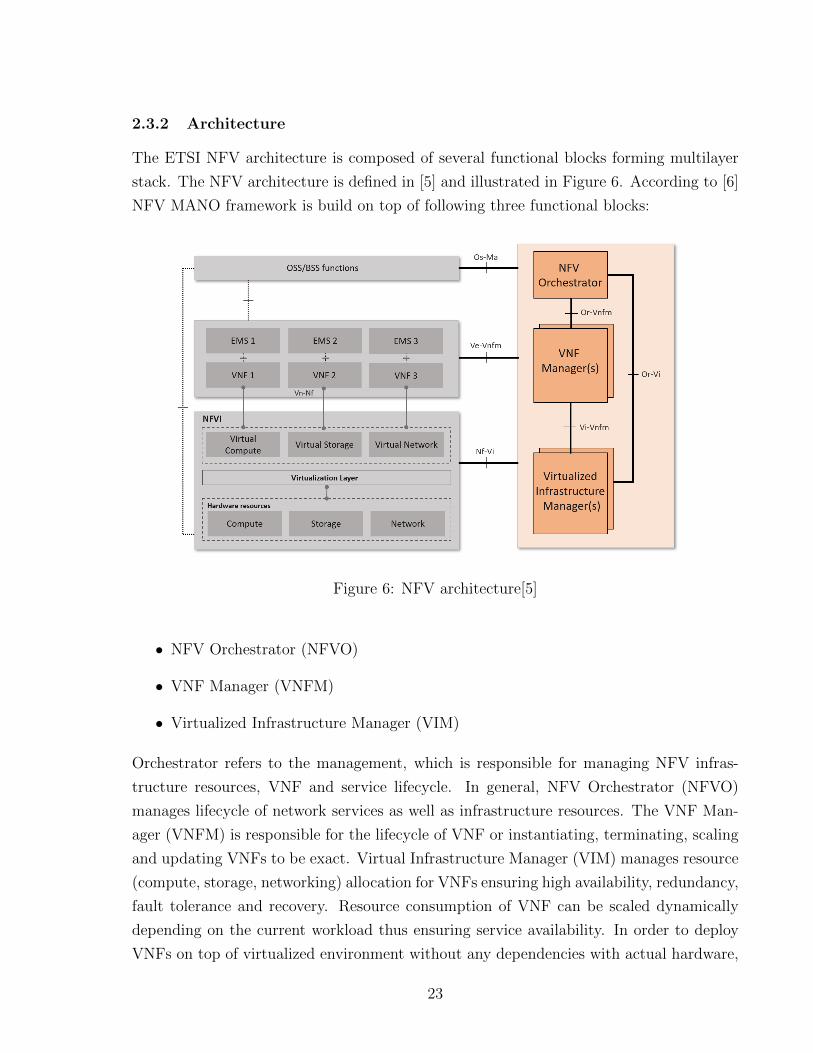
The ETSI NFV architecture is composed of several functional blocks forming multilayer
stack. The NFV architecture is defined in [5] and illustrated in Figure 6. According to [6]
NFV MANO framework is build on top of following three functional blocks:
Figure 6: NFV architecture[5]
• NFV Orchestrator (NFVO)
• VNF Manager (VNFM)
• Virtualized Infrastructure Manager (VIM)
Orchestrator refers to the management, which is responsible for managing NFV infras-
tructure resources, VNF and service lifecycle. In general, NFV Orchestrator (NFVO)
manages lifecycle of network services as well as infrastructure resources. The VNF Man-
ager (VNFM) is responsible for the lifecycle of VNF or instantiating, terminating, scaling
and updating VNFs to be exact. Virtual Infrastructure Manager (VIM) manages resource
(compute, storage, networking) allocation for VNFs ensuring high availability, redundancy,
fault tolerance and recovery. Resource consumption of VNF can be scaled dynamically
depending on the current workload thus ensuring service availability. In order to deploy
VNFs on top of virtualized environment without any dependencies with actual hardware,
23
virtualization layer simulates various hardware components and therefore, VNFs are un-
aware of the underlaying infrastructure. Hypervisors are good candidates for leveraging
abstraction layer and have been widely utilized since the introduction of VMs. The choice
of hypervisor can be scenario specific and both native and hosted type of hypervisors can
be used to support decoupling of VNFs from hardware resources.
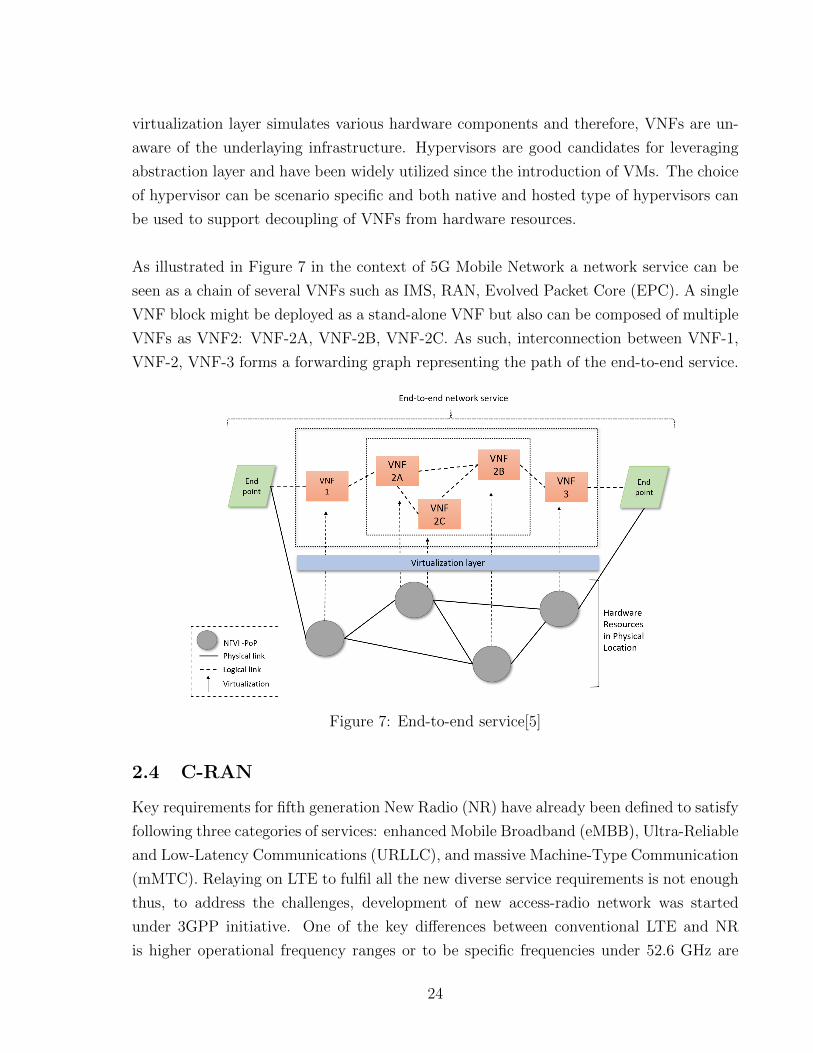
As illustrated in Figure 7 in the context of 5G Mobile Network a network service can be
seen as a chain of several VNFs such as IMS, RAN, Evolved Packet Core (EPC). A single
VNF block might be deployed as a stand-alone VNF but also can be composed of multiple
VNFs as VNF2: VNF-2A, VNF-2B, VNF-2C. As such, interconnection between VNF-1,
VNF-2, VNF-3 forms a forwarding graph representing the path of the end-to-end service.
Figure 7: End-to-end service[5]
2.4 C-RAN
Key requirements for fifth generation New Radio (NR) have already been defined to satisfy
following three categories of services: enhanced Mobile Broadband (eMBB), Ultra-Reliable
and Low-Latency Communications (URLLC), and massive Machine-Type Communication
(mMTC). Relaying on LTE to fulfil all the new diverse service requirements is not enough
thus, to address the challenges, development of new access-radio network was started
under 3GPP initiative. One of the key differences between conventional LTE and NR
is higher operational frequency ranges or to be specific frequencies under 52.6 GHz are
24
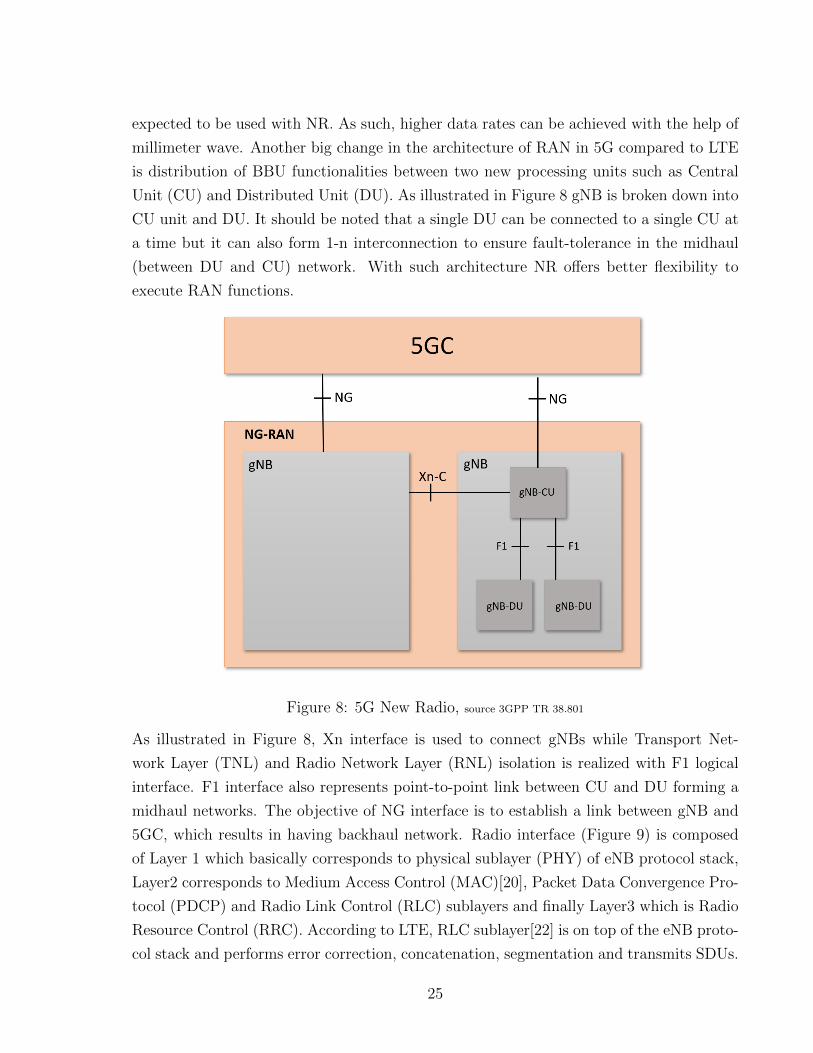
expected to be used with NR. As such, higher data rates can be achieved with the help of
millimeter wave. Another big change in the architecture of RAN in 5G compared to LTE
is distribution of BBU functionalities between two new processing units such as Central
Unit (CU) and Distributed Unit (DU). As illustrated in Figure 8 gNB is broken down into
CU unit and DU. It should be noted that a single DU can be connected to a single CU at
a time but it can also form 1-n interconnection to ensure fault-tolerance in the midhaul
(between DU and CU) network. With such architecture NR offers better flexibility to
execute RAN functions.
Figure 8: 5G New Radio, source 3GPP TR 38.801
As illustrated in Figure 8, Xn interface is used to connect gNBs while Transport Net-
work Layer (TNL) and Radio Network Layer (RNL) isolation is realized with F1 logical
interface. F1 interface also represents point-to-point link between CU and DU forming a
midhaul networks. The objective of NG interface is to establish a link between gNB and
5GC, which results in having backhaul network. Radio interface (Figure 9) is composed
of Layer 1 which basically corresponds to physical sublayer (PHY) of eNB protocol stack,
Layer2 corresponds to Medium Access Control (MAC)[20], Packet Data Convergence Pro-
tocol (PDCP) and Radio Link Control (RLC) sublayers and finally Layer3 which is Radio
Resource Control (RRC). According to LTE, RLC sublayer[22] is on top of the eNB proto-
col stack and performs error correction, concatenation, segmentation and transmits SDUs.
25
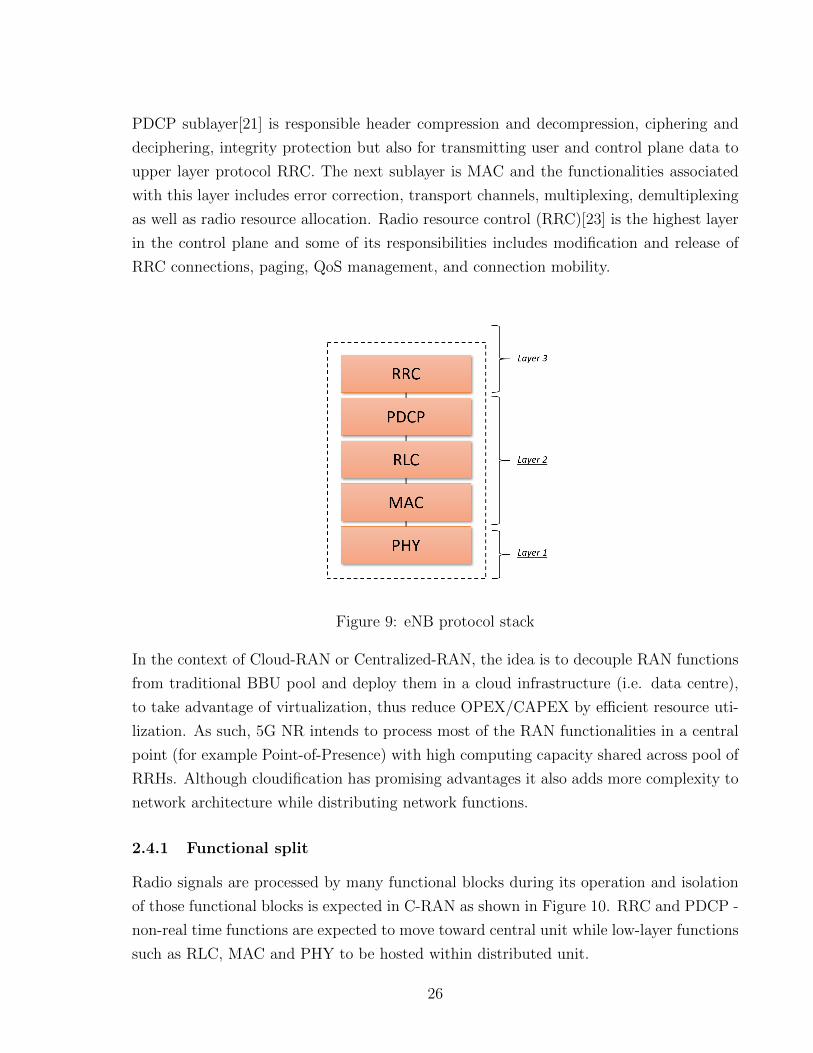
PDCP sublayer[21] is responsible header compression and decompression, ciphering and
deciphering, integrity protection but also for transmitting user and control plane data to
upper layer protocol RRC. The next sublayer is MAC and the functionalities associated
with this layer includes error correction, transport channels, multiplexing, demultiplexing
as well as radio resource allocation. Radio resource control (RRC)[23] is the highest layer
in the control plane and some of its responsibilities includes modification and release of
RRC connections, paging, QoS management, and connection mobility.
Figure 9: eNB protocol stack
In the context of Cloud-RAN or Centralized-RAN, the idea is to decouple RAN functions
from traditional BBU pool and deploy them in a cloud infrastructure (i.e. data centre),
to take advantage of virtualization, thus reduce OPEX/CAPEX by efficient resource uti-
lization. As such, 5G NR intends to process most of the RAN functionalities in a central
point (for example Point-of-Presence) with high computing capacity shared across pool of
RRHs. Although cloudification has promising advantages it also adds more complexity to
network architecture while distributing network functions.
2.4.1 Functional split
Radio signals are processed by many functional blocks during its operation and isolation
of those functional blocks is expected in C-RAN as shown in Figure 10. RRC and PDCP -
non-real time functions are expected to move toward central unit while low-layer functions
such as RLC, MAC and PHY to be hosted within distributed unit.
26
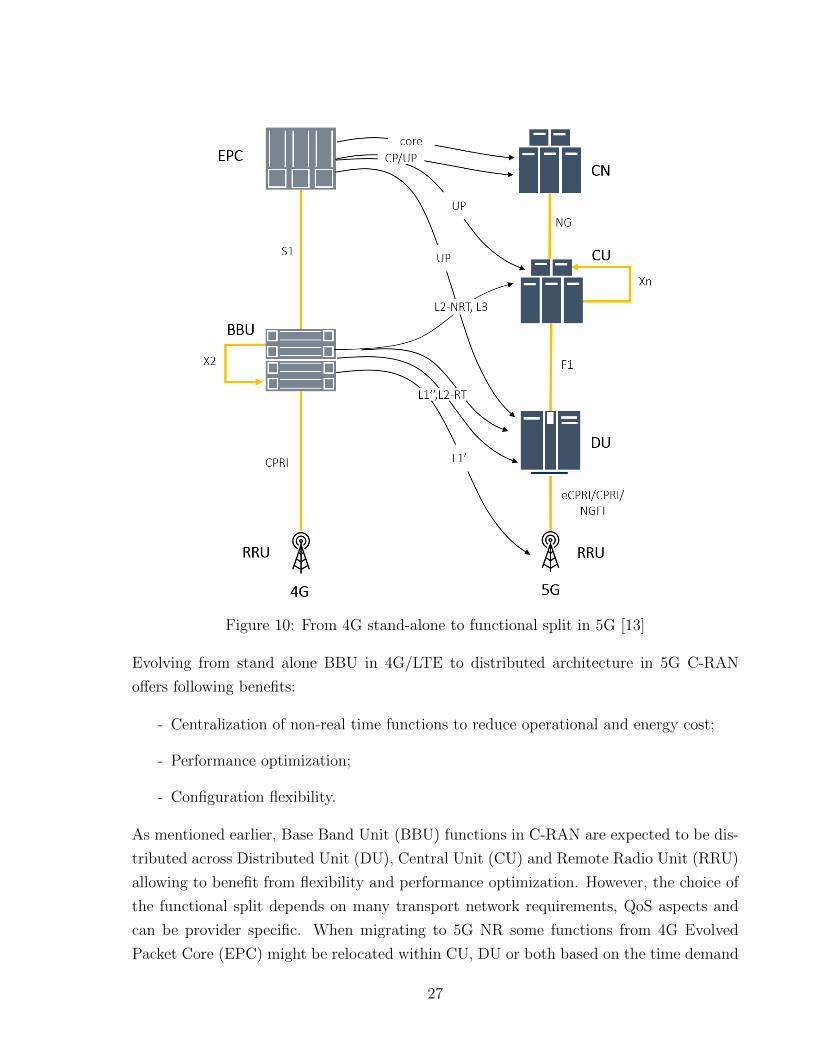
Figure 10: From 4G stand-alone to functional split in 5G [13]
Evolving from stand alone BBU in 4G/LTE to distributed architecture in 5G C-RAN
offers following benefits:
- Centralization of non-real time functions to reduce operational and energy cost;
- Performance optimization;
- Configuration flexibility.
As mentioned earlier, Base Band Unit (BBU) functions in C-RAN are expected to be dis-
tributed across Distributed Unit (DU), Central Unit (CU) and Remote Radio Unit (RRU)
allowing to benefit from flexibility and performance optimization. However, the choice of
the functional split depends on many transport network requirements, QoS aspects and
can be provider specific. When migrating to 5G NR some functions from 4G Evolved
Packet Core (EPC) might be relocated within CU, DU or both based on the time demand
27
for processing. Due to the feasibility of functional splitting, centralization of various RAN
functions is possible leading to the reduction in transport capacities. However, splitting
radio signalling functions requires low latency transport(a few hundred µsec). In fact,
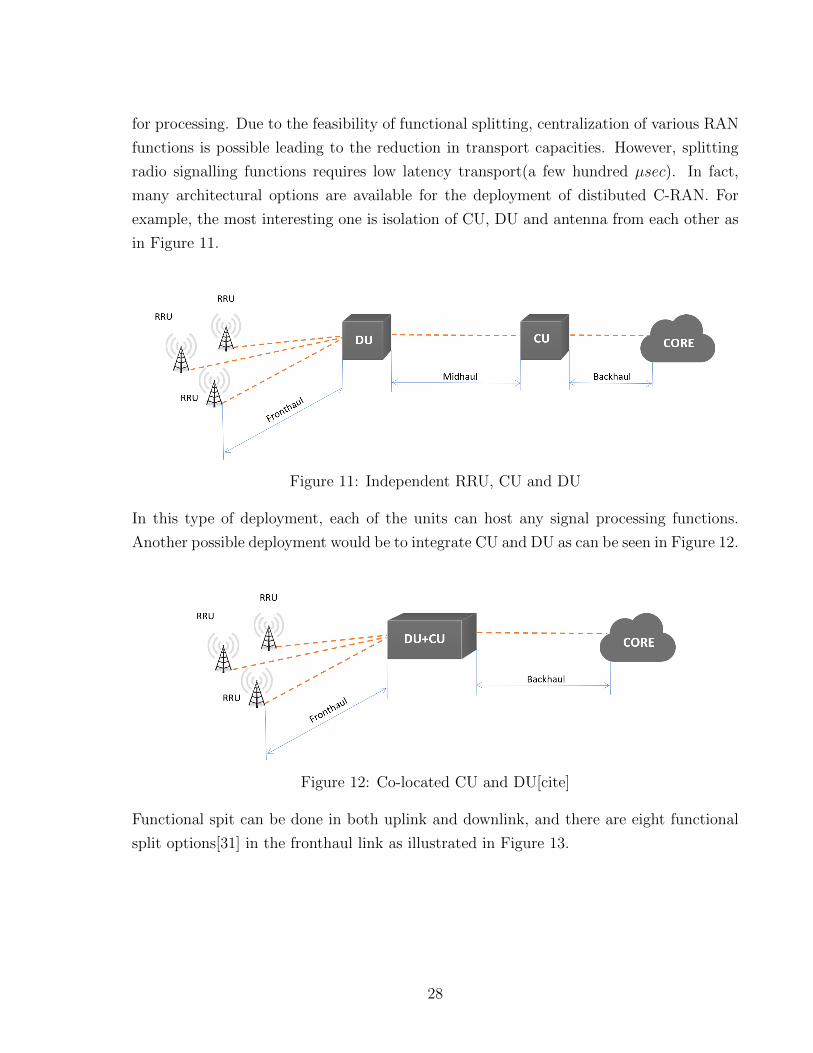
many architectural options are available for the deployment of distibuted C-RAN. For
example, the most interesting one is isolation of CU, DU and antenna from each other as
in Figure 11.
Figure 11: Independent RRU, CU and DU
In this type of deployment, each of the units can host any signal processing functions.
Another possible deployment would be to integrate CU and DU as can be seen in Figure 12.
Figure 12: Co-located CU and DU[cite]
Functional spit can be done in both uplink and downlink, and there are eight functional
split options[31] in the fronthaul link as illustrated in Figure 13.
28
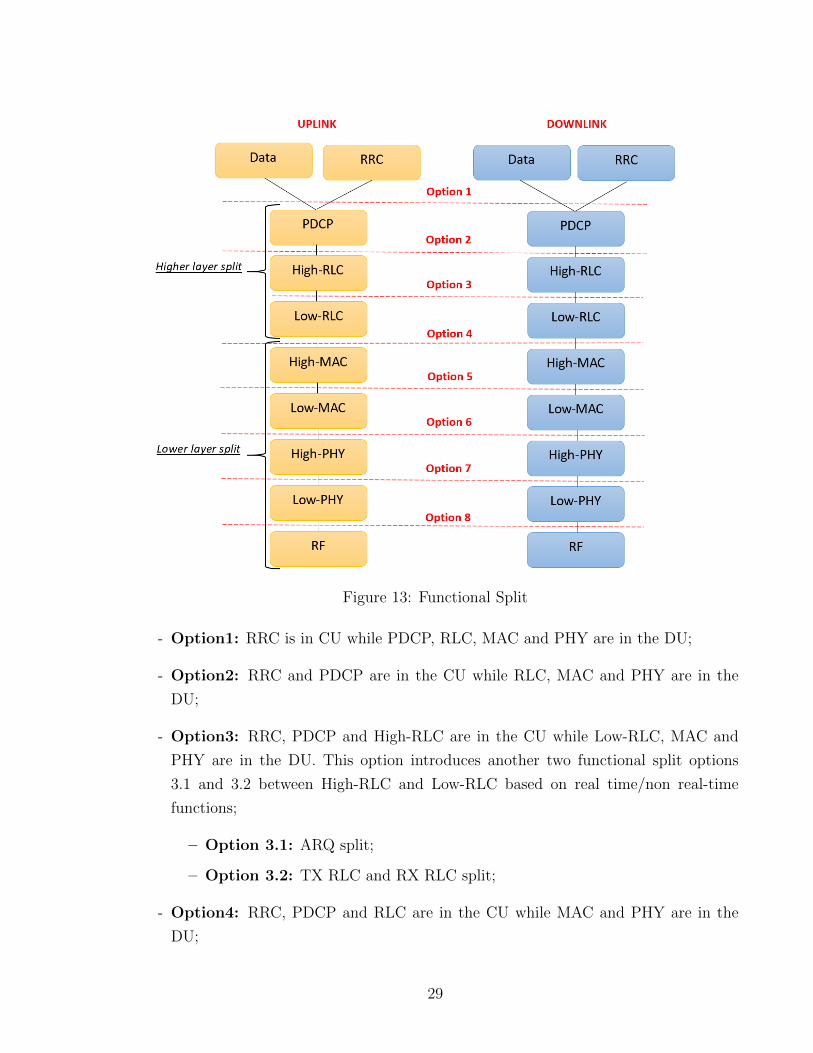
Figure 13: Functional Split
- Option1: RRC is in CU while PDCP, RLC, MAC and PHY are in the DU;
- Option2: RRC and PDCP are in the CU while RLC, MAC and PHY are in the
DU;
- Option3: RRC, PDCP and High-RLC are in the CU while Low-RLC, MAC and
PHY are in the DU. This option introduces another two functional split options
3.1 and 3.2 between High-RLC and Low-RLC based on real time/non real-time
functions;
– Option 3.1: ARQ split;
– Option 3.2: TX RLC and RX RLC split;
- Option4: RRC, PDCP and RLC are in the CU while MAC and PHY are in the
DU;
29
- Option5: RRC, PDCP, RLC and High-MAC are in the CU while Low- MAC and
PHY are in the DU;
- Option6: RRC, PDCP, RLC and MAC are in the CU while PHY are in the DU;
- Option7: RRC, PDCP, RLC, MAC and High-PHY are in the CU while Low-PHY
are in the DU. This option offers three different split options between High-PHY
and Low-PHY as following
- Option 7.1: FFT and CP removal functions are hosted within DU while the
rest of PHY functionalities are in the CU for the uplink direction. For the
downlink direction, iFFT and CP addition functions reside in DU while the
rest of PHY functions are hosted within CU;
- Option 7.2: Functions such as FFT, CP removal and resource de-mapping
are in DU while the rest of PHY functions are in CU fur uplink. For downlink
iFFT, CP addition, resource mapping and precoding are in DU while rest of
the PHY are hosted within the CU;
- Option 7.3: The encoder is hosted in the CU and the rest of PHY functions
are in the DU. Option8: RRC, PDCP, RLC, MAC, PHY are in CU. This option
8 or so-called fully virtualized RAN couples whole protocol stack at the central
point by separating RF from PHY layer.
Low layer functional split has gained vast interest as it enables techniques such as Massive
Multiple-Input Multiple-Output (MIMO) or Coordinated Multipoint (CoMP). However,
bandwidth requirement on the fronthaul network is the dominant issue which increases
with the number of antennas.
30
2.5 Performance optimization
Analysing processor total power consumption can be obtained by external power meters
as well as hardware build-in sensors which are widely integrated in the modern processors.
Furthermore, there are wide range of hardware counters (core cycles, thread cycles while
the thread is not in a halt state, etc) which count number of events related different
units of processors. With the help of these counters some analysis can be made regarding
processors power consumption. Type of events3 supported by Intel processor can vary
depending on processor microarchitecture. One of the challange with regard to VNF energy
measurements is to obtain power usage per application or process rather than evaluating
total power usage. For example, to analyse the energy impact of certain VNF it requires
power meter to be able to measure software energy impact. As such, it is impossible to
obtain power usage of a software with existing hardware power meters which can only
illustrate global (whole system) power consumption. However, according to the literature
there some software-based power meters capable of measuring power consumption per
process.
2.5.1 Processor Power States
Various processor power optimization techniques are available while C and P states are
widely accepted and integrated with current processors. C states refer to idle power saving
state, meaning that it is designed to reduce power usage when there are no instructions to
execute. In general, C-states can vary between C0 and C2, while C0 being active state or
operating state. Initially C states would shutdown some parts of a processor while with
current multicore processors it can even turn-off some of the active cores as well, if they
have no tasks to run. In contrast to C states, P states are runtime power saving states
which reduce power consumption by slowing down the operating voltage during instruction
execution. The number of available P states might vary for each processor in range of
P0÷ Pn, where P0 denotes highest voltage/frequency (except TurboBoost frequency).
2.5.2 Frequency scaling
Most of the current processors support a range of operating frequencies to switch to, in or-
der to reduce energy consumption but also for the performance optimization. The reason
behind tuning the CPU frequency (voltage) is to avoid wasting energy without degrad-
ing the performances. For example, if an instruction does not require quick execution,
3https://download.01.org/perfmon/index/
31
clock frequency can be switched to lower P state, rather than running at full capacity. In
fact, lowering the frequency (voltage) will slow down the performance but also reduce the
energy consumption. However, as a consequence of slower clock frequencies some appli-
cations which have strict execution deadlines may fail to execute eventually. Thus, it is
a non-trivial task to identify optimal frequency not to have a side effect on performance
and vice-versa. In many UNIX systems, frequency tuning can be accomplished with the
help of scaling drivers which are loaded by default and can vary depending on processor
type. Intel pstate4 is well-known frequency scaling driver in modern Intel processors and
supports two type of scaling governors, namely powersave and performance. Governor is
an object of driver responsible for setting policies for each core. Acpi cpufreq is another
performance scaling driver which offers more scaling governors such as userspace, onde-
mand, schedutil and conservative. While some governors intend to execute a job with
higher frequencies, others allow to set user desired frequency that will be constant no
matter how busy CPU is.
2.5.3 DVFS
Dynamic Voltage Frequency Scaling (DVFS) is a technique aimed to build correlation
between processor energy consumption and its performance. Runtime energy optimiza-
tion can be achieved with the help of DFVS by dynamically scaling supply voltage/clock
frequency depending on the current CPU workload. This technique has been widely in-
tegrated in many hardware platforms, but mostly with Intel processors. The main idea
behind DVFS is operational energy efficiency which is achieved by slowing-down clock fre-
quency when there is no necessity to run at high processor speed. With DVFS supported
processors, there is range of available frequencies {fmin,...,fmax} that processor can adjust
itself to use based on the current workload. Although, lowering the operating frequency
can lead to less power consumption it can result on performance degradation; increase the
job execution time. As such, if the job has strict Quality of Service (QoS) requirements
(e.g. critical execution deadline), then lowering clock frequency could lead to execution
failure potentially. Also, executing each task of a batch (parallel jobs forming a group)
under the same frequency would cause unsatisfaction of execution deadlines.
4https://www.kernel.org/doc/html/v4.12/admin-guide/pm/intel_pstate.html
32
2.6 Software-defined Power Meters
Hardware based power meters can only report global energy consumption, meaning that
they illustrate total energy consumption of a target system including all hardware compo-
nents (CPU, memory, disk, network interfaces, etc.). As such those tools lack capability of
distributing collected total energy across all running user-space applications. Several stud-
ies have been conducted and various software-defined power meters have been developed
within the last decade to estimate energy usage per application, which will be described
in following sections.
2.6.1 Power Gadget
Intel Power Gadget5 is a software-defined power meter tool supported from 2nd generation
of Intel processors and it reports real-time measurements collected from Intel Running
Average Power Limit (RAPL) model-specific registers (MSR). Power Gadget is available
for Windows, Mac OS X and Linux distibutions.
2.6.2 Joulemeter
Microsoft has developed software-defined power meter so-called Joulemeter6 which is ca-
pable of estimating energy usage of each single component of a software, VM, as well as
various hardware components (CPU, memory, disk, etc.) using specific power model. Al-
though Joulemeter can report application-based energy usage, currenetly it is not available
for the public use.
2.6.3 PowerAPI
PowerAPI7 is an open source implementation of software-defined power meter and it was
developed by Spirals research group. PowerAPI illustrates real-time energy consumption
by utilizing raw data reported by RAPL interface on Intel processors which is based on
at least Sandy Bridge processor micro-architecture. One of the advantages of this tool is
the capability of reporting power consumption of user-space applications separately rather
than providing global energy consumption as many other software and hardware power
meters. Furthermore, PowerAPI has proven that it has a minimal overhead [19] on the host
machine while performing power measurements but it also offers high accuracy. Various
5https://software.intel.com/en-us/articles/intel-power-gadget6http://research.microsoft.com/joulemeter7https://github.com/powerapi-ng/powerapi-scala
33
modules can be configured for different power measurements upon the need allowing to
have a modular architecture.
2.6.4 BitWatts
BitWatts8[2] is another software - defined power tool developed specifically for measur-
ing application energy consumption which is running within VM. The main difference
between PowerAPI and BitWatts is the target environment of user-space applications,
notably BitWatts for virtualized environment where PowerAPI is meant mostly for con-
ducting bare-metal based energy measurements. In fact, it has been demonstrated that
BitWatts can perform accurate real-time energy measurements per process hosted within
a VM. Furthermore, the overall overhead/footprint generated by Bitwatts itself is very
low which is around 5.4W on average, thus has reasonably minimum impact on overall
energy consumption.
8https://github.com/Spirals-Team/bitwatts
34
3 METHODOLOGY
This chapter describes System Development Research Methodology used to conduct the
research work and highlights key elements. Entire research process is divided into macro
and micro levels which give detailed overview of the research process.
3.1 System Development Research
Research process is defined[17] as set of procedures or activities performed in sequence in
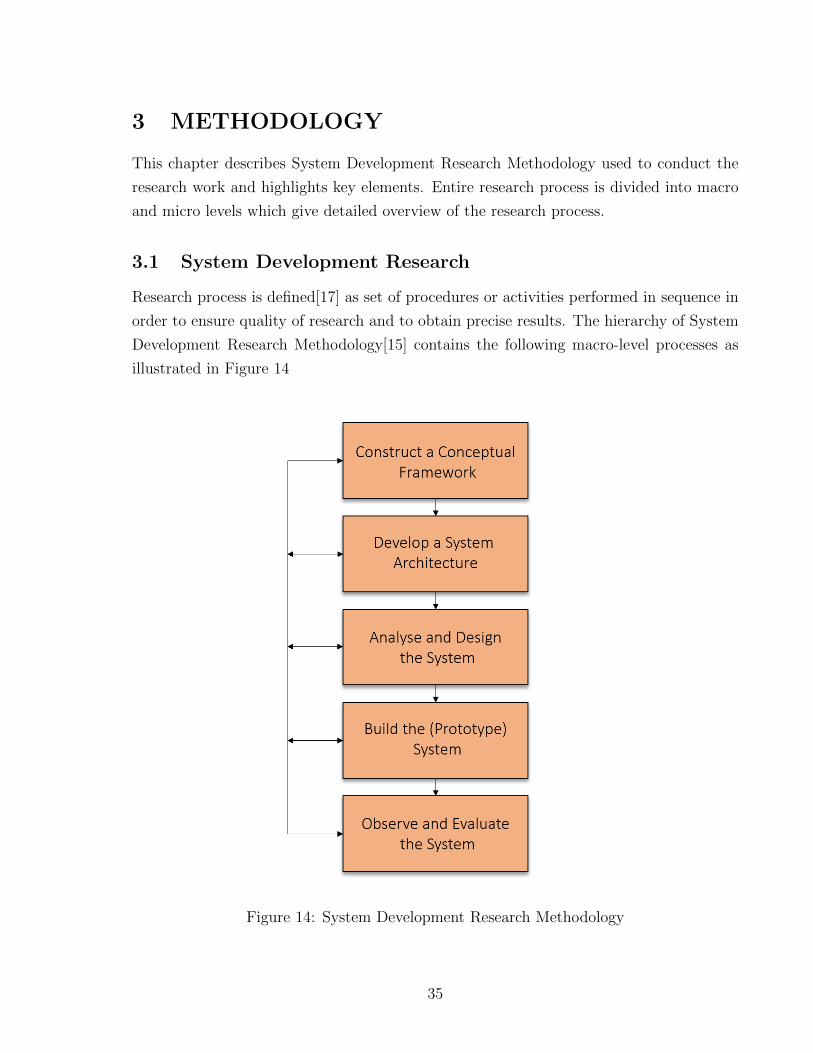
order to ensure quality of research and to obtain precise results. The hierarchy of System
Development Research Methodology[15] contains the following macro-level processes as
illustrated in Figure 14
Figure 14: System Development Research Methodology
35
The first stage intends to formulate a process of building the system, identifying re-
quirements and literature review to build knowledge of the domain. Researchers must
have a clear definition of the research problem to focus throughout development process.
Developing system architecture ensures to have clear vision of system development along
with all its tightly coupled functionalities. Based on the initial abstractions and theoreti-
cal knowledge, design of the system can be developed which is the most essential part of
the entire process. Many system development solutions (prototypes) can be proposed and
must be analysed. Building the system involves mainly engineering knowledge, and most
of the time it is prototype based architecture aimed to mimic the real-world scenarios.
Observations should made, tests must be performed based on the conceptual framework
at the last stage. Evaluation of the system according to obtained results can be made and
recommendations can be provided respectively.
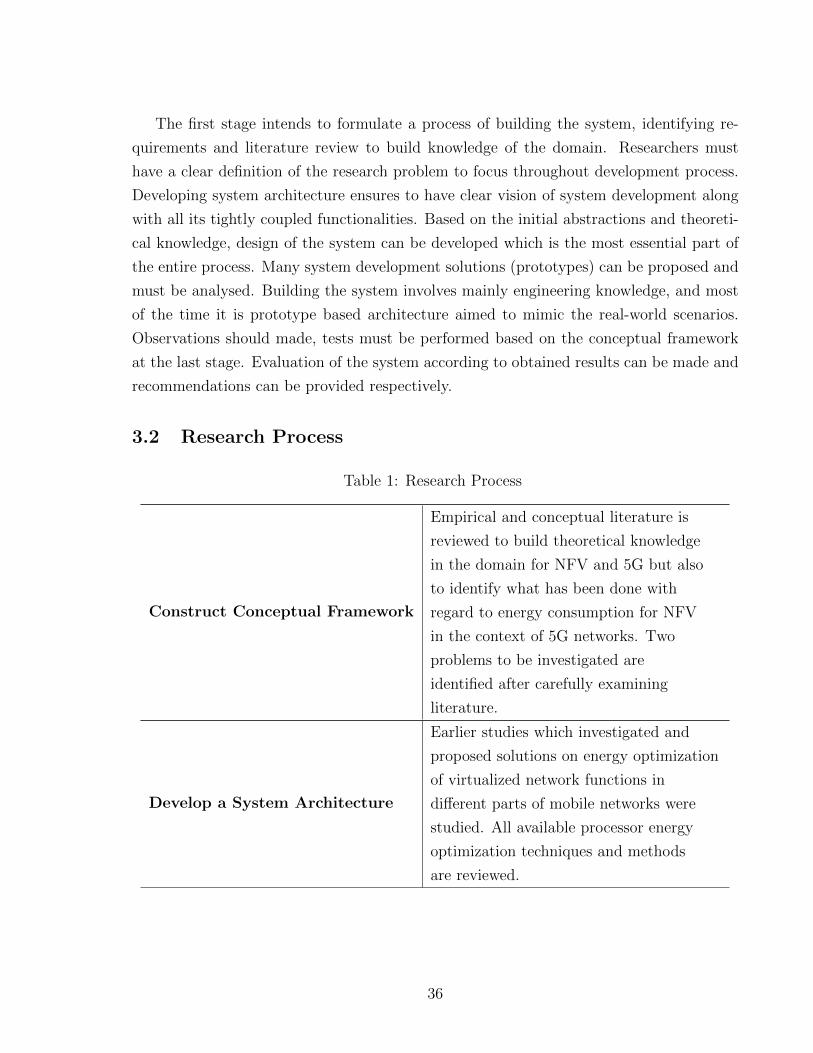
3.2 Research Process
Table 1: Research Process
Construct Conceptual Framework
Empirical and conceptual literature is
reviewed to build theoretical knowledge
in the domain for NFV and 5G but also
to identify what has been done with
regard to energy consumption for NFV
in the context of 5G networks. Two
problems to be investigated are
identified after carefully examining
literature.
Develop a System Architecture
Earlier studies which investigated and
proposed solutions on energy optimization
of virtualized network functions in
different parts of mobile networks were
studied. All available processor energy
optimization techniques and methods
are reviewed.
36
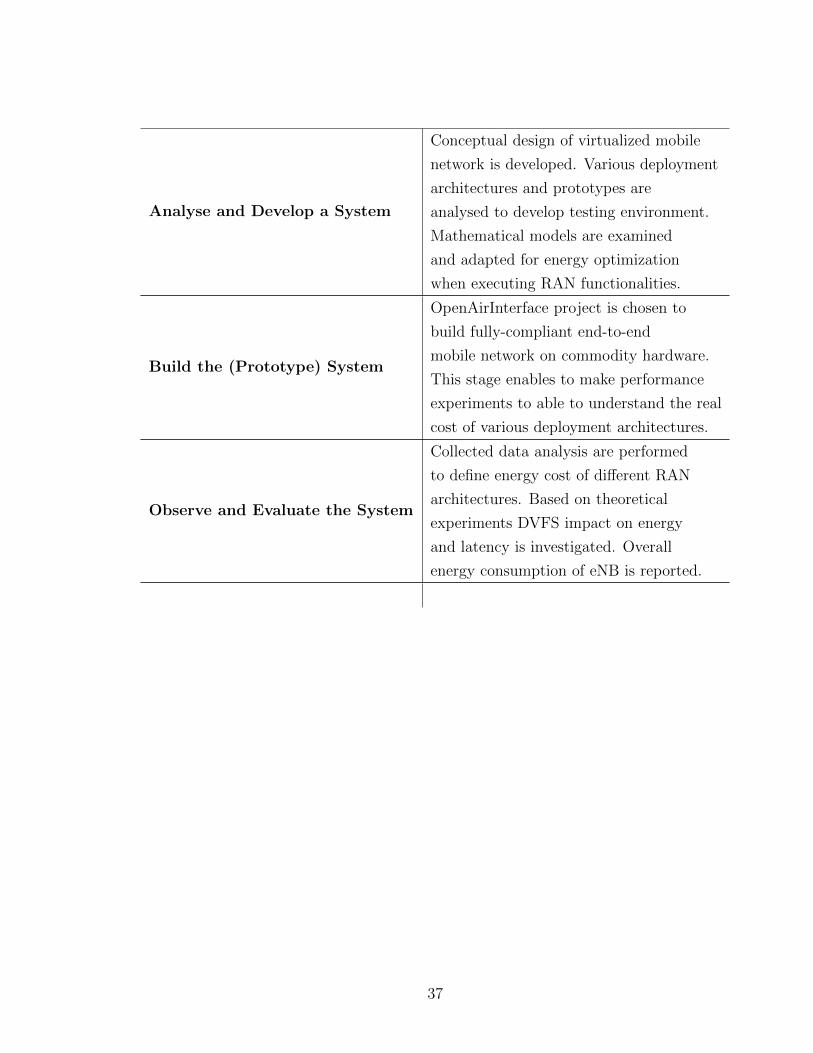
Analyse and Develop a System
Conceptual design of virtualized mobile
network is developed. Various deployment
architectures and prototypes are
analysed to develop testing environment.
Mathematical models are examined
and adapted for energy optimization
when executing RAN functionalities.
Build the (Prototype) System
OpenAirInterface project is chosen to
build fully-compliant end-to-end
mobile network on commodity hardware.
This stage enables to make performance
experiments to able to understand the real
cost of various deployment architectures.
Observe and Evaluate the System
Collected data analysis are performed
to define energy cost of different RAN
architectures. Based on theoretical
experiments DVFS impact on energy
and latency is investigated. Overall
energy consumption of eNB is reported.
37
4 IMPLEMENTATION
This chapter is divided into two sections: (4.1) describes theoretical model we use to
experiment energy optimization techniques for RAN functions and after obtained results.
Section (4.2) first explains the implementation of C-RAN using OpenAirInterface Software
Alliance code, experimental set-up for energy measurements and finally obtained results.
4.1 Mathematical model
This section describes energy optimization model by starting from energy model used to
analyze energy consumption, then frequency scaling factor to configure processor optimal
frequencies and finally results obtained from simulations.
4.1.1 Energy model
To evaluate total energy consumption of a batch composed of n parallel independent jobs
each scheduled for different core, we adapt the following equation as presented in [26]
E T1||...||Tn =n∑
i=1
(s−3i ∗ Pdyn + Pstatic) ∗ si; (1)
where Tn denotes execution time, s processor frequency scaling factor, Pdyn is dynamic
power and Pstatic is static power. Frequency scaling factor s is non-negative value which will
be used to configure lower frequencies, with the aim to reduce CPU energy consumption
during runtime.
4.1.2 Static and Dynamic power
As can be seen in (1) the overall power consumption of a server is composed of dynamic
power Pdyn and static power Pstatic. In fact, total power consumption is the sum of dynamic
and static power as following:
Ptotal = Pdyn + Pstatic (2)
Static Power - even if CPU has no tasks to execute (i.e. no program to run) there is
still some power being consumed during CPU’s idle state [34], which is referred as static
or leakage power [14].
Dynamic Power - depends on switching activities (i.a. frequency) of a processor and
changes linearly with frequency.
38
Before identifying optimal DVFS scaling factor (i.e. optimal frequencies), it requires Pdyn
and Pstatic to be extracted from the Ptotal. Extracting static and dynamic power is non-
trivial task and some methodologies have been introduced in the literature. As such to
define static and dynamic power we first evaluate overall power consumption Ptotal of a
server using Watts Up Pro hardware-based power meter. To capture power variation at
different CPU load, stress9 UNIX utility was chosen as the workload generator tool to per-
form incremental workloads at different hardware components of a server with parameters
given in Table 2. All available power and frequency management features are disabled
including Hyper-Threading, Turbo-Boost and C-states in order to capture power mea-
surements for only physical cores operating under full capacity.
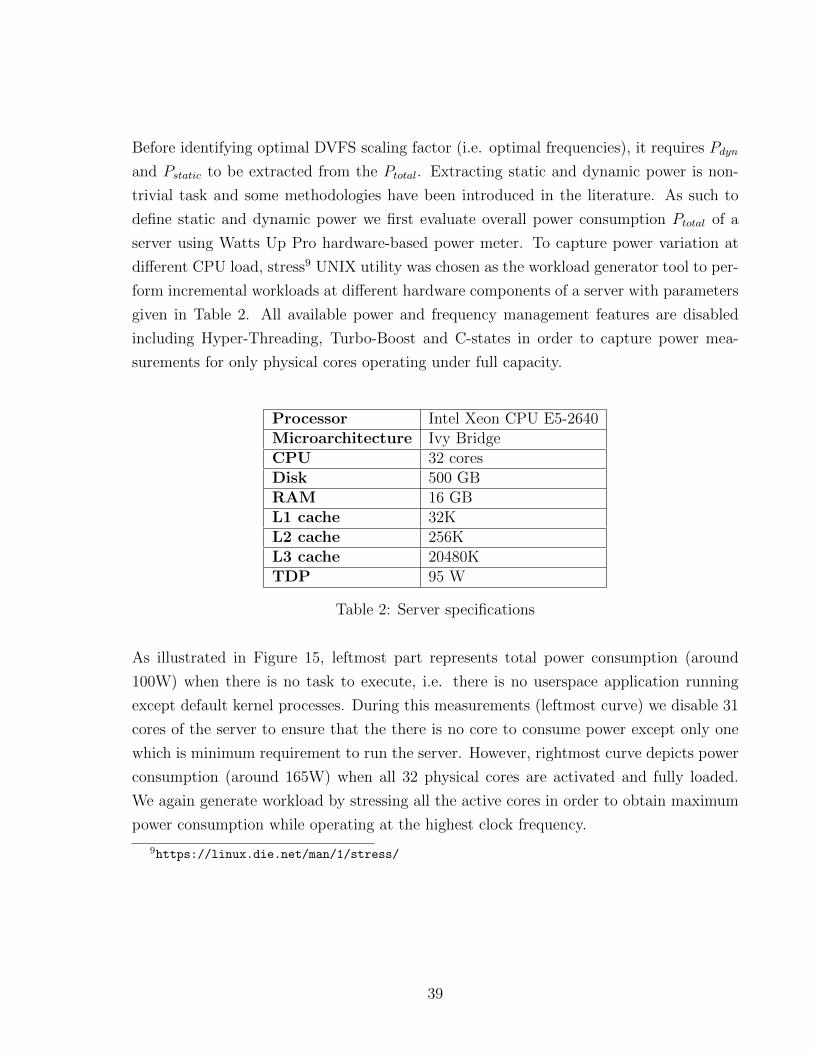
Processor Intel Xeon CPU E5-2640Microarchitecture Ivy BridgeCPU 32 coresDisk 500 GBRAM 16 GBL1 cache 32KL2 cache 256KL3 cache 20480KTDP 95 W
Table 2: Server specifications
As illustrated in Figure 15, leftmost part represents total power consumption (around
100W) when there is no task to execute, i.e. there is no userspace application running
except default kernel processes. During this measurements (leftmost curve) we disable 31
cores of the server to ensure that the there is no core to consume power except only one
which is minimum requirement to run the server. However, rightmost curve depicts power
consumption (around 165W) when all 32 physical cores are activated and fully loaded.
We again generate workload by stressing all the active cores in order to obtain maximum
power consumption while operating at the highest clock frequency.
9https://linux.die.net/man/1/stress/
39
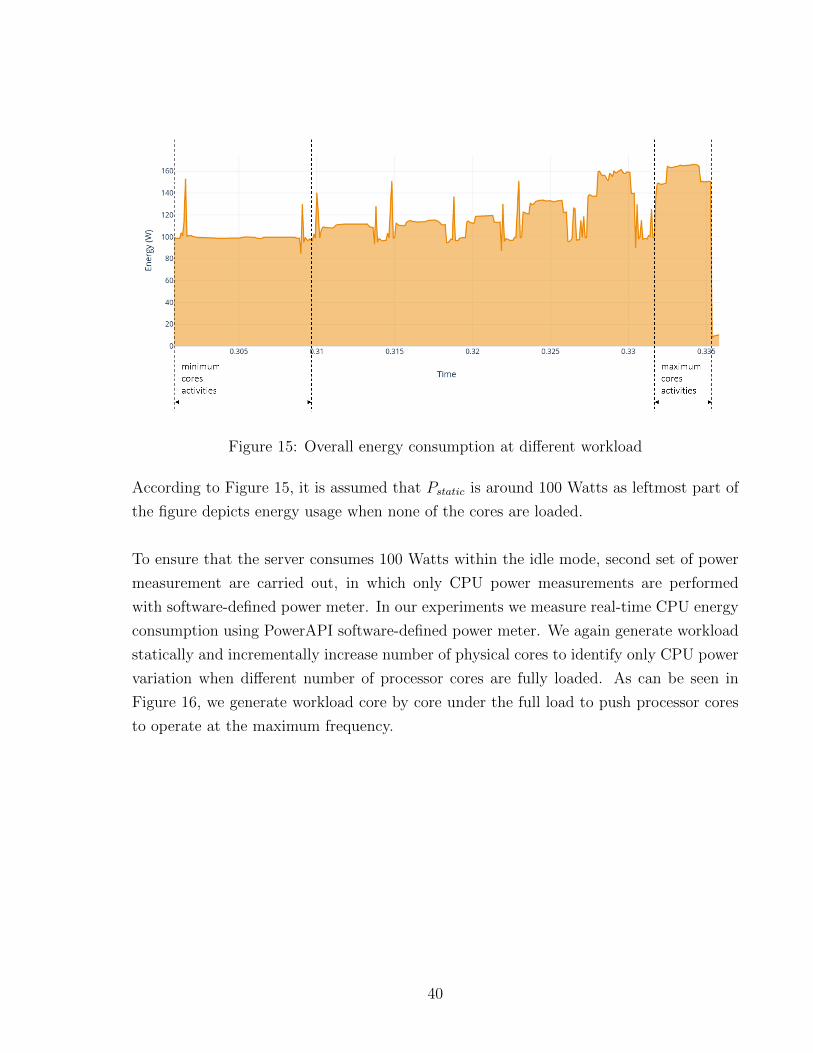
Figure 15: Overall energy consumption at different workload
According to Figure 15, it is assumed that Pstatic is around 100 Watts as leftmost part of
the figure depicts energy usage when none of the cores are loaded.
To ensure that the server consumes 100 Watts within the idle mode, second set of power
measurement are carried out, in which only CPU power measurements are performed
with software-defined power meter. In our experiments we measure real-time CPU energy
consumption using PowerAPI software-defined power meter. We again generate workload
statically and incrementally increase number of physical cores to identify only CPU power
variation when different number of processor cores are fully loaded. As can be seen in
Figure 16, we generate workload core by core under the full load to push processor cores
to operate at the maximum frequency.
40
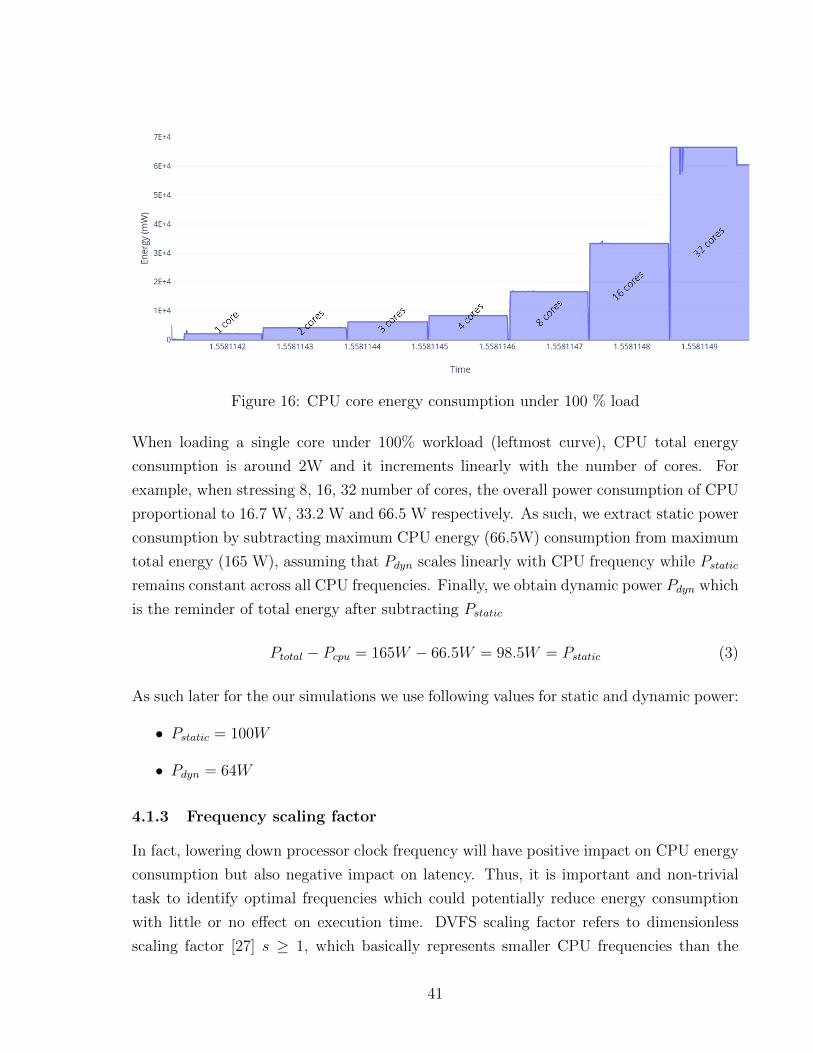
Figure 16: CPU core energy consumption under 100 % load
When loading a single core under 100% workload (leftmost curve), CPU total energy
consumption is around 2W and it increments linearly with the number of cores. For
example, when stressing 8, 16, 32 number of cores, the overall power consumption of CPU
proportional to 16.7 W, 33.2 W and 66.5 W respectively. As such, we extract static power
consumption by subtracting maximum CPU energy (66.5W) consumption from maximum
total energy (165 W), assuming that Pdyn scales linearly with CPU frequency while Pstatic
remains constant across all CPU frequencies. Finally, we obtain dynamic power Pdyn which
is the reminder of total energy after subtracting Pstatic
Ptotal − Pcpu = 165W − 66.5W = 98.5W = Pstatic (3)
As such later for the our simulations we use following values for static and dynamic power:
• Pstatic = 100W
• Pdyn = 64W
4.1.3 Frequency scaling factor
In fact, lowering down processor clock frequency will have positive impact on CPU energy
consumption but also negative impact on latency. Thus, it is important and non-trivial
task to identify optimal frequencies which could potentially reduce energy consumption
with little or no effect on execution time. DVFS scaling factor refers to dimensionless
scaling factor [27] s ≥ 1, which basically represents smaller CPU frequencies than the
41
maximum. In general, DVFS scaling factor is dimensionless value obtained through divi-
sion of fmax to fnew
s =fmax
fnew; (4)
fmin ≤ fnew ≤ fmax
To compute adaptive scaling factor depending on the job execution time we rely on
the following formula as presented in [28, 25]
sadapti = smaxCTmax
CTi
; (5)
CTmax denotes to the highest execution time among others within the same subframe, while
CTmax is execution time of jobi.
To obtain optimal scaling factor which could potentially reduce energy consumption
during execution time following equation is computed,
scopt = 3
√√√√ 2 ∗ Pdyn
n ∗ Pstatic
∗(
1 +n∑
i=2
C3Ti
C3Tmax
); i = {1, ..., n}; n = 13 (6)
Finally, another scaling factor sopt is adapted based on Pdyn and Pstatic as following
sopt = 3
√2 ∗ Pdyn
Pstatic
i = {1, ..., n}; n = 13 (7)
While some of the network functions are non-real time, some are real-time and can
have critical requirements for hosting infrastructure or QoS parameters. Channel coding
is the one of those low-layer functions that presents strict execution deadline. As such, we
specifically focus on optimization of energy consumption during the execution of channel
coding function. It should be noted that, we evaluate subframe energy consumption com-
posed of n number of channel coding functions. This subframe is expected to be executed
in multicore system, thus we assume that each job within the subframe is executed on
a separate processor core. We first evaluate total execution time of a subframe and its
energy consumption when all the available processor cores are running at the highest clock
frequency (except turbo frequencies). We assume that subframe total execution time is
proportional to a highest execution time in the subframe. For example, since each job is
being executed in parallel, all the jobs which already have finished their execution still
have to wait until the job with longest execution time is completed. As such, the overall
42
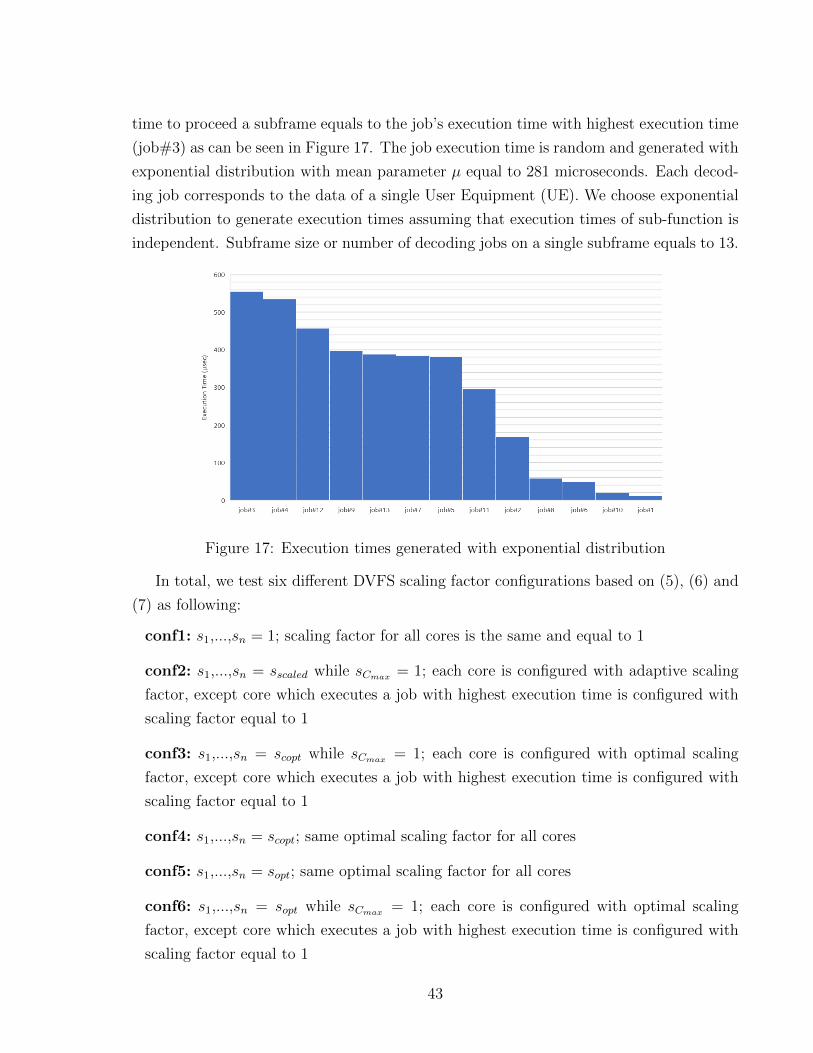
time to proceed a subframe equals to the job’s execution time with highest execution time
(job#3) as can be seen in Figure 17. The job execution time is random and generated with
exponential distribution with mean parameter µ equal to 281 microseconds. Each decod-
ing job corresponds to the data of a single User Equipment (UE). We choose exponential
distribution to generate execution times assuming that execution times of sub-function is
independent. Subframe size or number of decoding jobs on a single subframe equals to 13.
Figure 17: Execution times generated with exponential distribution
In total, we test six different DVFS scaling factor configurations based on (5), (6) and
(7) as following:
conf1: s1,...,sn = 1; scaling factor for all cores is the same and equal to 1
conf2: s1,...,sn = sscaled while sCmax = 1; each core is configured with adaptive scaling
factor, except core which executes a job with highest execution time is configured with
scaling factor equal to 1
conf3: s1,...,sn = scopt while sCmax = 1; each core is configured with optimal scaling
factor, except core which executes a job with highest execution time is configured with
scaling factor equal to 1
conf4: s1,...,sn = scopt; same optimal scaling factor for all cores
conf5: s1,...,sn = sopt; same optimal scaling factor for all cores
conf6: s1,...,sn = sopt while sCmax = 1; each core is configured with optimal scaling
factor, except core which executes a job with highest execution time is configured with
scaling factor equal to 1
43
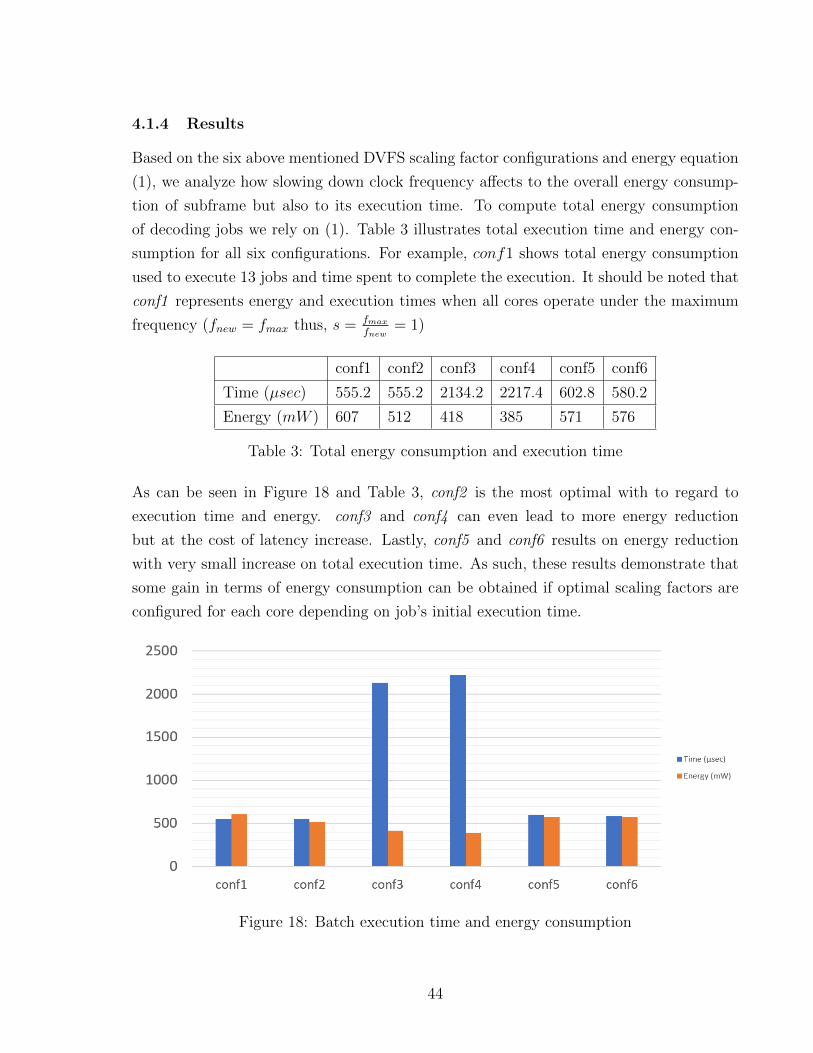
4.1.4 Results
Based on the six above mentioned DVFS scaling factor configurations and energy equation
(1), we analyze how slowing down clock frequency affects to the overall energy consump-
tion of subframe but also to its execution time. To compute total energy consumption
of decoding jobs we rely on (1). Table 3 illustrates total execution time and energy con-
sumption for all six configurations. For example, conf1 shows total energy consumption
used to execute 13 jobs and time spent to complete the execution. It should be noted that
conf1 represents energy and execution times when all cores operate under the maximum
frequency (fnew = fmax thus, s = fmax
fnew= 1)
conf1 conf2 conf3 conf4 conf5 conf6
Time (µsec) 555.2 555.2 2134.2 2217.4 602.8 580.2
Energy (mW ) 607 512 418 385 571 576
Table 3: Total energy consumption and execution time
As can be seen in Figure 18 and Table 3, conf2 is the most optimal with to regard to
execution time and energy. conf3 and conf4 can even lead to more energy reduction
but at the cost of latency increase. Lastly, conf5 and conf6 results on energy reduction
with very small increase on total execution time. As such, these results demonstrate that
some gain in terms of energy consumption can be obtained if optimal scaling factors are
configured for each core depending on job’s initial execution time.
Figure 18: Batch execution time and energy consumption
44
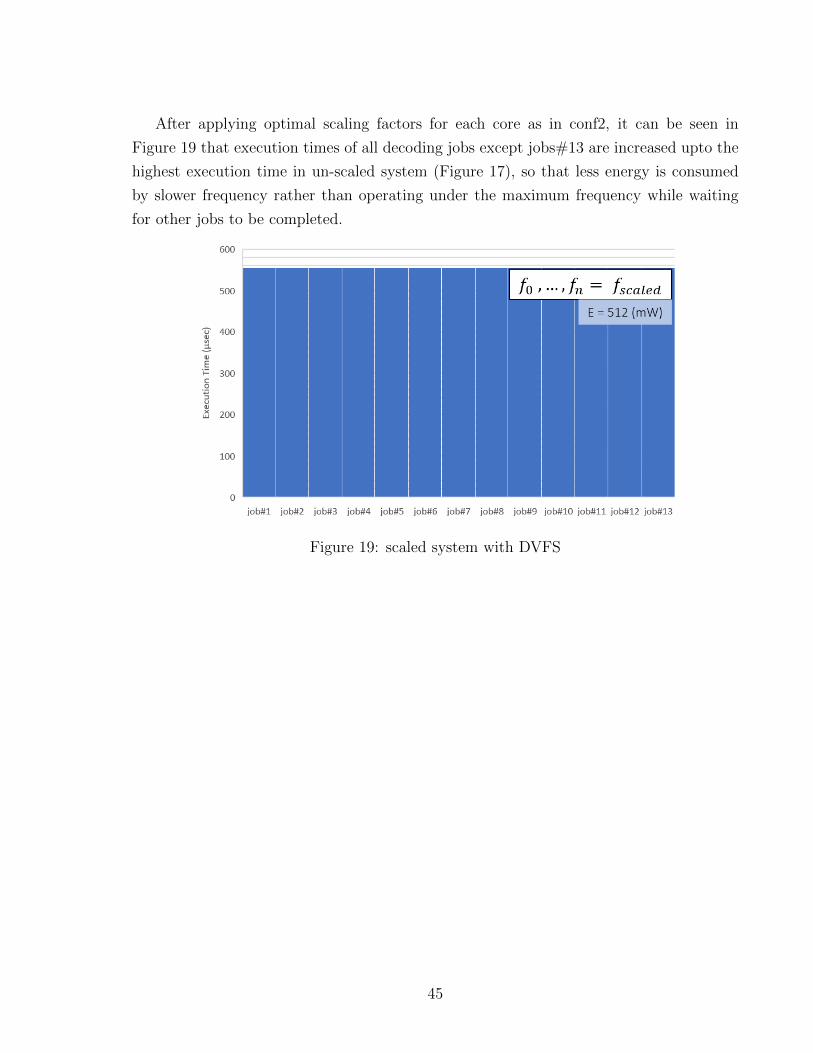
After applying optimal scaling factors for each core as in conf2, it can be seen in
Figure 19 that execution times of all decoding jobs except jobs#13 are increased upto the
highest execution time in un-scaled system (Figure 17), so that less energy is consumed
by slower frequency rather than operating under the maximum frequency while waiting
for other jobs to be completed.
Figure 19: scaled system with DVFS
45
4.2 5G Testbed Description
This chapter will discuss Phase 2 of our research workflow, notably two different deploy-
ment architectures of fully virtualized end-to-end mobile network will be described. Each
of the below subsections will explain open-source software-based implementation of two
different mobile network architectures from technical viewpoint.
4.2.1 Open Air Interface
To analyse energy consumption of various RAN functional split options, first it requires
to implement or prototype fully compliant end-to-end mobile network to be tested with
regard to energy consumption. Open Air Interface (OAI)10 is chosen as an open-source
reference implementation of 3GPP technologies to build various units of mobile networks
such as base station, user equipment and the core network. Commoditization and virtu-
alization of network functions enable deploying services on top of the commercial off-the
shelf servers with some small dependencies on hardware, leading to avoid vendor locking.
As such OAI serves as project concretely dedicated to testing, deploying, verification and
validation of different functionalities of 4G LTE but also future 5G networks on commod-
ity hardware. OAI project was started in 2014 under initiatives of French research centre
in communication systems namely EURECOM. OAI supports full stack implementation
of 3GPP technologies such as radio access network and core network. In general, OAI is
composed of two main projects as following
1. Open Air Interface Radio Access Network (OAI-RAN)
2. Open Air Interface Core Network (OAI-CN)
As such, to build software based end-to-end mobile network we use both OAI-RAN and
OAI-CN projects. In order to evaluate energy cost with 3GPP functional split option 8
and option 7 we build two different network architectures namely monolithic and split as
described in more details below.
In fact, as mentioned above, OAI can be deployed on commodity hardware but there
are some system requirements that one needs to take into account before starting imple-
mentation. For example, in the context of RAN, it is strongly recommended to build
software on top of low-latency Kernel or to be specific 3.19.0-61-lowlatency. In order to
utilize full capacity of a server all the power management features need to be disabled
10https://www.openairinterface.org/
46
including P-states. Furthermore, we disable Hyper-threading, CPU frequency control and
C-States from BIOS configuration to avoid any dynamic tuning of clock frequency during
the time of execution. By default, most of the latest Intel servers come with intel pstate
scaling driver which supports powersave and performance governors. We disable CPU
frequency scaling by configuring performance governor in BIOS configuration as it selects
the maximum P-state it is allowed to use. As for the server hosting Core network (EPC),
it is preferable and tested to use with Kernel 4.7 release and strongly recommended to
avoid using 3.19.0-59-generic release. Although, it is possible to host EPC and RAN on a
single server, it is suggested to run them on a separate machines since it can cause ker-
nel/package requirements conflicts. There are several OAI source code branches available
at Gitlab, where develop and master branches are two main which have been used for
testing purposes. Also, it should be noted that master branch offers more stable code
while develop one considered as unstable code as it is always under development but can
provide more extra features (e.g. functional split). In fact, eNB and EPC are configured
for band 7 Frequency-Division Duplexing (FDD) 5MHz and same for Subscriber Identity
Module (SIM) card configurations. We program a SysmoCom SIM card with the open-
cells Universal Integrated Circuit Card (UICC) reader with specific Tracking Area Code
(TAC), Mobile Country Code (MCC) and Mobile Network Code (MNC) and pass all these
parameters to eNB. It is important to ensure that band configured for OAI doesn’t operate
at the same frequency as the real mobile network in surrounding area which can cause
interference potentially.
4.2.2 OAI Monotolithic deployment
As one of the target scenarios for testing energy consumption, we deploy end-to-end mobile
network with OAI source code11. We call this architecture as monolithic deployment since
the full stack of RAN functionalities reside on a single server. As illustrated in Figure 20
Evolved Packet Core is hosted on a separate machine on the right side of the figure
while server in the middle acts as eNB responsible for executing RAN functionalities
(RRC, PDCP, RLC, MAC, PHY). Mobility Management Entity (MME), Service Provider
Gateway (SPGW) and Home Subscriber Server (HSS) are the network functions that reside
within EPC. In general EPC is in charge of security functions, radio resource management,
network management functions, packet routing and access control. On the left side of eNB
we use USRP B210 board which covers RF frequencies from 70MHz to 6 GHz and supports
Spartan6 FPGA and USB 3.0 connectivity. In total there are four channels, two to receive
11https://gitlab.eurecom.fr/oai/openairinterface5g/wikis/OpenAirUsage
47
and two to transmit.
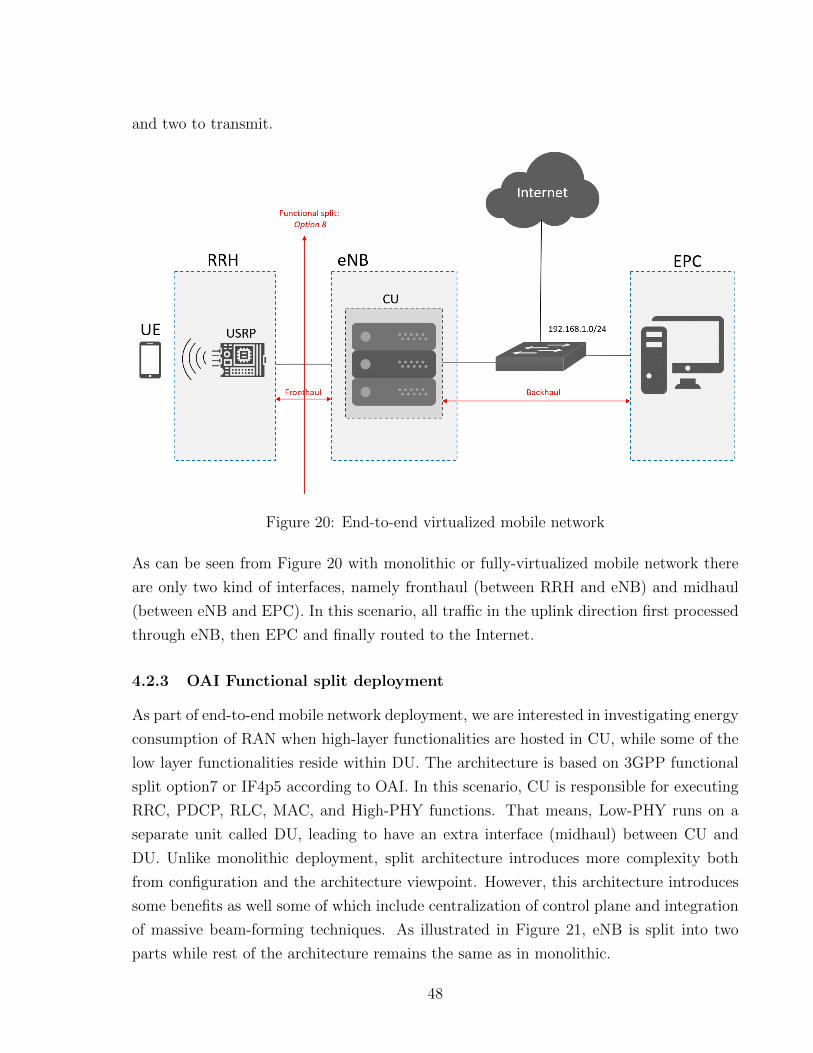
Figure 20: End-to-end virtualized mobile network
As can be seen from Figure 20 with monolithic or fully-virtualized mobile network there
are only two kind of interfaces, namely fronthaul (between RRH and eNB) and midhaul
(between eNB and EPC). In this scenario, all traffic in the uplink direction first processed
through eNB, then EPC and finally routed to the Internet.
4.2.3 OAI Functional split deployment
As part of end-to-end mobile network deployment, we are interested in investigating energy
consumption of RAN when high-layer functionalities are hosted in CU, while some of the
low layer functionalities reside within DU. The architecture is based on 3GPP functional
split option7 or IF4p5 according to OAI. In this scenario, CU is responsible for executing
RRC, PDCP, RLC, MAC, and High-PHY functions. That means, Low-PHY runs on a
separate unit called DU, leading to have an extra interface (midhaul) between CU and
DU. Unlike monolithic deployment, split architecture introduces more complexity both
from configuration and the architecture viewpoint. However, this architecture introduces
some benefits as well some of which include centralization of control plane and integration
of massive beam-forming techniques. As illustrated in Figure 21, eNB is split into two
parts while rest of the architecture remains the same as in monolithic.
48
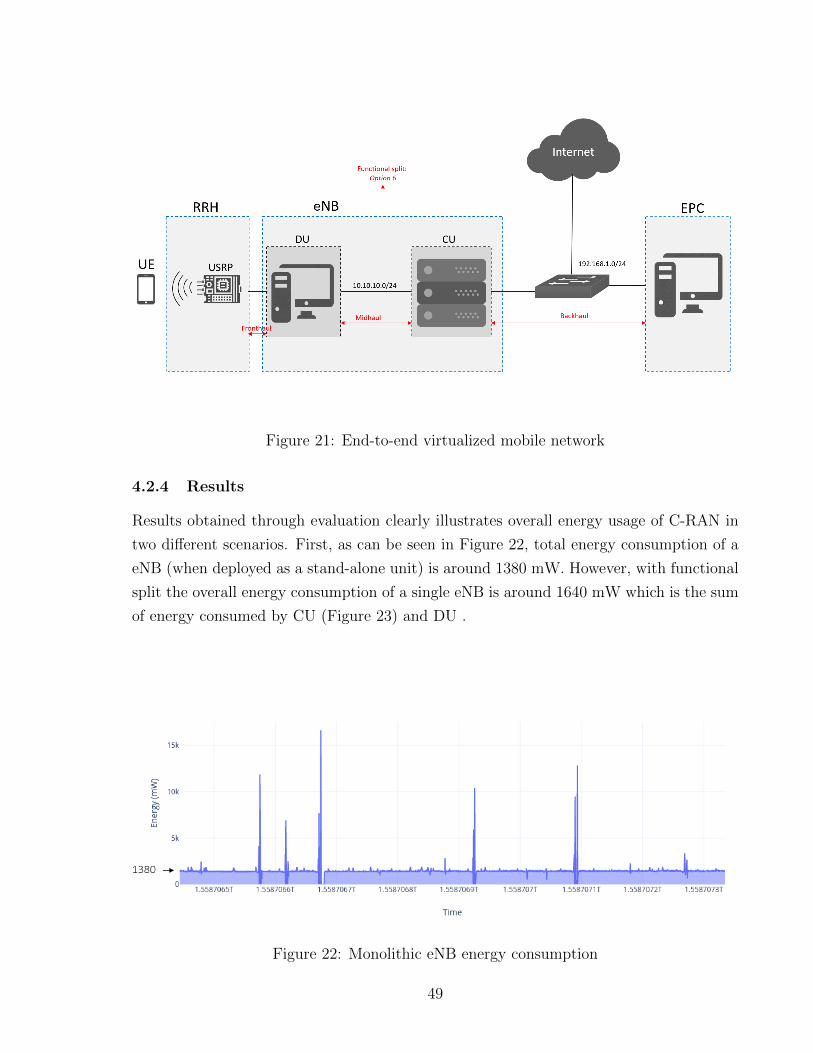
Figure 21: End-to-end virtualized mobile network
4.2.4 Results
Results obtained through evaluation clearly illustrates overall energy usage of C-RAN in
two different scenarios. First, as can be seen in Figure 22, total energy consumption of a
eNB (when deployed as a stand-alone unit) is around 1380 mW. However, with functional
split the overall energy consumption of a single eNB is around 1640 mW which is the sum
of energy consumed by CU (Figure 23) and DU .
Figure 22: Monolithic eNB energy consumption
49
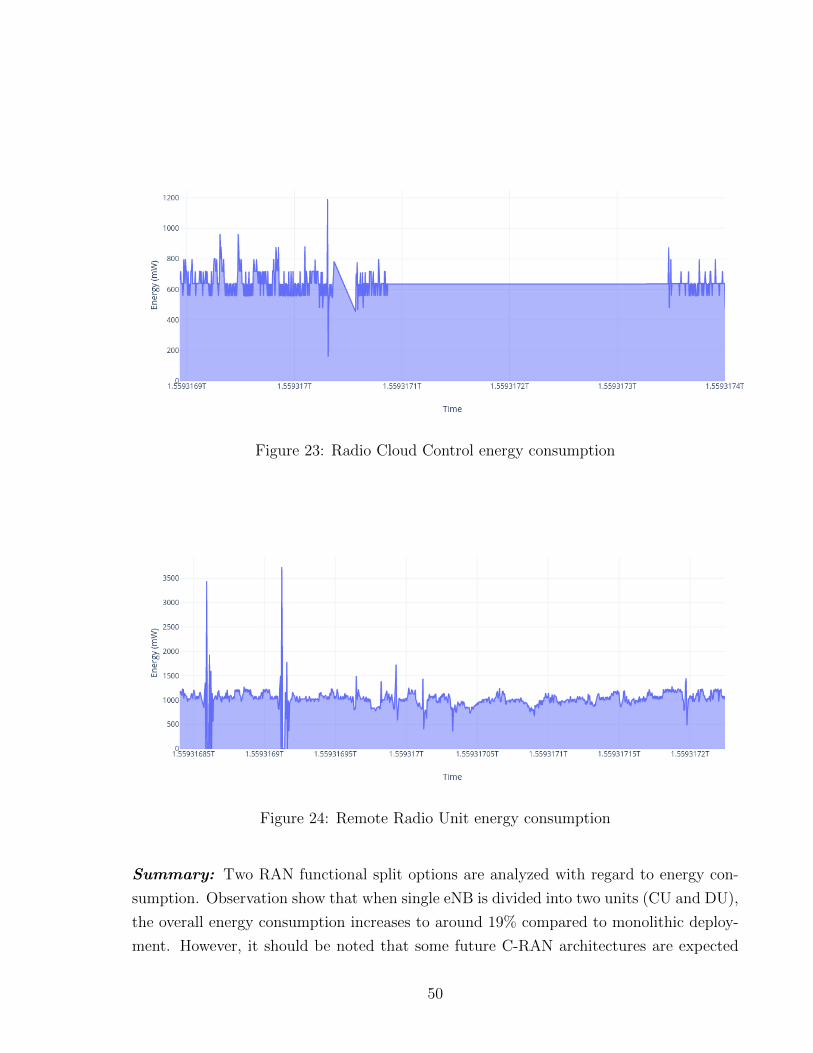
Figure 23: Radio Cloud Control energy consumption
Figure 24: Remote Radio Unit energy consumption
Summary: Two RAN functional split options are analyzed with regard to energy con-
sumption. Observation show that when single eNB is divided into two units (CU and DU),
the overall energy consumption increases to around 19% compared to monolithic deploy-
ment. However, it should be noted that some future C-RAN architectures are expected
50

to have n-1 connections between DU and CU, where overall energy cost can be less than
having several stand-alone BBUs.
51
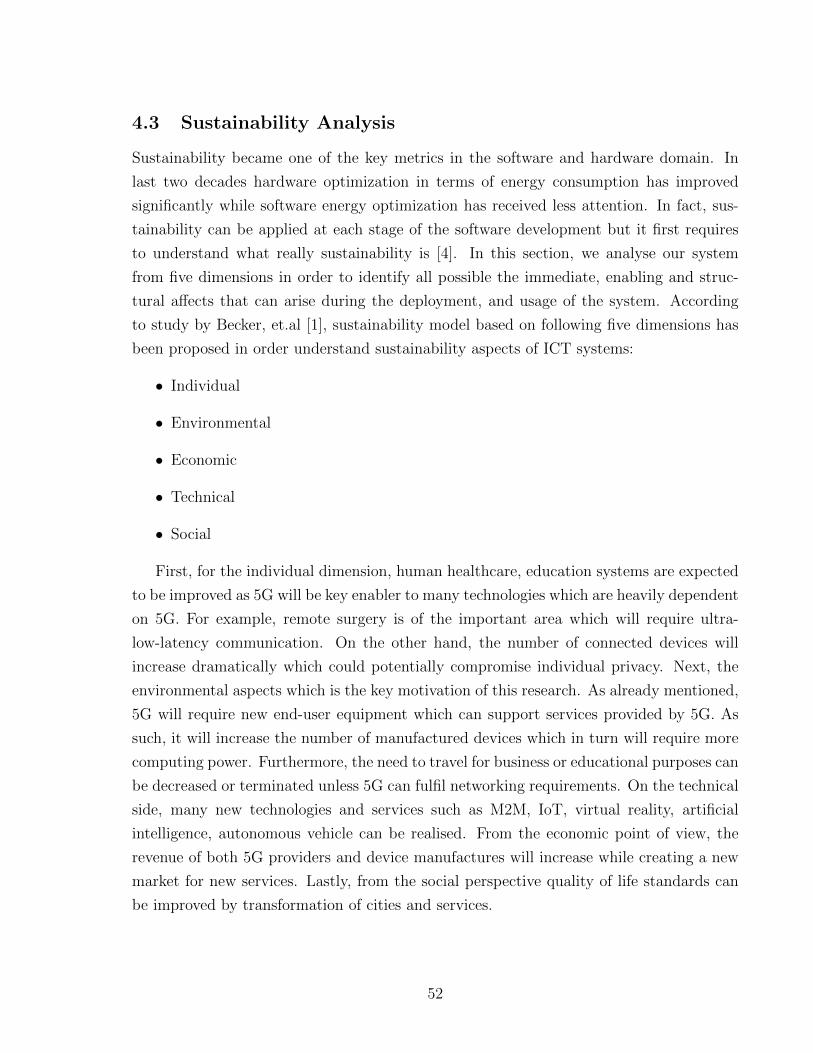
4.3 Sustainability Analysis
Sustainability became one of the key metrics in the software and hardware domain. In
last two decades hardware optimization in terms of energy consumption has improved
significantly while software energy optimization has received less attention. In fact, sus-
tainability can be applied at each stage of the software development but it first requires
to understand what really sustainability is [4]. In this section, we analyse our system
from five dimensions in order to identify all possible the immediate, enabling and struc-
tural affects that can arise during the deployment, and usage of the system. According
to study by Becker, et.al [1], sustainability model based on following five dimensions has
been proposed in order understand sustainability aspects of ICT systems:
• Individual
• Environmental
• Economic
• Technical
• Social
First, for the individual dimension, human healthcare, education systems are expected
to be improved as 5G will be key enabler to many technologies which are heavily dependent
on 5G. For example, remote surgery is of the important area which will require ultra-
low-latency communication. On the other hand, the number of connected devices will
increase dramatically which could potentially compromise individual privacy. Next, the
environmental aspects which is the key motivation of this research. As already mentioned,
5G will require new end-user equipment which can support services provided by 5G. As
such, it will increase the number of manufactured devices which in turn will require more
computing power. Furthermore, the need to travel for business or educational purposes can
be decreased or terminated unless 5G can fulfil networking requirements. On the technical
side, many new technologies and services such as M2M, IoT, virtual reality, artificial
intelligence, autonomous vehicle can be realised. From the economic point of view, the
revenue of both 5G providers and device manufactures will increase while creating a new
market for new services. Lastly, from the social perspective quality of life standards can
be improved by transformation of cities and services.
52
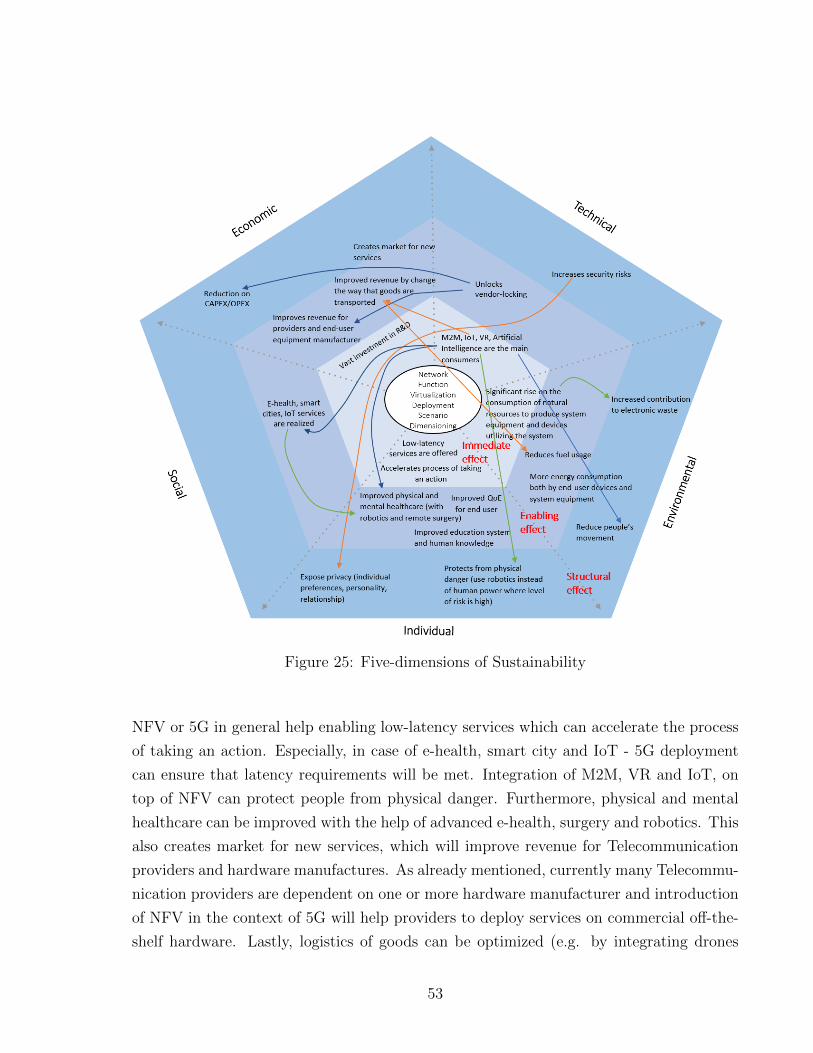
Figure 25: Five-dimensions of Sustainability
NFV or 5G in general help enabling low-latency services which can accelerate the process
of taking an action. Especially, in case of e-health, smart city and IoT - 5G deployment
can ensure that latency requirements will be met. Integration of M2M, VR and IoT, on
top of NFV can protect people from physical danger. Furthermore, physical and mental
healthcare can be improved with the help of advanced e-health, surgery and robotics. This
also creates market for new services, which will improve revenue for Telecommunication
providers and hardware manufactures. As already mentioned, currently many Telecommu-
nication providers are dependent on one or more hardware manufacturer and introduction
of NFV in the context of 5G will help providers to deploy services on commercial off-the-
shelf hardware. Lastly, logistics of goods can be optimized (e.g. by integrating drones
53

that operate on solar energy) leading to less fuel consumption as well as improving the
revenue for service providers.
54
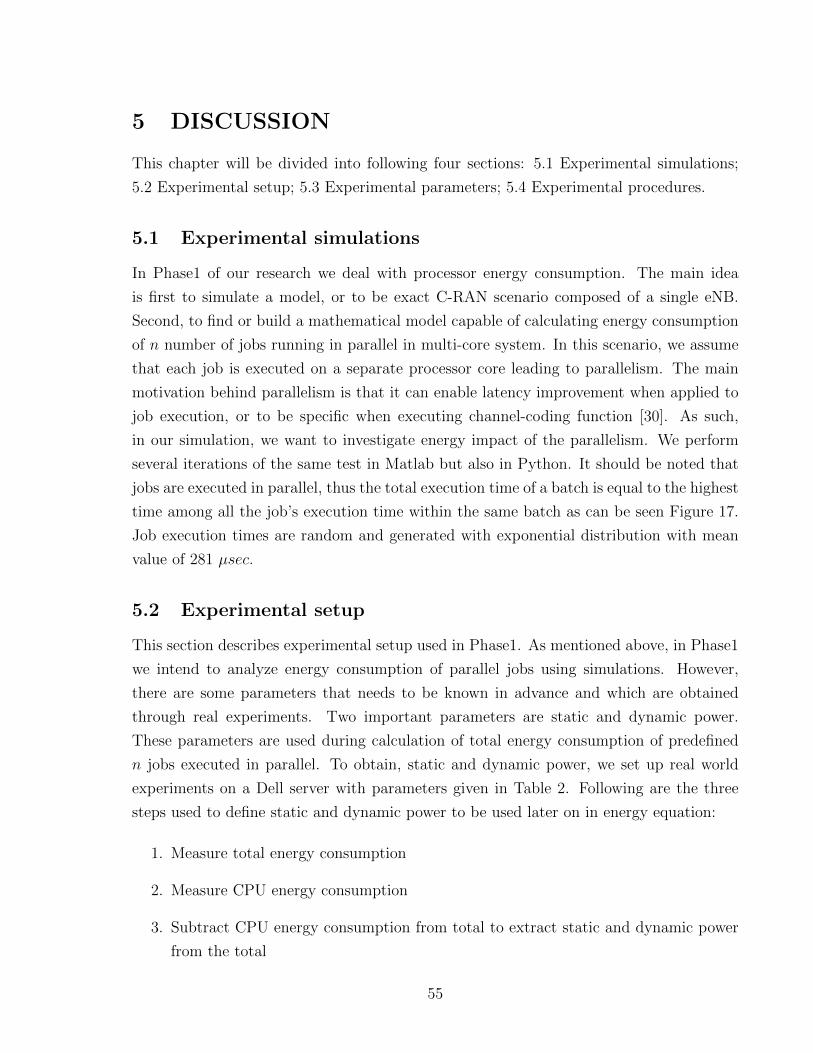
5 DISCUSSION
This chapter will be divided into following four sections: 5.1 Experimental simulations;
5.2 Experimental setup; 5.3 Experimental parameters; 5.4 Experimental procedures.
5.1 Experimental simulations
In Phase1 of our research we deal with processor energy consumption. The main idea
is first to simulate a model, or to be exact C-RAN scenario composed of a single eNB.
Second, to find or build a mathematical model capable of calculating energy consumption
of n number of jobs running in parallel in multi-core system. In this scenario, we assume
that each job is executed on a separate processor core leading to parallelism. The main
motivation behind parallelism is that it can enable latency improvement when applied to
job execution, or to be specific when executing channel-coding function [30]. As such,
in our simulation, we want to investigate energy impact of the parallelism. We perform
several iterations of the same test in Matlab but also in Python. It should be noted that
jobs are executed in parallel, thus the total execution time of a batch is equal to the highest
time among all the job’s execution time within the same batch as can be seen Figure 17.
Job execution times are random and generated with exponential distribution with mean
value of 281 µsec.
5.2 Experimental setup
This section describes experimental setup used in Phase1. As mentioned above, in Phase1
we intend to analyze energy consumption of parallel jobs using simulations. However,
there are some parameters that needs to be known in advance and which are obtained
through real experiments. Two important parameters are static and dynamic power.
These parameters are used during calculation of total energy consumption of predefined
n jobs executed in parallel. To obtain, static and dynamic power, we set up real world
experiments on a Dell server with parameters given in Table 2. Following are the three
steps used to define static and dynamic power to be used later on in energy equation:
1. Measure total energy consumption
2. Measure CPU energy consumption
3. Subtract CPU energy consumption from total to extract static and dynamic power
from the total
55
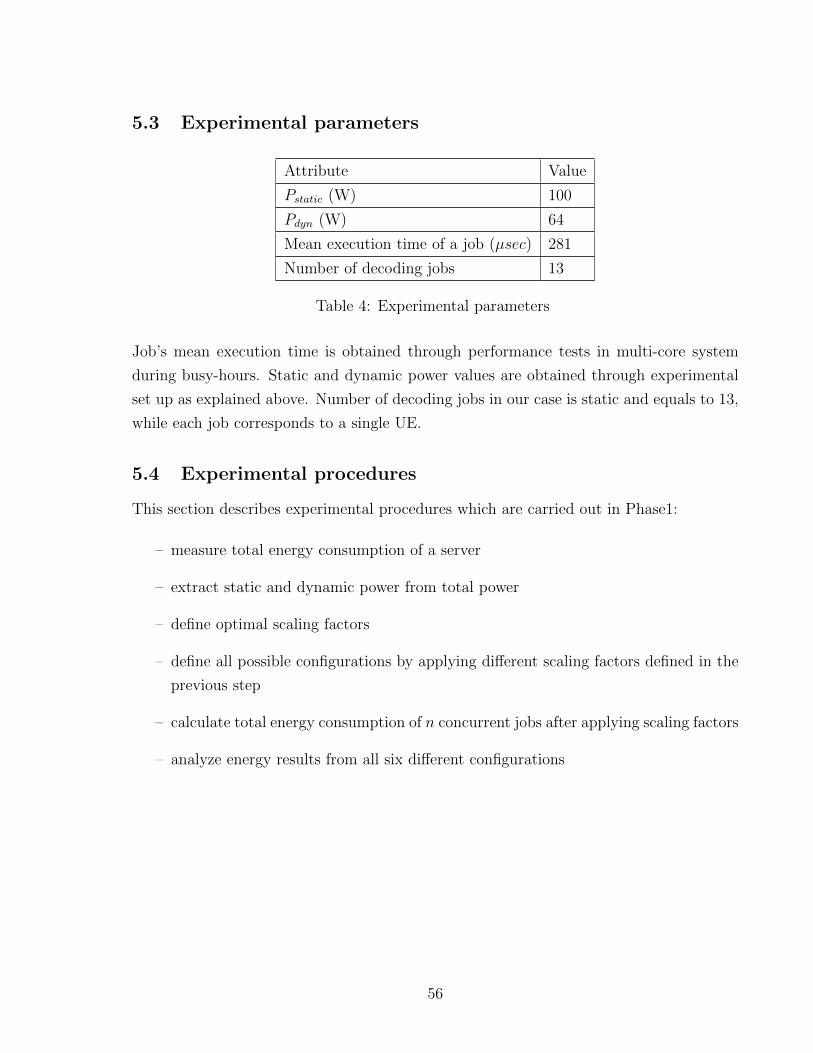
5.3 Experimental parameters
Attribute Value
Pstatic (W) 100
Pdyn (W) 64
Mean execution time of a job (µsec) 281
Number of decoding jobs 13
Table 4: Experimental parameters
Job’s mean execution time is obtained through performance tests in multi-core system
during busy-hours. Static and dynamic power values are obtained through experimental
set up as explained above. Number of decoding jobs in our case is static and equals to 13,
while each job corresponds to a single UE.
5.4 Experimental procedures
This section describes experimental procedures which are carried out in Phase1:
– measure total energy consumption of a server
– extract static and dynamic power from total power
– define optimal scaling factors
– define all possible configurations by applying different scaling factors defined in the
previous step
– calculate total energy consumption of n concurrent jobs after applying scaling factors
– analyze energy results from all six different configurations
56
6 CONCLUSION AND FUTURE WORK
This thesis has analysed energy cost of softwarization and commoditization of network
functions within C-RAN. Also, investigations on energy efficiency for C-RAN are made.
The results obtained clearly show that with virtualization or not total energy consumption
can be reduced when executing RAN functions on commodity hardware (data centre),
without degrading QoS parameters of the functions. Furthermore, around 19% overall
energy increase was observed with distributed architecture of C-RAN compared to stand-
alone architecture for a single eNB. However, with n-1 architecture (n-DUs and 1-CU)
total energy consumption of RAN is expected to be less than monolithic architecture.
As recommendation for future work, dynamic scheduler for assigning optimal DVFS scaling
factor can be implemented, which can tune the clock frequency automatically depending on
the several aspects including deadline for execution time. In this work, energy efficiency
was analyzed with static configurations meaning that they are not integrated into cpu
performance scaling drivers like intel pstate. Furthermore, energy cost of VNFs running
as VM or container can be studied as the new paradigm requires to deploy services based
on microservices architecture.
57
REFERENCES
[1] C. Becker et al. “Requirements: The Key to Sustainability”. In: IEEE Software 33.1
(Jan. 2016), pp. 56–65. issn: 0740-7459. doi: 10.1109/MS.2015.158.
[2] Maxime Colmant et al. “Process-level Power Estimation in VM-based Systems To
cite this version : HAL Id : hal-01130030 Process-level Power Estimation in VM-
based Systems”. In: (2015).
[3] J. Duan, X. Lagrange, and F. Guilloud. “Performance Analysis of Several Func-
tional Splits in C-RAN”. In: 2016 IEEE 83rd Vehicular Technology Conference (VTC
Spring). May 2016, pp. 1–5. doi: 10.1109/VTCSpring.2016.7504410.
[4] Leticia Duboc et al. “Do we really know what we are building? Raising awareness of
potential Sustainability Effects of Software Systems in Requirements Engineering”.
English. In: 27th IEEE International Requirements Engineering Conference. United
States: IEEE Computer Society, June 2019.
[5] Network Functions Virtualisation ETSI. Architectural Framework. Tech. rep. Tech-
nical Report ETSI GS NFV 002 V1.1.1, 2013.
[6] Network Functions Virtualisation ETSI. Management and Orchestration. Tech. rep.
Technical Report ETSI GS NFV-MAN 001 V1.1.1, 2014.
[7] Network Functions Virtualisation ETSI. Use cases. Tech. rep. Technical Report ETSI
GS NFV 001 V1.1.1, 2013.
[8] Emily Farnworth and Juan Carlos Castilla-rubio. “SMART 2020: Enabling the low
carbon economy in the information age”. In: (2020). issn: 09067590. doi: 10.1111/
j.2006.0906-7590.04873.x.
[9] GeSI and accenturestrategy. “#SMARTer2030 - ICT Solutions for 21st Century
Challenges”. In: (2015), p. 134. url: http://smarter2030.gesi.org/downloads/
Full_report.pdf.
[10] GSMA. The 5G Guide A reference for operators. Tech. rep. GSMA, 2019.
[11] International Telecommunications Union (ITU). “IMT traffic estimates for the years
2020 to 2030”. In: Report ITU-R M.2370-0 (07/2015) 0 (2015). doi: Rep.ITU-
RM.2370-0. url: https://www.itu.int/dms_pub/itu-r/opb/rep/R-REP-
M.2370-2015-PDF-E.pdf.
[12] ITU-R. “Recommendation ITU-R M.2083-0 - IMT Vision-Framework and overall
objectives of the future development of IMT for 2020 and b eyond M Series Mobile,
radiodetermination, amateur and related satellite services”. In: 0.M Series (2015).
url: http://www.itu.int/ITU-R/go/patents/en.
[13] ITU-T. Transport network support of IMT-2020/5G. Tech. rep. Technical Report
ITU-T GSTR-TN5G, 2018.
[14] R. Jejurikar, C. Pereira, and R. Gupta. “Leakage aware dynamic voltage scaling for
real-time embedded systems”. In: Proceedings. 41st Design Automation Conference,
2004. July 2004, pp. 275–280. doi: 10.1145/996566.996650.
[15] Jay F. Nunamaker Jr., Minder Chen, and Titus D.M. Purdin. “Systems Development
in Information Systems Research”. In: Journal of Management Information Systems
7.3 (1990), pp. 89–106. doi: 10.1080/07421222.1990.11517898.
[16] Alexandra Klimova et al. “An international Master’s program in green ICT as a
contribution to sustainable development”. In: Journal of Cleaner Production 135
(2016), pp. 223–239. issn: 0959-6526. doi: https://doi.org/10.1016/j.jclepro.
2016.06.032. url: http://www.sciencedirect.com/science/article/pii/
S0959652616307077.
[17] C. R. KOTHARI. Research methodology: methods techniques. New Delhi, New Age
International (P) Ltd, 2004.
[18] Peter M. Mell and Timothy Grance. SP 800-145. The NIST Definition of Cloud
Computing. Tech. rep. Gaithersburg, MD, United States, 2011.
[19] A. Noureddine et al. “A preliminary study of the impact of software engineering on
GreenIT”. In: 2012 First International Workshop on Green and Sustainable Software
(GREENS). June 2012, pp. 21–27. doi: 10.1109/GREENS.2012.6224251.
[20] ”NR; Medium Access Control (MAC) protocol specification”. TR 38.321. V15.0.0.
3GPP, 3rd Generation Partnership Project. Dec. 2017.
[21] ” NR; Packet Data Convergence Protocol (PDCP) specification”. TR 38.323. V15.5.0.
3GPP, 3rd Generation Partnership Project. Mar. 2019.
[22] ”NR; Radio Link Control (RLC) protocol specification”. TR 38.322. V15.0.0. 3GPP,
3rd Generation Partnership Project. Dec. 2017.
[23] ” NR; Radio Resource Control (RRC) protocol specification”. TR 38.331. V15.0.0.
3GPP, 3rd Generation Partnership Project. Dec. 2017.
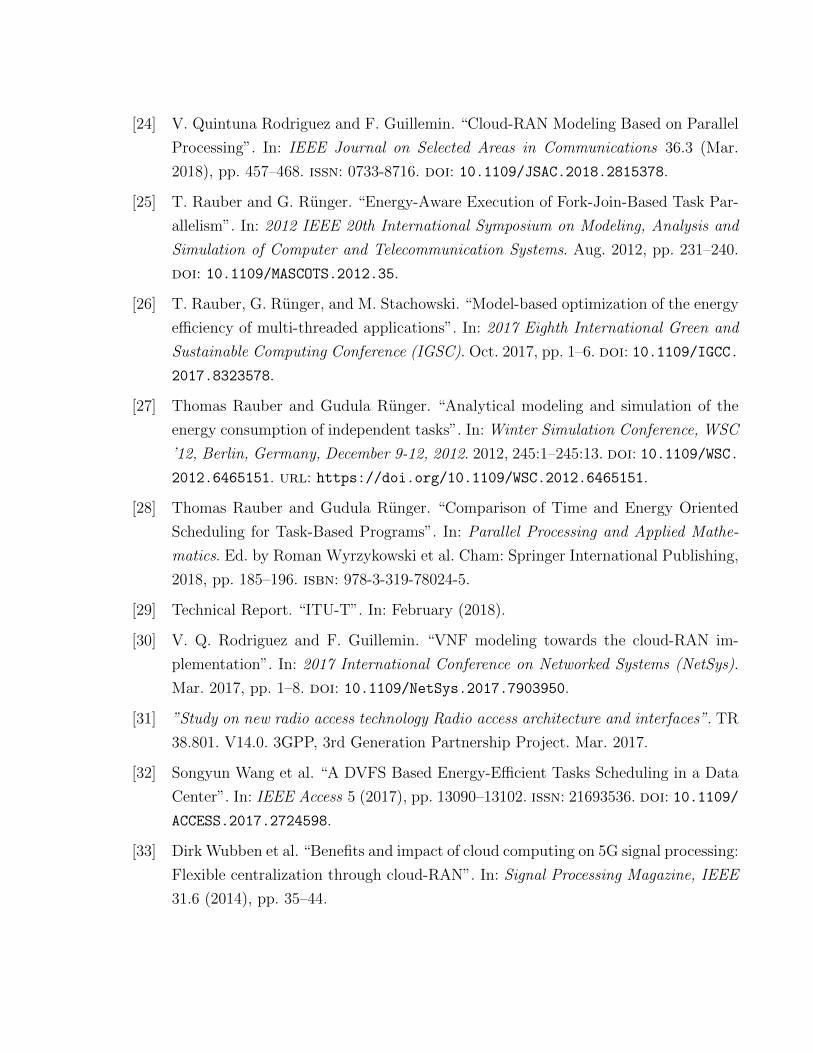
[24] V. Quintuna Rodriguez and F. Guillemin. “Cloud-RAN Modeling Based on Parallel
Processing”. In: IEEE Journal on Selected Areas in Communications 36.3 (Mar.
2018), pp. 457–468. issn: 0733-8716. doi: 10.1109/JSAC.2018.2815378.
[25] T. Rauber and G. Runger. “Energy-Aware Execution of Fork-Join-Based Task Par-
allelism”. In: 2012 IEEE 20th International Symposium on Modeling, Analysis and
Simulation of Computer and Telecommunication Systems. Aug. 2012, pp. 231–240.
doi: 10.1109/MASCOTS.2012.35.
[26] T. Rauber, G. Runger, and M. Stachowski. “Model-based optimization of the energy
efficiency of multi-threaded applications”. In: 2017 Eighth International Green and
Sustainable Computing Conference (IGSC). Oct. 2017, pp. 1–6. doi: 10.1109/IGCC.
2017.8323578.
[27] Thomas Rauber and Gudula Runger. “Analytical modeling and simulation of the
energy consumption of independent tasks”. In: Winter Simulation Conference, WSC
’12, Berlin, Germany, December 9-12, 2012. 2012, 245:1–245:13. doi: 10.1109/WSC.
2012.6465151. url: https://doi.org/10.1109/WSC.2012.6465151.
[28] Thomas Rauber and Gudula Runger. “Comparison of Time and Energy Oriented
Scheduling for Task-Based Programs”. In: Parallel Processing and Applied Mathe-
matics. Ed. by Roman Wyrzykowski et al. Cham: Springer International Publishing,
2018, pp. 185–196. isbn: 978-3-319-78024-5.
[29] Technical Report. “ITU-T”. In: February (2018).
[30] V. Q. Rodriguez and F. Guillemin. “VNF modeling towards the cloud-RAN im-
plementation”. In: 2017 International Conference on Networked Systems (NetSys).
Mar. 2017, pp. 1–8. doi: 10.1109/NetSys.2017.7903950.
[31] ”Study on new radio access technology Radio access architecture and interfaces”. TR
38.801. V14.0. 3GPP, 3rd Generation Partnership Project. Mar. 2017.
[32] Songyun Wang et al. “A DVFS Based Energy-Efficient Tasks Scheduling in a Data
Center”. In: IEEE Access 5 (2017), pp. 13090–13102. issn: 21693536. doi: 10.1109/
ACCESS.2017.2724598.
[33] Dirk Wubben et al. “Benefits and impact of cloud computing on 5G signal processing:
Flexible centralization through cloud-RAN”. In: Signal Processing Magazine, IEEE
31.6 (2014), pp. 35–44.

[34] Yan Zhai et al. “HaPPy: Hyperthread-aware Power Profiling Dynamically”. In:
2014 USENIX Annual Technical Conference (USENIX ATC 14). Philadelphia, PA:
USENIX Association, 2014, pp. 211–217. isbn: 978-1-931971-10-2. url: https://
www.usenix.org/conference/atc14/technical-sessions/presentation/zhai.
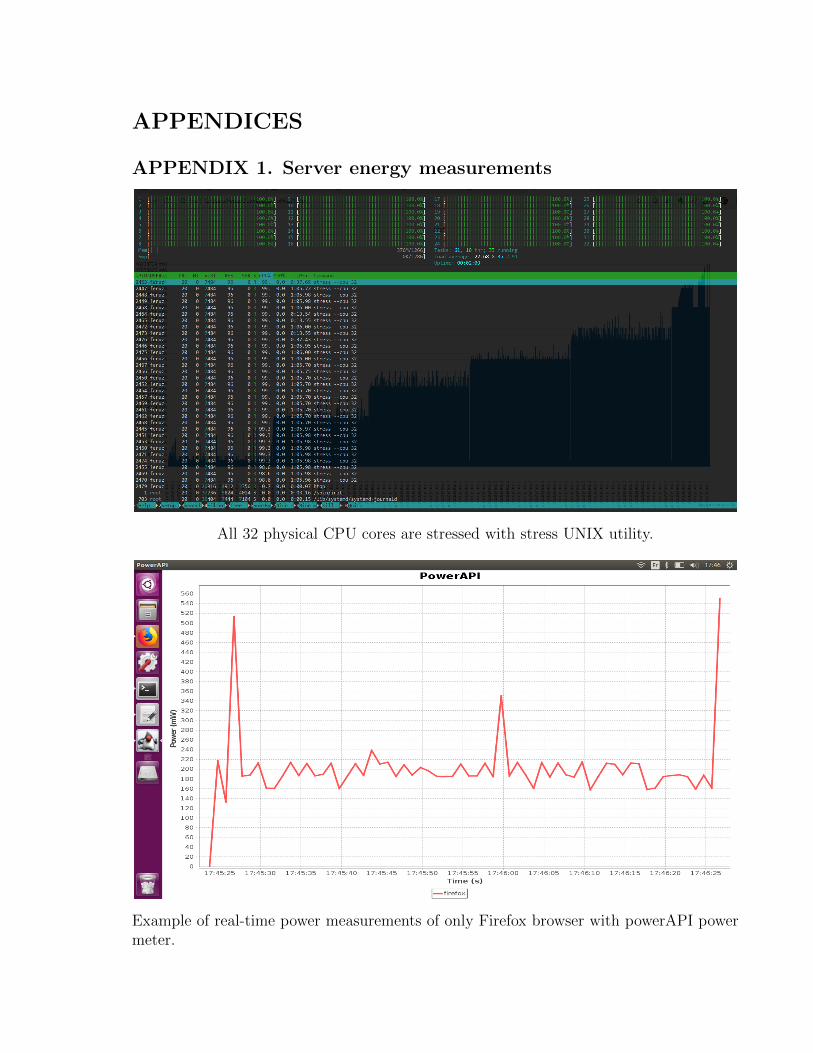
APPENDICES
APPENDIX 1. Server energy measurements
All 32 physical CPU cores are stressed with stress UNIX utility.
Example of real-time power measurements of only Firefox browser with powerAPI powermeter.
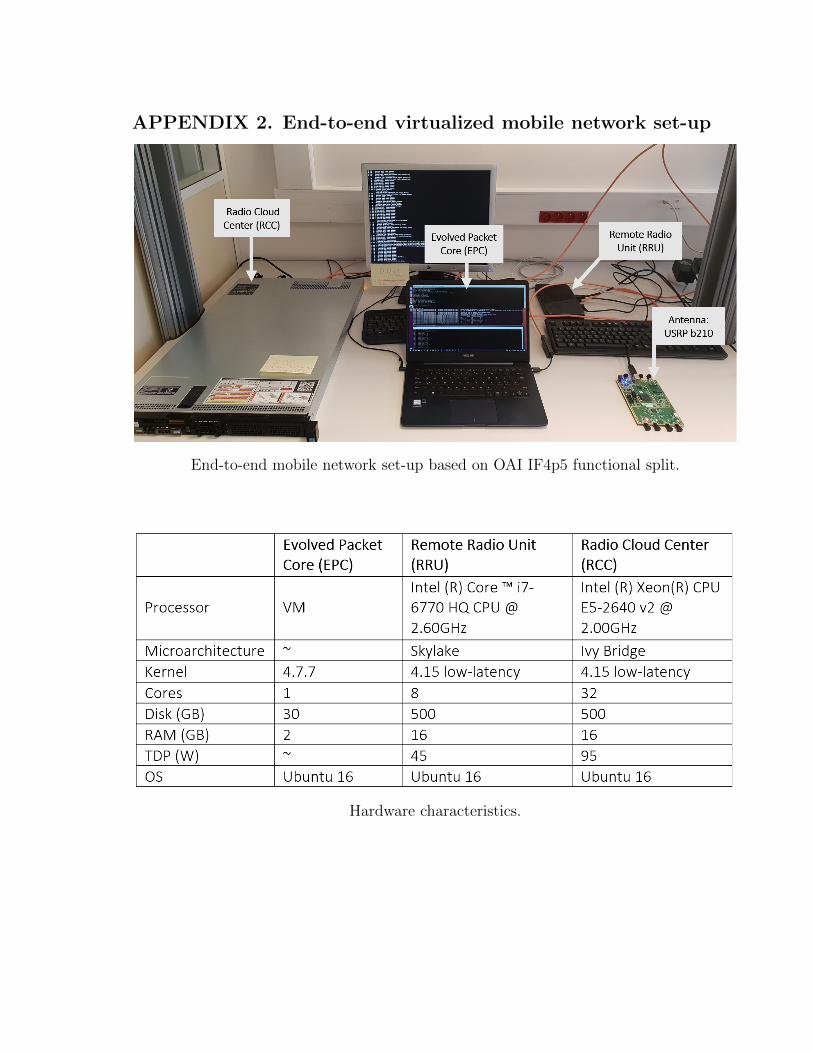
APPENDIX 2. End-to-end virtualized mobile network set-up
End-to-end mobile network set-up based on OAI IF4p5 functional split.
Hardware characteristics.
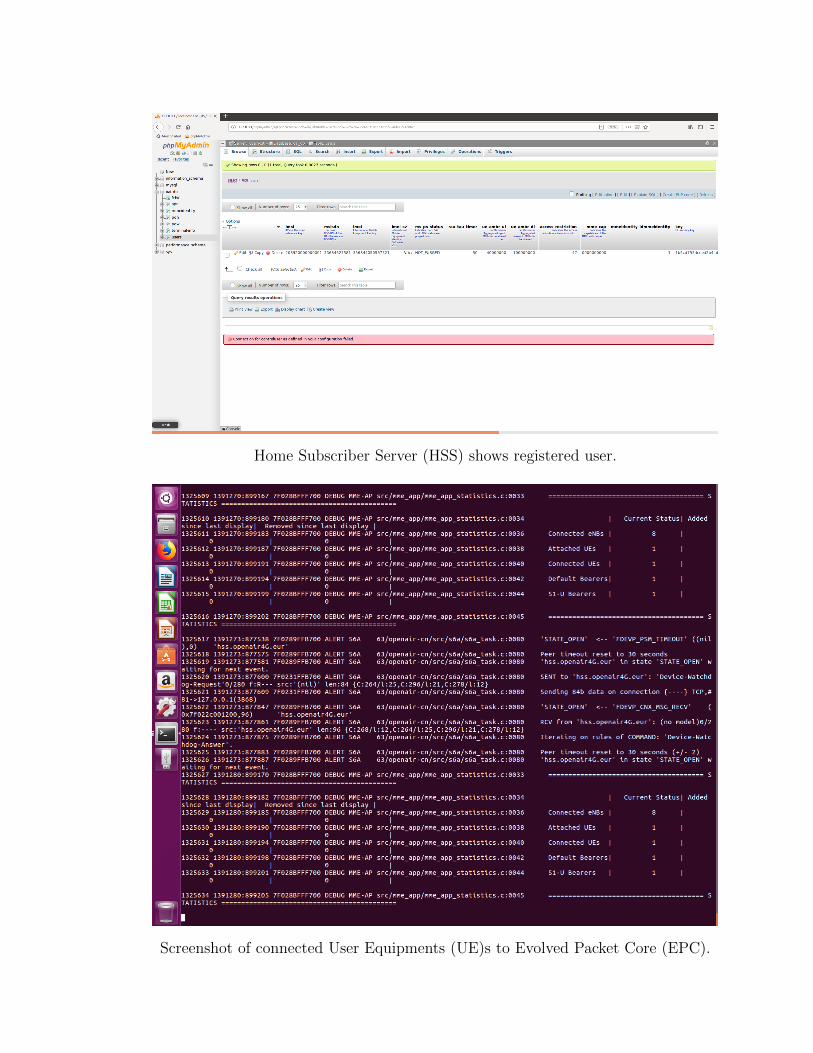
Home Subscriber Server (HSS) shows registered user.
Screenshot of connected User Equipments (UE)s to Evolved Packet Core (EPC).
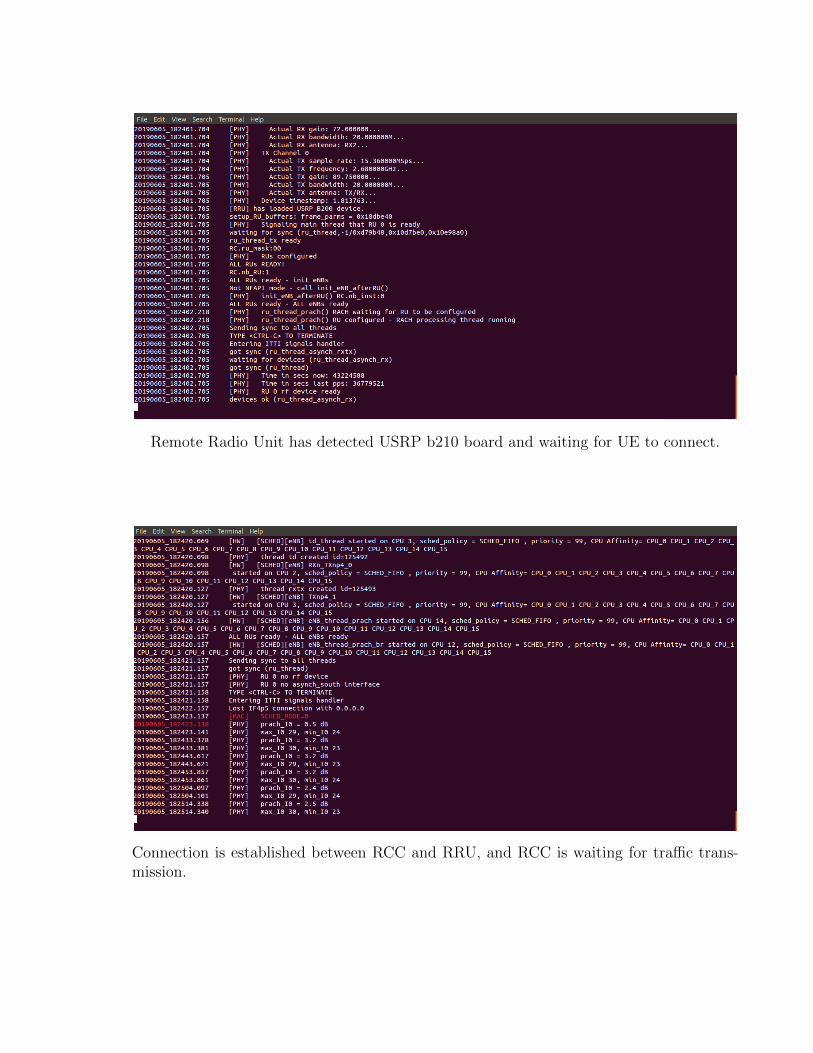
Remote Radio Unit has detected USRP b210 board and waiting for UE to connect.
Connection is established between RCC and RRU, and RCC is waiting for traffic trans-mission.
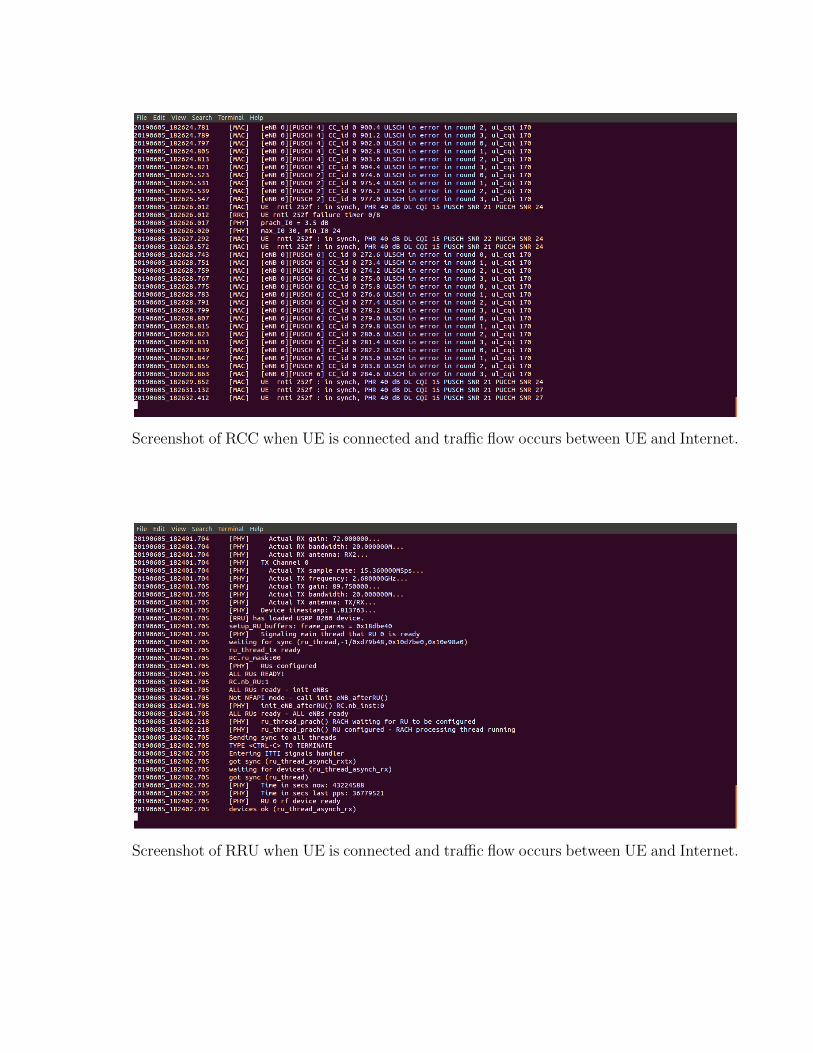
Screenshot of RCC when UE is connected and traffic flow occurs between UE and Internet.
Screenshot of RRU when UE is connected and traffic flow occurs between UE and Internet.
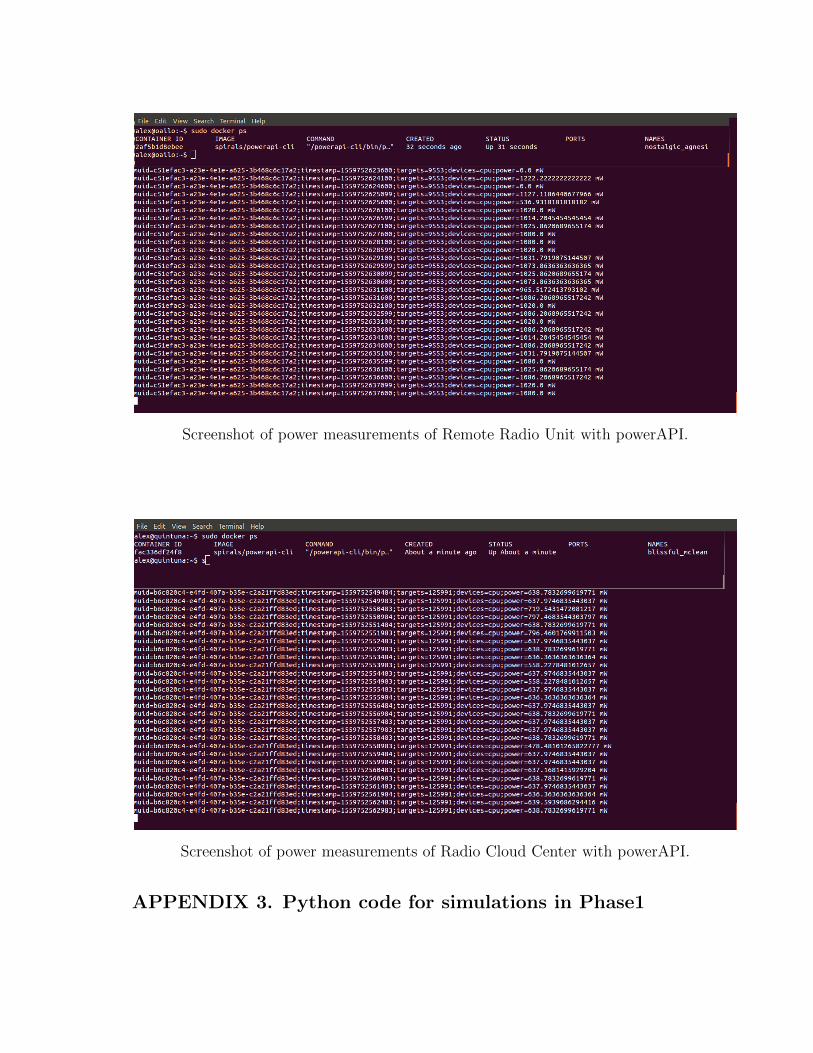
Screenshot of power measurements of Remote Radio Unit with powerAPI.
Screenshot of power measurements of Radio Cloud Center with powerAPI.
APPENDIX 3. Python code for simulations in Phase1