Embed Size (px)
Citation preview
NETWORK ALIGNMENT
Dr. Alioune Ngom
School of Computer Science
University of Windsor
Winter 2013
What are Proteins ?
Proteins are large biological molecules consisting of one or more
chains of amino acids.
Proteins perform vast array of functions within living organisms.
For example:
Transporting molecules from one location to another.
Responding to stimuli
Replicating DNA
Catalyzing metabolic reactions
The study of protein interactions is fundamental in understanding
how proteins function.
2

Protein-Protein Interaction Network
Protein–protein interactions occur when two or more proteins
bind together, often to carry out their biological functions.
A graphical representation of protein-protein interaction is known
as Protein-Protein Interaction (PPI) network.
In a PPI network, all proteins are represented as nodes and
interactions as edges between the nodes.
nodes
edges
3
Challenges in PPI Network
Network comparison is the process of contrasting two or more
protein interaction networks, representing different species.
It helps to understand the structure, function and evolution of
proteins in different species.
The problem in comparing/aligning networks is lack of knowledge
of how each node of one network maps to one or more nodes of
the other networks.
Absence of this information requires solving the sub-graph
isomorphism problem.
4

Sub-graph isomorphism: An isomorphism is a bijection between
nodes of two networks G and H that preserves edge adjacency.
Exact comparisons are inappropriate in biology (biological
variation)
Network alignment
More general problem is finding the best way to “fit” G into H
even if G and H do not have exact sub-graph
Thus, an efficient and accurate multiple network alignment
algorithm is required.
Challenges in PPI Network 5
A
B
C
D
1
2
3
4 G H
A→1
B→2
C→3
D→4
Network Alignment
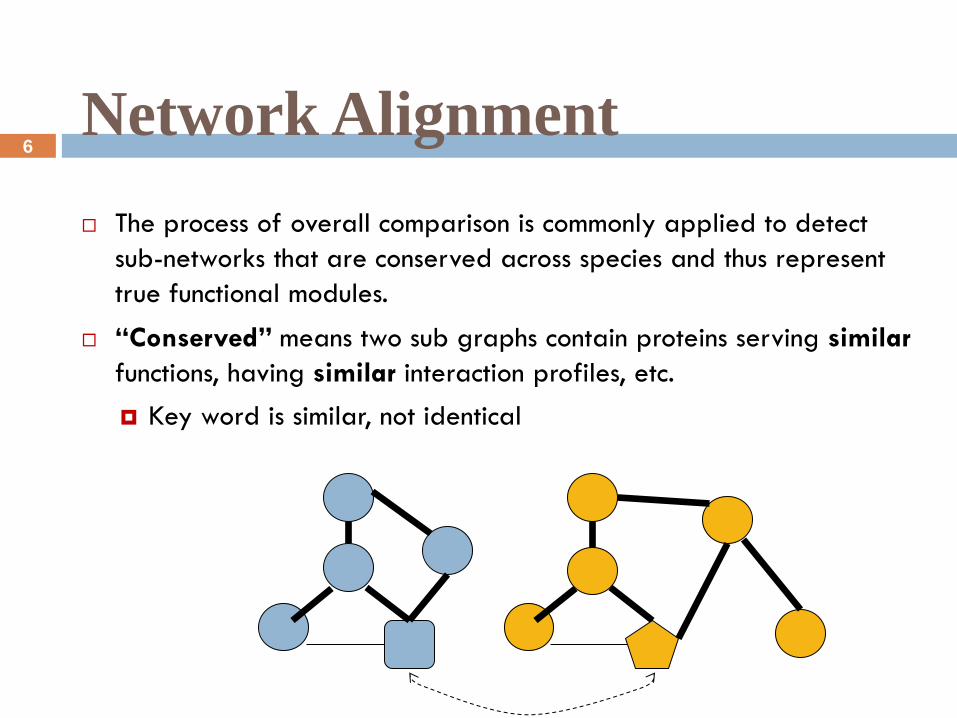
The process of overall comparison is commonly applied to detect
sub-networks that are conserved across species and thus represent
true functional modules.
“Conserved” means two sub graphs contain proteins serving similar
functions, having similar interaction profiles, etc.
Key word is similar, not identical
6
Network Alignment
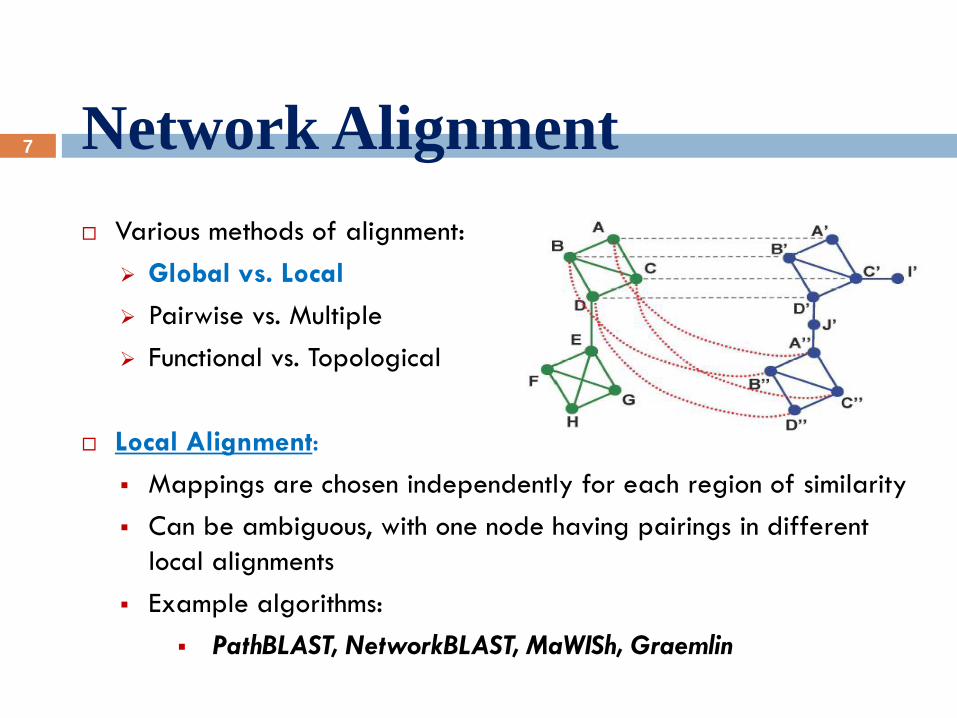
Various methods of alignment:
Global vs. Local
Pairwise vs. Multiple
Functional vs. Topological
Local Alignment:
Mappings are chosen independently for each region of similarity
Can be ambiguous, with one node having pairings in different
local alignments
Example algorithms:
PathBLAST, NetworkBLAST, MaWISh, Graemlin
7
Network Alignment
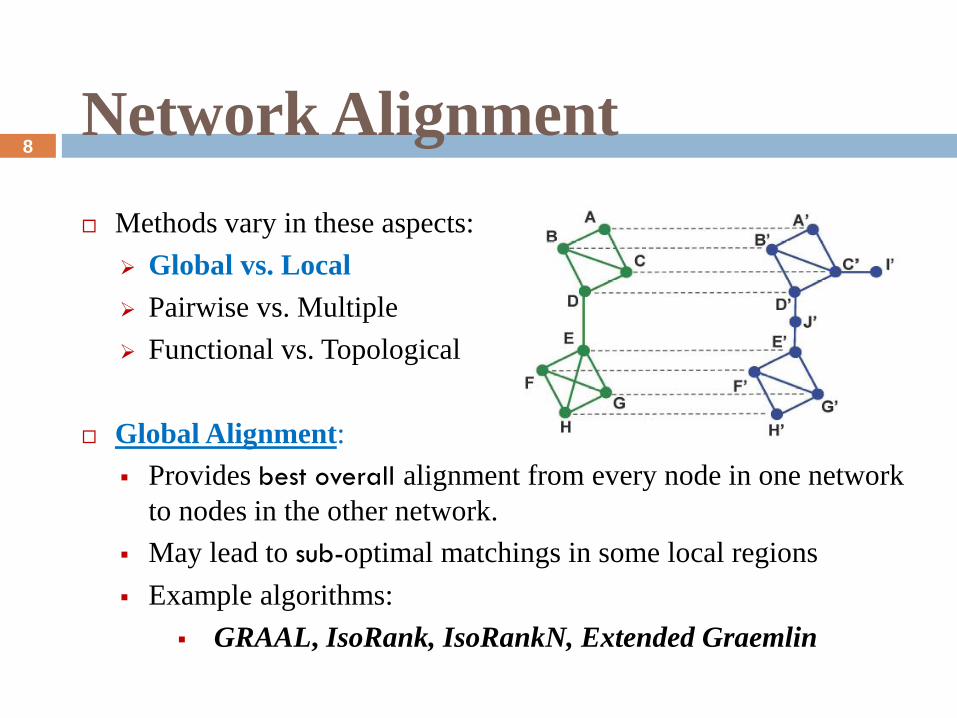
Methods vary in these aspects:
Global vs. Local
Pairwise vs. Multiple
Functional vs. Topological
Global Alignment:
Provides best overall alignment from every node in one network
to nodes in the other network.
May lead to sub-optimal matchings in some local regions
Example algorithms:
GRAAL, IsoRank, IsoRankN, Extended Graemlin
8
Network Alignment
Methods vary in these aspects:
Global vs. Local
Pairwise vs. Multiple
Functional vs. Topological
Pairwise Alignment:
Two networks aligned
Example algorithms:
GRAAL, PathBLAST, MaWISh, IsoRank
Multiple Alignment:
More than two networks aligned
Example algorithms:
Greamlin, Extended PathBLAST, Extended IsoRank
9
Network Alignment
Methods vary in these aspects:
Global vs. Local
Pairwise vs. Multiple
Functional vs. Topological
Functional Information
Information external to network topology used, e.g., protein
sequence, to define “similarity” between nodes
Example algorithms:
all except for GRAAL; e.g. IsoRank, but then
perform poorly Topological Information
Only network topology used to define node “similarity”.
It is interesting, as it answers how much and what type of
biological information can be extracted from topology only.
10
Network Alignment Graph
One heuristic approach:
A merged representation of the networks being compared is
created, called a “network alignment graph” in which:
Nodes represent sets of proteins, one from each network
Edges represent conserved protein interactions across different
networks
The alignment is simple when there exists a 1-to-1
correspondence between proteins across the networks, but in
general there may be a many-to-many correspondence
Then apply a greedy algorithm for identifying conserved sub-
networks embedded in the “network alignment graph”
11
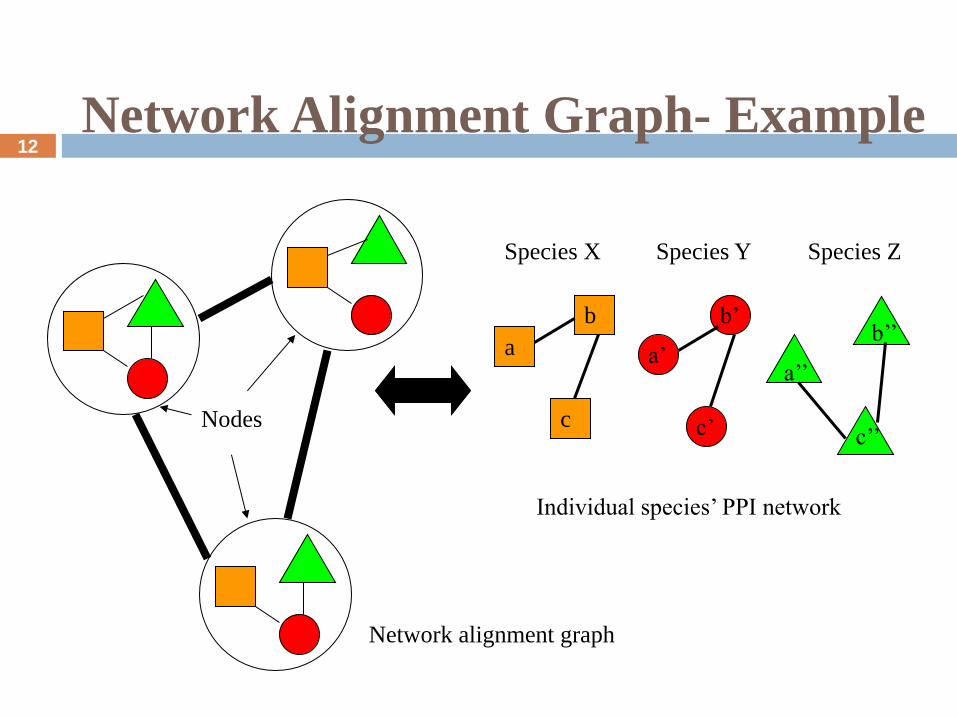
Network Alignment Graph- Example
Nodes
a
b
c
a’
b’
c’
a’’
b’’
c’’
Network alignment graph
Individual species’ PPI network
Species X Species Y Species Z
12
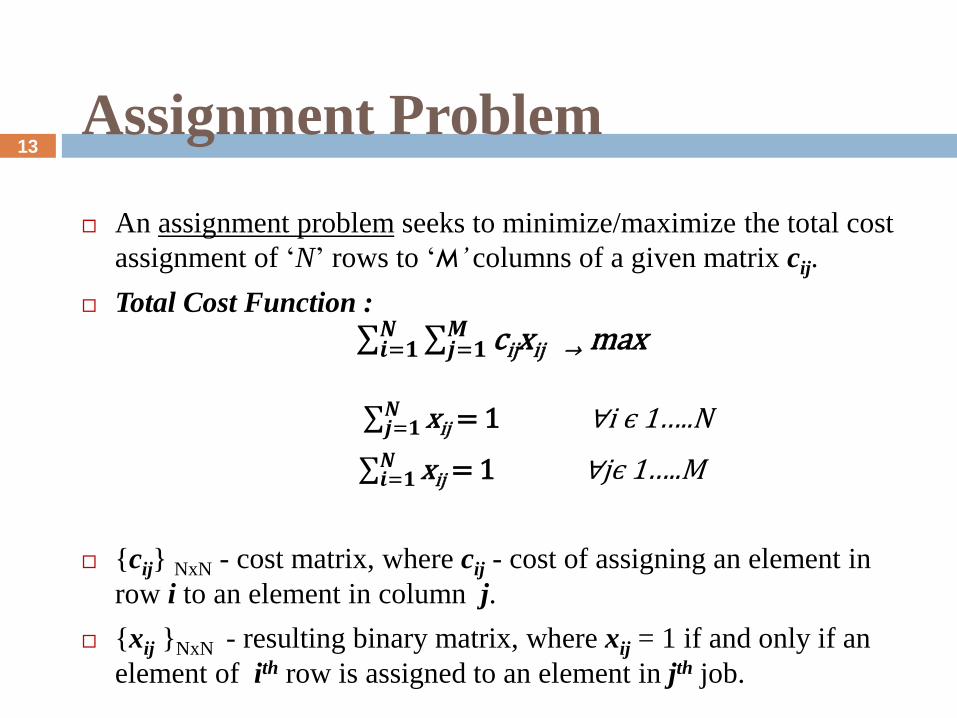
Assignment Problem
An assignment problem seeks to minimize/maximize the total cost
assignment of ‘N’ rows to ‘M’ columns of a given matrix cij.
Total Cost Function :
cijxij → max 𝑴𝒋=𝟏
𝑵𝒊=𝟏
xij𝑵𝒋=𝟏 = 1 ∀i є 1…..N
xij𝑵𝒊=𝟏 = 1 ∀jє 1…..M
{cij} NxN - cost matrix, where cij - cost of assigning an element in
row i to an element in column j.
{xij }NxN - resulting binary matrix, where xij = 1 if and only if an
element of ith row is assigned to an element in jth job.
13
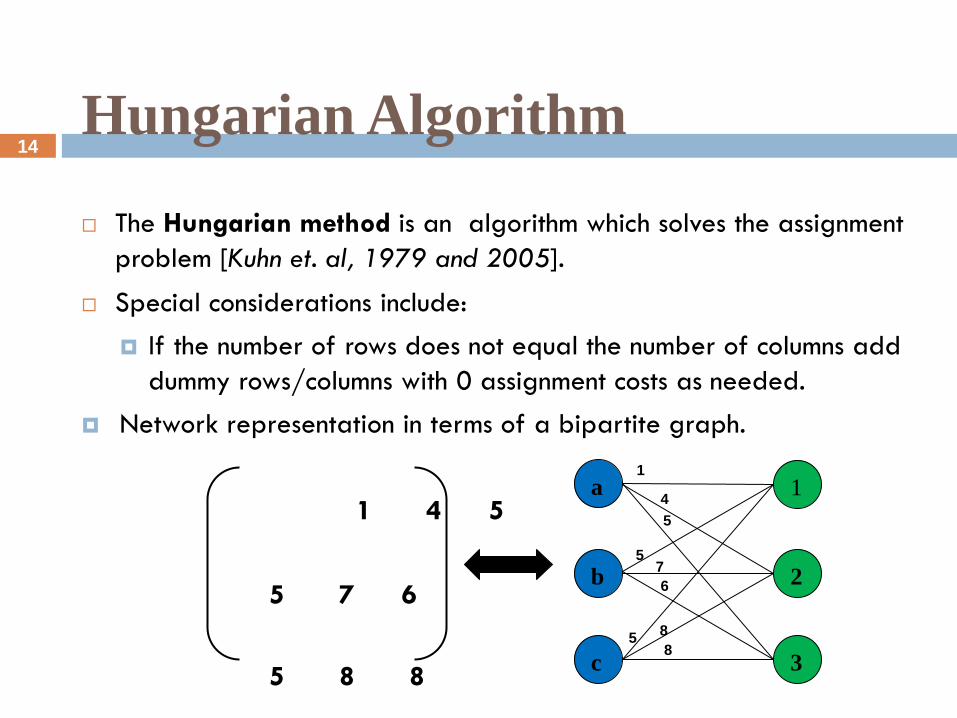
Hungarian Algorithm
The Hungarian method is an algorithm which solves the assignment
problem [Kuhn et. al, 1979 and 2005].
Special considerations include:
If the number of rows does not equal the number of columns add
dummy rows/columns with 0 assignment costs as needed.
Network representation in terms of a bipartite graph.
1 4 5
5 7 6
5 8 8
c
b
a
3
2
1 1
4
5
5 7
6
5 8
8
14
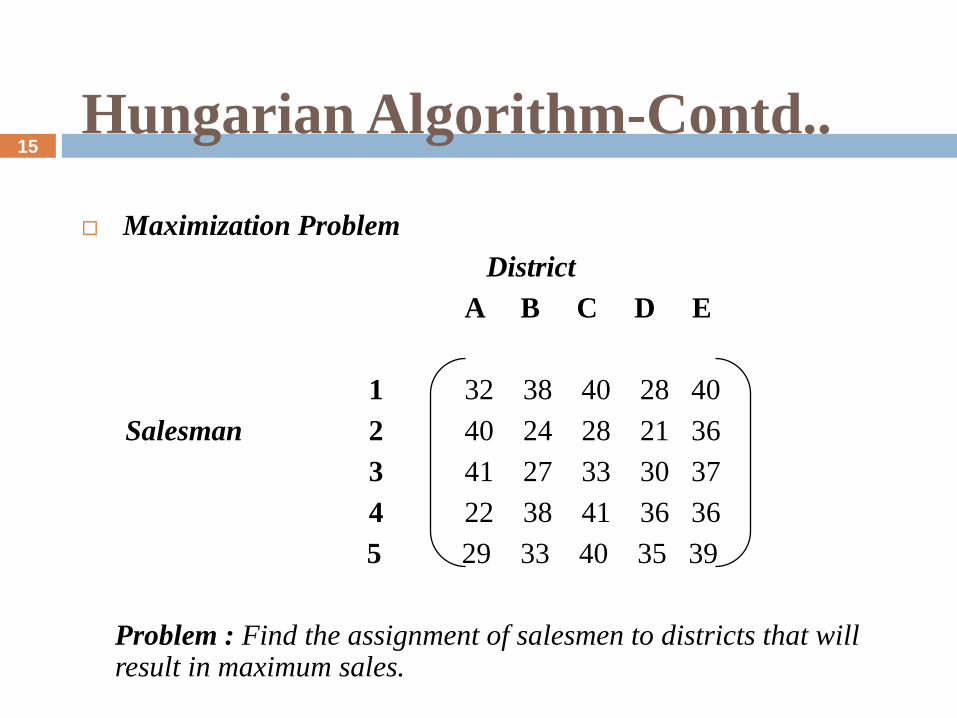
Hungarian Algorithm-Contd..
Maximization Problem
District
A B C D E
1 32 38 40 28 40
Salesman 2 40 24 28 21 36
3 41 27 33 30 37
4 22 38 41 36 36
5 29 33 40 35 39
Problem : Find the assignment of salesmen to districts that will result in maximum sales.
15
Hungarian Algorithm-Contd..
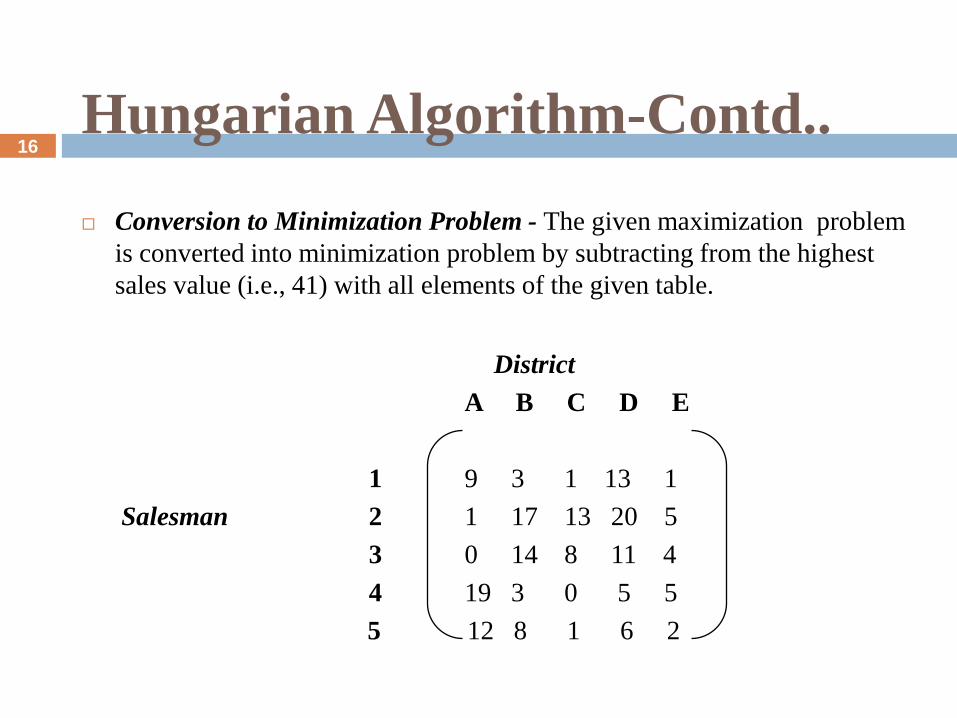
Conversion to Minimization Problem - The given maximization problem
is converted into minimization problem by subtracting from the highest
sales value (i.e., 41) with all elements of the given table.
District
A B C D E
1 9 3 1 13 1
Salesman 2 1 17 13 20 5
3 0 14 8 11 4
4 19 3 0 5 5
5 12 8 1 6 2
16

Hungarian Algorithm-Contd..
Step 1: Matrix Reduced Row-wise
District
A B C D E
1 8 2 0 12 0
Salesman 2 0 18 12 19 4
3 0 14 8 11 4
4 19 3 0 5 5
5 11 7 0 5 1
17
Hungarian Algorithm-Contd..
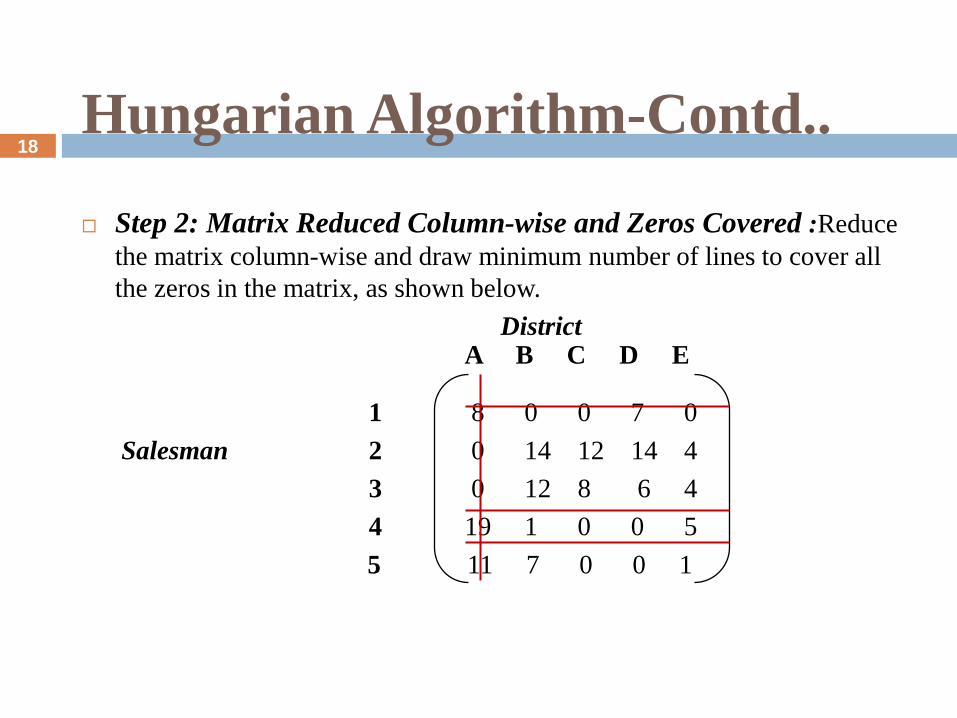
Step 2: Matrix Reduced Column-wise and Zeros Covered :Reduce
the matrix column-wise and draw minimum number of lines to cover all
the zeros in the matrix, as shown below.
District A B C D E 1 8 0 0 7 0
Salesman 2 0 14 12 14 4
3 0 12 8 6 4
4 19 1 0 0 5
5 11 7 0 0 1
18
Hungarian Algorithm-Contd…
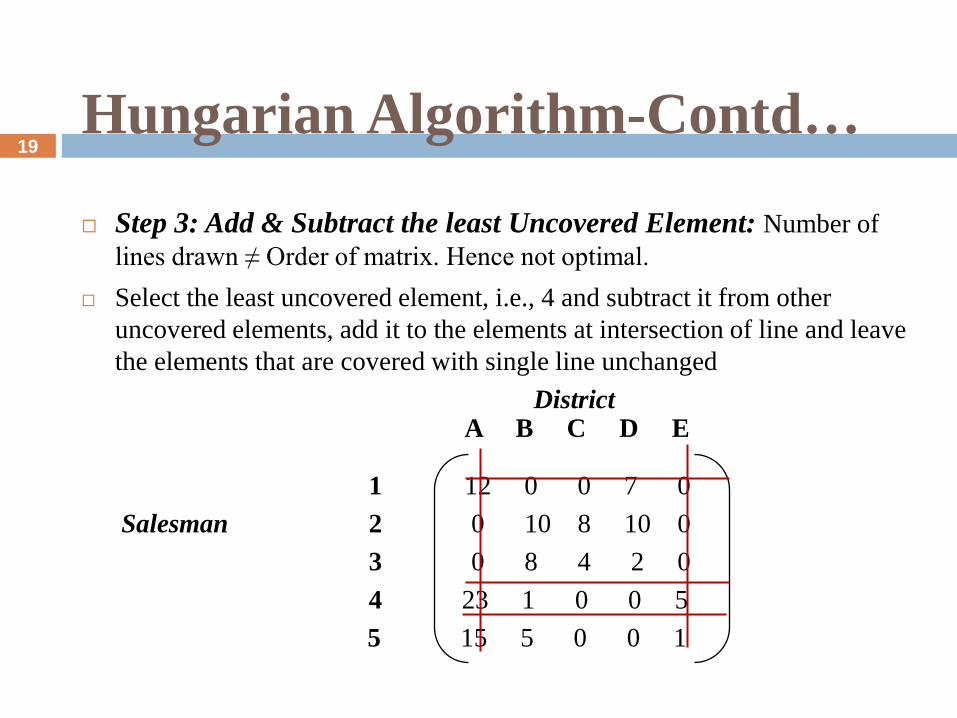
Step 3: Add & Subtract the least Uncovered Element: Number of
lines drawn ≠ Order of matrix. Hence not optimal.
Select the least uncovered element, i.e., 4 and subtract it from other
uncovered elements, add it to the elements at intersection of line and leave
the elements that are covered with single line unchanged
District A B C D E 1 12 0 0 7 0
Salesman 2 0 10 8 10 0
3 0 8 4 2 0
4 23 1 0 0 5
5 15 5 0 0 1
19
Hungarian Algorithm-Contd..
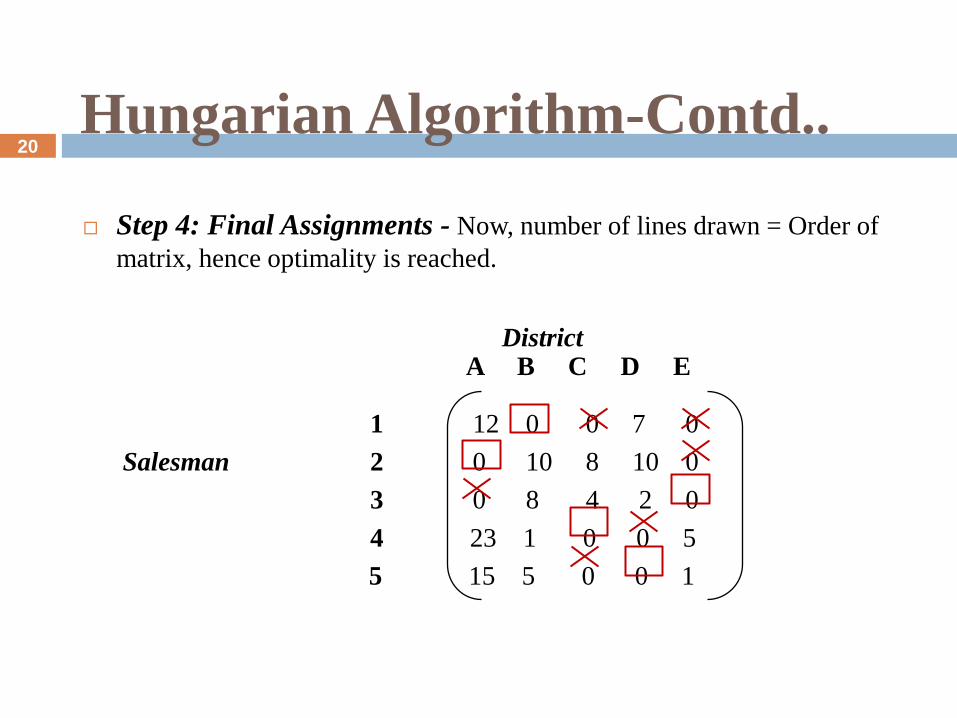
Step 4: Final Assignments - Now, number of lines drawn = Order of
matrix, hence optimality is reached.
District A B C D E 1 12 0 0 7 0
Salesman 2 0 10 8 10 0
3 0 8 4 2 0
4 23 1 0 0 5
5 15 5 0 0 1
20

The availability of huge quantity of data on protein interactions has
motivated researchers to compare the networks of different species.
The alignment of bio-molecular networks is used for examining
interactions in the networks of different species.
Thus network alignment allows us to-
Identify conserved functional modules
Predict protein functions
Validate protein interactions
Predict protein interactions
Discovering protein complexes
The primary focus of my thesis is on multiple alignment PPI network.
Motivation 21
Related Work
22
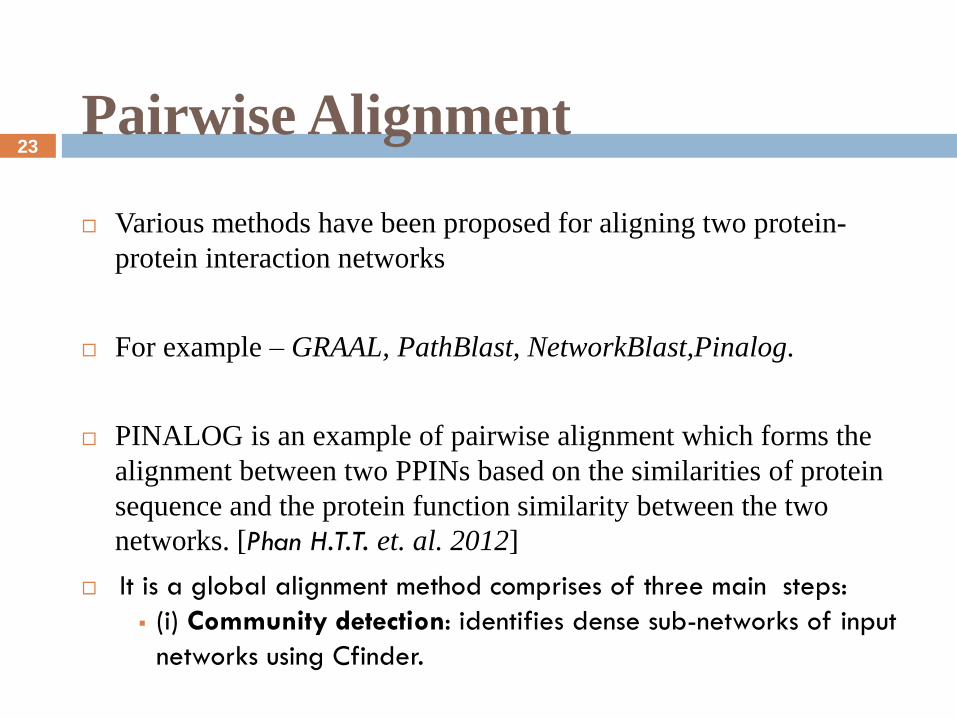
Pairwise Alignment
Various methods have been proposed for aligning two protein-
protein interaction networks
For example – GRAAL, PathBlast, NetworkBlast,Pinalog.
PINALOG is an example of pairwise alignment which forms the
alignment between two PPINs based on the similarities of protein
sequence and the protein function similarity between the two
networks. [Phan H.T.T. et. al. 2012]
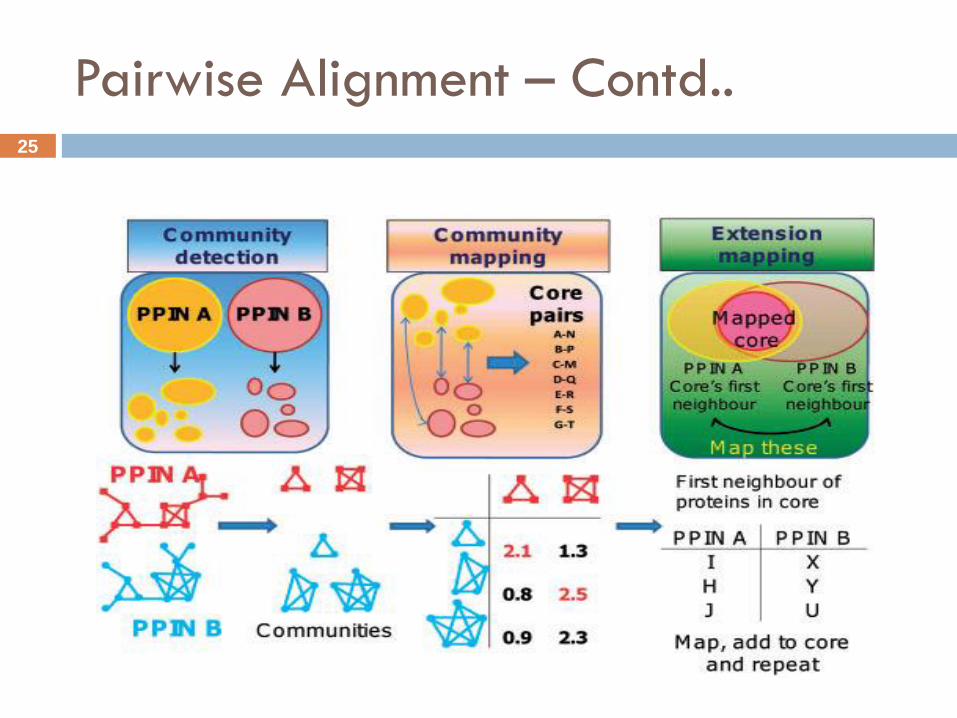
It is a global alignment method comprises of three main steps:
(i) Community detection: identifies dense sub-networks of input
networks using Cfinder.
23
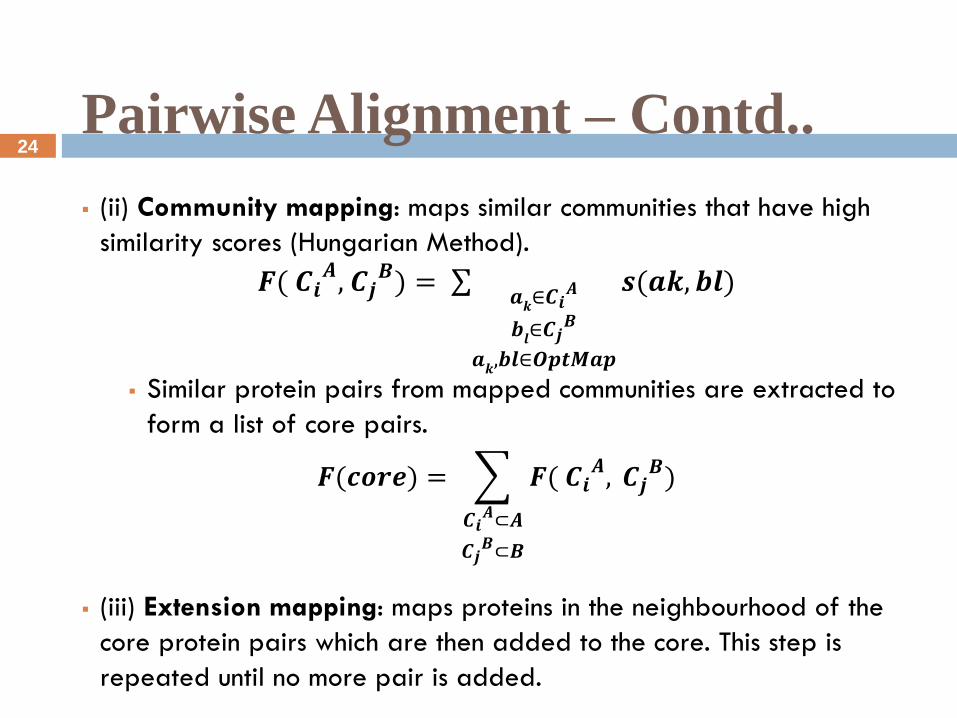
Pairwise Alignment – Contd..
(ii) Community mapping: maps similar communities that have high
similarity scores (Hungarian Method).
𝑭( 𝑪𝒊𝑨, 𝑪𝒋𝑩) = 𝒔(𝒂𝒌, 𝒃𝒍)
𝒂𝒌∈𝑪𝒊𝑨
𝒃𝒍∈𝑪𝒋𝑩
𝒂𝒌,𝒃𝒍∈𝑶𝒑𝒕𝑴𝒂𝒑
Similar protein pairs from mapped communities are extracted to
form a list of core pairs.
𝑭(𝒄𝒐𝒓𝒆) = 𝑭( 𝑪𝒊𝑨, 𝑪𝒋
𝑩)
𝑪𝒊𝑨⊂𝑨
𝑪𝒋𝑩⊂𝑩
(iii) Extension mapping: maps proteins in the neighbourhood of the
core protein pairs which are then added to the core. This step is
repeated until no more pair is added.
24
Pairwise Alignment – Contd.. 25
Multiple Alignment
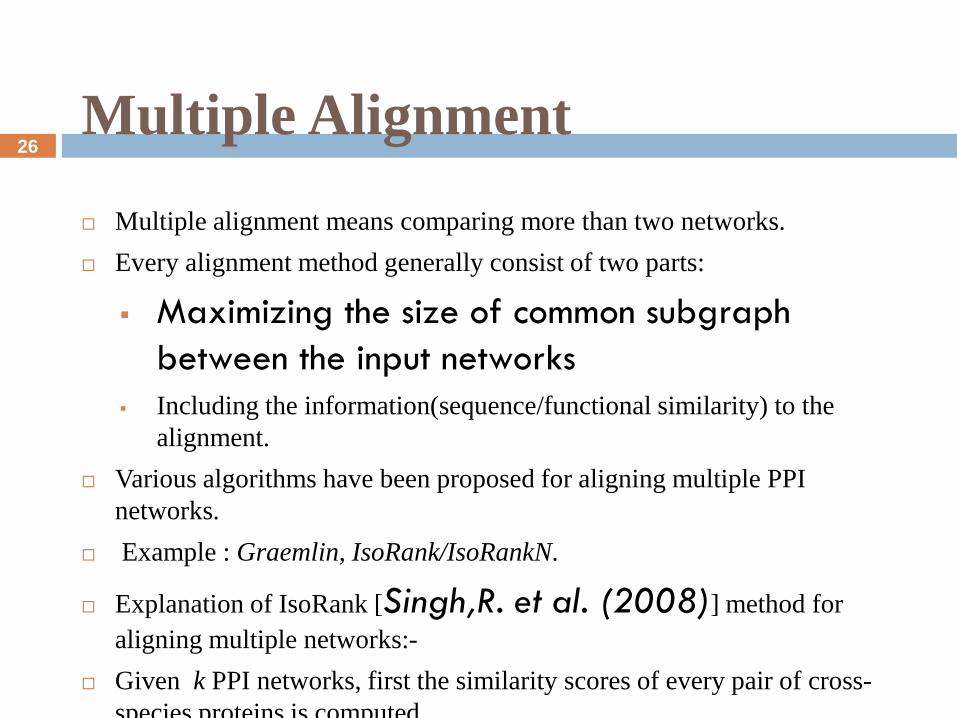
Multiple alignment means comparing more than two networks.
Every alignment method generally consist of two parts:
Maximizing the size of common subgraph
between the input networks
Including the information(sequence/functional similarity) to the
alignment.
Various algorithms have been proposed for aligning multiple PPI
networks.
Example : Graemlin, IsoRank/IsoRankN.
Explanation of IsoRank [Singh,R. et al. (2008)] method for
aligning multiple networks:-
Given k PPI networks, first the similarity scores of every pair of cross-
species proteins is computed.
IsoRank is a variant of maximum common subgraph(MCS).
26
Multiple Alignment-IsoRank
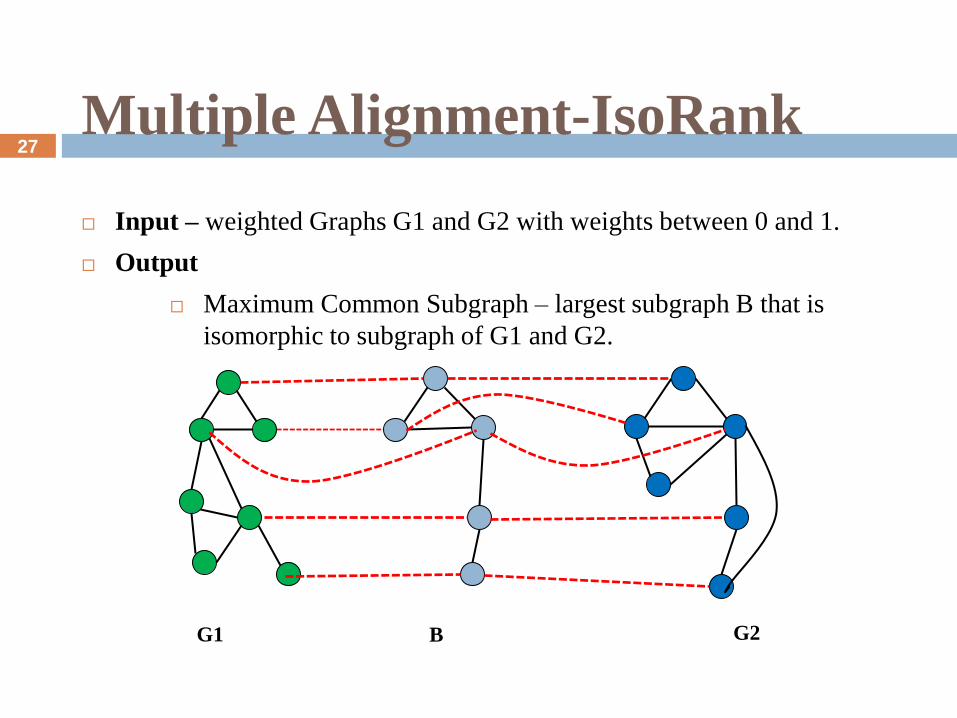
Input – weighted Graphs G1 and G2 with weights between 0 and 1.
Output
Maximum Common Subgraph – largest subgraph B that is
isomorphic to subgraph of G1 and G2.
G1 B G2
27
Multiple Alignment-IsoRank
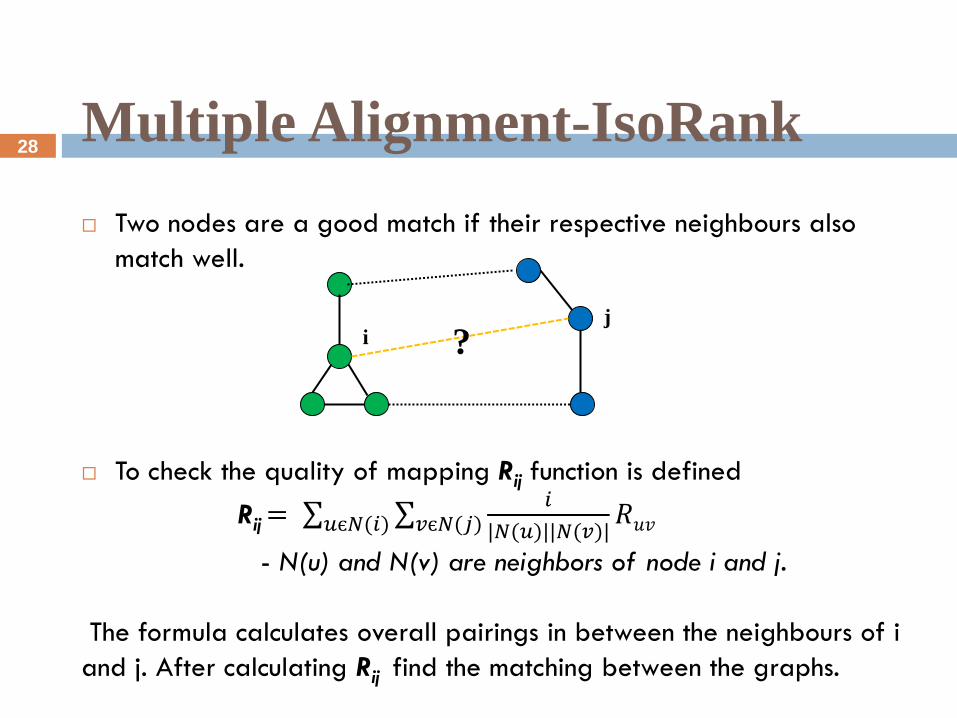
Two nodes are a good match if their respective neighbours also
match well.
To check the quality of mapping Rij function is defined
Rij = 𝑖
|𝑁(𝑢)||𝑁(𝑣)|𝑣є𝑁(𝑗) 𝑅𝑢𝑣𝑢є𝑁(𝑖)
- N(u) and N(v) are neighbors of node i and j.
The formula calculates overall pairings in between the neighbours of i
and j. After calculating Rij find the matching between the graphs.
i j
?
28
Multiple Alignment-IsoRank
Thus, the score of a protein pair depends on the score of their
neighbours, which in turn, depend on the neighbours of their
neighbours, and so on.
Once these ‘topological’ scores are computed for all node pairs,
sequence-based BLAST scores are included in the alignment scores.
ISORANK then constructs the node alignment with the repetitive
greedy strategy to identify all proteins with highest scores
It then outputs those proteins, and removing all scores involving any
of the identified nodes.
29

Proposed Method
30
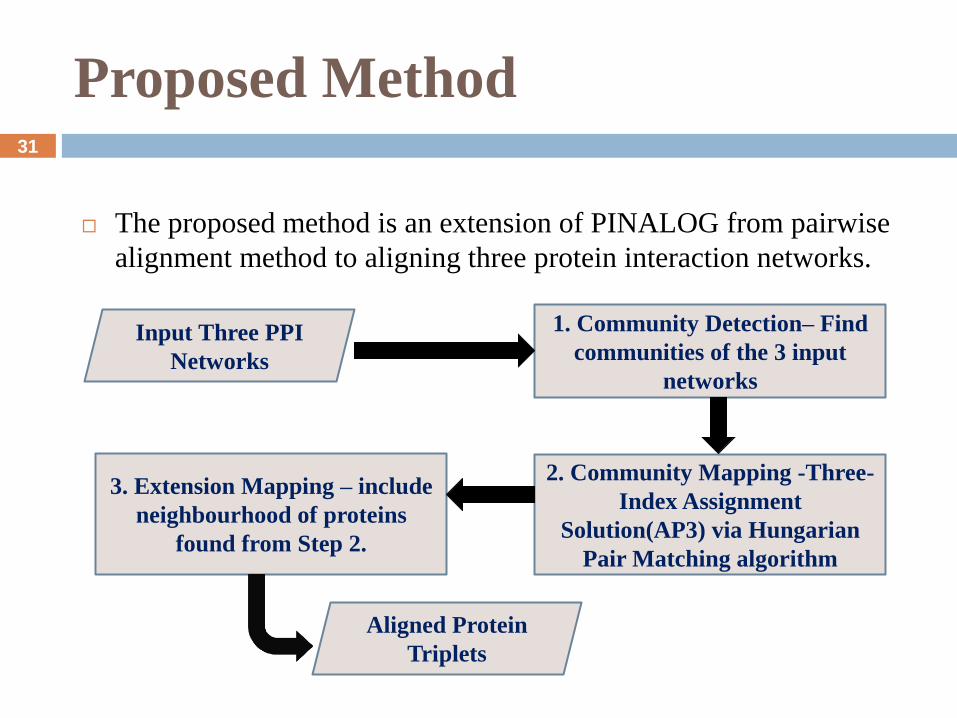
Proposed Method
The proposed method is an extension of PINALOG from pairwise
alignment method to aligning three protein interaction networks.
31
Input Three PPI
Networks
1. Community Detection– Find
communities of the 3 input
networks
Aligned Protein
Triplets
2. Community Mapping -Three-
Index Assignment
Solution(AP3) via Hungarian
Pair Matching algorithm
3. Extension Mapping – include
neighbourhood of proteins
found from Step 2.
Community Detection
Protein complexes or functional modules form highly connected
components in the PPI networks.
It is better to find highly connected components(clusters) of the PPI
networks first and to align them, rather than aligning the networks
directly. (Brohee et. al, [2006]).
Various clustering methods have been proposed for finding the
clusters of protein interaction networks.
Clustering method used here is Cfinder.(k=3)
32

Community Detection
PPI A
PPI B
PPI C
Communities
33
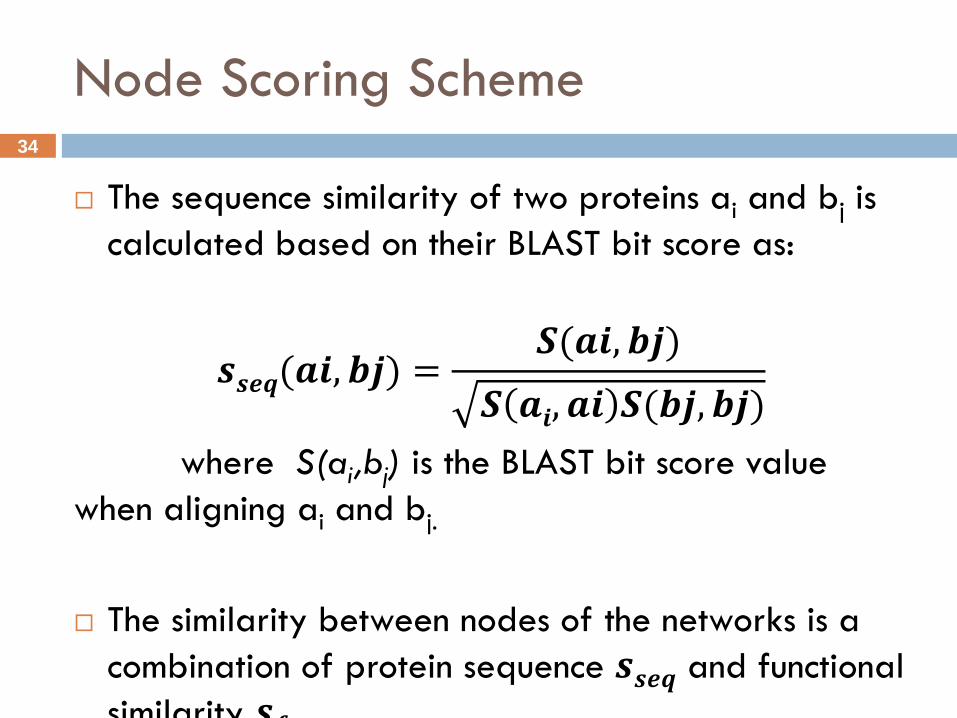
Node Scoring Scheme
The sequence similarity of two proteins ai and bj is
calculated based on their BLAST bit score as:
𝒔𝒔𝒆𝒒(𝒂𝒊, 𝒃𝒋) =𝑺(𝒂𝒊, 𝒃𝒋)
𝑺 𝒂𝒊, 𝒂𝒊 𝑺(𝒃𝒋, 𝒃𝒋)
where S(ai,bj) is the BLAST bit score value
when aligning ai and bj.
The similarity between nodes of the networks is a
combination of protein sequence 𝒔𝒔𝒆𝒒 and functional
similarity 𝒔𝒇𝒖𝒏𝒄 .
𝒔(𝒂 𝒊, 𝒃 𝒋) = 𝜽 𝒔𝒔𝒆𝒒 (𝒂 𝒊, 𝒃 𝒋) + (1 − θ) 𝒔𝒇𝒖𝒏𝒄 (𝒂 𝒊, 𝒃 𝒋)
34

Community Mapping
This step involves matching the communities obtained from the
previous step having high similarity scores.
One of the Three-Index Assignment Solution is used to find complete
match between the three networks.
Using Hungarian algorithm.
The AP3 is an optimization problem on a complete tripartite graph
The cost of choosing triangle (𝑖, 𝑗, 𝑘) 𝑖𝑠 𝒄𝒊𝒋𝒌
The objective of AP3 is to choose “N” disjoint triangles (i, j, k) so
that the total cost is maximized.
35
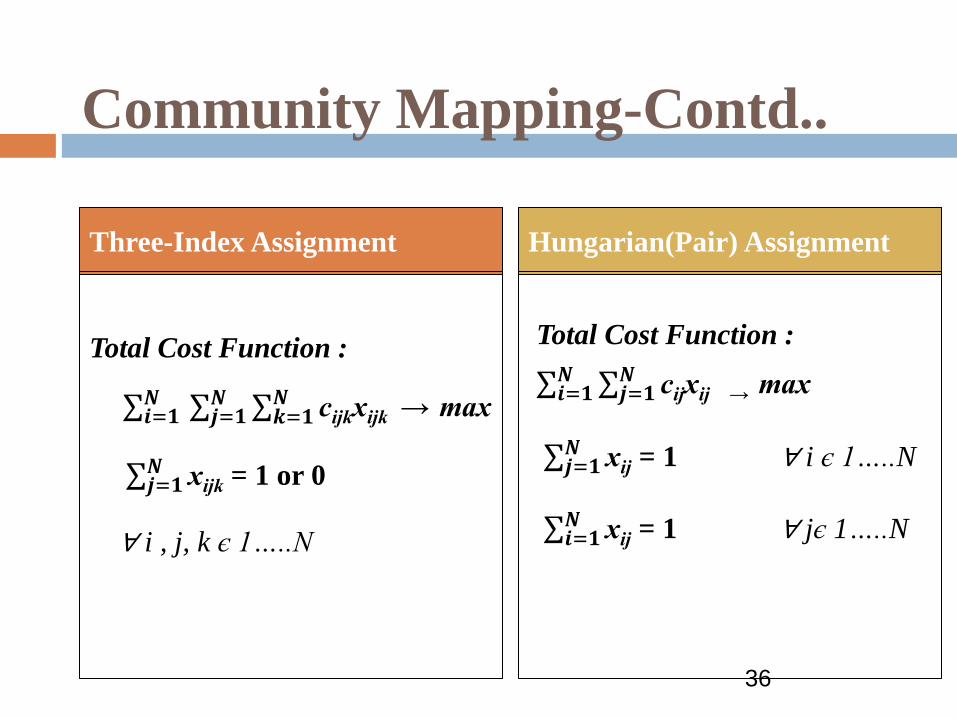
Community Mapping-Contd..
Three-Index Assignment
Total Cost Function : cijkxijk
→ max 𝑵
𝒌=𝟏𝑵𝒋=𝟏 𝑵
𝒊=𝟏
xijk𝑵𝒋=𝟏 = 1 or 0
∀ i , j, k є 1…..N
Hungarian(Pair) Assignment
36
Total Cost Function : cijxij →
max 𝑵𝒋=𝟏
𝑵𝒊=𝟏
xij𝑵𝒋=𝟏 = 1 ∀ i є 1…..N
xij𝑵𝒊=𝟏 = 1 ∀ jє 1…..N
Community Mapping-Contd..
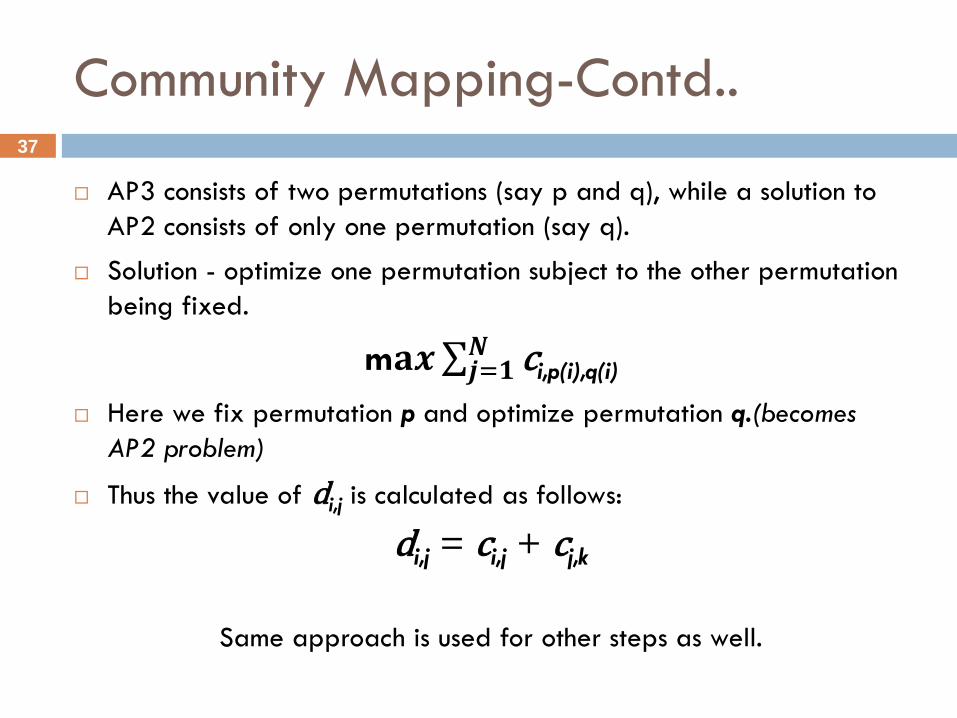
AP3 consists of two permutations (say p and q), while a solution to
AP2 consists of only one permutation (say q).
Solution - optimize one permutation subject to the other permutation
being fixed.
m𝐚𝒙 ci,p(i),q(i)𝑵𝒋=𝟏
Here we fix permutation p and optimize permutation q.(becomes
AP2 problem)
Thus the value of di,j is calculated as follows:
di,j = ci,j + cj,k
Same approach is used for other steps as well.
37
Community Mapping-Contd..
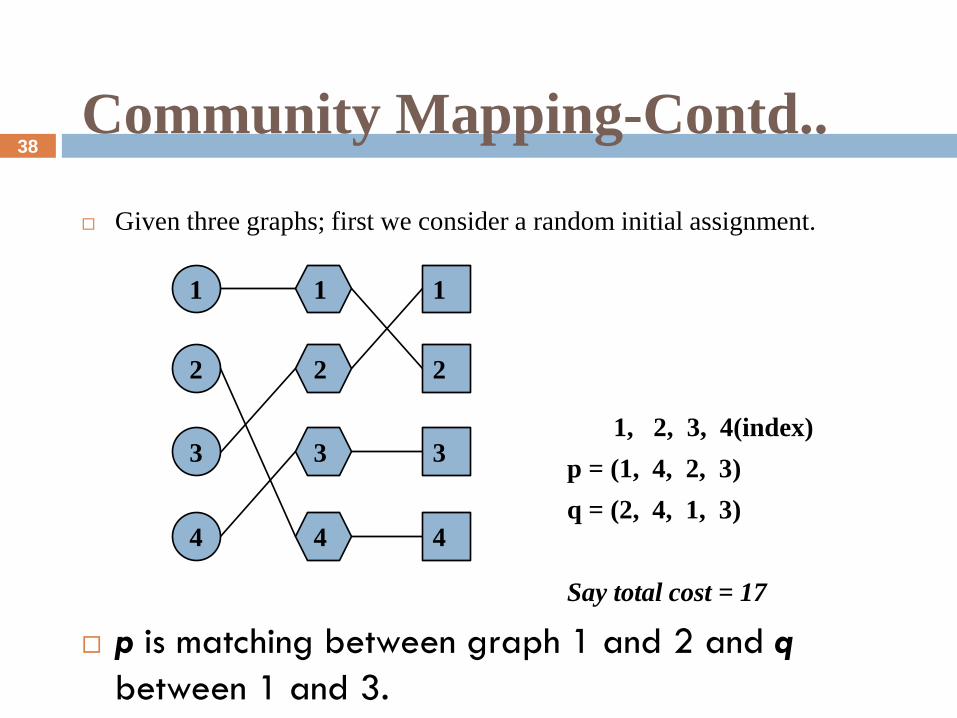
Given three graphs; first we consider a random initial assignment.
1, 2, 3, 4(index)
p = (1, 4, 2, 3)
q = (2, 4, 1, 3)
Say total cost = 17
p is matching between graph 1 and 2 and q
between 1 and 3.
Our idea is to optimize one permutation subject to the other permutation
being fixed.
1
2
3
4
1
2
3
4
1
2
3
4
38
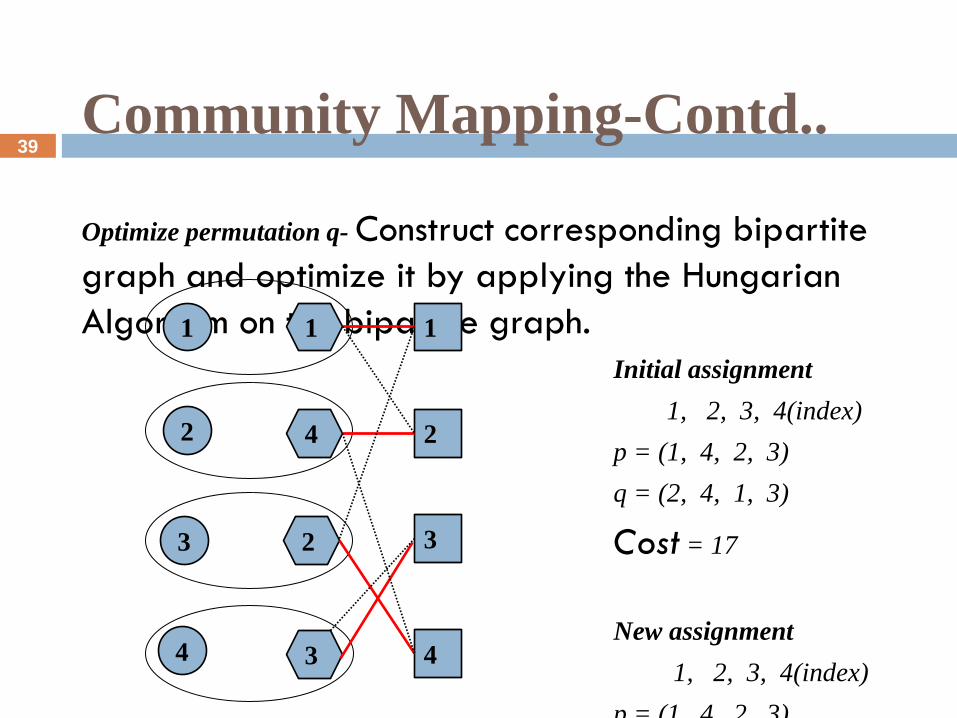
Community Mapping-Contd..
Optimize permutation q- Construct corresponding bipartite
graph and optimize it by applying the Hungarian
Algorithm on the bipartite graph.
Initial assignment
1, 2, 3, 4(index)
p = (1, 4, 2, 3)
q = (2, 4, 1, 3)
Cost = 17
New assignment
1, 2, 3, 4(index)
p = (1, 4, 2, 3)
q = (1, 2, 4, 3)(*)
Cost increased= 72
1
2
3
4
1
4
2
3
1
2
3
4
39
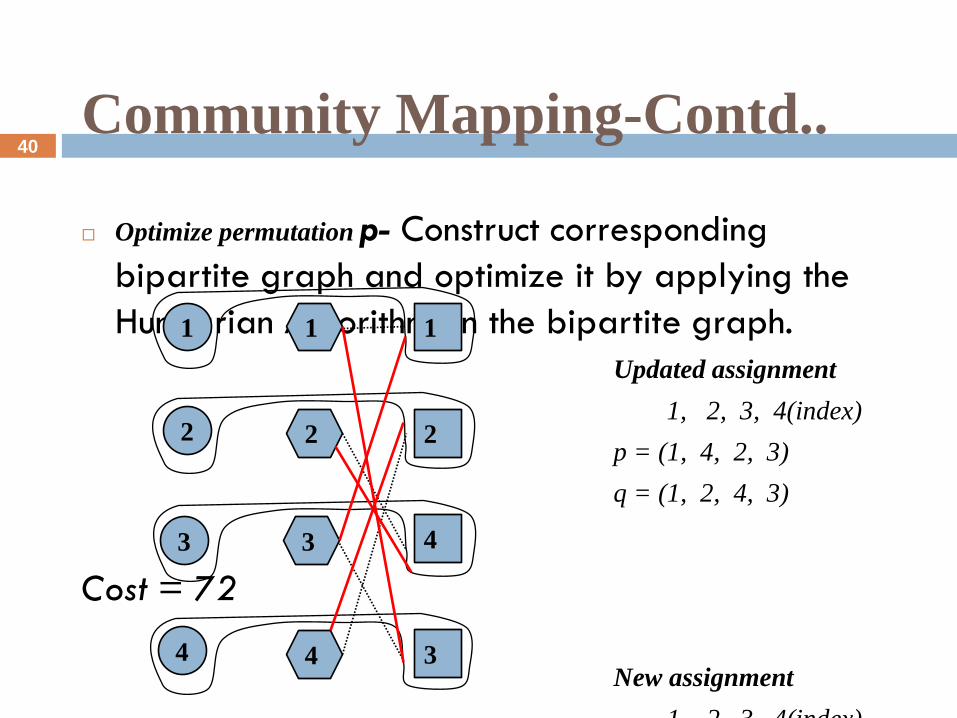
Community Mapping-Contd..
Optimize permutation p- Construct corresponding
bipartite graph and optimize it by applying the
Hungarian Algorithm on the bipartite graph.
Updated assignment
1, 2, 3, 4(index)
p = (1, 4, 2, 3)
q = (1, 2, 4, 3)
Cost = 72
New assignment
1, 2, 3, 4(index)
p = (3, 4, 2, 1)(*)
q = (1, 2, 4, 3)
Cost increased= 120
1
2
3
4
1
2
3
4
1
2
4
3
40
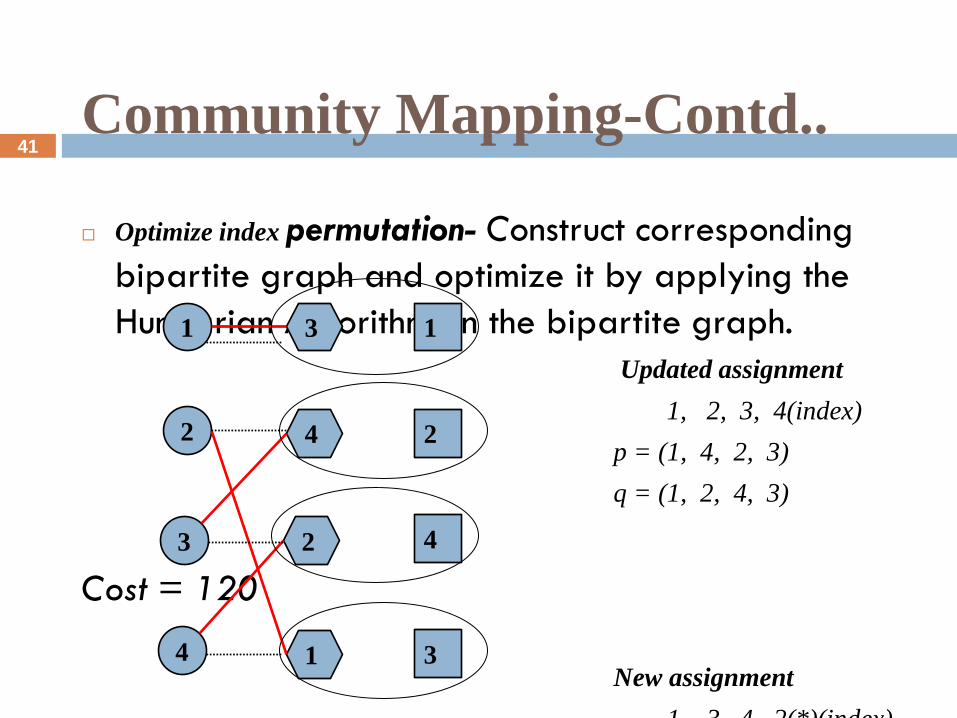
Community Mapping-Contd..
Optimize index permutation- Construct corresponding
bipartite graph and optimize it by applying the
Hungarian Algorithm on the bipartite graph.
Updated assignment
1, 2, 3, 4(index)
p = (1, 4, 2, 3)
q = (1, 2, 4, 3)
Cost = 120
New assignment
1, 3, 4, 2(*)(index)
p = (3, 4, 2, 1)
q = (1, 2, 4, 3)
Cost increased= 177
1
2
3
4
3
4
2
1
1
2
4
3
41
Extension Mapping
In addition to protein sequence similarity, topological similarity
is added.
The protein triplets obtained after second step are considered as
core protein triplets.
Neighbours of proteins in the core are considered as candidates for
extension mapping.
Let N(ai) and N(bj ) be the set of all first neighbours (proteins
separated by one interaction) and second neighbours (proteins
separated by two interactions) of ai in A and bj in B
42
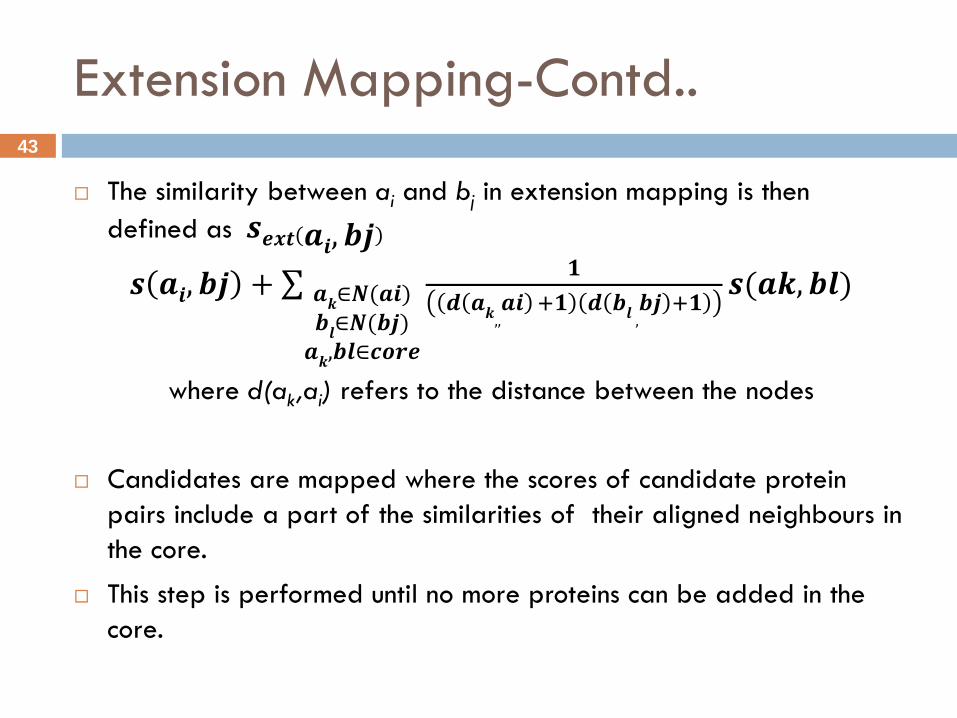
Extension Mapping-Contd..
The similarity between ai and bj in extension mapping is then
defined as 𝒔𝒆𝒙𝒕 𝒂𝒊, 𝒃𝒋
𝒔 𝒂𝒊, 𝒃𝒋 + 𝟏
𝒅 𝒂𝒌,,𝒂𝒊 +𝟏 𝒅 𝒃
𝒍 ,𝒃𝒋 +𝟏
𝒔(𝒂𝒌, 𝒃𝒍)𝒂𝒌∈𝑵(𝒂𝒊)𝒃𝒍∈𝑵(𝒃𝒋)𝒂𝒌,𝒃𝒍∈𝒄𝒐𝒓𝒆
where d(ak,ai) refers to the distance between the nodes
Candidates are mapped where the scores of candidate protein
pairs include a part of the similarities of their aligned neighbours in
the core.
This step is performed until no more proteins can be added in the
core.
43
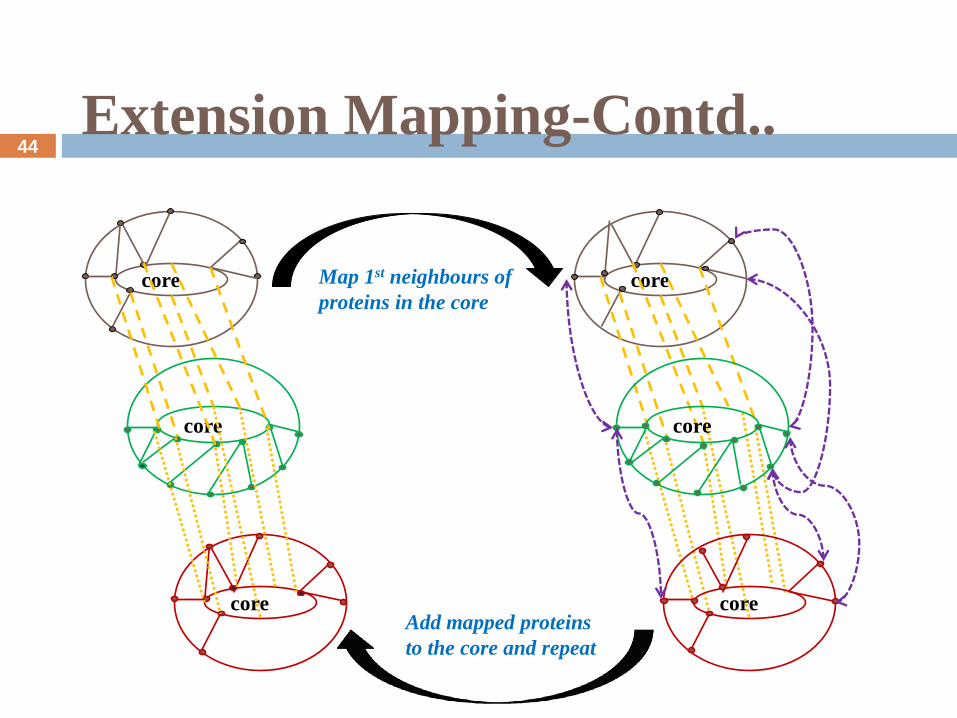
Extension Mapping-Contd..
core
core
core
core
core
core
Map 1st neighbours of
proteins in the core
Add mapped proteins
to the core and repeat
44
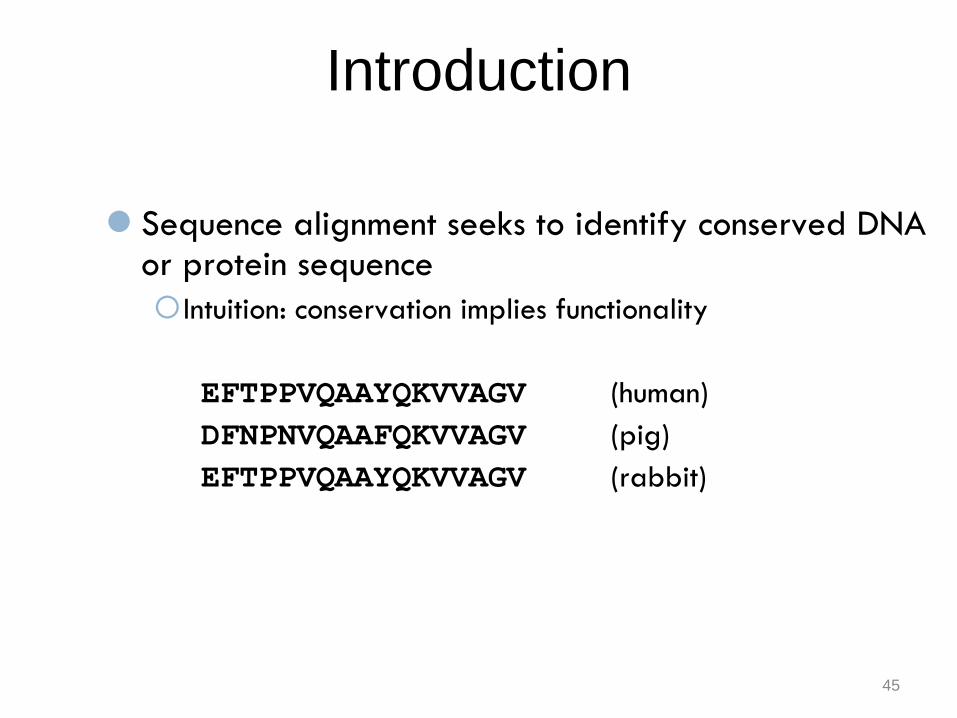
Sequence alignment seeks to identify conserved DNA or protein sequence
Intuition: conservation implies functionality
EFTPPVQAAYQKVVAGV (human)
DFNPNVQAAFQKVVAGV (pig)
EFTPPVQAAYQKVVAGV (rabbit)
Introduction
45

Introduction
By similar intuition, subnetworks conserved across
species are likely functional modules
46
Introduction
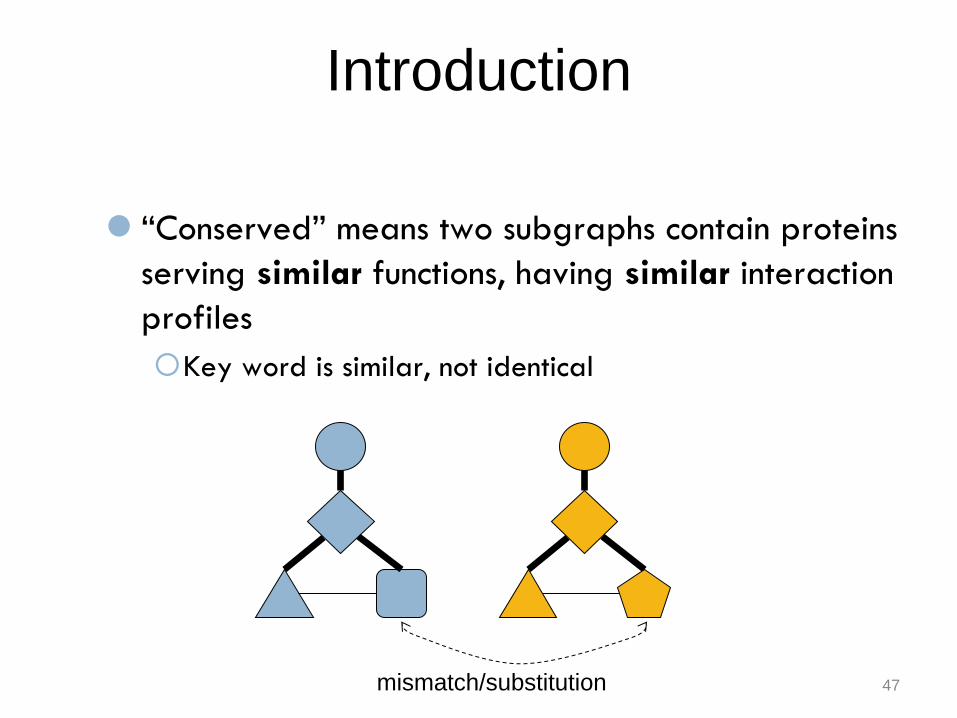
“Conserved” means two subgraphs contain proteins
serving similar functions, having similar interaction
profiles
Key word is similar, not identical
mismatch/substitution 47

Introduction
Interactions conserved in orthologs
Orthology is a fuzzy notion
Sequence similarity not necessary for conservation of
function
48
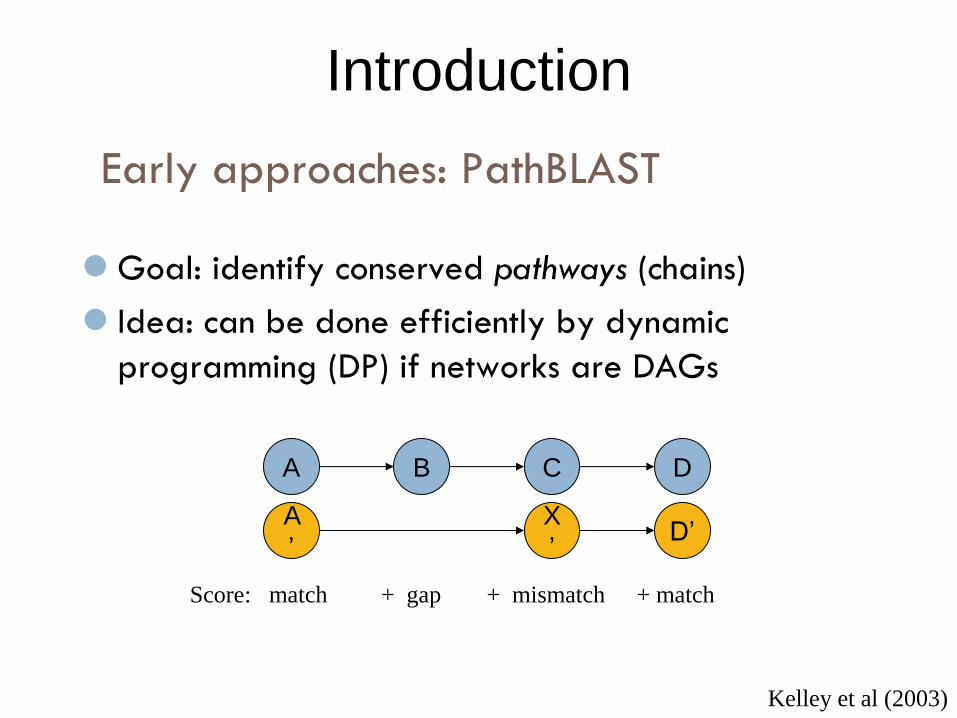
Goal: identify conserved pathways (chains)
Idea: can be done efficiently by dynamic
programming (DP) if networks are DAGs
Kelley et al (2003)
D
D’
+ match
Early approaches: PathBLAST
C
X
’
+ mismatch
B
+ gap
A
A
’
Score: match
Introduction
Early approaches: PathBLAST
Introduction
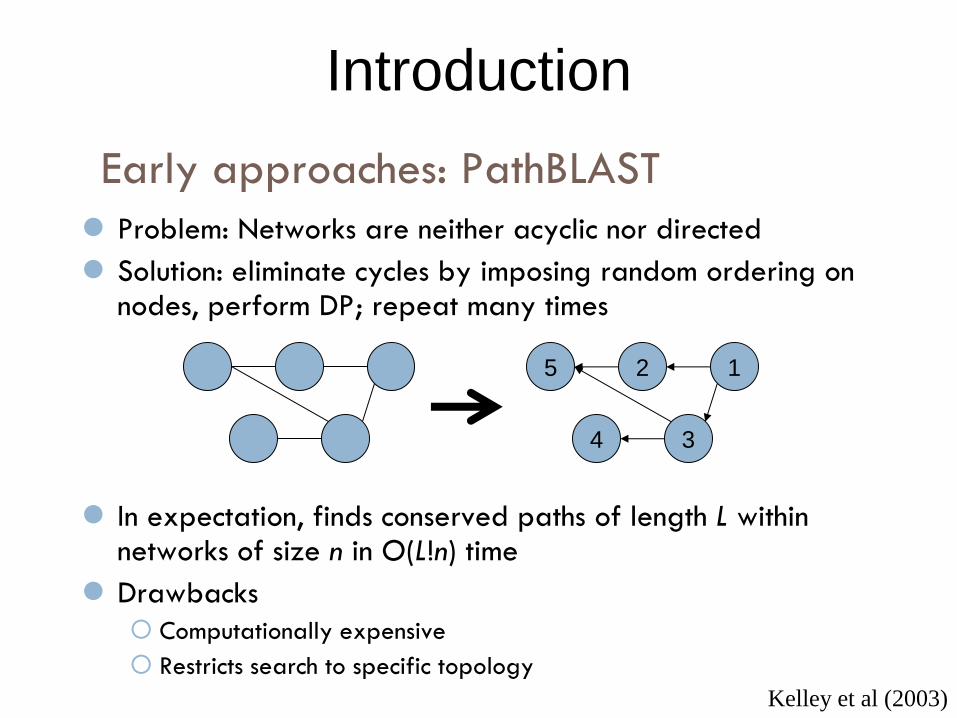
Problem: Networks are neither acyclic nor directed
Solution: eliminate cycles by imposing random ordering on nodes, perform DP; repeat many times
In expectation, finds conserved paths of length L within networks of size n in O(L!n) time
Drawbacks
Computationally expensive
Restricts search to specific topology
Kelley et al (2003)
5 2 1
3 4
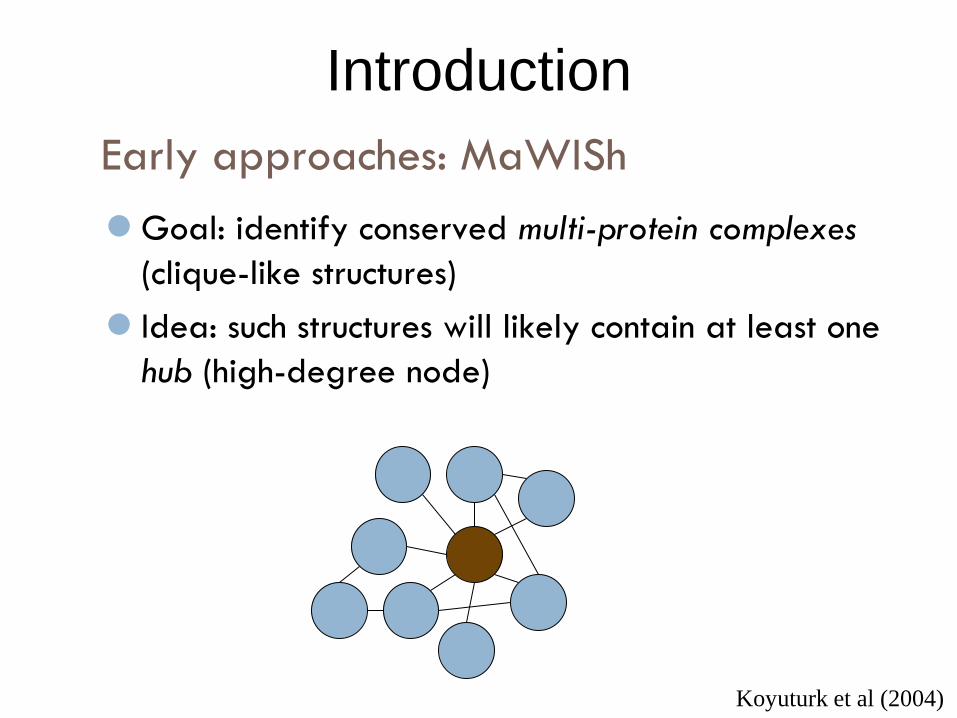
Early approaches: MaWISh
Introduction
Goal: identify conserved multi-protein complexes
(clique-like structures)
Idea: such structures will likely contain at least one
hub (high-degree node)
Koyuturk et al (2004)
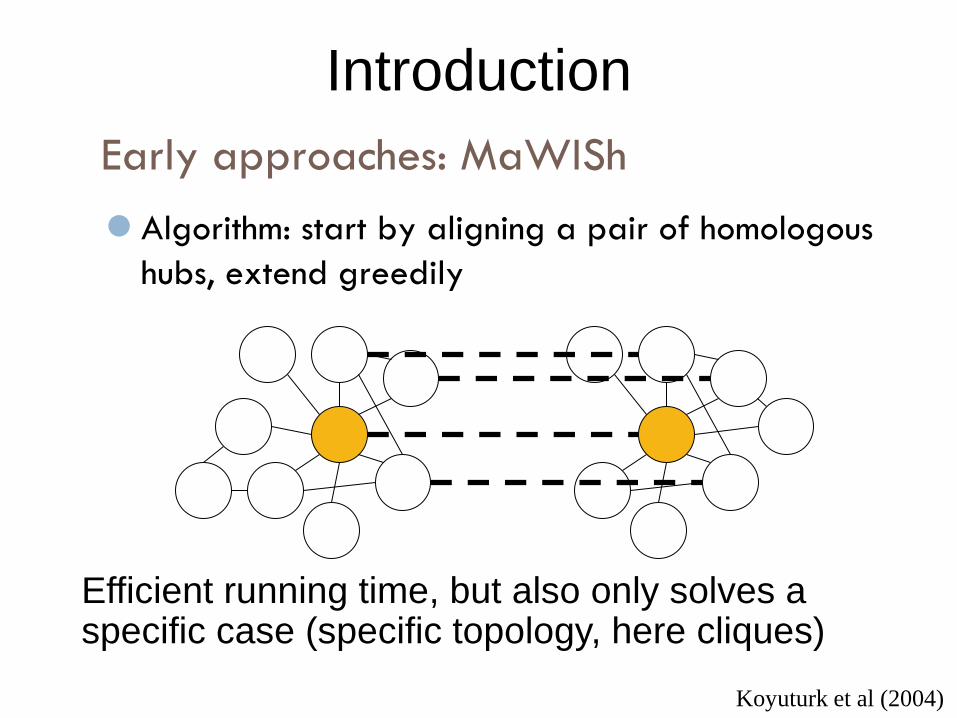
Early approaches: MaWISh
Introduction
Algorithm: start by aligning a pair of homologous
hubs, extend greedily
Koyuturk et al (2004)
Efficient running time, but also only solves a specific case (specific topology, here cliques)
Introduction
A General Network Aligner: Goals
Solve restrictions of existing approaches
Should extend gracefully to multiple alignment
PathBLAST was extended to 3-way alignment, but extension scales exponentially in number of species
Should not restrict search to specific network topologies (cliques/pathways)
Must be efficient in running time
53
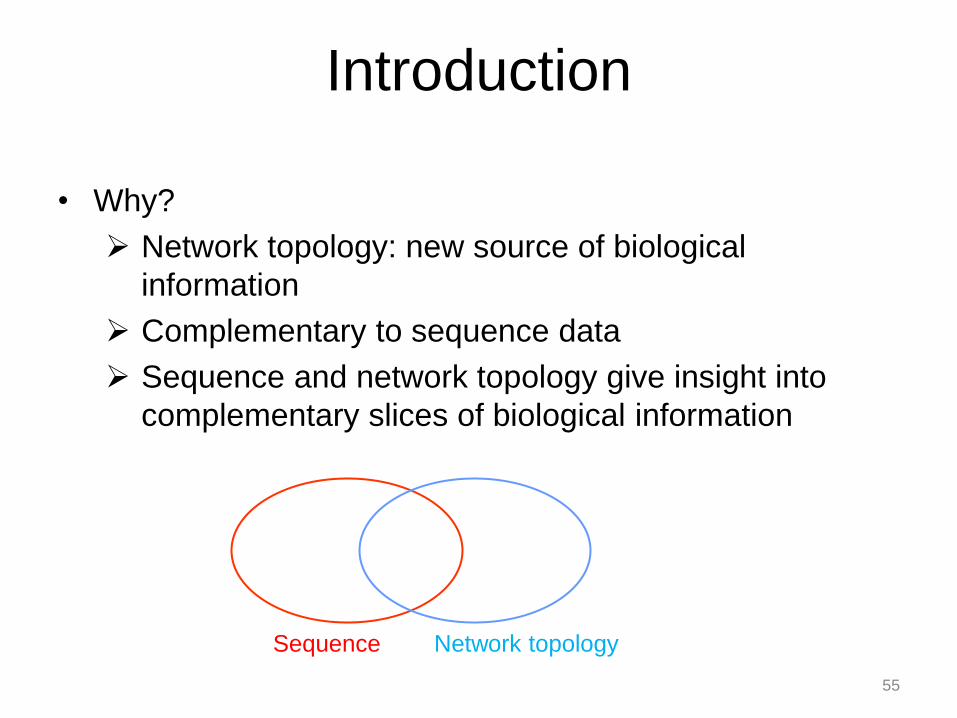
• Why?
Network topology: new source of biological
information
Complementary to sequence data
Sequence and network topology give insight into
complementary slices of biological information
Introduction
Sequence Network topology
55
Introduction
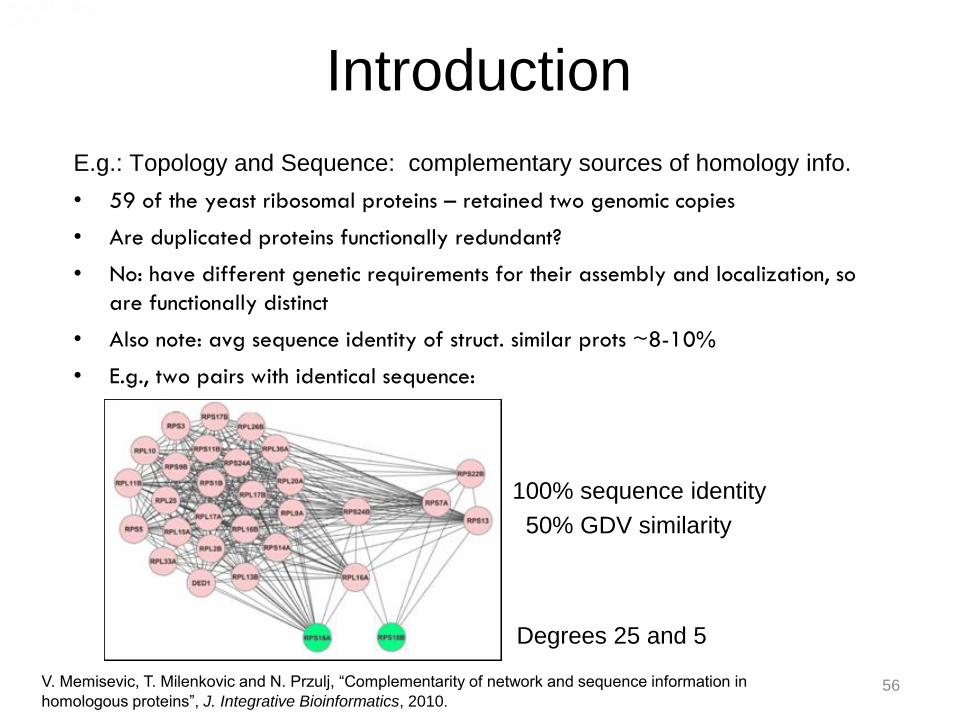
E.g.: Topology and Sequence: complementary sources of homology info.
• 59 of the yeast ribosomal proteins – retained two genomic copies
• Are duplicated proteins functionally redundant?
• No: have different genetic requirements for their assembly and localization, so
are functionally distinct
• Also note: avg sequence identity of struct. similar prots ~8-10%
• E.g., two pairs with identical sequence:
100% sequence identity
50% GDV similarity
V. Memisevic, T. Milenkovic and N. Przulj, “Complementarity of network and sequence information in
homologous proteins”, J. Integrative Bioinformatics, 2010.
Degrees 25 and 5
56
Introduction
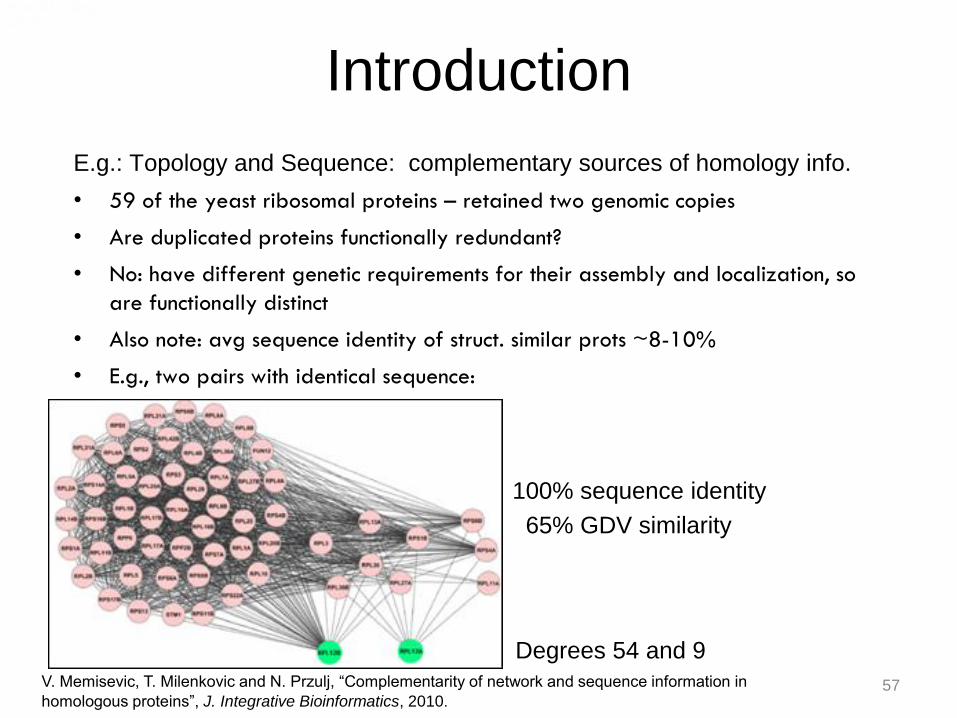
E.g.: Topology and Sequence: complementary sources of homology info.
• 59 of the yeast ribosomal proteins – retained two genomic copies
• Are duplicated proteins functionally redundant?
• No: have different genetic requirements for their assembly and localization, so
are functionally distinct
• Also note: avg sequence identity of struct. similar prots ~8-10%
• E.g., two pairs with identical sequence:
100% sequence identity
65% GDV similarity
V. Memisevic, T. Milenkovic and N. Przulj, “Complementarity of network and sequence information in
homologous proteins”, J. Integrative Bioinformatics, 2010.
Degrees 54 and 9
57
Introduction
Sequence and network topology
complementary slices of homology information
Redefine homology from topology?
But how?
Need network alignment algorithms.
E.g.: Topology and Sequence: complementary sources of homology info.
58
• We will survey computational methodology for network
alignment and biological questions it may be able to
answer
• Conceptually, network alignment is the process of
contrasting two or more interaction networks,
representing different:
• species,
• conditions (eg, healthy vs. disease),
• interaction types (eg, physical vs. genetic interactions), or
• time points
Introduction
59

• Based on the identified network similarities, answer
a number of fundamental biological questions:
• Which proteins, protein interactions and groups of
proteins/interactions are likely to have equivalent
functions across species?
• Can we predict new functional information about
proteins and interactions that are poorly characterized?
• What do these relationships tell us about the evolution
of proteins, networks, and whole species?
Introduction
60
• Noise in the data – screens for PPI detection report
large numbers of false-positives and negatives:
• Which interactions represent true binding events?
• Confidence of interactions should be taken into account
before network comparison
• However
• A false-positive interaction is unlikely to be reproduced
across the interaction maps of multiple species
• Hence, use network comparison to identify “core”
interactions conserved in multiple species
Introduction
61
• Such questions have motivated 3 types (modes)
of comparative methods:
1. Network alignment
2. Network integration
3. Network querying
Types of Network Comparisons
62
1. Network alignment:
• The process of comparison of two or more
networks of the same type to identify regions of
similarity and dissimilarity
• Commonly applied to detect subnetworks that
are conserved across species and hence likely to
present true functional modules
Types of Network Comparisons
63
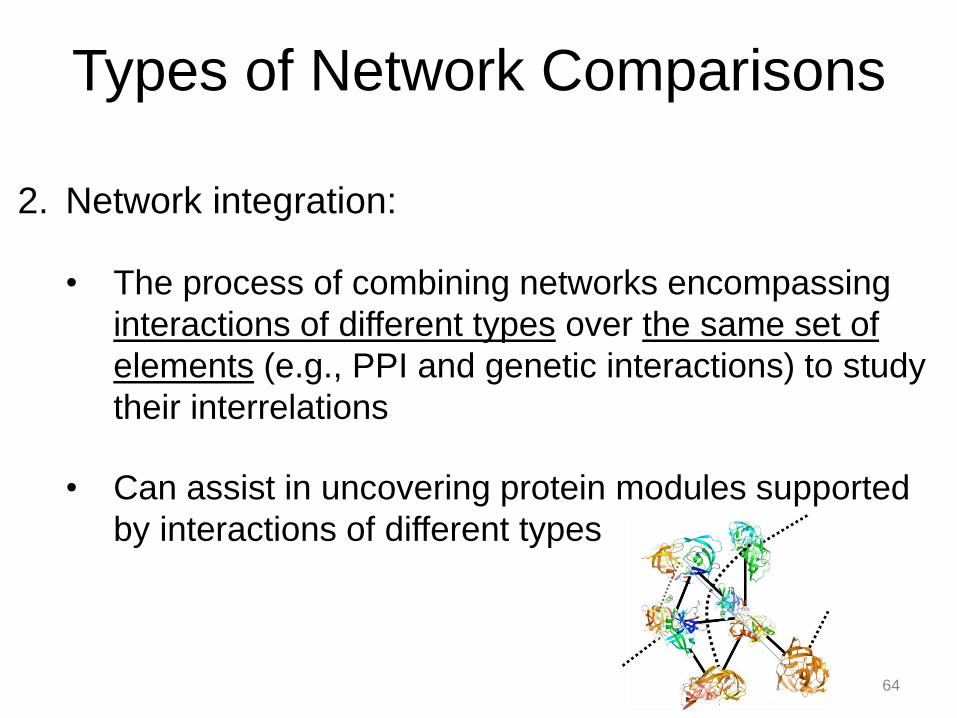
2. Network integration:
• The process of combining networks encompassing
interactions of different types over the same set of
elements (e.g., PPI and genetic interactions) to study
their interrelations
• Can assist in uncovering protein modules supported
by interactions of different types
Types of Network Comparisons
64
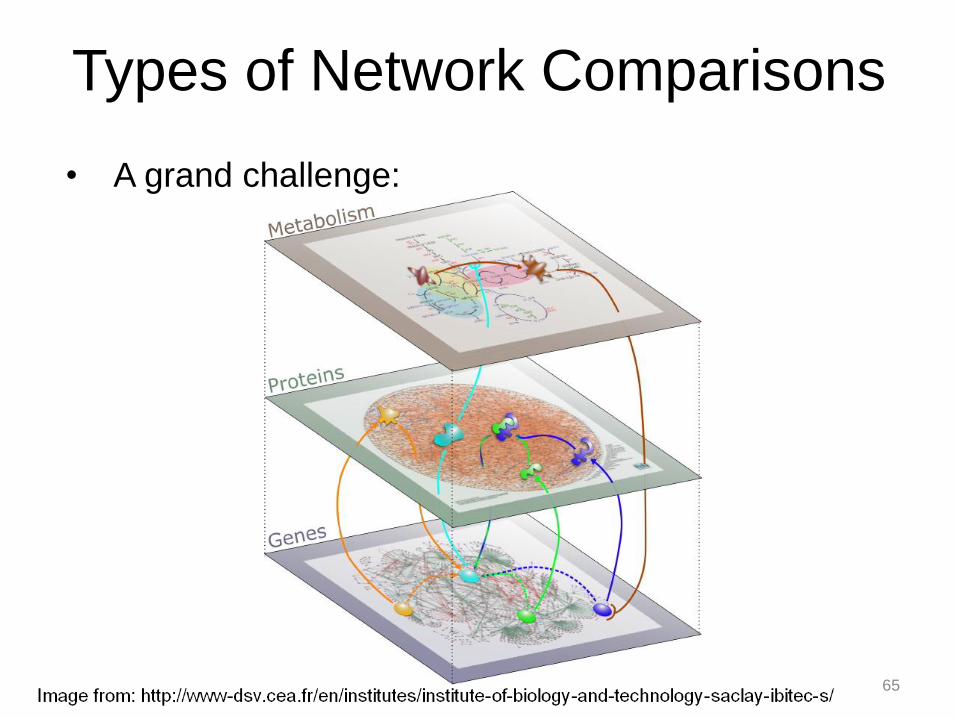
• A grand challenge:
Types of Network Comparisons
65
3. Network querying:
• A given network is searched for subnetworks
that are similar to a subnetwork query of interest
• This basic database search operation is aimed
at transferring biological knowledge within and
across species
• Currently limited to very sparse graphs, e.g.,
trees
Types of Network Comparisons
66

3. Network querying
Types of Network Comparisons
Useful application for biologists: given a candidate module, align to a database of networks (“query-to-database”)
Query: Database:
67
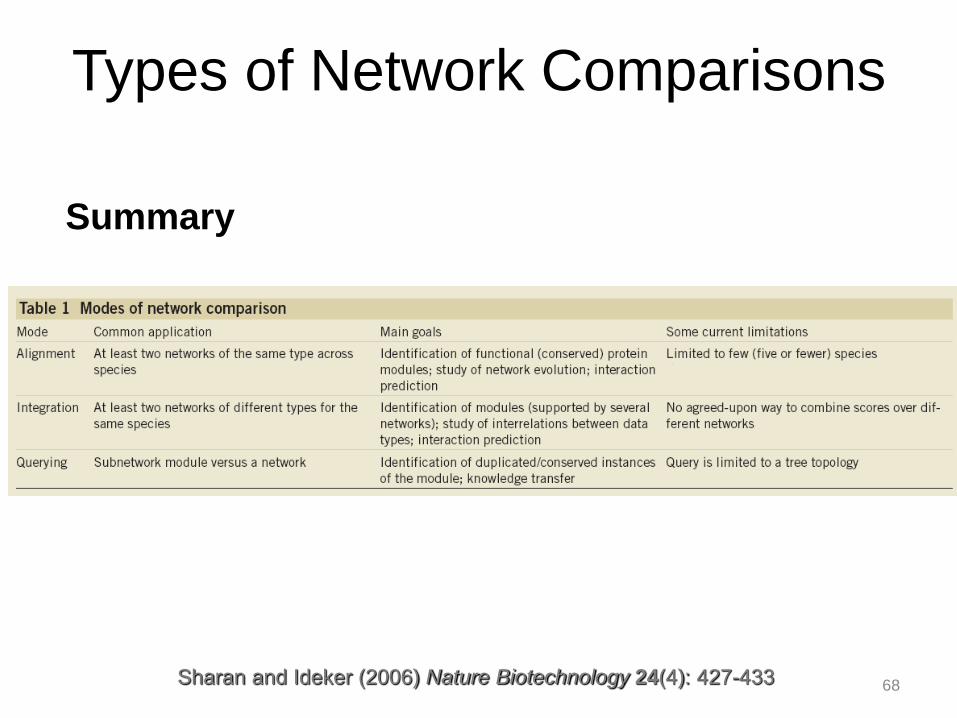
Summary
Types of Network Comparisons
Sharan and Ideker (2006) Nature Biotechnology 24(4): 427-433
68
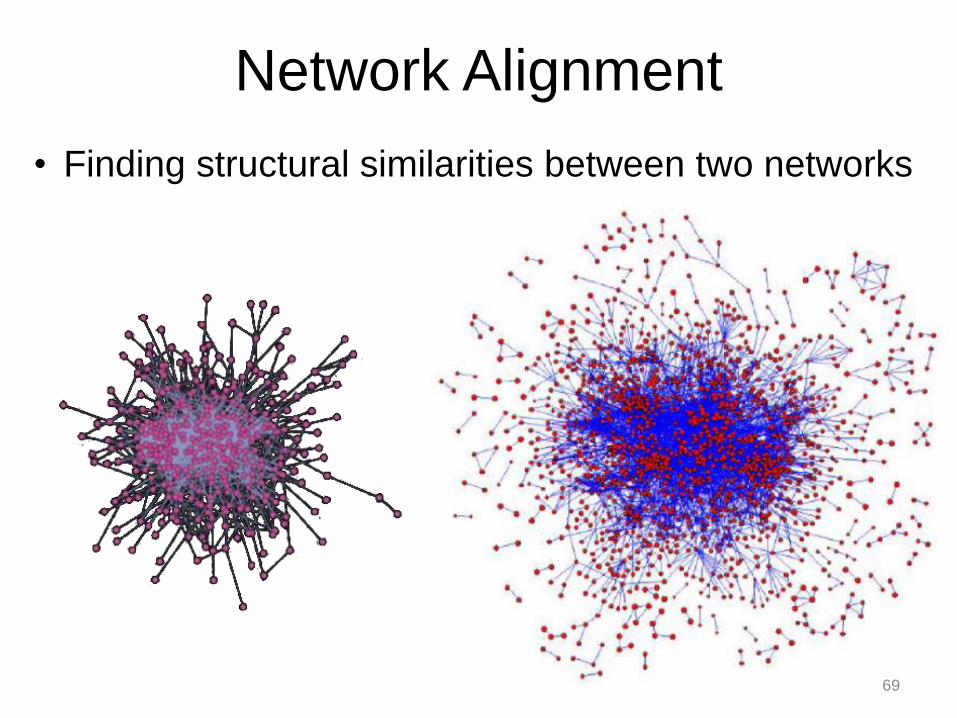
Network Alignment
• Finding structural similarities between two networks
69
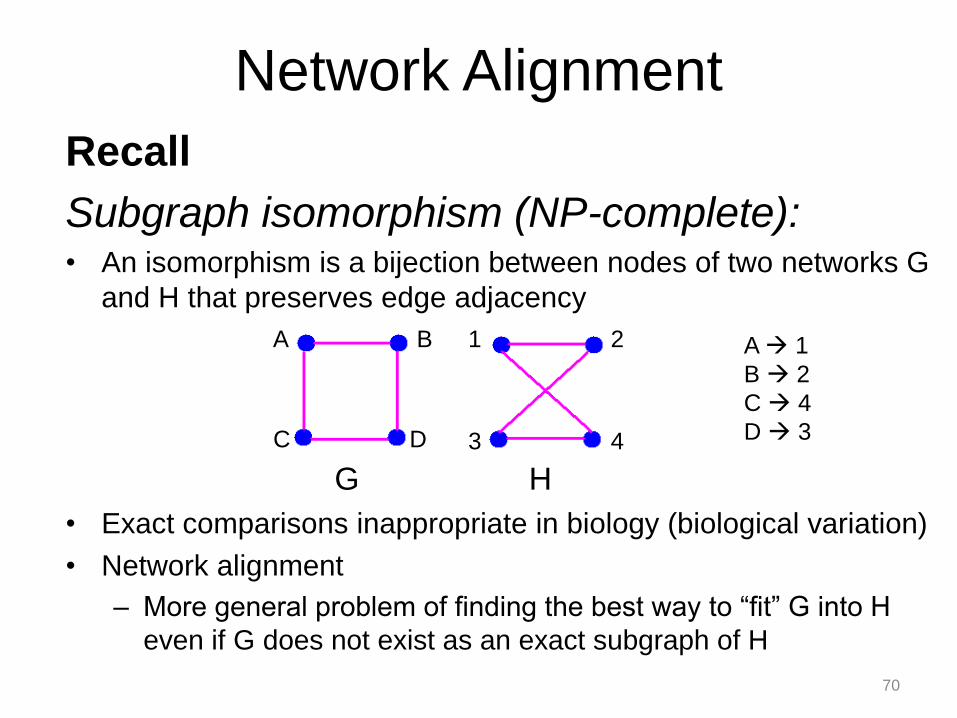
Recall
Subgraph isomorphism (NP-complete): • An isomorphism is a bijection between nodes of two networks G
and H that preserves edge adjacency
• Exact comparisons inappropriate in biology (biological variation)
• Network alignment
– More general problem of finding the best way to “fit” G into H
even if G does not exist as an exact subgraph of H
A 1
B 2
C 4
D 3
G H
C D 3 4
A B 1 2
Network Alignment
70
G H
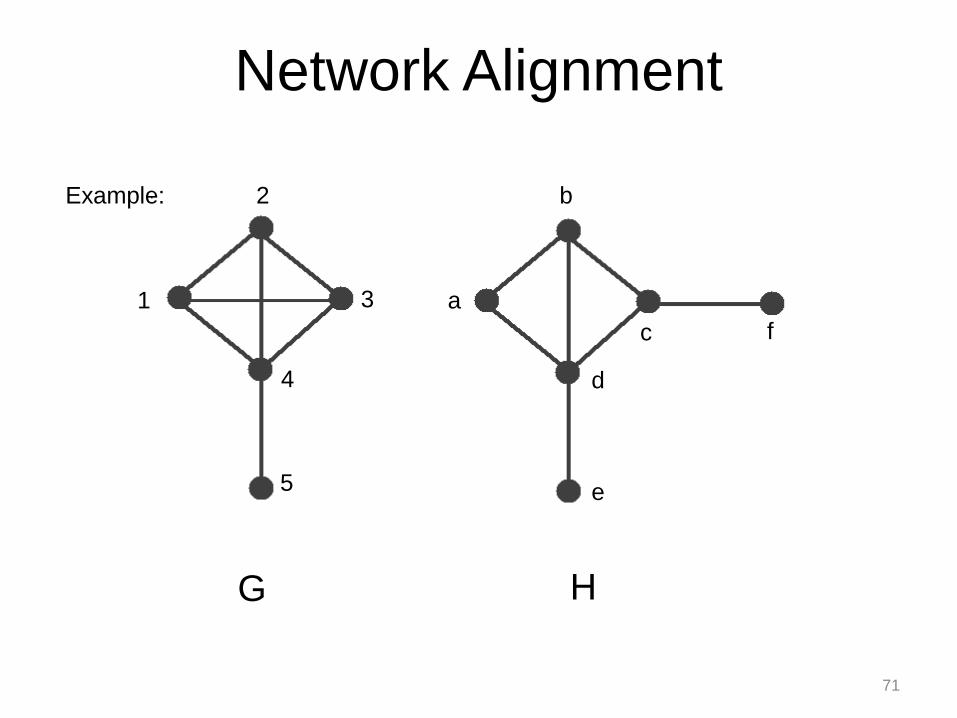
Network Alignment
1
2
3
4
5
a
b
c
d
e
f
Example:
71
G H
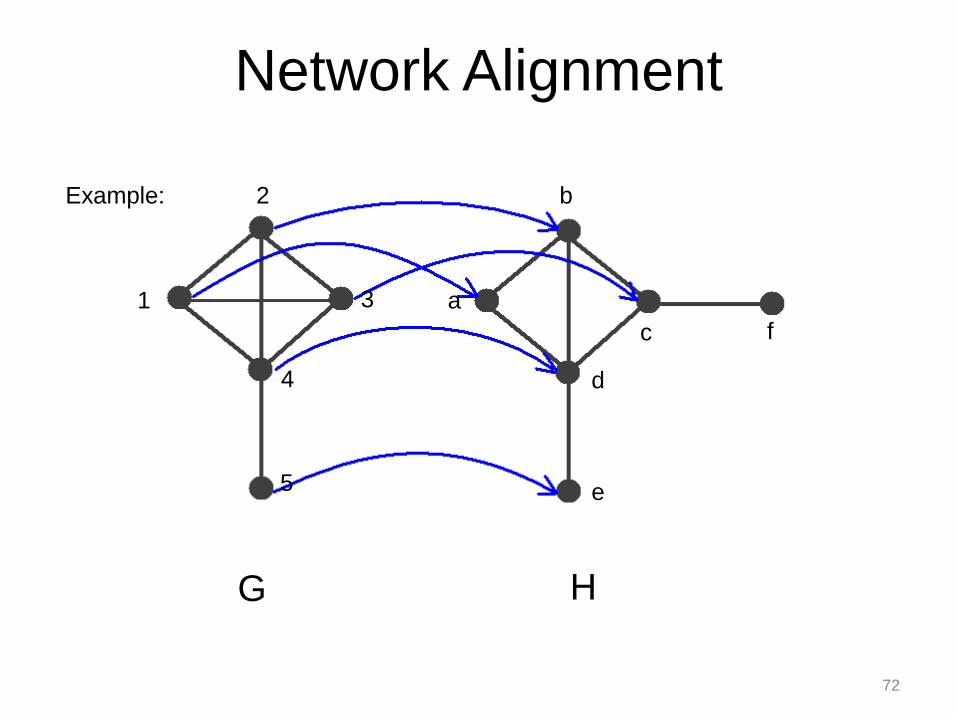
Network Alignment
1
2
3
4
5
a
b
c
d
e
f
Example:
72
• Methods vary in these aspects:
A. Global vs. local
B. Pairwise vs. multiple
C. Functional vs. topological information
Network Alignment
73
• Methods vary in these aspects:
A. Global vs. local
B. Pairwise vs. multiple
C. Functional vs. topological information
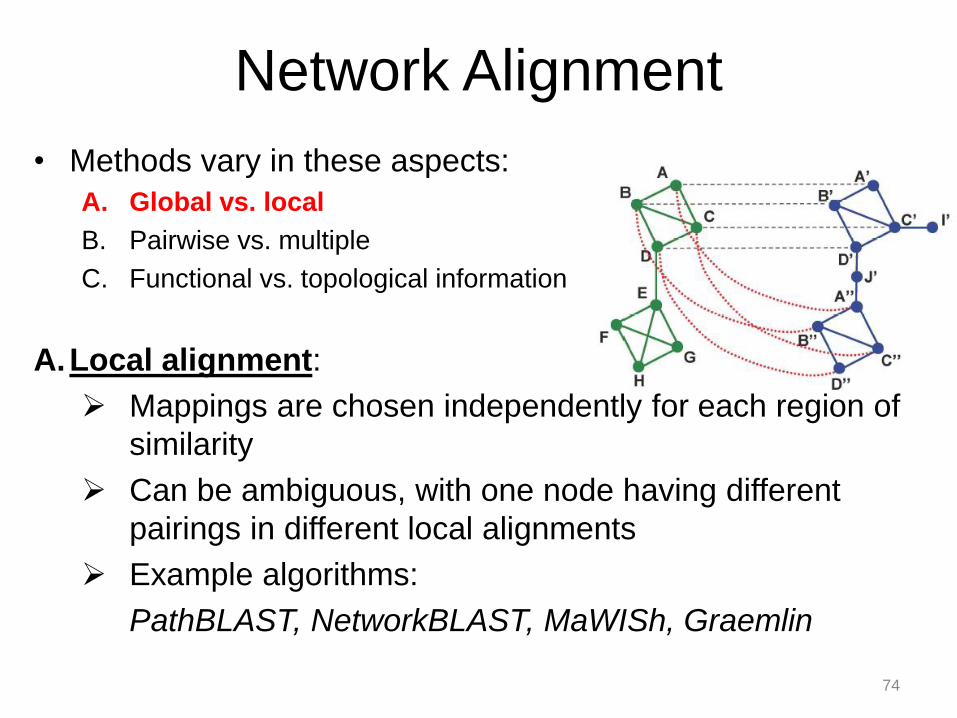
A.Local alignment:
Mappings are chosen independently for each region of
similarity
Can be ambiguous, with one node having different
pairings in different local alignments
Example algorithms:
PathBLAST, NetworkBLAST, MaWISh, Graemlin
Network Alignment
74
• Methods vary in these aspects:
A. Global vs. local
B. Pairwise vs. multiple
C. Functional vs. topological information
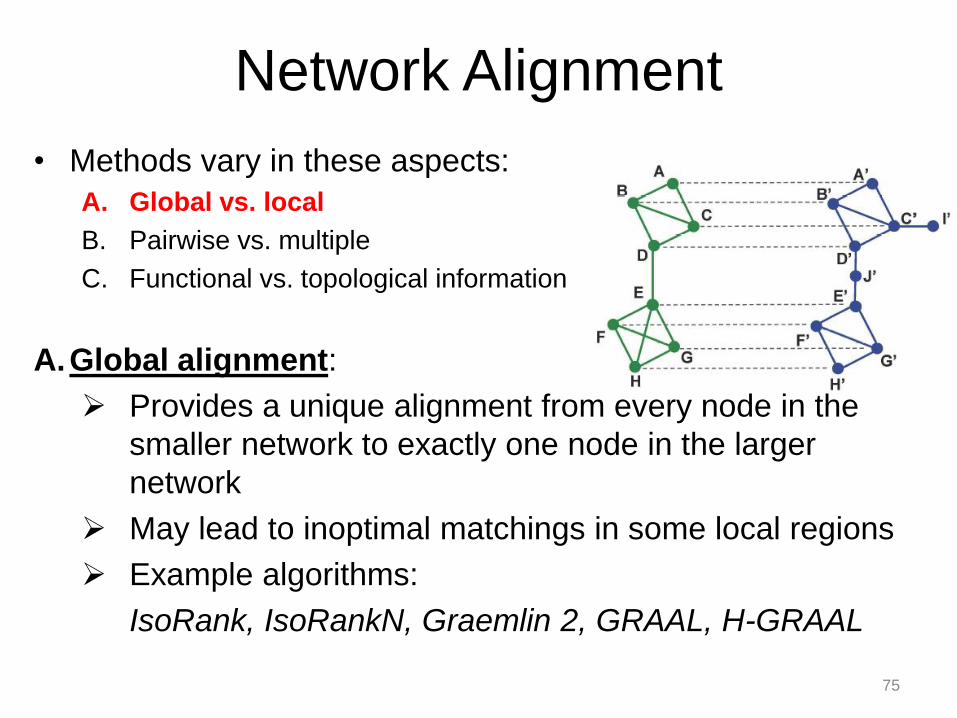
A.Global alignment:
Provides a unique alignment from every node in the
smaller network to exactly one node in the larger
network
May lead to inoptimal matchings in some local regions
Example algorithms:
IsoRank, IsoRankN, Graemlin 2, GRAAL, H-GRAAL
Network Alignment
75
• Methods vary in these aspects:
A. Global vs. local
B. Pairwise vs. multiple
C. Functional vs. topological information
Network Alignment
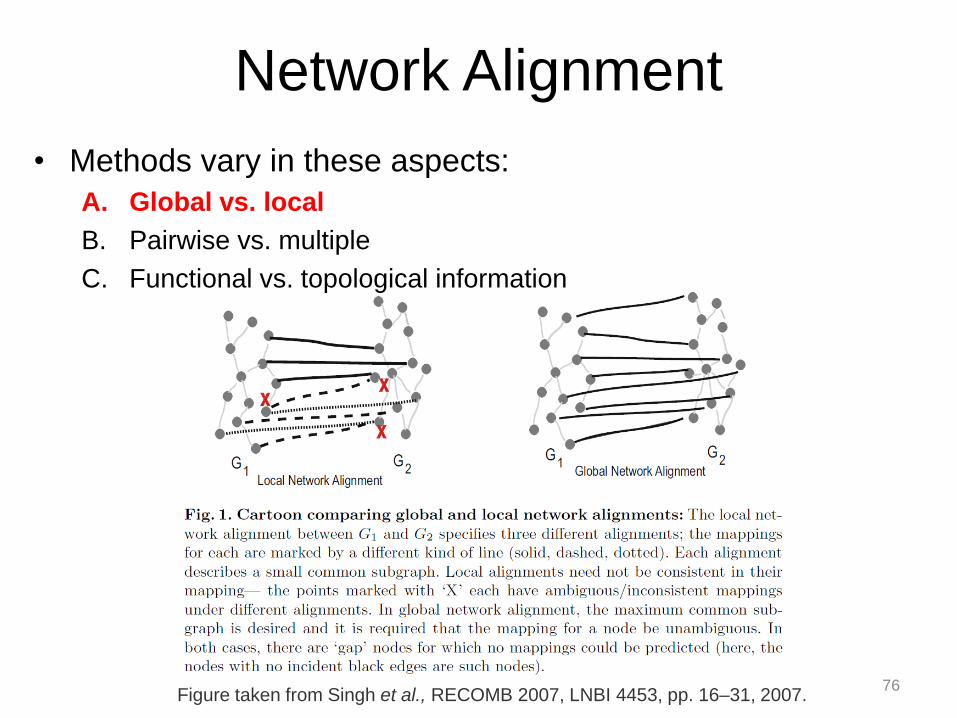
Figure taken from Singh et al., RECOMB 2007, LNBI 4453, pp. 16–31, 2007. 76
• Methods vary in these aspects:
A. Global vs. local
B. Pairwise vs. multiple
C. Functional vs. topological information
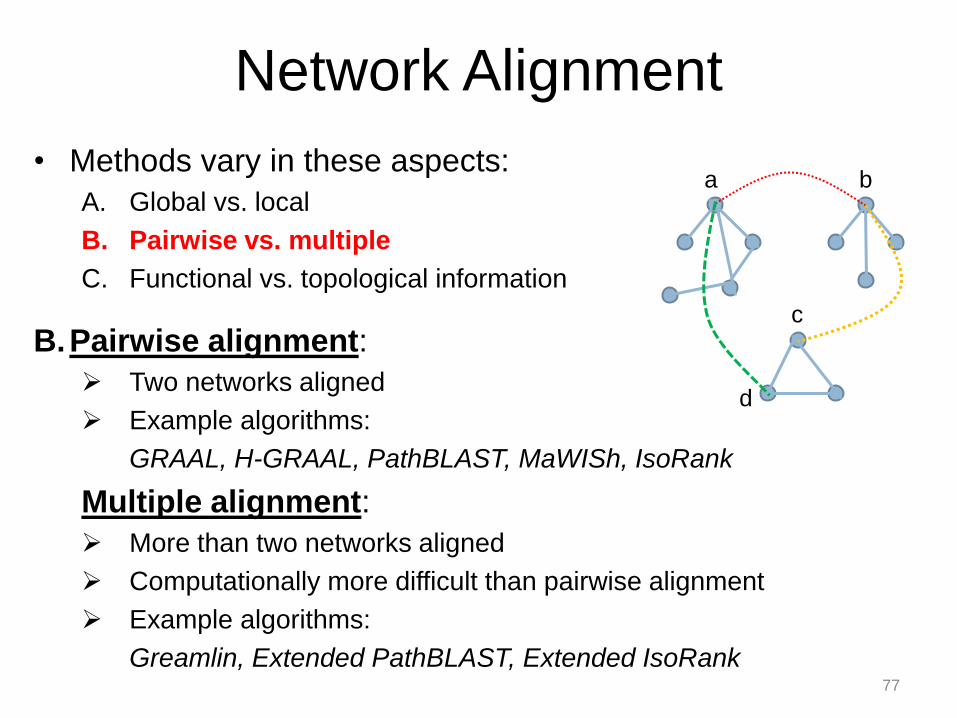
B.Pairwise alignment:
Two networks aligned
Example algorithms:
GRAAL, H-GRAAL, PathBLAST, MaWISh, IsoRank
Multiple alignment:
More than two networks aligned
Computationally more difficult than pairwise alignment
Example algorithms:
Greamlin, Extended PathBLAST, Extended IsoRank
Network Alignment
a b
c
d
77
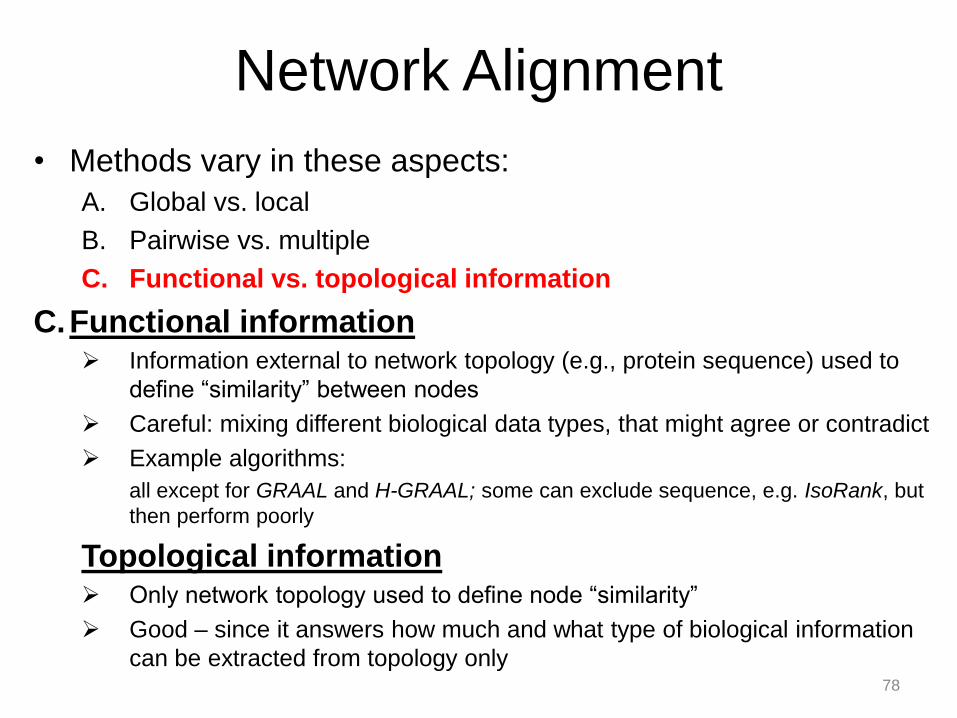
• Methods vary in these aspects:
A. Global vs. local
B. Pairwise vs. multiple
C. Functional vs. topological information
C.Functional information Information external to network topology (e.g., protein sequence) used to
define “similarity” between nodes
Careful: mixing different biological data types, that might agree or contradict
Example algorithms:
all except for GRAAL and H-GRAAL; some can exclude sequence, e.g. IsoRank, but
then perform poorly
Topological information Only network topology used to define node “similarity”
Good – since it answers how much and what type of biological information
can be extracted from topology only
Network Alignment
78

• In general, the network alignment problem is computationally
hard (generalizing subgraph isomorphism)
• Hence, heuristic approaches are devised
• For now, let us assume that we have a heuristic algorithm for
network alignment
• How do we measure the quality of its resulting alignments?
Network Alignment
79
80 80 80 80 80 80 80
80
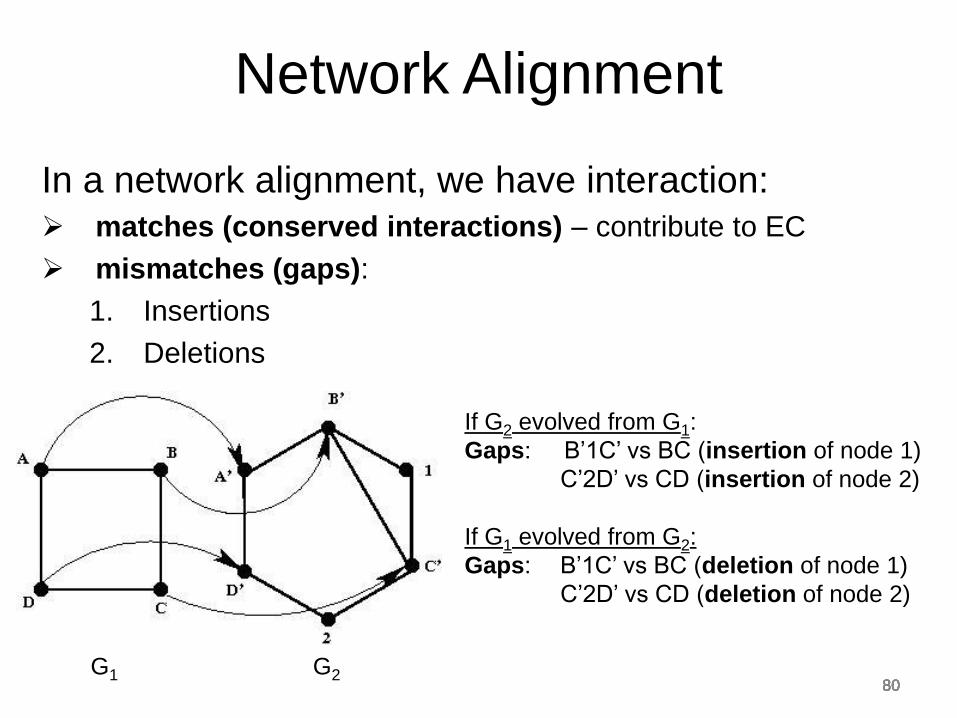
In a network alignment, we have interaction:
matches (conserved interactions) – contribute to EC
mismatches (gaps):
1. Insertions
2. Deletions
G1 G2
If G2 evolved from G1:
Gaps: B’1C’ vs BC (insertion of node 1)
C’2D’ vs CD (insertion of node 2)
If G1 evolved from G2:
Gaps: B’1C’ vs BC (deletion of node 1)
C’2D’ vs CD (deletion of node 2)
Network Alignment
81
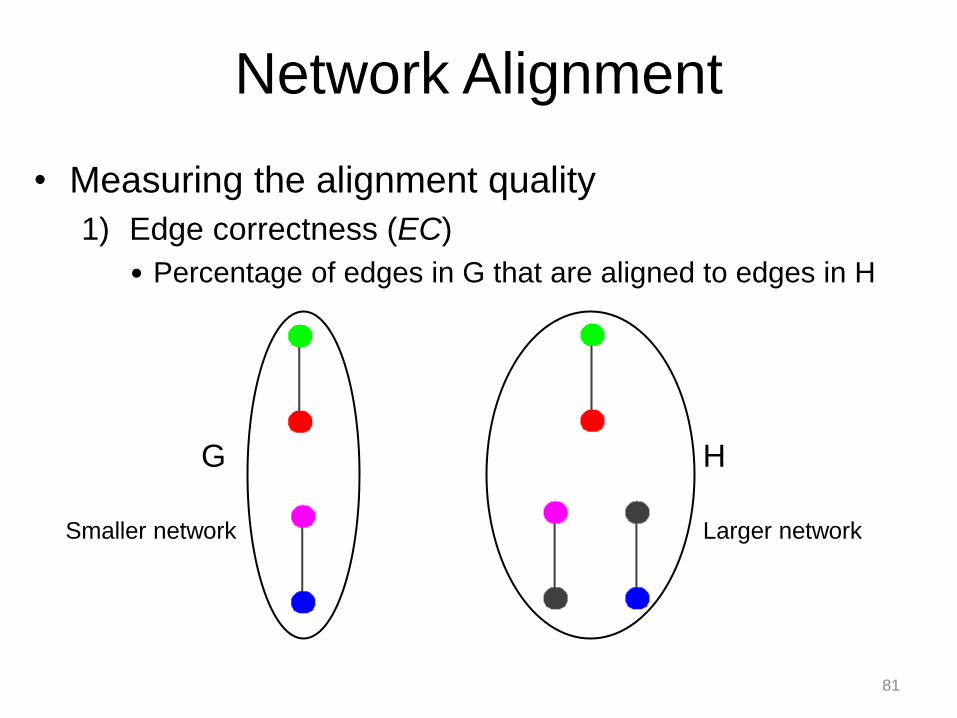
• Measuring the alignment quality
1) Edge correctness (EC)
• Percentage of edges in G that are aligned to edges in H
G H
Network Alignment
Smaller network Larger network
82
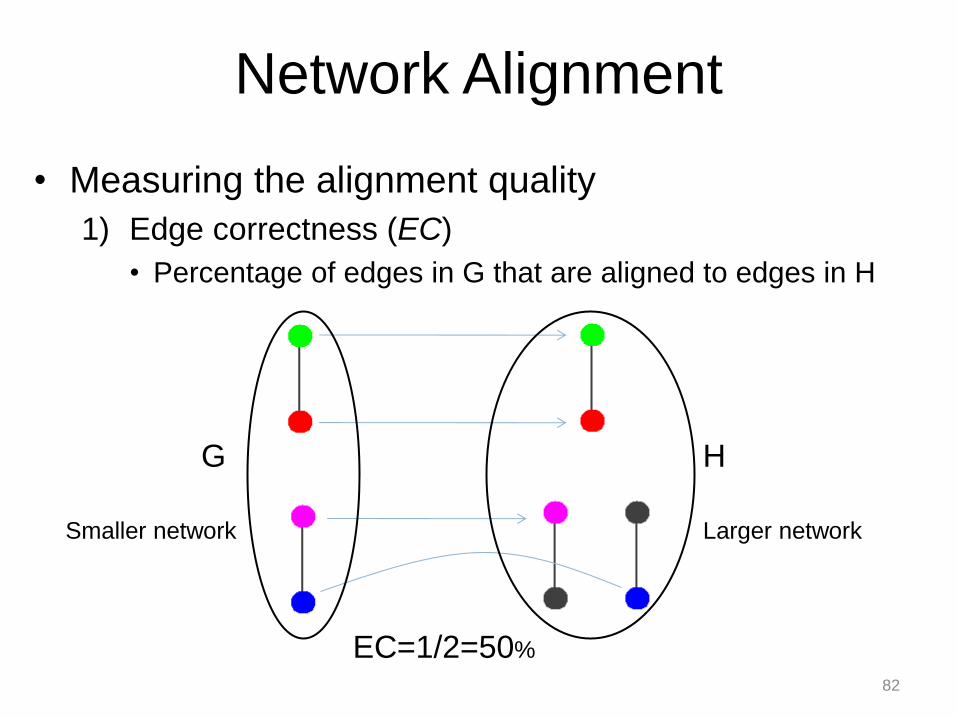
• Measuring the alignment quality
1) Edge correctness (EC)
• Percentage of edges in G that are aligned to edges in H
G H
EC=1/2=50%
Network Alignment
Smaller network Larger network

83 83
Network Alignment
84 84
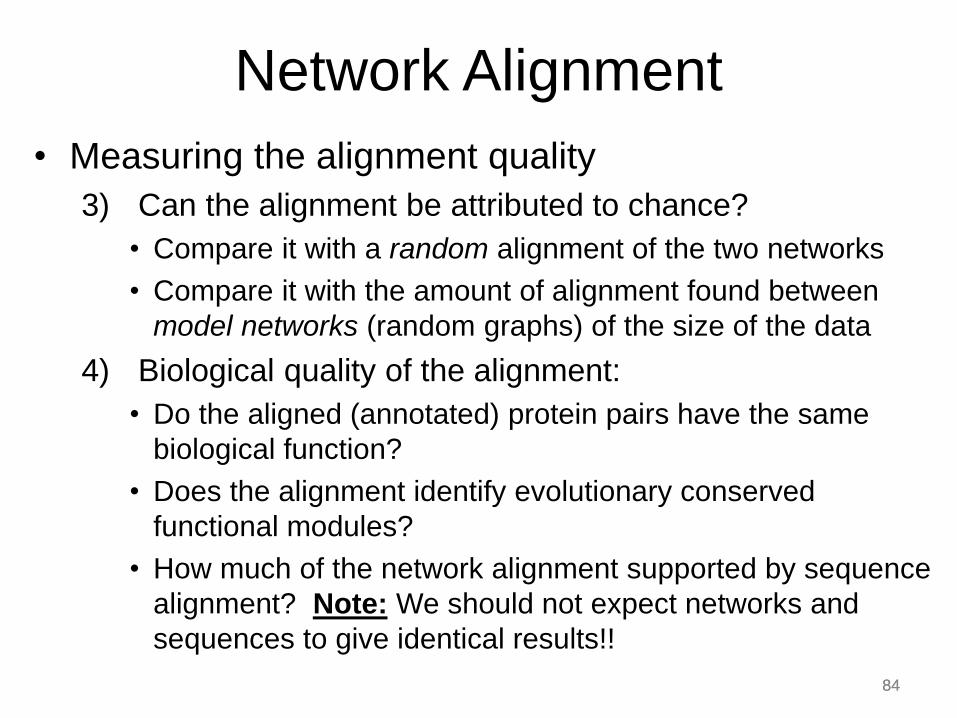
• Measuring the alignment quality
3) Can the alignment be attributed to chance?
• Compare it with a random alignment of the two networks
• Compare it with the amount of alignment found between
model networks (random graphs) of the size of the data
4) Biological quality of the alignment:
• Do the aligned (annotated) protein pairs have the same
biological function?
• Does the alignment identify evolutionary conserved
functional modules?
• How much of the network alignment supported by sequence
alignment? Note: We should not expect networks and
sequences to give identical results!!
Network Alignment
85 85
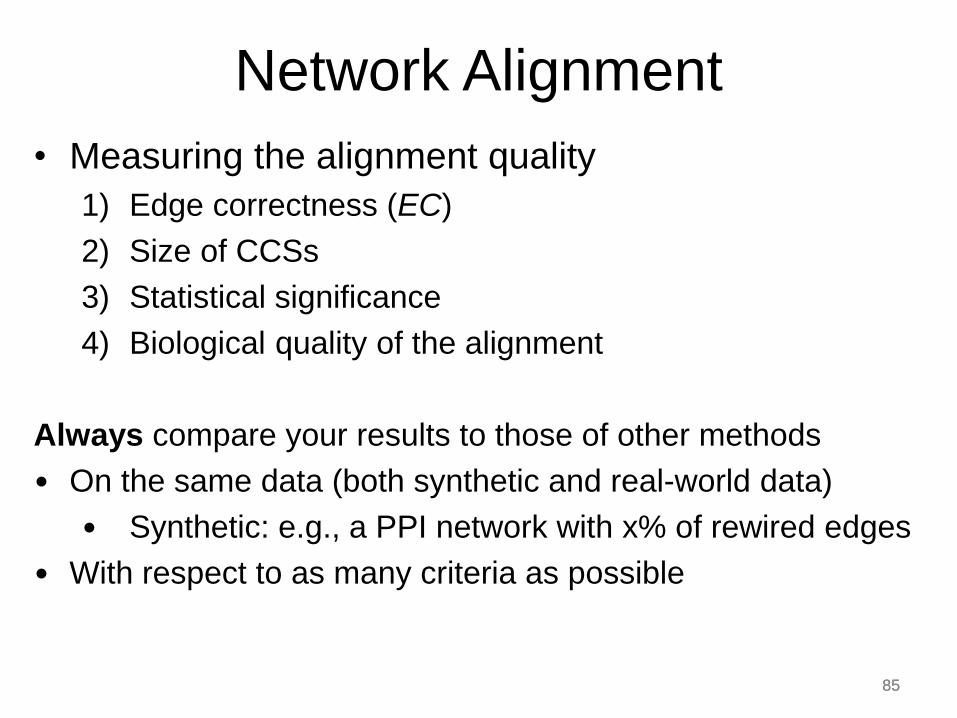
• Measuring the alignment quality
1) Edge correctness (EC)
2) Size of CCSs
3) Statistical significance
4) Biological quality of the alignment
Always compare your results to those of other methods
• On the same data (both synthetic and real-world data)
• Synthetic: e.g., a PPI network with x% of rewired edges
• With respect to as many criteria as possible
Network Alignment
86 86 86 86 86 86
86
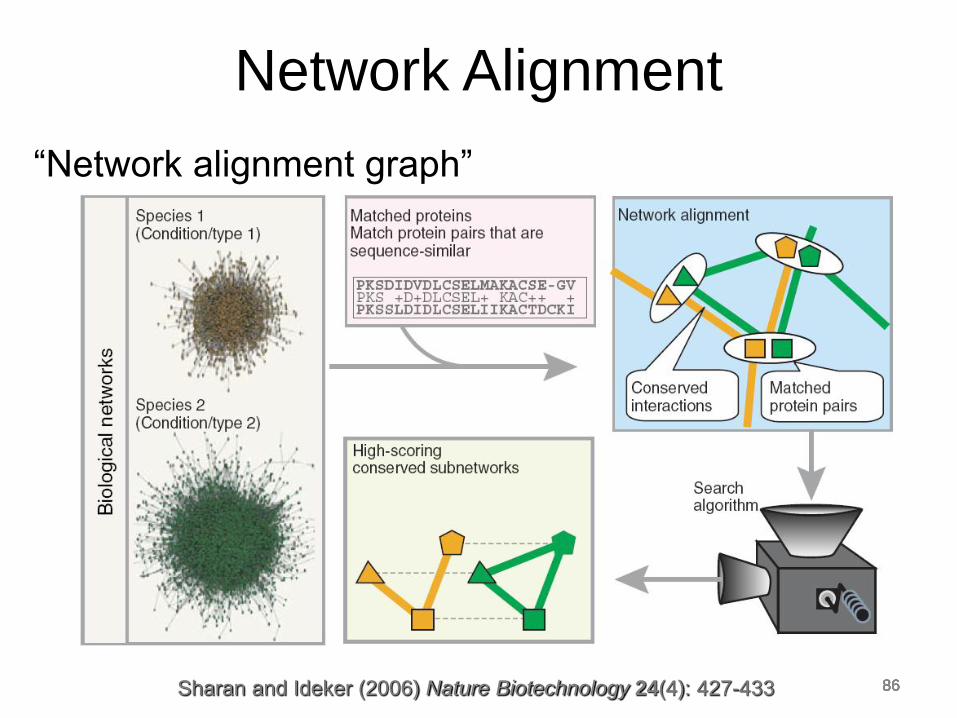
“Network alignment graph”
Sharan and Ideker (2006) Nature Biotechnology 24(4): 427-433
Network Alignment
Network Alignment
“Network alignment graph” • A merged representation of the two networks being
compared in which: • Nodes represent sets of molecules, one from each network
• Edges represent conserved molecular interactions across
different networks
• The alignment is simple when there exists a 1-to-1
correspondence between molecules across the two
networks, but in general there may be a complex
many-to-many correspondence
• Then apply a greedy algorithm for identifying
conserved subnetworks embedded in the “network
alignment graph”
87
88 88 88 88 88 88
88
“Network alignment graph”
• Facilitates the search for conserved network regions
• E.g.,
conserved dense clusters of interactions may indicate protein
complexes
conserved linear paths may correspond to signalling pathways
• Finding conserved pathways was done by finding “high-
scoring” paths in the alignment graph (Kelley et al., PNAS,
2003):
PathBLAST
Identified five regions conserved across PPI networks of yeast
S. Cerevisiae and Helicobacter pylori
Later extended to detect conserved protein clusters rather than
paths (NetworkBlast)
Network Alignment
Key algorithmic components of network alignment
algorithms:
Node similarity measure
Rapid identification of high-scoring alignments
from among the exponentially large set of possible
alignments
Network Alignment
89
• How is “similarity” between nodes defined?
• Using information external to network topology, e.g., the
sequence alignment score
• Homology, E-values, sequence similarity vs. sequence identity…
• Using only network topology, e.g., node degree, graphlet
degree vectors (e.g., GRAAL, H-GRAAL)
• Using a combination of the two
• But one still needs to ensure that a meaningful alignment is a
result of the alignment algorithm applied to network topology,
and not of the external node information
• Caution about the validation/application of the algorithm
• If sequence is used to guide the algorithm, you should not use
the alignment to validate it with or make predictions about
sequence-based information
Network Alignment
90
Network Alignment
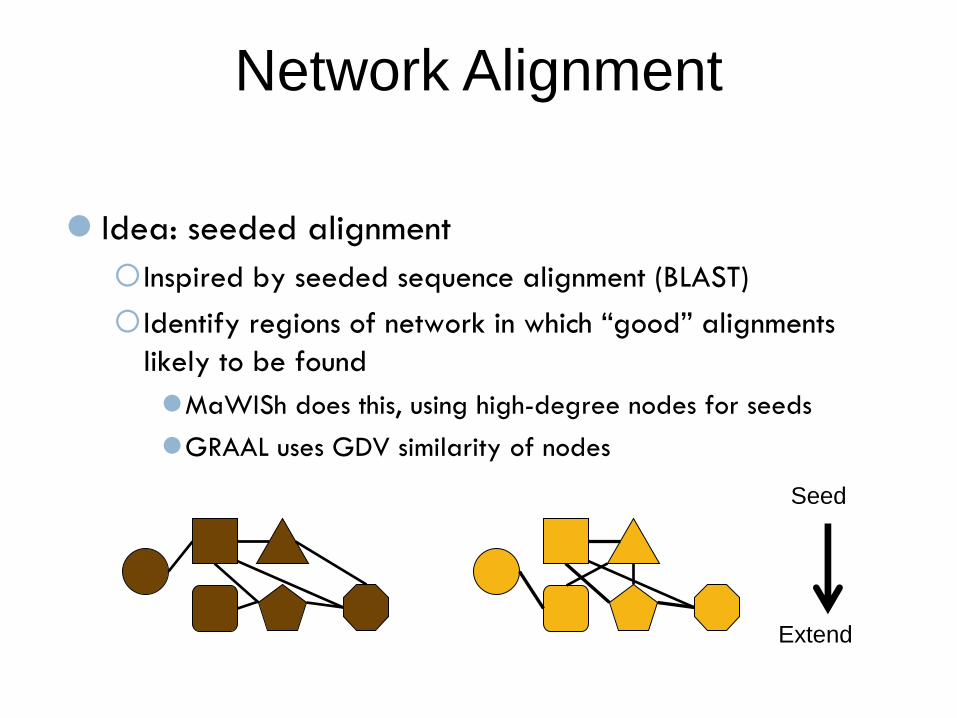
Idea: seeded alignment
Inspired by seeded sequence alignment (BLAST)
Identify regions of network in which “good” alignments
likely to be found
MaWISh does this, using high-degree nodes for seeds
GRAAL uses GDV similarity of nodes
Seed
Extend
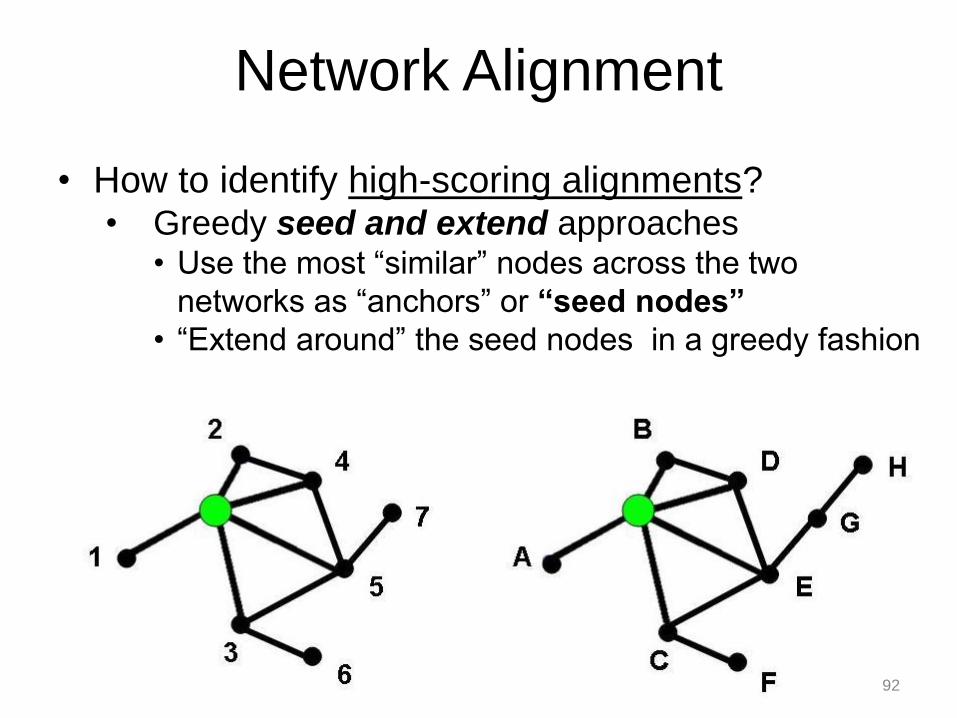
• How to identify high-scoring alignments? • Greedy seed and extend approaches
• Use the most “similar” nodes across the two
networks as “anchors” or “seed nodes”
• “Extend around” the seed nodes in a greedy fashion
Network Alignment
92

• How to identify high-scoring alignments? • Greedy seed and extend approaches
• Use the most “similar” nodes across the two
networks as “anchors” or “seed nodes”
• “Extend around” the seed nodes in a greedy fashion
Network Alignment
93

• How to identify high-scoring alignments? • Greedy seed and extend approaches
• Use the most “similar” nodes across the two
networks as “anchors” or “seed nodes”
• “Extend around” the seed nodes in a greedy fashion
Network Alignment
94
Network Alignment
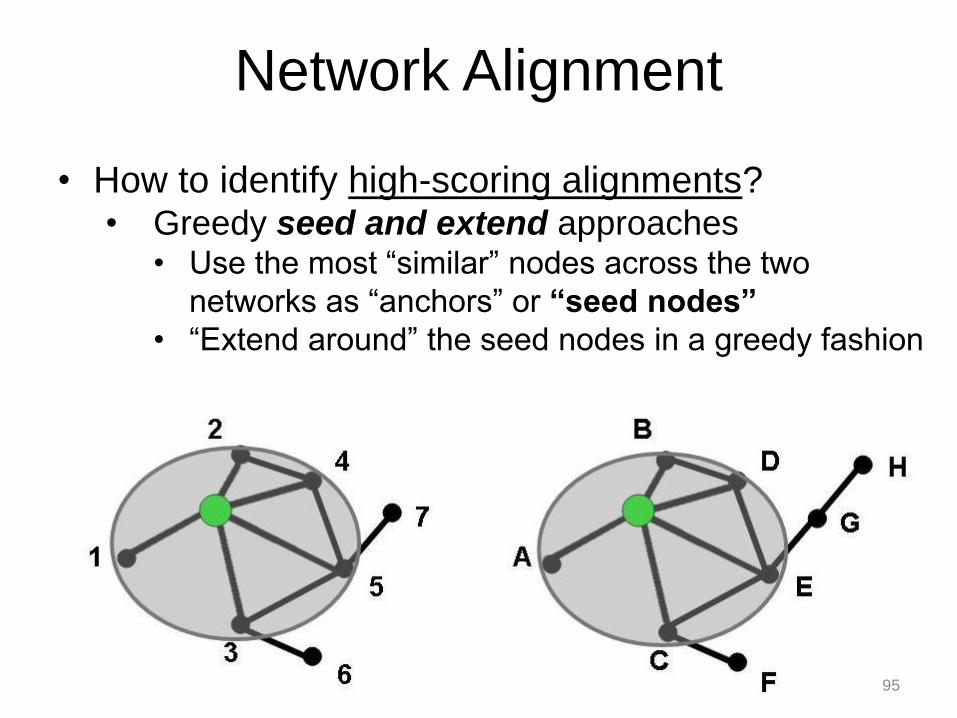
• How to identify high-scoring alignments? • Greedy seed and extend approaches
• Use the most “similar” nodes across the two
networks as “anchors” or “seed nodes”
• “Extend around” the seed nodes in a greedy fashion
95
Network Alignment
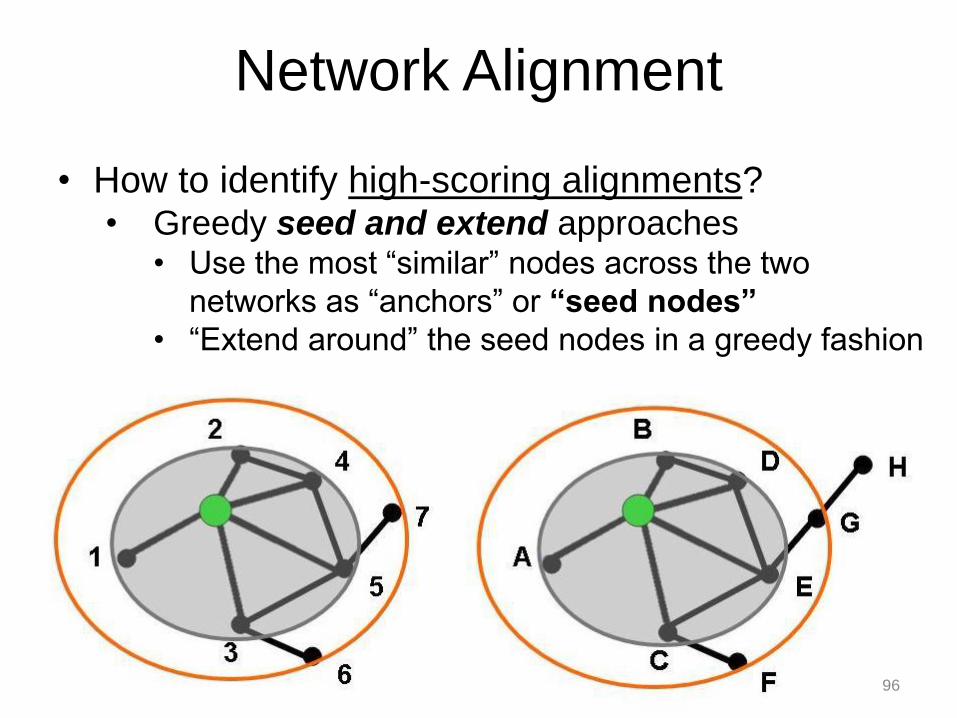
• How to identify high-scoring alignments? • Greedy seed and extend approaches
• Use the most “similar” nodes across the two
networks as “anchors” or “seed nodes”
• “Extend around” the seed nodes in a greedy fashion
96

Network Alignment
• How to identify high-scoring alignments? • Greedy seed and extend approaches
• Use the most “similar” nodes across the two
networks as “anchors” or “seed nodes”
• “Extend around” the seed nodes in a greedy fashion
97
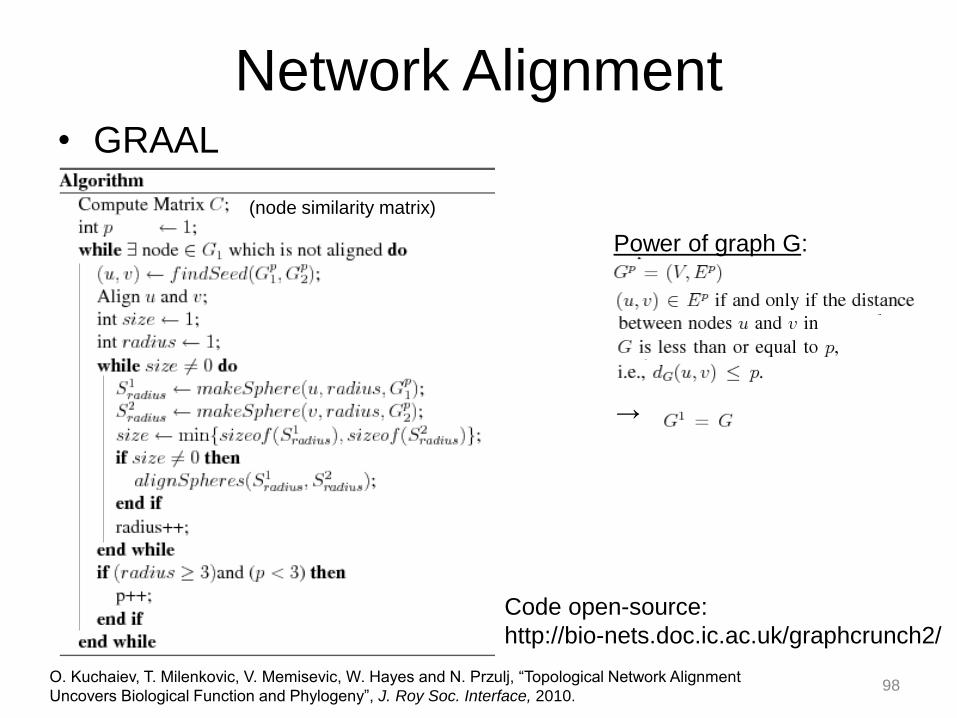
Network Alignment • GRAAL
(node similarity matrix)
O. Kuchaiev, T. Milenkovic, V. Memisevic, W. Hayes and N. Przulj, “Topological Network Alignment
Uncovers Biological Function and Phylogeny”, J. Roy Soc. Interface, 2010. 98
Power of graph G:
→
Code open-source:
http://bio-nets.doc.ic.ac.uk/graphcrunch2/
Network Alignment • GRAAL
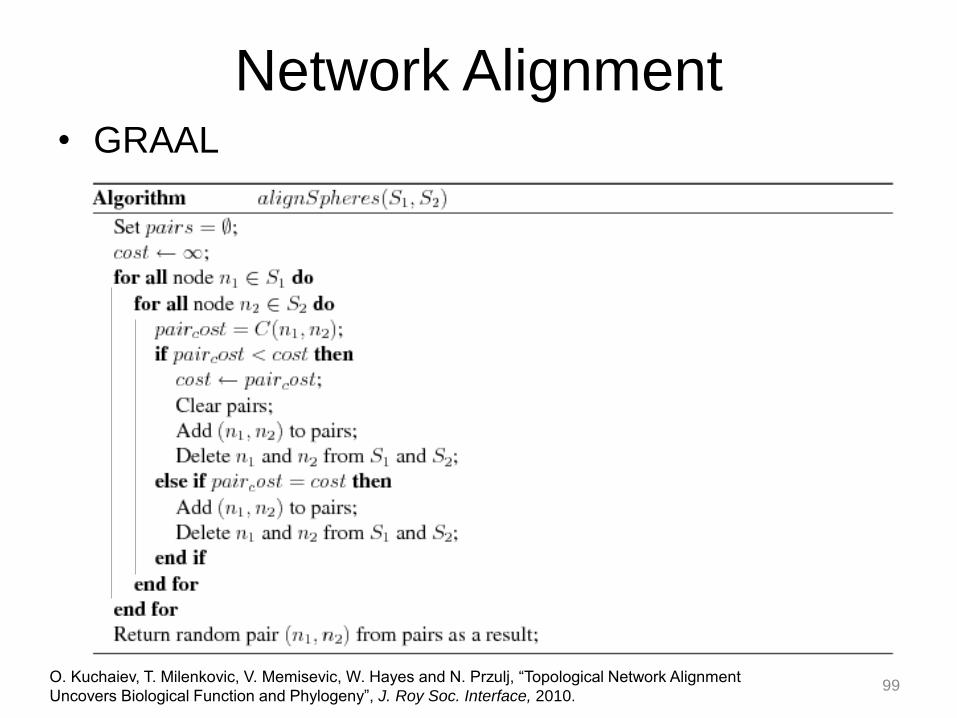
O. Kuchaiev, T. Milenkovic, V. Memisevic, W. Hayes and N. Przulj, “Topological Network Alignment
Uncovers Biological Function and Phylogeny”, J. Roy Soc. Interface, 2010. 99
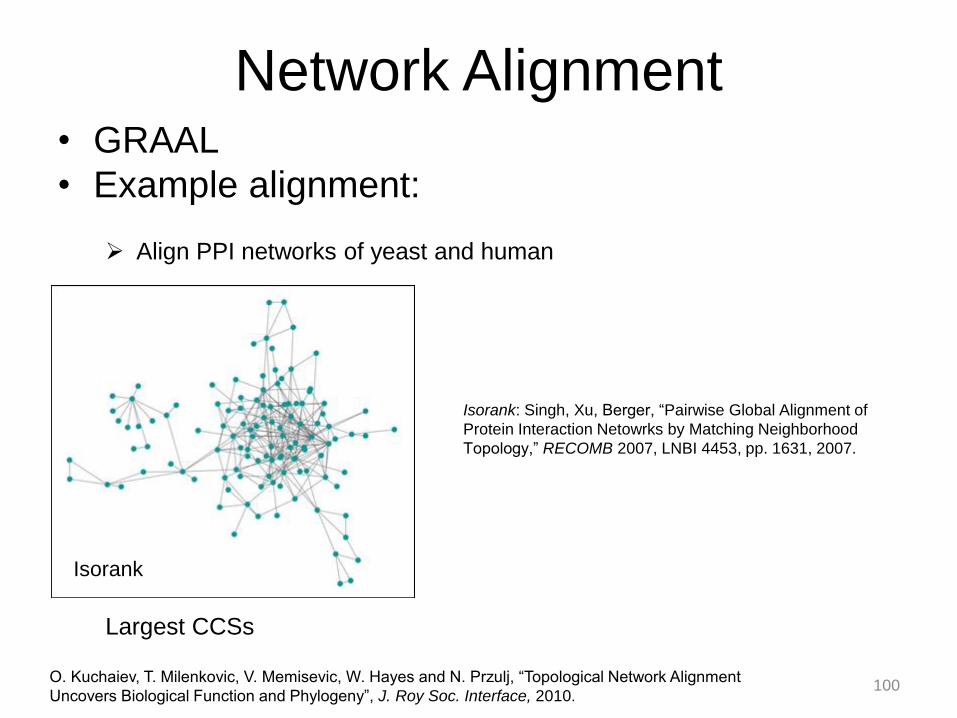
Network Alignment • GRAAL
• Example alignment:
O. Kuchaiev, T. Milenkovic, V. Memisevic, W. Hayes and N. Przulj, “Topological Network Alignment
Uncovers Biological Function and Phylogeny”, J. Roy Soc. Interface, 2010.
Align PPI networks of yeast and human
Isorank: Singh, Xu, Berger, “Pairwise Global Alignment of
Protein Interaction Netowrks by Matching Neighborhood
Topology,” RECOMB 2007, LNBI 4453, pp. 1631, 2007.
Isorank
Largest CCSs
100
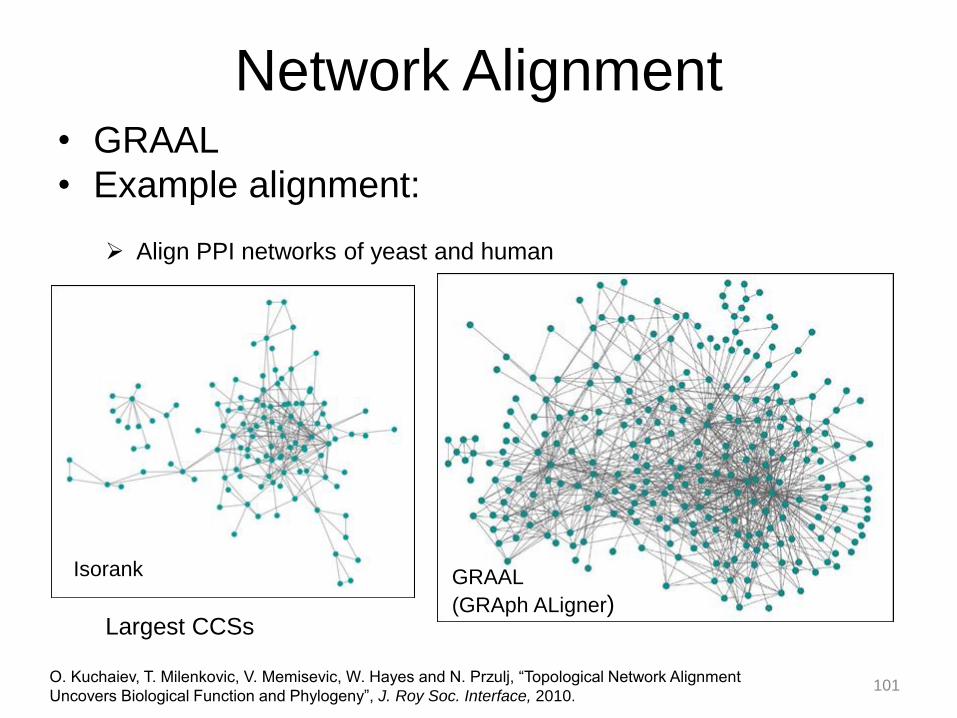
Network Alignment • GRAAL
• Example alignment:
O. Kuchaiev, T. Milenkovic, V. Memisevic, W. Hayes and N. Przulj, “Topological Network Alignment
Uncovers Biological Function and Phylogeny”, J. Roy Soc. Interface, 2010.
Align PPI networks of yeast and human
Isorank GRAAL
(GRAph ALigner) Largest CCSs
101
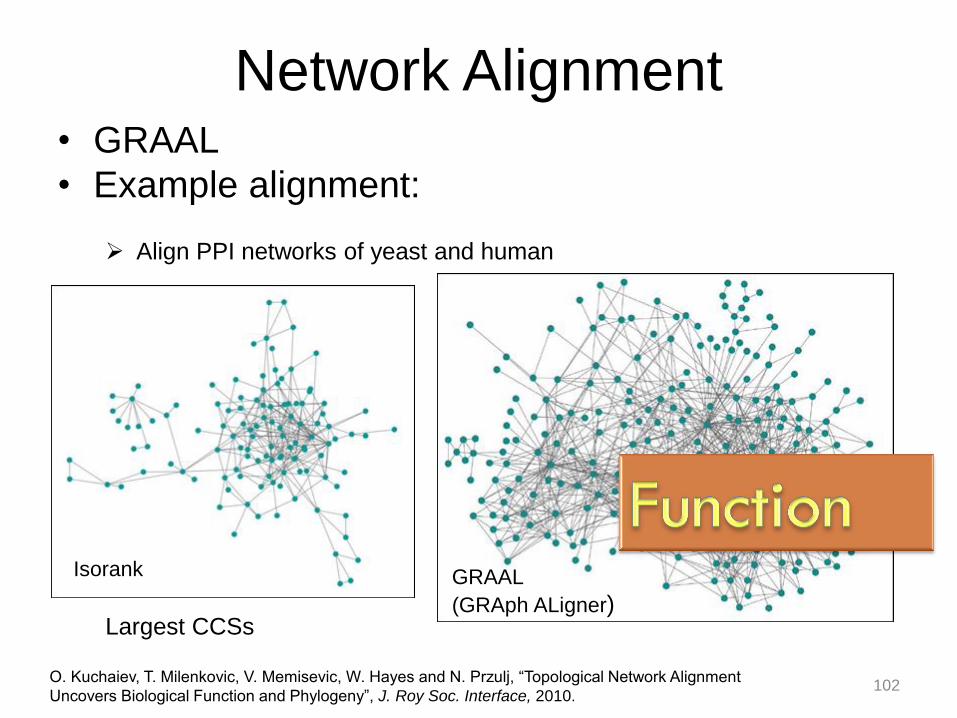
Network Alignment • GRAAL
• Example alignment:
O. Kuchaiev, T. Milenkovic, V. Memisevic, W. Hayes and N. Przulj, “Topological Network Alignment
Uncovers Biological Function and Phylogeny”, J. Roy Soc. Interface, 2010.
Align PPI networks of yeast and human
Isorank GRAAL
(GRAph ALigner) Largest CCSs
102

Network Alignment • GRAAL
• Example alignment:
O. Kuchaiev, T. Milenkovic, V. Memisevic, W. Hayes and N. Przulj, “Topological Network Alignment
Uncovers Biological Function and Phylogeny”, J. Roy Soc. Interface, 2010.
Align PPI networks of yeast and human
Isorank
GRAAL
(GRAph ALigner) Second largest CCSs
103

Network Alignment • GRAAL
• Example alignment:
O. Kuchaiev, T. Milenkovic, V. Memisevic, W. Hayes and N. Przulj, “Topological Network Alignment
Uncovers Biological Function and Phylogeny”, J. Roy Soc. Interface, 2010.
Align metabolic networks of Protists
104
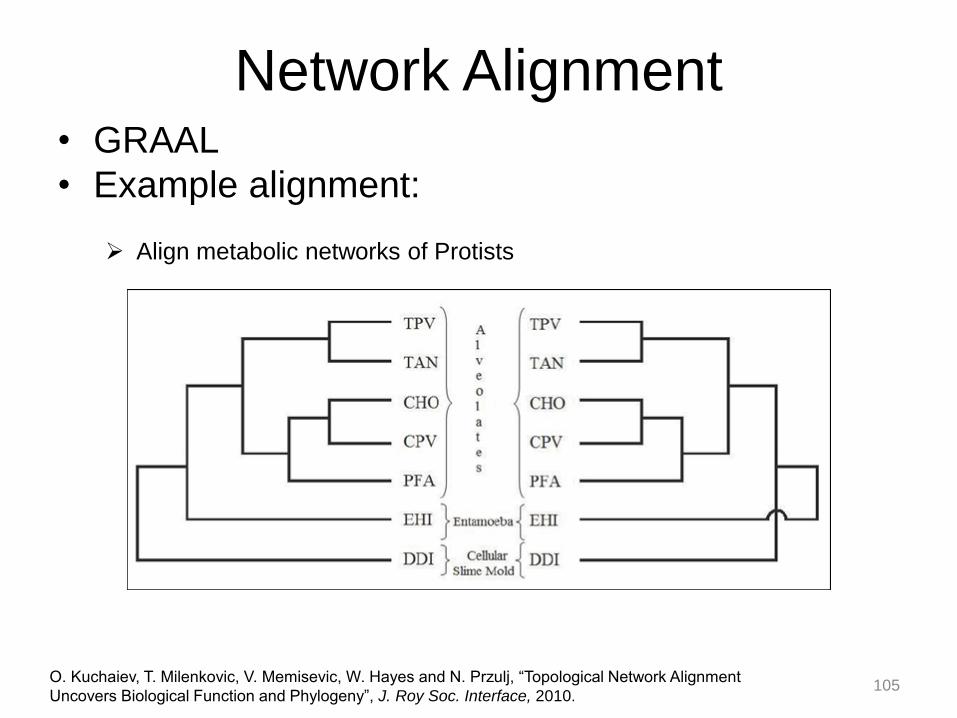
Network Alignment • GRAAL
• Example alignment:
O. Kuchaiev, T. Milenkovic, V. Memisevic, W. Hayes and N. Przulj, “Topological Network Alignment
Uncovers Biological Function and Phylogeny”, J. Roy Soc. Interface, 2010.
Align metabolic networks of Protists
105
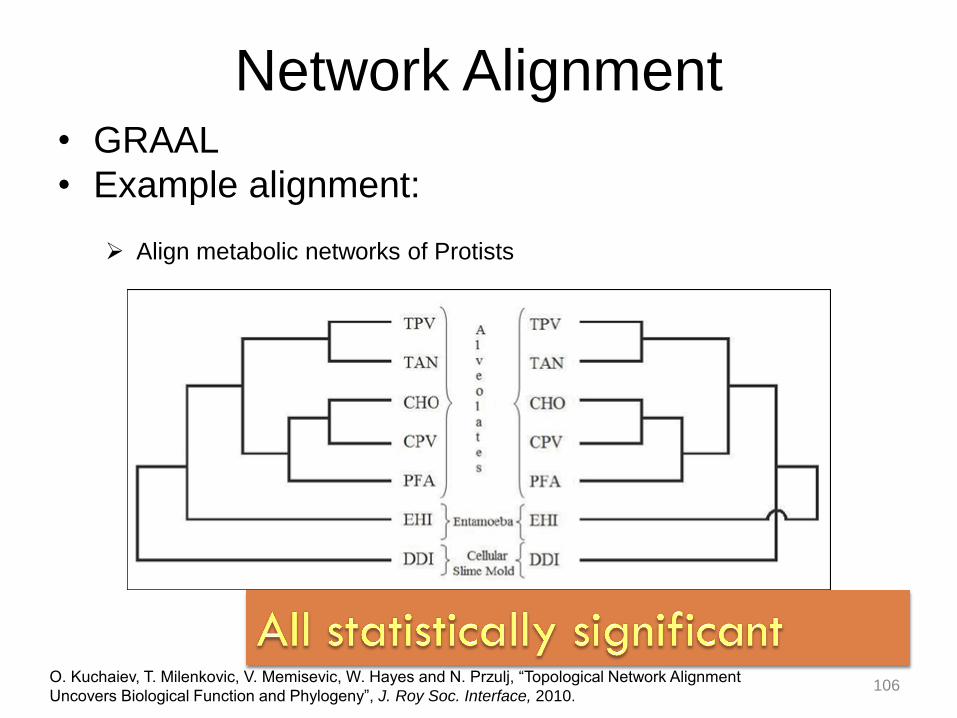
Network Alignment • GRAAL
• Example alignment:
O. Kuchaiev, T. Milenkovic, V. Memisevic, W. Hayes and N. Przulj, “Topological Network Alignment
Uncovers Biological Function and Phylogeny”, J. Roy Soc. Interface, 2010.
Align metabolic networks of Protists
106
Network Alignment
• How to identify high-scoring alignments? • Greedy seed and extend approaches
• Use the most “similar” nodes across the two
networks as “anchors” or “seed nodes”
• “Extend around” the seed nodes in a greedy fashion
• GRAAL – uses GDV similarity of nodes
• Finds an alignment
• Is it optimal (with respect to the cost function)?
107

Network Alignment
• How to identify high-scoring alignments? • Greedy seed and extend approaches
• Use the most “similar” nodes across the two
networks as “anchors” or “seed nodes”
• “Extend around” the seed nodes in a greedy fashion
• Alternative to matching nodes greedily based solely on
node similarity scores:
• Align two nodes only if this increases the current
alignment score • Reward matches (conserved interactions) – contribute to EC
• Penalize mismatches/gaps (insertions and deletions)
108
Network Alignment
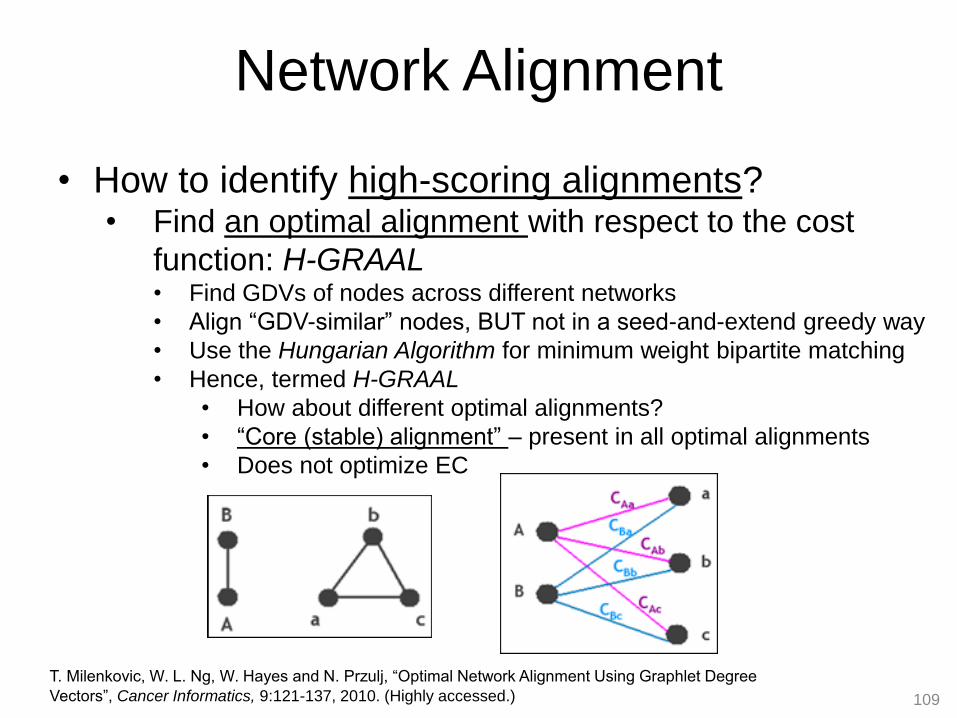
• How to identify high-scoring alignments? • Find an optimal alignment with respect to the cost
function: H-GRAAL • Find GDVs of nodes across different networks
• Align “GDV-similar” nodes, BUT not in a seed-and-extend greedy way
• Use the Hungarian Algorithm for minimum weight bipartite matching
• Hence, termed H-GRAAL
• How about different optimal alignments?
• “Core (stable) alignment” – present in all optimal alignments
• Does not optimize EC
109
T. Milenkovic, W. L. Ng, W. Hayes and N. Przulj, “Optimal Network Alignment Using Graphlet Degree
Vectors”, Cancer Informatics, 9:121-137, 2010. (Highly accessed.)
Network Alignment
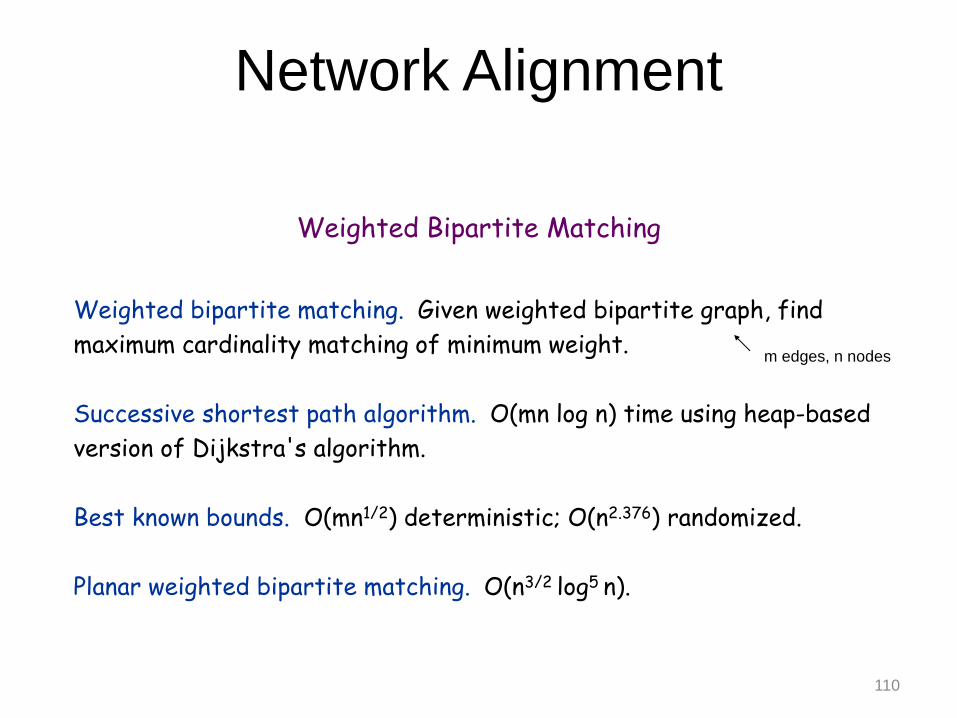
Weighted bipartite matching. Given weighted bipartite graph, find
maximum cardinality matching of minimum weight.
Successive shortest path algorithm. O(mn log n) time using heap-based
version of Dijkstra's algorithm.
Best known bounds. O(mn1/2) deterministic; O(n2.376) randomized.
Planar weighted bipartite matching. O(n3/2 log5 n).
Weighted Bipartite Matching
m edges, n nodes
110