Embed Size (px)
Citation preview
Running head: NETs mtDNA and metformin in SLE
NETs mitochondrial DNA and its autoantibody in Systemic Lupus
Erythematosus and a proof-of-concept trial of metformin
Haiting Wang, Ting Li, Sheng Chen, Yueying Gu, Shuang Ye
Supported by the Chinese Natural Science Foundation (grants 81072503)
Haiting Wang, MM, Ting Li, MD, Sheng Chen, MD, Yueying Gu, MD, Shuang Ye,
MD: Department of Rheumatology, Renji Hospital South Campus, School of
Medicine, Shanghai JiaoTong University, Shanghai 200001 China
Address correspondence to Shuang Ye, MD, Department of Rheumatology, Renji
Hospital South Campus, School of Medicine, Shanghai JiaoTong University, 145
Shandong C Rd, Shanghai 200001, China. E-mail:[email protected]
Full Length Arthritis & RheumatologyDOI 10.1002/art.39296
This article has been accepted for publication and undergone full peer review but has not beenthrough the copyediting, typesetting, pagination and proofreading process which may lead todifferences between this version and the Version of Record. Please cite this article as an‘Accepted Article’, doi: 10.1002/art.39296© 2015 American College of RheumatologyReceived: Nov 30, 2014; Revised: Jun 19, 2015; Accepted: Jul 16, 2015
This article is protected by copyright. All rights reserved.
2
Abstract
Objective.Neutrophil extracellular traps (NETs) are found to be important in systemic
lupus erythematosus (SLE) pathogenesis by activating plasmacytoid dendritic cells
(pDCs) and type I interferon (IFN) pathway. NETs composed of self-DNA are
considered of nuclear origin, and are a major source for anti-DNA autoantibody (Ab)
generation. This study evaluated whether mitochondrial DNA (mtDNA) reside in
NETs, and together with anti-mtDNA Abs cause dysregulation of pDC-IFN-α
pathway and its clinical implication in SLE.
Methods. Patients with SLE (n=102), rheumatoid arthritis (n=30) and healthy donors
(n=40) were enrolled in our in vitro studies. NETs were generated from phorbol
12-myristate 13-acetate (PMA)-stimulated peripheral neutrophils. Immunofluorescent
staining determined NETs formation ex vivo and in lupus nephritis (LN) renal biopsy
samples. mtDNA levels and type I IFN-inducible gene scores (IFN scores) were
measured by quantitative PCR. Anti-mtDNA Abs, anti-double strands (ds)-DNA Abs
and IFN-α were detected by enzyme-linked immunosorbent assay. Isolated NETs,
mtDNA or dsDNA, combined with anti-mtDNA or dsDNA IgG, and other culture
conditions were applied to stimulate purified pDCs. In the proof-of-concept trial,
another 113 SLE patients were enrolled. We evaluated the efficacy and safety of
metformin on a background of corticosteroids and conventional immunosuppressive
agents in patients with mild/moderate lupus. The primary endpoint was to measure the
efficacy of metformin on reducing disease flare.
Results. We first identified mtDNA in NETs and anti-mtDNA Abs was elevated in
Page 2 of 41
John Wiley & Sons
Arthritis & Rheumatology
This article is protected by copyright. All rights reserved.
3
SLE patients compared with controls and significantly correlated with IFN scores and
disease activity index. We next detected the presence of anti-mtDNA Abs was
disproportionately associated with lupus nephritis (LN), and correlated better than
anti-dsDNA Abs to LN activity index. mtDNA was deposited in NETs in LN renal
biopsies. In addition, mtDNA/anti-mtDNA was greater inducers of pDC IFN-α
production via TLR9 engagement than dsDNA/anti-dsDNA. We then assessed the
effect of an old drug, metformin, on down-regulating NET-mtDNA-pDC-IFNα
pathway. Metformin indeed decreased PMA-induced NET formation and
CpG-stimulated pDCs IFN-ɑ generation. Ultimately, a proof-of-concept trial that treat
mild/moderate SLE patients with metformin add-on resulted in decreased clinical
flare-up, prednisone exposure and body weight.
Conclusion. Our data establish a link between mtDNA in NETs, anti-mtDNA Abs,
and pDC-IFN-α pathogenesis in SLE, and highlight that specific strategies attempting
to down-regulate this pathway, like metformin, may turn out to be new approaches to
treat SLE.
Key words: systemic lupus erythematosus (SLE), lupus nephritis (LN), neutrophil
extracellular traps (NETs), mitochondrial DNA (mtDNA), plasmacytoid dendritic
cells (pDCs), type I interferon (IFN), metformin
Page 3 of 41
John Wiley & Sons
Arthritis & Rheumatology
This article is protected by copyright. All rights reserved.
4
The type I interferon (IFN) pathway plays a pivotal role in the pathogenesis of
systemic lupus erythematosus (SLE). It is well known that self-DNA and other
nuclear antigens, along with their autoantibodies (Abs), are potent stimulators of
natural IFN-α producing cells such as plasmacytoid dendritic cells (pDCs)(1).
Recently, neutrophil extracellular traps (NETs) were found to be important in SLE, as
they promote pDCs differentiation and activation (2,3). When NETs components,
including self-DNA and antimicrobial peptides, engage innate immunity pattern
recognition receptors, such as Toll-like receptor 9 (TLR9), they mediate pDC-IFN-α
pathway activation (4,5). NETs-DNA is thought to be of nuclear genomic origin. Our
first question was to determine whether NETs from SLE patients contained
mitochondrial DNA (mtDNA). Indeed, it was shown that mtDNA reside in NETs from
healthy donors (6). However, whether there is increased mtDNA residing in NETs in
lupus and the possible mechanistic relevance to the pDC-IFN-α pathway requires
further investigation.
Human mtDNA is a 16,569-nucleotide pair, closed circular molecule present in
the mitochondrial inner membrane where reactive oxygen species (ROS) are produced.
Compared with nuclear DNA, protected by histones, mtDNA is more vulnerable to
injury. mtDNA evolved from bacterial genomes and contains unmethylated
cytosine-phosphate-guanine (CpG) DNA repeats (7), which are highly potent TLR9
ligands (8,9). In addition, circulating mtDNA induces systemic inflammatory
syndrome that triggers profound tissue injury (10). Thus, the hypothesis that
NETs-mtDNA contributes to pDC-IFN-α pathway activation in SLE is plausible.
Page 4 of 41
John Wiley & Sons
Arthritis & Rheumatology
This article is protected by copyright. All rights reserved.
5
Furthermore, since an immune complex is likely required to facilitate the DNA
component accessing intracellular TLR-9, we investigated whether anti-mtDNA Abs
are present in SLE. This study investigated the clinical relevance of anti-mtDNA Abs
to the lupus phenotype and its possible synergistic effect with NETs-mtDNA.
Given the mechanistic relevance of NETs-mtDNA/Abs and pDC-IFN-α pathway
in SLE holds true, the next important question is to ask what would be our approach
to down-regulate this process? Metformin is the mainstay treatment for type 2
diabetes mellitus that has diverse mechanism of actions. Its anti-oxidative properties
(11) and anti-inflammatory effects (12), as well as excellent safety profile, make
metformin a convenient candidate in this regard. The formation of NET is
ROS-dependent (13, 14), while metformin can selectivity inhibit mitochondrial
respiratory chain complex I and decrease the NADPH oxidase activity, thus leading to
a decrease in ROS production (11). After in vitro experiments to observe the effect of
metformin on down-regulating NET-mtDNA-pDC-IFN-α pathway, we take one step
forward to design a randomized, proof-of-concept trial to evaluate the efficacy and
safety of metformin on a background of corticosteroids and conventional
immunosuppressive agents in patients with mild/moderate lupus.
MATERIALS AND METHODS
Clinical Study design
Patients
We enrolled age and sex matched SLE patients (n=102) , rheumatoid arthritis
patients (n=30) and healthy donors (n=40) in our in vitro studies. Another 113 SLE
Page 5 of 41
John Wiley & Sons
Arthritis & Rheumatology
This article is protected by copyright. All rights reserved.
6
patients were enrolled in the clinical trial. All SLE patients were at least 18 years old
and recruited from the Department of Rheumatology, Shanghai Renji Hospital,
fulfilled the American College of Rheumatology (ACR) classification criteria for SLE
(15). All patients’ clinical data were recorded including the assessment of SLE
Disease Activity Index (SLEDAI) (16). Other inclusion criteria in clinical trial were a
mild/moderate disease activity with no British Isles Lupus Assessment Group
(BILAG) A or no more than two B (17) and a stable treatment regimen with fixed
doses of prednisone (0-30 mg/day), antimalarial, or immunosuppressive drugs for at
least 30 days (cyclophosphamide for at least 6 months as an exception). The main
exclusion criteria in clinical trial were fulfill the diagnosis of diabetes (18); previous
treatment with any biological agents within 6 months; previous exposure of
metformin within 30 days before screening or previous history of intolerant to
metformin; pregnancy; current or recent infection. Of the 102 SLE patients in in vitro
experiment, 76 had LN, and renal biopsies were obtained in 38 patients. Subtypes of
LN and active/chronic index were documented according to the International Society
of Nephrology/Renal Pathology Society (ISN/RPS) 2003 classification criteria
(19).The research protocol was approved by the institutional review board of Renji
Hospital. All clinical investigations were performed according to the Declaration of
Helsinki.
Clinical trial design
Eligible patients for clinical trial were randomized in a 1:1 ratio to metformin
add-on or just conventional treatment by using random number table method. Subjects
Page 6 of 41
John Wiley & Sons
Arthritis & Rheumatology
This article is protected by copyright. All rights reserved.
7
randomized to metformin will receive a target dose of 500 mg three times daily.
Investigators were allowed to adjust the dose according to the patients’ tolerance. At
12 months, the average dose of metformin in the experimental group is 1078mg
(500mg to 1500mg). The regimen for conventional treatment was based on the
patient’s disease manifestations and was in accordance with standard of care.
Investigators tapered the prednisone dose on the basis of their clinical judgment. The
modified SELENA-SLEDAI Flare Index (SFI) (20, 21) and body weight were
assessed every 4 weeks with prescribed laboratory tests. Adverse events were
recorded at every study visit.
Endpoints
The primary endpoint was to evaluate the effect of metformin on reduction in
disease flare for patients with mild or moderate SLE with a common background of
corticosteroids and conventional immunosuppressive agents. The major secondary
endpoints were the influence of metformin on corticosteroid sparing effect and the
influence of metformin on patients’ body mass index (BMI).
This trial is registered with Chinese Clinical Trial Registry
(ChiCTR-TRC-12002419).
Neutrophil isolation and stimulation
Five ml of whole-blood was obtained from SLE patients and HDs using ACD
tubes (BD Vacutainer). Neutrophils were isolated immediately by a one-step gradient
centrifugation method using polymorphoprep (Axis-Shield). The mononuclear cell
layer was aspirated for total RNA extraction. The neutrophil layer was isolated, and
Page 7 of 41
John Wiley & Sons
Arthritis & Rheumatology
This article is protected by copyright. All rights reserved.
8
resuspended in RPMI 1640 supplemented with 10% fetal calf serum (FCS) at a
density of 5×10⁶ cells/ml (2). The preparation contained greater than 98% neutrophils
as confirmed by flow cytometry (FACS Calibur) using anti-CD15 antibody staining
(BD Bioscience). Trypan blue exclusion showed the viability was greater than 96%
for all preparations. Neutrophils were cultured in 24-well/96-well tissue culture plates.
Neutrophils were incubated with inhibitors 30 min before stimulation as indicated.
The NADPH oxidase inhibitor DPI (Calbiochem) was used at 5-10 µM and
metformin (Sigma) at 1-1000 µM. Phorbol 12-myristate 13-acetate (PMA, Sigma)
(10ng/ml) was added to form NETs, and the cells were incubated at 37 °C. After 3
hours of stimulation, cells were spun down and cell-free supernatant was collected.
Supernatants were stored at −20 °C until use.
Quantification of NETs
NETs generated by activated neutrophils were digested with 500 mU/ml
micrococcal nuclease (MNase; Worthington Biochemical Corp.). The nuclease
activity was stopped with 5 mM EDTA and the culture supernatants were collected
and stored at 4°C until further use. Picogreen (Invitrogen), a fluorescent DNA dye,
was added, and the DNA content was quantified by fluorescence spectrometry. The
relative fluorescence was then read with a fluorometer with filter setting of 480
(excitation)/520(emission). A standard curve was built with Lambda DNA Standard (2,
14).
NETs Triple/Double Immunofluorescence Staining
SLE and HD neutrophils were seeded on 0.001% poly-L-lysine covered slides,
Page 8 of 41
John Wiley & Sons
Arthritis & Rheumatology
This article is protected by copyright. All rights reserved.
9
and stimulated with PMA (20ng/ml) as described above. Cell membranes were stained
with calcein green AM (Invitrogen). For labeling of DNA,
4′,6-diamidino-2-phenylindole (DAPI) was used. mtDNA was stained using MitoSox
Red (5 µM, Invitrogen). Slides were mounted in Prolong Gold antifade media
(Molecular Probes) and examined with a Leica or Carl Zeiss confocal microscope.
Frozen sections from renal biopsy specimens were also stained accordingly.
DNA/RNA Isolation and quantitative PCR (qPCR)
DNA from supernatants of PMA-stimulated neutrophils was purified using
QIAamp® DNA Mini Kit (Qiagen). Nuclear DNA is undetectable in the supernatant,
as indicated by the Ct values (>30) of two genomic house-keeping genes (RPL13A
and GAPDH) (Supplementary Figure 1). A qPCR assay for measuring mtDNA copy
numbers was then set up. A specific human mitochondrial cytochrome oxidase b
(Cyto B) sequence was cloned and constructed into a PGM-T plasmid in order to
generate a standard curve (Supplementary Figure 2). Total RNA extracted from
peripheral blood mononuclear cells (PBMC) using Trizol Reagent (Invitrogen) was
reverse transcribed into cDNA with the Superscript II Reverse Transcriptase kit
(Takara, Shiga, Japan). The concentration of mtDNA and the transcriptional levels of
type I IFN-inducible genes (IFN-induced protein with tetratricopeptide repeats
[IFIT]1, IFIT3, myxovirus resistance 1 [Mx1], oligoadenylatesynthetase [OAS]1, and
lymphocyte antigen 6 complex, locus E [Ly6e]) were measured by SYBR Green
qPCR using Premix Ex TaqTM (Takara) via the ABI PRISM 7900 system (22).
Primer sequences are shown in Supplementary Table 1.
Page 9 of 41
John Wiley & Sons
Arthritis & Rheumatology
This article is protected by copyright. All rights reserved.
10
Anti-mtDNA Abs enzyme-linked immunosorbent assay (ELISA) and IgG
purification
Mitochondria were isolated from HD peripheral blood leukocytes using
Mitochondria Isolation Kit (Thermo). mtDNA was extracted from isolated
mitochondria using DNeasy Blood & Tissue kit (Qiagen). DNA Coating Solution
(Pierce) was used to immobilize mtDNA(4 µg/ml) on an ELISA plate. The coating
plate was incubated with 1/100 dilution of serum for 2 h at 37 °C. The secondary
antibody, anti-human IgG coupled with horseradish peroxidase, was added and
incubated for 1 h. Substrate solution was added thereafter. A microplate reader
determined the absorbance at 450 nm within 5 minutes after the addition of the Stop
Solution.
Anti-dsDNA Abs titers in serum were measured in parallel using an ELISA kit
(EUROIMMUN). Anti-mtDNA Abs predominant samples were arbitrarily defined as
having anti-mtDNA titers greater than 1.5 optical density (OD) value and anti-dsDNA
titers less than 0.4 OD value, while anti-dsDNA Abs predominant samples had
anti-dsDNA titers greater than 1.2 OD value and anti-mtDNA titers less than 1 OD
value. IgG from these samples or from HD sera were purified using a HiTrap protein
G HP column (GE Healthcare). Once purified, IgG was quantified using BCA Protein
Assay Kit (Pierce) and then stored at −80 °C (2).
Purification and activation of pDCs
HD Blood leukocytes (buffy coat) were obtained from Shanghai Veteran Blood
Station and fractionated over Ficoll gradients. pDCs were isolated from PBMCs using
Page 10 of 41
John Wiley & Sons
Arthritis & Rheumatology
This article is protected by copyright. All rights reserved.
11
a negative selection kit (Diamond Plasmacytoid Dendritic Cell Isolation Kit, Miltenyi
Biotec). The preparation contained greater than 98% pDCs as confirmed by flow
cytometry using anti-CD123 and CD304 antibody (Miltenyi Biotec) staining. pDCs
were cultured at a density of 5×10⁴ cells per well in 96-well plates in 200 µl of
complete RPMI supplemented with 10% FCS and stimulated overnight before IFN-α
was measured. The TLR9 agonist CpG-2216 (1 µg/ml) and TLR7 agonist R837 (10
µg/ml) were added (both from InvivoGen). Metformin (1-100 µM) was added 30 min
before stimulating with CpG-2216 as indicated. Other conditions included mtDNA,
dsDNA (human peripheral blood leukocytes genome DNA), anti-mtDNA-IgG (10
µg/ml), anti-dsDNA-IgG (10 µg/ml), control IgG (10 µg/ml), supernatants from
PMA-stimulated SLE neutrophils with or without DNase I (Sigma) (6 U/ml). IFN-α
was measured by an ELISA kit (PBL Biomedical Laboratories).
Statistical analysis
An intent-to-treat approach was used for the analysis of primary and secondary
outcomes in the clinical trial. On the basis of previous reports and the clinical opinion
of the principal investigator, it was estimated that 50 percent of the patients in
conventional treatment group would have an increase in objective manifestations of
disease within 12 months (23). A 50 percent reduction in the rate of clinical flare-ups
was considered of clinically significance. For an alpha error of 0.05(two-side) and a
beta error of 0.20, the estimated sample needed was 57 subjects per group.
Two-tailed Student’s t-test test, chi-square analysis and Spearman correlation
were performed where indicated. For flare-free survival data, the Mantel-Cox test was
Page 11 of 41
John Wiley & Sons
Arthritis & Rheumatology
This article is protected by copyright. All rights reserved.
12
conducted. For these tests, P ≤ 0.05 was deemed significant.
RESULTS
The presence of mtDNA in NETs and anti-mtDNA Abs in sera are greatly
enhanced in active SLE patients and correlate with disease activity. Neutrophils
isolated from the blood of SLE patients and HDs were stimulated with PMA to induce
NETs formation. Combined two-color DNA (Sytox Red) and cell membrane (calcine
green) staining suggested SLE neutrophils underwent more extensive NETosis
(Figure 1A), as evidenced by significant web-like structure formation and higher
quantity of NETs measured by DNA fluorescence, all in line with previous reports (3,
24). Then qPCR was used to measure whether NETs DNA release contained mtDNA
sequences. Significantly increased mtDNA copies were observed in the supernatants
of PMA-stimulated neutrophils from SLE patients (n=63) versus HDs (n=24) (Figure
1B). It is noteworthy that the circulating mtDNA in plasma was significantly higher in
lupus patients, about one order of magnitude, than in HDs (Figure 1C), albeit there is
no statistically significant correlation between NETs-mtDNA and plasma mtDNA
(p=0.0799; r=0.2018). More importantly, NETosis released mtDNA levels were
positively correlated with SLE disease activity, as determined by SLEDAI and IFN
scores (Figure 1D).
Since abundant NETs comprise a major source of autoantigens in SLE, we
measured anti-mtDNA Abs in the sera of SLE patients (n=102) and controls.
Forty-one percent of SLE patients were positive for anti-mtDNA Abs (determined by
mean plus two times SD from 40 HDs with a cutoff OD value = 1.311). In
Page 12 of 41
John Wiley & Sons
Arthritis & Rheumatology
This article is protected by copyright. All rights reserved.
13
comparison, none of the RA (n=30) controls displayed a positive serology response to
mtDNA (Figure 2A). Additionally, the titers of anti-mtDNA Abs were also associated
with SLE patient PBMC IFN scores and SLEDAI (Figure 2B). Interestingly, the
levels of anti-mtDNA Abs significantly correlated with classic anti-dsDNA Abs titers
measured by ELISA (Figure 2B). Not surprisingly, anti-mtDNA Abs was associated
with LN phenotype similar to anti-dsDNA Abs (Supplementary Table 2). To further
discriminate the function of anti-mtDNA and anti-dsDNA Abs, we obtained the
samples according to arbitrarily defined different specificities (Figure 2B, boxed area)
and purified their IgG for further in vitro study.
NETs mtDNA and anti-mtDNA Abs are associated with active lupus nephritis.
As the major phenotype of SLE, the impairment of NETs degradation was implicated
in LN patients (24). We analyzed renal biopsy samples from LN patients by in situ
immunofluorescent staining, to determine the presence of NETs-mtDNA in the renal
biopsy tissue. We detected NETs by staining with a DNA dye (DAPI), a specific
mtDNA dye (MitoSOX Red) and an anti-myeloperoxidase (MPO) antibody. NETs
components, especially mtDNA and MPO, were colocalized in close proximity to
neutrophil infiltrates in affected glomeruli (Figure 2C) compared with normal kidney
tissues which were obtained from a nephrectomy sample distant to tumor tissues
(Figure 2C). In addition, the presence of anti-mtDNA Abs was disproportionately
associated with active disease rather than chronic lesions among proliferative LN
(class III or IV with/without V) (Figure 2D).Moreover, anti-mtDNA Abs was more
frequently present in the serum of patients with significant manifestation of
Page 13 of 41
John Wiley & Sons
Arthritis & Rheumatology
This article is protected by copyright. All rights reserved.
14
proteinuria (Figure 2E). Although anti-dsDNA Abs had a similar correlation,
anti-mtDNA Abs had a better performance in terms of correlation with LN activity
index and the quantity of proteinuria (Figure 2F and Supplementary Figure 3). These
results indicate that mtDNA in NETs and anti-mtDNA autoantibodies are probably
involved in LN.
mtDNA and anti-mtDNA Abs are stronger inducers of pDC-IFN-α
production than dsDNA and anti-dsDNA Abs. NETs components, such as
antimicrobial peptide (LL37, HNPs) coated DNA, are potent pDC-IFN-α inducers (3,
25). We evaluated the specific role of mtDNA and anti-mtDNA in this process. First,
free human mtDNA(40 µg/ml) or dsDNA (40 µg/ml) alone was unable to activate
pDCs. However, pDCs were activated when human mtDNA or dsDNA was
complexed with their antibody IgG (10 µg/ml) purified from SLE serum. These data
are consistent with previous reports (4, 5) that demonstrated the Fc portion of IgG
from SLE patients serum interacts with CD32 (FcγRII) on pDCs and delivers DNA to
intracellular pools of TLR9. It is noteworthy that mtDNA complexed with
SLE-derived anti-mtDNA IgG (10 µg/ml) promotes pDCs to secrete more IFN-α than
dsDNA/anti-dsDNA complexes (Figure 3A). pDC-IFN-α production induced by
DNA/anti-DNA complexes occurs in a DNA dose-dependent manner, and
mtDNA/anti-mtDNA are more potent IFN-α inducers compared with
dsDNA/anti-dsDNA (Figure 3B). We then used NETs, i.e., cell-free supernatants of
PMA-activated neutrophils, isolated from SLE patients to stimulate pDCs. These
supernatants induced substantial levels of IFN-α in pDCs (Figure 3C) (3). As
Page 14 of 41
John Wiley & Sons
Arthritis & Rheumatology
This article is protected by copyright. All rights reserved.
15
predicted, IFN-α production was greatly enhanced by the addition of anti-DNA IgG
purified from SLE patients serum, but not by IgG from HDs. IFN-α levels were
doubled when induced by NETs with anti-mtDNA IgG versus anti-dsDNA IgG
(Figure 3C). We then depleted DNA (mtDNA or nuclear DNA) using DNase I (6
U/ml), which abrogated over 90% of NETs/anti-mtDNA-stimulated pDCs IFN-α
producing activity. DNase I eliminated the IFN-α inducing effect of CpG-2216, a
synthetic TLR9 agonist, as opposed to the lack of effect on TLR7-induced IFN-α
production by a TLR7 agonist (R837) (Figure 3D). This further demonstrates that the
DNA component of NET is required for pDC-IFN-α activation in a TLR-9 dependent
manner, and that mtDNA is more efficient than dsDNA in the immune complex that
promotes this process.
Metformin down-regulates NETs/mtDNA-pDC-IFN-α pathway. We examined
the effect of metformin on PMA-induced NET production in purified peripheral blood
neutrophils from heathy donors. Pretreatment of neutrophils with metformin before
addition of PMA inhibited NET formation in a concentration-dependent manner
(Figure 4A). The viability of neutrophils is not changed by metformin and there is no
apoptosis as stained with FITC-conjugated Annexin V and propidium iodide (PI)
(Supplementary Figure 4). NETosis is dependent on ROS production and the NADPH
oxidase inhibitor diphenyleneiodonium (DPI) prevented NET formation upon
activation with PMA, which was used as a positive control. NET-DNA release by
metformin pretreated neutrophils showed a significant decrease after 40 min of PMA
activation (Figure 4B). Metformin decreased mtDNA copies in NETs by 57% at 40
Page 15 of 41
John Wiley & Sons
Arthritis & Rheumatology
This article is protected by copyright. All rights reserved.
16
minutes after PMA stimulation as compared with neutrophils treated with PMA
alone(Figure 4C). In addition, metformin can inhibits CpG or mtDNA/anti-mtDNA
Abs stimulated IFN-α generation by pDCs and the effect is in a dose dependent
manner (Figure 4D-E); Within the pharmacologic meaningful range (5~50µM), the
IFN-ɑ production is reduced by 50~80%. Therefore, we carried on a proof-of-concept
clinical trial to evaluate the efficacy and safety of metformin add-on to a background
of corticosteroids and conventional immunosuppressive agents in mild/moderate
lupus patients.
Metformin can reduce clinical flare, prednisone exposure and body weight in
SLE patients. From Sept 1, 2012, to Jul 1, 2014, 113 patients with systemic lupus
erythematosus were randomly assigned to add-on metformin (n=56) or just
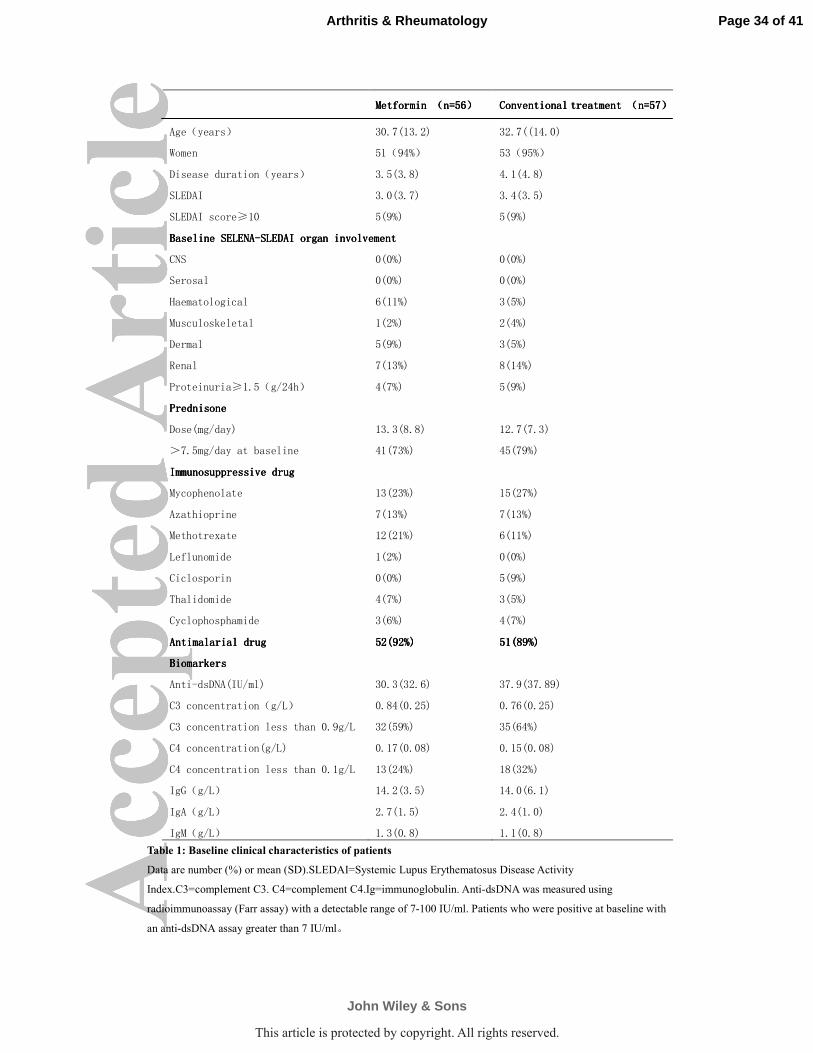
conventional treatment (n=57). Supplementary table 3 shows the trial profile. The two
groups did not differ in any of the main baseline characteristics including the
exposure of immunosuppressive agents (table 1). The rate of disease flares was
reduced during 12 months with metformin group, when assessed with SLEDAI and
SFI (figure 5A). The relative risk of SFI in patients receiving metformin was 0.49
(95% CI: 0.26, 0.96; P=0.04), in other words, add-on metformin reduced the risk of
disease flares by 51% over conventional treatment. In the meantime, the prednisone
exposure in the metformin add-on group is lower than conventional treatment group.
The proportions of patients with at least a 50% reduction in prednisone dose were
significantly greater with metformin at every visit from weeks 16 to 24 and week 32
(figure 5B).The tapering of prednisone from the baseline was significantly greater in
Page 16 of 41
John Wiley & Sons
Arthritis & Rheumatology
This article is protected by copyright. All rights reserved.
17
the metformin add-on group than in the conventional treatment group at week 24, 32
and 48 (figure 5C), however the overall exposure of prednisone (area under the curve)
is lower, the statistical significance cannot be appreciated .
The mean change in body weight index (BMI) between metformin add-on group
and conventional treatment group reached statistical significance from the 8th week to
the completion of the study (figure 5D). There is an increase of body weight of
conventional treatment group during the first 24 weeks and go plateau thereafter,
while the BMI of metformin add-on group continued to decline.
In the metformin add-on group, three patients discontinued the study because of
side effects. Two patients complained of nausea and diarrhea and one experienced
slightly alanine transaminase elevated (less than two times the upper limit of normal)
during the dose escalation. After stopping metformin, these symptoms disappeared.
Metformin administration caused minimal side effects in five of 56 subjects finishing
the follow up. These patients complained of mild GI discomfort, which resolved with
reduction of the dose. No hypoglycemia, lacticacidosis and other serious adverse
reaction were reported.
DISCUSSION
In the current study, we are trying to draw lines to connect several established or
unestablished dots, i.e.,NETosis, mtDNA along with its autoantibody, and pDC-IFN-α
pathway, for a better understanding of part of the pathogenesis of SLE.
NETosis is a neutrophil-specific form of cell death. Unlike apoptosis or necrosis,
NETosis is characterized by the formation of NETs. Composed of DNA, histones and
Page 17 of 41
John Wiley & Sons
Arthritis & Rheumatology
This article is protected by copyright. All rights reserved.
18
antimicrobial peptides, NETs amplify pDC-IFN-α pathway activation in SLE, and act
as a major source of lupus auto antigens(2,3). A recent study constructed an in vivo
model[Cl-amidine treated New Zealand mixed 2328 (NZM) mice], to test this widely
accepted concept. NZM mice is a model of lupus relevant to type I IFNs and
replicates a number of the features of aberrant of NET formation in human lupus.
Treatment of NZM mice with a chemical inhibitor of NET improved the lupus
phenotype (26). These previous observations highlight the role of NETosis in the
pathogenesis of SLE.
Mitochondria are endosymbionts that originated from purple bacteria
approximately 1.5×10⁹
years ago and are the only organelle of the mammalian cell
that contains its own DNA except for the nucleus. It is hardly a surprise that mtDNA
is present in NETs. Indeed, mtDNA, but not nuclear DNA, first joins NETs formation
when neutrophils are still viable (6). It is possible that mitochondria and mtDNA are
actively involved in the process of NETosis. As an example, pharmacological or
genetic approaches to block ROS production suggested that NET formation is ROS
dependent (6), while mitochondria are both the source and target of ROS (27). The
precise mechanism of mitochondria and mtDNA involvement in NETosis is still
undetermined. Nonetheless, our data, for the first time, provide direct evidence that
mtDNA release by netting neutrophils is greatly enhanced in SLE patients. mtDNA
contains a higher frequency of unmethylated CpG dinucleotides, similar to bacterial
DNA, which can promote innate immune responses through TLR9 (8, 9). Our data
further confirmed that NETs-mtDNA, in the presence of its autoantibodies, are
Page 18 of 41
John Wiley & Sons
Arthritis & Rheumatology
This article is protected by copyright. All rights reserved.
19
two-fold more potent compared with nuclear (ds) DNA in terms of inducing pDCs
IFN-α production. One of the technical limitations of this study is that the possibility
of cross-reaction and difference in affinity between the anti-mtDNA and anti-dsDNA
antibodies. To develop monoclonal antibody against mtDNA will be our next step to
solve this problem.
Anti-mtDNA Abs was detected in over 40% SLE patients in this study. Both
NETs mtDNA and serum anti-mtDNA Abs correlated with disease activity and the
presence of a type I IFN response. Anti-mtDNA Abs, but not NETs-mtDNA or
circulating mtDNA (data not shown), were associated with active LN. Our data
suggested that anti-mtDNA Abs might have biomarker value, along with the classic
anti-dsDNA Abs, as a panel of anti-DNA Abs in SLE, which could provide useful
information both relevant to renal involvement and IFN-signature responses. To
validate the performance of anti-mtDNA Abs, large-scale clinical studies are
warranted. Our in vitro study was consistent with a previous report that NETs
DNA-containing immune complexes (with anti-DNA Abs) stimulated pDCs to
produce type I IFN via a FcγR and TLR9 dependent pathway (5). Our in situ data, i.e.,
co-localization of mtDNA in NETs structures in LN samples, in line with previous
studies in LN (24, 28) indicated that NETs/mtDNA could be actively involved in
immune-mediated renal injury.
Various studies bas highlighted the role of metformin in autoimmune
inflammatory disease (29-32). In our in vitro study, we showed that metformin
decreased NET-DNA release and NET-mtDNA copies in cultured neutrophils.
Page 19 of 41
John Wiley & Sons
Arthritis & Rheumatology
This article is protected by copyright. All rights reserved.
20
Moreover, CpG-stimulated pDCs IFN-α generation were inhibited by 50~80% by
metformin within the pharmacologic meaningful range (5~50µM). Therefore, our
hypothesis is that metformin may serve as an adjunct treatment to reduce SLE disease
activity.
In our clinical trial, the frequency of SFI flares of patients in metformin add-on
group was 51% less compared to those patients in conventional treatment group.
Metformin displayed steroid-sparing effects, although no statistical difference was
observed in the overall exposure of prednisone between the two groups. Without any
directed caloric restriction or increase in habitual exercise, metformin also effectively
reduced body weight in SLE patients which has positive impact both on patients’
well-being and cardiovascular risk. Whether metformin could reduce the
cardiovascular events in SLE patients deserves further long term investigation. One of
the major limitations of the current study is the open-label, non-blinded design
without a placebo arm, which introduces certain bias; nevertheless, metformin can
reduce SLE flares without compensating by more prednisone exposure,
self-sufficiently suggested its therapeutic effect. Another limitation is that whether
metformin could down-regulate NETosis, mtDNA release, and IFN-α signature in
vivo was not addressed in the proof-of-concept trial. In fact, the effect of metformin is
probably multi-facet and other types of immune cells maybe affected. As an example,
Yin, et al., recently reported that metformin could restore lupus CD4+ T cell function
in vitro and reverse lupus phenotype in animal models through tuning T cell
metabolism (33).
Page 20 of 41
John Wiley & Sons
Arthritis & Rheumatology
This article is protected by copyright. All rights reserved.
21
Taken together, we believe that specific strategies interrupting the NETs-mtDNA
orchestrated type I IFN pathway might be a novel approach to treat SLE and
metformin is a promising choice that deserve further multicenter, randomized placebo
controlled trial.
ACKNOWLEDGMENTS
We thank Drs. Cristina Tacu, L. Chen, X. X. Chen, G. L.Chen, L. Guo, Z. N.
Wang, C. Lin,and P. Ye for their contributions to this study.
AUTHOR CONTRIBUTIONS
All authors were involved in drafting the article or revising itcritically for
important intellectual content, and all authors approvedthe final version to be
published. Dr. Ye had full access to all of thedata in the study and takes responsibility
for the integrity of the dataand the accuracy of the data analysis.
Study conception and design.Ye.
Acquisition of data.Wang, Li, Chen, Gu.
Analysis and interpretation of data.Wang, Ye.
REFERENCES
1. Wahren-Herlenius M, Dörner T. Immunopathogenic mechanisms of systemic
autoimmune disease. The Lancet, 2013;382: 819-831.
2. Garcia-Romo GS, Caielli S, Vega B, Connolly J, Allantaz F, Xu Z, et al. Netting
neutrophils are major inducers of type I IFN production in pediatric systemic
lupus erythematosus. SciTransl Med 2011;3:73ra20.
Page 21 of 41
John Wiley & Sons
Arthritis & Rheumatology
This article is protected by copyright. All rights reserved.
22
3. Lande R, Ganguly D, Facchinetti V, Frasca L, Conrad C, Gregorio J,et al.
Neutrophils activate plasmacytoid dendritic cells by releasing self-DNA–peptide
complexes in systemic lupus erythematosus. SciTransl Med 2011;3:73ra19.
4. Båve U, Magnusson M, Eloranta ML, Perers A, Alm GV, Rönnblom L, et al.
FcγRIIa is expressed on natural IFN-α-producing cells (plasmacytoid dendritic
cells) and is required for the IFN-α production induced by apoptotic cells
combined with lupus IgG. J Immunol 2003;171:3296-3302.
5. Means TK, Latz E, Hayashi F, Murali MR, Golenbock DT, Luster AD. Human
lupus autoantibody–DNA complexes activate DCs through cooperation of CD32
and TLR9. J Clin Invest 2005;115:407-417.
6. Yousefi S, Mihalache C, Kozlowski E, Schmid I, Simon HU. Viable neutrophils
release mitochondrial DNA to form neutrophil extracellular traps. Cell Death
Differ 2009;16:1438-1444.
7. Cardon LR, Burge C, Clayton DA, Karlin S. Pervasive CpG suppression in
animal mitochondrial genomes. ProcNatlAcadSci USA 1994;91:3799-3803.
8. Hemmi H, Takeuchi O, Kawai T, Kaisho T, Sato S, Sanjo H, et al. A Toll-like
receptor recognizes bacterial DNA. Nature 2000;408:740-745.
9. Bauer S, Kirschning CJ, Häcker H, Redecke V, Hausmann S, Akira S, et al.
Human TLR9 confers responsiveness to bacterial DNA via species-specific CpG
motif recognition. ProcNatlAcadSci USA 2001;98:9237-9242.
10. Zhang Q, Raoof M, Chen Y, Sumi Y, Sursal T, Junger W, et al. Circulating
mitochondrial DAMPs cause inflammatory responses to injury. Nature
Page 22 of 41
John Wiley & Sons
Arthritis & Rheumatology
This article is protected by copyright. All rights reserved.
23
2010;464:104-107.
11. Viollet B, Guigas B, Garcia N S, et al. Cellular and molecular mechanisms of
metformin: an overview. Clinical science, 2012, 122(6): 253-270.
12. Mahmood K, Naeem M, Rahimnajjad N A. Metformin: The hidden chronicles of
a magic drug. European journal of internal medicine, 2012.
13. Brinkmann V, Zychlinsky A. Beneficial suicide: why neutrophils die to make
NETs. Nature Reviews Microbiology, 2007, 5(8): 577-582.
14. Fuchs, T. A. et al. Novel cell death program leads to neutrophil extracellular
traps. J. Cell Biol.176, 231–241 (2007).
15. Hochberg MC. Updating the American College of Rheumatology revised criteria
for the classification of systemic lupus erythematosus. Arthritis Rheum 1997; 40:
1725.
16. Bombardier C, Gladman DD, Urowitz MB, Caron D, Chang CH. Derivation of
the SLEDAI. A disease activity index for lupus patients. Arthritis Rheum
1992;35:630-640.
17. Isenberg DA, Gordon C. From BILAG to BLIPS—disease activity assessment in
lupus past, present and future. Lupus 2000; 9: 651–54.
18. World Health Organization: Definition, diagnosis and classification of diabetes
mellitus and its complications: Report of a WHO Consultation. Part 1. Diagnosis
and classification of diabetes mellitus. Geneva, World Health Organization, 1999
19. Weening JJ, D'Agati VD, Schwartz MM, Seshan SV, Alpers CE, Appel GB, et al.
The classification of glomerulonephritis in systemic lupus erythematosus
Page 23 of 41
John Wiley & Sons
Arthritis & Rheumatology
This article is protected by copyright. All rights reserved.
24
revisited. Kidney Int 2004;65:521-530.
20. Petri M, Kim MY, Kalunian KC, et al. Combined oral contraceptives in women
with systemic lupus erythematosus. N Engl J Med 2005; 353: 2550–58.
21. Petri M, Buyon J, Kim M. Classification and definition of major flares in SLE
clinical trials.Lupus 1999; 8: 685–91.
22. Kirou KA, Lee C, George S, Louca K, Papagiannis IG, Peterson MG, et al.
Coordinate overexpression of interferon-α–induced genes in systemic lupus
erythematosus. Arthritis Rheum 2004;50:3958-3967.
23. konas E., Joseph L., Esdaile J.M., Choquette D., Senecal J.L., Cividino A., et al.
(1998) A long-term study of hydroxychloroquine withdrawal on exacerbations in
systemic lupus erythematosus. The Canadian Hydroxychloroquine Study Group.
Lupus 7: 80–85
24. Hakkim A, Fürnrohr BG, Amann K, Laube B, Abed UA, Brinkmann V, et al.
Impairment of neutrophil extracellular trap degradation is associated with lupus
nephritis. ProcNatlAcadSci USA 2010;107:9813-9818.
25. Lande R, Gregorio J, Facchinetti V, Chatterjee B, Wang YH, Homey B, et al.
Plasmacytoid dendritic cells sense self-DNA coupled with antimicrobial peptide.
Nature 2007;449:504-509.
26. Knight JS, Zhao W, Luo W, Subramanian V, O’Dell AA, Yalavarthi S, et al.
Peptidylargininedeiminase inhibition is immunomodulatory and
vasculoprotective in murine lupus. J Clin Invest (2013) 123:2981–93.
doi:10.1172/JCI67390
Page 24 of 41
John Wiley & Sons
Arthritis & Rheumatology
This article is protected by copyright. All rights reserved.
25
27. Simon HU, Haj-Yehia A, Levi-Schaffer F. Role of reactive oxygen species (ROS)
in apoptosis induction. Apoptosis 2000;5:415-418.
28. Villanueva E, Yalavarthi S, Berthier CC, Hodgin JB, Khandpur R, Lin AM, et al.
Netting neutrophils induce endothelial damage, infiltrate tissues, and expose
immunostimulatory molecules in systemic lupus erythematosus. J Immunol
2011;187:538-552.
29. Nath N, Khan M, Paintlia M K, et al. Metformin attenuated the autoimmune
disease of the central nervous system in animal models of multiple sclerosis[J].
The Journal of immunology, 2009, 182(12): 8005-8014.
30. Kalariya N M, Shoeb M, Ansari N H, et al. Antidiabetic drug metformin
suppresses endotoxin-induced uveitis in rats[J]. Investigative Ophthalmology
&Visual Science, 2012, 53(7): 3431-3440.
31. Arai M, Uchiba M, Komura H, et al. Metformin, an antidiabetic agent,
suppresses the production of tumor necrosis factor and tissue factor by
inhibiting early growth response factor-1 expression in human monocytes in
vitro. Journal of Pharmacology and Experimental Therapeutics, 2010, 334(1):
206-213.
32. Isoda K, Young J L, Zirlik A, et al. Metformin inhibits proinflammatory
responses and nuclear factor-κB in human vascular wall cells. Arteriosclerosis,
thrombosis, and vascular biology, 2006, 26(3): 611-617
33. Yin Y, Choi SC, Xu Z, Perry DJ, Seay H, Croker BP, Sobel ES, Brusko
TM, Morel L. Normalization of CD4+ T cell metabolism reverses lupus. Sci
Page 25 of 41
John Wiley & Sons
Arthritis & Rheumatology
This article is protected by copyright. All rights reserved.

26
Transl Med. 2015;7:274ra18.
Page 26 of 41
John Wiley & Sons
Arthritis & Rheumatology
This article is protected by copyright. All rights reserved.
27
Figure 1. Mitochondrial DNA release by netting neutrophils is greatly enhanced in active SLE
patients.(A) Neutrophils from healthy donors (HD) and SLE patients were stained with cell
membranes (calcine green) and DNA (Sytox Red) and NET DNA was quantified by fluorescence.
The data were representative of 6 (upper panel) or 3 (lower panel) independent experiments,
respectively. Scale bars, 50 µm. (B) NETs-released mitochondrial DNA was significantly elevated
in SLE patients versus HDs. (C) Mitochondrial DNA in plasma was significantly elevated in SLE
patients versus HDs. (D) NETs-released mitochondrial DNA was positively correlated with
SLEDAI and IFN scores. Each symbol represents an independent patient, and horizontal bars
represent the mean.*p<0.05, **p<0.01,***p<0.001
Figure 2. NETs mtDNA and anti-mtDNA Abs are associated with active lupus nephritis. (A)
Autoantibodies against mtDNA in sera from patients with SLE, RA, or HDs. (B) The titers of
anti-mtDNA Abs correlated with the SLEDAI,IFN scores and anti-dsDNA Abs titers in SLE
patients (n=50). (C) In situ immunofluorescence analysis of frozen sections of renal biopsies from
individuals with lupus nephritis and normal kidney tissues. Colocalization of DNA (blue), mtDNA
(red) and neutrophil granule markers, MPO (green) indicates intra-glomerular NET formation.
Increased magnification of boxed area shows NET deposition inside glomerular capsule. Scale
bars, 50 µm. (D) Patients with active renal damage [A] had a higher percentage of anti-mtDNA
Abs than patients with chronic renal damage [C] among proliferative LN (class III or IV
with/without V). A/C group was defined as mixed active and chronic lesions. (E) Percentages of
LN patients with significant anti-mtDNA antibody titers (cutoff value OD index, 1.311) among
LN patients with proteinuria great than 0.5 g/d and patients with proteinuria less than 0.5 g/d by
chi-square test. (F) Correlation between LN activity index and anti-mtDNA or anti-dsDNA.
Each symbol represents an independent patient, and horizontal bars represent the mean.*p<0.05,
***p<0.001, ns=not significant.
Figure 3. mtDNA and its autoantibody are stronger inducers of pDC IFN-α than dsDNA and
anti-dsDNA. (A) pDCs IFN-α production stimulated with mtDNA/dsDNA alone or in
combination with anti-mtDNA IgG/anti-dsDNA IgG. (B) IFN-α produced by pDCs stimulated
with anti-mtDNA IgG/anti-dsDNA IgG and with increased concentrations of mtDNA/dsDNA. (C)
IFN-α produced by pDCs stimulated with supernatants of NETting neutrophils alone or in the
presence of anti-mtDNA IgG, anti-dsDNA IgG or control IgG. CpG2216 was used as a positive
control. (D) IFN-α produced by pDCs after stimulation with supernatants of NETting neutrophils
in the presence of anti-mtDNA IgG. DNase I (6 U/ml) was added to NET-stimulated pDC cultures.
Stimulation with CpG2216 or R837 was used as controls. The experiment was repeated at least 4
times with pDCs from independent donors with similar results, and horizontal bars represent the
mean. *p<0.05, **p<0.01.
Figure 4. Metformin down-regulates NETs/mtDNA-pDC-IFNα pathway. (A) Neutrophils were
pre-incubated with various concentrations of metformin for 0.5 h and then stimulated with PMA
(10 µg/ml). Three hours after the stimulation, the supernatants were collected and NET-DNA was
quantified. (B) Neutrophils were activated with PMA in the presence of 100 µM metformin (white
bars), 10 µM of the NADPH oxidase inhibitor (DPI, gray bars) or in the absence of these
Page 27 of 41
John Wiley & Sons
Arthritis & Rheumatology
This article is protected by copyright. All rights reserved.
28
components (black bars) and NET-DNA was quantified. (C) NET mtDNA copies of neutrophils
stimulated with PMA in the absence or presence of 100 µM metformin. (D-E) PDCs were
pretreated with various concentrations of metformin and then incubated overnight with the
indicated concentrations of CPG(D) or mtDNA/anti-mtDNA Abs(E). IFN-a production was
inhibited by metformin in a dose-dependent manner. The data shown is a representative triplicate
experiment and horizontal bars represent the mean.*p<0.05.
Figure 5. Metformin add-on reduce disease flare, prednisone exposure and body weight in SLE
patients. (A) Life table analysis of time to a flare. Patients at risk are defined based on the original
randomization. The group assigned to continue taking metformin is indicated with red line, and
the control group is indicated with blue line. The numbers of patients in each treatment group who
remained at risk at each 1-month interval are shown below the graph. P=0.04 (log-rank test) for
the difference between groups. (B) Effect of metformin on steroid sparing (≥50% reduction). (C)
Changes in prednisone dose from baseline. (D) Changes in BMI from baseline. *p<0.05 ,
**p<0.01, ***p<0.001.
Page 28 of 41
John Wiley & Sons
Arthritis & Rheumatology
This article is protected by copyright. All rights reserved.
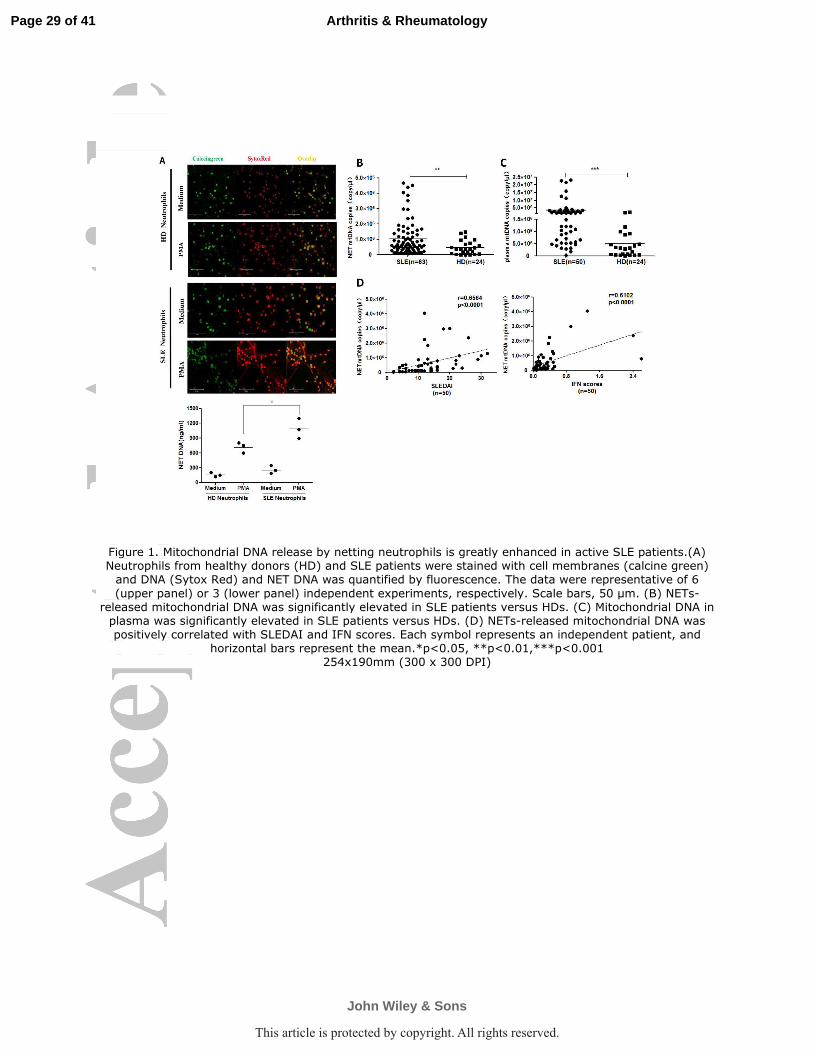
Figure 1. Mitochondrial DNA release by netting neutrophils is greatly enhanced in active SLE patients.(A) Neutrophils from healthy donors (HD) and SLE patients were stained with cell membranes (calcine green)
and DNA (Sytox Red) and NET DNA was quantified by fluorescence. The data were representative of 6
(upper panel) or 3 (lower panel) independent experiments, respectively. Scale bars, 50 µm. (B) NETs-released mitochondrial DNA was significantly elevated in SLE patients versus HDs. (C) Mitochondrial DNA in
plasma was significantly elevated in SLE patients versus HDs. (D) NETs-released mitochondrial DNA was positively correlated with SLEDAI and IFN scores. Each symbol represents an independent patient, and
horizontal bars represent the mean.*p<0.05, **p<0.01,***p<0.001 254x190mm (300 x 300 DPI)
Page 29 of 41
John Wiley & Sons
Arthritis & Rheumatology
This article is protected by copyright. All rights reserved.
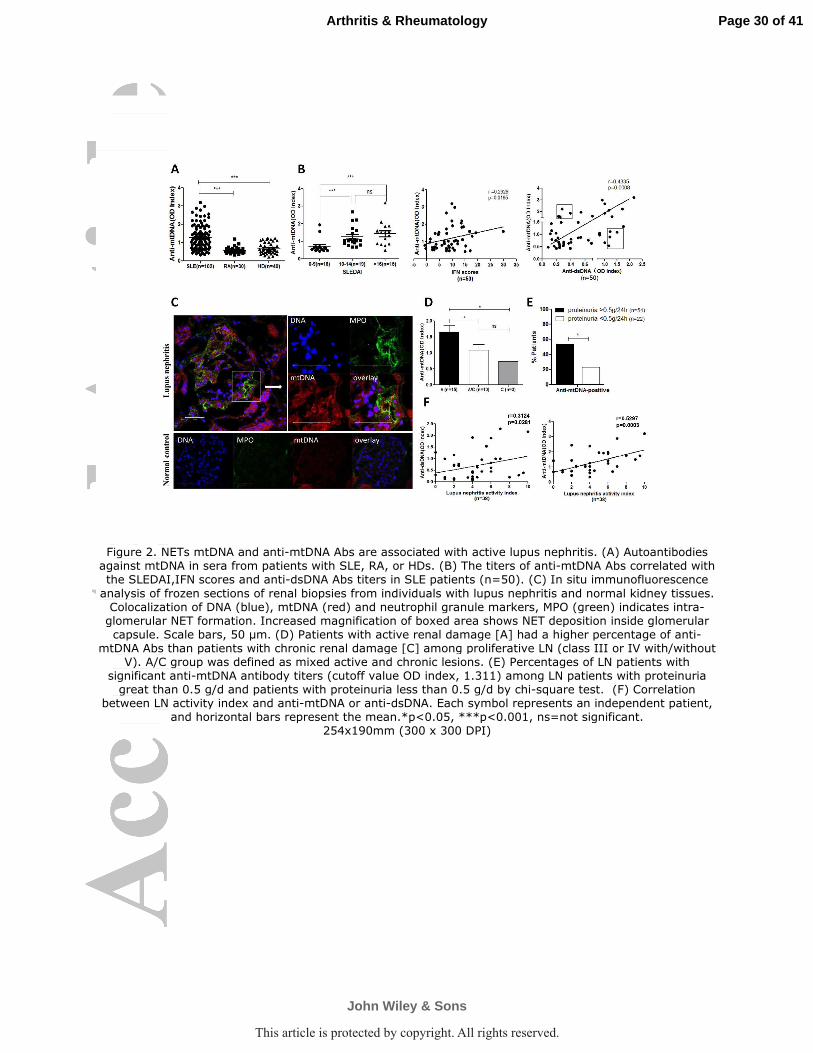
Figure 2. NETs mtDNA and anti-mtDNA Abs are associated with active lupus nephritis. (A) Autoantibodies against mtDNA in sera from patients with SLE, RA, or HDs. (B) The titers of anti-mtDNA Abs correlated with the SLEDAI,IFN scores and anti-dsDNA Abs titers in SLE patients (n=50). (C) In situ immunofluorescence
analysis of frozen sections of renal biopsies from individuals with lupus nephritis and normal kidney tissues. Colocalization of DNA (blue), mtDNA (red) and neutrophil granule markers, MPO (green) indicates intra-
glomerular NET formation. Increased magnification of boxed area shows NET deposition inside glomerular capsule. Scale bars, 50 µm. (D) Patients with active renal damage [A] had a higher percentage of anti-
mtDNA Abs than patients with chronic renal damage [C] among proliferative LN (class III or IV with/without V). A/C group was defined as mixed active and chronic lesions. (E) Percentages of LN patients with
significant anti-mtDNA antibody titers (cutoff value OD index, 1.311) among LN patients with proteinuria great than 0.5 g/d and patients with proteinuria less than 0.5 g/d by chi-square test. (F) Correlation
between LN activity index and anti-mtDNA or anti-dsDNA. Each symbol represents an independent patient, and horizontal bars represent the mean.*p<0.05, ***p<0.001, ns=not significant.
254x190mm (300 x 300 DPI)
Page 30 of 41
John Wiley & Sons
Arthritis & Rheumatology
This article is protected by copyright. All rights reserved.
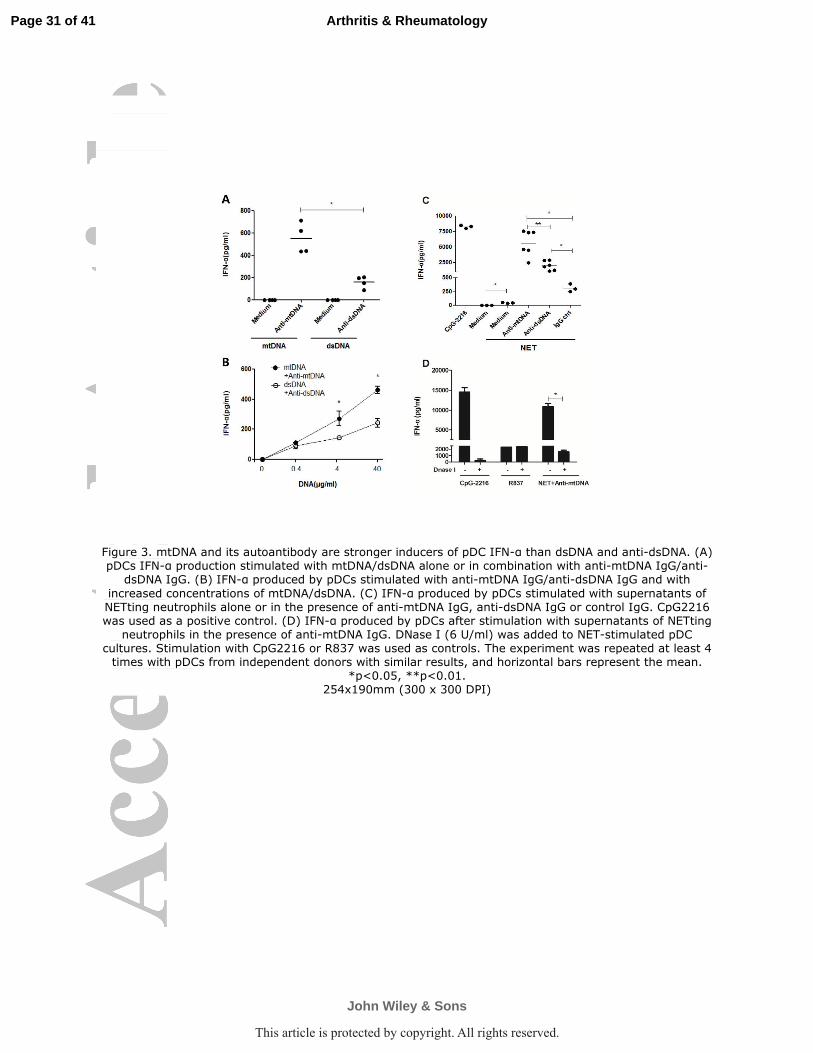
Figure 3. mtDNA and its autoantibody are stronger inducers of pDC IFN-α than dsDNA and anti-dsDNA. (A) pDCs IFN-α production stimulated with mtDNA/dsDNA alone or in combination with anti-mtDNA IgG/anti-
dsDNA IgG. (B) IFN-α produced by pDCs stimulated with anti-mtDNA IgG/anti-dsDNA IgG and with
increased concentrations of mtDNA/dsDNA. (C) IFN-α produced by pDCs stimulated with supernatants of NETting neutrophils alone or in the presence of anti-mtDNA IgG, anti-dsDNA IgG or control IgG. CpG2216 was used as a positive control. (D) IFN-α produced by pDCs after stimulation with supernatants of NETting
neutrophils in the presence of anti-mtDNA IgG. DNase I (6 U/ml) was added to NET-stimulated pDC cultures. Stimulation with CpG2216 or R837 was used as controls. The experiment was repeated at least 4
times with pDCs from independent donors with similar results, and horizontal bars represent the mean. *p<0.05, **p<0.01.
254x190mm (300 x 300 DPI)
Page 31 of 41
John Wiley & Sons
Arthritis & Rheumatology
This article is protected by copyright. All rights reserved.
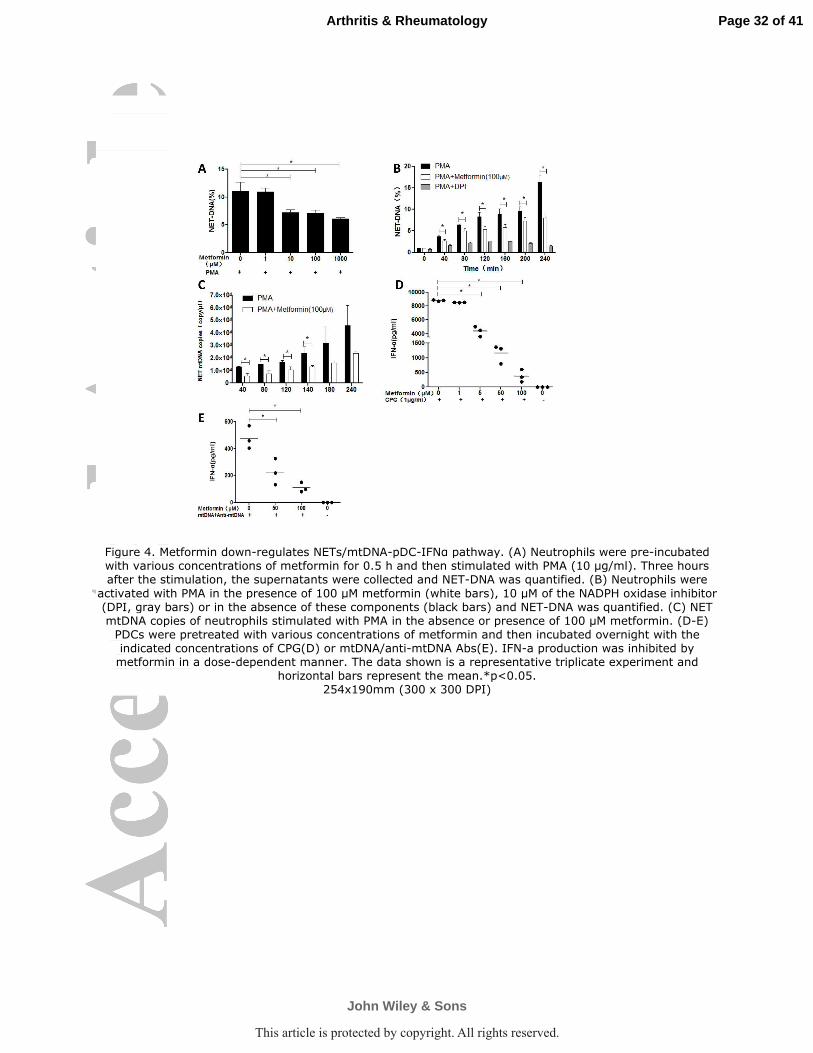
Figure 4. Metformin down-regulates NETs/mtDNA-pDC-IFNα pathway. (A) Neutrophils were pre-incubated with various concentrations of metformin for 0.5 h and then stimulated with PMA (10 µg/ml). Three hours after the stimulation, the supernatants were collected and NET-DNA was quantified. (B) Neutrophils were
activated with PMA in the presence of 100 µM metformin (white bars), 10 µM of the NADPH oxidase inhibitor (DPI, gray bars) or in the absence of these components (black bars) and NET-DNA was quantified. (C) NET mtDNA copies of neutrophils stimulated with PMA in the absence or presence of 100 µM metformin. (D-E)
PDCs were pretreated with various concentrations of metformin and then incubated overnight with the indicated concentrations of CPG(D) or mtDNA/anti-mtDNA Abs(E). IFN-a production was inhibited by
metformin in a dose-dependent manner. The data shown is a representative triplicate experiment and horizontal bars represent the mean.*p<0.05.
254x190mm (300 x 300 DPI)
Page 32 of 41
John Wiley & Sons
Arthritis & Rheumatology
This article is protected by copyright. All rights reserved.
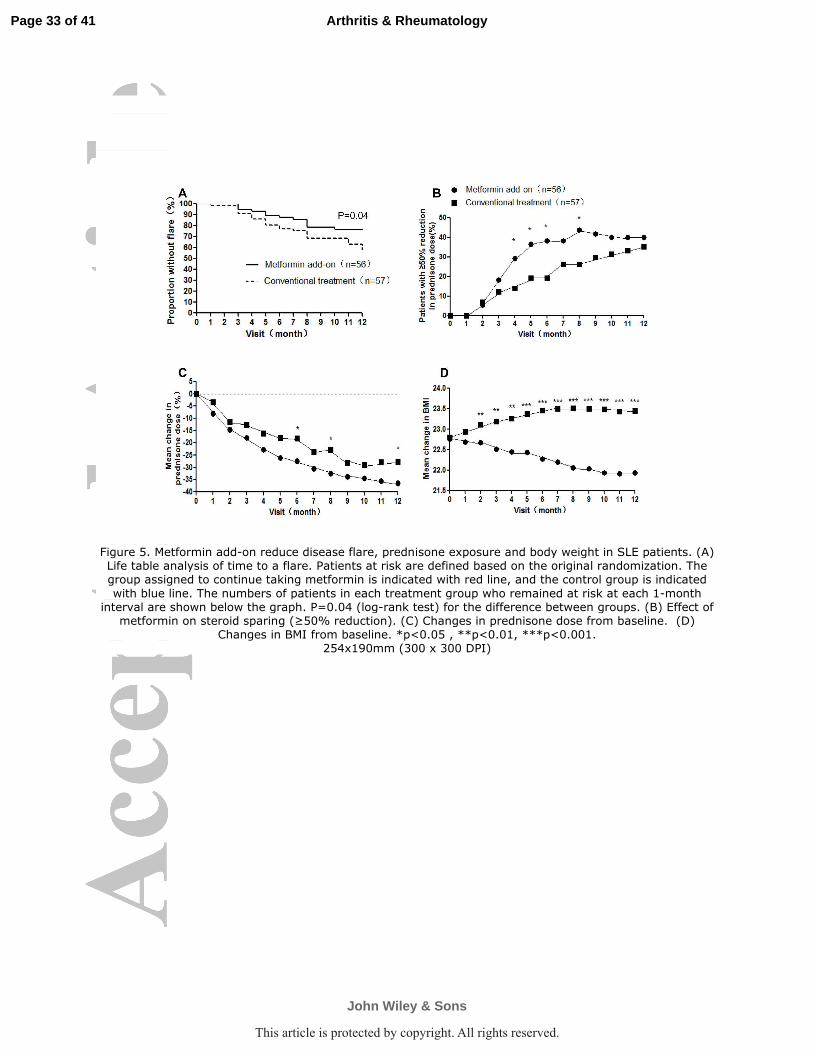
Figure 5. Metformin add-on reduce disease flare, prednisone exposure and body weight in SLE patients. (A) Life table analysis of time to a flare. Patients at risk are defined based on the original randomization. The group assigned to continue taking metformin is indicated with red line, and the control group is indicated
with blue line. The numbers of patients in each treatment group who remained at risk at each 1-month interval are shown below the graph. P=0.04 (log-rank test) for the difference between groups. (B) Effect of
metformin on steroid sparing (≥50% reduction). (C) Changes in prednisone dose from baseline. (D) Changes in BMI from baseline. *p<0.05 , **p<0.01, ***p<0.001.
254x190mm (300 x 300 DPI)
Page 33 of 41
John Wiley & Sons
Arthritis & Rheumatology
This article is protected by copyright. All rights reserved.
Metformin Metformin Metformin Metformin ((((n=56n=56n=56n=56)))) CCCConventional treatment onventional treatment onventional treatment onventional treatment ((((n=57n=57n=57n=57))))
Age(years) 30.7(13.2) 32.7((14.0)
Women 51(94%) 53(95%)
Disease duration(years) 3.5(3.8) 4.1(4.8)
SLEDAI 3.0(3.7) 3.4(3.5)
SLEDAI score≥10 5(9%) 5(9%)
Baseline SELENABaseline SELENABaseline SELENABaseline SELENA----SLEDAI organ involvementSLEDAI organ involvementSLEDAI organ involvementSLEDAI organ involvement
CNS 0(0%) 0(0%)
Serosal 0(0%) 0(0%)
Haematological 6(11%) 3(5%)
Musculoskeletal 1(2%) 2(4%)
Dermal 5(9%) 3(5%)
Renal 7(13%) 8(14%)
Proteinuria≥1.5(g/24h) 4(7%) 5(9%)
PrednisonePrednisonePrednisonePrednisone
Dose(mg/day) 13.3(8.8) 12.7(7.3)
>7.5mg/day at baseline 41(73%) 45(79%)
ImmunImmunImmunImmunosuppressive drugosuppressive drugosuppressive drugosuppressive drug
Mycophenolate 13(23%) 15(27%)
Azathioprine 7(13%) 7(13%)
Methotrexate 12(21%) 6(11%)
Leflunomide 1(2%) 0(0%)
Ciclosporin 0(0%) 5(9%)
Thalidomide 4(7%) 3(5%)
Cyclophosphamide 3(6%) 4(7%)
Antimalarial drugAntimalarial drugAntimalarial drugAntimalarial drug 52(92%)52(92%)52(92%)52(92%) 51(89%)51(89%)51(89%)51(89%)
BiomarkersBiomarkersBiomarkersBiomarkers
Anti-dsDNA(IU/ml) 30.3(32.6) 37.9(37.89)
C3 concentration(g/L) 0.84(0.25) 0.76(0.25)
C3 concentration less than 0.9g/L 32(59%) 35(64%)
C4 concentration(g/L) 0.17(0.08) 0.15(0.08)
C4 concentration less than 0.1g/L 13(24%) 18(32%)
IgG(g/L) 14.2(3.5) 14.0(6.1)
IgA(g/L) 2.7(1.5) 2.4(1.0)
IgM(g/L) 1.3(0.8) 1.1(0.8)
Table 1: Baseline clinical characteristics of patients
Data are number (%) or mean (SD).SLEDAI=Systemic Lupus Erythematosus Disease Activity
Index.C3=complement C3. C4=complement C4.Ig=immunoglobulin. Anti-dsDNA was measured using
radioimmunoassay (Farr assay) with a detectable range of 7-100 IU/ml. Patients who were positive at baseline with
an anti-dsDNA assay greater than 7 IU/ml。
Page 34 of 41
John Wiley & Sons
Arthritis & Rheumatology
This article is protected by copyright. All rights reserved.