Embed Size (px)
Citation preview
NETHERLANDS
Key issues
Adults in the Netherlands show above-average proficiency in literacy, numeracy and problem
solving in technology-rich environments compared with adults in the other countries
participating in the survey.
Young adults (16-24 years old) in the Netherlands have high levels of proficiency in literacy,
numeracy and problem solving in technology-rich environments, on average, compared to
their peers of similar age in other countries.
As in most countries, a significant minority of Dutch adults have very low proficiency in literacy
and numeracy. A reasonably large proportion of adults show poor proficiency in accessing,
analysing and communicating information using common computer applications.
Foreign-language immigrants in the Netherlands have much lower levels of proficiency in the
Dutch language than native-born adults whose first language was Dutch. However, the average
literacy proficiency of foreign-language immigrants to the Netherlands is close to the average
among foreign-language immigrants across all participating countries and higher than that
observed in a number of European countries with large immigrant populations.
The survey
The Survey of Adult Skills (PIAAC) provides a picture of adults’ proficiency in three key information-processing skills:
literacy – the ability to understand and respond appropriately to written texts;
numeracy – the ability to use numerical and mathematical concepts; and
problem solving in technology-rich environments – the capacity to access, interpret and analyse
information found, transformed and communicated in digital environments.
Proficiency is described in terms of a scale of 500 points divided into levels. Each level summarises what a
person with a particular score can do. Six proficiency levels are defined for literacy and numeracy (Levels 1
through 5 plus below Level 1) and four for problem solving in technology-rich environments (Levels 1 through
3 plus below Level 1).
The survey also provides a rich array of information regarding respondents’ use of skills at work and in
everyday life, their education, their linguistic and social backgrounds, their participation in the labour market
and other aspects of their well-being.
The Survey of Adult Skills was conducted in the Netherlands from September 2011 to March 2012.
A total of 5 170 adults aged 16 to 65 were surveyed.
NETHERLANDS – Country Note –Survey of Adult Skills first results
© OECD 2
Adults in the Netherlands have high average proficiency in literacy, numeracy and problem solving in technology-rich environments compared with adults in the other countries participating in the survey. Some 18.2% of adults in the Netherlands (aged 16-65) attain the two highest levels of proficiency in literacy (Level 4 or 5) compared with the average of 11.8% of adults in all participating countries. At Level 4, adults can integrate, interpret and synthesise information from complex or lengthy texts that contain conditional and/or competing information (for more details on what adults can do at each proficiency level, see the table at the end of this note). Some 41.5% are proficient at Level 3 in literacy compared to 38.2% of adults in all participating countries. Adults performing at this level can understand and respond appropriately to dense or lengthy texts, and can identify, interpret, or evaluate one or more pieces of information and make appropriate inferences using knowledge text structures and rhetorical devices. Some 17.0% of adults in the Netherlands attain Level 4 or 5 in numeracy compared with the average of 12.4% of adults across all participating countries. At Level 4, adults understand a broad range of mathematical information that may be complex, abstract or found in unfamiliar contexts. Some 39.4% attain Level 3 proficiency in numeracy compared to 34.4% of adults in all participating countries. At this level, adults have a good sense of number and space; can recognise and work with mathematical relationships, patterns, and proportions expressed in verbal or numerical form; and can interpret and perform basic analyses of data and statistics in texts, tables and graphs. Some 7.3% of Dutch adults are proficient at Level 3, the highest proficiency level, in problem solving in technology-rich environments (compared to an average of 5.8% of adults in all participating countries), while 34.3% attain proficiency Level 2 in problem solving (compared with the average of 28.2%). Adults at Level 3 can complete tasks involving multiple computer applications, a large number of steps, and the discovery and use of ad hoc commands in a novel environment. At Level 2, adults can complete problems that involve a small number of computer applications, and require completing several steps and operations to reach a solution.
Young adults (aged 16-24) in the Netherlands have higher proficiency than older adults in all three domains surveyed. Compared with their peers in other countries, these young adults have higher average proficiency in literacy, numeracy and problem solving. In literacy, young adults in the Netherlands are among the top performers in the survey. Their average proficiency is lower than that of their peers in Japan, who have the highest average score, but similar to that of young adults in Finland and Korea. In numeracy, young adults in the Netherlands show the highest average proficiency, along with their peers in Finland, Flanders (Belgium), Japan and Korea. In problem solving in technology-rich environments, 58.3% of young adults in the Netherlands attain Level 2 or 3 (compared with 50.7% of young adults across all participating countries). This is 5.1 percentage points lower than in Korea, where young adults attain the highest scores in problem solving, and 20.7 percentage points higher than that in the United States, where young adults attain the lowest scores in problem solving.
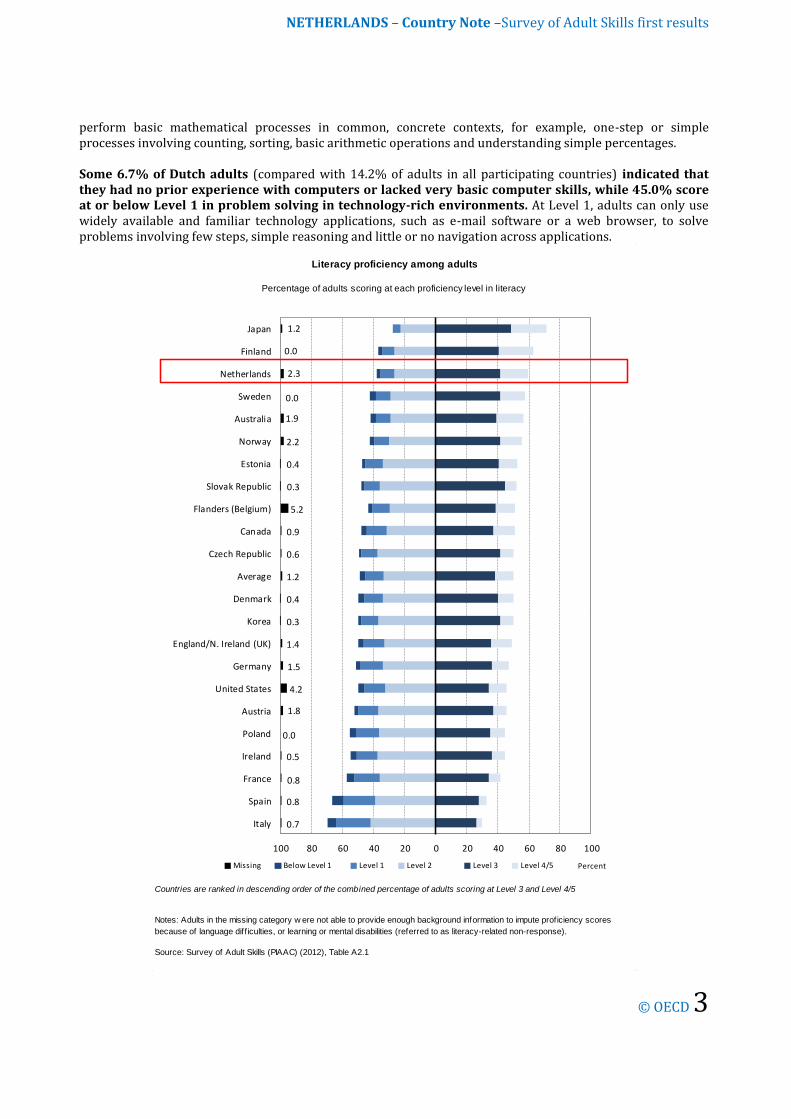
As in most participating countries, relatively large minorities of the adult population in the Netherlands have poor literacy, numeracy and problem-solving skills. Some 11.7% of Dutch adults attain only Level 1 or below in literacy proficiency (compared with the average of 15.5%) and 13.2% attain Level 1 or below in numeracy (compared with the average of 19.0%). At Level 1 in literacy, adults can read brief texts on familiar topics and locate a single piece of specific information identical in form to information in the question or directive. In numeracy, adults at Level 1 can
NETHERLANDS – Country Note –Survey of Adult Skills first results
© OECD 3
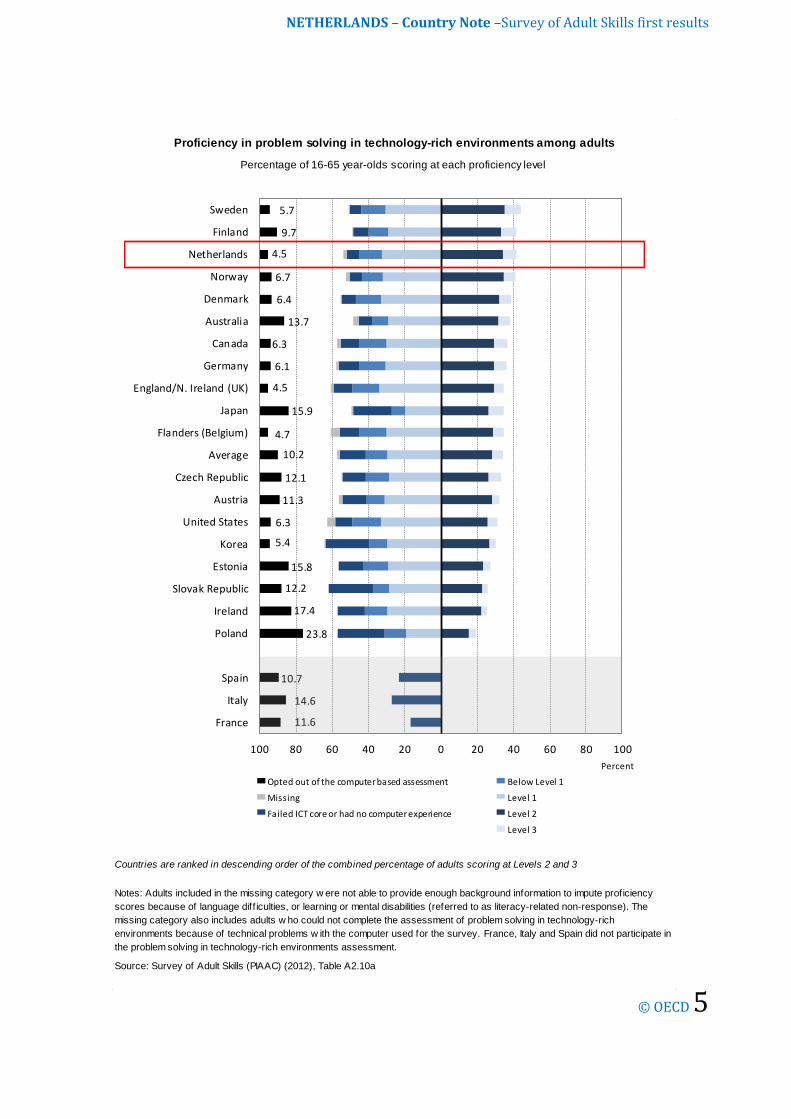
perform basic mathematical processes in common, concrete contexts, for example, one-step or simple processes involving counting, sorting, basic arithmetic operations and understanding simple percentages. Some 6.7% of Dutch adults (compared with 14.2% of adults in all participating countries) indicated that they had no prior experience with computers or lacked very basic computer skills, while 45.0% score at or below Level 1 in problem solving in technology-rich environments. At Level 1, adults can only use widely available and familiar technology applications, such as e-mail software or a web browser, to solve problems involving few steps, simple reasoning and little or no navigation across applications.
Countries are ranked in descending order of the combined percentage of adults scoring at Level 3 and Level 4/5
Source: Survey of Adult Skills (PIAAC) (2012), Table A2.1
Notes: Adults in the missing category w ere not able to provide enough background information to impute proficiency scores
because of language diff iculties, or learning or mental disabilities (referred to as literacy-related non-response).
Literacy proficiency among adults
Percentage of adults scoring at each proficiency level in literacy
0.7
0.8
0.8
0.5
0.0
1.8
4.2
1.5
1.4
0.3
0.4
1.2
0.6
0.9
5.2
0.3
0.4
2.2
1.9
0.0
2.3
0.0
1.2
100 80 60 40 20 0 20 40 60 80 100
Italy
Spain
France
Ireland
Poland
Austria
United States
Germany
England/N. Ireland (UK)
Korea
Denmark
Average
Czech Republic
Canada
Flanders (Belgium)
Slovak Republic
Estonia
Norway
Australia
Sweden
Netherlands
Finland
Japan
PercentMissing Below Level 1 Level 1 Level 2 Level 3 Level 4/5

NETHERLANDS – Country Note –Survey of Adult Skills first results
© OECD 4
Countries are ranked in descending order of the combined percentage of adults scoring at Level 3 and Level 4/ 5
Source: Survey of Adult Skills (PIAAC) (2012), Table A2.5
Notes: Adults in the missing category w ere not able to provide enough background information to impute proficiency scores
because of language diff iculties, or learning or mental disabilities (referred to as literacy-related non-response).
Numeracy proficiency among adults
Percentage of 16-65 year-olds scoring at each proficiency level in numeracy
0.8
0.7
4.2
0.5
0.8
0.0
1.4
0.3
0.9
1.9
1.2
0.4
1.5
1.8
0.6
5.2
0.3
0.4
2.2
2.3
0.0
0.0
1.2
100 80 60 40 20 0 20 40 60 80 100
Spain
Italy
United States
Ireland
France
Poland
England/N. Ireland (UK)
Korea
Canada
Australia
Average
Estonia
Germany
Austria
Czech Republic
Flanders (Belgium)
Slovak Republic
Denmark
Norway
Netherlands
Sweden
Finland
Japan
PercentMissing Below Level 1 Level 1 Level 2 Level 3 Level 4/5
NETHERLANDS – Country Note –Survey of Adult Skills first results
© OECD 5
Source: Survey of Adult Skills (PIAAC) (2012), Table A2.10a
Countries are ranked in descending order of the combined percentage of adults scoring at Levels 2 and 3
Notes: Adults included in the missing category w ere not able to provide enough background information to impute proficiency
scores because of language diff iculties, or learning or mental disabilities (referred to as literacy-related non-response). The
missing category also includes adults w ho could not complete the assessment of problem solving in technology-rich
environments because of technical problems w ith the computer used for the survey. France, Italy and Spain did not participate in
the problem solving in technology-rich environments assessment.
Proficiency in problem solving in technology-rich environments among adults
Percentage of 16-65 year-olds scoring at each proficiency level
11.6
14.6
10.7
23.8
17.4
12.2
15.8
5.4
6.3
11.3
12.1
10.2
4.7
15.9
4.5
6.1
6.3
13.7
6.4
6.7
4.5
9.7
5.7
100 80 60 40 20 0 20 40 60 80 100
France
Italy
Spain
Poland
Ireland
Slovak Republic
Estonia
Korea
United States
Austria
Czech Republic
Average
Flanders (Belgium)
Japan
England/N. Ireland (UK)
Germany
Canada
Australia
Denmark
Norway
Netherlands
Finland
Sweden
Percent
Opted out of the computer based assessment
Missing
Failed ICT core or had no computer experience
Below Level 1
Level 1
Level 2
Level 3
NETHERLANDS – Country Note –Survey of Adult Skills first results
© OECD 6
Foreign-language immigrants in the Netherlands have much lower levels of proficiency in the Dutch language than native-born adults whose first language was Dutch. However, the average literacy proficiency of foreign-language immigrants to the Netherlands is close to the average for foreign-language immigrants across participating countries and higher than that observed in a number of European countries with large immigrant populations.
As expected, in all countries, foreign-language immigrants tend to have lower literacy skills than native-born adults who spoke the official language of the country from birth. Both their overall level of proficiency and their proficiency relative to native-born adults reflect the changing size and composition of immigrant inflows into the countries concerned over the post-war period, as well as the impact of language and integration policies. In the Netherlands, there is a large gap in literacy proficiency (nearly 51 score points compared to a country average of 37 points) between native-born adults whose first language was Dutch and foreign-language immigrants. To a large extent this reflects the overall high literacy proficiency of native-born, native-language speakers in the Netherlands rather than low proficiency among immigrants. Foreign-language immigrants in the Netherlands perform at the average for foreign-language immigrants as a whole.
The relationship between most socio-demographic characteristics and proficiency is similar to that observed in other countries, with the exception of immigration status, age and educational attainment. In most countries, including the Netherlands, there are differences in skills proficiency related to socio-demographic characteristics, such as gender, age, level of education and social background. In the Netherlands, the strength of these relationships is, for the most part, close to the average observed in all countries. However, in addition to immigration status (discussed above), there is a stronger relationship between age and educational attainment and proficiency than in other countries.
Across the participating countries, proficiency in literacy and numeracy peaks among 25-34 year-olds while the proficiency of 55-64 year-olds is generally the lowest of all age groups. This is true in the Netherlands too. The difference in literacy proficiency between 16-24 year-olds and 55-65 year-olds is close to 34 score points, compared to the average of 24 score points. The magnitude of this difference partly reflects the very high literacy proficiency among Dutch youth.
As expected, adults with higher levels of educational attainment tend to have higher proficiency than those with lower levels of attainments. On average across all countries, the advantage to adults with tertiary qualifications over those with lower-than-secondary attainment is 51 score points. In the Netherlands, this difference is 57 score points, around the levels observed in Canada, England/Northern Ireland (UK) and Sweden, but below those observed in France and the United States.

NETHERLANDS – Country Note –Survey of Adult Skills first results
© OECD 7
The Netherlands’s 16-29 year-old graduates of upper secondary general programmes have substantially higher proficiency in literacy than young adults of the same age who graduated from vocational programmes.
In most countries, among young people whose highest level of attainment is upper secondary education, those who completed general programmes have higher proficiency in literacy than those who enrolled in vocationally oriented programmes. This may be the result of large curricular differences between vocational and general programmes or of the processes of selection into different programmes, including self-selection. In the Netherlands, as in Australia, Austria, the Czech Republic, Denmark, Finland and Germany, there is a particularly large gap in literacy proficiency in favour of 16-29 year-olds who graduated from general rather than vocational programmes at the upper secondary level. In the Netherlands, this reflects the relatively strong performance of graduates of general secondary programmes (which is well above the average) rather than poor performance among graduates of vocationally oriented programmes (which is also above average).
Higher proficiency in literacy and numeracy has a positive impact on labour force participation and wages.
In all participating countries, there is a positive relationship between proficiency and labour force participation and employment. Individuals with higher levels of proficiency in literacy, numeracy and problem solving in technology-rich environments have greater chances of participating in the labour market and of being employed and less chance of being unemployed than individuals with lower levels of proficiency, on average.
Synthesis of socio-demographic differences in literacy proficiency
Difference in literacy scores between contrast categories within various socio-demographic groups
Source: Survey of Adult Skills (PIAAC) (2012), Table A3.2(L), Table A3.6(L), Table A3.9(L), Table A3.15(L) and Table A3.19(L).
Notes: The estimates show the differences betw een the tw o means for each contrast category ). The differences are: 16-24
year-olds minus 55-65 year-olds (age), native born and native language minus foreign born and foreign language (immigrant),
tertiary minus less than upper secondary (education), at least one parent attained tertiary minus neither parent attained upper
secondary (parents' education) and skilled minus elementary occupations (occupation).
0
20
40
60
80
Age Immigrant Education Parents' Education Occupation
Netherlands AverageScore-point difference

NETHERLANDS – Country Note –Survey of Adult Skills first results
© OECD 8
Some 85.3% of Dutch adults scoring at Level 4/5 in literacy are employed compared to only 57.5% of those scoring at Level 1 or below. The rate of inactivity (11.2%) among highly proficient (Level 4/5) Dutch adults is one of the lowest observed, and is well below the average (17.1%) among participating countries.
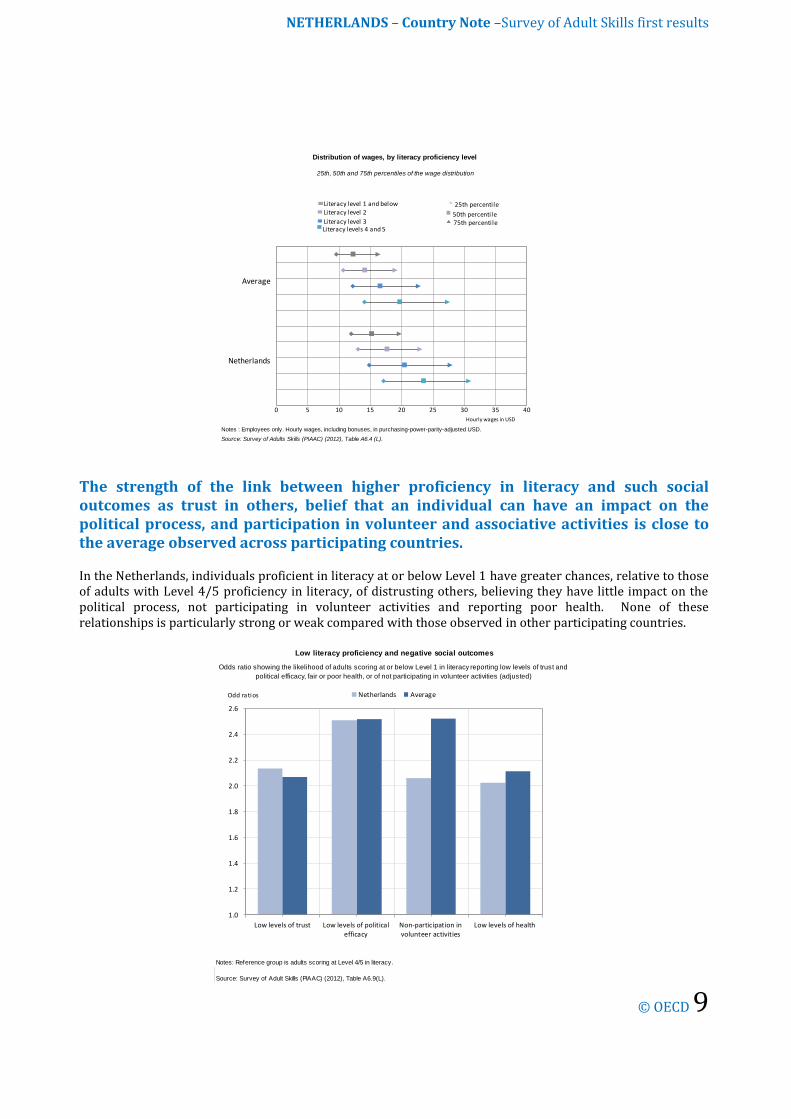
Wages are also affected by proficiency in information-processing skills. In the Netherlands, the best-paid workers who score at Level 4/5 in literacy earn about USD 11.20 more per hour than the best-paid workers who score at or below Level 1. There is an overlap in the wage distributions at different levels of proficiency. For instance, in the Netherlands, a median earner with Level 2 proficiency in literacy earns about the same as a low-paid worker with Level 4/5 proficiency.
Source: Survey of Adults Skills (PIAAC) (2012), Table A6.3 (L)
Employment status, by literacy proficiency level
Percentage of adults in each labour market status
0
10
20
30
40
50
60
70
80
90
100
Netherlands Average Netherlands Average
Level 1 or below Level 4/5
Unemployed
Employed
Percent
1. See footnotes A and B in the Reader's Guide.
England/N.
Ireland (UK)
Source: Survey of Adults Skills (PIAAC) (2012), Table A6.3 (L)
Countries are listed in alphabetical order.
Korea
Figure 6.3 (L)Employment status, by literacy proficiency level
Netherlands
Norway
Poland
Estonia
Finland
Australia
Austria
AverageFlanders
(Belgium)
Percentage of adults in each labour market status
United States
Ireland
Italy
Japan
Spain
Sweden
Slovak RepublicGermany
Czech
Republic
Canada
Denmark
Cyprus1
0 50 100
Percent
0 50 100
Percent
0 50 100
Percent
Unemployed Out of the labour forceEmployedLiteracy level 1 and below
Literacy level 2Literacy level 3
Literacy levels 4 and 5
NETHERLANDS – Country Note –Survey of Adult Skills first results
© OECD 9
The strength of the link between higher proficiency in literacy and such social outcomes as trust in others, belief that an individual can have an impact on the political process, and participation in volunteer and associative activities is close to the average observed across participating countries.
In the Netherlands, individuals proficient in literacy at or below Level 1 have greater chances, relative to those of adults with Level 4/5 proficiency in literacy, of distrusting others, believing they have little impact on the political process, not participating in volunteer activities and reporting poor health. None of these relationships is particularly strong or weak compared with those observed in other participating countries.
Notes : Employees only. Hourly wages, including bonuses, in purchasing-power-parity-adjusted USD.
Source: Survey of Adults Skills (PIAAC) (2012), Table A6.4 (L).
Average
Netherlands
Distribution of wages, by literacy proficiency level
25th, 50th and 75th percentiles of the wage distribution
0 5 10 15 20 25 30 35 40
Hourly wages in USD
25th percentile
50th percentile75th percentile
Literacy level 1 and below Literacy level 2
Literacy level 3 Literacy levels 4 and 5
Low literacy proficiency and negative social outcomes
Odds ratio showing the likelihood of adults scoring at or below Level 1 in literacy reporting low levels of trust and
political efficacy, fair or poor health, or of not participating in volunteer activities (adjusted)
Source: Survey of Adult Skills (PIAAC) (2012), Table A6.9(L).
Notes: Reference group is adults scoring at Level 4/5 in literacy.
1.0
1.2
1.4
1.6
1.8
2.0
2.2
2.4
2.6
Low levels of trust Low levels of politicalefficacy
Non-participation involunteer activities
Low levels of health
Netherlands AverageOdd ratios

NETHERLANDS – Country Note –Survey of Adult Skills first results
© OECD 10
The Netherlands appears to have little mismatch between the literacy and numeracy proficiency of workers and the demands of their jobs.
The Survey of Adult Skills collected information about the use of information-processing and other generic skills in the work-place. Linked with data about workers’ proficiency in these skills, this information provides a picture of the match – or mismatch – between workers’ skills and the tasks they are asked to perform in their jobs.
Dutch workers read, write, work with mathematics, solve problems and use computers in their jobs at around the average level observed across OECD countries participating in the Survey of Adult Skills. There is evidence of a high level of good matches between the literacy and numeracy skills of workers and the requirements of their jobs. The Netherlands has a small proportion of workers whose proficiency in literacy (6.8%) and numeracy (5.1%) is estimated to be above the maximum required by their job (over-skilling) and a small proportion of workers whose proficiency in literacy (2.7%) and numeracy (3.0%) is below the minimum required by their job (under-skilling) among all participating countries. Not surprisingly, there is no apparent wage premium for those who work in jobs requiring a higher level of numeracy skills and no wage penalty for those working in jobs for which they have a higher level of proficiency than is required.
Average use of information-processing skills at work
Source: Survey of Adult Skills (PIAAC) (2012), Table A4.1.
Notes: Skills use indicators are standardised to have a mean of 2 and a standard deviation of 1 across the entire survey sample.
0
0.5
1
1.5
2
2.5
Reading at Work Writing at Work Numeracy at Work ICT at Work Problem Solving
Netherlands AverageMean use

NETHERLANDS – Country Note –Survey of Adult Skills first results
© OECD 11
Key facts about the Survey of Adult Skills (PIAAC)
What is assessed
The Survey of Adult Skills (PIAAC) assesses the proficiency of adults from age 16 onwards in literacy, numeracy and problem solving in technology-rich environments. These skills are “key information-processing competencies” that are relevant to adults in many social contexts and work situations, and necessary for fully integrating and participating in the labour market, education and training, and social and civic life.
In addition, the survey collects a range of information on the reading- and numeracy-related activities of respondents, the use of information and communication technologies at work and in everyday life, and on a range of generic skills, such as collaborating with others and organising one’s time, required of individuals in their work. Respondents are also asked whether their skills and qualifications match their work requirements and whether they have autonomy over key aspects of their work.
Methods
Around 166 000 adults aged 16-65 were surveyed in 24 countries and sub-national regions: 22 OECD member countries – Australia, Austria, Belgium (Flanders), Canada, the Czech Republic, Denmark, Estonia, Finland, France, Norway, Ireland, Italy, Japan, Korea, the Netherlands, Norway, Poland, the Slovak Republic, Spain, Sweden, the United Kingdom (England and Northern Ireland), and the United States; and two partner countries – Cyprus** and the Russian Federation
Data collection for the Survey of Adult Skills took place from 1 August 2011 to 31 March 2012 in most participating countries. In Canada, data collection took place from November 2011 to June 2012; and France collected data from September to November 2012.
The language of assessment was the official language or languages of each participating country. In some countries, the assessment was also conducted in widely spoken minority or regional languages.
Two components of the assessment were optional: the assessment of problem solving in technology-rich environments and the assessment of reading components. Twenty of the 24 participating countries administered the problem-solving assessment and 21 administered the reading components assessment.
The target population for the survey was the non-institutionalised population, aged 16 to 65 years, residing in the country at the time of data collection, irrespective of nationality, citizenship or language status.
Sample sizes depended primarily on the number of cognitive domains assessed and the number of languages in which the assessment was administered. Some countries boosted sample sizes in order to have reliable estimates of proficiency for the residents of particular geographical regions and/or for certain sub-groups of the population such as indigenous inhabitants or immigrants. The achieved samples ranged from a minimum of approximately 4 500 to a maximum of nearly 27 300.
The survey was administered under the supervision of trained interviewers either in the respondent’s home or in a location agreed between the respondent and the interviewer. The background questionnaire was administered in Computer-Aided Personal Interview format by the interviewer. Depending on the situation of the respondent, the time taken to complete the questionnaire ranged between 30 and 45 minutes.
After having answered the background questionnaire, the respondent completed the assessment either on a laptop computer or by completing a paper version using printed test booklets, depending on their computer skills. Respondents could take as much or as little time as needed to complete the assessment. On average, the respondents took 50 minutes to complete the cognitive assessment.
**A. Note by Turkey The information in this document with reference to “Cyprus” relates to the southern part of the Island. There is no single authority representing both Turkish and Greek Cypriot people on the Island. Turkey recognises the Turkish Republic of Northern Cyprus (TRNC). Until a lasting and equitable solution is found within the context of the United Nations, Turkey shall preserve its position concerning the “Cyprus issue”. B. Note by all the European Union Member States of the OECD and the European Union The Republic of Cyprus is recognised by all members of the United Nations with the exception of Turkey. The information in this document relates to the area under the effective control of the Government of the Republic of Cyprus.

NETHERLANDS – Country Note –Survey of Adult Skills first results
© OECD 12
Proficiency levels: Literacy and numeracy
Level Score range Literacy Numeracy Below Level
1
Below 176 points
Tasks at this level require the respondent to read brief texts on familiar topics and locate a single piece of specific information. There is seldom any competing information in the text. Only basic vocabulary knowledge is required, and the reader is not required to understand the structure of sentences or paragraphs or make use of other text features.
Tasks at this level require the respondent to carry out simple processes such as counting, sorting, performing basic arithmetic operations with whole numbers or money, or recognising common spatial representations.
1 176 to less than 226
points
Tasks at this level require the respondent to read relatively short digital or print texts to locate a single piece of information that is identical to or synonymous with the information given in the question or directive. Knowledge and skill in recognising basic vocabulary, determining the meaning of sentences, and reading paragraphs of text is expected.
Tasks at this level require the respondent to carry out basic mathematical processes in common, concrete contexts where the mathematical content is explicit. Tasks usually require one-step or simple processes involving counting; sorting; performing basic arithmetic operations; and identifying elements of simple or common graphical or spatial representations.
2 226 to less than 276
points
Tasks at this level require the respondent to make matches between the text, either digital or printed, and information, and may require paraphrasing or low-level inferences.
Tasks at this level require the application of two or more steps or processes involving calculation with whole numbers and common decimals, percents and fractions; simple measurement and spatial representation; estimation; and interpretation of relatively simple data and statistics in texts, tables and graphs.
3 276 to less than 326
points
Texts at this level are often dense or lengthy. Understanding text and rhetorical structures is often required, as is navigating complex digital texts.
Tasks at this level require the application of number sense and spatial sense; recognising and working with mathematical relationships, patterns, and proportions expressed in verbal or numerical form; and interpreting data and statistics in texts, tables and graphs.
4 326 to less than 376
points
Tasks at this level often require the respondent to perform multiple-step operations to integrate, interpret, or synthesise information from complex or lengthy texts. Many tasks require identifying and understanding one or more specific, non-central idea(s) in the text in order to interpret or evaluate subtle evidence-claim or persuasive discourse relationships.
Tasks at this level require analysis and more complex reasoning about quantities and data; statistics and chance; spatial relationships; and change, proportions and formulas. They may also require understanding arguments or communicating well-reasoned explanations for answers or choices.
5 Equal to or higher than 376 points
Tasks at this level may require the respondent to search for and integrate information across multiple, dense texts; construct syntheses of similar and contrasting ideas or points of view; or evaluate evidence based arguments. They often require respondents to be aware of subtle, rhetorical cues and to make high-level inferences or use specialised background knowledge.
Tasks at this level may require the respondent to integrate multiple types of mathematical information where considerable translation or interpretation is required; draw inferences; develop or work with mathematical arguments or models; and critically reflect on solutions or choices.
NETHERLANDS – Country Note –Survey of Adult Skills first results
© OECD 13
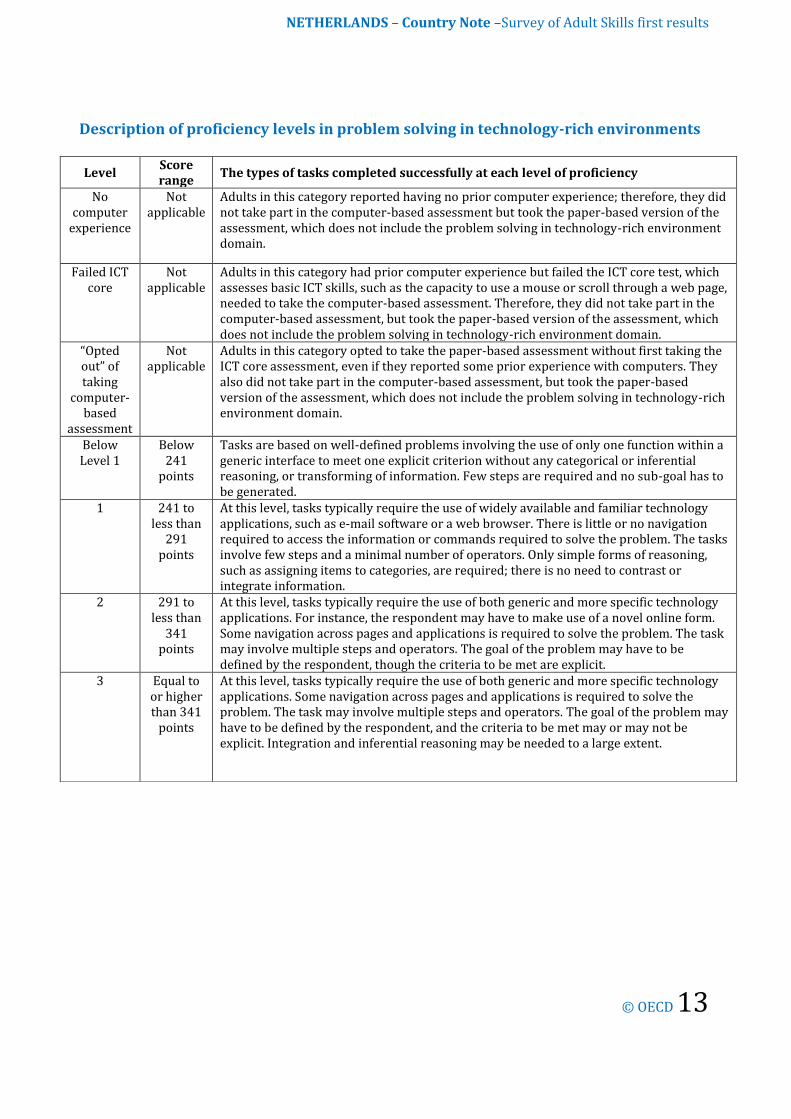
Description of proficiency levels in problem solving in technology-rich environments
Level Score range
The types of tasks completed successfully at each level of proficiency
No computer
experience
Not applicable
Adults in this category reported having no prior computer experience; therefore, they did not take part in the computer-based assessment but took the paper-based version of the assessment, which does not include the problem solving in technology-rich environment domain.
Failed ICT core
Not applicable
Adults in this category had prior computer experience but failed the ICT core test, which assesses basic ICT skills, such as the capacity to use a mouse or scroll through a web page, needed to take the computer-based assessment. Therefore, they did not take part in the computer-based assessment, but took the paper-based version of the assessment, which does not include the problem solving in technology-rich environment domain.
“Opted out” of taking
computer-based
assessment
Not applicable
Adults in this category opted to take the paper-based assessment without first taking the ICT core assessment, even if they reported some prior experience with computers. They also did not take part in the computer-based assessment, but took the paper-based version of the assessment, which does not include the problem solving in technology-rich environment domain.
Below Level 1
Below 241
points
Tasks are based on well-defined problems involving the use of only one function within a generic interface to meet one explicit criterion without any categorical or inferential reasoning, or transforming of information. Few steps are required and no sub-goal has to be generated.
1 241 to less than
291 points
At this level, tasks typically require the use of widely available and familiar technology applications, such as e-mail software or a web browser. There is little or no navigation required to access the information or commands required to solve the problem. The tasks involve few steps and a minimal number of operators. Only simple forms of reasoning, such as assigning items to categories, are required; there is no need to contrast or integrate information.
2 291 to less than
341 points
At this level, tasks typically require the use of both generic and more specific technology applications. For instance, the respondent may have to make use of a novel online form. Some navigation across pages and applications is required to solve the problem. The task may involve multiple steps and operators. The goal of the problem may have to be defined by the respondent, though the criteria to be met are explicit.
3 Equal to or higher than 341
points
At this level, tasks typically require the use of both generic and more specific technology applications. Some navigation across pages and applications is required to solve the problem. The task may involve multiple steps and operators. The goal of the problem may have to be defined by the respondent, and the criteria to be met may or may not be explicit. Integration and inferential reasoning may be needed to a large extent.

Contacts: Andreas Schleicher Advisor to the Secretary-General on Education Policy, Deputy Director for Education and Skills Email: [email protected] Telephone: +33 6 07 38 54 64 Mark Keese Head of the Employment Analysis and Policy Division, Directorate for Employment Labour and Social Affairs Email: [email protected] Telephone: +33 1 45 24 87 94 William Thorn Senior Analyst, Skills Beyond School Division, Directorate for Education and Skills Email: [email protected] Telephone: +33 1 45 24 78 04
For more information on the Survey of Adult Skills (PIAAC) and to access the full OECD Skills Outlook 2013 report, visit:
http://skills.oecd.org/skillsoutlook.html
www.oecd.org/site/piaac


![Luftwaffe Airfields 1935-45 the Netherlands - Netherlands.pdf · Luftwaffe Airfields 1935-45 the Netherlands By Henry L. deZeng IV ... web site ww2.dk] ... bulk fuel storage was in](https://img.pdfslide.us/doc/110x75/5a78d9b37f8b9ae6228de77d/luftwaffe-airfields-1935-45-the-netherlandspdfluftwaffe-airfields-1935-45-the.jpg)