Embed Size (px)
Citation preview

NETAPP TECHNICAL REPORT
Performance Report: Multiprotocol Performance Test of VMware
® ESX 3.5 on NetApp Storage Systems
A Performance Comparison Study of FC, iSCSI, and NFS Protocols
Jack McLeod, NetApp
June 2008 | TR-3697
ABSTRACT
This document compares the performance of FC, iSCSI, and NFS protocols using VMware® ESX 3.5 on NetApp® storage systems. This document seeks to compare the individual protocol performance and CPU utilization at varying workloads.
1
© 2008 NetApp and VMware, Inc. All rights reserved. Specifications are subject to change without
notice. NetApp, the NetApp logo, Go further, faster, Data ONTAP, FilerView, FlexVol, RAID-DP,
and Snapshot are trademarks or registered trademarks of NetApp, Inc. in the United States and/or
other countries. Windows is a registered trademark of Microsoft Corporation. Linux is a registered
trademark of Linus Torvalds. Intel is a registered trademark of Intel Corporation. VMware, the
VMware “boxes” logo and design, Virtual SMP and VMotion are registered trademarks or
trademarks of VMware, Inc. in the United States and/or other jurisdictions. UNIX is a registered
trademark of The Open Group. All other brands or products are trademarks or registered trademarks
of their respective holders and should be treated as such.
2
TABLE OF CONTENTS
1 INTRODUCTION ......................................................................................................................... 3
2 ADDITIONAL INFORMATION .................................................................................................... 3
2.1 TEST OBJECTIVE ....................................................................................................................................... 3
2.2 VMWARE ESX 3.5 DATA CENTER SUMMARY .......................................................................................... 4
2.3 HARDWARE AND SOFTWARE ENVIRONMENT ....................................................................................... 4
2.4 PROVISIONING NETAPP STORAGE TO THE VMWARE ESX 3.5 HOST SERVERS ................................ 7
2.5 WORKLOAD DEFINITION AND IOMETER CONFIGURATION ................................................................... 9
3 PERFORMANCE RESULTS USING A WORKLOAD CONSISTING OF A 4K REQUEST SIZE, 60%
READ, 40% WRITES, AND 75% SEQUENTIAL ACCESS ............................................................ 12
3.1 RELATIVE THROUGHPUT COMPARISON ............................................................................................... 12
3.2 AVERAGE ESX 3.5 SERVER CPU UTILIZATION COMPARISON ............................................................ 13
4 PERFORMANCE RESULTS USING A WORKLOAD CONSISTING OF A 4K REQUEST SIZE, 75%
READ, 25% WRITES, AND 100% RANDOM ACCESS ................................................................. 13
4.1 RELATIVE THROUGHPUT COMPARISON ............................................................................................... 13
4.2 AVERAGE ESX 3.5 SERVER CPU UTILIZATION COMPARISON ............................................................ 14
5 PERFORMANCE RESULTS USING A WORKLOAD CONSISTING OF AN 8K REQUEST SIZE, 60%
READ, 40% WRITES, AND 75% SEQUENTIAL ACCESS ............................................................ 15
5.1 RELATIVE THROUGHPUT COMPARISON ............................................................................................... 15
5.2 AVERAGE ESX 3.5 SERVER CPU UTILIZATION COMPARISON ............................................................ 16
6 PERFORMANCE RESULTS USING A WORKLOAD CONSISTING OF AN 8K REQUEST SIZE, 75%
READ, 25% WRITES, AND 100% RANDOM ACCESS ................................................................. 17
6.1 RELATIVE THROUGHPUT COMPARISON ............................................................................................... 17
6.2 AVERAGE ESX 3.5 SERVER CPU UTILIZATION ..................................................................................... 18
7 CONCLUSION ........................................................................................................................... 19
7.1 KEY TAKEAWAYS .................................................................................................................................... 19
8 REFERENCES .......................................................................................................................... 21
8.1 NETAPP AND VMWARE ESX BEST PRACTICES AND CONFIGURATION GUIDES .............................. 21
8.2 VMWARE BEST PRACTICE AND USER GUIDES .................................................................................... 21
3
1 INTRODUCTION
Both NetApp storage arrays and VMware® ESX 3.5 natively support data access using three storage
protocols: FC, iSCSI, and NFS. Due to the protocol flexibility and neutrality of both companies,
many discussions have been had around the water cooler comparing the administrative pros and cons
of the storage protocols as well as how they compare from a performance perspective in an ESX
environment. This technical report, completed jointly by VMware and NetApp, shares the results of
testing conducted to compare the performance of FC, software-initiated iSCSI, and NFS in an ESX
3.5 environment using NetApp storage. The results compare the performance of the three protocols
with a goal of aiding customer decisions as they build out their virtual infrastructures.
The performance tests sought to simulate a “real world” environment. This design is composed of
components and architectures commonly found in a typical VMware implementation that include
using the FC, iSCSI, and NFS protocols in a multiple virtual machine (VM), multiple ESX 3.5 host
environment accessing a single data store. Our performance tests used realistic I/O patterns with true
to life block sizes, read/write mixes, and I/O loads.
During the tests we measured the total throughput generated using each protocol at a variety of
points simulating low, typical, and heavy workloads as experienced by ESX. While you might not
drive your ESX environment to these levels, we believe it’s valuable to discover how the protocols
behave at extremely high levels of activity.
We configured a VMware data center consisting of two ESX 3.5 host systems, each configured with
a total of eight VMs running Windows® Server 2003 Enterprise Edition and SP2. Additionally, we
used a NetApp FAS3070 controller to provide storage for the data accessed by the VMs during the
performance testing. We used the identical test infrastructure and loads for all three protocols under
test.
Once the environment was set up we used the industry standard Iometer benchmark to measure the
performance of each protocol using workloads ranging from light to heavy amounts of I/O from the
ESX hosts to the NetApp FAS3070 storage used for the tests. For each protocol we recorded the
overall throughput and the individual ESX host CPU utilization. We then averaged the results of the
ESX host CPU utilization across both hosts. We used the same data sets for each test, and we
measured I/O scalability at the data store level during the tests.
2 ADDITIONAL INFORMATION
2.1 TEST OBJECTIVE
The goal of this testing was to compare the throughput capabilities of ESX 3.5 with NetApp storage
using FC, iSCSI, and NFS protocols in a real world environment. The data below was part of the
required observations resulting from these tests:
Protocol comparisons at lower loads
Protocol comparisons at higher loads
VMware ESX 3.5 host CPU consumption at each workload level
4
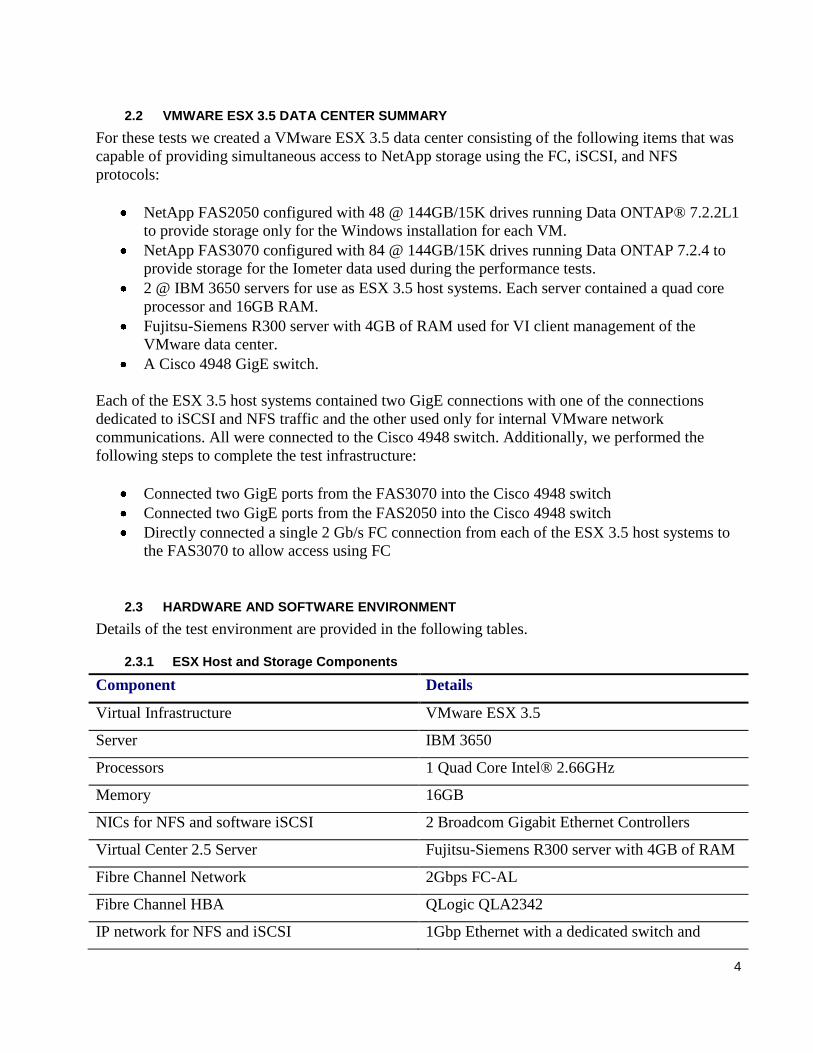
2.2 VMWARE ESX 3.5 DATA CENTER SUMMARY
For these tests we created a VMware ESX 3.5 data center consisting of the following items that was
capable of providing simultaneous access to NetApp storage using the FC, iSCSI, and NFS
protocols:
NetApp FAS2050 configured with 48 @ 144GB/15K drives running Data ONTAP® 7.2.2L1
to provide storage only for the Windows installation for each VM.
NetApp FAS3070 configured with 84 @ 144GB/15K drives running Data ONTAP 7.2.4 to
provide storage for the Iometer data used during the performance tests.
2 @ IBM 3650 servers for use as ESX 3.5 host systems. Each server contained a quad core
processor and 16GB RAM.
Fujitsu-Siemens R300 server with 4GB of RAM used for VI client management of the
VMware data center.
A Cisco 4948 GigE switch.
Each of the ESX 3.5 host systems contained two GigE connections with one of the connections
dedicated to iSCSI and NFS traffic and the other used only for internal VMware network
communications. All were connected to the Cisco 4948 switch. Additionally, we performed the
following steps to complete the test infrastructure:
Connected two GigE ports from the FAS3070 into the Cisco 4948 switch
Connected two GigE ports from the FAS2050 into the Cisco 4948 switch
Directly connected a single 2 Gb/s FC connection from each of the ESX 3.5 host systems to
the FAS3070 to allow access using FC
2.3 HARDWARE AND SOFTWARE ENVIRONMENT
Details of the test environment are provided in the following tables.
2.3.1 ESX Host and Storage Components
Component Details
Virtual Infrastructure VMware ESX 3.5
Server IBM 3650
Processors 1 Quad Core Intel® 2.66GHz
Memory 16GB
NICs for NFS and software iSCSI 2 Broadcom Gigabit Ethernet Controllers
Virtual Center 2.5 Server Fujitsu-Siemens R300 server with 4GB of RAM
Fibre Channel Network 2Gbps FC-AL
Fibre Channel HBA QLogic QLA2342
IP network for NFS and iSCSI 1Gbp Ethernet with a dedicated switch and
5
VLAN
Gigabit Ethernet Switch Cisco Catalyst 4948 w/ 48 ports Firmware v3.1.3
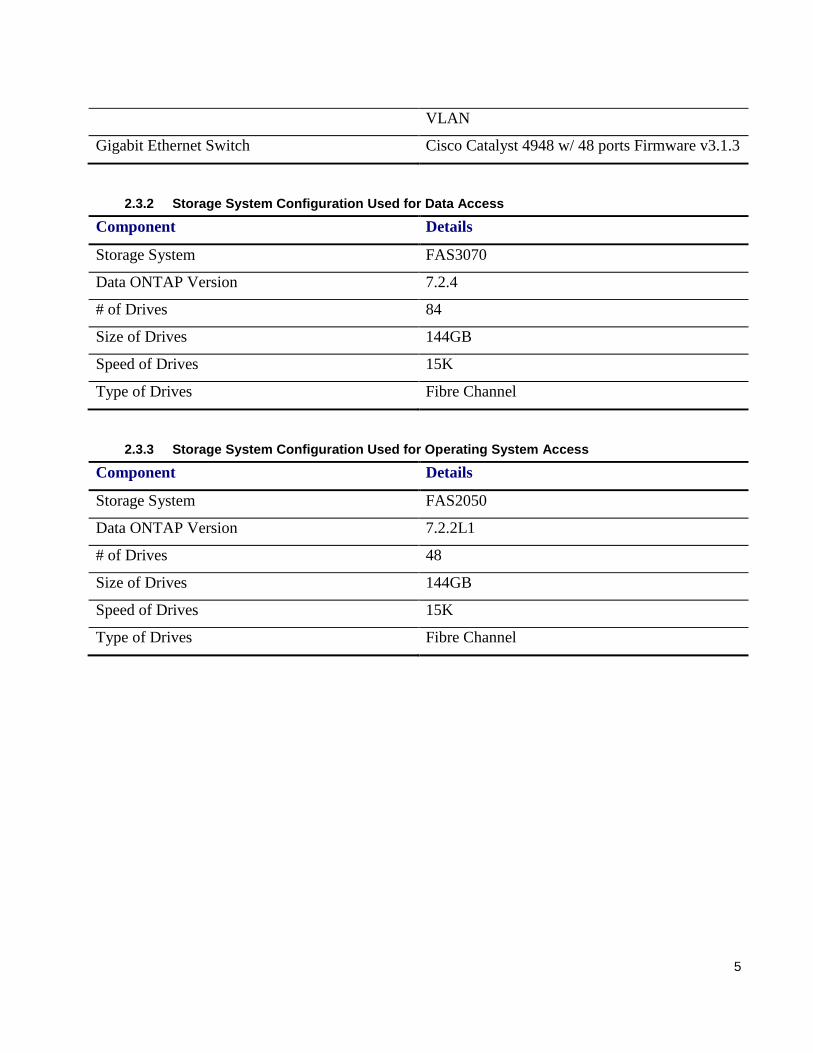
2.3.2 Storage System Configuration Used for Data Access
Component Details
Storage System FAS3070
Data ONTAP Version 7.2.4
# of Drives 84
Size of Drives 144GB
Speed of Drives 15K
Type of Drives Fibre Channel
2.3.3 Storage System Configuration Used for Operating System Access
Component Details
Storage System FAS2050
Data ONTAP Version 7.2.2L1
# of Drives 48
Size of Drives 144GB
Speed of Drives 15K
Type of Drives Fibre Channel

6
2.3.4 Infrastructure Diagram
Figure 1) Network diagram of performance testing configuration
7
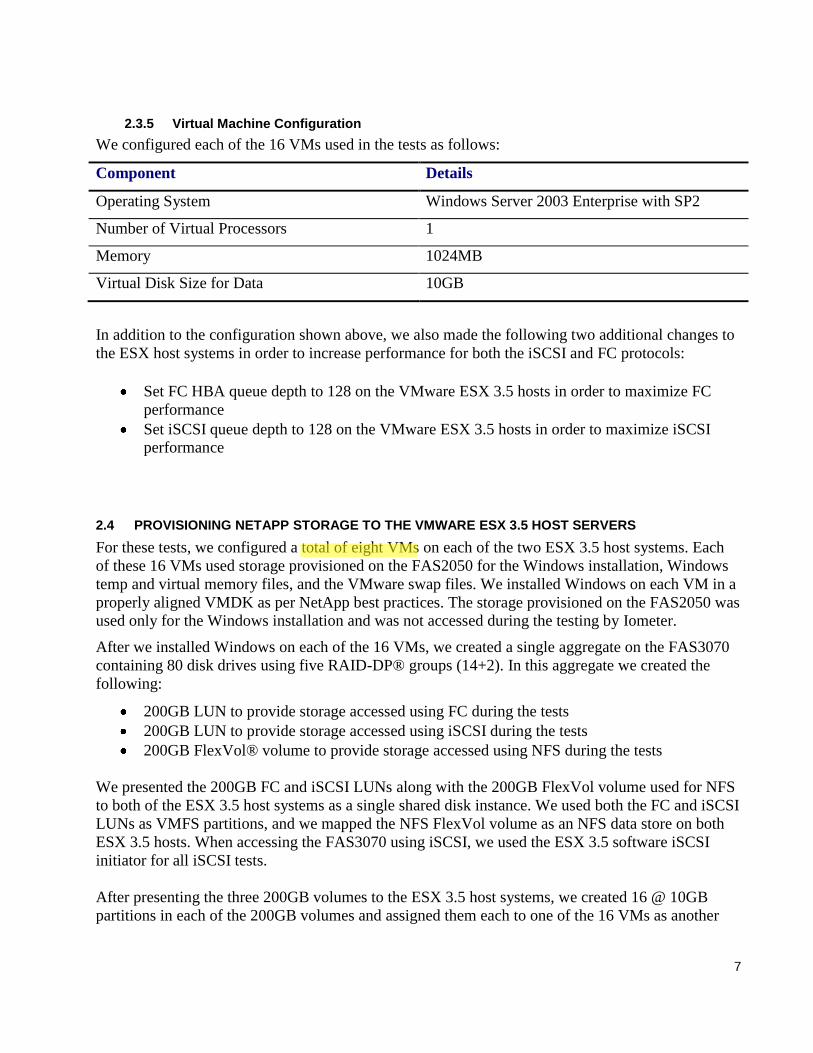
2.3.5 Virtual Machine Configuration
We configured each of the 16 VMs used in the tests as follows:
Component Details
Operating System Windows Server 2003 Enterprise with SP2
Number of Virtual Processors 1
Memory 1024MB
Virtual Disk Size for Data 10GB
In addition to the configuration shown above, we also made the following two additional changes to
the ESX host systems in order to increase performance for both the iSCSI and FC protocols:
Set FC HBA queue depth to 128 on the VMware ESX 3.5 hosts in order to maximize FC
performance
Set iSCSI queue depth to 128 on the VMware ESX 3.5 hosts in order to maximize iSCSI
performance
2.4 PROVISIONING NETAPP STORAGE TO THE VMWARE ESX 3.5 HOST SERVERS
For these tests, we configured a total of eight VMs on each of the two ESX 3.5 host systems. Each
of these 16 VMs used storage provisioned on the FAS2050 for the Windows installation, Windows
temp and virtual memory files, and the VMware swap files. We installed Windows on each VM in a
properly aligned VMDK as per NetApp best practices. The storage provisioned on the FAS2050 was
used only for the Windows installation and was not accessed during the testing by Iometer.
After we installed Windows on each of the 16 VMs, we created a single aggregate on the FAS3070
containing 80 disk drives using five RAID-DP® groups (14+2). In this aggregate we created the
following:
200GB LUN to provide storage accessed using FC during the tests
200GB LUN to provide storage accessed using iSCSI during the tests
200GB FlexVol® volume to provide storage accessed using NFS during the tests
We presented the 200GB FC and iSCSI LUNs along with the 200GB FlexVol volume used for NFS
to both of the ESX 3.5 host systems as a single shared disk instance. We used both the FC and iSCSI
LUNs as VMFS partitions, and we mapped the NFS FlexVol volume as an NFS data store on both
ESX 3.5 hosts. When accessing the FAS3070 using iSCSI, we used the ESX 3.5 software iSCSI
initiator for all iSCSI tests.
After presenting the three 200GB volumes to the ESX 3.5 host systems, we created 16 @ 10GB
partitions in each of the 200GB volumes and assigned them each to one of the 16 VMs as another
8
VMDK for use during the testing. The result was a total of three additional 10GB virtual disks added
to each of the 16 VMs with each accessed by a different protocol.
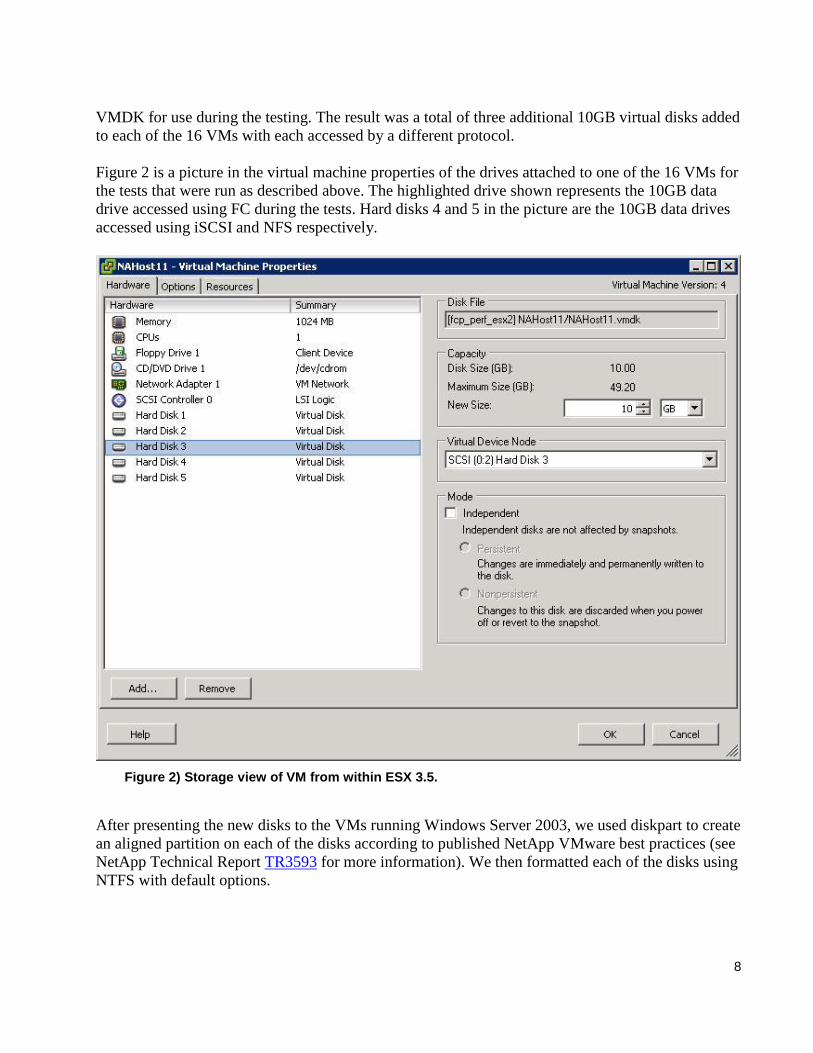
Figure 2 is a picture in the virtual machine properties of the drives attached to one of the 16 VMs for
the tests that were run as described above. The highlighted drive shown represents the 10GB data
drive accessed using FC during the tests. Hard disks 4 and 5 in the picture are the 10GB data drives
accessed using iSCSI and NFS respectively.
Figure 2) Storage view of VM from within ESX 3.5.
After presenting the new disks to the VMs running Windows Server 2003, we used diskpart to create
an aligned partition on each of the disks according to published NetApp VMware best practices (see
NetApp Technical Report TR3593 for more information). We then formatted each of the disks using
NTFS with default options.
9
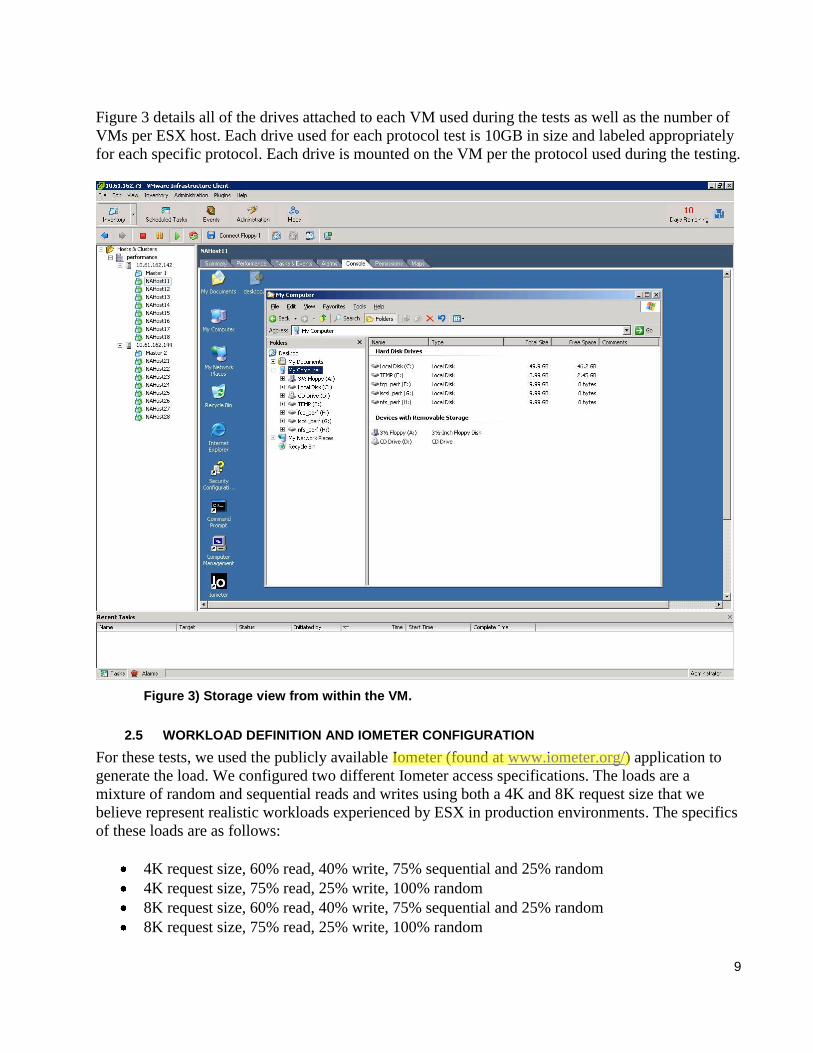
Figure 3 details all of the drives attached to each VM used during the tests as well as the number of
VMs per ESX host. Each drive used for each protocol test is 10GB in size and labeled appropriately
for each specific protocol. Each drive is mounted on the VM per the protocol used during the testing.
Figure 3) Storage view from within the VM.
2.5 WORKLOAD DEFINITION AND IOMETER CONFIGURATION
For these tests, we used the publicly available Iometer (found at www.iometer.org/) application to
generate the load. We configured two different Iometer access specifications. The loads are a
mixture of random and sequential reads and writes using both a 4K and 8K request size that we
believe represent realistic workloads experienced by ESX in production environments. The specifics
of these loads are as follows:
4K request size, 60% read, 40% write, 75% sequential and 25% random
4K request size, 75% read, 25% write, 100% random
8K request size, 60% read, 40% write, 75% sequential and 25% random
8K request size, 75% read, 25% write, 100% random
10
For these tests we configured Iometer as follows:
Installed the Iometer controller application on the server running VI client.
Installed the Iometer dynamo load generation application on each of the 16 VMs in the data
center.
Configured the dynamo applications to correctly log into the Iometer controller.
Each of the VMs that log into the Iometer controller report all the disk targets that appears under
Windows. This includes each of the three 10GB virtual disks, one for use when testing FC another
for iSCSI and one for NFS.
Because each Iometer worker reported each disk, it was a simple matter to drive the load using
different protocols by selecting one of the three available disk targets presented to Iometer by each
of the VMs participating in the test.
To initialize the data stores, we created a total of two additional Iometer workers on each of the VMs
for a total of three workers for each VM. We then created an Iometer access specification to generate
a 100% random read load and manually assigned one of the three Iometer workers on each VM to
each of the three 10GB disk targets. We then executed the random read access specification from all
of the workers, allowing Iometer to create a 10GB data file called "iobw.tst" in each of the 48 virtual
disks. We did not use the results of this random read test. It was used only to initialize the virtual
disks associated with the VMs.
After initializing the data stores, we deleted the two additional Iometer workers from each of the 16
VMs. This left only a single Iometer worker running on each VM. For all of the remaining testing,
each VM ran only a single Iometer worker.
After having Iometer initialize the test files, we created a Snapshot™ copy of the aggregate
containing the three FlexVol volumes defined above.
During the tests, we used a single Iometer worker running from each of the VMs running to generate
the load. To control the load placed on the ESX 3.5 hosts during the tests, we modified the number
of outstanding I/Os that each of the Iometer workers used during the testing. Varying the number of
outstanding I/Os used by each Iometer worker allowed for dialing the load up or down depending on
the test case.
Before running the tests, we made the following changes to the default ESX 3.5 configuration based
on VMware performance tuning best practices:
Manually set the queue depth of the QLogic FC HBAs in the ESX 3.5 host systems to 128 as
described in VMware’s SAN configuration guide.
Manually set the queue depth of the iSCSI initiator on each of the ESX 3.5 host systems to
128 as described in VMware’s iSCSI SAN configuration guide.
11
In addition to increasing the queue depths above, we configured the following options on the
FAS3070 according to NetApp best practices to maximize the NFS performance. We enabled the
no_atime_update volume option on the FlexVol volume providing storage accessed using NFS and
increased the TCP receive windows size for NFS by issuing the following commands:
vol options <nfs_flex_vol_name> no_atime_update on
options nfs.tcp.recvwindowsize 64240
When conducting the tests, we used the following methodology for each workload defined above for
FC, iSCSI, and NFS:
For each Iometer worker, assign the worker a specific disk target such that all I/O generated
during the test used the specific protocol under test. For example, to test FC performance,
assign each of the 16 Iometer workers a disk target accessed using only the FC protocol.
Initially configure the single Iometer worker running on each VM to use a total of one
outstanding I/O for a total load of 16 outstanding I/Os generated against the specific disk
target under test. Run the test and record the results.
For subsequent tests, increase the load generated by each VM by successively doubling the
number of outstanding I/Os assigned to each of the Iometer workers on each VM until a total
of 16 outstanding I/Os per VM or 256 total outstanding I/Os is generated.
After completing all test cases for a specific protocol, we performed an aggregate snap
restore on the main aggregate on the FAS3070 to make sure the Iometer data files were the
same state for all of the protocols under test.
The Iometer test cases ran for a total of five minutes, including a three-minute ramp up time to allow
performance to reach a steady state before Iometer began to record results. Additionally, each of the
Iometer workers was configured to access the entire 10GB of the associated data file, resulting in
160GB of data being accessed for all test cases. The total size of this working set was large enough
so that it could not be effectively cached on the FAS3070, resulting in modest to high levels of disk
activity on the FAS3070 depending on the number of outstanding I/Os used in the test.
In addition to gathering results of the performance testing, we recorded processor utilization data
from each of the ESX 3.5 host systems using the performance monitoring features of the VMware
VI client.
Finally, it’s worth noting that these test cases were not designed to highlight the differences between
the protocols from a raw bandwidth perspective. The smaller 4K and 8K requests generated large
numbers of requests (that is, IOPS) but don’t necessarily move amounts of data large enough to
saturate the GigE network or FC connections. For example, with a given load we would not expect
to see FC deliver twice the numbers of IOPS compared to iSCSI or NFS.
12
3 PERFORMANCE RESULTS USING A WORKLOAD CONSISTING OF A 4K REQUEST SIZE, 60% READ, 40% WRITES, AND 75% SEQUENTIAL ACCESS
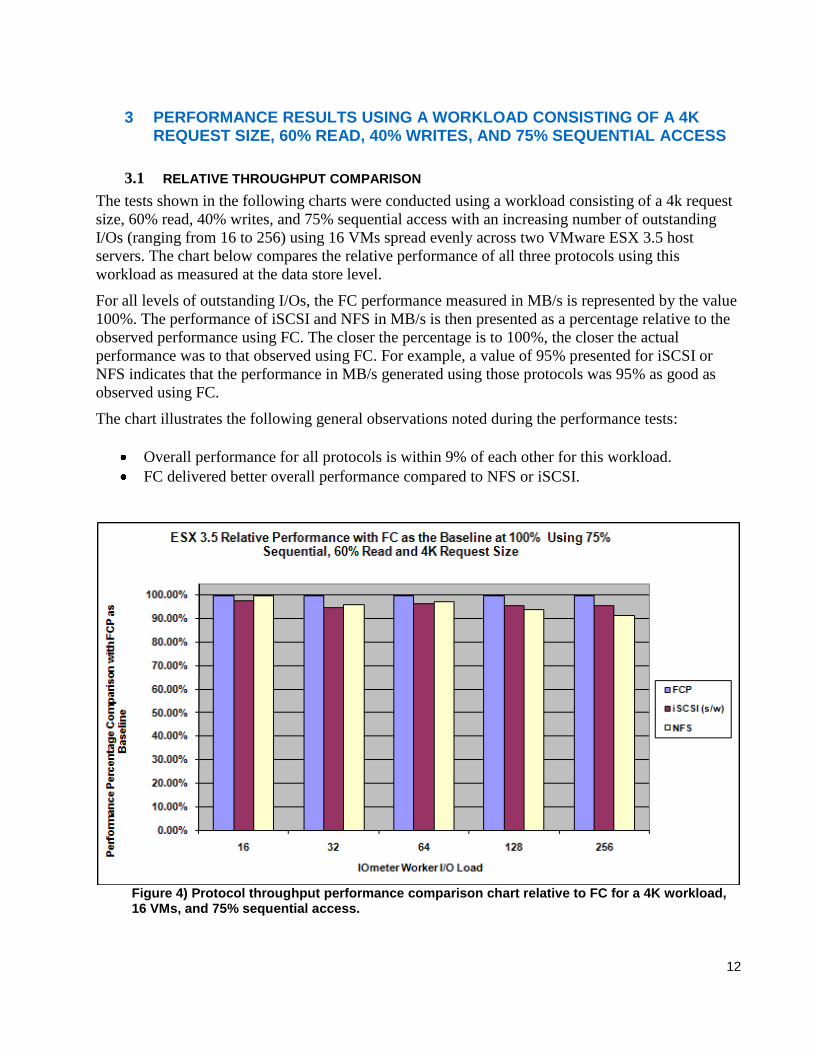
3.1 RELATIVE THROUGHPUT COMPARISON
The tests shown in the following charts were conducted using a workload consisting of a 4k request
size, 60% read, 40% writes, and 75% sequential access with an increasing number of outstanding
I/Os (ranging from 16 to 256) using 16 VMs spread evenly across two VMware ESX 3.5 host
servers. The chart below compares the relative performance of all three protocols using this
workload as measured at the data store level.
For all levels of outstanding I/Os, the FC performance measured in MB/s is represented by the value
100%. The performance of iSCSI and NFS in MB/s is then presented as a percentage relative to the
observed performance using FC. The closer the percentage is to 100%, the closer the actual
performance was to that observed using FC. For example, a value of 95% presented for iSCSI or
NFS indicates that the performance in MB/s generated using those protocols was 95% as good as
observed using FC.
The chart illustrates the following general observations noted during the performance tests:
Overall performance for all protocols is within 9% of each other for this workload.
FC delivered better overall performance compared to NFS or iSCSI.
Figure 4) Protocol throughput performance comparison chart relative to FC for a 4K workload, 16 VMs, and 75% sequential access.

13
3.2 AVERAGE ESX 3.5 SERVER CPU UTILIZATION COMPARISON
The chart below compares the ESX host CPU utilization observed during the tests for FC, iSCSI,
and NFS. For all levels of CPU utilization, the CPU utilization recorded using FC is represented by
the value 100%. The CPU utilization recorded using iSCSI and NFS is then presented as a
percentage relative to that observed using FC. The closer the percentage is to 100%, the closer the
actual CPU utilization was to that observed using FC. For example, a value of 120% presented for
iSCSI or NFS indicates that the CPU utilization observed using those protocols was 20% higher
compared to the CPU utilization observed using FC.
With regard to ESX host processor utilization, we observed the following:
Using FC generated noticeably lower overall host ESX 3.5 host CPU utilization compared to
iSCSI and NFS at all levels of concurrent I/Os.
iSCSI achieved the highest maximum average ESX 3.5 host CPU utilization during all tests
for this workload.
Figure 5) Host CPU utilization chart relative to FCP for a 4K workload, 16 VMs, and 75% sequential access.
4 PERFORMANCE RESULTS USING A WORKLOAD CONSISTING OF A 4K REQUEST SIZE, 75% READ, 25% WRITES, AND 100% RANDOM ACCESS
4.1 RELATIVE THROUGHPUT COMPARISON
The tests shown in the following charts were conducted using a workload consisting of a 4k request
size, 75% read, 25% writes, and 100% random access with an increasing number of outstanding I/Os
14
(ranging from 16 to 256) using 16 VMs spread evenly across two VMware ESX 3.5 host servers.
The chart below compares the relative performance of all three protocols using this workload as
measured at the data store level.
For all levels of outstanding I/Os, the FC performance measured in MB/s is represented by the value
100%. The performance of iSCSI and NFS in MB/s is then presented as a percentage relative to the
observed performance using FC. The closer the percentage is to 100%, the closer the actual
performance was to that observed using FC. For example, a value of 95% presented for iSCSI or
NFS indicates that the performance in MB/s generated using those protocols was 95% as good as
observed using FC.
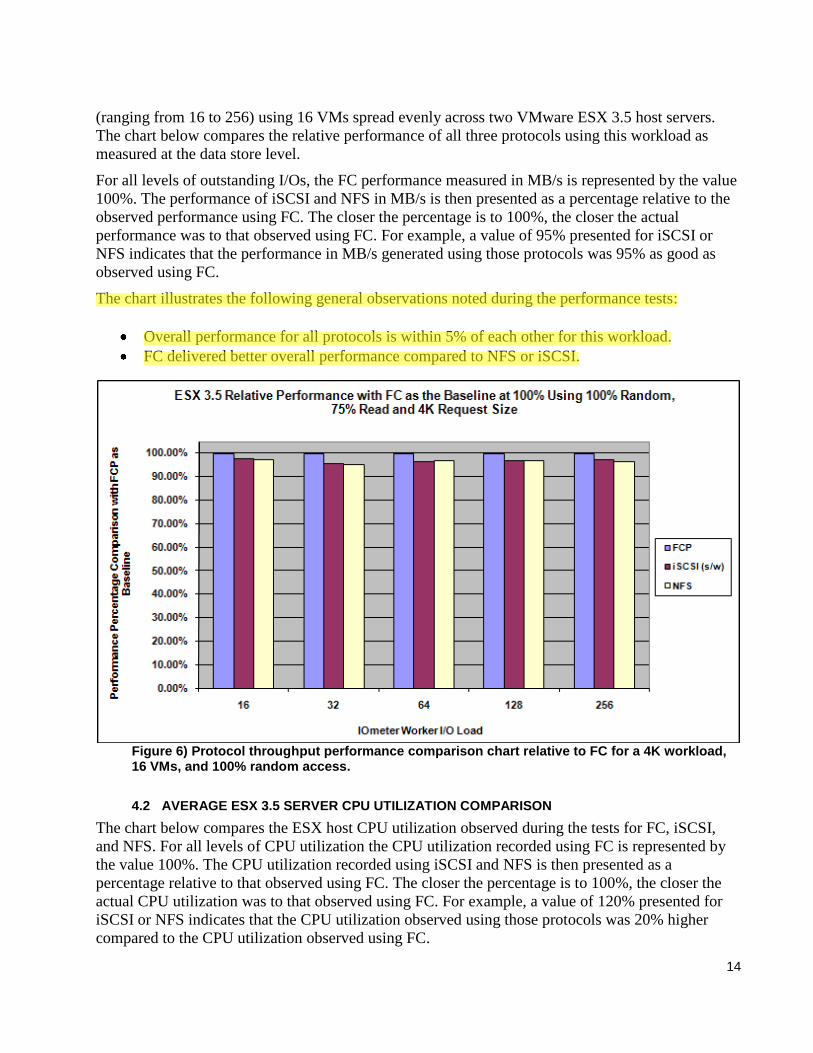
The chart illustrates the following general observations noted during the performance tests:
Overall performance for all protocols is within 5% of each other for this workload.
FC delivered better overall performance compared to NFS or iSCSI.
Figure 6) Protocol throughput performance comparison chart relative to FC for a 4K workload, 16 VMs, and 100% random access.
4.2 AVERAGE ESX 3.5 SERVER CPU UTILIZATION COMPARISON
The chart below compares the ESX host CPU utilization observed during the tests for FC, iSCSI,
and NFS. For all levels of CPU utilization the CPU utilization recorded using FC is represented by
the value 100%. The CPU utilization recorded using iSCSI and NFS is then presented as a
percentage relative to that observed using FC. The closer the percentage is to 100%, the closer the
actual CPU utilization was to that observed using FC. For example, a value of 120% presented for
iSCSI or NFS indicates that the CPU utilization observed using those protocols was 20% higher
compared to the CPU utilization observed using FC.
15
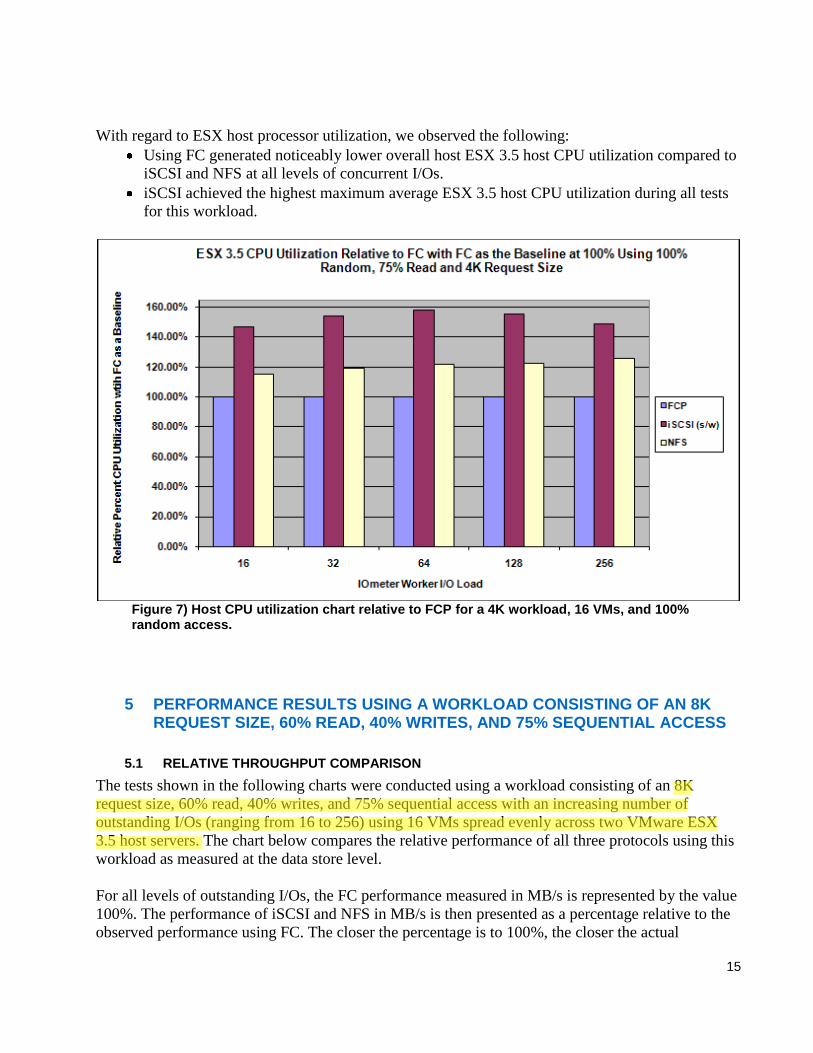
With regard to ESX host processor utilization, we observed the following:
Using FC generated noticeably lower overall host ESX 3.5 host CPU utilization compared to
iSCSI and NFS at all levels of concurrent I/Os.
iSCSI achieved the highest maximum average ESX 3.5 host CPU utilization during all tests
for this workload.
Figure 7) Host CPU utilization chart relative to FCP for a 4K workload, 16 VMs, and 100% random access.
5 PERFORMANCE RESULTS USING A WORKLOAD CONSISTING OF AN 8K REQUEST SIZE, 60% READ, 40% WRITES, AND 75% SEQUENTIAL ACCESS
5.1 RELATIVE THROUGHPUT COMPARISON
The tests shown in the following charts were conducted using a workload consisting of an 8K
request size, 60% read, 40% writes, and 75% sequential access with an increasing number of
outstanding I/Os (ranging from 16 to 256) using 16 VMs spread evenly across two VMware ESX
3.5 host servers. The chart below compares the relative performance of all three protocols using this
workload as measured at the data store level.
For all levels of outstanding I/Os, the FC performance measured in MB/s is represented by the value
100%. The performance of iSCSI and NFS in MB/s is then presented as a percentage relative to the
observed performance using FC. The closer the percentage is to 100%, the closer the actual
16
performance was to that observed using FC. For example, a value of 95% presented for iSCSI or
NFS indicates that the performance in MB/s generated using those protocols was 95% as good as
observed using FC.
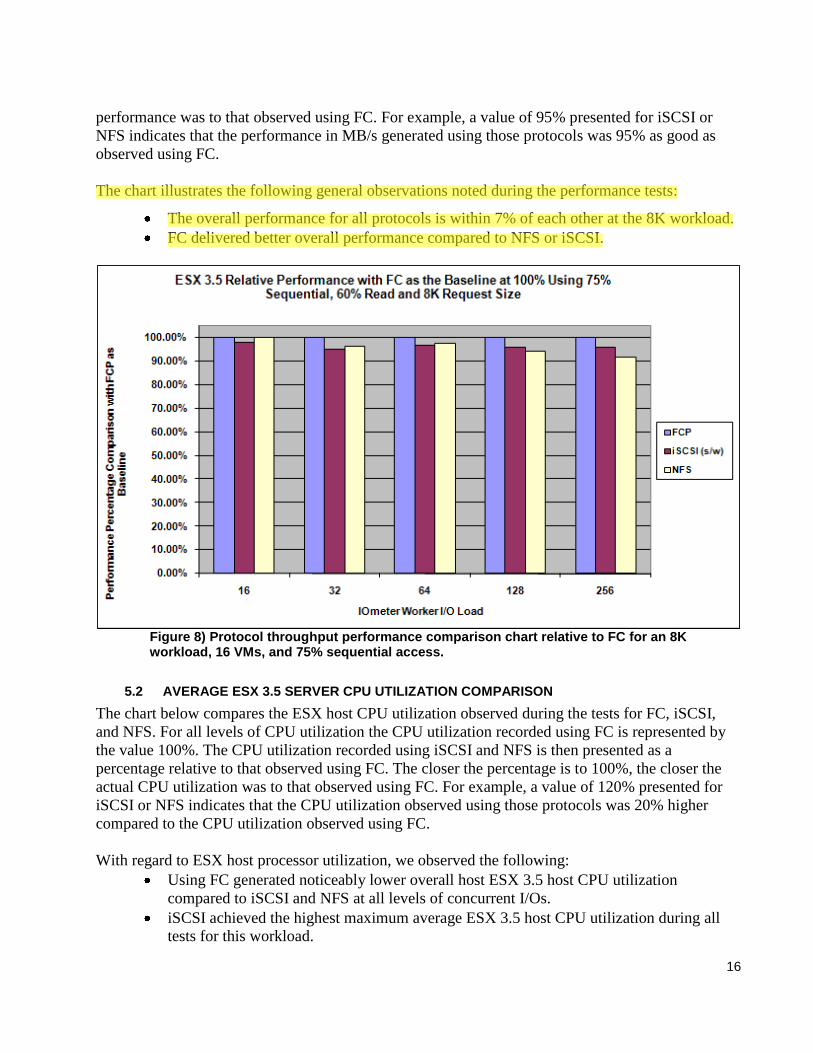
The chart illustrates the following general observations noted during the performance tests:
The overall performance for all protocols is within 7% of each other at the 8K workload.
FC delivered better overall performance compared to NFS or iSCSI.
Figure 8) Protocol throughput performance comparison chart relative to FC for an 8K workload, 16 VMs, and 75% sequential access.
5.2 AVERAGE ESX 3.5 SERVER CPU UTILIZATION COMPARISON
The chart below compares the ESX host CPU utilization observed during the tests for FC, iSCSI,
and NFS. For all levels of CPU utilization the CPU utilization recorded using FC is represented by
the value 100%. The CPU utilization recorded using iSCSI and NFS is then presented as a
percentage relative to that observed using FC. The closer the percentage is to 100%, the closer the
actual CPU utilization was to that observed using FC. For example, a value of 120% presented for
iSCSI or NFS indicates that the CPU utilization observed using those protocols was 20% higher
compared to the CPU utilization observed using FC.
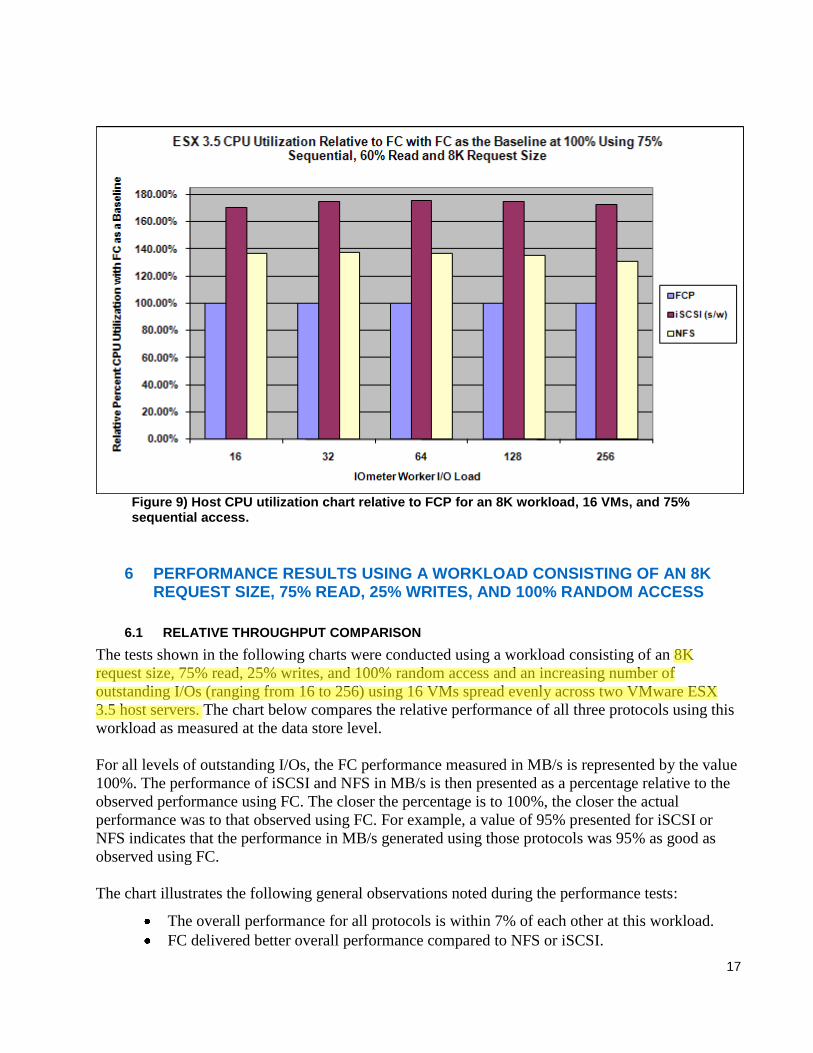
With regard to ESX host processor utilization, we observed the following:
Using FC generated noticeably lower overall host ESX 3.5 host CPU utilization
compared to iSCSI and NFS at all levels of concurrent I/Os.
iSCSI achieved the highest maximum average ESX 3.5 host CPU utilization during all
tests for this workload.
17
Figure 9) Host CPU utilization chart relative to FCP for an 8K workload, 16 VMs, and 75% sequential access.
6 PERFORMANCE RESULTS USING A WORKLOAD CONSISTING OF AN 8K REQUEST SIZE, 75% READ, 25% WRITES, AND 100% RANDOM ACCESS
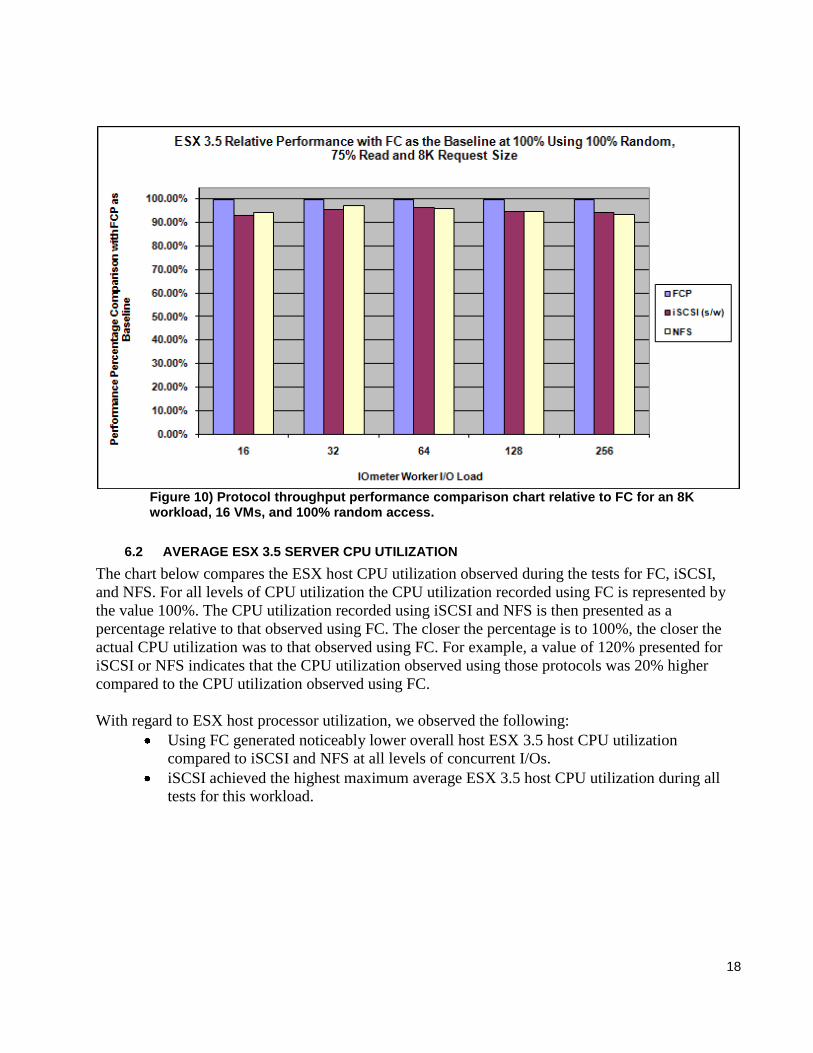
6.1 RELATIVE THROUGHPUT COMPARISON
The tests shown in the following charts were conducted using a workload consisting of an 8K
request size, 75% read, 25% writes, and 100% random access and an increasing number of
outstanding I/Os (ranging from 16 to 256) using 16 VMs spread evenly across two VMware ESX
3.5 host servers. The chart below compares the relative performance of all three protocols using this
workload as measured at the data store level.
For all levels of outstanding I/Os, the FC performance measured in MB/s is represented by the value
100%. The performance of iSCSI and NFS in MB/s is then presented as a percentage relative to the
observed performance using FC. The closer the percentage is to 100%, the closer the actual
performance was to that observed using FC. For example, a value of 95% presented for iSCSI or
NFS indicates that the performance in MB/s generated using those protocols was 95% as good as
observed using FC.
The chart illustrates the following general observations noted during the performance tests:
The overall performance for all protocols is within 7% of each other at this workload.
FC delivered better overall performance compared to NFS or iSCSI.
18
Figure 10) Protocol throughput performance comparison chart relative to FC for an 8K workload, 16 VMs, and 100% random access.
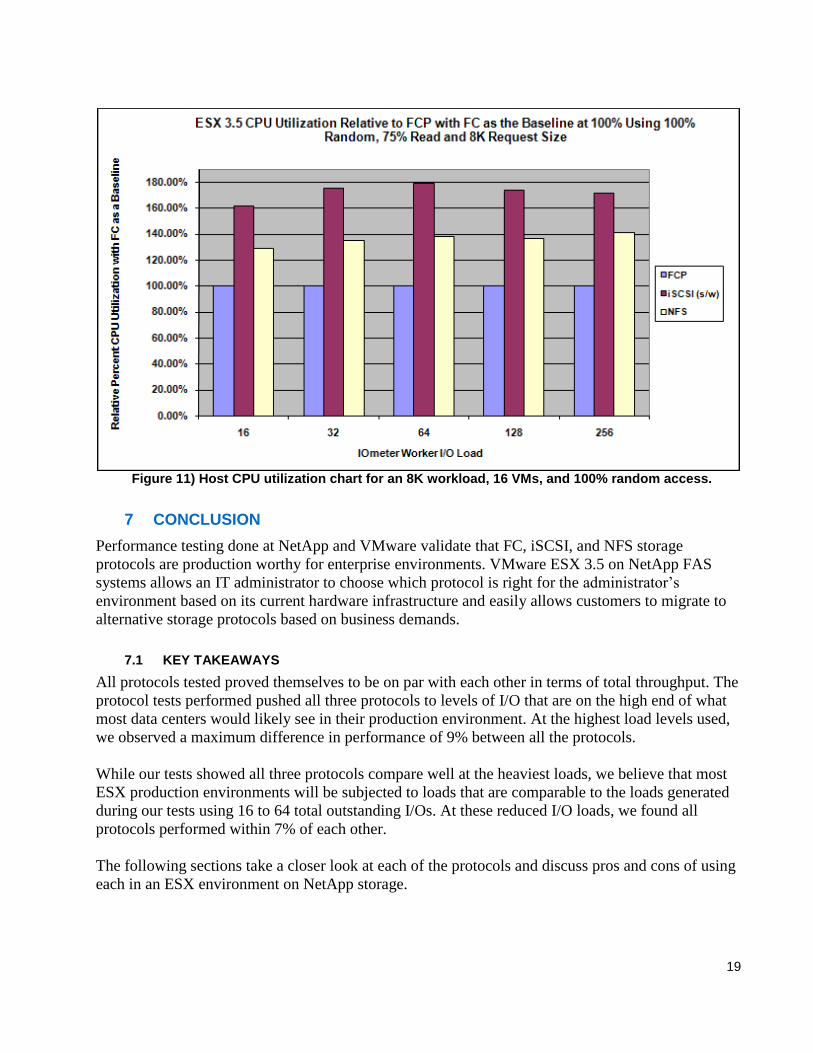
6.2 AVERAGE ESX 3.5 SERVER CPU UTILIZATION
The chart below compares the ESX host CPU utilization observed during the tests for FC, iSCSI,
and NFS. For all levels of CPU utilization the CPU utilization recorded using FC is represented by
the value 100%. The CPU utilization recorded using iSCSI and NFS is then presented as a
percentage relative to that observed using FC. The closer the percentage is to 100%, the closer the
actual CPU utilization was to that observed using FC. For example, a value of 120% presented for
iSCSI or NFS indicates that the CPU utilization observed using those protocols was 20% higher
compared to the CPU utilization observed using FC.
With regard to ESX host processor utilization, we observed the following:
Using FC generated noticeably lower overall host ESX 3.5 host CPU utilization
compared to iSCSI and NFS at all levels of concurrent I/Os.
iSCSI achieved the highest maximum average ESX 3.5 host CPU utilization during all
tests for this workload.
19
Figure 11) Host CPU utilization chart for an 8K workload, 16 VMs, and 100% random access.
7 CONCLUSION
Performance testing done at NetApp and VMware validate that FC, iSCSI, and NFS storage
protocols are production worthy for enterprise environments. VMware ESX 3.5 on NetApp FAS
systems allows an IT administrator to choose which protocol is right for the administrator’s
environment based on its current hardware infrastructure and easily allows customers to migrate to
alternative storage protocols based on business demands.
7.1 KEY TAKEAWAYS
All protocols tested proved themselves to be on par with each other in terms of total throughput. The
protocol tests performed pushed all three protocols to levels of I/O that are on the high end of what
most data centers would likely see in their production environment. At the highest load levels used,
we observed a maximum difference in performance of 9% between all the protocols.
While our tests showed all three protocols compare well at the heaviest loads, we believe that most
ESX production environments will be subjected to loads that are comparable to the loads generated
during our tests using 16 to 64 total outstanding I/Os. At these reduced I/O loads, we found all
protocols performed within 7% of each other.
The following sections take a closer look at each of the protocols and discuss pros and cons of using
each in an ESX environment on NetApp storage.
20
7.1.1 Fibre Channel Protocol Summary
FC is one of the most mature and widely deployed of the three protocols supported by VMware. Due
to this maturity it is the storage protocol found in the majority of VMware virtual infrastructure
deployments.
FC obtains marginally higher performance in terms of MB/s when compared to the other protocols
using our workloads. The tests performed showed why this protocol is so pervasive in deployments
around the world. This protocol attained the highest throughput of any protocol, achieving up to 9%
higher throughput than the other protocols while requiring noticeably lower CPU utilization on the
ESX 3.5 host compared to NFS and iSCSI.
When deploying FC in a data center, there are some caveats besides the performance advantages
shown above to think about. In our tests we found FC infrastructures require less processing power
from the systems that use it, allowing for a higher total utilization of the systems. However, FC
storage infrastructures are generally the most costly of all the protocols to install and maintain. FC
infrastructure requires expensive Fibre Channel switches and Fibre Channel cabling in order to be
deployed. Also, FC will always require additional operational costs as the solution needs storage-
specific networking and the operational teams to manage this protocol environment.
7.1.2 iSCSI Protocol Summary
iSCSI is a newer block protocol compared to FC and is relatively new to VMware, introduced with
VMware ESX 3.0 in June of 2006. iSCSI has proven itself to be attractive as a protocol and has seen
adoption in multiple sectors of industry.
The tests showed that when deployed properly, iSCSI can perform at levels comparable to that of the
more established FC protocol and in conjunction with NetApp FAS systems can be deployed in a
VMware ESX 3.5 enterprise environment. During these tests using the VMware iSCSI software
initiator, we observed performance was at most 7% lower than FC. Software iSCSI also exhibited
the highest maximum ESX 3.5 host CPU utilization of all the protocols tested. This is an indication
that, while iSCSI performance is comparable to FC, you might need to keep a closer eye on the ESX
host CPU utilization if using VMware software iSCSI.
Besides the comparable performance to FC shown above, the reasons iSCSI has been widely
adopted in some environments is that it is relatively inexpensive to deploy and maintain. Running on
a standard TCP/IP network, it does not require the expensive Fibre Channel switches, host bus
adapters, and Fibre Channel cabling that FC requires, making it the much cheaper alternative of the
two protocols. Also, additional operational costs are much lower when compared to FC by
minimizing additional staff or specialized training needed for this protocol.
7.1.3 NFS Protocol Summary
NFS is a NAS protocol that is extremely familiar to the UNIX® and Linux® world. This protocol
was introduced with VMware ESX 3.0 in June of 2006. NFS is being readily adopted in large
VMware environments using NetApp storage due to its ease of management and performance
attributes.
21
The tests demonstrated that NFS performs at levels comparable to that of FC during all workloads
tested and in conjunction with NetApp FAS systems can be successfully deployed in VMware ESX
3.5 enterprise environments. During the tests NFS performance was at maximum 9% lower than FC.
NFS also exhibited ESX 3.5 host server CPU utilization maximum on average higher than FC but
lower than iSCSI.
While NFS does not quite achieve the performance of FC and has a slightly higher CPU utilization,
it does have some advantages over FC that should be considered when deciding which protocol to
deploy. Running on a standard TCP/IP network, NFS does not require the expensive Fibre Channel
switches, host bus adapters, and Fibre Channel cabling that FC requires, making NFS a lower cost
alternative of the two protocols. Additionally, operational costs are low with no specialized staffing
or training needed in order to maintain the environment. Also, NFS provides further storage
efficiencies by allowing on-demand resizing of data stores and increasing storage saving efficiencies
gained when using deduplication. Both of these advantages provide additional operational savings as
a result of this storage simplification.
8 REFERENCES
8.1 NETAPP AND VMWARE ESX BEST PRACTICES AND CONFIGURATION GUIDES
www.netapp.com/library/tr/3428.pdf
www.netapp.com/library/tr/3593.pdf
8.2 VMWARE BEST PRACTICE AND USER GUIDES
http://h71019.www7.hp.com/ActiveAnswers/downloads/4AA1-0818ENW.pdf
www.vmware.com/pdf/esx3_partition_align.pdf
www.vmware.com/pdf/vi3_san_guide.pdf
www.vmware.com/pdf/vi3_35/esx_3/r35/vi3_35_25_iscsi_san_cfg.pdf