Embed Size (px)
Citation preview
In partnership with
NetApp Verified Architecture
NetApp HCI for End-User Computing with VMware and NVIDIA GPUs NVA Deployment Suresh Thoppay, NetApp May 2019 | NVA-1129-DEPLOY | Version 1.0
Abstract VMware End-User Computing with NetApp® HCI is a prevalidated, best-practice, data center architecture for deploying virtual desktop workloads at an enterprise scale. This document describes how to deploy the solution at production scale in a reliable and risk-free manner.

TABLE OF CONTENTS
1 Executive Summary.............................................................................................................................. 6
2 The Big Picture: VMware Private Cloud on NetApp HCI................................................................... 6 2.1 Benefits of the NetApp HCI VMware Private Cloud ........................................................................................7
3 NetApp HCI and VMware End-User Computing Architecture .......................................................... 8 3.1 VMware End-User Computing ........................................................................................................................9
4 Solution Overview .............................................................................................................................. 10 4.1 Target Audience ............................................................................................................................................ 11 4.2 NetApp HCI Use Cases ................................................................................................................................ 11 4.3 Private Cloud ................................................................................................................................................ 11 4.4 End-User Computing .................................................................................................................................... 11 4.5 Workload Consolidation ................................................................................................................................ 11 4.6 Solution Use Case Summary ........................................................................................................................ 12
5 Technology Components .................................................................................................................. 12 5.1 Hardware Components ................................................................................................................................. 12 5.2 Software Components .................................................................................................................................. 13
6 Deployment Procedures .................................................................................................................... 14 6.1 NetApp HCI Deployment ............................................................................................................................... 14 6.2 Predeployment Checklist .............................................................................................................................. 14 6.3 Deploy and Configure Resource Block(s) ..................................................................................................... 15 6.4 Deploy and Configure VMware Horizon 7 Instant Clones ............................................................................. 15 6.5 Deploy and Configure VMware App Volumes Manager ................................................................................ 15 6.6 Deploy and Configure VMware User Environment Manager......................................................................... 16 6.7 Deploy and Configure JMP Server ................................................................................................................ 16 6.8 Configure vRealize Operations Manager ...................................................................................................... 16 6.9 Integrate with vRealize Log Insight ............................................................................................................... 16 6.10 (Optional) Integrate with vRealize Automation .............................................................................................. 17
7 Solution Verification ........................................................................................................................... 17 7.1 Single Server Knowledge Worker Workload without GPU ............................................................................ 19 7.2 Single Server Knowledge Worker Workload with vSGA mode...................................................................... 21 7.3 Single Server Knowledge Worker Workload with NVIDIA vGPU mode ........................................................ 22 7.4 Two Servers Knowledge Worker Workload with NVIDIA vGPU mode .......................................................... 24 7.5 Single Server Multimedia Workload with vSGA mode .................................................................................. 27 7.6 Single Server Multimedia Workload with NVIDIA vGPU mode ..................................................................... 30
7.7 Knowledge Worker Load with Mix of 400 Users on H410C and 128 Users on H610C servers..................... 33
8 Conclusion .......................................................................................................................................... 36
Where to Find Additional Information .................................................................................................... 36 NetApp ................................................................................................................................................................. 36 NVIDIA ................................................................................................................................................................. 37 VMware ................................................................................................................................................................ 37
Version History ......................................................................................................................................... 38
LIST OF TABLES Table 1) Physical hardware components...................................................................................................................... 12 Table 2) Virtual hardware components. ........................................................................................................................ 12 Table 3) Software requirements. .................................................................................................................................. 13 Table 4) Predeployment checklist. ............................................................................................................................... 15 Table 5) Hardware specifications of the H610C server. ............................................................................................... 18 Table 6) Test details (single server no GPU) ................................................................................................................ 19 Table 7) Test results (single server no GPU) ............................................................................................................... 19 Table 8) Test details (single server with vSGA mode) .................................................................................................. 21 Table 9) Test results (single server with vSGA mode) ................................................................................................. 21 Table 10) Test details (single server with NVIDIA vGPU mode) ................................................................................... 22 Table 11) Test results (single server with NVIDIA vGPU mode) .................................................................................. 23 Table 12) GPU metrics (single server with NVIDIA vGPU mode). ................................................................................ 23 Table 13) Linear scale testing (two servers) ................................................................................................................. 25 Table 14) Test results (two servers). ............................................................................................................................ 25 Table 15) GPU metrics (first server). ............................................................................................................................ 26 Table 16) GPU metrics (second server). ...................................................................................................................... 26 Table 17) Test details (single server multimedia with vSGA mode) ............................................................................. 27 Table 18) Test results (single server multimedia with vSGA mode) ............................................................................. 28 Table 19) Test details (single server multimedia with NVIDIA vGPU mode). ............................................................... 30 Table 20) Test results (single server multimedia with NVIDIA GPU mode). ................................................................. 31 Table 21) GPU metrics (single server multimedia with NVIDIA GPU mode). ............................................................... 32 Table 22) Test details (mixed users on H410C and H610C servers). .......................................................................... 33 Table 23) Test results (mixed users on H410C and H610C servers). .......................................................................... 33 Table 24) Percentage of core utilization and memory usage (mixed users on H410C and H610C servers). ............... 34 Table 25) GPU metrics (mixed users on H410C and H610C servers). ........................................................................ 34 Table 26) GPU metrics (mixed users on H410C and H610C servers). ........................................................................ 35
LIST OF FIGURES Figure 1) VMware private cloud on NetApp HCI. ............................................................................................................7
Figure 2) VMware Horizon JMP technology. ..................................................................................................................9 Figure 3) NetApp Verified Architecture for VMware Private Cloud ............................................................................... 10 Figure 4) Login VSI workloads. .................................................................................................................................... 17 Figure 5) Response time and number of active sessions (single server no GPU). ....................................................... 20 Figure 6) IOPS on volumes (single server no GPU). .................................................................................................... 20 Figure 7) Virtual session index and response time (single server with vSGA mode). ................................................... 21 Figure 8) IOPS volume (single server with vSGA mode). ............................................................................................. 22 Figure 9) Virtual session index and response time (single server with NVIDIA vGPU mode)....................................... 23 Figure 10) Total IOPS monitored with NetApp HCI storage (single server with NVIDIA vGPU mode). ........................ 24 Figure 11) Virtual session index and response time (two servers). .............................................................................. 25 Figure 12) Total IOPS for virtual desktop volumes (two servers). ................................................................................ 27 Figure 13) Virtual session index and response time (single server). ............................................................................ 28 Figure 14) Total volume IOPS (single server multimedia vSGA mode). ....................................................................... 29 Figure 15) Total IOPS with user writable volume. ........................................................................................................ 30 Figure 16) Virtual session index and response time (single server NVIDIA GPU mode). ............................................. 31 Figure 17) Storage IOPS of virtual desktop volumes including user-writable volumes. ................................................ 32 Figure 18) Virtual session index and response time (mixed users on H410C and H610C servers). ............................ 34 Figure 19) Total IOPS from virtual desktop volumes (mixed users on H410C and H610C servers). ............................ 36
1 Executive Summary Technology continues to shape our everyday lives and, because end-user demands are increasing, digital transformation is a priority for most enterprises. Regardless of where you are on your journey, NetApp® can help you by providing solutions that deliver business results for your end users.
This document details the design decisions that we made to deploy VMware End-User Computing and NVIDIA GPUs on NetApp HCI. The combination of NetApp and VMware enables you to use the End-User Computing ecosystem while progressing down the digital transformation (DX) path.
DX is about enabling you to solve traditional problems in different ways by using digital technology; this transformation leads to a better digital solution for your organization.
NetApp is committed to delivering digital transformation solutions. This paper is focused on how you can deploy an end-user compute solution using the VMware Horizon environment on NetApp HCI. The minimum starting point for this solution is an environment with:
• Virtualized compute – NetApp HCI compute running ESXi • Pooled storage – NetApp HCI storage running NetApp Element® software • Management plane – Element Plug-in for VMware vCenter Server
With this solution, your business can easily meet rapidly changing needs and you can accelerate your business outcomes. The NetApp HCI solution delivers predictable performance for all desktops, databases, and applications in your end-user compute environment. It has a highly flexible and efficient architecture that is simple to deploy, manage, and scale.
The NetApp HCI solution is designed to:
• Host multiple workloads and applications • Be easily scalable for either computer or storage • Provide management, monitoring, and reporting tools as needed • Provide QoS for all tenants
2 The Big Picture: VMware Private Cloud on NetApp HCI Moving to the private cloud is a journey. Most organizations want to start small and grow their environment over time. NetApp has developed, in collaboration with VMware, two documents that describe how to deploy the NetApp HCI Private Cloud with VMware Private. These documents are the VMware Validated Design (VVD) for NetApp HCI and the NetApp HCI for VMware Private Cloud NVA. These documents provide guidelines, best practices, and deployment information for a VMware private cloud, using the VMware vRealize suite of products and VMware NSX, with NetApp HCI.
When you are using a private cloud, you might want to automate parts of the environment. With tools such as vRealize Automation self-service, you can provision virtual machines (VMs) from a predefined catalog and quickly provision applications. For example, engineering VMs can be delivered as an OVA file (template) from VMware and then deployed in the vSphere environment. The goal is a solution that offers microsegmentation of resources, provides extensive IT automation, and enables you to integrate your application workloads that are running in a private cloud.
Another objective when deploying and operating in a private cloud is increased agility or the ability to quickly deploy more applications or workloads. With NetApp HCI, you can easily deploy and support any workload or use case. Figure 1 shows how the compute and storage resources are distributed for a superior level of resource-sharing capabilities. This capability is similar to hyperscalers such as Amazon Web Services (AWS), Azure, and Google Cloud.
With this infrastructure, you can deploy the application or workload to run on the desired CPUs and move that application as your needs evolve. The storage that holds the data does not have to move and can be
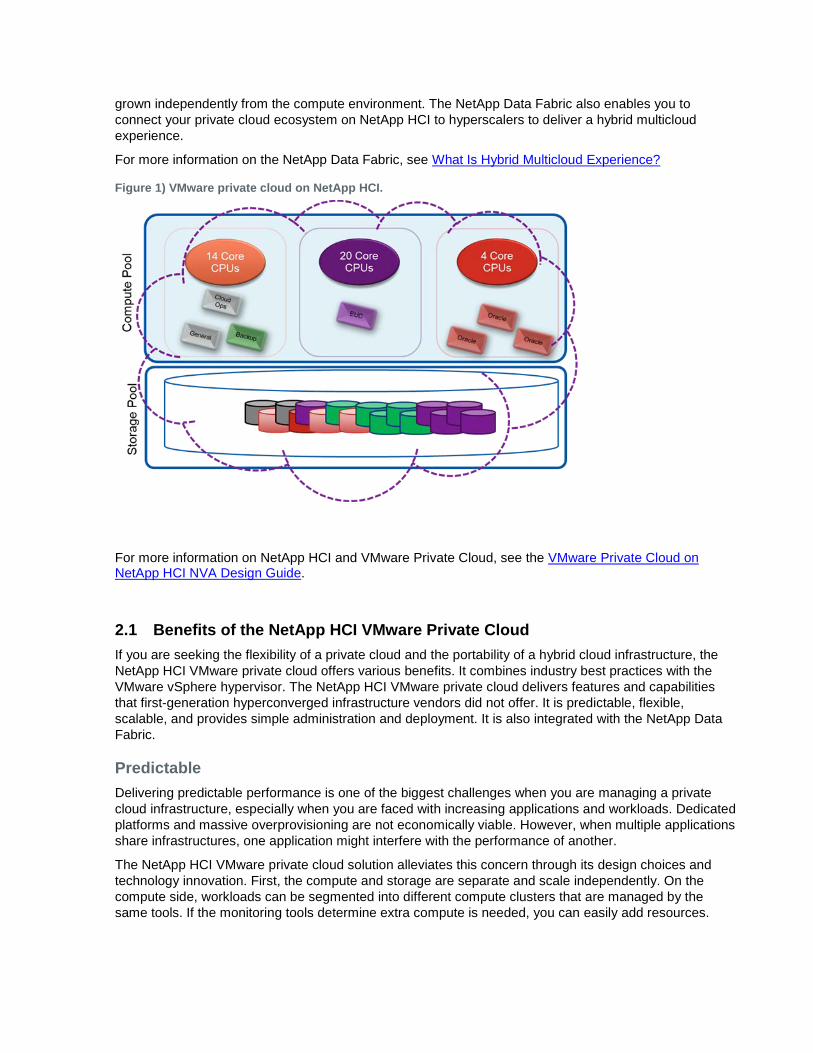
grown independently from the compute environment. The NetApp Data Fabric also enables you to connect your private cloud ecosystem on NetApp HCI to hyperscalers to deliver a hybrid multicloud experience.
For more information on the NetApp Data Fabric, see What Is Hybrid Multicloud Experience?
Figure 1) VMware private cloud on NetApp HCI.
For more information on NetApp HCI and VMware Private Cloud, see the VMware Private Cloud on NetApp HCI NVA Design Guide.
2.1 Benefits of the NetApp HCI VMware Private Cloud If you are seeking the flexibility of a private cloud and the portability of a hybrid cloud infrastructure, the NetApp HCI VMware private cloud offers various benefits. It combines industry best practices with the VMware vSphere hypervisor. The NetApp HCI VMware private cloud delivers features and capabilities that first-generation hyperconverged infrastructure vendors did not offer. It is predictable, flexible, scalable, and provides simple administration and deployment. It is also integrated with the NetApp Data Fabric.
Predictable Delivering predictable performance is one of the biggest challenges when you are managing a private cloud infrastructure, especially when you are faced with increasing applications and workloads. Dedicated platforms and massive overprovisioning are not economically viable. However, when multiple applications share infrastructures, one application might interfere with the performance of another.
The NetApp HCI VMware private cloud solution alleviates this concern through its design choices and technology innovation. First, the compute and storage are separate and scale independently. On the compute side, workloads can be segmented into different compute clusters that are managed by the same tools. If the monitoring tools determine extra compute is needed, you can easily add resources.
On the storage side, the NetApp Element software implements quality of service (QoS) which applies limits and enables granular control of each application and volume. Element software also eliminates noisy neighbors and satisfies performance SLAs. All applications can be deployed and operated on a shared platform, with predictable performance.
Flexible and Scalable Workload planning is not an exact science. Business needs change constantly, applications evolve, and IT organizations are expected to keep pace. Administrators need solutions that can scale, are easy to manage, and provide dynamic flexibility. The NetApp HCI VMware private cloud enables independent on-demand scaling and rebalancing of compute and storage resources. It offers online resource migration, providing a public cloud-like experience for private cloud users.
NetApp HCI scales compute and storage resources independently. Independent scaling enables the environment to add extra resources to only those areas that need them. This type of scaling helps avoid costly and inefficient overprovisioning and simplifies capacity and performance planning.
With the NetApp HCI VMware private cloud, licensing costs can also be reduced. It can mix-and-match compute configurations to match application needs. The architectural design choices that are available can help you to confidently scale on your terms. These features make NetApp HCI a viable solution for core data center applications and platforms.
Simple Automating all routine tasks is a priority for the IT community because it mitigates the risk of user error, and releases resources to focus on more interesting, higher-value projects. The NetApp HCI VMware private cloud enables IT departments to become more agile and responsive by simplifying deployment and ongoing management.
The VMware vCenter plug-in simplifies management in an intuitive way. Also, the NetApp HCI VMware private cloud solution uses a robust suite of APIs to promote integration with higher-level management, orchestration, backup, and disaster recovery tools.
NetApp Storage Portfolio and the NetApp Data Fabric Several private cloud solutions involve the introduction of a silo of resources into an existing data center. They do not have the portfolio to offer best-in-class technologies. NetApp can deliver a multitude of storage technologies designed to meet your application and workload needs. Also, all of the different storage products can operate in the NetApp Data Fabric.
NetApp has invested heavily in the Data Fabric, offering enhanced data portability, visibility, and protection of workloads whether they reside on-premises, in near-cloud storage, or in a public cloud. The Data Fabric removes lock-in and provides you with a new set of choices. It enables the full potential of your data to be unleashed across cloud environments.
3 NetApp HCI and VMware End-User Computing Architecture This combination of technologies from NetApp and VMware gives you the benefit of the end-user computing ecosystem. This document details the design decisions that we made to deploy VMware End-User Computing on NetApp HCI.
NetApp HCI is a hybrid cloud infrastructure solution capable of transforming and empowering organizations to move faster, drive operational efficiencies, and reduce costs. NetApp HCI is designed to run multiple applications and to deliver predictable performance—features that enterprises and their customers demand. NetApp HCI enables the independent scaling of compute and storage resources, making sure that systems are right-sized. VMware Horizon can rapidly provision desktops and required applications in minutes, eliminating the complex management of traditional architectures. Integration into
the NetApp Data Fabric means that you can easily integrate your infrastructure with the cloud and the required data services.
NetApp HCI releases you from the limitations of current infrastructure solutions which are often complex and are unable to consolidate all workloads. These restrictions can force you to scale in ways that strand resources and throttle the performance required by next-generation applications. With VMware Horizon on NetApp HCI, you can provision your compute and storage to quickly deploy on virtual desktops and applications. The infrastructure can then be scaled as needs change.
3.1 VMware End-User Computing Horizon is tightly integrated with the NetApp HCI solution. This integration provides a seamless turnkey solution, eliminating the need to build, test, and support disparate storage, virtualization, and networking products.
Horizon provides you with access to all of their virtual desktops, applications, and online services through a single digital workspace. You can quickly transform static desktops into secure, digital workspaces that can be delivered on demand. It’s also possible to provision virtual or remote desktops and applications through a single virtual desktop infrastructure (VDI) and app virtualization platform. This feature enables you to streamline management and easily assign permissions for your end users.
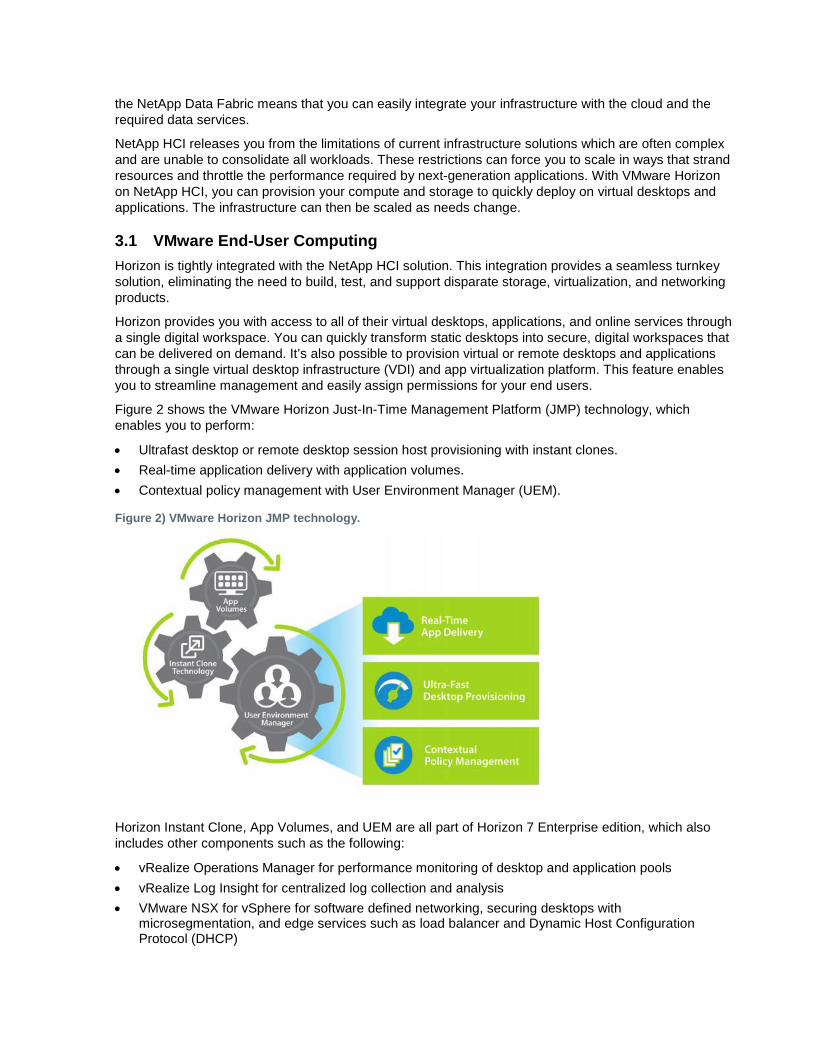
Figure 2 shows the VMware Horizon Just-In-Time Management Platform (JMP) technology, which enables you to perform:
• Ultrafast desktop or remote desktop session host provisioning with instant clones. • Real-time application delivery with application volumes. • Contextual policy management with User Environment Manager (UEM).
Figure 2) VMware Horizon JMP technology.
Horizon Instant Clone, App Volumes, and UEM are all part of Horizon 7 Enterprise edition, which also includes other components such as the following:
• vRealize Operations Manager for performance monitoring of desktop and application pools • vRealize Log Insight for centralized log collection and analysis • VMware NSX for vSphere for software defined networking, securing desktops with
microsegmentation, and edge services such as load balancer and Dynamic Host Configuration Protocol (DHCP)
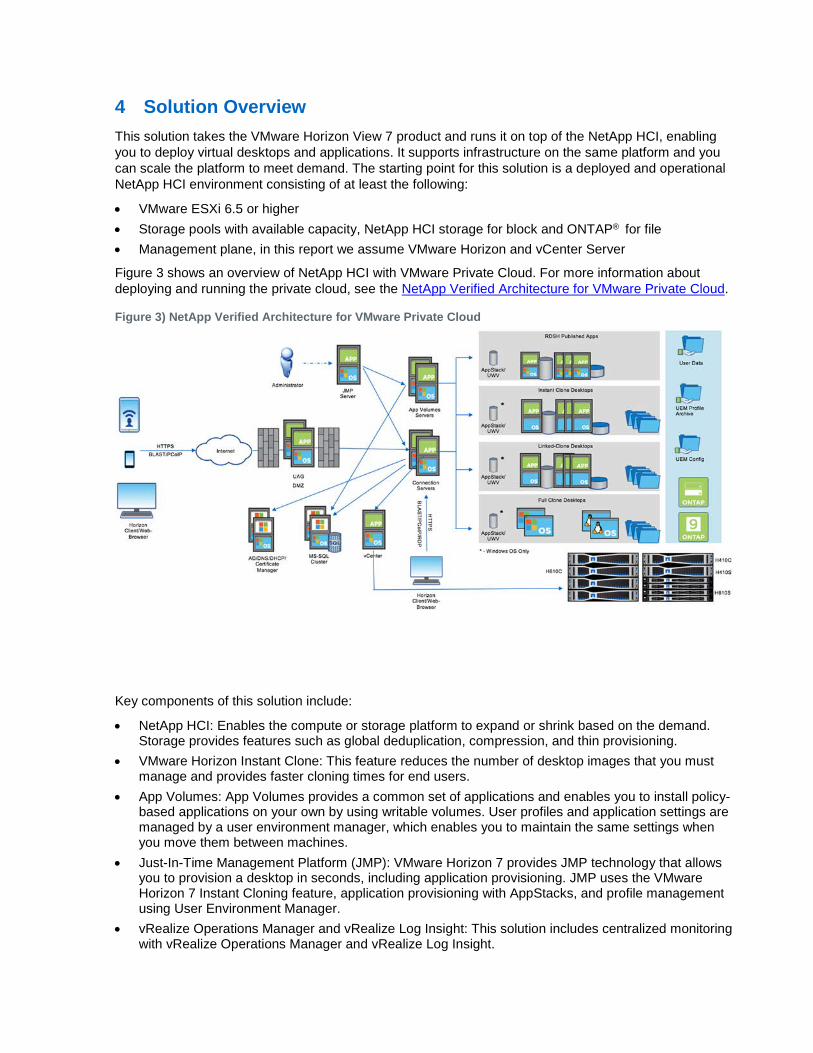
4 Solution Overview This solution takes the VMware Horizon View 7 product and runs it on top of the NetApp HCI, enabling you to deploy virtual desktops and applications. It supports infrastructure on the same platform and you can scale the platform to meet demand. The starting point for this solution is a deployed and operational NetApp HCI environment consisting of at least the following:
• VMware ESXi 6.5 or higher • Storage pools with available capacity, NetApp HCI storage for block and ONTAP® for file • Management plane, in this report we assume VMware Horizon and vCenter Server
Figure 3 shows an overview of NetApp HCI with VMware Private Cloud. For more information about deploying and running the private cloud, see the NetApp Verified Architecture for VMware Private Cloud.
Figure 3) NetApp Verified Architecture for VMware Private Cloud
Key components of this solution include:
• NetApp HCI: Enables the compute or storage platform to expand or shrink based on the demand. Storage provides features such as global deduplication, compression, and thin provisioning.
• VMware Horizon Instant Clone: This feature reduces the number of desktop images that you must manage and provides faster cloning times for end users.
• App Volumes: App Volumes provides a common set of applications and enables you to install policy-based applications on your own by using writable volumes. User profiles and application settings are managed by a user environment manager, which enables you to maintain the same settings when you move them between machines.
• Just-In-Time Management Platform (JMP): VMware Horizon 7 provides JMP technology that allows you to provision a desktop in seconds, including application provisioning. JMP uses the VMware Horizon 7 Instant Cloning feature, application provisioning with AppStacks, and profile management using User Environment Manager.
• vRealize Operations Manager and vRealize Log Insight: This solution includes centralized monitoring with vRealize Operations Manager and vRealize Log Insight.
• NVIDIA Grid: NVIDIA virtual GPU manager software handles the scheduling of GPU resources across the virtual machines.
4.1 Target Audience The target audience for the solution includes the following groups:
• Field consultants to help with design decisions in the VMware End-User compute environment. • Executives and sales engineers to understand the value of the solution. • NetApp Professional Services and IT managers to understand and identify the components of the
solution. • Partners to learn and assist the customers who face similar challenges
4.2 NetApp HCI Use Cases In addition to the previously mentioned benefits, there are various use cases for which the NetApp HCI solution is ideal. If you are designing end-user compute environments, including hardware accelerated graphics applications, and considering workload consolidation, NetApp HCI is architected to deliver exceptional value.
4.3 Private Cloud NetApp HCI is an optimal foundation for an enterprise private cloud model, whether you choose OpenStack, VMware, or a solution developed in-house. This flexibility is because NetApp HCI uses native Element software APIs that enable the on-demand provisioning of workloads through storage drivers and management plug-ins.
For example, NetApp HCI integrates with VMware Virtual Volumes (VVols), enabling VMware administrators to achieve the most granular control over storage performance on a per-VM basis. You can set minimum, maximum, and burst IOPS levels, confirming exact amounts of capacity and performance for even the most sensitive VMs. You can change capacity and performance dynamically without migrating data or affecting system performance.
4.4 End-User Computing NetApp HCI is optimal for end-user computing (EUC) environments because capacity and performance are allocated independently for every virtual desktop and every application. The allocations can be easily adjusted as workloads shift or requirements change. If an application needs more performance, the initial configuration can become a bottleneck, but NetApp HCI eliminates the penalty for underestimating requirements. Modification of the QoS policies can easily change the settings for minimum, maximum, or burst, and the new settings take effect immediately.
4.5 Workload Consolidation NetApp HCI eliminates workload silos, enabling you to predictably run multiple applications on the same infrastructure. Traditionally, when multiple applications share infrastructures, all performance resources, both IOPS and bandwidth, are freely available to all applications across the shared resources. Without a more precise resource allocation, one application or “noisy neighbor” can easily consume an unfair share of the resources, leaving little available for others. This first-come, first-served allocation methodology can have a negative effect on the other applications on the system.
Performance expectations on an application-by-application basis are unpredictable. One misbehaving application can cripple the entire system. To keep these variances in check, you must constantly monitor and manage which applications share resources. Often, alleviating resource contention requires that either the “noisy neighbor” or the unhappy customer is migrated to a new system.
The NetApp HCI QoS settings eliminate resource contention and the variable application performance that is caused by noisy neighbors. Each volume on the system is assigned its own minimum, maximum, and burst settings for predictable performance each application. This feature is important for avoiding the capacity sprawl and low utilization issues that are common in today’s hyper converged infrastructures.
4.6 Solution Use Case Summary This solution applies to the following use cases:
• On-demand desktop and application deployment for end users • User profile management self-service for end users • Ease of management for security patches • Integration with an existing private cloud • Secure multitenant infrastructure for enterprises
5 Technology Components This section covers the technology components that we used to validate the end-user computing on NetApp HCI.
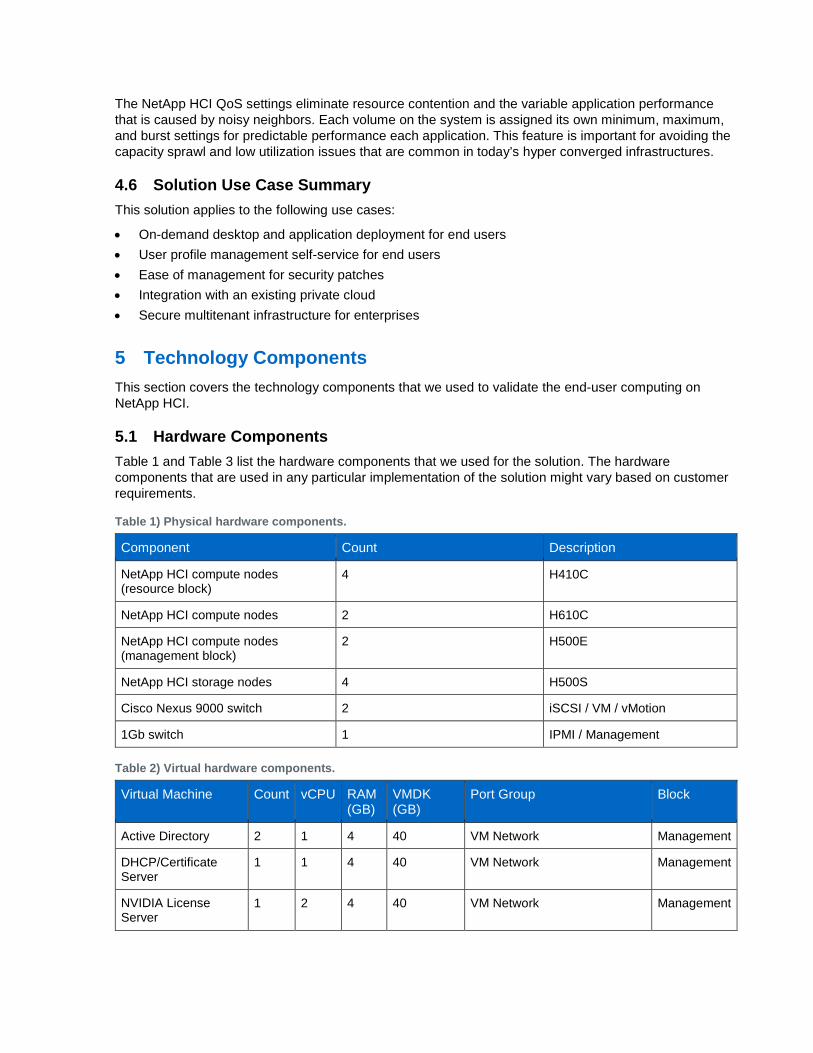
5.1 Hardware Components Table 1 and Table 3 list the hardware components that we used for the solution. The hardware components that are used in any particular implementation of the solution might vary based on customer requirements.
Table 1) Physical hardware components.
Component Count Description
NetApp HCI compute nodes (resource block)
4 H410C
NetApp HCI compute nodes 2 H610C
NetApp HCI compute nodes (management block)
2 H500E
NetApp HCI storage nodes 4 H500S
Cisco Nexus 9000 switch 2 iSCSI / VM / vMotion
1Gb switch 1 IPMI / Management
Table 2) Virtual hardware components.
Virtual Machine Count vCPU RAM (GB)
VMDK (GB)
Port Group Block
Active Directory 2 1 4 40 VM Network Management
DHCP/Certificate Server
1 1 4 40 VM Network Management
NVIDIA License Server
1 2 4 40 VM Network Management
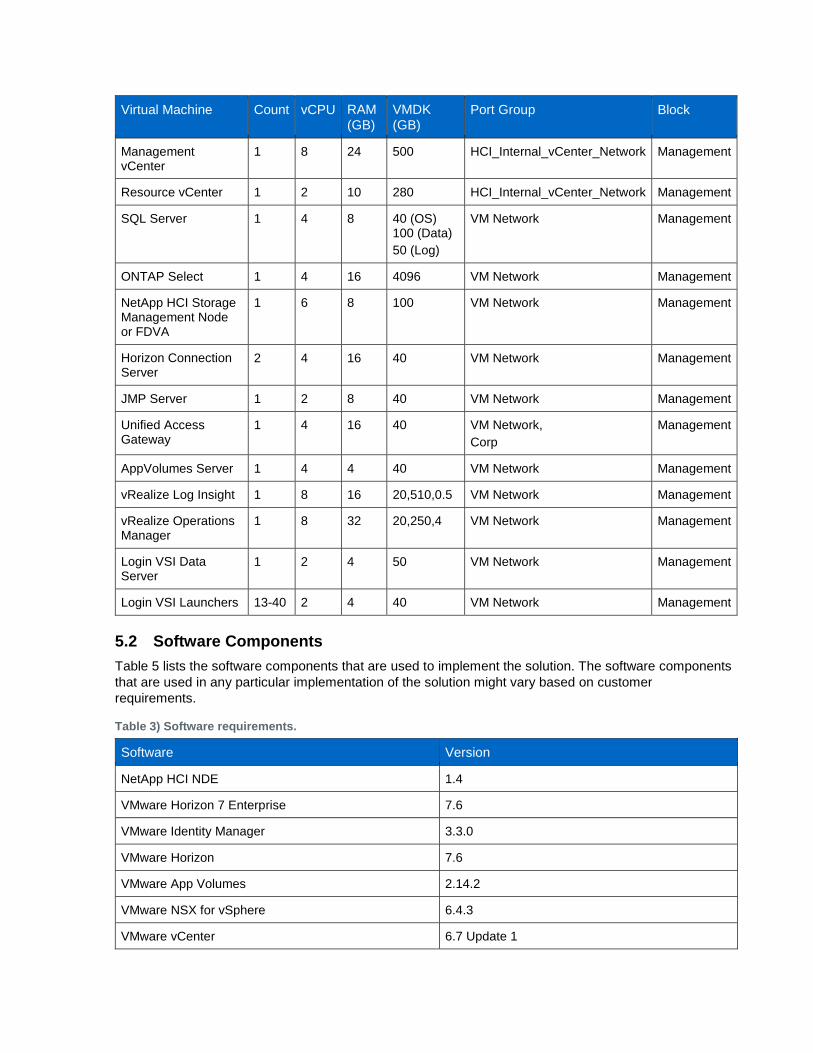
Virtual Machine Count vCPU RAM (GB)
VMDK (GB)
Port Group Block
Management vCenter
1 8 24 500 HCI_Internal_vCenter_Network Management
Resource vCenter 1 2 10 280 HCI_Internal_vCenter_Network Management
SQL Server 1 4 8 40 (OS) 100 (Data) 50 (Log)
VM Network Management
ONTAP Select 1 4 16 4096 VM Network Management
NetApp HCI Storage Management Node or FDVA
1 6 8 100 VM Network Management
Horizon Connection Server
2 4 16 40 VM Network Management
JMP Server 1 2 8 40 VM Network Management
Unified Access Gateway
1 4 16 40 VM Network, Corp
Management
AppVolumes Server 1 4 4 40 VM Network Management
vRealize Log Insight 1 8 16 20,510,0.5 VM Network Management
vRealize Operations Manager
1 8 32 20,250,4 VM Network Management
Login VSI Data Server
1 2 4 50 VM Network Management
Login VSI Launchers 13-40 2 4 40 VM Network Management
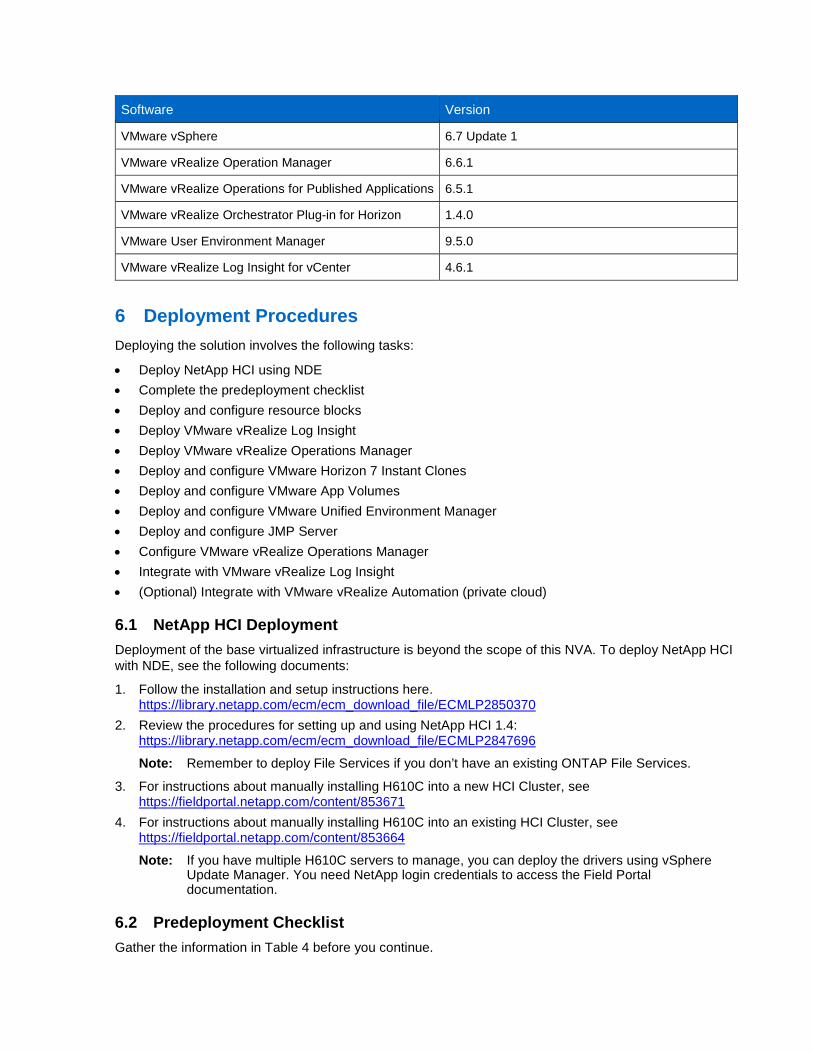
5.2 Software Components Table 5 lists the software components that are used to implement the solution. The software components that are used in any particular implementation of the solution might vary based on customer requirements.
Table 3) Software requirements.
Software Version
NetApp HCI NDE 1.4
VMware Horizon 7 Enterprise 7.6
VMware Identity Manager 3.3.0
VMware Horizon 7.6
VMware App Volumes 2.14.2
VMware NSX for vSphere 6.4.3
VMware vCenter 6.7 Update 1
Software Version
VMware vSphere 6.7 Update 1
VMware vRealize Operation Manager 6.6.1
VMware vRealize Operations for Published Applications 6.5.1
VMware vRealize Orchestrator Plug-in for Horizon 1.4.0
VMware User Environment Manager 9.5.0
VMware vRealize Log Insight for vCenter 4.6.1
6 Deployment Procedures Deploying the solution involves the following tasks:
• Deploy NetApp HCI using NDE • Complete the predeployment checklist • Deploy and configure resource blocks • Deploy VMware vRealize Log Insight • Deploy VMware vRealize Operations Manager • Deploy and configure VMware Horizon 7 Instant Clones • Deploy and configure VMware App Volumes • Deploy and configure VMware Unified Environment Manager • Deploy and configure JMP Server • Configure VMware vRealize Operations Manager • Integrate with VMware vRealize Log Insight • (Optional) Integrate with VMware vRealize Automation (private cloud)
6.1 NetApp HCI Deployment Deployment of the base virtualized infrastructure is beyond the scope of this NVA. To deploy NetApp HCI with NDE, see the following documents:
1. Follow the installation and setup instructions here. https://library.netapp.com/ecm/ecm_download_file/ECMLP2850370
2. Review the procedures for setting up and using NetApp HCI 1.4: https://library.netapp.com/ecm/ecm_download_file/ECMLP2847696
Note: Remember to deploy File Services if you don’t have an existing ONTAP File Services.
3. For instructions about manually installing H610C into a new HCI Cluster, see https://fieldportal.netapp.com/content/853671
4. For instructions about manually installing H610C into an existing HCI Cluster, see https://fieldportal.netapp.com/content/853664
Note: If you have multiple H610C servers to manage, you can deploy the drivers using vSphere Update Manager. You need NetApp login credentials to access the Field Portal documentation.
6.2 Predeployment Checklist Gather the information in Table 4 before you continue.
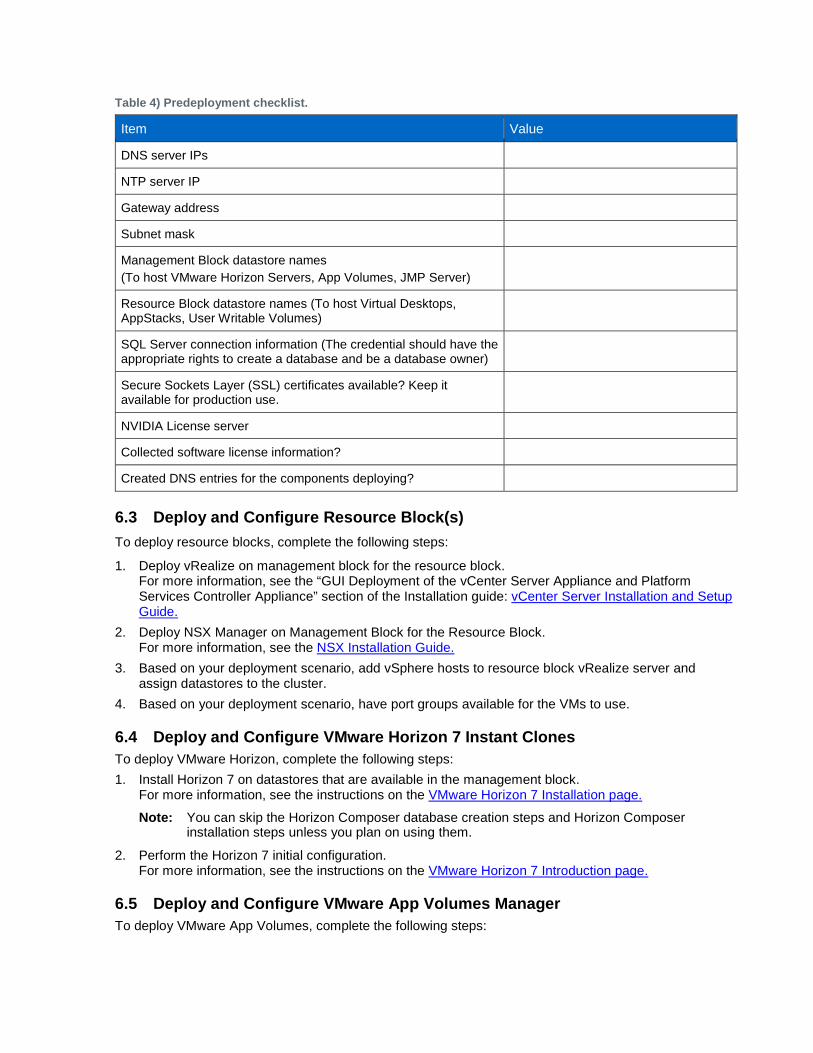
Table 4) Predeployment checklist.
Item Value
DNS server IPs
NTP server IP
Gateway address
Subnet mask
Management Block datastore names (To host VMware Horizon Servers, App Volumes, JMP Server)
Resource Block datastore names (To host Virtual Desktops, AppStacks, User Writable Volumes)
SQL Server connection information (The credential should have the appropriate rights to create a database and be a database owner)
Secure Sockets Layer (SSL) certificates available? Keep it available for production use.
NVIDIA License server
Collected software license information?
Created DNS entries for the components deploying?
6.3 Deploy and Configure Resource Block(s) To deploy resource blocks, complete the following steps:
1. Deploy vRealize on management block for the resource block. For more information, see the “GUI Deployment of the vCenter Server Appliance and Platform Services Controller Appliance” section of the Installation guide: vCenter Server Installation and Setup Guide.
2. Deploy NSX Manager on Management Block for the Resource Block. For more information, see the NSX Installation Guide.
3. Based on your deployment scenario, add vSphere hosts to resource block vRealize server and assign datastores to the cluster.
4. Based on your deployment scenario, have port groups available for the VMs to use.
6.4 Deploy and Configure VMware Horizon 7 Instant Clones To deploy VMware Horizon, complete the following steps: 1. Install Horizon 7 on datastores that are available in the management block.
For more information, see the instructions on the VMware Horizon 7 Installation page.
Note: You can skip the Horizon Composer database creation steps and Horizon Composer installation steps unless you plan on using them.
2. Perform the Horizon 7 initial configuration. For more information, see the instructions on the VMware Horizon 7 Introduction page.
6.5 Deploy and Configure VMware App Volumes Manager To deploy VMware App Volumes, complete the following steps:
1. Install VMware App Volumes Manager. See the “Installing App Volumes” section at VMware App Volumes Installation Guide.
Note: Depending on your environment, you might need to deploy more App Volumes managers.
2. Configure VMware App Volumes Manager. See the “Configuring App Volumes Manager” section of the VMware App Volumes Administration Guide.
3. Update SSL Certificate. See the “Using SSL Certificates with App Volumes Manager” section at VMware App Volumes Administration Guide.
6.6 Deploy and Configure VMware User Environment Manager To deploy VMware User Environment Manager, complete the following steps: 1. Create a UEM configuration file share and user profile archive file share.
Follow the instructions available at VMware User Environment Manager Deployed in 60 Minutes or Less.
2. Configure Windows Group Policy Objects (GPOs). Follow the instructions available at VMware User Environment Manager Deployed in 60 Minutes or Less.
3. Install UEM Management Console and configure. For more information, see:Quick Start Tutorial for User Environment Manager.
6.7 Deploy and Configure JMP Server To deploy a JMP Server, complete the following steps: 4. Create SQL Server Database and Login for JMP server host.
For more information, see Create a SQL Server Database for JMP Server. 5. For SQL Server login for JMP server host, see Create a SQL Server Login for the JMP Server Host. 6. Install the JMP Server.
For more information, see Install JMP Server. 7. Configure the JMP Server.
For more information, see Configuring the JMP Server Instance. Note: For complete step by step instructions with screenshots, see Quick-Start Tutorial for VMware
Horizon JMP Integrated Workflow.
6.8 Configure vRealize Operations Manager To monitor VMware Horizon with vRealize Operations Manager, complete the following steps: 1. Install the vRealize Operations for Horizon Solution
For more information, see Installing and Configuring vRealize Operations for Horizon.
Note: Install the Horizon Broker Agent on Connection Servers.
2. To monitor NetApp HCI with vRealize Operations Manager, deploy the Blue Medora NetApp HCI plug-in. For more information, see VMware vRealize Operations Management Pack for NetApp HCI & SolidFire.
6.9 Integrate with vRealize Log Insight To configure Horizon centralized logging with vRealize Log Insight, complete the following steps: 1. Install vRealize Log Insight Agent on the desktop template.
For more information, see the appropriate section at Installing or Upgrading vRealize Log Insight Agents.
2. Install VMware Horizon View content pack for log insight:
a. Download the content pack here: https://marketplace.vmware.com/resources/99407fe755ee11e78024005056a107c6/doc/ce2e437bf7484024beb86b7a990891da/VMware%20-%20Horizon%20View%20%20v3.3.vlcp
b. Install using the procedure provided in the Install a Content Pack from the Content Pack Marketplace.
3. Create Agent Group and provide appropriate filters to add the agents. For more information, see Working with Centralized Agent Configurations and Agent Groups.
6.10 (Optional) Integrate with vRealize Automation To integrate Horizon with vRealize Automation, complete the following steps: 1. Install vRealize Orchestrator Plug-in for Horizon.
For more information, see Install or Upgrade vRealize Orchestrator Plug-In for Horizon. 2. Configure the connection to Horizon Pod.
For more information, see Configure the Connection to a Horizon Pod. 3. Configure the App Volumes Server.
For more information, see Configure the App Volumes Server. 4. Expose Horizon Workflows in vRealize Automation.
For more information, see Exposing vRealize Orchestrator Plug-in for Horizon Workflows in vRealize Automation.
7 Solution Verification Login Virtual Session Indexer (Login VSI) is the industry standard load-simulation testing tool for measuring the performance and scalability of centralized Windows desktop environments such as VDI and hosted applications. Login VSI is used for simulating a typical user activity using the virtual desktop. Login VSI is 100% vendor independent and works with standardized user workloads. This standardization makes all conclusions that are based on Login VSI test data objective, verifiable, and repeatable.
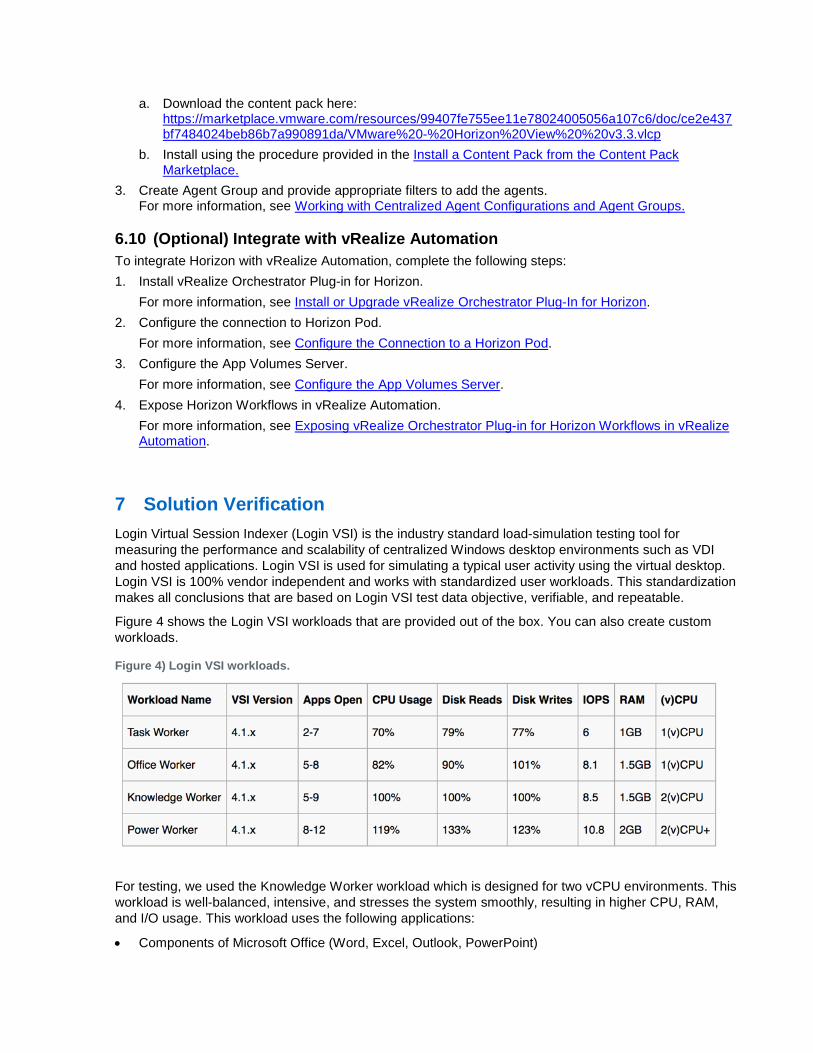
Figure 4 shows the Login VSI workloads that are provided out of the box. You can also create custom workloads.
Figure 4) Login VSI workloads.
For testing, we used the Knowledge Worker workload which is designed for two vCPU environments. This workload is well-balanced, intensive, and stresses the system smoothly, resulting in higher CPU, RAM, and I/O usage. This workload uses the following applications:
• Components of Microsoft Office (Word, Excel, Outlook, PowerPoint)
• Adobe Reader • Freemind or Java • Web Browser (Microsoft Edge or Internet Explorer) • Photo Viewer • Native Windows Apps (Notepad)
Multimedia workload uses the above applications with modified options such as high-resolution transitions for PowerPoint and the following additional applications or operations:
• Google Earth • HTML 5 3D spinning balls • MP3 • Streaming video
With vSphere, GPU can be presented to the virtual machin (VM) in three ways:
• Virtual Dedicated Graphics (vDGA) • Virtual Shared Graphics (vSGA) • Virtual Shared Pass-Through Graphics (Shared-Direct/NVIDIA vGPU)
With vDGA, the VM has full dedicated access to GPU using IOMMU on vSphere. However, vMotion and dynamic resource scheduler (DRS) are not supported on vDGA and for this reason we didn’t test this scenario. NetApp H610C has two Tesla M10 cards. Each card supports four GPUs with an 8GB frame buffer and a total of eight GPUs with a 64GB frame buffer in the system.
vSGA enables sharing of a GPU across multiple virtual desktops. This option is appealing if you only need the GPU’s full potential for short period of time. But this mode has limited support on DirectX and OpenGL versions. This option also provides a better user consolidation ratio for knowledge workers.
NVIDIA vGPU mode provides better performance than vSGA and a higher consolidation ratio than vDGA. It has a dedicated frame buffer for each virtual desktop and, based on that amount, the number of virtual desktops per machine is decided.
Our test goal is to check the performance characteristics of the following use cases:
• Single server knowledge worker load without using GPU card. • Single server knowledge worker load with vSGA mode • Single server knowledge worker load with NVIDIA vGPU mode • Two server knowledge worker load with NVIDIA vGPU mode • Single server multimedia load with vSGA mode • Single server multimedia load with NVIDIA vGPU mode • Knowledge worker load with mix of 400 users on H410C and 128 users on H610C.
The hardware specification of the H610C server that is used for testing is:
Table 5) Hardware specifications of the H610C server.
Item Value
Model Number NetApp HCI H610C
Processor Two Intel Xeon scalable processors (also known as Skylake) Gold 6130 (16 core, 2.1 GHz up to 3.7 GHz with Turbo, 22MB L3 Cache)
Memory 512GB
GPU Two Tesla M10 cards 2560 CUDA cores per card 640 CUDA per GPU 4 GPU per card 32GB memory per card 8GB memory per GPU 225W board power
7.1 Single Server Knowledge Worker Workload without GPU For this test we used VMware Horizon JMP desktop pool with persistent Instant Clone, User Writable volume with App Volumes, we applied user and application profile settings through UEM without enabling GPU. No NVIDIA drivers were installed on the vSphere host. The virtual desktop machine image was created with no 3D graphics enabled.
Table 6) Test details (single server no GPU)
Test Case Details
Test number Test-01
Hyper-Threading Enabled
Virtual Desktop OS Windows 10 1803 (with latest Windows updates)
Horizon Pool Type Automated – Dedicated User Assignment - Instant Clone
Horizon Pool Size 90
AppVolume Assignment
User Writable Volumes.
Login VSI Launchers 13
Login VSI Test Results (Single Server no GPU) Table 7) shows the results of the test scenario using a single server and no GPU.
Table 7) Test results (single server no GPU)
Item Value
Login VSI Max 80
Login VSI Base 1257ms
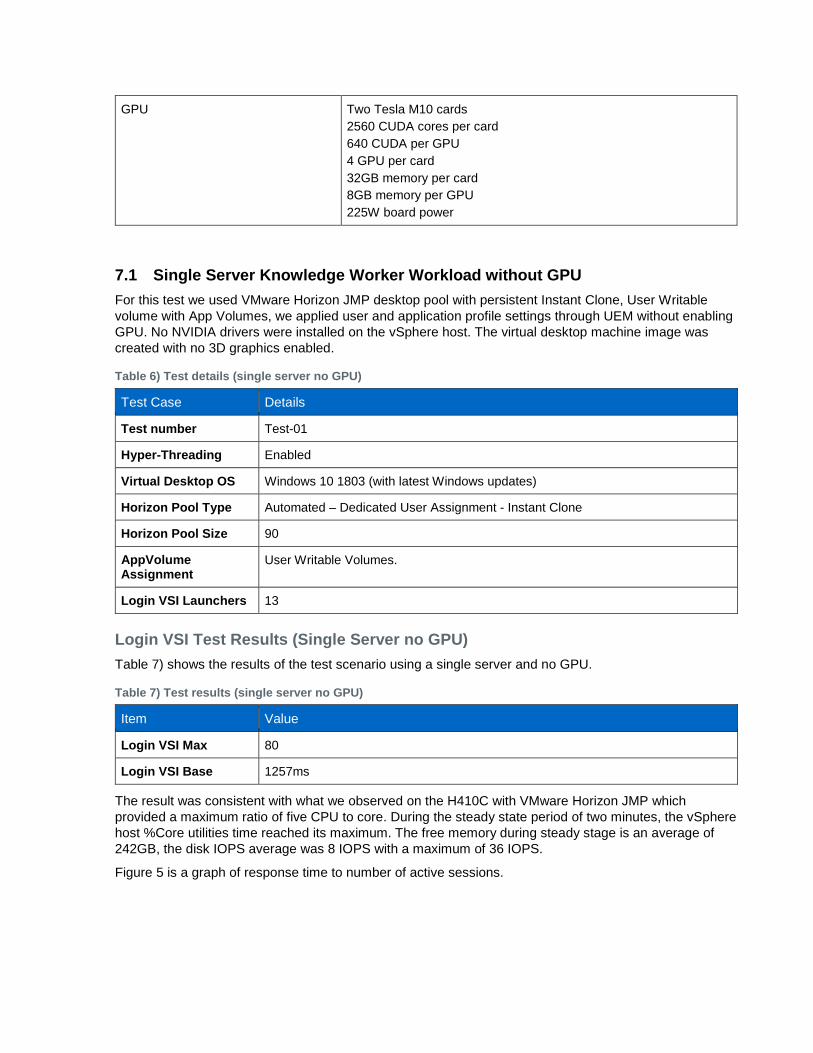
The result was consistent with what we observed on the H410C with VMware Horizon JMP which provided a maximum ratio of five CPU to core. During the steady state period of two minutes, the vSphere host %Core utilities time reached its maximum. The free memory during steady stage is an average of 242GB, the disk IOPS average was 8 IOPS with a maximum of 36 IOPS.
Figure 5 is a graph of response time to number of active sessions.
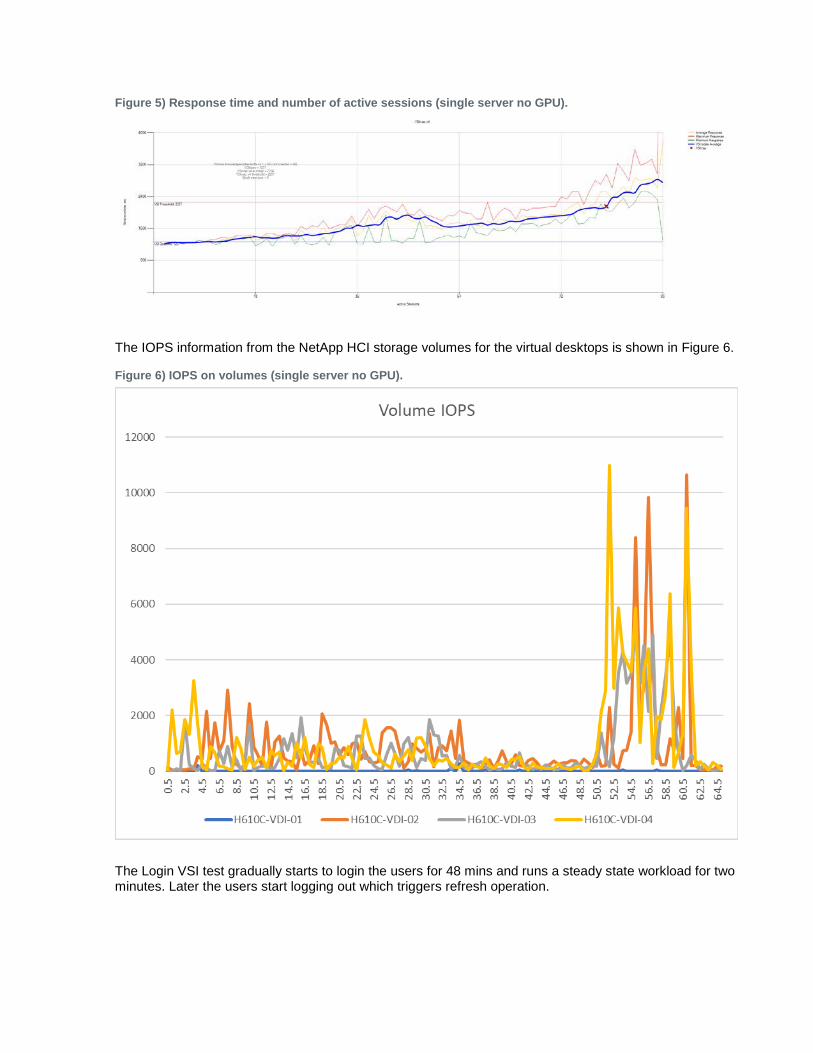
Figure 5) Response time and number of active sessions (single server no GPU).
The IOPS information from the NetApp HCI storage volumes for the virtual desktops is shown in Figure 6.
Figure 6) IOPS on volumes (single server no GPU).
The Login VSI test gradually starts to login the users for 48 mins and runs a steady state workload for two minutes. Later the users start logging out which triggers refresh operation.
7.2 Single Server Knowledge Worker Workload with vSGA mode For this test, we installed the NVIDIA grid vGPU manager on the vSphere host. The default mode of the driver installation is Shared Graphics mode. With Shared Graphics mode, the monitoring capability is limited compared to the Shared-Passthrough (Shared-Direct mode). We used the same workload as Test-01. The virtual desktop machine setting is updated with hardware 3D enabled.
Table 8) Test details (single server with vSGA mode)
Test Case Details
Test number Test-02
Hyper-Threading Enabled
Virtual Desktop OS Windows 10 1803 (with latest Windows updates)
Horizon Pool Type Automated – Dedicated User Assignment - Instant Clone
Horizon Pool Size 70
AppVolume Assignment
User Writable Volume
Login VSI Launchers 13
Login VSI Test Results Table 9 shows the test results for the Login VSI test using a single server with vSGA mode.
Table 9) Test results (single server with vSGA mode)
Item Value
Login VSI Max 77
Login VSI Base 1278ms
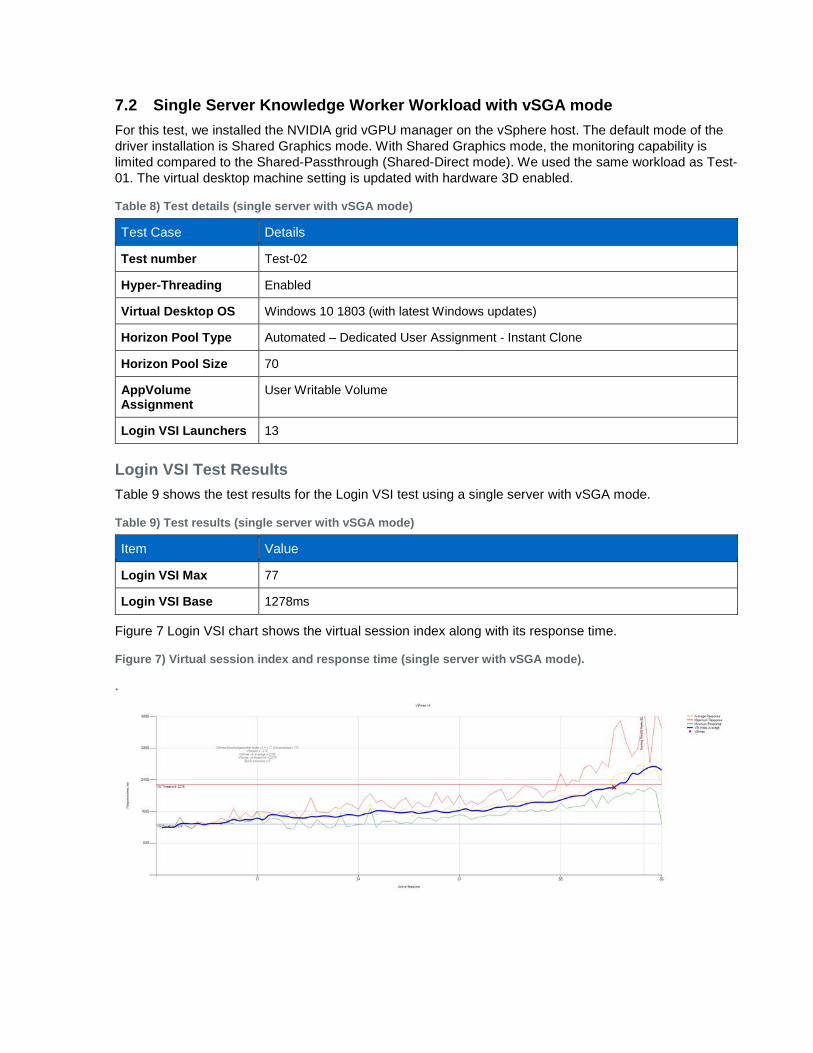
Figure 7 Login VSI chart shows the virtual session index along with its response time.
Figure 7) Virtual session index and response time (single server with vSGA mode).
.
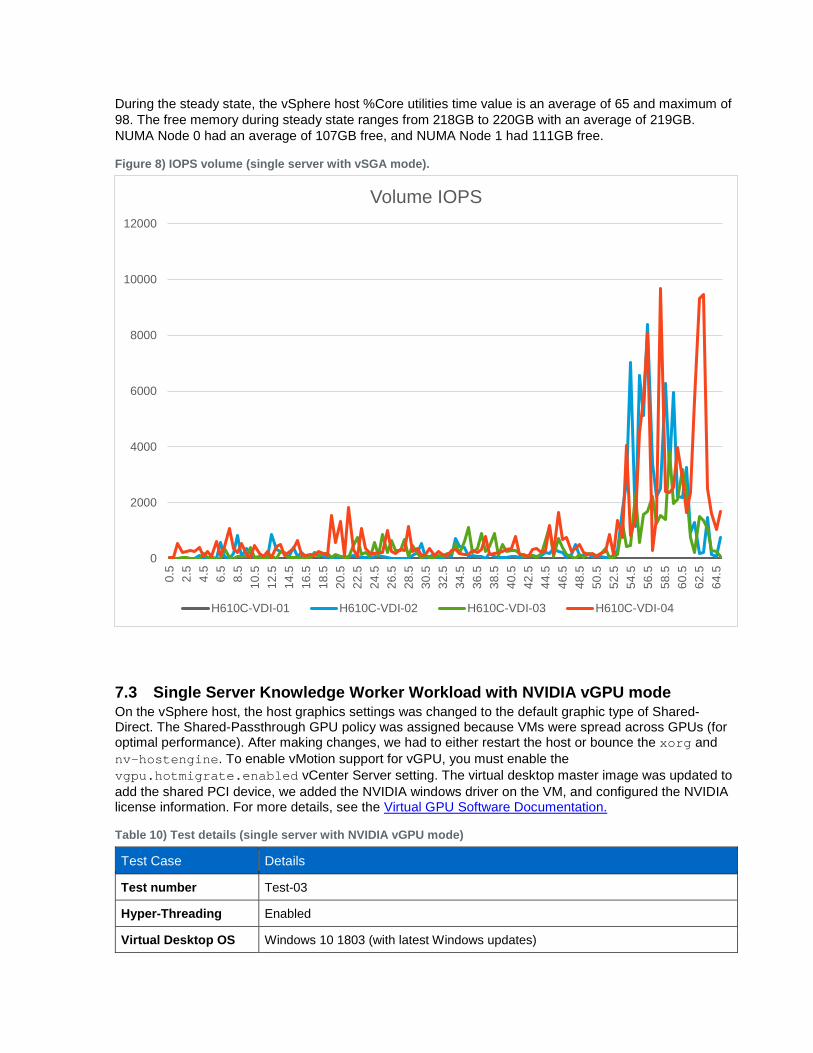
During the steady state, the vSphere host %Core utilities time value is an average of 65 and maximum of 98. The free memory during steady state ranges from 218GB to 220GB with an average of 219GB. NUMA Node 0 had an average of 107GB free, and NUMA Node 1 had 111GB free.
Figure 8) IOPS volume (single server with vSGA mode).
7.3 Single Server Knowledge Worker Workload with NVIDIA vGPU mode On the vSphere host, the host graphics settings was changed to the default graphic type of Shared-Direct. The Shared-Passthrough GPU policy was assigned because VMs were spread across GPUs (for optimal performance). After making changes, we had to either restart the host or bounce the xorg and nv-hostengine. To enable vMotion support for vGPU, you must enable the vgpu.hotmigrate.enabled vCenter Server setting. The virtual desktop master image was updated to add the shared PCI device, we added the NVIDIA windows driver on the VM, and configured the NVIDIA license information. For more details, see the Virtual GPU Software Documentation.
Table 10) Test details (single server with NVIDIA vGPU mode)
Test Case Details
Test number Test-03
Hyper-Threading Enabled
Virtual Desktop OS Windows 10 1803 (with latest Windows updates)
0
2000
4000
6000
8000
10000
12000
0.5
2.5
4.5
6.5
8.5
10.5
12.5
14.5
16.5
18.5
20.5
22.5
24.5
26.5
28.5
30.5
32.5
34.5
36.5
38.5
40.5
42.5
44.5
46.5
48.5
50.5
52.5
54.5
56.5
58.5
60.5
62.5
64.5
Volume IOPS
H610C-VDI-01 H610C-VDI-02 H610C-VDI-03 H610C-VDI-04
Horizon Pool Type Automated – Dedicated User Assignment - Instant Clone
Horizon Pool Size 64
AppVolume Assignment
User Writable Volume
Login VSI Launchers 13
Login VSI Test Results Table 11 shows the test results using a single server with NVIDIA vGPU mode.
Table 11) Test results (single server with NVIDIA vGPU mode)
Item Value
Login VSI Max 58
Login VSI Base 1245ms
Without App Volumes Agent installed on the machine, we can achieve VSI maximum of 64 per server with VSI baseline of 877ms.
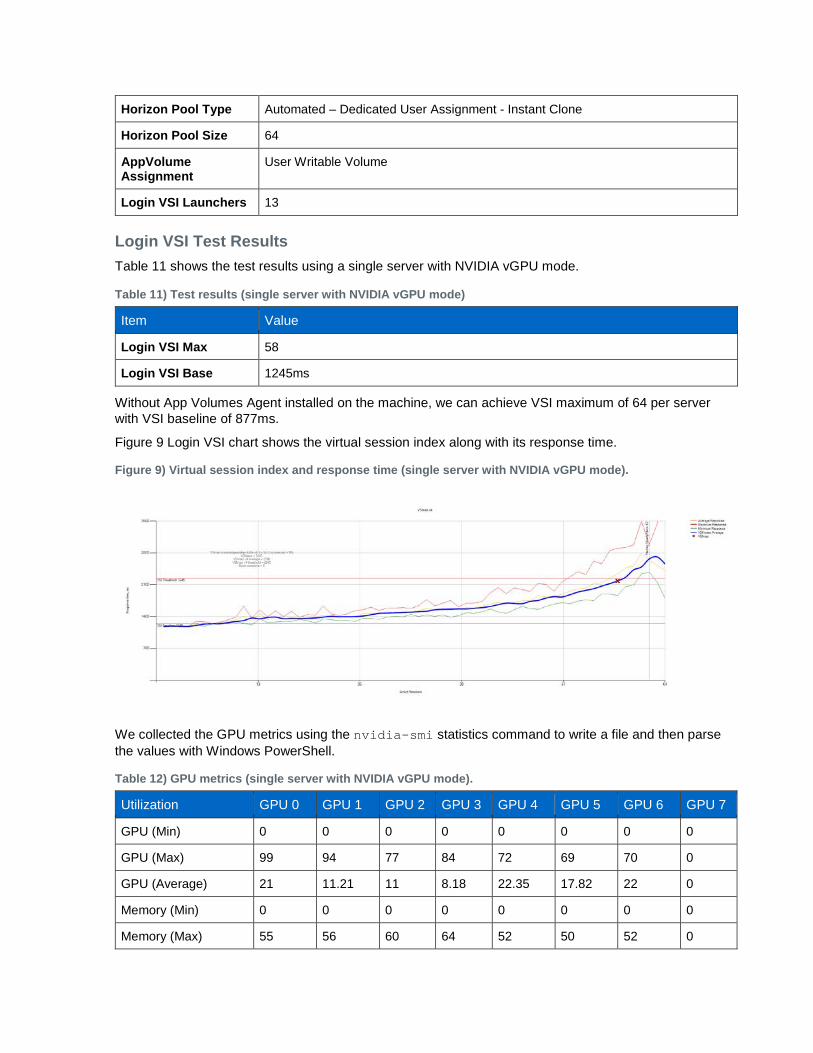
Figure 9 Login VSI chart shows the virtual session index along with its response time.
Figure 9) Virtual session index and response time (single server with NVIDIA vGPU mode).
We collected the GPU metrics using the nvidia-smi statistics command to write a file and then parse the values with Windows PowerShell.
Table 12) GPU metrics (single server with NVIDIA vGPU mode).
Utilization GPU 0 GPU 1 GPU 2 GPU 3 GPU 4 GPU 5 GPU 6 GPU 7
GPU (Min) 0 0 0 0 0 0 0 0
GPU (Max) 99 94 77 84 72 69 70 0
GPU (Average) 21 11.21 11 8.18 22.35 17.82 22 0
Memory (Min) 0 0 0 0 0 0 0 0
Memory (Max) 55 56 60 64 52 50 52 0
Utilization GPU 0 GPU 1 GPU 2 GPU 3 GPU 4 GPU 5 GPU 6 GPU 7
Memory (Average) 11.86 6.36 5.10 3.8 11.6 10.03 11.57 0
Encoder (Min) 0 0 0 0 0 0 0 0
Encoder (Max) 26 17 22 28 17 17 17 0
Encoder (Avg) 10.68 4.20 5.58 4.68 8.47 6.58 8.04 0
Decoder (Min) 0 0 0 0 0 0 0 0
Decoder (Max) 0 0 0 0 0 0 0 0
Decoder (Avg) 0 0 0 0 0 0 0 0
GPU 7 was not used and that might be the reason for the lower user count.
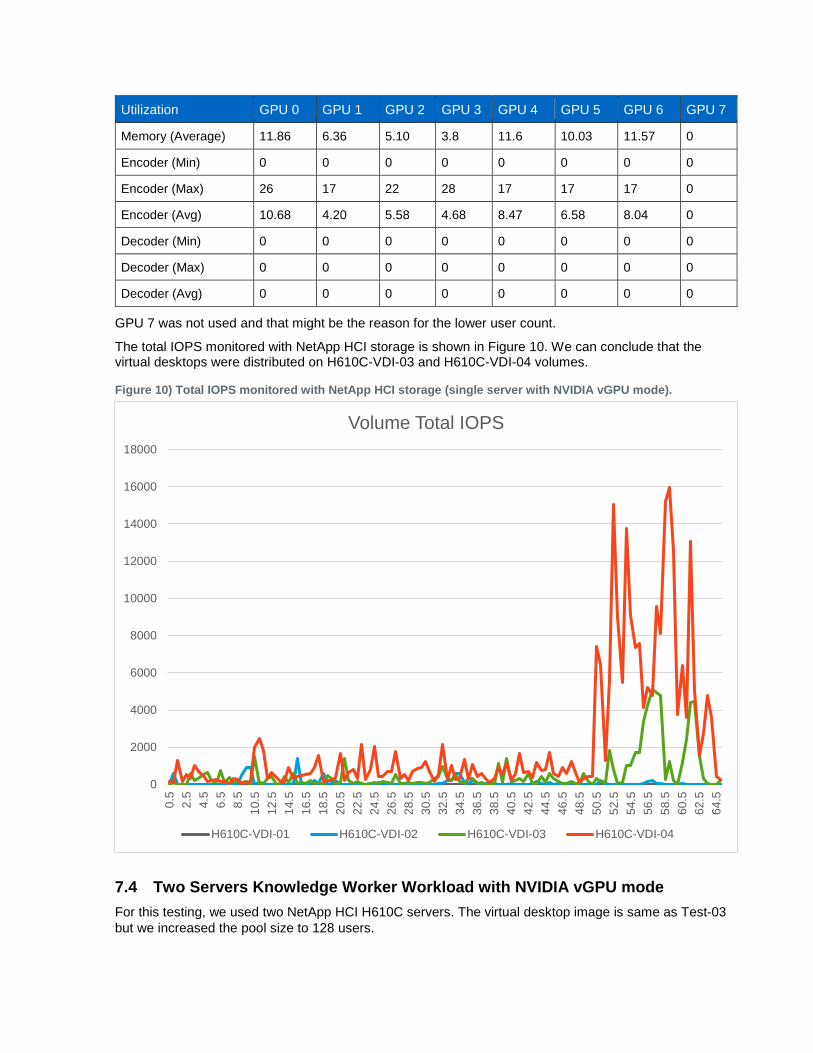
The total IOPS monitored with NetApp HCI storage is shown in Figure 10. We can conclude that the virtual desktops were distributed on H610C-VDI-03 and H610C-VDI-04 volumes.
Figure 10) Total IOPS monitored with NetApp HCI storage (single server with NVIDIA vGPU mode).
7.4 Two Servers Knowledge Worker Workload with NVIDIA vGPU mode For this testing, we used two NetApp HCI H610C servers. The virtual desktop image is same as Test-03 but we increased the pool size to 128 users.
0
2000
4000
6000
8000
10000
12000
14000
16000
18000
0.5
2.5
4.5
6.5
8.5
10.5
12.5
14.5
16.5
18.5
20.5
22.5
24.5
26.5
28.5
30.5
32.5
34.5
36.5
38.5
40.5
42.5
44.5
46.5
48.5
50.5
52.5
54.5
56.5
58.5
60.5
62.5
64.5
Volume Total IOPS
H610C-VDI-01 H610C-VDI-02 H610C-VDI-03 H610C-VDI-04
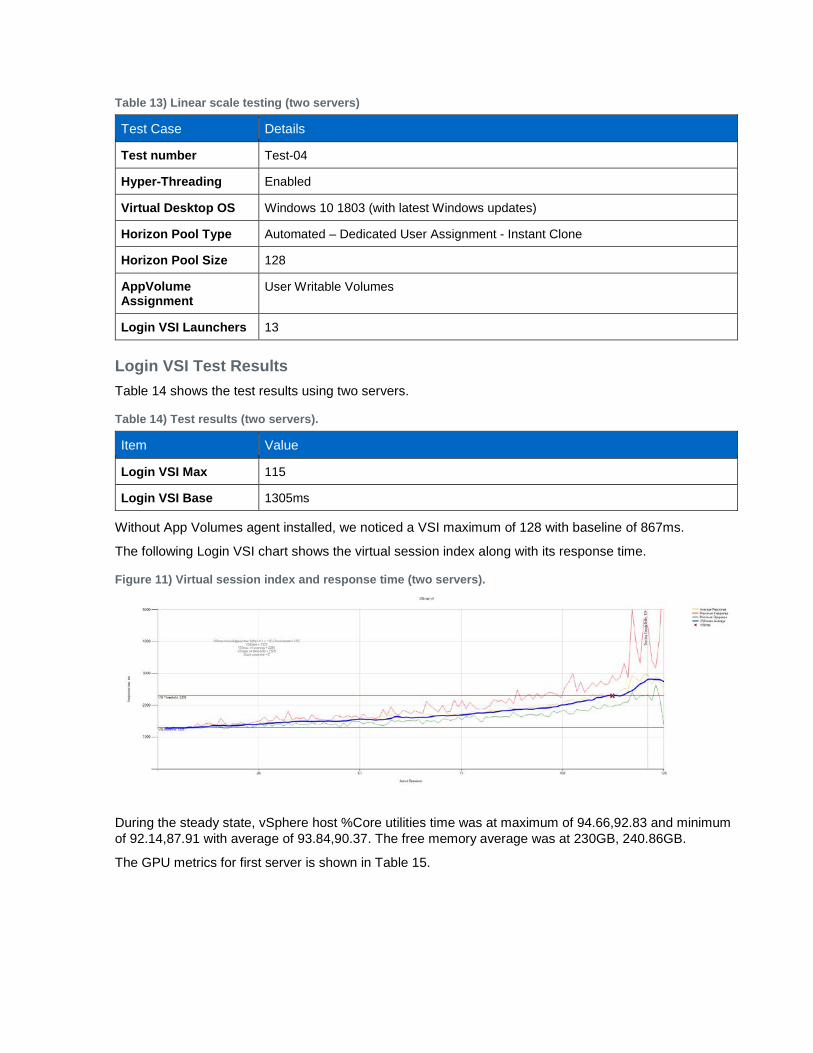
Table 13) Linear scale testing (two servers)
Test Case Details
Test number Test-04
Hyper-Threading Enabled
Virtual Desktop OS Windows 10 1803 (with latest Windows updates)
Horizon Pool Type Automated – Dedicated User Assignment - Instant Clone
Horizon Pool Size 128
AppVolume Assignment
User Writable Volumes
Login VSI Launchers 13
Login VSI Test Results Table 14 shows the test results using two servers.
Table 14) Test results (two servers).
Item Value
Login VSI Max 115
Login VSI Base 1305ms
Without App Volumes agent installed, we noticed a VSI maximum of 128 with baseline of 867ms.
The following Login VSI chart shows the virtual session index along with its response time.
Figure 11) Virtual session index and response time (two servers).
During the steady state, vSphere host %Core utilities time was at maximum of 94.66,92.83 and minimum of 92.14,87.91 with average of 93.84,90.37. The free memory average was at 230GB, 240.86GB.
The GPU metrics for first server is shown in Table 15.
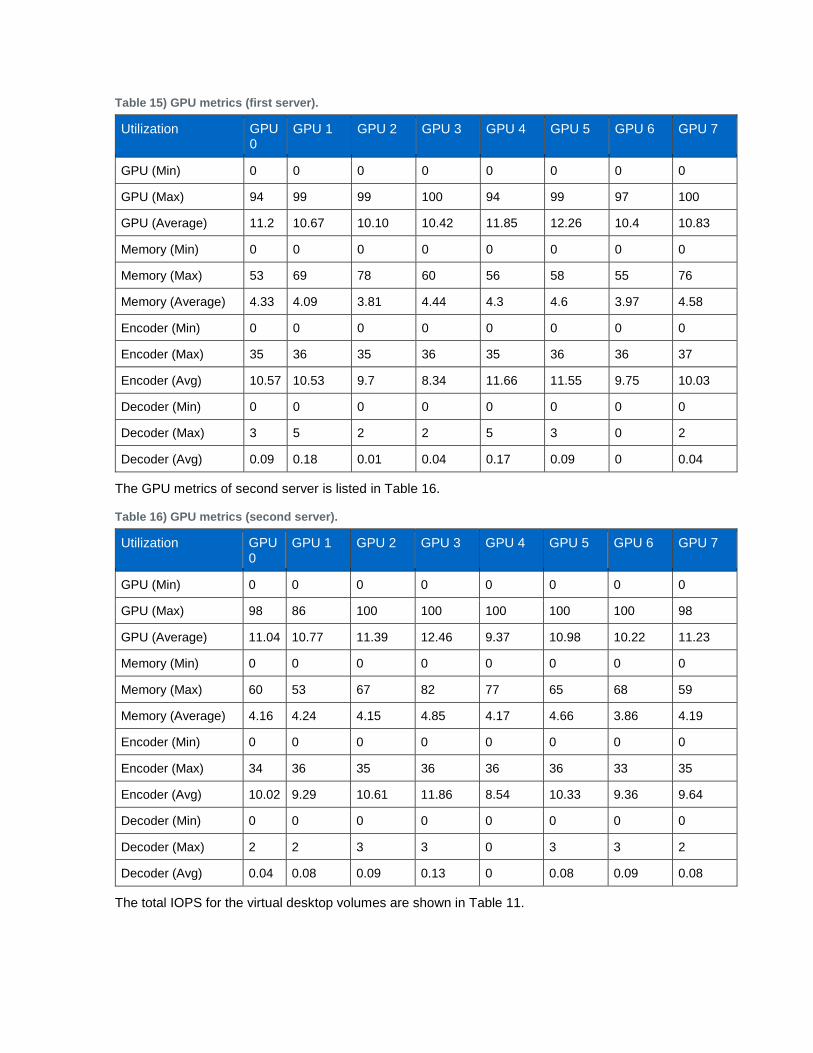
Table 15) GPU metrics (first server).
Utilization GPU 0
GPU 1 GPU 2 GPU 3 GPU 4 GPU 5 GPU 6 GPU 7
GPU (Min) 0 0 0 0 0 0 0 0
GPU (Max) 94 99 99 100 94 99 97 100
GPU (Average) 11.2 10.67 10.10 10.42 11.85 12.26 10.4 10.83
Memory (Min) 0 0 0 0 0 0 0 0
Memory (Max) 53 69 78 60 56 58 55 76
Memory (Average) 4.33 4.09 3.81 4.44 4.3 4.6 3.97 4.58
Encoder (Min) 0 0 0 0 0 0 0 0
Encoder (Max) 35 36 35 36 35 36 36 37
Encoder (Avg) 10.57 10.53 9.7 8.34 11.66 11.55 9.75 10.03
Decoder (Min) 0 0 0 0 0 0 0 0
Decoder (Max) 3 5 2 2 5 3 0 2
Decoder (Avg) 0.09 0.18 0.01 0.04 0.17 0.09 0 0.04
The GPU metrics of second server is listed in Table 16.
Table 16) GPU metrics (second server).
Utilization GPU 0
GPU 1 GPU 2 GPU 3 GPU 4 GPU 5 GPU 6 GPU 7
GPU (Min) 0 0 0 0 0 0 0 0
GPU (Max) 98 86 100 100 100 100 100 98
GPU (Average) 11.04 10.77 11.39 12.46 9.37 10.98 10.22 11.23
Memory (Min) 0 0 0 0 0 0 0 0
Memory (Max) 60 53 67 82 77 65 68 59
Memory (Average) 4.16 4.24 4.15 4.85 4.17 4.66 3.86 4.19
Encoder (Min) 0 0 0 0 0 0 0 0
Encoder (Max) 34 36 35 36 36 36 33 35
Encoder (Avg) 10.02 9.29 10.61 11.86 8.54 10.33 9.36 9.64
Decoder (Min) 0 0 0 0 0 0 0 0
Decoder (Max) 2 2 3 3 0 3 3 2
Decoder (Avg) 0.04 0.08 0.09 0.13 0 0.08 0.09 0.08
The total IOPS for the virtual desktop volumes are shown in Table 11.
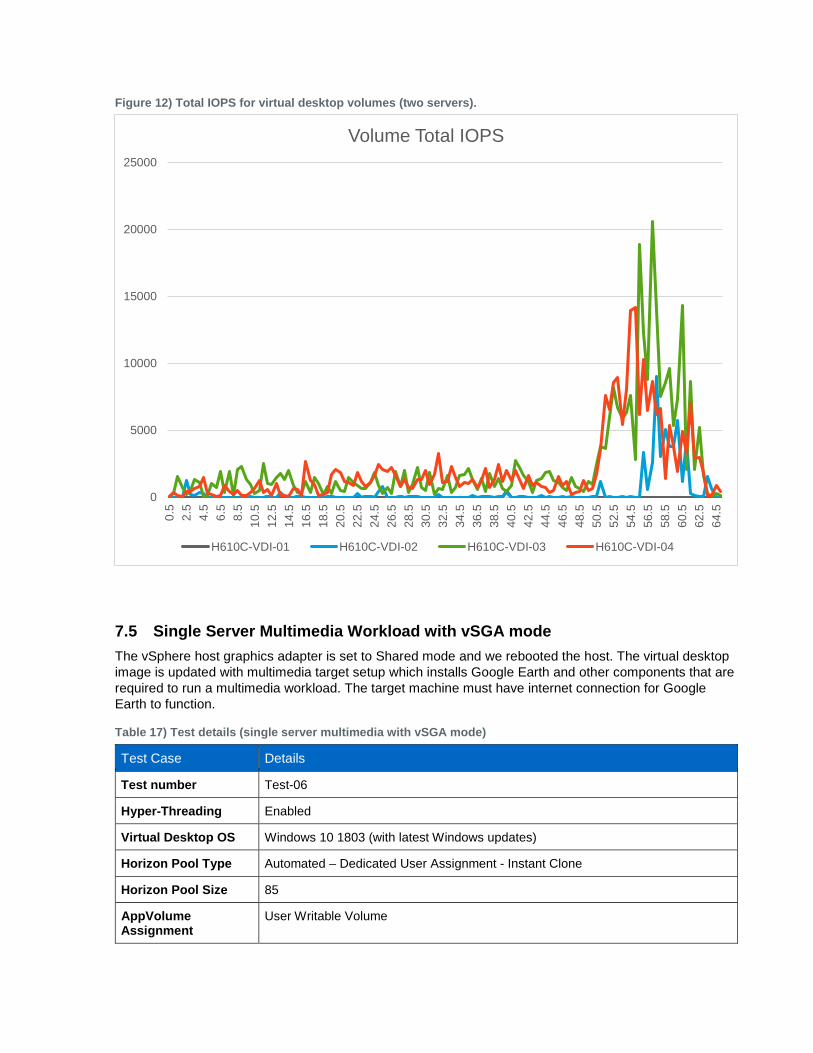
Figure 12) Total IOPS for virtual desktop volumes (two servers).
7.5 Single Server Multimedia Workload with vSGA mode The vSphere host graphics adapter is set to Shared mode and we rebooted the host. The virtual desktop image is updated with multimedia target setup which installs Google Earth and other components that are required to run a multimedia workload. The target machine must have internet connection for Google Earth to function.
Table 17) Test details (single server multimedia with vSGA mode)
Test Case Details
Test number Test-06
Hyper-Threading Enabled
Virtual Desktop OS Windows 10 1803 (with latest Windows updates)
Horizon Pool Type Automated – Dedicated User Assignment - Instant Clone
Horizon Pool Size 85
AppVolume Assignment
User Writable Volume
0
5000
10000
15000
20000
250000.
52.
54.
56.
58.
510
.512
.514
.516
.518
.520
.522
.524
.526
.528
.530
.532
.534
.536
.538
.540
.542
.544
.546
.548
.550
.552
.554
.556
.558
.560
.562
.564
.5
Volume Total IOPS
H610C-VDI-01 H610C-VDI-02 H610C-VDI-03 H610C-VDI-04
Login VSI Launchers 13
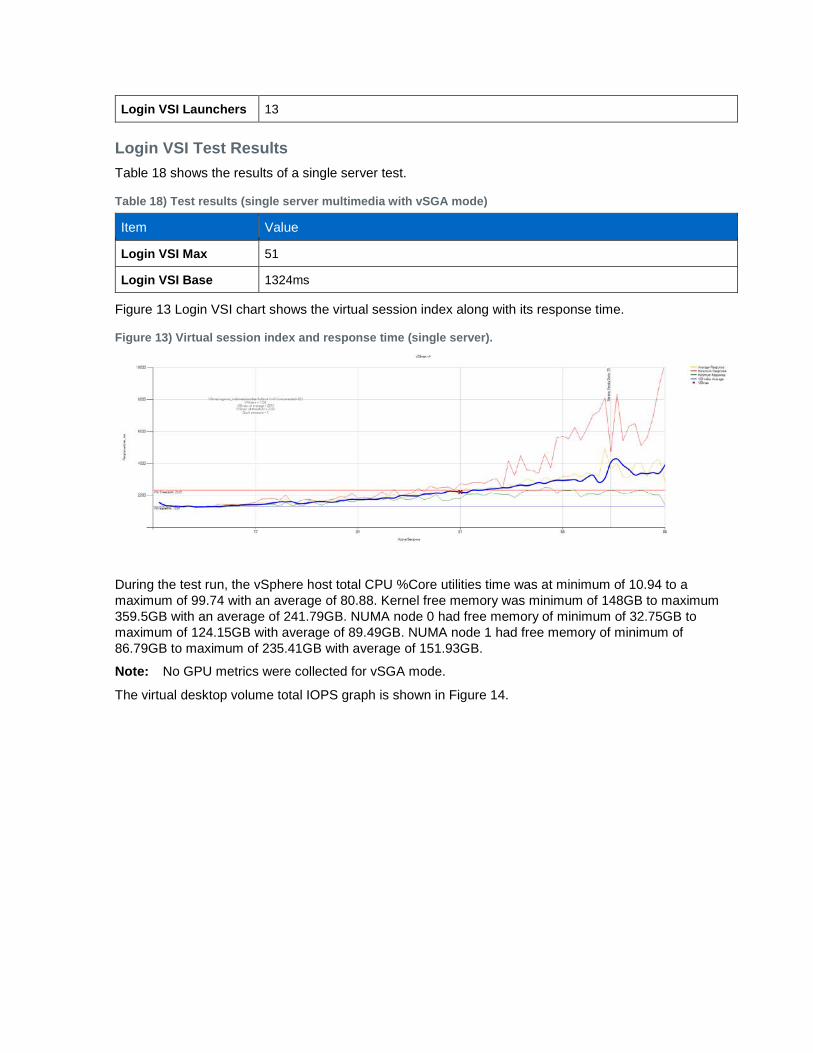
Login VSI Test Results Table 18 shows the results of a single server test.
Table 18) Test results (single server multimedia with vSGA mode)
Item Value
Login VSI Max 51
Login VSI Base 1324ms
Figure 13 Login VSI chart shows the virtual session index along with its response time.
Figure 13) Virtual session index and response time (single server).
During the test run, the vSphere host total CPU %Core utilities time was at minimum of 10.94 to a maximum of 99.74 with an average of 80.88. Kernel free memory was minimum of 148GB to maximum 359.5GB with an average of 241.79GB. NUMA node 0 had free memory of minimum of 32.75GB to maximum of 124.15GB with average of 89.49GB. NUMA node 1 had free memory of minimum of 86.79GB to maximum of 235.41GB with average of 151.93GB.
Note: No GPU metrics were collected for vSGA mode.
The virtual desktop volume total IOPS graph is shown in Figure 14.
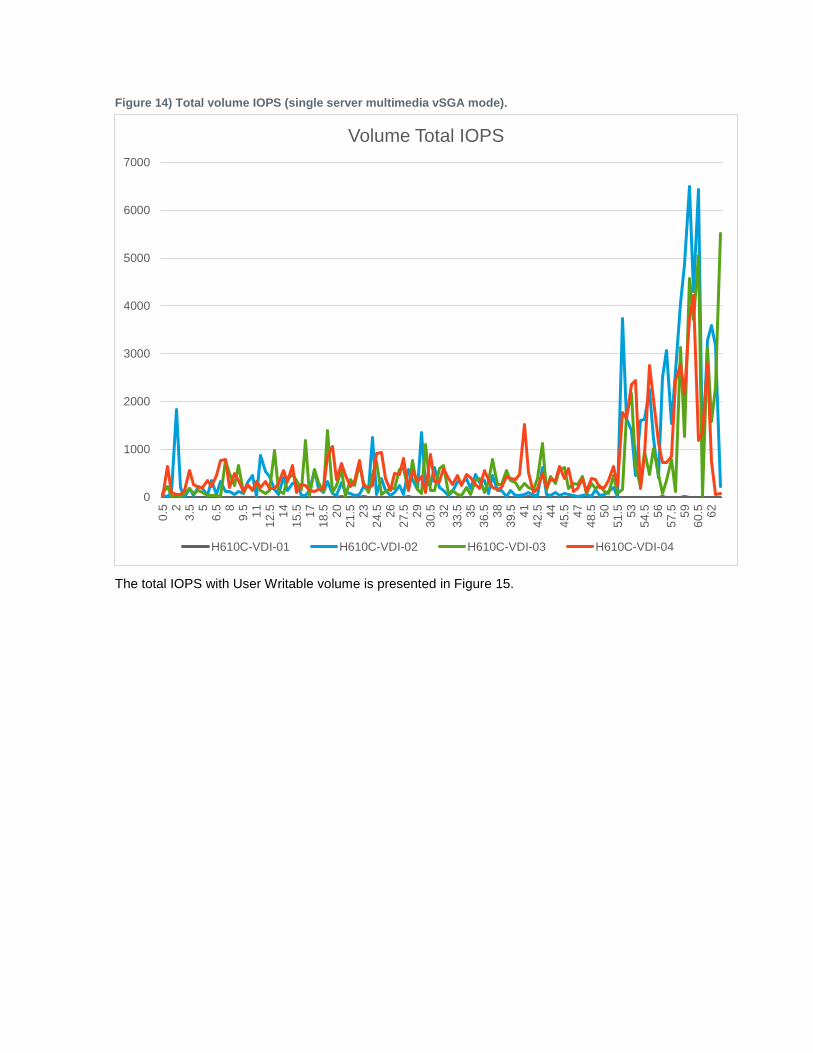
Figure 14) Total volume IOPS (single server multimedia vSGA mode).
The total IOPS with User Writable volume is presented in Figure 15.
0
1000
2000
3000
4000
5000
6000
70000.
5 23.
5 56.
5 89.
5 1112
.5 1415
.5 1718
.5 2021
.5 2324
.5 2627
.5 2930
.5 3233
.5 3536
.5 3839
.5 4142
.5 4445
.5 4748
.5 5051
.5 5354
.5 5657
.5 5960
.5 62
Volume Total IOPS
H610C-VDI-01 H610C-VDI-02 H610C-VDI-03 H610C-VDI-04
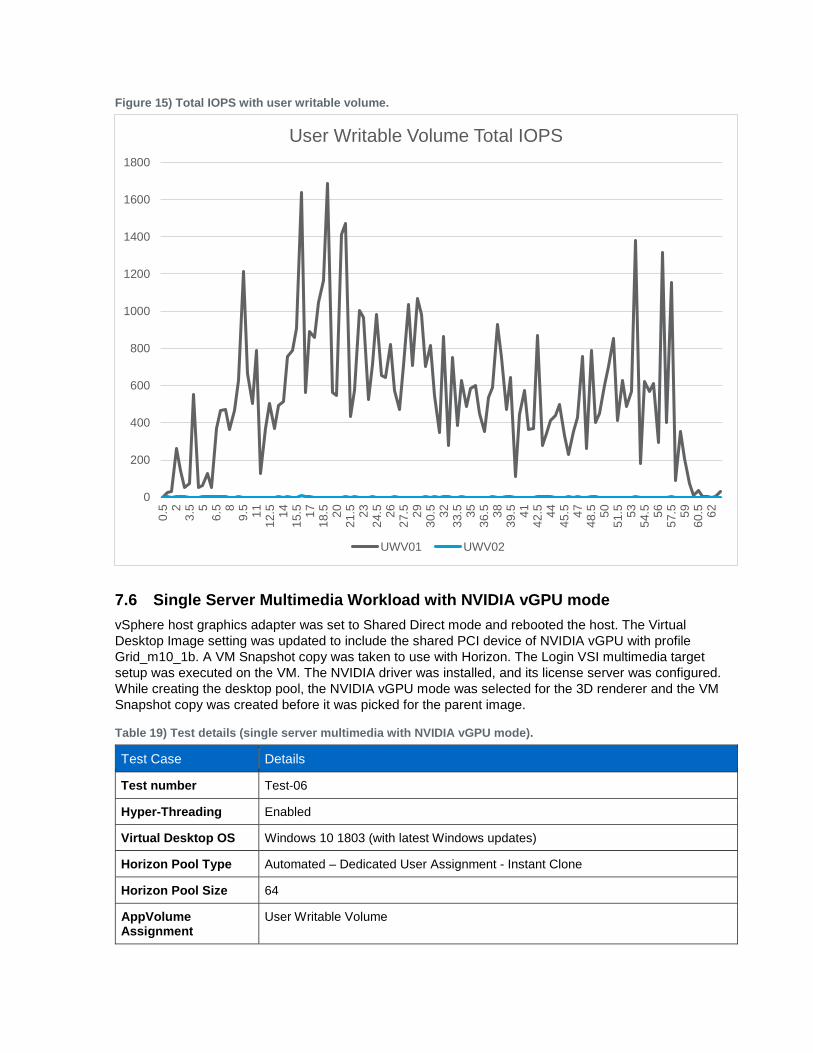
Figure 15) Total IOPS with user writable volume.
7.6 Single Server Multimedia Workload with NVIDIA vGPU mode vSphere host graphics adapter was set to Shared Direct mode and rebooted the host. The Virtual Desktop Image setting was updated to include the shared PCI device of NVIDIA vGPU with profile Grid_m10_1b. A VM Snapshot copy was taken to use with Horizon. The Login VSI multimedia target setup was executed on the VM. The NVIDIA driver was installed, and its license server was configured. While creating the desktop pool, the NVIDIA vGPU mode was selected for the 3D renderer and the VM Snapshot copy was created before it was picked for the parent image.
Table 19) Test details (single server multimedia with NVIDIA vGPU mode).
Test Case Details
Test number Test-06
Hyper-Threading Enabled
Virtual Desktop OS Windows 10 1803 (with latest Windows updates)
Horizon Pool Type Automated – Dedicated User Assignment - Instant Clone
Horizon Pool Size 64
AppVolume Assignment
User Writable Volume
0
200
400
600
800
1000
1200
1400
1600
18000.
5 23.
5 56.
5 89.
5 1112
.5 1415
.5 1718
.5 2021
.5 2324
.5 2627
.5 2930
.5 3233
.5 3536
.5 3839
.5 4142
.5 4445
.5 4748
.5 5051
.5 5354
.5 5657
.5 5960
.5 62
User Writable Volume Total IOPS
UWV01 UWV02
Login VSI Launchers 13
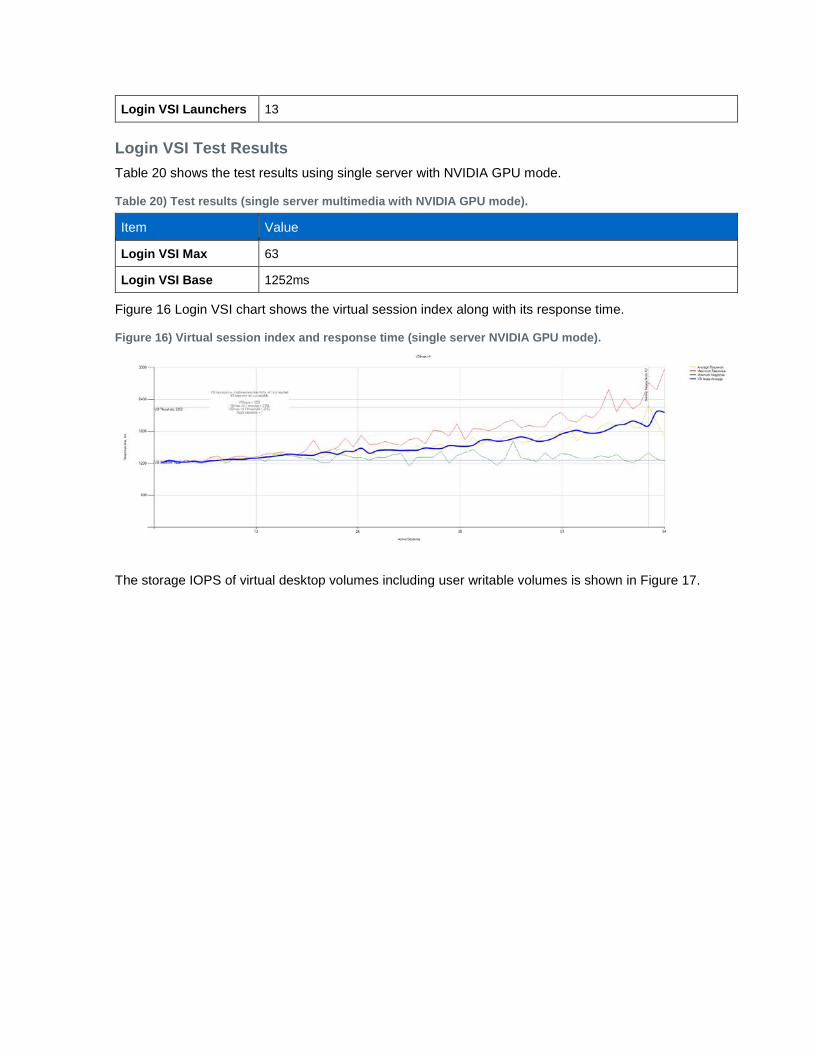
Login VSI Test Results Table 20 shows the test results using single server with NVIDIA GPU mode.
Table 20) Test results (single server multimedia with NVIDIA GPU mode).
Item Value
Login VSI Max 63
Login VSI Base 1252ms
Figure 16 Login VSI chart shows the virtual session index along with its response time.
Figure 16) Virtual session index and response time (single server NVIDIA GPU mode).
The storage IOPS of virtual desktop volumes including user writable volumes is shown in Figure 17.
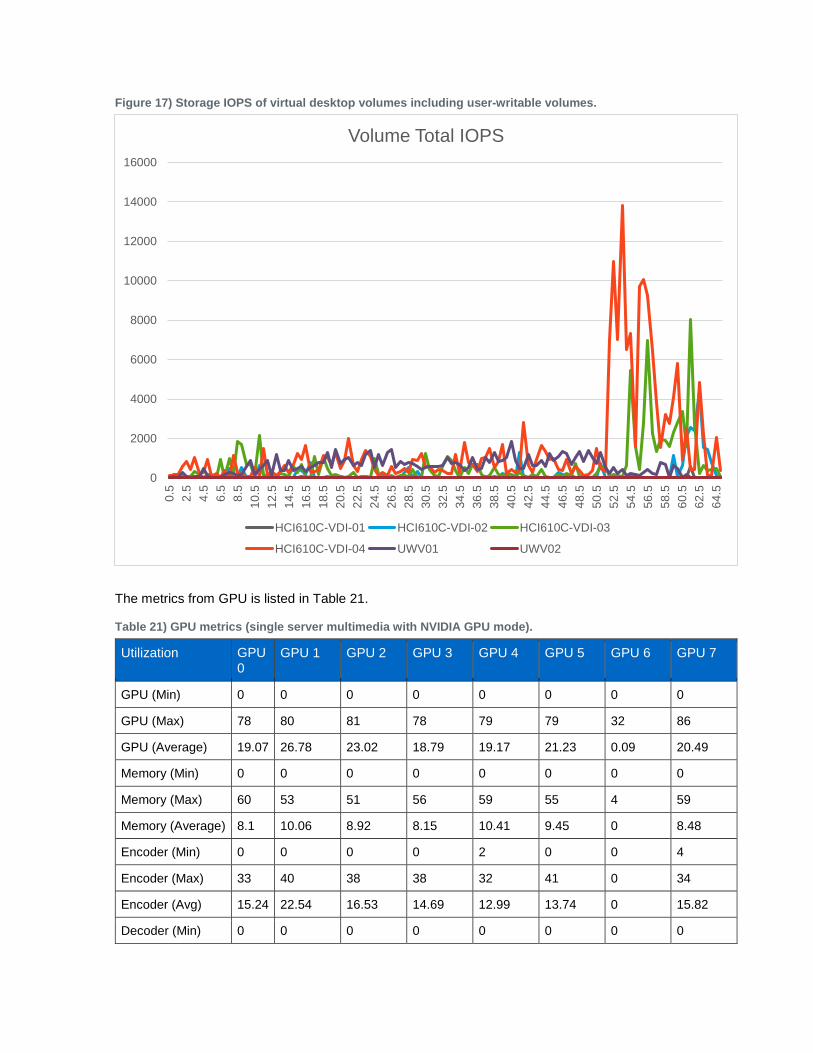
Figure 17) Storage IOPS of virtual desktop volumes including user-writable volumes.
The metrics from GPU is listed in Table 21.
Table 21) GPU metrics (single server multimedia with NVIDIA GPU mode).
Utilization GPU 0
GPU 1 GPU 2 GPU 3 GPU 4 GPU 5 GPU 6 GPU 7
GPU (Min) 0 0 0 0 0 0 0 0
GPU (Max) 78 80 81 78 79 79 32 86
GPU (Average) 19.07 26.78 23.02 18.79 19.17 21.23 0.09 20.49
Memory (Min) 0 0 0 0 0 0 0 0
Memory (Max) 60 53 51 56 59 55 4 59
Memory (Average) 8.1 10.06 8.92 8.15 10.41 9.45 0 8.48
Encoder (Min) 0 0 0 0 2 0 0 4
Encoder (Max) 33 40 38 38 32 41 0 34
Encoder (Avg) 15.24 22.54 16.53 14.69 12.99 13.74 0 15.82
Decoder (Min) 0 0 0 0 0 0 0 0
0
2000
4000
6000
8000
10000
12000
14000
160000.
52.
54.
56.
58.
510
.512
.514
.516
.518
.520
.522
.524
.526
.528
.530
.532
.534
.536
.538
.540
.542
.544
.546
.548
.550
.552
.554
.556
.558
.560
.562
.564
.5
Volume Total IOPS
HCI610C-VDI-01 HCI610C-VDI-02 HCI610C-VDI-03
HCI610C-VDI-04 UWV01 UWV02
Utilization GPU 0
GPU 1 GPU 2 GPU 3 GPU 4 GPU 5 GPU 6 GPU 7
Decoder (Max) 10 0 0 0 13 0 0 9
Decoder (Avg) 0.05 0 0 0 1.01 0 0 0.53
It is interesting to note that the GPU use on a multimedia workload fluctuates less and that the average GPU load is almost double that of knowledge worker workload.
7.7 Knowledge Worker Load with Mix of 400 Users on H410C and 128 Users on H610C servers
NetApp HCI H410C and H610C were managed with the same vCenter with two vSphere clusters. Two Horizon Instant Clone desktop pools were created; one on each cluster. No App Volume Agent was installed on the virtual desktop master image. The virtual desktop on H610C was in NVIDIA vGPU mode with a grid profile of grid_m10-1b.
Table 22) Test details (mixed users on H410C and H610C servers).
Test Case Details
Test number Test-07
Hyperthreading Enabled
Virtual Desktop OS Windows 10 1803 (with latest Windows updates)
Horizon Pool Type Automated – Dedicated User Assignment - Instant Clone
Horizon Pool Size 528 (400 + 128)
AppVolume Assignment
Not Applicable
Login VSI Launchers 40
Login VSI Test Results Table 23 shows the test results using a mix of users on different server types.
Table 23) Test results (mixed users on H410C and H610C servers).
Item Value
Login VSI Max 527
Login VSI Base 1040ms
Figure 18 Login VSI chart shows the virtual session index along with its response time.
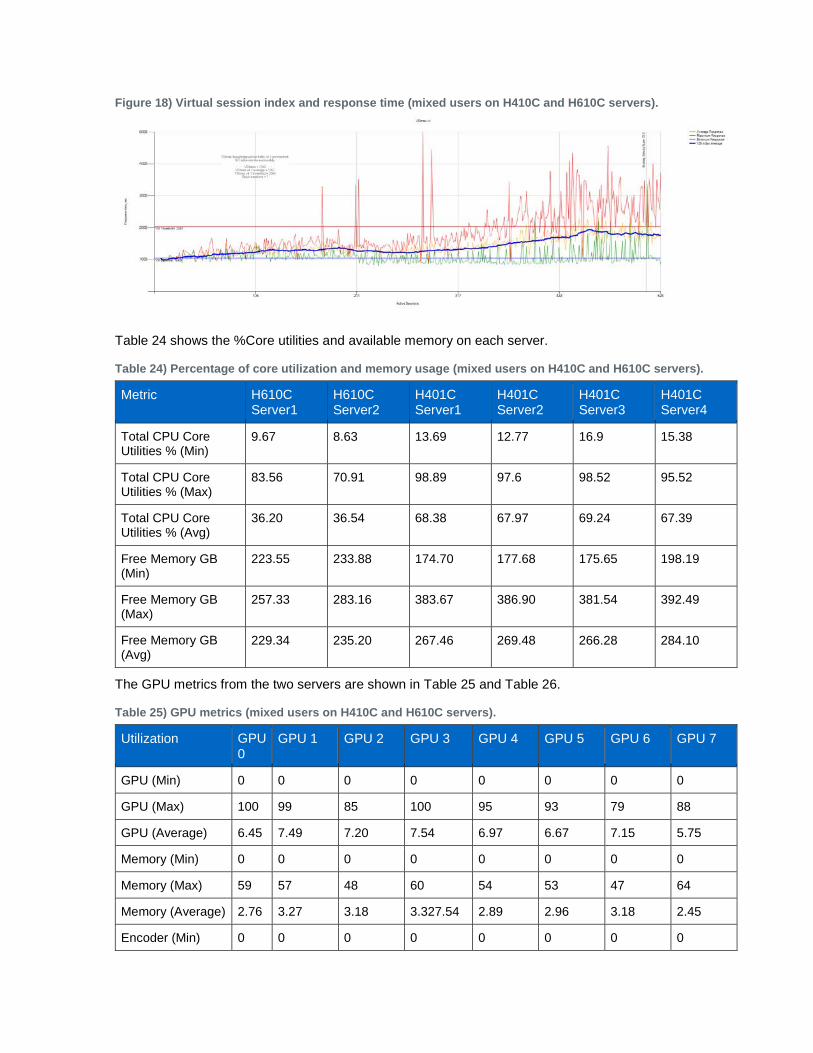
Figure 18) Virtual session index and response time (mixed users on H410C and H610C servers).
Table 24 shows the %Core utilities and available memory on each server.
Table 24) Percentage of core utilization and memory usage (mixed users on H410C and H610C servers).
Metric H610C Server1
H610C Server2
H401C Server1
H401C Server2
H401C Server3
H401C Server4
Total CPU Core Utilities % (Min)
9.67 8.63 13.69 12.77 16.9 15.38
Total CPU Core Utilities % (Max)
83.56 70.91 98.89 97.6 98.52 95.52
Total CPU Core Utilities % (Avg)
36.20 36.54 68.38 67.97 69.24 67.39
Free Memory GB (Min)
223.55 233.88 174.70 177.68 175.65 198.19
Free Memory GB (Max)
257.33 283.16 383.67 386.90 381.54 392.49
Free Memory GB (Avg)
229.34 235.20 267.46 269.48 266.28 284.10
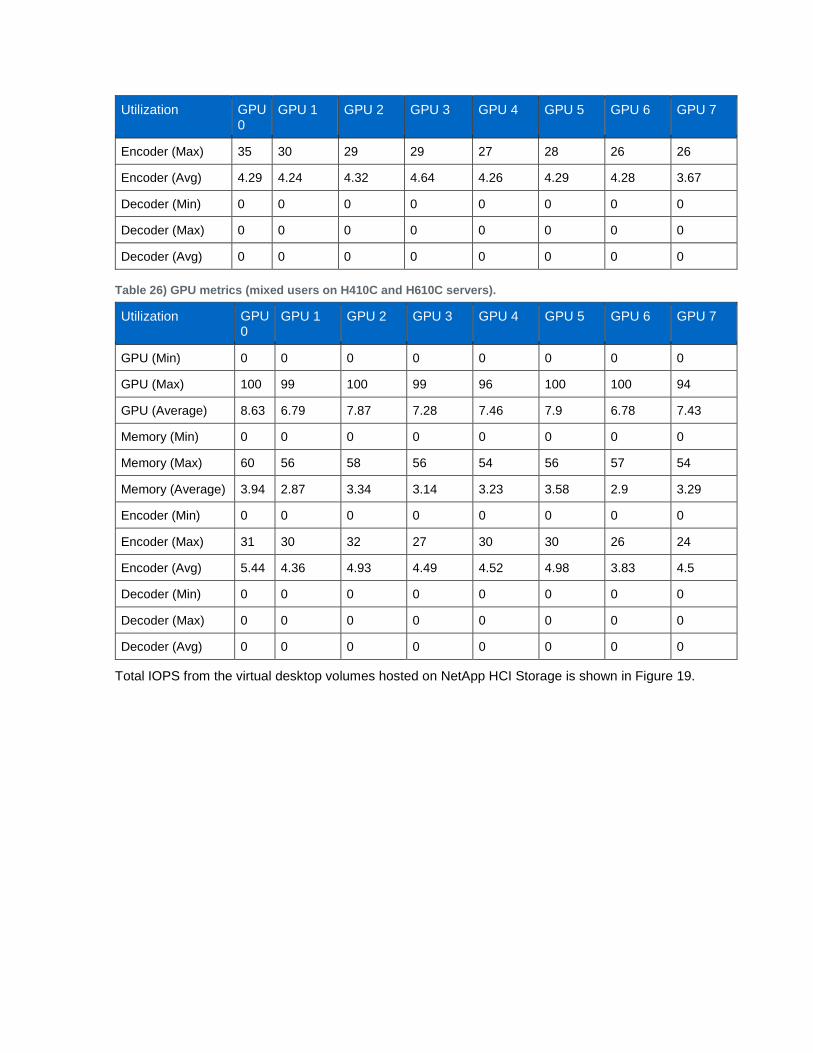
The GPU metrics from the two servers are shown in Table 25 and Table 26.
Table 25) GPU metrics (mixed users on H410C and H610C servers).
Utilization GPU 0
GPU 1 GPU 2 GPU 3 GPU 4 GPU 5 GPU 6 GPU 7
GPU (Min) 0 0 0 0 0 0 0 0
GPU (Max) 100 99 85 100 95 93 79 88
GPU (Average) 6.45 7.49 7.20 7.54 6.97 6.67 7.15 5.75
Memory (Min) 0 0 0 0 0 0 0 0
Memory (Max) 59 57 48 60 54 53 47 64
Memory (Average) 2.76 3.27 3.18 3.327.54 2.89 2.96 3.18 2.45
Encoder (Min) 0 0 0 0 0 0 0 0
Utilization GPU 0
GPU 1 GPU 2 GPU 3 GPU 4 GPU 5 GPU 6 GPU 7
Encoder (Max) 35 30 29 29 27 28 26 26
Encoder (Avg) 4.29 4.24 4.32 4.64 4.26 4.29 4.28 3.67
Decoder (Min) 0 0 0 0 0 0 0 0
Decoder (Max) 0 0 0 0 0 0 0 0
Decoder (Avg) 0 0 0 0 0 0 0 0
Table 26) GPU metrics (mixed users on H410C and H610C servers).
Utilization GPU 0
GPU 1 GPU 2 GPU 3 GPU 4 GPU 5 GPU 6 GPU 7
GPU (Min) 0 0 0 0 0 0 0 0
GPU (Max) 100 99 100 99 96 100 100 94
GPU (Average) 8.63 6.79 7.87 7.28 7.46 7.9 6.78 7.43
Memory (Min) 0 0 0 0 0 0 0 0
Memory (Max) 60 56 58 56 54 56 57 54
Memory (Average) 3.94 2.87 3.34 3.14 3.23 3.58 2.9 3.29
Encoder (Min) 0 0 0 0 0 0 0 0
Encoder (Max) 31 30 32 27 30 30 26 24
Encoder (Avg) 5.44 4.36 4.93 4.49 4.52 4.98 3.83 4.5
Decoder (Min) 0 0 0 0 0 0 0 0
Decoder (Max) 0 0 0 0 0 0 0 0
Decoder (Avg) 0 0 0 0 0 0 0 0
Total IOPS from the virtual desktop volumes hosted on NetApp HCI Storage is shown in Figure 19.
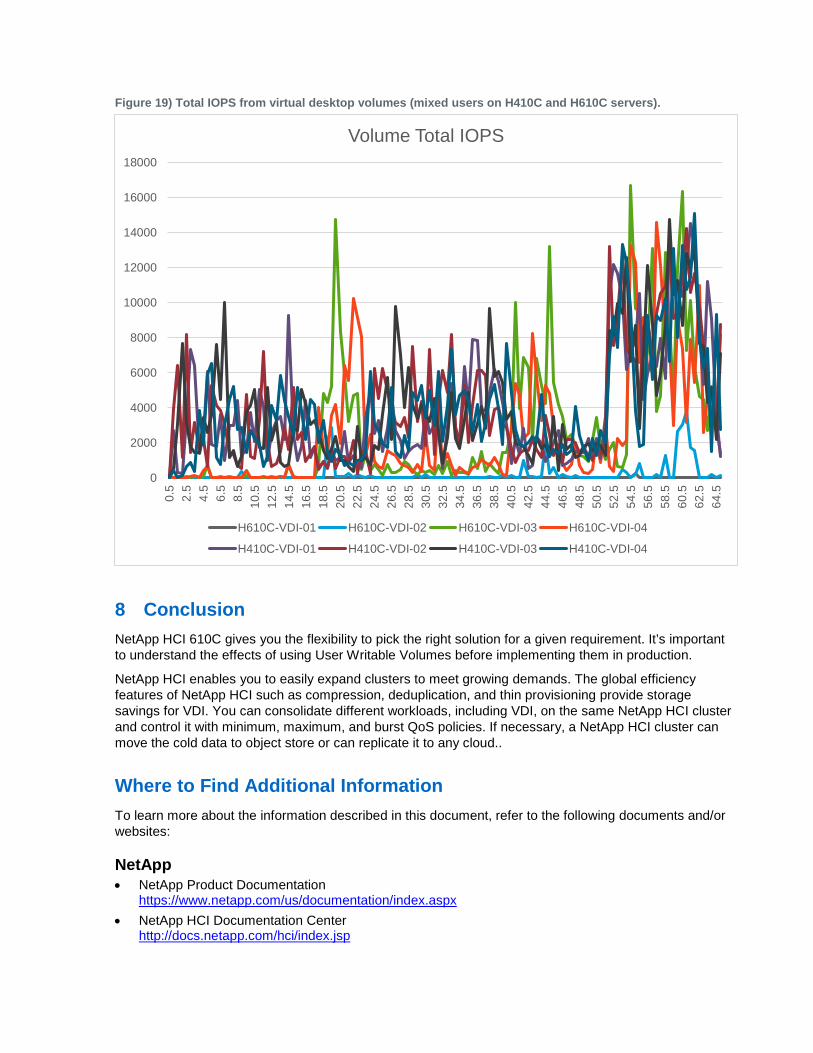
Figure 19) Total IOPS from virtual desktop volumes (mixed users on H410C and H610C servers).
8 Conclusion NetApp HCI 610C gives you the flexibility to pick the right solution for a given requirement. It’s important to understand the effects of using User Writable Volumes before implementing them in production.
NetApp HCI enables you to easily expand clusters to meet growing demands. The global efficiency features of NetApp HCI such as compression, deduplication, and thin provisioning provide storage savings for VDI. You can consolidate different workloads, including VDI, on the same NetApp HCI cluster and control it with minimum, maximum, and burst QoS policies. If necessary, a NetApp HCI cluster can move the cold data to object store or can replicate it to any cloud..
Where to Find Additional Information To learn more about the information described in this document, refer to the following documents and/or websites:
NetApp • NetApp Product Documentation
https://www.netapp.com/us/documentation/index.aspx • NetApp HCI Documentation Center
http://docs.netapp.com/hci/index.jsp
0
2000
4000
6000
8000
10000
12000
14000
16000
180000.
52.
54.
56.
58.
510
.512
.514
.516
.518
.520
.522
.524
.526
.528
.530
.532
.534
.536
.538
.540
.542
.544
.546
.548
.550
.552
.554
.556
.558
.560
.562
.564
.5
Volume Total IOPS
H610C-VDI-01 H610C-VDI-02 H610C-VDI-03 H610C-VDI-04
H410C-VDI-01 H410C-VDI-02 H410C-VDI-03 H410C-VDI-04
• NetApp Data Fabric https://www.netapp.com/us/info/what-is-data-fabric.aspx
• NetApp HCI Datasheet https://www.netapp.com/us/media/ds-3881.pdf
• NetApp HCI Technical docs http://docs.netapp.com/hci/index.jsp
• NetApp HCI Deployment Guide https://library.netapp.com/ecm/ecm_download_file/ECMLP2844053
• NetApp HCI Network Setup Guide https://www.netapp.com/us/media/tr-4679.pdf
• VMware vRealize Operations Management Pack for NetApp HCI and SolidFire https://bluemedora.com/resource/vmware-vrealize-operations-management-pack-for-netapp-hci-solidfire/
• NetApp SolidFire vRealize Orchestrator Plug-in https://github.com/solidfire/vrealize-orchestrator-plugin
• NetApp HCI Theory of Operations https://www.netapp.com/us/media/wp-7261.pdf
• NetApp Element software https://www.netapp.com/us/products/data-management-software/element-os.aspx
• NetApp ONTAP Select https://www.netapp.com/us/products/data-management-software/ontap-select-sds.aspx
• NetApp Interoperability Matrix Tool https://mysupport.netapp.com/matrix/#welcome
NVIDIA • NVIDIA Virtual GPU Software Documentation
https://docs.nvidia.com/grid/
VMware • VMware Tech Zone
https://techzone.vmware.com/ • Best Practices for Published Applications and Desktops in VMware Horizon Apps and VMware
Horizon 7 https://techzone.vmware.com/resource/best-practices-published-applications-and-desktops-vmware-horizon-apps-and-vmware-horizon-7
• App Volumes Deployment Considerations https://techzone.vmware.com/resource/app-volumes-deployment-considerations
• User Environment Manager Deployment Considerations Guide https://techzone.vmware.com/resource/user-environment-manager-deployment-considerations-guide
• VMware Workspace ONE and VMware Horizon 7 Enterprise Edition On-Premises Reference Architecture https://techzone.vmware.com/resource/vmware-workspace-one-and-vmware-horizon-7-enterprise-edition-premises-reference
• VMware Horizon 7 sizing limits and recommendations https://kb.vmware.com/s/article/2150348
• VMware Configuration Maximums https://configmax.vmware.com/
• Reviewer’s Guide for On-Premises VMware Identity Manager https://techzone.vmware.com/resource/reviewers-guide-premises-vmware-identity-manager
• Deployment and Design Considerations for VMware Mirage https://www.vmware.com/content/dam/digitalmarketing/vmware/en/pdf/techpaper/vmware-horizon-mirage-deployment-design-considerations.pdf
• Network Ports in VMware Horizon 7 https://techzone.vmware.com/resource/network-ports-vmware-horizon-7
• Horizon for Linux FAQ https://www.vmware.com/content/dam/digitalmarketing/vmware/en/pdf/products/horizon/vmware-horizon-for-linux-faq.pdf
• vRealize Operations Manager 6.6.1 Sizing Guidelines https://kb.vmware.com/s/article/2150421
• Sizing the vRealize Log Insight Virtual Appliance https://docs.vmware.com/en/vRealize-Log-Insight/4.6/com.vmware.log-insight.getting-started.doc/GUID-284FC5F4-B832-47A7-912E-D407A760CAE4.html
Version History Version Date Document Version History
Version 1.0 May 2019 Initial version
Refer to the Interoperability Matrix Tool (IMT) on the NetApp Support site to validate that the exact product and feature versions described in this document are supported for your specific environment. The NetApp IMT defines the product components and versions that can be used to construct configurations that are supported by NetApp. Specific results depend on each customer’s installation in accordance with published specifications.
Copyright Information Copyright © 2019 NetApp, Inc. All Rights Reserved. Printed in the U.S. No part of this document covered by copyright may be reproduced in any form or by any means—graphic, electronic, or mechanical, including photocopying, recording, taping, or storage in an electronic retrieval system—without prior written permission of the copyright owner.
Software derived from copyrighted NetApp material is subject to the following license and disclaimer:
THIS SOFTWARE IS PROVIDED BY NetApp “AS IS” AND WITHOUT ANY EXPRESS OR IMPLIED WARRANTIES, INCLUDING, BUT NOT LIMITED TO, THE IMPLIED WARRANTIES OF MERCHANTABILITY AND FITNESS FOR A PARTICULAR PURPOSE, WHICH ARE HEREBY DISCLAIMED. IN NO EVENT SHALL NetApp BE LIABLE FOR ANY DIRECT, INDIRECT, INCIDENTAL, SPECIAL, EXEMPLARY, OR CONSEQUENTIAL DAMAGES (INCLUDING, BUT NOT LIMITED TO, PROCUREMENT OF SUBSTITUTE GOODS OR SERVICES; LOSS OF USE, DATA, OR PROFITS; OR BUSINESS INTERRUPTION) HOWEVER CAUSED AND ON ANY THEORY OF LIABILITY, WHETHER IN CONTRACT, STRICT LIABILITY, OR TORT (INCLUDING NEGLIGENCE OR OTHERWISE) ARISING IN ANY WAY OUT OF THE USE OF THIS SOFTWARE, EVEN IF ADVISED OF THE POSSIBILITY OF SUCH DAMAGE.
NetApp reserves the right to change any products described herein at any time, and without notice. NetApp assumes no responsibility or liability arising from the use of products described herein, except as expressly agreed to in writing by NetApp. The use or purchase of this product does not convey a license under any patent rights, trademark rights, or any other intellectual property rights of NetApp.
The product described in this manual may be protected by one or more U.S. patents, foreign patents, or pending applications.
Data contained herein pertains to a commercial item (as defined in FAR 2.101) and is proprietary to NetApp, Inc. The U.S. Government has a non-exclusive, non-transferrable, non-sublicensable, worldwide, limited irrevocable license to use the Data only in connection with and in support of the U.S. Government contract under which the Data was delivered. Except as provided herein, the Data may not be used, disclosed, reproduced, modified, performed, or displayed without the prior written approval of NetApp, Inc. United States Government license rights for the Department of Defense are limited to those rights identified in DFARS clause 252.227-7015(b).
Trademark Information NetApp, the NetApp logo, and the marks listed at http://www.netapp.com/TM are trademarks of NetApp, Inc. Other company and product names may be trademarks of their respective owners.