Embed Size (px)
Citation preview

Net Zero: The UK’s contribution to ending warming
Richard Millar, Committee on Climate Change
Tuesday 17th September, 2019

The Climate Change Act (2008)
2
The Climate Change Act 2008
2050 Emissions TargetA goal1
Carbon BudgetsA pathway2
Requirement that Government brings forward policies
A toolkit3
Committee on Climate Change to monitor progress and suggest changes
A monitoringframework
4
Committee on Climate Change
2 committee chairs (mitigation & adaptation)
14 independent committee members
~25 analysts (5 adaptation, 20 mitigation), 8 corporate staff
The CCC has a brief to hold the Government to account on both mitigating greenhouse gas
emissions and adapting to climate change
3
Mitigation lead Adaptation lead
Independent advisor
Other Government departments and devolved administrations
UK legislatures
Source: CCC Net Zero (2019) 4
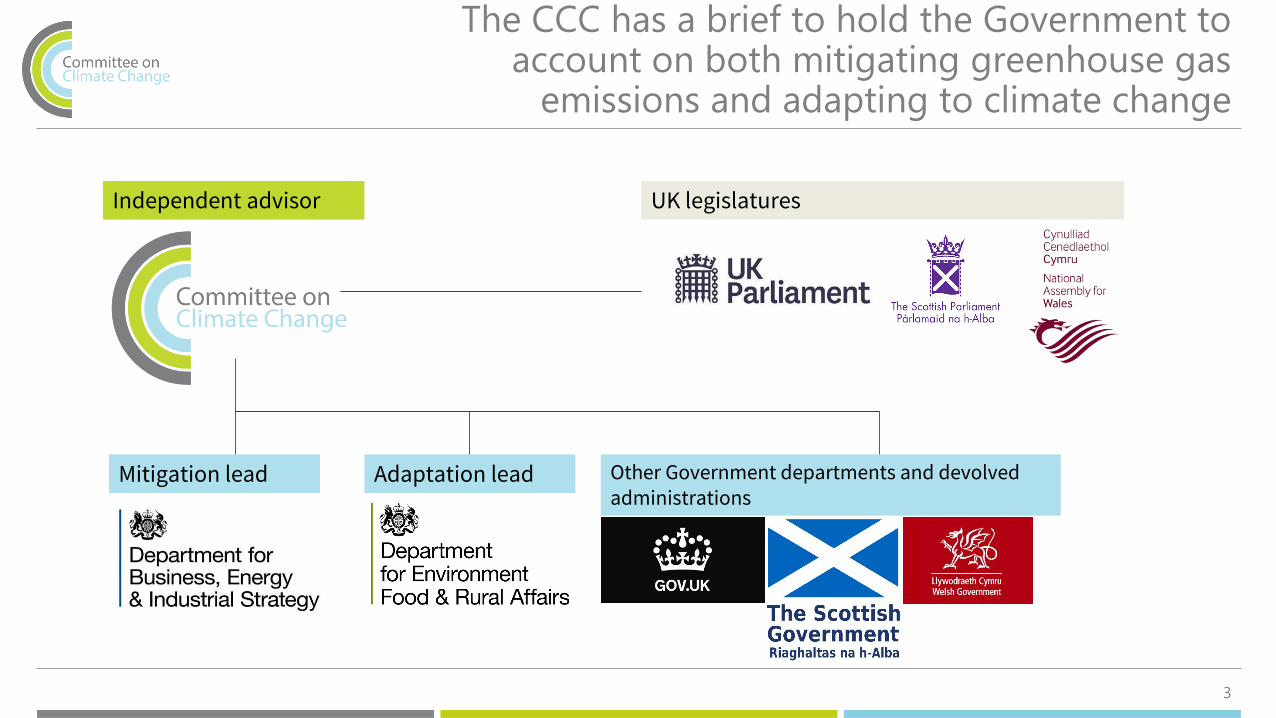
The Committee draws on a wide range of evidence in developing its advice
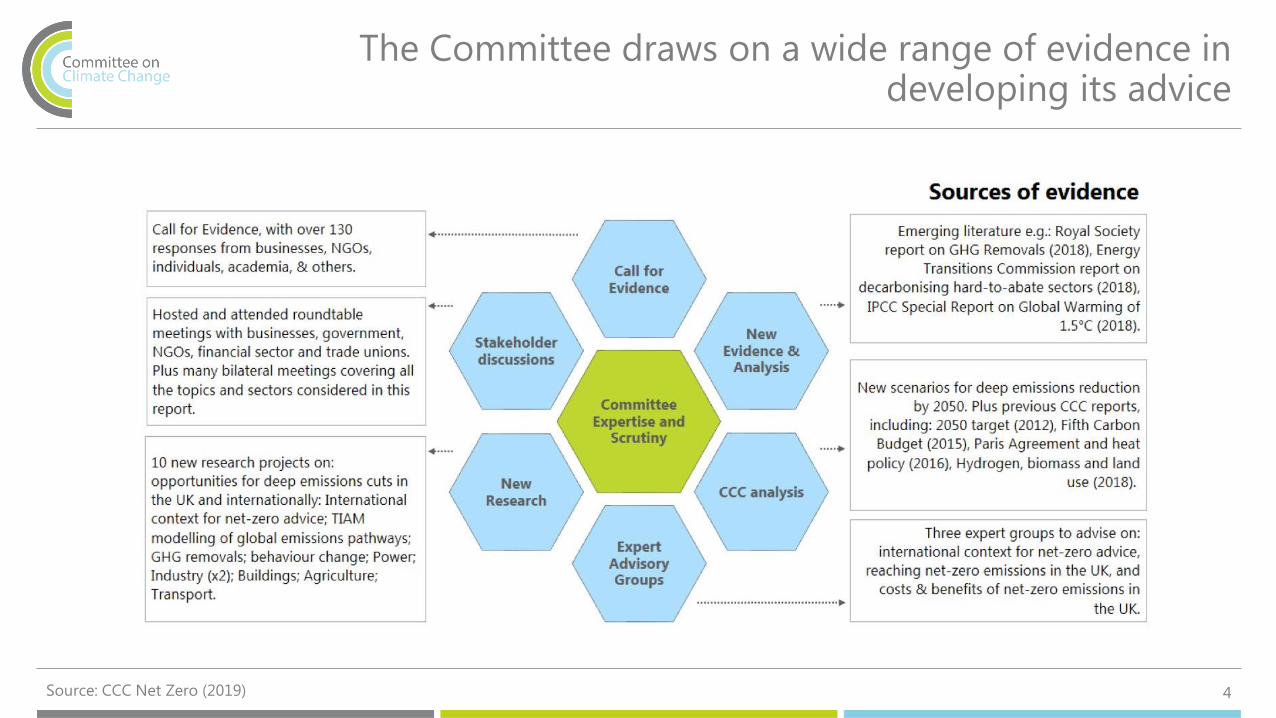
Science and international contextSupporting increased global ambition
5
Evolution of global per capita emissions over time
-5
-3
-1
1
3
5
7
9
11
13
151990
2000
2010
2020
2030
2040
2050
2060
2070
2080
2090
2100G
HG
em
issi
on
s p
er
cap
ita
(tC
O2
e/p
ers
on
/yr)
>66% 2°C - Range
>50 %1.5°C - Range
>50% 1.5°C - Median
>66% 2°C - Median
Historical - World
Source: Huppmann, D. et al. (2018) A new scenario resource for
integrated 1.5°C research.

Science and international contextSupporting increased global ambition
6
Evolution of global per capita emissions over time
-5
-3
-1
1
3
5
7
9
11
13
151990
2000
2010
2020
2030
2040
2050
2060
2070
2080
2090
2100G
HG
em
issi
on
s p
er
cap
ita
(tC
O2
e/p
ers
on
/yr)
>66% 2°C - Range
>50 %1.5°C - Range
>50% 1.5°C - Median
>66% 2°C - Median
Historical - World
Historical - UK
Source: Huppmann, D. et al. (2018) A new scenario resource for
integrated 1.5°C research.
Reaching net-zero emissions in the UKScenarios to reduce UK emissions to net-zero
7
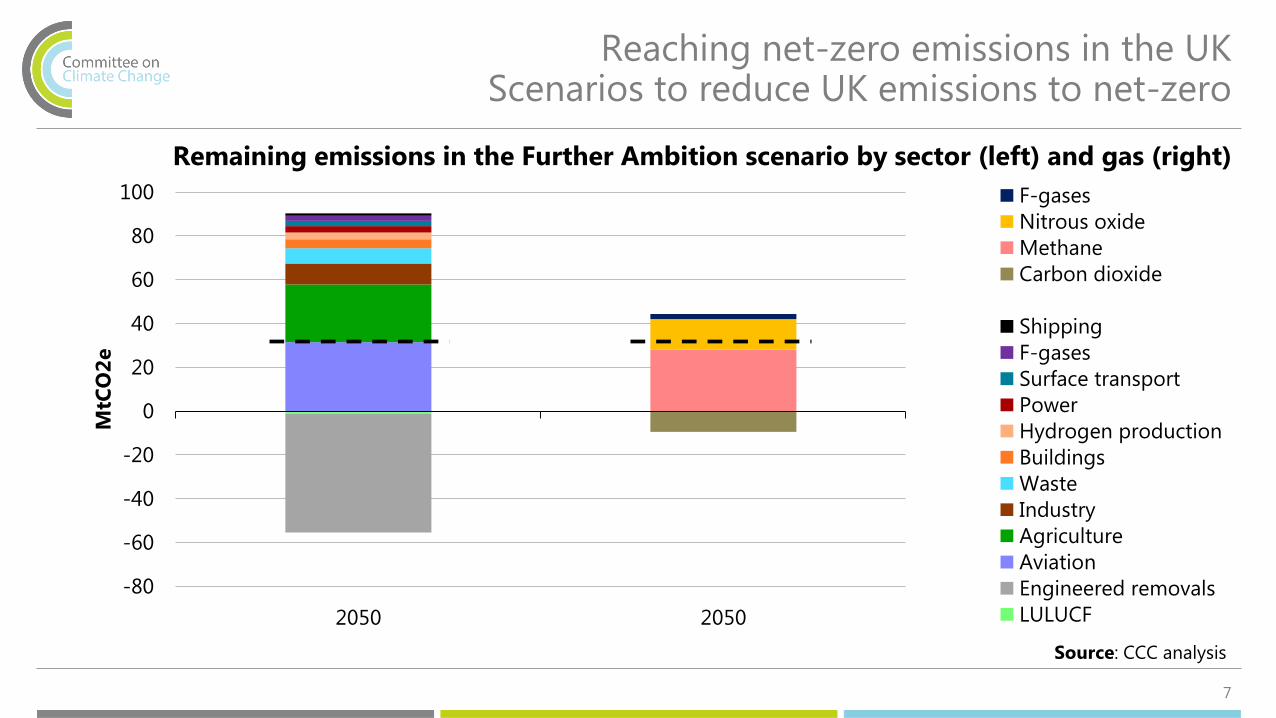
Remaining emissions in the Further Ambition scenario by sector (left) and gas (right)
-80
-60
-40
-20
0
20
40
60
80
100
2050 2050
MtC
O2
e
F-gases
Nitrous oxide
Methane
Carbon dioxide
Shipping
F-gases
Surface transport
Power
Hydrogen production
Buildings
Waste
Industry
Agriculture
Aviation
Engineered removals
LULUCF
Source: CCC analysis
Reaching net-zero emissions in the UKScenarios to reduce UK emissions to net-zero
8
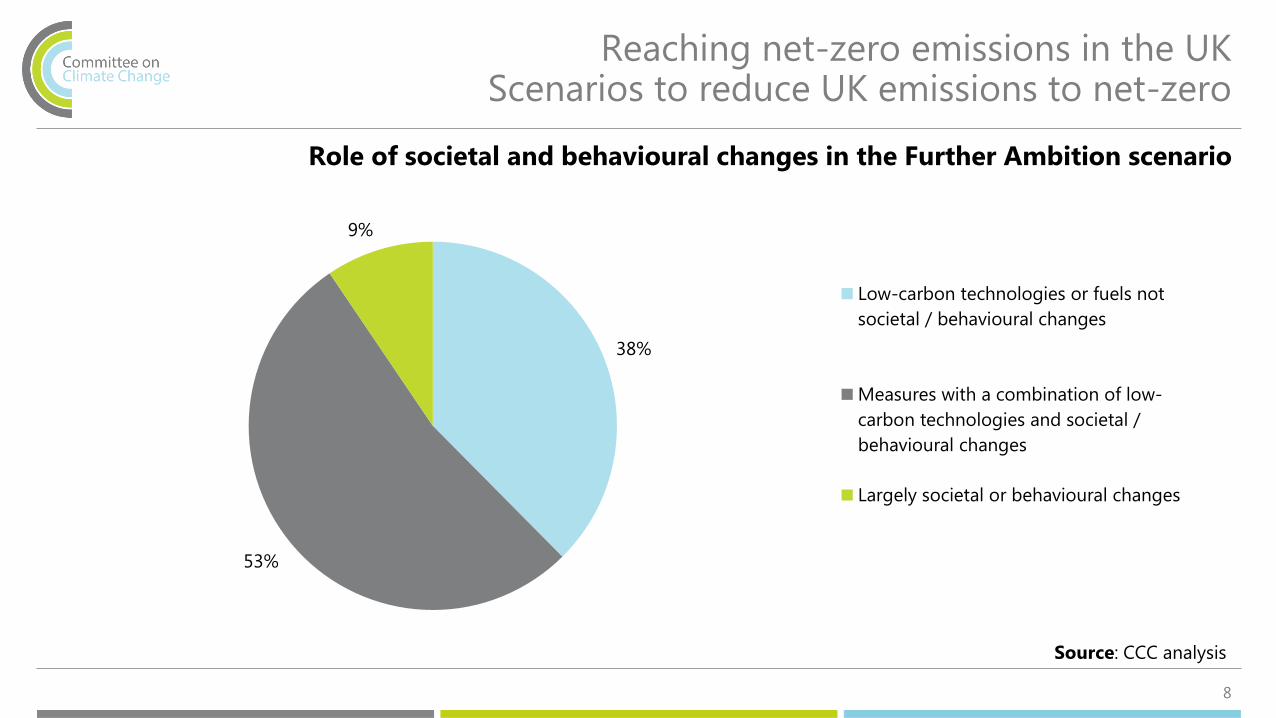
Role of societal and behavioural changes in the Further Ambition scenario
38%
53%
9%
Low-carbon technologies or fuels not
societal / behavioural changes
Measures with a combination of low-
carbon technologies and societal /
behavioural changes
Largely societal or behavioural changes
Source: CCC analysis
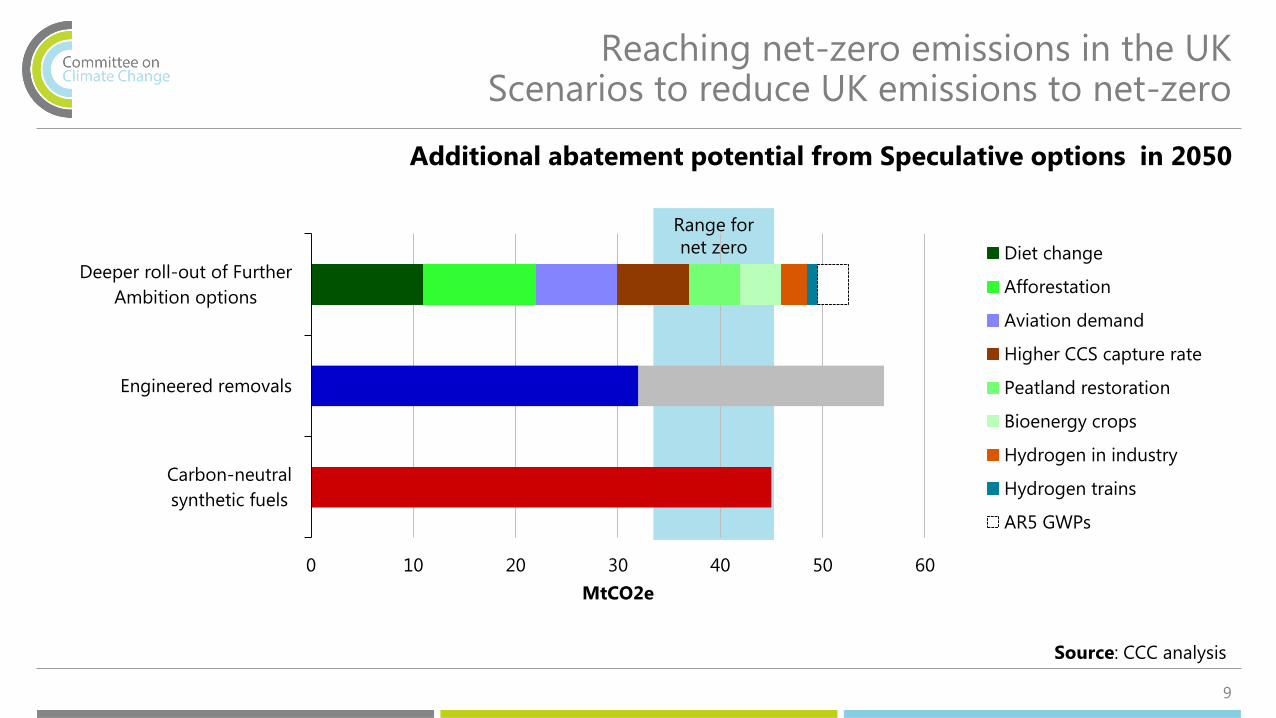
Range for
net zero
0 10 20 30 40 50 60
Carbon-neutral
synthetic fuels
Engineered removals
Deeper roll-out of Further
Ambition options
MtCO2e
Diet change
Afforestation
Aviation demand
Higher CCS capture rate
Peatland restoration
Bioenergy crops
Hydrogen in industry
Hydrogen trains
AR5 GWPs
Reaching net-zero emissions in the UKScenarios to reduce UK emissions to net-zero
9
Additional abatement potential from Speculative options in 2050
Source: CCC analysis

Reaching net-zero emissions in the UKScenarios to reduce UK emissions to net-zero
10
Scenarios for the UK, Scotland, Wales, and Northern Ireland (2050)
Scenario in 2050 UK Scotland Wales Northern Ireland
Further Ambition Emissions in 2050
(MtCO₂e)
33 to 45 -8 to -4 2 to 3 5 to 6
Reduction on 1990
levels
95% 96% 104% 110% 95% 97% 78% 80%
Ability of Speculative options to go beyond
the Further Ambition scenario
Earliest credible year for net-zero GHG emissions
2050 2045 Post-2050 Post-2050
Source: CCC analysis

Reaching net-zero emissions in the UKCosts are far lower than we imagined
11
The importance of innovationCosts of example low-carbon technologies compared to past projections
Offshore wind (left) Battery packs for electric vehicles (right)
0
50
100
150
200
250
2016
2020
2025
2030
Leveli
sed
cost
of
ele
ctri
city
-£
/MW
h
(£2
01
8)
DECCestimate(2012)
Contractssigned in2013
Contractssigned in2015
Contractssigned in2017
0
200
400
600
800
1000
1200
2010
2015
2020
2025
2030
Batt
ery
pack
co
st -
$/K
Wh
(£
20
18
)
CCCcentralestimate(2011)
Actualaveragecost
Source: Offshore wind costs, CCC analysis based on DECC (2012) Electricity generation costs and LCCC (2019) CfD register. Battery forecasts,
CCC (2015) Sectoral scenarios for the 5th Carbon Budget, outturn costs from BNEF (2018) Electric cars to reach price parity by 2022
Reaching net-zero emissions in the UKNo extra cost than already expected
12
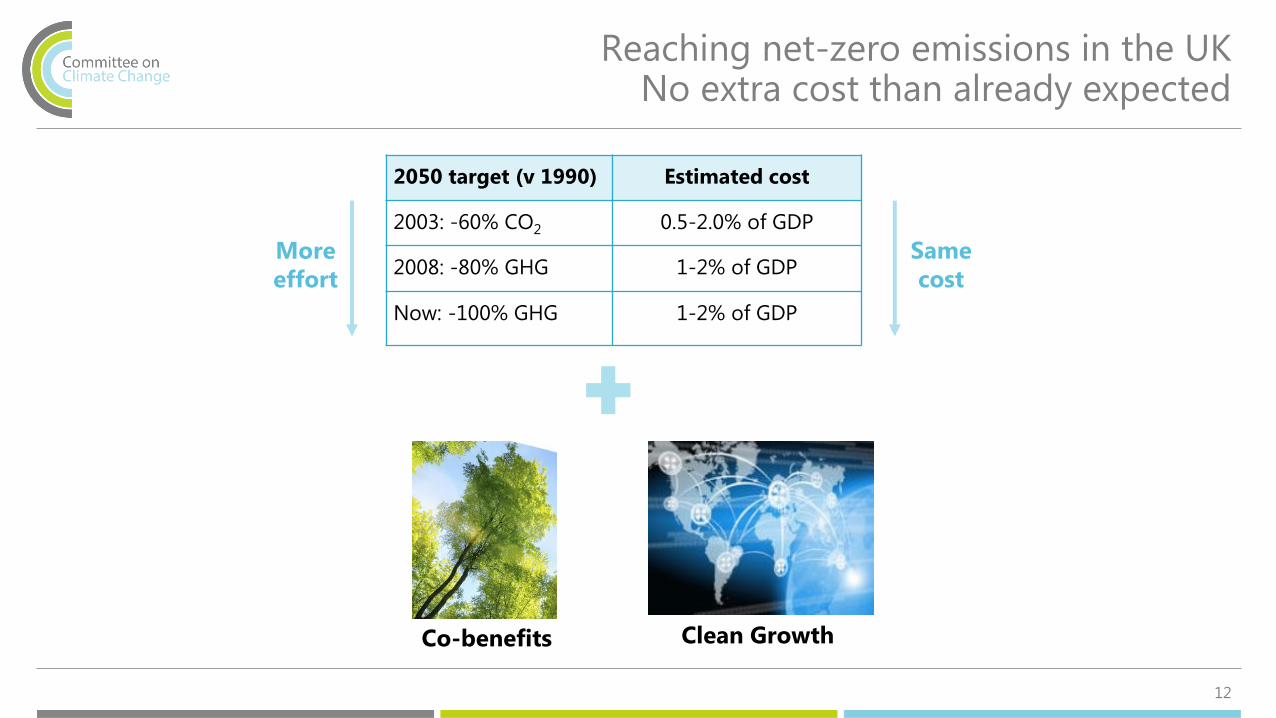
2050 target (v 1990) Estimated cost
2003: -60% CO2 0.5-2.0% of GDP
2008: -80% GHG 1-2% of GDP
Now: -100% GHG 1-2% of GDP
Co-benefits Clean Growth
More effort
Same cost
13
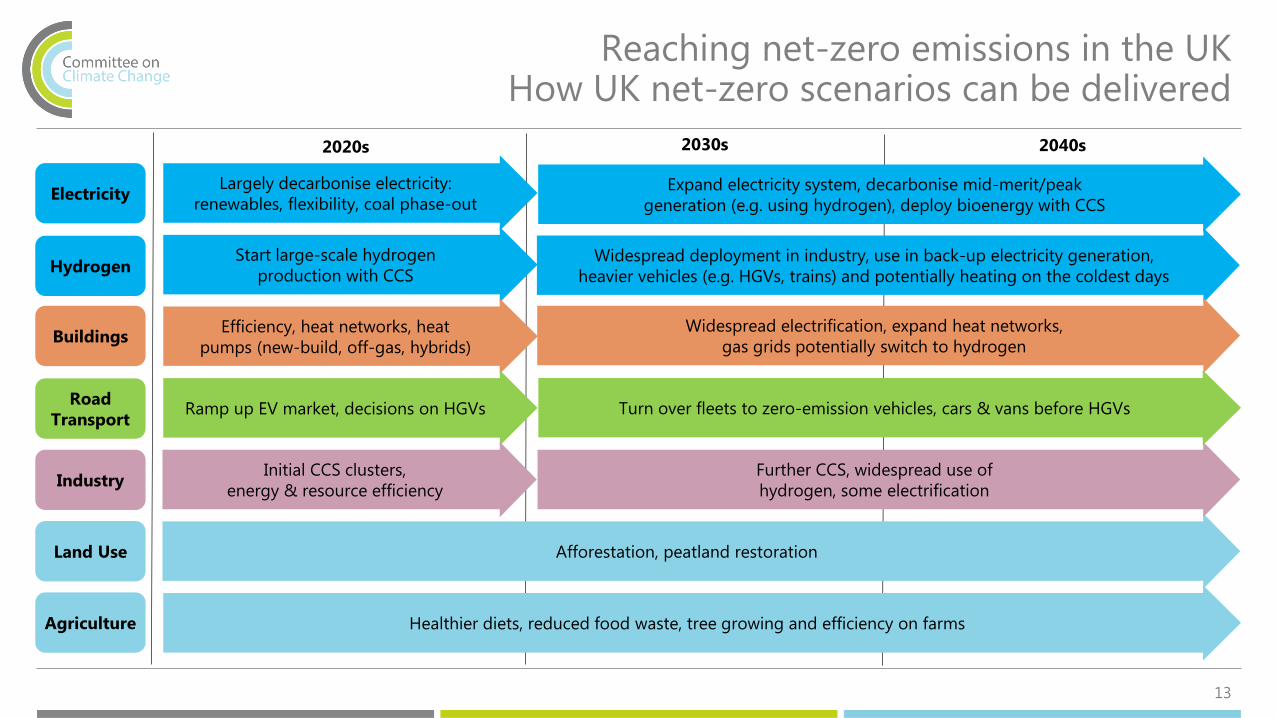
Reaching net-zero emissions in the UKHow UK net-zero scenarios can be delivered
2040s2030s2020s
Electricity
Hydrogen
Buildings
Road Transport
Industry
Land Use
Expand electricity system, decarbonise mid-merit/peak
generation (e.g. using hydrogen), deploy bioenergy with CCS
Widespread deployment in industry, use in back-up electricity generation,
heavier vehicles (e.g. HGVs, trains) and potentially heating on the coldest days
Widespread electrification, expand heat networks,
gas grids potentially switch to hydrogen
Start large-scale hydrogen
production with CCS
Largely decarbonise electricity:
renewables, flexibility, coal phase-out
Efficiency, heat networks, heat
pumps (new-build, off-gas, hybrids)
Turn over fleets to zero-emission vehicles, cars & vans before HGVsRamp up EV market, decisions on HGVs
Afforestation, peatland restoration
Agriculture
Further CCS, widespread use of
hydrogen, some electrification
Healthier diets, reduced food waste, tree growing and efficiency on farms
Initial CCS clusters,
energy & resource efficiency
14
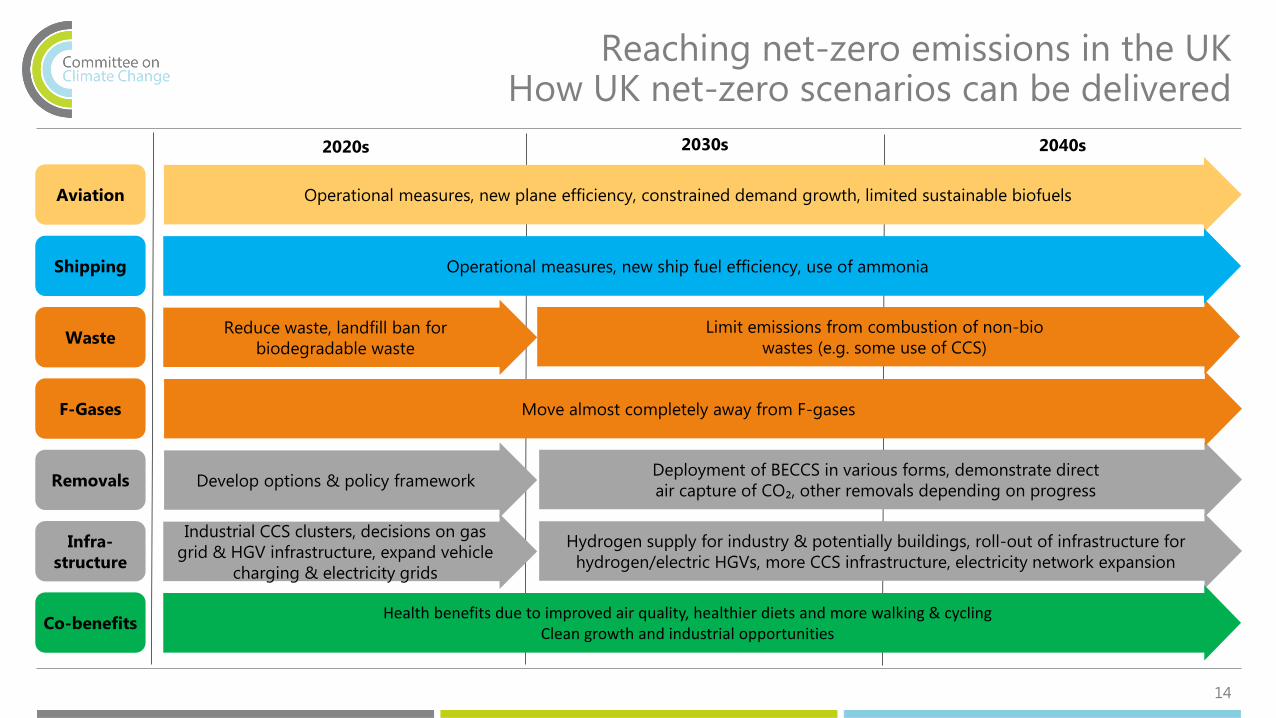
Reaching net-zero emissions in the UKHow UK net-zero scenarios can be delivered
2040s2030s2020s
Aviation
Shipping
Waste
F-Gases
Removals
Infra-structure
Limit emissions from combustion of non-bio
wastes (e.g. some use of CCS)Reduce waste, landfill ban for
biodegradable waste
Deployment of BECCS in various forms, demonstrate direct
air capture of CO₂, other removals depending on progressDevelop options & policy framework
Co-benefits
Hydrogen supply for industry & potentially buildings, roll-out of infrastructure for
hydrogen/electric HGVs, more CCS infrastructure, electricity network expansion
Health benefits due to improved air quality, healthier diets and more walking & cyclingClean growth and industrial opportunities
Industrial CCS clusters, decisions on gas
grid & HGV infrastructure, expand vehicle
charging & electricity grids
Operational measures, new plane efficiency, constrained demand growth, limited sustainable biofuels
Operational measures, new ship fuel efficiency, use of ammonia
Move almost completely away from F-gases
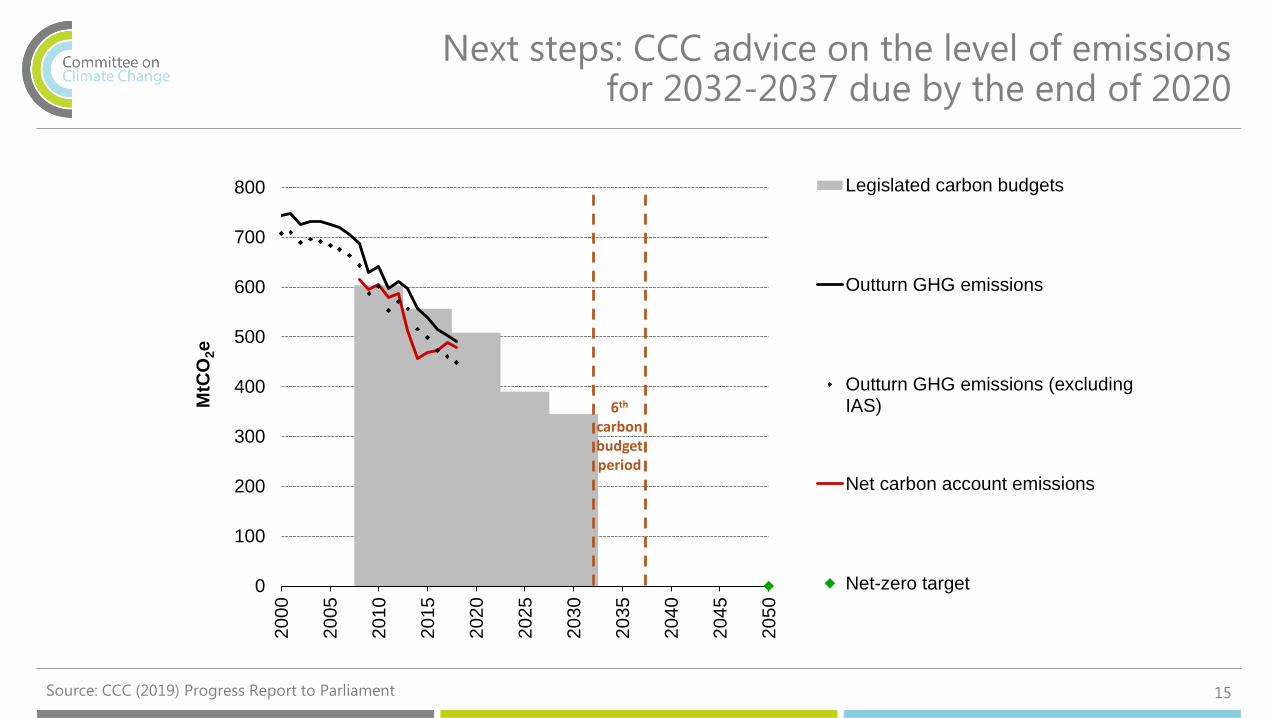
Next steps: CCC advice on the level of emissions for 2032-2037 due by the end of 2020
Source: CCC (2019) Progress Report to Parliament 15
0
100
200
300
400
500
600
700
800
2000
2005
2010
2015
2020
2025
2030
2035
2040
2045
2050
MtC
O2e
Legislated carbon budgets
Outturn GHG emissions
Outturn GHG emissions (excludingIAS)
Net carbon account emissions
Net-zero target
6th
carbon budgetperiod

Summary recommendations to UK Government
16
Now is the right time to set a UK net zero target. It is technically possible, based on current consumer behaviours and
known technologies, with prudent assumptions over cost reduction.
The UK should set a target to reach net-zero greenhouse gas emissions by 2050. The target should cover all sectors of the economy, including international aviation and shipping.
The aim should be to meet the target through UK domestic effort, without relying on international carbon units (or
‘credits’).
The target is an appropriate contribution to the Paris Agreement. The UK can benefit from the international influence
of setting a bolder target, using it as an opportunity for further positive international collaboration.
Overall costs are manageable, but must be fairly distributed. Rapid cost reductions during mass deployment for key
technologies mean that net zero can be met an annual resource cost of up to 1-2% of GDP to 2050, the same cost as the
previous expectation for an 80% reduction from 1990.