Embed Size (px)
Citation preview
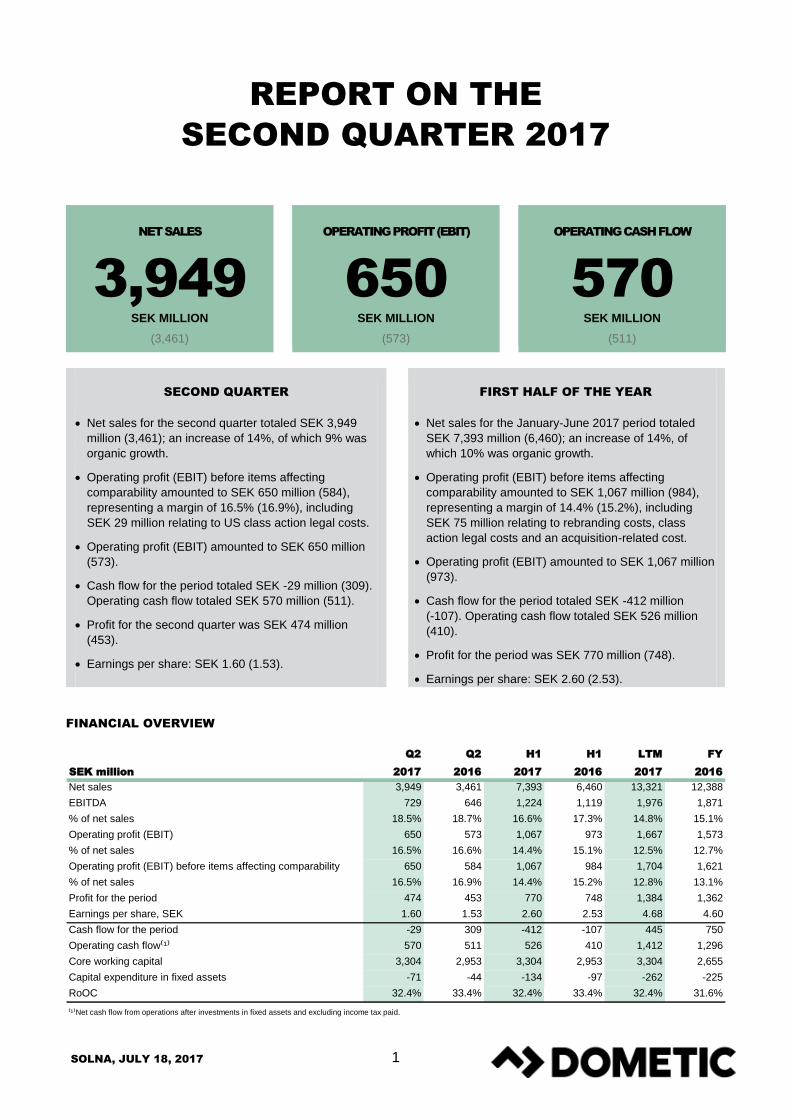
1 SOLNA, JULY 18, 2017
REPORT ON THE
SECOND QUARTER 2017
NET SALES
3,949 SEK MILLION
(3,461)
OPERATING PROFIT (EBIT)
650 SEK MILLION
(573)
OPERATING CASH FLOW
570 SEK MILLION
(511)
SECOND QUARTER
Net sales for the second quarter totaled SEK 3,949
million (3,461); an increase of 14%, of which 9% was
organic growth.
Operating profit (EBIT) before items affecting
comparability amounted to SEK 650 million (584),
representing a margin of 16.5% (16.9%), including
SEK 29 million relating to US class action legal costs.
Operating profit (EBIT) amounted to SEK 650 million
(573).
Cash flow for the period totaled SEK -29 million (309).
Operating cash flow totaled SEK 570 million (511).
Profit for the second quarter was SEK 474 million
(453).
Earnings per share: SEK 1.60 (1.53).
FIRST HALF OF THE YEAR
Net sales for the January-June 2017 period totaled
SEK 7,393 million (6,460); an increase of 14%, of
which 10% was organic growth.
Operating profit (EBIT) before items affecting
comparability amounted to SEK 1,067 million (984),
representing a margin of 14.4% (15.2%), including
SEK 75 million relating to rebranding costs, class
action legal costs and an acquisition-related cost.
Operating profit (EBIT) amounted to SEK 1,067 million
(973).
Cash flow for the period totaled SEK -412 million
(-107). Operating cash flow totaled SEK 526 million
(410).
Profit for the period was SEK 770 million (748).
Earnings per share: SEK 2.60 (2.53).
FINANCIAL OVERVIEW
Q2 Q2 H1 H1 LTM FY
SEK million 2017 2016 2017 2016 2017 2016
Net sales 3,949 3,461 7,393 6,460 13,321 12,388
EBITDA 729 646 1,224 1,119 1,976 1,871
% of net sales 18.5% 18.7% 16.6% 17.3% 14.8% 15.1%
Operating profit (EBIT) 650 573 1,067 973 1,667 1,573
% of net sales 16.5% 16.6% 14.4% 15.1% 12.5% 12.7%
Operating profit (EBIT) before items affecting comparability 650 584 1,067 984 1,704 1,621
% of net sales 16.5% 16.9% 14.4% 15.2% 12.8% 13.1%
Profit for the period 474 453 770 748 1,384 1,362
Earnings per share, SEK 1.60 1.53 2.60 2.53 4.68 4.60
Cash flow for the period -29 309 -412 -107 445 750
Operating cash flow⁽¹⁾ 570 511 526 410 1,412 1,296
Core working capital 3,304 2,953 3,304 2,953 3,304 2,655
Capital expenditure in fixed assets -71 -44 -134 -97 -262 -225
RoOC 32.4% 33.4% 32.4% 33.4% 32.4% 31.6%
⁽¹⁾Net cash flow from operations after investments in fixed assets and excluding income tax paid.
DOMETIC INTERIM REPORT – Q2 2017
2
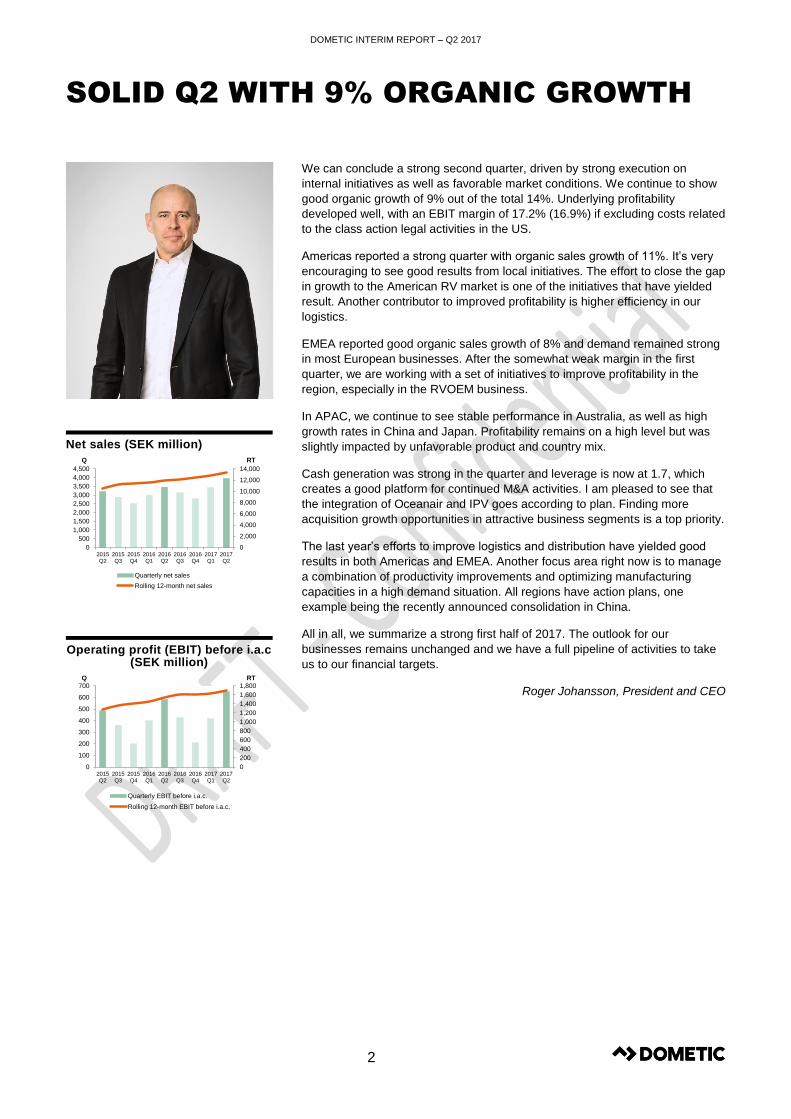
SOLID Q2 WITH 9% ORGANIC GROWTH
Net sales (SEK million)
Operating profit (EBIT) before i.a.c (SEK million)
We can conclude a strong second quarter, driven by strong execution on
internal initiatives as well as favorable market conditions. We continue to show
good organic growth of 9% out of the total 14%. Underlying profitability
developed well, with an EBIT margin of 17.2% (16.9%) if excluding costs related
to the class action legal activities in the US.
Americas reported a strong quarter with organic sales growth of 11%. It’s very
encouraging to see good results from local initiatives. The effort to close the gap
in growth to the American RV market is one of the initiatives that have yielded
result. Another contributor to improved profitability is higher efficiency in our
logistics.
EMEA reported good organic sales growth of 8% and demand remained strong
in most European businesses. After the somewhat weak margin in the first
quarter, we are working with a set of initiatives to improve profitability in the
region, especially in the RVOEM business.
In APAC, we continue to see stable performance in Australia, as well as high
growth rates in China and Japan. Profitability remains on a high level but was
slightly impacted by unfavorable product and country mix.
Cash generation was strong in the quarter and leverage is now at 1.7, which
creates a good platform for continued M&A activities. I am pleased to see that
the integration of Oceanair and IPV goes according to plan. Finding more
acquisition growth opportunities in attractive business segments is a top priority.
The last year’s efforts to improve logistics and distribution have yielded good
results in both Americas and EMEA. Another focus area right now is to manage
a combination of productivity improvements and optimizing manufacturing
capacities in a high demand situation. All regions have action plans, one
example being the recently announced consolidation in China.
All in all, we summarize a strong first half of 2017. The outlook for our
businesses remains unchanged and we have a full pipeline of activities to take
us to our financial targets.
Roger Johansson, President and CEO
0
2,000
4,000
6,000
8,000
10,000
12,000
14,000
0
500
1,000
1,500
2,000
2,500
3,000
3,500
4,000
4,500
2015Q2
2015Q3
2015Q4
2016Q1
2016Q2
2016Q3
2016Q4
2017Q1
2017Q2
RTQ
Quarterly net sales
Rolling 12-month net sales
0
200
400
600
800
1,000
1,200
1,400
1,600
1,800
0
100
200
300
400
500
600
700
2015Q2
2015Q3
2015Q4
2016Q1
2016Q2
2016Q3
2016Q4
2017Q1
2017Q2
RTQ
Quarterly EBIT before i.a.c.
Rolling 12-month EBIT before i.a.c.
DOMETIC INTERIM REPORT – Q2 2017
3
FINANCIAL SUMMARY – SECOND QUARTER
Net sales in the three months ending June 30, 2017,
totaled SEK 3,949 million, representing an increase of
14% compared with SEK 3,461 million in the same period
last year. This is made up of 9% organic growth, 4%
currency translation and 1% M&A.
Operating profit (EBIT) before i.a.c. totaled SEK 650
million in Q2 2017, which was an increase of 11%
compared to SEK 584 million in Q2 2016. The EBIT
margin decreased from 16.9% to 16.5%. Earnings for Q2
2017 include SEK 29 million relating to class action legal
costs.
Financial items amounted to a net expense of SEK 32
million (39), including SEK 25 million in interest on
external bank loans (30) and SEK 2 million for
amortization of capitalized long-term financing expenses
(2). Other expense items amounted to SEK 6 million (9)
and financial income to SEK 1 million (2).
Taxes totaled SEK -144 million (-81), corresponding to
23% (15%) of profit before tax. Current tax amounted to
SEK -44 million (-61) and deferred tax to SEK -100 million
(-20).
Profit for the period totaled SEK 474 million (453).
Earnings per share amounted to SEK 1.60 (1.53).
Operating cash flow totaled SEK 570 million (511).
The improvement derives from stronger operating profit
and a reduction in inventory.
Cash flow for the period of SEK -29 million (309),
including cash payment of dividend for 2016 of SEK 547
million.
Financial position. Leverage in Q2 2017 was 1.7
compared with 2.1 in Q2 2016. At year-end 2016,
leverage was 1.7.
FINANCIAL SUMMARY – FIRST HALF
Net sales totaled SEK 7,393 million, representing an
increase of 14% compared with SEK 6,460 million in the
same period last year. This is made up of 10% organic
growth, 4% currency translation and 0% M&A.
Operating profit (EBIT) before i.a.c. totaled SEK
1,067 million, which was an increase of 8% compared to
SEK 984 million 2016. The EBIT margin decreased from
15.2% to 14.4%. Earnings for H1 2017 include SEK 75
million relating to rebranding costs, class action legal
costs and an acquisition-related cost.
Financial items amounted to a net expense of SEK 63
million (73), including SEK 51 million in interest on
external bank loans (60) and SEK 4 million for
amortization of capitalized long-term financing expenses
(4). Other expense items amounted to SEK 9 million (12)
and financial income to SEK 1 million (3).
Taxes totaled SEK -234 million (-152), corresponding to
23% (17%) of profit before tax. Current tax amounted to
SEK -95 million (-116) and deferred tax to SEK -139
million (-36).
Profit for the period totaled SEK 770 million (748).
Earnings per share amounted to SEK 2.60 (2.53).
Operating cash flow totaled SEK 526 million (410).
The improvement derives from stronger operating profit
and a reduction in inventory.
Cash flow for the period of SEK -412 million (-107)
includes purchase price paid net of acquired cash and
cash equivalents of SEK187 million for the acquisitions in
Q1 and cash dividend payout for 2016 of SEK 547 million
in Q2 2017.
Events after the quarter. Dometic divested an
industrial facility in China. Selling price amounted to CNY
160 million. Net gain of CNY 80 -100 million.
Roger Johansson, President and CEO, announced that
he will leave his position at the end of the year. The
Board has appointed Juan Vargues as his successor.
Q2 Q2 H1 H1 LTM FY
SEK million 2017 2016 Rep. Adj.⁽¹⁾ 2017 2016 Rep. Adj.⁽¹⁾ 2017 2016
Americas 1,692 1,527 11% 6% 3,198 2,967 8% 3% 5,980 5,749
EMEA 1,833 1,552 18% 14% 3,360 2,774 21% 18% 5,679 5,093
Asia Pacific 424 382 11% 5% 835 719 16% 9% 1,662 1,546
Total net sales 3,949 3,461 14% 10% 7,393 6,460 14% 10% 13,321 12,388
Americas 274 244 12% 7% 438 432 1% -4% 762 756
EMEA 277 246 12% 8% 439 389 13% 9% 584 534
Asia Pacific 99 94 5% 1% 190 163 16% 11% 358 331
Total operating profit (EBIT)⁽²⁾ 650 584 11% 7% 1,067 984 8% 4% 1,704 1,621
Americas 16.2% 16.0% 13.7% 14.5% 12.7% 13.1%
EMEA 15.1% 15.9% 13.1% 14.0% 10.3% 10.5%
Asia Pacific 23.3% 24.5% 22.8% 22.7% 21.6% 21.4%
Total operating profit % 16.5% 16.9% 14.4% 15.2% 12.8% 13.1%⁽¹⁾Represents change in comparable currency. ⁽²⁾Before i.a.c.
Change (%)Change (%)
DOMETIC INTERIM REPORT – Q2 2017
4
AMERICAS
Net sales (SEK million)
Sales split AM/OEM
Q2
NET SALES
1,692 SEK MILLION
(1,527)
OPERATING PROFIT (EBIT)¹
274 SEK MILLION
(244)
OPERATING MARGIN (EBIT%)¹
16.2%
(16.0%)
NET SALES AND OPERATING PROFIT (EBIT)
Second quarter 2017
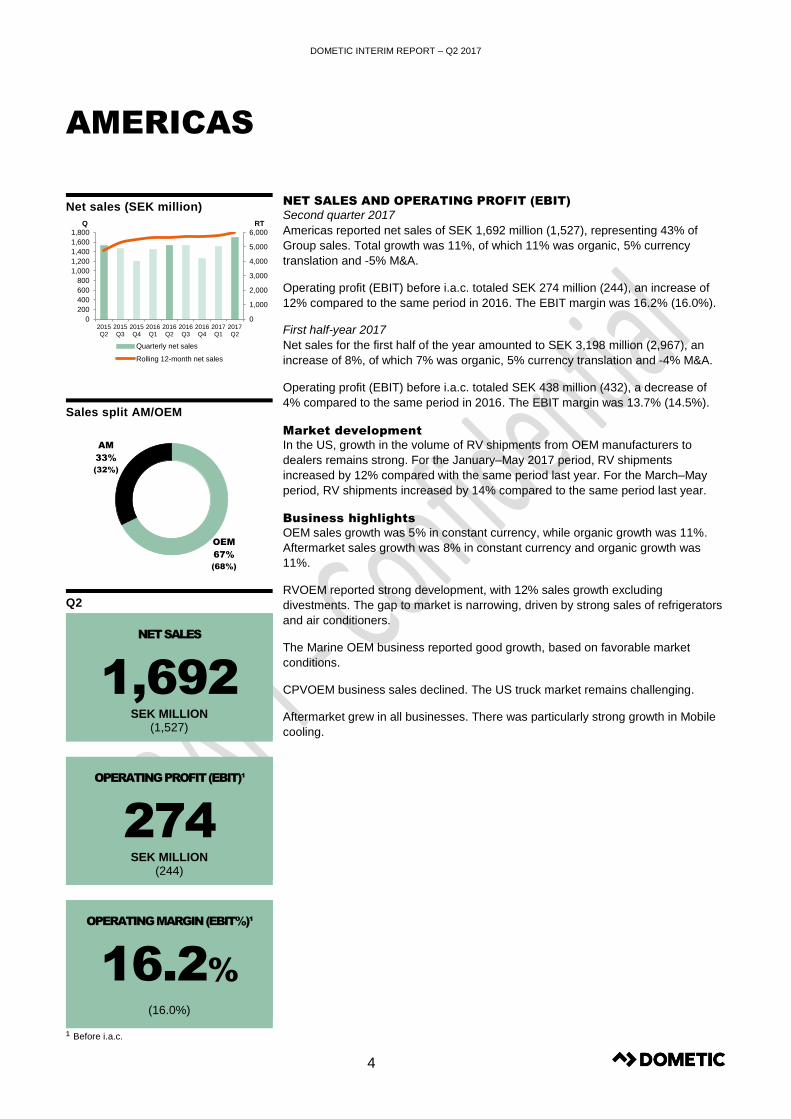
Americas reported net sales of SEK 1,692 million (1,527), representing 43% of
Group sales. Total growth was 11%, of which 11% was organic, 5% currency
translation and -5% M&A.
Operating profit (EBIT) before i.a.c. totaled SEK 274 million (244), an increase of
12% compared to the same period in 2016. The EBIT margin was 16.2% (16.0%).
First half-year 2017
Net sales for the first half of the year amounted to SEK 3,198 million (2,967), an
increase of 8%, of which 7% was organic, 5% currency translation and -4% M&A.
Operating profit (EBIT) before i.a.c. totaled SEK 438 million (432), a decrease of
4% compared to the same period in 2016. The EBIT margin was 13.7% (14.5%).
Market development
In the US, growth in the volume of RV shipments from OEM manufacturers to
dealers remains strong. For the January–May 2017 period, RV shipments
increased by 12% compared with the same period last year. For the March–May
period, RV shipments increased by 14% compared to the same period last year.
Business highlights
OEM sales growth was 5% in constant currency, while organic growth was 11%.
Aftermarket sales growth was 8% in constant currency and organic growth was
11%.
RVOEM reported strong development, with 12% sales growth excluding
divestments. The gap to market is narrowing, driven by strong sales of refrigerators
and air conditioners.
The Marine OEM business reported good growth, based on favorable market
conditions.
CPVOEM business sales declined. The US truck market remains challenging.
Aftermarket grew in all businesses. There was particularly strong growth in Mobile
cooling.
¹ Before i.a.c.
0
1,000
2,000
3,000
4,000
5,000
6,000
0
200
400
600
800
1,000
1,200
1,400
1,600
1,800
2015Q2
2015Q3
2015Q4
2016Q1
2016Q2
2016Q3
2016Q4
2017Q1
2017Q2
RTQ
Quarterly net sales
Rolling 12-month net sales
OEM
67%
(68%)
AM
33%
(32%)
DOMETIC INTERIM REPORT – Q2 2017
5
EMEA
Net sales (SEK million)
Sales split AM/OEM
Q2
NET SALES
1,833 SEK MILLION
(1,552)
OPERATING PROFIT (EBIT)¹
277 SEK MILLION
(246)
OPERATING MARGIN (EBIT%)¹
15.1%
(15.9%)
NET SALES AND OPERATING PROFIT (EBIT)
Second quarter 2017
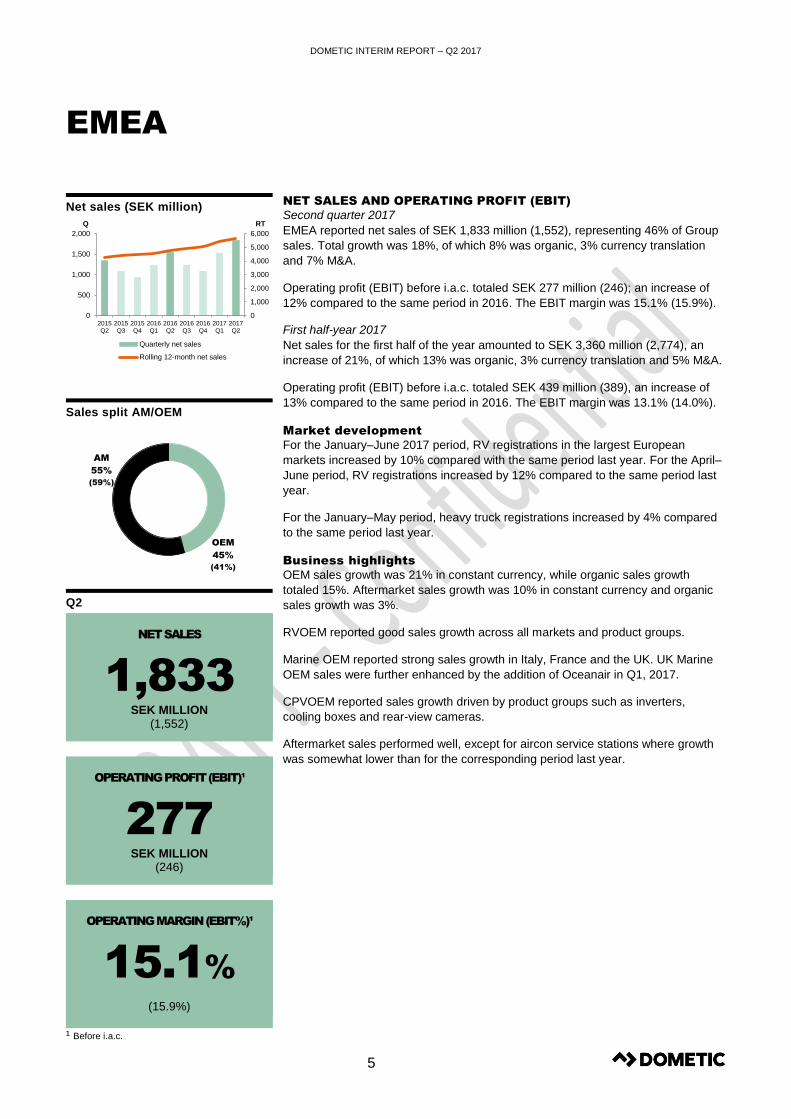
EMEA reported net sales of SEK 1,833 million (1,552), representing 46% of Group
sales. Total growth was 18%, of which 8% was organic, 3% currency translation
and 7% M&A.
Operating profit (EBIT) before i.a.c. totaled SEK 277 million (246); an increase of
12% compared to the same period in 2016. The EBIT margin was 15.1% (15.9%).
First half-year 2017
Net sales for the first half of the year amounted to SEK 3,360 million (2,774), an
increase of 21%, of which 13% was organic, 3% currency translation and 5% M&A.
Operating profit (EBIT) before i.a.c. totaled SEK 439 million (389), an increase of
13% compared to the same period in 2016. The EBIT margin was 13.1% (14.0%).
Market development
For the January–June 2017 period, RV registrations in the largest European
markets increased by 10% compared with the same period last year. For the April–
June period, RV registrations increased by 12% compared to the same period last
year.
For the January–May period, heavy truck registrations increased by 4% compared
to the same period last year.
Business highlights
OEM sales growth was 21% in constant currency, while organic sales growth
totaled 15%. Aftermarket sales growth was 10% in constant currency and organic
sales growth was 3%.
RVOEM reported good sales growth across all markets and product groups.
Marine OEM reported strong sales growth in Italy, France and the UK. UK Marine
OEM sales were further enhanced by the addition of Oceanair in Q1, 2017.
CPVOEM reported sales growth driven by product groups such as inverters,
cooling boxes and rear-view cameras.
Aftermarket sales performed well, except for aircon service stations where growth
was somewhat lower than for the corresponding period last year.
¹ Before i.a.c.
0
1,000
2,000
3,000
4,000
5,000
6,000
0
500
1,000
1,500
2,000
2015Q2
2015Q3
2015Q4
2016Q1
2016Q2
2016Q3
2016Q4
2017Q1
2017Q2
RTQ
Quarterly net sales
Rolling 12-month net sales
OEM
45%
(41%)
AM
55%
(59%)
DOMETIC INTERIM REPORT – Q2 2017
6
APAC
Net sales (SEK million)
Sales split AM/OEM
Q2
NET SALES
424 SEK MILLION
(382)
OPERATING PROFIT (EBIT)¹
99 SEK MILLION
(94)
OPERATING MARGIN (EBIT%)¹
23.3%
(24.5%)
NET SALES AND OPERATING PROFIT (EBIT)
Second quarter 2017
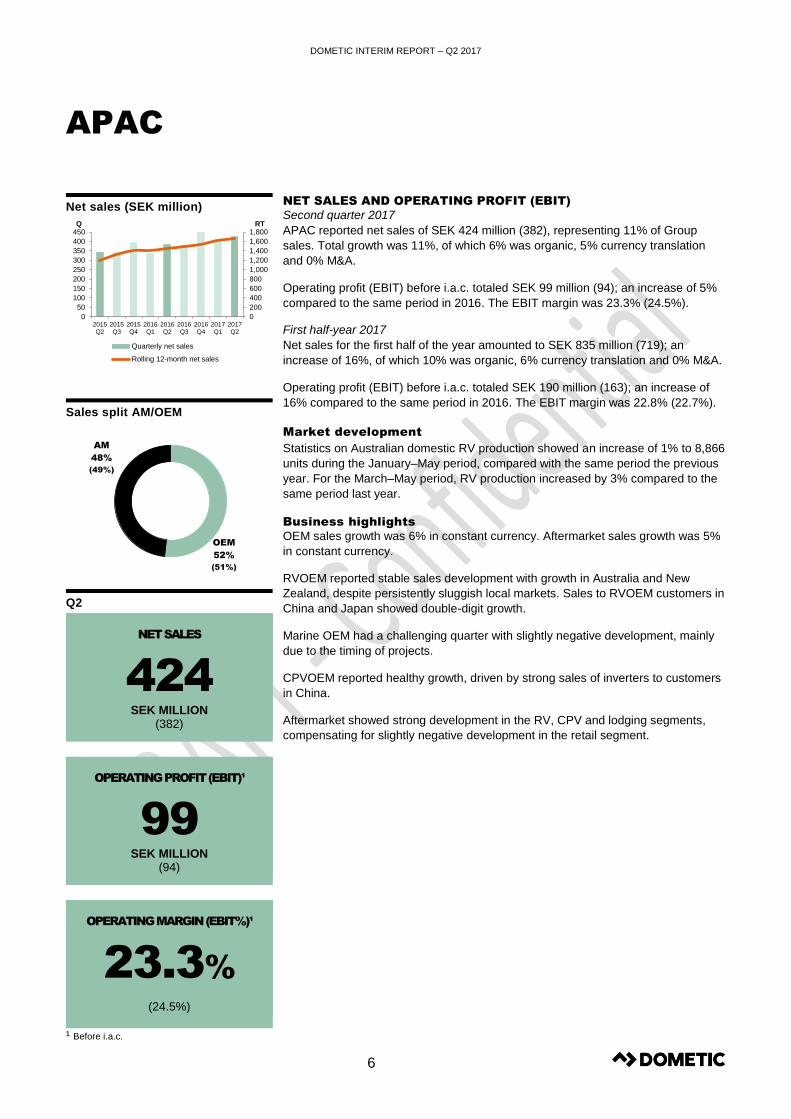
APAC reported net sales of SEK 424 million (382), representing 11% of Group
sales. Total growth was 11%, of which 6% was organic, 5% currency translation
and 0% M&A.
Operating profit (EBIT) before i.a.c. totaled SEK 99 million (94); an increase of 5%
compared to the same period in 2016. The EBIT margin was 23.3% (24.5%).
First half-year 2017
Net sales for the first half of the year amounted to SEK 835 million (719); an
increase of 16%, of which 10% was organic, 6% currency translation and 0% M&A.
Operating profit (EBIT) before i.a.c. totaled SEK 190 million (163); an increase of
16% compared to the same period in 2016. The EBIT margin was 22.8% (22.7%).
Market development
Statistics on Australian domestic RV production showed an increase of 1% to 8,866
units during the January–May period, compared with the same period the previous
year. For the March–May period, RV production increased by 3% compared to the
same period last year.
Business highlights
OEM sales growth was 6% in constant currency. Aftermarket sales growth was 5%
in constant currency.
RVOEM reported stable sales development with growth in Australia and New
Zealand, despite persistently sluggish local markets. Sales to RVOEM customers in
China and Japan showed double-digit growth.
Marine OEM had a challenging quarter with slightly negative development, mainly
due to the timing of projects.
CPVOEM reported healthy growth, driven by strong sales of inverters to customers
in China.
Aftermarket showed strong development in the RV, CPV and lodging segments,
compensating for slightly negative development in the retail segment.
¹ Before i.a.c.
0
200
400
600
800
1,000
1,200
1,400
1,600
1,800
0
50
100
150
200
250
300
350
400
450
2015Q2
2015Q3
2015Q4
2016Q1
2016Q2
2016Q3
2016Q4
2017Q1
2017Q2
RTQ
Quarterly net sales
Rolling 12-month net sales
OEM
52%
(51%)
AM
48%
(49%)
DOMETIC INTERIM REPORT – Q2 2017
7
PARENT COMPANY DOMETIC GROUP AB
(PUBL)
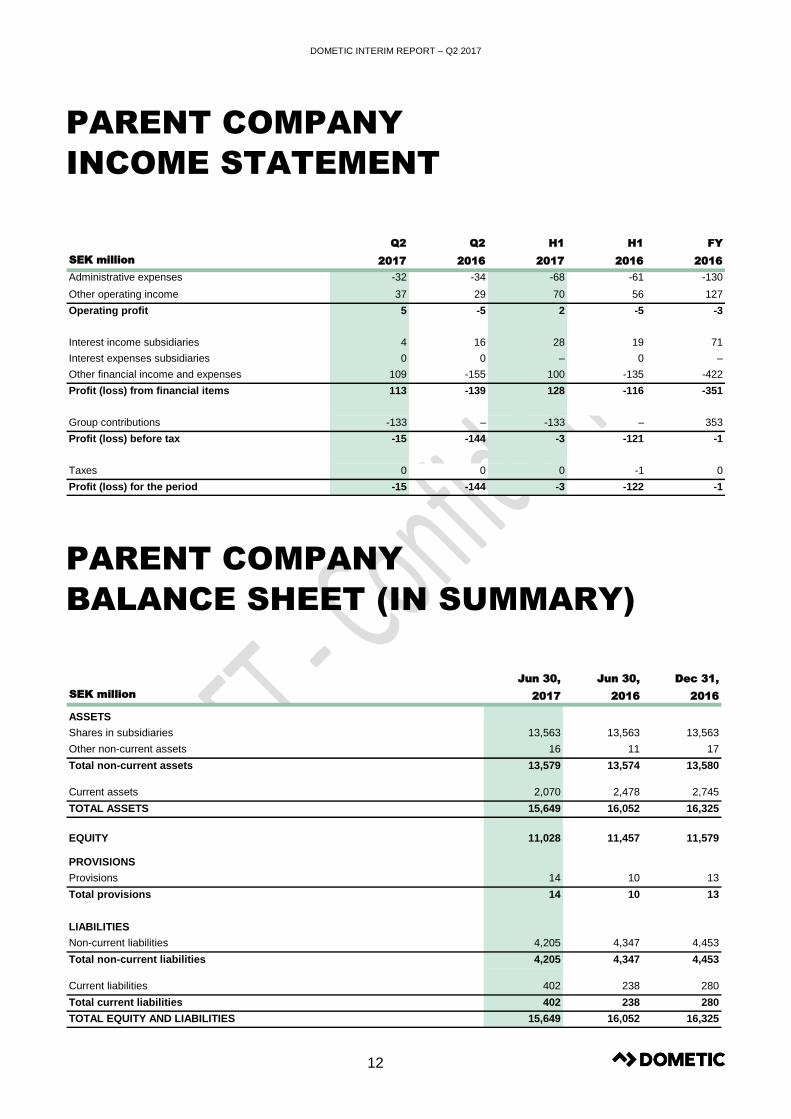
The Parent Company Dometic Group AB (publ)
comprises the functions of the Group’s head office, such
as Group-wide management and administration. The
Parent Company invoices its costs to Group companies.
For the second quarter 2017, the Parent Company had
an operating profit (loss) of SEK 5 million (-5), including
administrative expenses of SEK 32 million (34) and other
operating income of SEK 37 million (29), of which the full
amount relates to income from Group companies.
Profit (loss) from financial items totaled SEK 113 million (-
139), including interest income from Group companies of
SEK 4 million (16), interest expenses to Group
companies of SEK 0 million (0) and other financial
income and expenses SEK 109 million (-155).
Profit (loss) for the second quarter amounted to SEK -15
million (-144).
The Parent Company’s operating profit (loss) for the first
half of the year totaled SEK 2 million (-5), including
administrative expenses of SEK 68 million (61) and other
operating income of SEK 70 million (56), of which the full
amount relates to income from Group companies.
Profit (loss) from financial items totaled SEK 128 million (-
-116), including interest income from Group companies of
SEK 28 million (19), interest expenses to Group
companies of SEK - million (0) and other financial
income and expenses SEK 100 million (-135).
Profit (loss) for the first half year amounted to SEK -3
million (-122).
For further information, please refer to the Parent
Company’s condensed financial statements on page 12.
SIGNATURES OF THE BOARD OF DIRECTORS
The Board of Directors and the President and CEO certify that the Interim Report gives a true and fair overview of the Parent
Company’s operations, their financial position and results of operations, and describes the significant risks and uncertainties
facing the Parent Company and other companies in the Group.
Solna July 18, 2017
REVIEW
This interim report has not been subject to special review by the Dometic Group AB (publ)’s external auditor.
Fredrik Cappelen
Chairman of the Board
Rainer E. Schmückle
Board member
Magnus Yngen
Board member
Peter Sjölander
Board member
Heléne Vibbleus
Board member
Jacqueline Hoogerbrugge
Board member
Erik Olsson
Board member
Roger Johansson
President and CEO
DOMETIC INTERIM REPORT – Q2 2017
8
CONSOLIDATED
INCOME STATEMENT
CONSOLIDATED STATEMENT OF
COMPREHENSIVE INCOME
Q2 Q2 H1 H1 FY
SEK million 2017 2016 2017 2016 2016
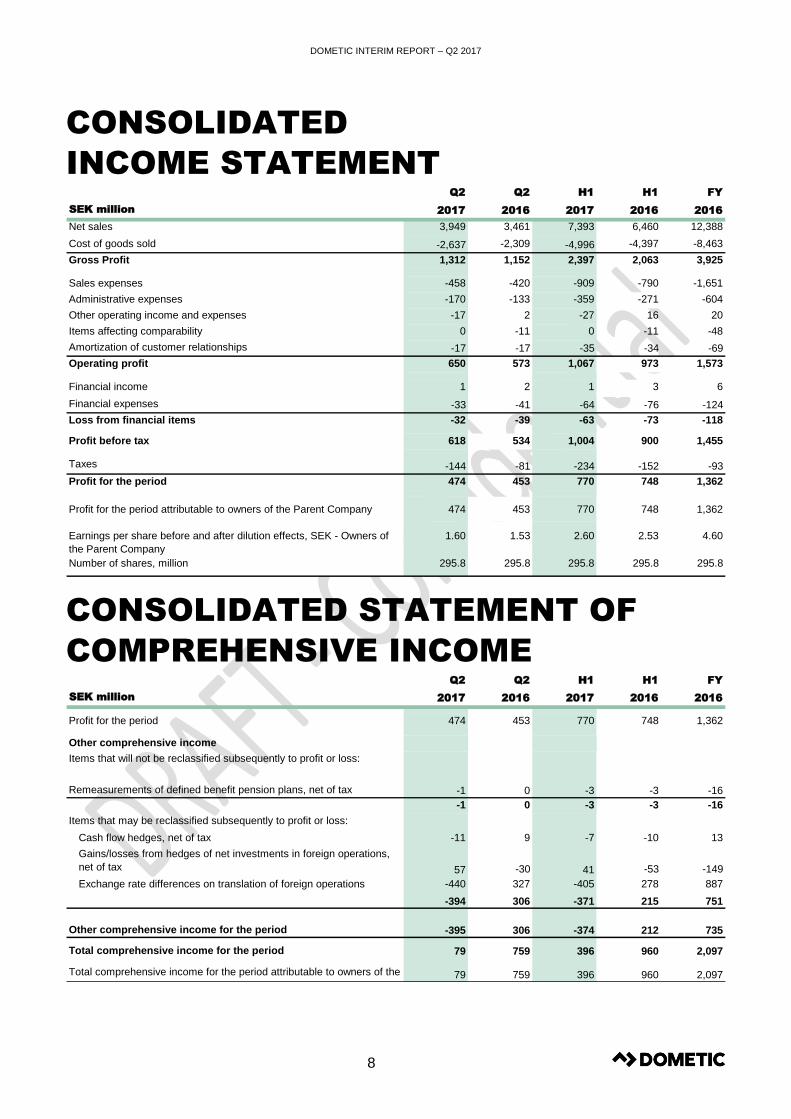
Net sales 3,949 3,461 7,393 6,460 12,388
Cost of goods sold -2,637 -2,309 -4,996 -4,397 -8,463
Gross Profit 1,312 1,152 2,397 2,063 3,925
Sales expenses -458 -420 -909 -790 -1,651
Administrative expenses -170 -133 -359 -271 -604
Other operating income and expenses -17 2 -27 16 20
Items affecting comparability 0 -11 0 -11 -48
Amortization of customer relationships -17 -17 -35 -34 -69
Operating profit 650 573 1,067 973 1,573
Financial income 1 2 1 3 6
Financial expenses -33 -41 -64 -76 -124
Loss from financial items -32 -39 -63 -73 -118
Profit before tax 618 534 1,004 900 1,455
Taxes -144 -81 -234 -152 -93
Profit for the period 474 453 770 748 1,362
Profit for the period attributable to owners of the Parent Company 474 453 770 748 1,362
Earnings per share before and after dilution effects, SEK - Owners of
the Parent Company
1.60 1.53 2.60 2.53 4.60
Number of shares, million 295.8 295.8 295.8 295.8 295.8
Q2 Q2 H1 H1 FY
SEK million 2017 2016 2017 2016 2016
Profit for the period 474 453 770 748 1,362
Other comprehensive income
Items that will not be reclassified subsequently to profit or loss:
Remeasurements of defined benefit pension plans, net of tax -1 0 -3 -3 -16
-1 0 -3 -3 -16
Items that may be reclassified subsequently to profit or loss:
Cash flow hedges, net of tax -11 9 -7 -10 13
Gains/losses from hedges of net investments in foreign operations,
net of tax 57 -30 41 -53 -149
Exchange rate differences on translation of foreign operations -440 327 -405 278 887
-394 306 -371 215 751
Other comprehensive income for the period -395 306 -374 212 735
Total comprehensive income for the period 79 759 396 960 2,097
Total comprehensive income for the period attributable to owners of the
Parent Company79 759 396 960 2,097
DOMETIC INTERIM REPORT – Q2 2017
9
CONSOLIDATED
BALANCE SHEET (IN SUMMARY)
SEK million
ASSETS
Non-current assets
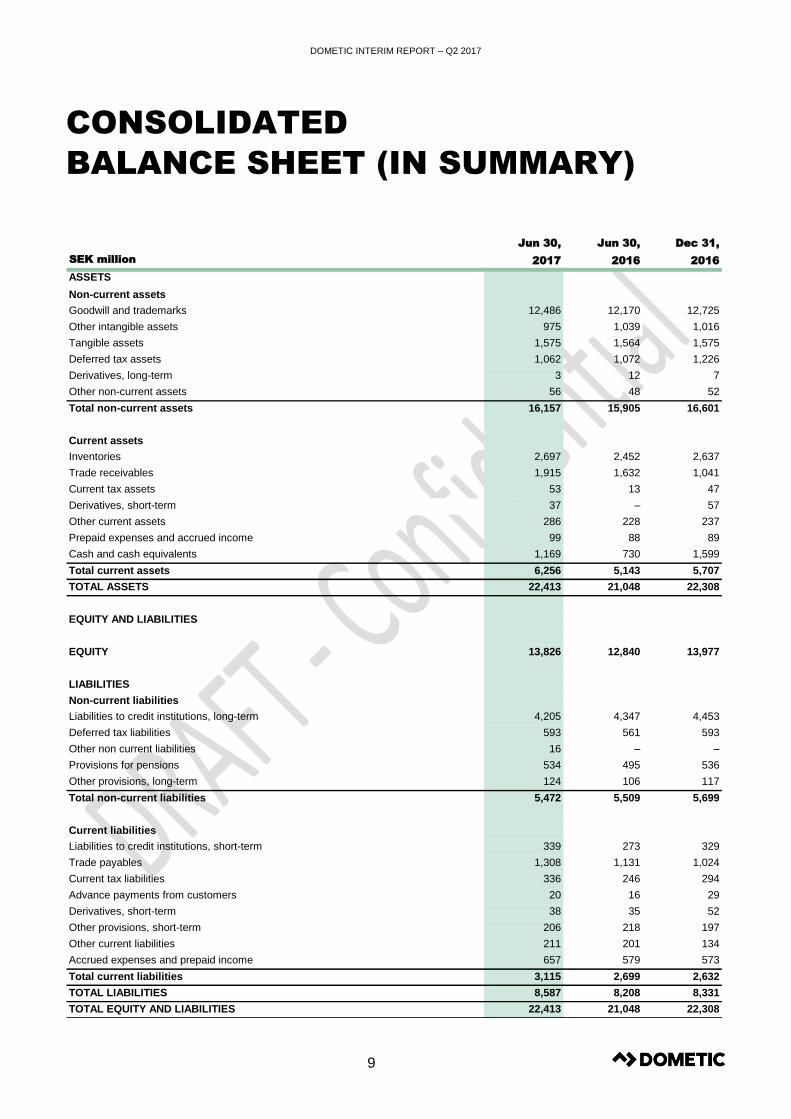
Goodwill and trademarks 12,486 12,170 12,725
Other intangible assets 975 1,039 1,016
Tangible assets 1,575 1,564 1,575
Deferred tax assets 1,062 1,072 1,226
Derivatives, long-term 3 12 7
Other non-current assets 56 48 52
Total non-current assets 16,157 15,905 16,601
Current assets
Inventories 2,697 2,452 2,637
Trade receivables 1,915 1,632 1,041
Current tax assets 53 13 47
Derivatives, short-term 37 – 57
Other current assets 286 228 237
Prepaid expenses and accrued income 99 88 89
Cash and cash equivalents 1,169 730 1,599
Total current assets 6,256 5,143 5,707
TOTAL ASSETS 22,413 21,048 22,308
EQUITY AND LIABILITIES
EQUITY 13,826 12,840 13,977
LIABILITIES
Non-current liabilities
Liabilities to credit institutions, long-term 4,205 4,347 4,453
Deferred tax liabilities 593 561 593
Other non current liabilities 16 – –
Provisions for pensions 534 495 536
Other provisions, long-term 124 106 117
Total non-current liabilities 5,472 5,509 5,699
Current liabilities
Liabilities to credit institutions, short-term 339 273 329
Trade payables 1,308 1,131 1,024
Current tax liabilities 336 246 294
Advance payments from customers 20 16 29
Derivatives, short-term 38 35 52
Other provisions, short-term 206 218 197
Other current liabilities 211 201 134
Accrued expenses and prepaid income 657 579 573
Total current liabilities 3,115 2,699 2,632
TOTAL LIABILITIES 8,587 8,208 8,331
TOTAL EQUITY AND LIABILITIES 22,413 21,048 22,308
Jun 30,
2017
Jun 30,
2016
Dec 31,
2016
DOMETIC INTERIM REPORT – Q2 2017
10
CONSOLIDATED STATEMENT
OF CHANGES IN EQUITY
SEK million Share capital
Other paid in
capital ⁽¹⁾ Reserves
Retained
earnings Total equity
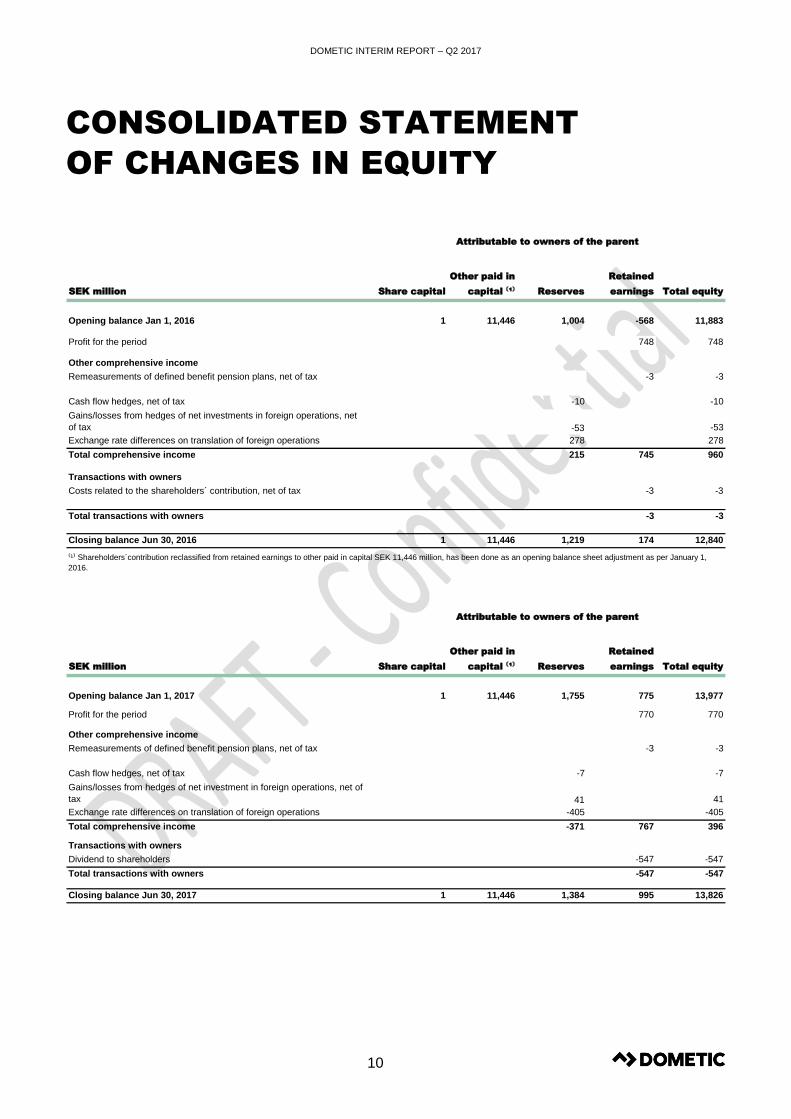
Opening balance Jan 1, 2016 1 11,446 1,004 -568 11,883
Profit for the period 748 748
Other comprehensive income
Remeasurements of defined benefit pension plans, net of tax -3 -3
Cash flow hedges, net of tax -10 -10
Gains/losses from hedges of net investments in foreign operations, net
of tax -53 -53
Exchange rate differences on translation of foreign operations 278 278
Total comprehensive income 215 745 960
Transactions with owners
Costs related to the shareholders´ contribution, net of tax -3 -3
Total transactions with owners -3 -3
Closing balance Jun 30, 2016 1 11,446 1,219 174 12,840
SEK million Share capital
Other paid in
capital ⁽¹⁾ Reserves
Retained
earnings Total equity
Opening balance Jan 1, 2017 1 11,446 1,755 775 13,977
Profit for the period 770 770
Other comprehensive income
Remeasurements of defined benefit pension plans, net of tax -3 -3
Cash flow hedges, net of tax -7 -7
Gains/losses from hedges of net investment in foreign operations, net of
tax 41 41
Exchange rate differences on translation of foreign operations -405 -405
Total comprehensive income -371 767 396
Transactions with owners
Dividend to shareholders -547 -547
Total transactions with owners -547 -547
Closing balance Jun 30, 2017 1 11,446 1,384 995 13,826
Attributable to owners of the parent
Attributable to owners of the parent
⁽¹⁾ Shareholders´contribution reclassified from retained earnings to other paid in capital SEK 11,446 million, has been done as an opening balance sheet adjustment as per January 1,
2016.
Aktieägartillskott omfört mellan Balanserat resultat och Övrigt tillskjutet kapital med 4Mkr.
Kolla
DOMETIC INTERIM REPORT – Q2 2017
11
CONSOLIDATED STATEMENT
OF CASH FLOW
Q2 Q2 H1 H1 FY
SEK million2017 2016 2017 2016 2016
Cash flow from operations
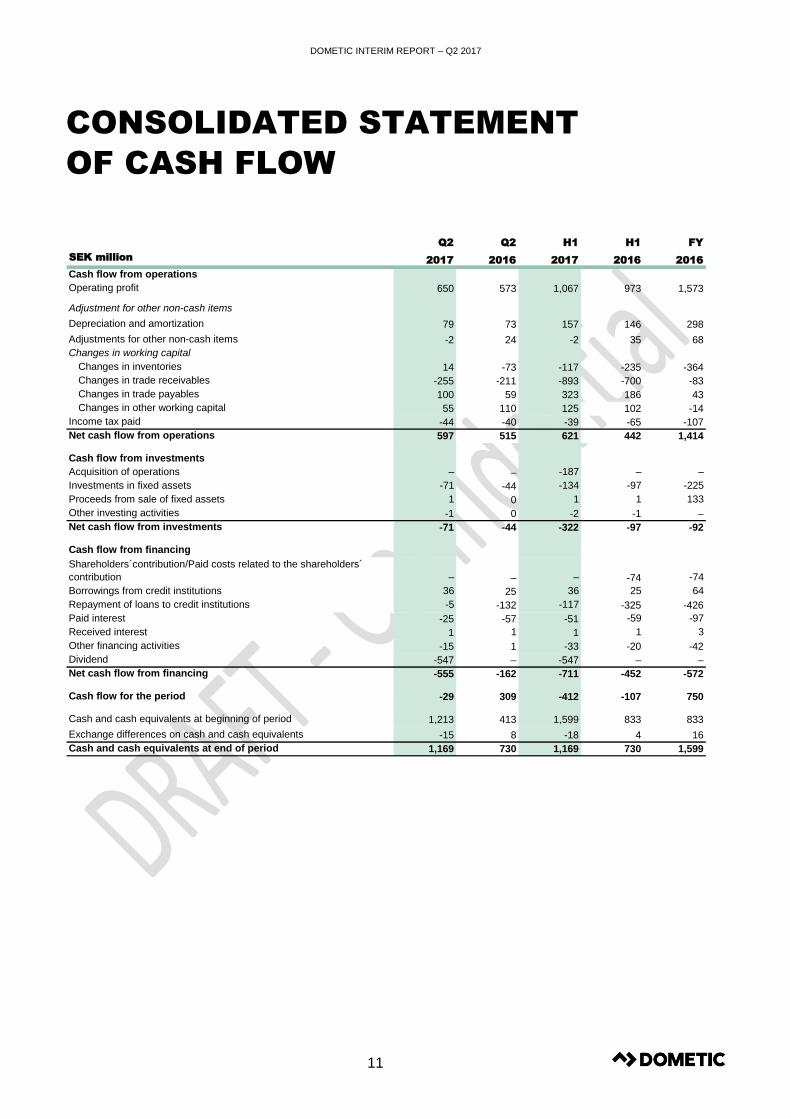
Operating profit 650 573 1,067 973 1,573
Adjustment for other non-cash items
Depreciation and amortization 79 73 157 146 298
Adjustments for other non-cash items -2 24 -2 35 68
Changes in working capital
Changes in inventories 14 -73 -117 -235 -364
Changes in trade receivables -255 -211 -893 -700 -83
Changes in trade payables 100 59 323 186 43
Changes in other working capital 55 110 125 102 -14
Income tax paid -44 -40 -39 -65 -107
Net cash flow from operations 597 515 621 442 1,414
Cash flow from investments
Acquisition of operations – – -187 – –
Investments in fixed assets -71 -44 -134 -97 -225
Proceeds from sale of fixed assets 1 0 1 1 133
Other investing activities -1 0 -2 -1 –
Net cash flow from investments -71 -44 -322 -97 -92
Cash flow from financing
Shareholders´contribution/Paid costs related to the shareholders´
contribution – – – -74 -74
Borrowings from credit institutions 36 25 36 25 64
Repayment of loans to credit institutions -5 -132 -117 -325 -426
Paid interest -25 -57 -51 -59 -97
Received interest 1 1 1 1 3
Other financing activities -15 1 -33 -20 -42
Dividend -547 – -547 – –
Net cash flow from financing -555 -162 -711 -452 -572
Cash flow for the period -29 309 -412 -107 750
Cash and cash equivalents at beginning of period 1,213 413 1,599 833 833
Exchange differences on cash and cash equivalents -15 8 -18 4 16
Cash and cash equivalents at end of period 1,169 730 1,169 730 1,599
DOMETIC INTERIM REPORT – Q2 2017
12
PARENT COMPANY
INCOME STATEMENT
PARENT COMPANY
BALANCE SHEET (IN SUMMARY)
Q2 Q2 H1 H1 FY
SEK million 2017 2016 2017 2016 2016
Administrative expenses -32 -34 -68 -61 -130
Other operating income 37 29 70 56 127
Operating profit 5 -5 2 -5 -3
Interest income subsidiaries 4 16 28 19 71
Interest expenses subsidiaries 0 0 – 0 –
Other financial income and expenses 109 -155 100 -135 -422
Profit (loss) from financial items 113 -139 128 -116 -351
Group contributions -133 – -133 – 353
Profit (loss) before tax -15 -144 -3 -121 -1
Taxes 0 0 0 -1 0
Profit (loss) for the period -15 -144 -3 -122 -1
Linjal tabell helsida, 100% upplösning
SEK million
ASSETS
Shares in subsidiaries 13,563 13,563 13,563
Other non-current assets 16 11 17
Total non-current assets 13,579 13,574 13,580
Current assets 2,070 2,478 2,745
TOTAL ASSETS 15,649 16,052 16,325
EQUITY 11,028 11,457 11,579
PROVISIONS
Provisions 14 10 13
Total provisions 14 10 13
LIABILITIES
Non-current liabilities 4,205 4,347 4,453
Total non-current liabilities 4,205 4,347 4,453
Current liabilities 402 238 280
Total current liabilities 402 238 280
TOTAL EQUITY AND LIABILITIES 15,649 16,052 16,325
Jun 30,
2017
Jun 30,
2016
Dec 31,
2016
Linjal tabell helsida, 100% upplösning = 72,5 bredd
DOMETIC INTERIM REPORT – Q2 2017
13
CONDENSED NOTES
NOTE 1 | ACCOUNTING PRINCIPLES
Dometic Group AB (publ) (“Dometic”) applies International
Financial Reporting Standards (IFRS), as adopted by the EU.
This consolidated Interim Financial Report has been prepared in
accordance with IAS 34 ‘Interim Financial Reporting’. The
Swedish Annual Accounts Act and RFR 2 Accounting for Legal
Entities, issued by the Swedish Financial Reporting Board, have
been applied for the Parent Company. The interim report
comprises pages 1-16 and pages 1-7 are thus an integrated part
of this financial report (IAS 34.16A).
The accounting principles applied correspond to those described
in the 2016 Annual Report. There are no changes to Dometic’s
accounting and valuation principles compared with principles
described in Notes 2 and 4 of the 2016 Annual Report. For a
detailed description of the accounting and valuation principles
applied by the Group, see Notes 1, 2 and 4 of the 2016 Annual
Report, available at www.dometic.com.
Preparations for the new accounting standards
The following information should be considered in addition to the
description of the new accounting standards and related
activities provided in the 2016 Annual Report, Note 2.
IFRS 9 Financial instruments; the work with the credit loss model
is still ongoing. The extent to which IFRS 9 affects Dometic’s
financial reporting will be determined in 2017. IFRS 15 Revenue
from Contracts with Customers; at present the Group is working
with the data collection in order to meet the disclosure
requirements. IFRS 16 Leases. Currently Dometic is assessing
the impact from the new standard, at this stage the Group is not
able to quantify the impact on Group financial consolidated
statements.
IFRS 9 (Financial Instruments) and IFRS 15 (Revenue from
Contracts with Customers) are to be applied from the financial
year beginning January 1, 2018, while IFRS 16 (Leases) is
effective as of January 1, 2019. Earlier application is permitted
for all standards. Dometic will not apply earlier adoption.
NOTE 2 | RISKS AND UNCERTAINTIES
As all businesses, Dometic is exposed to a number of risks that
could have a material impact on the Group. These risks are
factors that impact Dometic’s ability to achieve established
Group targets. This applies to both financial targets and targets
in other areas outlined in Dometic’s business strategy. Dometic
performs annual risk analysis by assessing each defined risks
likelihood and impact in a risk register, resulting in global and
regional risk maps presented to Group management and the
Board of Directors and used as foundation for the control
activities within Dometic. The risks that Dometic is exposed to
are classified into four main categories (business and market
risks, operational risks, compliance and regulatory risks and
financial risks) where each category has underlying risks. These
risks can be both internal and external. The internal risks are
mainly managed and controlled by Dometic whereas the external
risk factors are not caused nor can be controlled by Dometic but
the effects can be limited by an effective risk management.
Dometic is subject to transaction risks at the time of purchasing
and selling, as well as when conducting financial transactions.
Transaction exposure is primarily related to the currencies EUR,
USD and AUD. As the majority of the Group’s profit is generated
outside Sweden, the Group is also exposed to translational risks
in all the major currencies.
Efficient risk management is a continual process conducted
within the framework of business control, and is part of the
ongoing review of operations and forward-looking assessment of
operations. In the preparation of financial reports, the Board of
Directors and Group management are required to make
estimates and judgments. These estimates and judgments
impact the income statement and balance sheet, as well as the
disclosures. The actual outcome may differ from these estimates
and judgments under different circumstances and conditions.
Dometic’s future risk exposure is assumed not to deviate from
the inherent exposure associated with Dometic’s ongoing
business operations. For a more in-depth analysis of risks and
risk management, please refer to Dometic’s 2016 Annual Report.
NOTE 3 | FINANCIAL INSTRUMENTS
Dometic uses interest rate swaps to hedge senior facility term
loans to move from a floating interest rate to a fixed interest rate.
The Group also uses currency forward agreements to hedge part
of its cash flow exposure. Valuation principles and principles for
hedge accounting, as described in Note 3 of the 2016 Annual
Report, have been applied throughout the reporting period.
The fair values of Dometic’s derivative assets and liabilities were
SEK 40 million (Q2 2016: SEK 12 million) and SEK 38 million,
(Q2 2016: SEK 35 million).The value of derivatives is based on
published prices in an active market. No transfers between levels
of the fair value hierarchy have occurred during the period.
For financial assets and liabilities other than derivatives, fair
value is assumed to be equal to the carrying amount.
DOMETIC INTERIM REPORT – Q2 2017
14
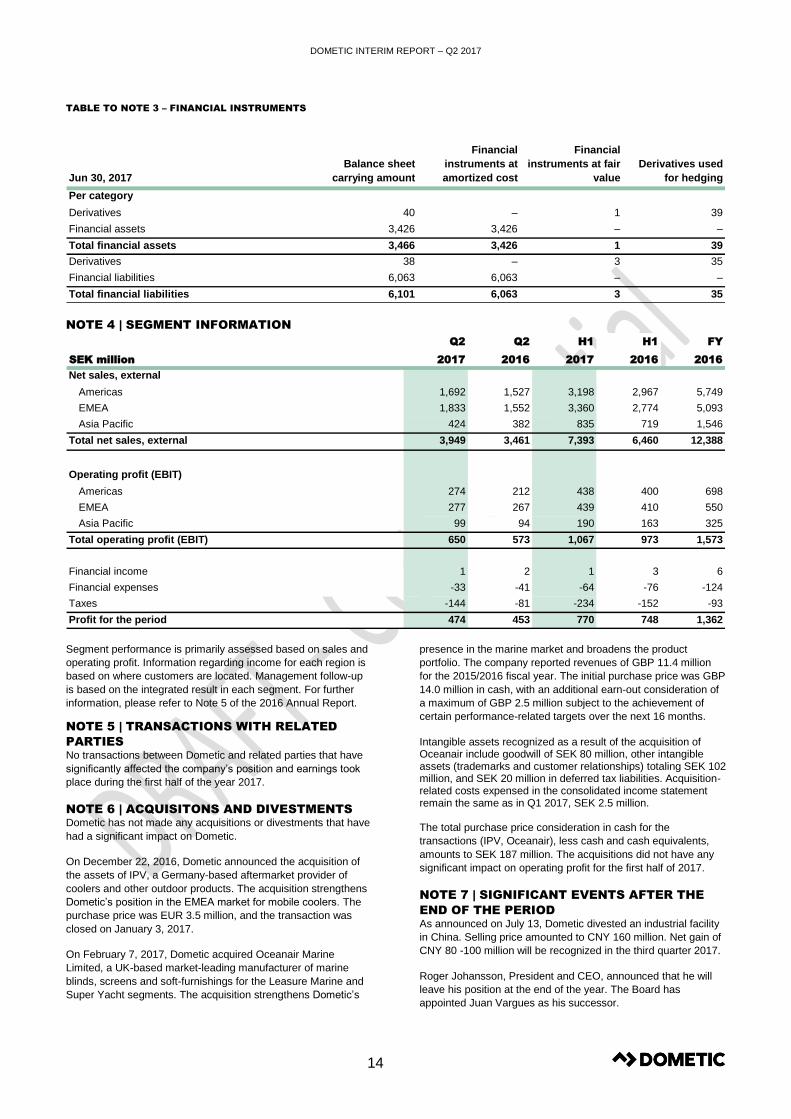
TABLE TO NOTE 3 – FINANCIAL INSTRUMENTS
NOTE 4 | SEGMENT INFORMATION
Segment performance is primarily assessed based on sales and
operating profit. Information regarding income for each region is
based on where customers are located. Management follow-up
is based on the integrated result in each segment. For further
information, please refer to Note 5 of the 2016 Annual Report.
NOTE 5 | TRANSACTIONS WITH RELATED
PARTIES
No transactions between Dometic and related parties that have
significantly affected the company’s position and earnings took
place during the first half of the year 2017.
NOTE 6 | ACQUISITONS AND DIVESTMENTS
Dometic has not made any acquisitions or divestments that have
had a significant impact on Dometic.
On December 22, 2016, Dometic announced the acquisition of
the assets of IPV, a Germany-based aftermarket provider of
coolers and other outdoor products. The acquisition strengthens
Dometic’s position in the EMEA market for mobile coolers. The
purchase price was EUR 3.5 million, and the transaction was
closed on January 3, 2017.
On February 7, 2017, Dometic acquired Oceanair Marine
Limited, a UK-based market-leading manufacturer of marine
blinds, screens and soft-furnishings for the Leasure Marine and
Super Yacht segments. The acquisition strengthens Dometic’s
presence in the marine market and broadens the product
portfolio. The company reported revenues of GBP 11.4 million
for the 2015/2016 fiscal year. The initial purchase price was GBP
14.0 million in cash, with an additional earn-out consideration of
a maximum of GBP 2.5 million subject to the achievement of
certain performance-related targets over the next 16 months.
Intangible assets recognized as a result of the acquisition of Oceanair include goodwill of SEK 80 million, other intangible assets (trademarks and customer relationships) totaling SEK 102 million, and SEK 20 million in deferred tax liabilities. Acquisition-related costs expensed in the consolidated income statement remain the same as in Q1 2017, SEK 2.5 million. The total purchase price consideration in cash for the
transactions (IPV, Oceanair), less cash and cash equivalents,
amounts to SEK 187 million. The acquisitions did not have any
significant impact on operating profit for the first half of 2017.
NOTE 7 | SIGNIFICANT EVENTS AFTER THE
END OF THE PERIOD
As announced on July 13, Dometic divested an industrial facility
in China. Selling price amounted to CNY 160 million. Net gain of
CNY 80 -100 million will be recognized in the third quarter 2017.
Roger Johansson, President and CEO, announced that he will
leave his position at the end of the year. The Board has
appointed Juan Vargues as his successor.
Jun 30, 2017
Balance sheet
carrying amount
Financial
instruments at
amortized cost
Financial
instruments at fair
value
Derivatives used
for hedging
Per category
Derivatives 40 – 1 39
Financial assets 3,426 3,426 – –
Total financial assets 3,466 3,426 1 39
Derivatives 38 – 3 35
Financial liabilities 6,063 6,063 – –
Total financial liabilities 6,101 6,063 3 35
Linjal tabell helsida, 100% upplösning
Q2 Q2 H1 H1 FY
SEK million 2017 2016 2017 2016 2016
Net sales, external
Americas 1,692 1,527 3,198 2,967 5,749
EMEA 1,833 1,552 3,360 2,774 5,093
Asia Pacific 424 382 835 719 1,546
Total net sales, external 3,949 3,461 7,393 6,460 12,388
Operating profit (EBIT)
Americas 274 212 438 400 698
EMEA 277 267 439 410 550
Asia Pacific 99 94 190 163 325
Total operating profit (EBIT) 650 573 1,067 973 1,573
Financial income 1 2 1 3 6
Financial expenses -33 -41 -64 -76 -124
Taxes -144 -81 -234 -152 -93
Profit for the period 474 453 770 748 1,362
Linjal tabell helsida, 100% upplösning
DOMETIC INTERIM REPORT – Q2 2017
15
RECONCILIATION OF NON-IFRS MEASURES
TO IFRS (ALTERNATIVE PERFORMANCE MEASURES)
Dometic presents some financial measures in this interim report, which are not defined by IFRS. The company believes that these
measures provide valuable additional information to investors and management for evaluating the company’s financial performance,
financial position and trends in our operations. It should be noted that these measures, as defined, may not be comparable to similarly titled
measures used by other companies. These non-IFRS measures should not be considered as substitutes for financial reporting measures
prepared in accordance with IFRS. See Dometic’s website www. dometic.com for the detailed reconciliation.
Core working capital
Consists of inventories and trade receivables less trade
payables.
EBITDA
Earnings before Interest, Taxes, Depreciation and Amortization
EBITDA margin
EBITDA divided by net sales
Leverage
Net debt excluding pensions and accrued interest in relation to
EBITDA.
Net debt
Total borrowings including pensions and accrued interest less
cash and cash equivalents.
Operating cash flow
EBITDA +/- change in working capital excluding paid tax, after
capital expenditure.
Organic growth
Sales growth excluding acquisitions/divestments and currency
translation effects. Quarters calculated at comparable currency,
applying latest period average rate.
RoOC – Return on Operating Capital
Operating profit (EBIT) divided by operating capital. Based on
the operating profit (EBIT) for the four previous quarters, divided
by the average operating capital for the previous four quarters,
excluding goodwill and trademarks for the previous quarter
DEFINITIONS AND KEY RATIOS
AM
Aftermarket.
Capital expenditure
Expenses related to the purchase of tangible and intangible assets.
CPV
Commercial and Passenger Vehicles.
EPS – Earnings per share
Net profit for the period divided by average number of shares.
FY 2016
Financial Year ended December 31, 2016
i.a.c. – items affecting comparability
Represents income and expenses related to non-recurring events,
occurring on an irregular basis and affecting comparability between
the periods.
Interest-bearing debt
Liabilities to credit institutions plus liabilities to related parties plus
provisions for pensions.
OCI
Other comprehensive income.
OEM
Original Equipment Manufacturers.
Operating capital
excluding goodwill and trademarks
Interest-bearing debt plus equity less cash and cash equivalents,
excluding goodwill and trademarks.
Operating profit (EBIT)
Operating profit; earnings before financial items and taxes.
Operating profit (EBIT) margin
Operating profit divided by net sales.
RV
Recreational Vehicles.
Q2 2017
April to June 2017 for Income Statement.
Q2 2016
April to June 2016 for Income Statement.
Working capital
Core working capital plus other current assets less other current
liabilities and provisions relating to operations.
DOMETIC INTERIM REPORT – Q2 2017
16
PRESENTATION OF THE
INTERIM REPORT
Analysts and media are invited to participate in a telephone
conference at 10.00 (CEST), today, July 18, 2017, during which
President and CEO, Roger Johansson and CFO, Per-Arne
Blomquist, will present the report and answer questions. To
participate in the webcast/telephone conference, please dial in five
minutes prior to the start of the conference call:
Sweden: +46 (0)8 566 426 69
UK: +44 (0)20 300 898 08
US: +1 855 831 59 48
Webcast URL and presentation are available at www.dometic.com
FOR FURTHER INFORMATION,
PLEASE CONTACT
Johan Lundin
Head of Investor Relations and Communications
Phone: +46 8 501 025 46
E-mail: [email protected]
This information is information that Dometic Group AB (publ) is
obliged to make public pursuant to the EU Market Abuse Regulation
and the Securities Markets Act. The information was submitted for
publication, through the agency of the contact person set out above,
at 08:00 CET on July 18, 2017.
FINANCIAL CALENDAR
CONTACT DETAILS
Dometic Group AB (publ)
Hemvärnsgatan 15
SE-171 54 Solna, Sweden
Phone: +46 8 501 025 00
www.dometic.com
Corporate registration number 556829-4390
ABOUT DOMETIC
Dometic is a global market leader in branded solutions for mobile
living in the areas of Climate, Hygiene & Sanitation and Food &
Beverage. Dometic operates in the Americas, EMEA and Asia
Pacific, providing products for use in recreational vehicles, trucks
and premium cars, pleasure and workboats, and for a variety of
other uses. Dometic offers products and solutions that enrich
people’s experiences away from home, whether in a motorhome,
caravan, boat or truck. Our motivation is to create smart and
reliable products with outstanding design. We operate 22
manufacturing/assembly sites in nine countries, sell our products in
approximately 100 countries and manufacture approximately 85%
of products sold in-house. We have a global distribution and dealer
network in place to serve the aftermarket. Dometic employs
approximately 6,500 people worldwide, had net sales of SEK 12.4
billion in 2016 and is headquartered in Stockholm, Sweden.
This document is a translation of the Swedish version of the interim
report. In the event of any discrepancy, the Swedish wording shall
prevail.
OCTOBER 24, 2017
Interim report, January – September 2017
FEBRUARY 8, 2018
Year-end report, 2017


![10773senate.gov.ph › republic_acts › ra 10773.pdf · 10773] AN ACT RENEWING FOR ANOTHER TWENT\'-Fr\’E (25) \t:ars the franchise granted to eagle BROADCASTING CORPORATION AS](https://img.pdfslide.us/doc/110x75/5f1c4dfa271b215cd63916fd/a-republicacts-a-ra-10773pdf-10773-an-act-renewing-for-another-twent-frae.jpg)