Embed Size (px)
Citation preview

485 Massachusetts Avenue, Suite 2
Cambridge, Massachusetts 02139
617.661.3248 | www.synapse‐energy.com
Net Metering in Mississippi
Costs, Benefits, and Policy Considerations
Prepared for the Public Service Commission of Mississippi
September 19, 2014
AUTHORS
Elizabeth A. Stanton, PhD
Joseph Daniel
Tommy Vitolo, PhD
Pat Knight
David White, PhD
Geoff Keith

CONTENTS
1. EXECUTIVE SUMMARY ....................................................................................... 1
2. BACKGROUND CONTEXT ..................................................................................... 3
2.1. What is Net Metering? ...................................................................................................... 3
2.2. Regional Context ............................................................................................................. 13
2.3. Avoided Cost and Screening Tests Used in Mississippi ..................................................... 16
2.4. Mississippi Electricity Utilities and Fuel Mix ..................................................................... 17
2.5. Growth of Solar in the United States ............................................................................... 19
3. MODELING ................................................................................................... 20
3.1. Modeling Assumptions .................................................................................................... 21
3.2. Model Inputs: General ..................................................................................................... 23
3.3. Model Inputs: Benefits of Net Metering........................................................................... 26
3.4. Model Inputs: Costs ......................................................................................................... 31
3.5. Literature Review of Costs and Benefits Not Monetized .................................................. 34
4. MISSISSIPPI NET METERING POLICY CASE RESULTS ................................................. 36
4.1. Policy Case Benefits ......................................................................................................... 36
4.2. Policy Case Costs ............................................................................................................. 38
4.3. Cost‐Effectiveness Analysis .............................................................................................. 39
5. SENSITIVITY ANALYSES ..................................................................................... 44
5.1. Fuel Prices ....................................................................................................................... 45
5.2. Capacity Values ............................................................................................................... 45
5.3. Avoided T&D ................................................................................................................... 46
5.4. CO2 Price Sensitivities ...................................................................................................... 47
5.5. Combined Sensitivities .................................................................................................... 48
6. CONCLUSIONS ................................................................................................ 49

APPENDIX A: VALUE OF AVOIDED RISK ....................................................................... 51
Theoretical Framework ............................................................................................................. 51
Current Practices ...................................................................................................................... 54
Conclusions and Recommendations .......................................................................................... 60

Synapse Energy Economics, Inc. Net Metering in Mississippi 1
1. EXECUTIVE SUMMARY
At its December 7, 2010 Open Meeting, the Mississippi Public Service Commission voted to open docket
2011‐AD‐2 in order to investigate establishing and implementing net metering and interconnection
standards for Mississippi. Mississippi is one of only a few states that do not have some sort of net
metering policy for their distribution companies.1 In this report we describe a potential net metering
policy for Mississippi and the issues surrounding it, focusing on residential and commercial rooftop solar.
Two vertically integrated investor‐owned utilities serve customers in Mississippi: Entergy Mississippi and
Mississippi Power. The Tennessee Valley Authority, a not‐for‐profit corporation owned by the United
States government, owns generation and transmission assets within the state. Many Mississippi
customers are served by electric power associations, including South Mississippi Electric Power
Association, a generation and transmission cooperative, and the 25 distribution co‐ops. These entities
rely primarily on three resources for electric generation: natural gas, coal, and nuclear power. About 3
percent of generation is attributable to wood and wood‐derived fuels. Less than 0.01 percent of
Mississippians participated in distributed generation in 2013. We modeled and analyzed the impacts of
installing rooftop solar in Mississippi equivalent to 0.5 percent of the state’s peak historical demand with
the goal of estimating the potential benefits and potential costs of a hypothetical net metering program.
Highlights of analysis and findings:
Generation from rooftop solar panels in Mississippi will most likely displace generation from the state’s peaking resources—oil and natural gas combustion turbines.
Distributed solar is expected to avoid costs associated with energy generation costs, future capacity investments, line losses over the transmission and distribution system, future investments in the transmission and distribution system, environmental compliance costs, and costs associated with risk.
Distributed solar will also impose new costs, including the costs associated with buying and installing rooftop solar (borne by the host of the solar panels) and the costs associated with managing and administering a net metering program.
Of the three cost‐effectiveness tests used for energy efficiency in Mississippi—the Total Resource Cost (TRC) test, the Rate Impact Measure, and the Utility Cost Test—the TRC test best reflects and accounts for the benefits associated with distributed generation.
Net metering provides net benefits (benefit‐cost ratio above 1.0) under almost all of the scenarios and sensitivities analyzed, as shown in ES Table 1.
1 Other states that do not have a net metering policy: Idaho, South Dakota, Texas, Alabama, and Tennessee.

Synapse Energy Economics, Inc. Net Metering in Mississippi 2
ES Table 1. Summation of TRC Test benefit/cost ratios under various sensitivities
Low Mid High
Fuel Price Scenario 1.17 1.19 1.21
Capacity Value Sensitivities 1.11 1.19 1.26
Avoided T&D Sensitivities 1.01 1.19 1.32
CO2 Price Sensitivities 1.16 1.19 1.24
Combined Scenarios 0.89 1.19 1.47
To determine the widest range of possible benefits, our analysis included combined scenarios in which all of the inputs were selected to yield the highest possible benefits (in the All High scenario) and the lowest possible benefits (All Low); the All Low scenario was the only scenario or sensitivity that did not pass the TRC test (see ES Figure 1).
ES Figure 1. Results of scenario testing under combined scenarios
Distributed solar has the potential to result in a downward pressure on rates.
Distributed solar provides benefits to hosts in the form of reduced energy bills; however, the
host pays for the panels and if the reduced energy bills do not offset these costs, it is unlikely
that distributed solar will achieve significant adoption within the state.
If net metered customers are compensated at the variable retail rate in Mississippi, it is unlikely
they will be able to finance rooftop solar installations.
Synapse Energy Economics, Inc. Net Metering in Mississippi 3
2. BACKGROUND CONTEXT
2.1. What is Net Metering?
Net metering is a financial incentive to owners or leasers of distributed energy resources. Customers
develop their own energy generation resources and receive a payment or an energy credit from their
distribution company for doing so. Mississippi is one of only a few states that do not have some sort of
net metering policy for their distribution companies (voluntary or otherwise).2 In addition to presenting
results of a cost‐benefit analysis of net metering in Mississippi, this report describes some of the key
issues that may be contested in the development of a net metering policy for Mississippi.
In our description of net metering and the issues surrounding it, we focus on residential and commercial
rooftop solar.
Why Net Metering?
Net metering provides customers with a payment for electricity generation from their distributed
generation resources. Distributed generation provides benefits to its host and to all ratepayers.
Valuation of these benefits, however, has proven contentious. This section discusses issues in calculating
costs avoided by distributed generation, as well as some additional difficult‐to‐monetize benefits:
freedom of energy choice, grid resiliency, risk mitigation, and fuel diversity.
Avoided Costs
The term “avoided costs” refers to costs that would be borne by the distribution company and passed
on to ratepayers were it not for distributed generation or energy efficiency (or other alternative
resources). Avoiding these costs is a benefit to both ratepayers and distribution companies. Under the
Public Utility Regulatory Policy Act (PURPA), utilities and commissions already go through the process of
calculating avoided costs associated with generation from qualified facilities. As a result, the incremental
costs associated with calculating avoided costs for net metering facilities is small. We provide a review
of the avoided cost and screening tests already used in Mississippi below.
A variety of methods have been used to calculate avoided costs. Estimation of system benefits can be
difficult and costly, and small changes in assumptions can sometimes dominate benefit‐cost results.
Avoided cost estimation methods range from:
Adoption of the simple assumptions that (a) a single type of power plant is on the margin in all hours of the day and (b) distributed generation has no potential for offsetting or postponing capital expenses; to
2 Other states that do not have a net metering policy: Idaho, South Dakota, Texas, Alabama, and Tennessee.

Synapse Energy Economics, Inc. Net Metering in Mississippi 4
The rigorous modeling of production costs using hourly dispatch of all units in a region and capacity expansion over long time horizons. This method requires development of distributive generation load shapes (patterns of generation over the day and year) for present and future years, energy and capacity demands for the region, expected environmental regulations and their respective compliance costs, and projections for commodity prices such as natural gas and coal.
Table 1 provides a list of avoided costs from distributed generation facilities that have been analyzed in
other studies. The appropriate avoided costs to include in a benefit‐cost analysis depend on state‐ and
distribution‐company‐specific factors.
Table 1. List of potential costs avoided by distributed generation
Avoided Costs Description
Avoided Energy All fuel, variable operation and maintenance emission allowance costs and
any wheeling charges associated with the marginal unit
Avoided Capacity
Contribution of distributed generation to deferring the addition of capacity
resources, including those resources needed to maintain capacity reserve
requirements
Avoided Transmission and
Distribution Capacity
Contribution to deferring the addition of transmission and distribution
resources needs to serve load pockets, far reaching resources, or
elsewhere
Avoided System Losses Preventing energy lost over the transmission and distribution lines to get from
centralized generation resources to load
Avoided RPS Compliance Reduced payments to comply with state renewable energy portfolio standards
Avoided Environmental
Compliance Costs
Avoided costs associated with marginal unit complying with various existing
and commonly expected environmental regulations, including pending CO2
regulations
Market Price Suppression
Effects
Price effect caused by the introduction of new supply on energy and
capacity markets
Avoided Risk (e.g.,
reduced price volatility)
Reduction in risk associated with price volatility and/or project development
risk
Avoided Grid Support
Services
Contribution to reduced or deferred costs associated with grid support (aka
ancillary) services including voltage control and reactive supply
Avoided Outages Costs Estimated cost of power interruptions that may be avoided by distributed
generation systems that are still able to operate during outages
Non‐Energy Benefits Includes a wide range of benefits not associated with energy delivery, may
include increased customer satisfaction and fewer service complaints
Distributed energy avoids costs related to energy generation and future capital additions, as well as
transmission and distribution load losses and future capital expenditures, especially in pockets of
concentrated load. Net metering may also result in some additional transmission and distribution
expenses where the excess generation is significant enough to require upgrades. Because distributed

Synapse Energy Economics, Inc. Net Metering in Mississippi 5
generation occurs at the load source, a share of transmission and distribution line losses also may be
avoided. In states with Renewable Portfolio Standard (RPS) goals set as a percent of retail sales, distributed
generation reduces the RPS requirement and associated costs.
Generation from distributed energy resources also results in price suppression effects in the energy and
capacity markets (where applicable). As a recent addition to MISO, Entergy will participate in future
MISO capacity and energy markets and may therefore experience a price suppression effect from net
metering.
In 2013, Mississippi’s electricity generation was 60 percent natural gas, 21 percent nuclear, 16 percent
coal, and 3 percent biomass and others.3 Maintaining a diverse mix of generation resources protects
ratepayers against a variety of risks including fuel price volatility, change in average fuel prices over
time, uncertainties in resource construction costs, and the costs of complying with new environmental
regulations. In Mississippi, increased electric generation from solar, wind, or waste‐to‐energy projects
would represent an improvement in resource diversity, thereby lowering these potentially costly risks.
Other costs that may be avoided by integrating distributed generation onto the grid have not been as
rigorously studied or quantified. For example, distributed generation may contribute to reduced or deferred
costs associated with ancillary services, including voltage control and reactive supply. It may also reduce lost
load hours during power interruptions and costs associated with restoring power after outages, including the
administrative costs of handling complaints. Allowing for and assisting in the adoption of distributed
generation may increase customer satisfaction and result in fewer service complaints, both of which are in
energy providers’ best interest.
Additional Benefits
Grid resiliency
Grid resiliency reduces the amount of time customers go without power due to unplanned outages.
Resiliency may be achieved with: major generation, transmission, and distribution upgrades; load
reductions from distributed generation and energy efficiency; and new technologies, such as smart
meters that allow for real‐time data to be relayed back to grid operators. Distributed generation may
also improve grid resiliency to the extent that it is installed in conjunction with “micro‐grids” that have
the capacity to “island.”4 Valuing grid resiliency as a benefit is sometimes done using a “value of lost
3 U.S. Energy Information Administration (EIA). 2013. Form 923. 4 A micro‐grid is a group of interconnected loads and distributed energy resources within clearly defined electrical boundaries
that act as a single controllable entity with respect to the grid. A micro‐grid can connect and disconnect from the grid to enable it to operate fully connected to the grid or to separate a portion of load and generation from the rest of the grid system. To learn more about the micro‐grid, Synapse recommends these documents as primers:
http://energy.gov/sites/prod/files/2012%20Microgrid%20Workshop%20Report%2009102012.pdf
http://energy.pace.edu/sites/default/files/publications/Community%20Microgrids%20Report%20(2).pdf
http://nyssmartgrid.com/wp‐content/uploads/Microgrid_Primer_v18‐09‐06‐2013.pdf

Synapse Energy Economics, Inc. Net Metering in Mississippi 6
load” to determine how much customers would be willing to pay to avoid disruption to their electric
service (discussed later in this report).
Freedom of energy choice
The “right to self‐generate” or the freedom to reduce energy use, choose energy sources, and connect
to the grid is sometimes cited as a benefit of distributed generation. Some supporters of freedom of
energy choice assert that any barrier to self‐generation is an infringement of rights. Others take the
position that customers have no right to self‐generate unless they are disconnected from the grid.
Implementing a Net Metering Policy
States have made a variety of choices regarding several technical net metering issues that may have
important impacts on costs to ratepayers. The technical issues discussed in this section are metering,
treatment of “behind‐the‐meter” generation, treatment of net excess generation, third‐party
ownership, limits to installation sizes, caps to net metering penetration, “neighborhood” or
“community” net metering, virtual net metering, distribution company revenue recovery, and the value
of solar tariff.
Metering
Distributed generation resources are metered in one of three ways, depending on state requirements:
1. For customers with an electric meter that can “roll” forwards or backwards (measuring both electricity taken from the grid and electricity exported to the grid), distribution companies track only net consumption or generation of energy in a given billing cycle. Excess generation in some hours offsets consumption in other hours. If generation exceeds consumption within a billing cycle, the customer is a net energy producer. Because generation from some net metered facilities (particularly renewables) is subject to variability on hourly, monthly, and annual time scales, generation may exceed consumption in some months but be less than consumption in others. Distribution companies’ data on net consumption or production are limited by the frequency at which meters are monitored.
2. More advanced “smart” meters log moment‐by‐moment net consumption or generation at each customer site. With this type of meter, distribution companies may pay customers for excess generation using different rates for different hours.
3. Net metering facilities may also be installed with two separate meters: one for total electricity generation and one for total electricity consumption. Metered generation may be bought at a pre‐determined tariff rate while consumption is billed at the retail rate. It is also common to have a second meter installed for tracking solar generation for Solar Renewable Energy Credit (REC) tracking.
Treatment of “Behind‐the‐Meter” Generation
Net metered systems are typically attached to a host site, which has a load (and meter) associated with
it. During daylight hours on a net metered solar system:

Synapse Energy Economics, Inc. Net Metering in Mississippi 7
1. The host site’s load may exceed or be exactly equal to generation. In these hours, solar generation is entirely “behind the meter.” From the distribution company’s perspective, the effect of this generation is a reduction in retail sales (see Figure 1).
2. Generation may exceed the host site’s load. In these hours, solar generation is exported onto the grid. From the distribution company’s perspective, the effect of this generation is both a reduction in retail sales and an addition to generation resources (see Figure 2).
Figure 1. Illustrative example of net metered facility with demand greater than generation

Synapse Energy Economics, Inc. Net Metering in Mississippi 8
Figure 2. Illustrative example of net metered facility with excess generation
Typically, generation is considered behind the meter up to the point where a host load is exactly equal
to generation when summed over a typical billing period. Systems that are designed to accomplish this
are called Zero Net Energy Systems. While these systems, summed over the billing cycle, do not produce
any net excess generation, they do produce excess generation during some hours of the day and do,
therefore, utilize the grid.
Treatment of Net Excess Generation
Net excess generation is the portion of generation that exceeds the host’s load in a given billing period.
Some distributed resources (such as solar panels) will have net excess generation in some billing periods
but require net electricity sales from the distribution company in other periods. Host sites receive
payment for their net excess generation, but the value placed on this generation differs from state to
state. Participants are compensated for net excess generation in various ways. Examples of ways in
which participants are compensated include:
receiving the full retail rate as a credit on their monthly bill; these credits can roll over to future bills indefinitely
receiving the full retail rate as a credit on their monthly bill; these credits can roll over to future bills but for some finite period (typically one year) at which point they expire
receiving the full retail rate as a credit on their monthly bill; these credits can roll over to future bills indefinitely or the customer can choose to be paid out at the avoided cost rate

Synapse Energy Economics, Inc. Net Metering in Mississippi 9
receiving a pre‐determined rate (typically the avoided cost rate) as a credit on their monthly bill; these credits can roll over to future bills for a finite period (typically one year) at which point they expire
receiving a pre‐determined rate as a credit on their monthly bill, but with no set guarantee for how long they can roll over
receiving no payment at all
Third‐Party Ownership
Third‐party financing is the practice by which the host of the distributed energy system does not pay the
upfront costs to install the system and instead enters into a contract with a third party who owns the
system.5 Often structured through a power purchase agreement (PPA) or lease, third‐party financing
may increase access to distributed generation for households without access to other financing, or to
public entities that want to offset their electric bills with solar but cannot benefit from state or federal
tax incentives. With a PPA, the distributed generation is installed on the customer’s property by the
developer at no cost to the customer. The customer and the developer enter into an agreement in
which the customer purchases the energy generated by the solar panels at a fixed rate, typically below
the local retail rate. The distribution company experiences a reduction in retail sales but is not otherwise
involved. (Note that some municipal owned generators (“munis”) and electric co‐ops do not allow net
metering to be structured under a PPA with a third party.) With a solar lease, the customer enters into a
long‐term contract to lease the solar panels themselves, offsetting energy purchases and receiving
payment from the distribution company for excess net generation.
Contract language to address issues such as responsibility for maintenance, ownership of renewable
energy credits (RECs), and the risk for legislative or utility commission disallowance has been an area of
concern in some states. In the PPA structure, the developer takes on some of the responsibilities of a
provider and may need to be regulated by a public commission.
Limits to Installation Sizes
Most states have imposed limits on the size of installations eligible for net metering, often with different
limits for different customer classes, or for private versus public installations. Limits may be set in
absolute terms (a specific kW capacity limit) or as a percentage of historical peak load of the host site. In
some states, the de facto limit is actually smaller than the official limit because the size of the
installation is determined by policies other than net metering. For example, in Louisiana the legal limit to
5 The National Renewable Energy Laboratory put together an extensive report outlining third‐party PPAs and leasing:
http://www.nrel.gov/docs/fy10osti/46723.pdf.

Synapse Energy Economics, Inc. Net Metering in Mississippi 10
installations is 25 kW, but most installations are smaller than 6 kW due to a 50 percent tax rebate on
solar installations 6 kW or smaller.6
Caps to Net Metering Penetration
In most states, there are limits to how much net metered generation is allowed on the grid. Net
metering caps are commonly calculated as a share of each distribution company’s peak capacity. Munis
and co‐ops may or may not be subject to the same caps as utilities. To the extent that new investments
in transmission and distribution may be necessary with large‐scale penetration of distributed
generation, net metering caps keep the actual installation of distributed resources in line with the
planned roll out.
“Neighborhood” or “Community” Net Metering
Where neighborhood or community net metering is permitted, groups of residential customers pool
their resources to invest in a distributed generation system and jointly receive benefits from the system.
The system may be installed in a nearby parcel of land or on private property within the neighborhood
development. Multiple customers each invest a portion of the costs of installing the net metered facility
and each receive a proportional amount of the energy credits based on their respective investment.
Neighborhood net metering may make it possible for lower‐income communities or renters to invest in
renewable technologies that would otherwise be cost prohibitive.
Virtual Net Metering
Virtual net metering allows development of a net metered facility that is not on a piece of land
contiguous to the host’s historical load. The legal definition of virtual net metering differs from state to
state. The energy generated at the remote site is then “netted” against the customers’ monthly bill.
Virtual net metering may permit customers to take advantage of economies of scale, but there is
disagreement regarding how to differentiate a virtual net metering arrangement from a PURPA‐
regulated generator.
Distribution Company Revenue Recovery
Only one state, Hawaii, currently has solar capacity in excess of 5 percent of total capacity. In Hawaii,
solar represents 6.7 percent of total capacity; in New Jersey, 4.7 percent; in California, 2.7 percent; and
in Massachusetts, 2.3 percent. All other states have significantly less solar capacity as a share of total
capacity.7 Nonetheless, stakeholders in a number of states have begun drafting proposed legislation for
special monthly fixed charges, rate classes, and/or tariffs for solar net metered projects. Supporters of
6 Owens, D. 2014. “One Regulated Utility’s Perspective on Distributed Generation.” Presented at the 2014 Southeast Power
Summit, March 18, 2014. 7 National Renewable Energy Laboratory. “The Open PV Project.” Accessed June 3, 2014. Available at: openpv.nrel.gov.
Supplemented with Synapse research (see Table 4 of this report).

Synapse Energy Economics, Inc. Net Metering in Mississippi 11
the solar‐specific fixed charges and rate classes argue that these policies help prevent shifting costs from
those participating in net metering to those not participating. Special charges and rates may have the
effect of discouraging solar net metered development by increasing the cost and complexity of net
metering arrangements.
Value of Solar Tariff
A feed‐in tariff or a value‐of‐solar tariff is subtly different from net metering. Feed‐in tariffs are fixed
rate payments made to solar generators. The tariff amount is predetermined in dollars per kilowatt‐hour
and is typically valid for a fixed length of time. In states that have a solar feed‐in tariff (such as
Minnesota and Tennessee), solar generation is metered separately from the host’s demand. The host
gets paid for all electricity generated by the solar panels at the tariff rate and pays for all the electricity
consumed at the retail rate. Concerns raised regarding feed‐in tariffs for distributed generation include
the host’s tax liability and the need for periodic changes to the value of solar. Tariffs have the potential
to create stability in the financial forecasts for resource technologies, thereby lowering costs.
Rate Design Issues
Net metering raises several rate design issues related to cost sharing. In this section, we discuss cross‐
subsidization and fairness to distribution companies.
Cross‐Subsidization
Situations in which one group of people pays more for a good or service while a different group of
people pays less (or gets paid) for some related good or service are referred to as “cross‐subsidization.”
In situations of regressive cross‐subsidization, a lower income group pays more per unit of service and a
higher income group pays less per unit of service. Utility rate design and implementation are fraught
with opportunities for cross‐subsidization. There are three main ways that net metering can potentially
act as a cross‐subsidy: credit for compliance with renewable energy goals; federal tax subsidies; and cost
shifting in rate making.
Compliance with renewable energy goals
Most U.S. states have renewable energy goals or incentives. To meet their renewable energy goals,
energy providers pay renewable credits or certificates in addition to the wholesale price of energy.
Where net metered renewable facilities are eligible for these payments, there is a possibility of cross‐
subsidization. Since Mississippi does not have an RPS, tariff payments for renewables, or state tax
incentives for renewable energy, renewable energy incentives are not a likely pathway for cross‐
subsidization in the state.
Federal tax subsidies
The federal government currently offers investment tax credits (ITC) for wind, solar, and other
renewable energy resources. A small share of Mississippians’ federal income taxes, therefore, subsidizes
renewable energy generation. Given the relative lack of renewable energy development within the
Synapse Energy Economics, Inc. Net Metering in Mississippi 12
state, it is unlikely that the state is receiving its full share of federal funds for renewable energy
development, and possible that Mississippians are cross‐subsidizing renewable energy generation (at a
very small scale) in California, New Jersey, Massachusetts, and other states with relatively more
renewable energy development.
Cost shifting in rate making
Distributed generation reduces distribution companies’ total energy sales. With lower sales, distribution
companies’ fixed costs are spread across fewer kilowatt‐hours. The effect is a higher price charged for
each kilowatt‐hour sold. These costs are offset—at least in part—by the benefits that distributed
generation provides to the grid and to other ratepayers (as discussed above in the Avoided Costs section
of this memo). If all avoided costs are accurately and appropriately accounted for and the consumers are
paid an avoided cost rate, then there is no cost shifting because the costs to non‐participants (those
customers without distributed generation) are equal to the benefits to non‐participants. From a social
equity standpoint, this is important because net metering customers may have higher than average
incomes.8 Net metering customers should be paid for the value of their distributed generation, but non‐
participants should not bear an undue burden as a consequence of net metering. One strategy to help
mitigate the impact of cost shifting is to create opportunities for all income classes to participate in net
metering; this is sometimes achieved through community solar projects.
Fairness to Distribution Companies
Mississippi’s distribution companies reliably provide electricity to customers and are entitled to recover
a return on their investments. Policies that undermine their financial solvency have the potential to put
reliable electric generation and distribution at risk.
Reducing distribution company revenues
Distributed generation resources are sometimes viewed as being in competition with providers because
they reduce retail sales and, therefore, reduce distribution companies’ revenues. Reduced sales will
eventually cause providers to apply for rate increases so that they can recoup their expenses over the
new (lower) projected sales forecast. Higher electric rates make distributed energy and energy efficiency
a better investment, and may lead to deeper penetration of these resources, further reducing retail
sales. This feedback scenario has become known as the “utility death spiral.” Arguments are made both
that net metering (together with energy efficiency) may put providers out of business, and that the
effect of net metering on providers’ revenues is actually negligible. Distributed generation’s share of
8 Langheim, R., et. al. 2014. “Energy Efficiency Motivations and Actions of California Solar Homeowners.” Presented at the ACEE
2014 Sumer Study on Energy Efficiency in Buildings. August 17‐22, 2014. Available at: http://energycenter.org/sites/default/files/docs/nav/policy/research‐and‐reports/Energy%20Efficiency%20Motivations%20and%20Actions%20of%20California%20Solar%20Homeowners.pdf. See also: Hernandez, M. 2013. “Solar Power to the People: The Rise of Rooftop Solar Among the Middle Class.” Center for American Progress. October 21, 2013. Available at: http://www.americanprogress.org/issues/green/report/2013/10/21/76013/solar‐power‐to‐the‐people‐the‐rise‐of‐rooftop‐solar‐among‐the‐middle‐class/

Synapse Energy Economics, Inc. Net Metering in Mississippi 13
total generation is a key factor in understanding these impacts. Mississippi had less than 0.01 percent of
its customers participate in distributed generation in 2013.9
Increasing distribution company costs
Distributed generation also has the potential to reduce distribution companies’ revenues by increasing
costs. The argument that net metered facilities impose costs when providers are forced to plan for and
manage excess generation, again, depends on the share of distributed generation resources out of total
generation or the concentration of distributed resources in small, local areas. The share of distributed
generation necessary to impose additional costs on a provider likely depends on a number of factors
including (but not limited to) transmission and distribution infrastructure, the aggregate and individual
capacity of solar installations, local energy demand, and the demand load shape over the day and the
year.
Another potential cost issue for providers is the safety risk that rooftop solar panels may pose to utility
line workers. This is primarily a design and permitting issue: in the absence of the proper controls, a
utility worker could get electrocuted by excess generated from the solar panels.
2.2. Regional Context
Net Metering in the Region
As shown in Figure 3, as of July 2013 net metering policies had been implemented in 46 states and the
District of Columbia. Mississippi is one of four states that does not currently have any net metering
policies in place. The active docket to investigate establishing and implementing net metering and
interconnection standards for Mississippi is discussed below. Of those states immediately bordering
Mississippi, Louisiana and Arkansas have net metering policies, while Tennessee and Alabama do not.
9 Wesoff, E. 2014. “How Much Solar Can HECO and Oahu’s Grid Really Handle?” Greentech Media. Available at:
http://www.greentechmedia.com/articles/read/How‐Much‐Solar‐Can‐HECO‐and‐Oahus‐Grid‐Really‐Handle

Synapse Energy Economics, Inc. Net Metering in Mississippi 14
Figure 3. Net metering policy by state
Source: IREC and Vote Solar “Freeing the Grid” (2013, www.freeingthegrid.com)
The net metering policies of Louisiana and Arkansas are very similar: both states feature a 300 kW
maximum capacity for non‐residential customers and a 25 kW maximum for residential customers.
There is a 0.5 percent aggregate capacity limit in Louisiana,10 and net metered generators are
compensated at the retail rate with excess carried over indefinitely. There is no policy in Louisiana
regarding ownership of RECs sold to other states. Arkansas’ net metering customers face no aggregate
capacity limit, and while excess generation can be carried over indefinitely, only a limited quantity of
carry‐over is allowed. Arkansas’ net metering payments are at the retail rate, and the customer retains
ownership of any RECs generated by the net metered facility.
Mississippi Docket 2011‐AD‐2
At its December 7, 2010 Open Meeting, the Mississippi Public Service Commission voted to open docket
2011‐AD‐2 in order to investigate establishing and implementing net metering and interconnection
standards for Mississippi. The Commission has called for a three‐phase proceeding:
1. Identify specific issues that should be addressed in the rule and what procedures should be used
to solicit input from interested parties;
2. If the Commission chooses to proceed, develop a Proposed Rule; and finally,
3. Use traditional rulemaking procedures to establish net metering process, eligibility, and rates.
10 Entergy New Orleans has no aggregate capacity limit.
Has no net metering policy
Has net metering policy
DC

Synapse Energy Economics, Inc. Net Metering in Mississippi 15
All three phases allow for interveners.
Renewable Energy Policies in the Region
States pursue a variety of channels to encourage increased renewable energy generation. Perhaps the
most commonly discussed state‐level renewable energy policy is the RPS, a policy that requires
distribution companies within the state to procure an increasing number of RECs, inducing a demand for
renewably generated energy. While 29 states, 2 territories, and the District of Columbia have binding
RPS policies in place and an additional 7 states have formal, non‐binding RPS goals, neither Mississippi
nor any of its 4 surrounding states have such a policy. Louisiana has implemented a Renewable Energy
Pilot Program to study whether a RPS is suitable for Louisiana.
The Tennessee Valley Authority (TVA), operating in nearly all of Tennessee and smaller portions of
Mississippi, Alabama, Georgia, North Carolina, and Kentucky, does not have an RPS policy but does have
a number of policies to encourage the procurement of renewably generated electricity, including TVA
Green Power Providers, a feed‐in tariff 20‐year contract that pays generators an above‐market price for
energy. TVA's Green Power Providers program offers customers of TVA and participating munis and co‐
ops within the TVA corporation's territory the opportunity to enter into a 20‐year purchase agreement
for distributed, small‐scale renewably generated electricity. Eligible residential and non‐residential
customers can install solar, wind, biomass, or hydro generators sized between 0.5 kW and 50 kW,
subject to the additional size constraint that the expected annual generation does not exceed the
expected demand of the customer at that site. TVA will pay the customer's retail rate for the generated
electricity, plus an additional 3‐4 cents per kWh for the first 10 years of the contract.11 There are 18
distributor participants in Alabama, 14 in Georgia, 18 in Mississippi, 3 in North Carolina, 78 in Tennessee,
and 1 in Virginia.12
There are a number of tax benefits available for renewable generation installations in the region,
including both corporate and personal tax credits and property tax incentives in Louisiana for solar
installations; property and sales tax incentives for installing wind, solar, biomass, and geothermal
generators in Tennessee; and tax subsidies for switching from gas or electric to wood‐fueled space
heating in Alabama. Large tax incentives and government loans exist for the siting of substantial
renewable generator manufacturing facilities in Mississippi, Arkansas, and Tennessee.
Subsidized loans are another common renewable policy mechanism, allowing for favorable lending
conditions for the purchase and installation of renewable generation. Louisiana lends money to
residential customers, and Alabama and Mississippi lend to commercial, industrial, and institutional
customers. Alabama also lends to local municipalities, and Arkansas lends to a variety of customers.
11 Tennessee Valley Authority. 2014. “2014 Green Power Providers (GPP) Update.” Available at:
http://www.tva.com/greenpowerswitch/providers/. 12 Tennessee Valley Authority. 2014. “Green Power Providers Participating Power Companies.” Available at:
http://www.tva.com/greenpowerswitch/providers/distributors.htm.

Synapse Energy Economics, Inc. Net Metering in Mississippi 16
Table 2 summarizes the region’s renewable energy policies.
Table 2. Renewable policies by state
Policy LA AR TN AL MS
Renewable Portfolio Standard Feed‐in Tariff TVA TVATax Incentives Incentives for Manufacturing Subsidized Loans
Solar Installations by State
Tracking all solar photovoltaic installations by state is not a simple exercise, though a variety of sources
attempt to measure capacity installed. This report relies on U.S. Solar Market Trends 2012,13 with the
results detailed in Table 3. According to this source, in 2012, Mississippi installed 0.1 MW of solar
photovoltaic capacity, which brought total capacity installed to 0.7 MW.
Table 3. Installed solar photovoltaic capacity by state
Incremental Installed Capacity, 2012
(MW) Cumulative Capacity Installed through
2012 (MW)
Louisiana 11.9 18.2
Arkansas 0.6 1.5
Tennessee 23.0 45.0
Alabama 0.6 1.1
Mississippi 0.1 0.7
2.3. Avoided Cost and Screening Tests Used in Mississippi
There is a precedent in Mississippi for using particular avoided cost and screening tests that may be
relevant to the quantification of the state’s avoided costs of net metering. The July 2013 Final Order
from Mississippi Docket No. 2010‐AD‐2 added Rule 29 to the Public Utility Rules of Practice and
Procedure related to Conservation and Energy Efficiency Programs, the purpose of which “is to promote
the efficient use of electricity and natural gas by implementing energy efficiency programs and
13 Sherwood, L. 2013. U.S. Solar Market Trends 2012. Interstate Renewable Energy Council. Appendix C.

Synapse Energy Economics, Inc. Net Metering in Mississippi 17
standards in Mississippi.”14 Section 105 of Rule 29 specifies the cost‐benefit tests to be used when
assessing all energy efficiency programs. There are four tests used within the context of Rule 29.15
The Total Resource Cost (TRC) test determines if the total costs of energy in the utility service
territory will decrease. In addition to including all the costs and benefits of the Program
Administrator Cost (PAC) test (described below), it also includes the benefits and costs to the
participant. One advantage of the TRC test is that the full incremental cost of the efficiency
measure is included, because both the portion paid by the utility and the portion paid by the
consumer is included.
The Program Administrator Cost (PAC) test, also known as the Utility Cost Test (UCT),
determines if the cost to the utility administrator will increase. This test includes all the energy
efficiency program implementation costs incurred by the utility as well as all the benefits
associated with avoided generation, transmission, and distribution costs. Because the test is
limited to costs and benefits incurred by the utility, the impacts measures are limited to those
that would eventually be charged to all customers through the revenue requirements. These
impacts include the costs to implement the efficiency programs borne by ratepayers and the
benefits of avoided supply‐side costs, both included in retail rates. This test provides an
indication of the direct impact of energy efficiency programs on average customer rates.
The Rate Impact Measure (RIM) determines if utility rates will increase. All tests express results
using net present value, and each provides analysis from a different viewpoint. The RIM
includes all costs and benefits associated with the PAC test, but also includes lost revenue as a
cost. The lost revenue, equal to displaced sales times average retail rate, is typically significant.
The Participant Cost Test (PCT) measures the benefits to the participants over the measure life.
This test measures a program’s economic attractiveness by comparing bill savings against the
incremental cost of the efficiency equipment, and can be used to set rebate levels and forecast
participation.
2.4. Mississippi Electricity Utilities and Fuel Mix
Just over 1.2 million Mississippi residents are served by Entergy in the west or Mississippi Power in the
southeast. The electricity delivered to northeastern Mississippians is almost entirely generated by the
Tennessee Valley Authority (TVA) and delivered by one of the 14 municipal entities or 14 cooperatives in
the region.16 Throughout the state are 26 not‐for‐profit cooperatives that collectively serve 1.8 million
14 Mississippi Public Service Commission, Final Order Adopting Rule, Docket No. 2010‐AD‐2. July 11, 2013. Original emphasis.
15 Descriptions of the four tests come from Malone et al. 2013. “Energy Efficiency Cost‐Effectiveness Tests (Appendix D).”
Readying Michigan to Make Good Energy Decisions: Energy Efficiency. Available at: http://michigan.gov/documents/energy/ee_report_441094_7.pdf.
16 TVA has seven directly served customers to which 4.5 billion kWh were sold in 2013. Available at:
http://www.tva.com/news/state/mississippi.htm.

Synapse Energy Economics, Inc. Net Metering in Mississippi 18
Mississippians. The service territories of Entergy, Mississippi Power, and the munis supplied by TVA are
shown on the map on the left in Figure 4; the service territories of all 26 cooperatives are shown on the
map on the right.
Figure 4. Mississippi electric utility maps
Source: Mississippi Development Authority, Electric Power Associations of Mississippi
Entergy and Mississippi Power are vertically integrated investor‐owned utilities. TVA is a generation and
transmission not‐for‐profit corporation owned by the United States government. While South
Mississippi Electric Power Association is a generation and transmission co‐op, the remaining 25
cooperatives are distribution electric power associations.
The primary fuel used for generating electricity in Mississippi is natural gas, accounting for
approximately half of electricity generated (see Figure 5). Coal and nuclear power make up the vast
majority of remaining generation, with about 3 percent attributable to wood and wood‐derived fuels. In

Synapse Energy Economics, Inc. Net Metering in Mississippi 19
2013, Mississippi withdrew 1.5 percent of the natural gas extracted in the United States17 and mined 0.4
percent of the short tons of coal extracted from U.S. soil.18
Figure 5. Mississippi electric generation fuel sources
Source: EIA Form 923 2008‐2012. Note: “Other” includes generation from oil, municipal solid waste, and other miscellaneous sources.
2.5. Growth of Solar in the United States
Though not the case in Mississippi, solar resources have gained prevalence in other parts of the United
States in recent years. U.S. solar installations have been growing rapidly over the past five years (see
Figure 6). State data on solar and net metered generation is scattered and often under‐reported. The
National Renewable Energy Laboratory (NREL) runs the OpenPV project, which attempts to track solar
projects of all sizes in all states. California, Hawaii, New Jersey, and Massachusetts have some of the
most developed net metering programs and some of the most aggressive state goals for distributed
solar. Based on NREL’s OpenPV project, these states have installed solar capacity equivalent to between
0.9 and 4.7 percent of their state’s generation capacity. Recognizing the lag in reporting, Synapse has
conducted additional research in Hawaii and in Massachusetts. Based on this research, solar penetration
in these states ranges from 2.3 and 6.7 percent (see Table 4).
17 Energy Information Administration. 2014. “Natural Gas Gross Withdrawals and Production.” Available at:
http://www.eia.gov/dnav/ng/ng_prod_sum_dcu_NUS_m.htm. 18 Energy Information Administration. June 30, 2014. Quarterly Coal Report. Table 2: Coal Production by State. Available at:
http://www.eia.gov/coal/production/quarterly/pdf/t2p01p1.pdf.

Synapse Energy Economics, Inc. Net Metering in Mississippi 20
Figure 6. U.S. cumulative solar distributed generation (MW)
Source: NREL’s OpenPV project (openpv.nrel.gov); 2013 and 2014 reporting is as yet incomplete
Table 4. NREL solar capacity for selected states, with and without Synapse corrections
Capacity (MW) % of State Capacity
Per NREL OpenPV Project 2014
With Synapse Supplemental Research
Per NREL OpenPV Project 2014
With Synapse Supplemental Research
MS 1 1 0.0% 0.0%
CA 2,055 2,055 2.7% 2.7%
HI 27 200 0.9% 6.7%
NJ 979 979 4.7% 4.7%
MA 244 350 1.6% 2.3%
Source: NREL’s OpenPV project (openpv.nrel.gov) and Synapse research
3. MODELING
Net metered generating facilities result in both benefits (primarily avoided costs) and costs, including
lost revenues to distribution companies and the expense of distributed generation equipment. Our
quantitative analysis of a net metering policy for Mississippi provides benefit and cost estimates at the
state level to provide policy guidance for Mississippi decision‐makers and to help establish a protocol for
measuring the benefits and costs of net metering for use in distribution company compliance. The costs
and benefits outlined in this report provide a framework for that discussion.

Synapse Energy Economics, Inc. Net Metering in Mississippi 21
In the event that a net metering policy is adopted, distribution companies will likely be required to use
their detailed, often proprietary data along with the long‐term production cost models that they have at
their disposal to measure benefits and costs specific to each company. Such modeling requires detailed
forecasts of energy fuel prices, capacity, transmission, and distribution needs, as well as the expected
costs of compliance with environmental regulations.
3.1. Modeling Assumptions
Our benefit and cost analysis is limited along the following dimensions:
Modeling years: One‐year time steps from 2015 to 2039, with results provided both on an annual and a 25‐year levelized basis. A 25‐year analysis was chosen to reflect typical effective lifespans of solar panels.
Technology used for net metering: Solar rooftop only.
Geographic resolution of analysis: The state of Mississippi on an aggregate basis; we do not address specific costs and benefits for Tennessee Valley Authority, Entergy Mississippi, Mississippi Power, SMEPA, or the co‐ops.
Source of generation: Energy demand within the state is assumed to be met by
resources within the state with energy balancing at the state level.19
Rate of net metering penetration: Net metering installations equivalent to 0.5 percent of historical peak load in 2015, which holds constant over the entire study period.
Data sources: We supplement Mississippi average and utility‐specific data with regional and national information regarding load growth, commodity prices, performance characteristics of existing power plants in Mississippi, and costs of generation equipment.
Marginal unit: Mississippi’s 2013 generation capacity includes 508 MW of natural gas‐
and petroleum oil‐based combustion turbines (CT).20 While these oil units do not
contribute a significant portion of Mississippi’s total energy generation, they do contribute to the state’s peaking capabilities. On aggregate, these peaking resources operated 335 days in 2013—most frequently during daylight hours—and had a similar aggregate load shape to potential solar resources (see Figure 7). Our benefit and cost analysis follows the assumption that gas and oil CT peaking resources will be on the margin when solar resources are available and, therefore, that solar net metered facilities will displace the use of these peaking resources. At the level of solar penetration explored in our analysis (0.5 percent), it is unlikely that solar resources will
19 It should be noted that this is a simplifying assumption, and that in reality each of the generation companies in Mississippi is
free to buy or sell electricity and capacity to other states. The three largest owners of generation capacity in the state—Entergy Mississippi, TVA, and MPC—are all part of entities that operate in other states.
20 EPA. 2012. Air Markets Program (AMP) Dataset.

Synapse Energy Economics, Inc. Net Metering in Mississippi 22
displace base load units. Our analysis includes an estimate of how much net metered solar generation is necessary to displace base load units.
Figure 7: Normalized average load shapes by fuel type, including estimated shape of solar
Source: (1) EPA. 2012. Air Markets Program (AMP) Dataset. (2) NREL. 2014. PVWatts® Calculator.
Size of installations: We assume that all solar net metered facilities will be designed to generate no excess generation in the course of a year. Because we are modeling on a state‐level basis for each year, annual solar generation from net metered facilities is equivalent to the behind‐the‐meter load reduction.
Solar capacity contribution: The amount solar panels will contribute to reducing peak load was determined by using a state‐specific effective load carrying capacity (ELCC). In 2006, NREL updated its study on the effective load carrying capability of photovoltaics in the United States. The analysis was done by using load data from various U.S. utilities and “time‐coincident output of photovoltaic installations simulated from high
resolution, time/site‐specific satellite data.”21 The report provides the ELCC for several
types of solar panels and at varying degrees of solar penetration. Synapse used the values corresponding to 2 percent solar penetration (the lowest value provided in the report) and the average of three types of panels (horizontal, south‐facing, and southwest‐facing). The resulting assumed solar capacity contribution is 58 percent.
Solar hourly data and capacity factor: NREL’s Renewable Resource Data Center developed the PVWatts® Calculator as a way to estimate electricity generation and
21 Perez, R., R. Margolis, M. Kmiecik, M. Schwab, M. Perez. 2006. Update: Effective Load‐Carrying Capability of Photovoltaics in
the United States. Prepared for the National Renewable Energy Laboratory. Available at: http://www.nrel.gov/docs/fy06osti/40068.pdf.

Synapse Energy Economics, Inc. Net Metering in Mississippi 23
performance of roof‐ or ground‐mounted solar facilities. The calculator, which uses geographically specific data, provides hour‐by‐hour data including irradiance, DC output, and AC output. PVWatts® only had one location in Mississippi—Meridian—and this was used as a sample for our hourly data and to calculate a capacity factor. The calculated capacity factor, used in all of the calculations in this analysis, is 14.5 percent.
3.2. Model Inputs: General
Fuel Price Forecast
Our model assumes that net metered solar rooftop generation displaces oil‐ and natural gas‐fired units.
Consequently, fuel cost forecasts are a critical driver of avoided energy costs. The model uses fuel data
price forecasts from AEO 2014 specific to the East South Central region (see Figure 8 and Figure 9). Our
Mid case is the AEO Reference case, and our Low and High case values are the AEO 2014 High Economic
Growth and Low Economic Growth cases, respectively.
Figure 8. East South Central diesel fuel oil price forecasts
Source: AEO 2014 Table 3.6. Energy Prices by Sector and Source ‐ East South Central; Reference Case, High Economic Growth
Case, and Low Economic Growth Case

Synapse Energy Economics, Inc. Net Metering in Mississippi 24
Figure 9. East South Central natural gas price forecasts
Source: AEO 2014 Table 3.6. Energy Prices by Sector and Source ‐ East South Central; Reference Case, High Economic Growth
Case, and Low Economic Growth Case
Capacity Value Forecast
Mississippi’s in‐state energy resources comprised 17,542 MW of capacity in 2012,22 serving an in‐state
peak demand of 9,400 MW along with significant out‐of‐state demand.23 Even with the 582 MW Kemper
IGCC plant scheduled to come online in 2015, additional capacity may still have a positive value in the
future as Mississippi and its neighbors respond to expected environmental regulations. For example, in
its 2012 planning document, Entergy identified a system‐wide need for up to 3.3 GW of capacity in its
reference load forecast.24 Incremental capacity has the potential to serve other states in the service
territories of distribution companies operating in Mississippi
The value of capacity is the opportunity cost of selling it to another entity that needs additional capacity
for reliability purposes. For companies participating in capacity markets (such as MISO, PJM, and ISO
New England), the value of capacity is determined by the clearing price. The most recent MISO South
Reliability Pricing Model (RPM) Base Residual Auction (BRA) capacity market cleared at $16 per MW‐day.
22 EIA. 2012. EIA 860 2012. Available at: http://www.eia.gov/electricity/data/eia860/xls/eia8602012.zip.
23 EIA. 2013. Air Markets Program Dataset, hourly 2013 for Mississippi. Available at: http://ampd.epa.gov/ampd.
24 Entergy. 2012. 2012 Integrated Resource Plan: Entergy System. Available at:
https://spofossil.entergy.com/ENTRFP/SEND/2012Rfp/Documents/2012%20System%20IRP%20Report%20‐%20Final%2002Oct2012.pdf.

Synapse Energy Economics, Inc. Net Metering in Mississippi 25
To approximate the value of capacity in Mississippi, Synapse formulated three capacity value projections
(see Figure 10). In these projections, gross cost of new entry (CONE) was calculated as the 25‐year
levelized cost of a new NGCC, and net CONE was calculated based on the ratio of net CONE to gross
CONE observed in PJM reliability calculations (0.84).25 In the Low case, the capacity value stays at the
2014/2015 MISO South BRA clearing price of $6 per kW‐year. For the Mid case, the capacity value
escalates linearly to a net CONE of $57 per kW‐year by 2030. In the High case, the capacity value rises to
the estimated net CONE value of $57 per kW‐year by 2020, where it remains for the rest of the study
period. These projections do not represent Synapse estimates of future MISO South BRA clearing
prices26; rather, they approximate values suitable for estimating benefits and performing sensitivity
analyses.
Figure 10. Inputs for avoided capacity cost sensitivities
25 PJM Planning Period Parameters 2017‐2018. Available at: http://pjm.com/~/media/markets‐ops/rpm/rpm‐auction‐
info/2017‐2018‐planning‐period‐parameters.ashx. MISO calculates gross CONE but not net CONE. 26 "MISO Clears 136,912 MW in Annual Capacity Auction" Electric Light & Power, April 15, 2014.
http://www.elp.com/articles/2014/04/miso‐clears‐136‐912‐mw‐in‐annual‐capacity‐auction.html

Synapse Energy Economics, Inc. Net Metering in Mississippi 26
CO2 Price Forecast
Synapse has developed a carbon dioxide (CO2) price forecast specifically for use in utility planning.27 The
Synapse CO2 forecast is developed through analysis and consideration of the latest information on
federal and state policymaking and the cost of pollution abatement.28 Because there is inherent
uncertainty in those regulations, the Synapse forecast is provided as High, Mid and Low cases, as
illustrated in Figure 11. In this analysis, the Synapse Mid case was used for the policy reference case
while the High and Low cases were used in sensitivity analyses.
Figure 11. Synapse high, mid, and low CO2 price forecasts.
3.3. Model Inputs: Benefits of Net Metering
Generation from rooftop solar panels in Mississippi will displace generation from the state’s CT peaking
resources, thereby avoiding: these resources’ future operating costs, the cost of compliance with certain
environmental regulations, and the need for additional capacity resources.
27 Luckow, P., E. A Stanton, B. Biewald, J. Fisher, F. Ackerman, E. Hausman. 2013. 2013 Synapse Carbon Dioxide Price Forecast.
Synapse Energy Economics. Available at: http://synapse‐energy.com/project/synapse‐carbon‐dioxide‐price‐forecast. 28 Luckow, P., J. Daniel, S. Fields, E. A. Stanton, B. Biewald. 2014. “CO2 Price Forecast.” EM Magazine. Available at:
http://www.synapse‐energy.com/Downloads/SynapsePaper.2014‐06.0.EM‐Price‐Forecast.A0040.pdf.

Synapse Energy Economics, Inc. Net Metering in Mississippi 27
Avoided Energy Costs
The avoided energy costs include all fuel, variable operation and maintenance, emission allowances, and
wheeling charges associated with the marginal unit (in our analysis, a blend of oil and gas combustion
turbines).
Because fuel is a driving factor in the value of avoided energy costs, we made distinct short‐ and long‐
run assumptions regarding the fuel mix of peaking resources. We assumed the 2013 mix in year 2015
(approximately 25 percent oil and 75 percent natural gas), and a linear transition to 100 percent natural
gas use in peaking units by 2020.
Avoided energy costs are estimated by multiplying the per MWh variable operating and fuel costs of the
marginal resource by the projected MWh of solar generation in each modeled year.29 AEO’s 2014
Electric Market Module reports that the variable operation and maintenance for an oil CT is $15.67 per
MWh, and for a NGCT it is $10.52 per MWh.30 For fuel costs, we used the AEO 2014 data to project costs
on an MMBtu basis and unit heat rates to convert to fuel costs on a dollars per MWh basis. Our analysis
calculated the heat rates of fossil fuel units in Mississippi using data available from EPA’s Air Markets
Program. From this dataset, we calculated that the average in‐state oil‐fired unit (both steam and
combustion turbines) had an 11.89 MMBtu per MWh heat rate and that the average natural gas‐fired
combustion turbine was 10.41 MMBtu per MWh.
Capacity Value Benefits
In this analysis, capacity value benefits were calculated as the contribution of solar net metering
projects to increasing capacity availability within the state. For each year of the study period, we
calculated the total amount of installed solar capacity (in this analysis, 88 MW) and then calculated the
number of megawatts that contribute to peak load reduction by using the calculated Effective Load‐
Carrying Capability (ELCC) of 58 percent (88 MW × 58% = 51 MW of capacity contribution).31 We then
multiplied the capacity contribution by the capacity value in each year, and divided the total by the solar
generation of that year to yield a dollar per MWh value.
Avoided Transmission and Distribution Capital Costs
The avoided capital costs associated with transmission and distribution (T&D) are the contribution of a
distributed generation resource to deferring the addition of T&D resources. T&D investments are based
on load growth and general maintenance. Growth of both the system’s peak demand and energy
29 U.S. Energy Information Administration. 2014. Annual Energy Outlook 2014 (AEO 2014). Available at:
www.eia.gov/forecasts/aeo. 30 U.S. Energy Information Administration. 2014. AEO 2014 Electric Market Module. Table 8.2. Available at:
http://www.eia.gov/forecasts/aeo/assumptions/pdf/electricity.pdf. Converted to 2013 dollars. 31 Because distributed solar resources are a demand‐side resource, they reduce the load and energy requirements that the
distribution companies have to serve. The ELCC is used to translate how much the companies can expect peak load to be reduced as a result of distributed solar resources.

Synapse Energy Economics, Inc. Net Metering in Mississippi 28
requirements are reduced by the customer‐side generating resources (as it would be for other demand‐
side resources such as energy efficiency), and these costs can be avoided if the growth is counteracted
by the solar resources. General maintenance costs are not entirely avoidable but can be reduced by
distributed generation measures. For example, an aging 100‐MW cable might be replaced with a slightly
less expensive 85‐MW cable. The same holds for distribution system costs. For example, costs
associated with maintaining or building new transformers and distribution buses at substations will be
lower if the peak demand at that substation is reduced.
In the absence of utility‐specific values for avoidable T&D costs, we use our in‐house database of
avoided T&D costs calculated for distributed generation and energy efficiency programs to provide a
reasonable estimate. The average avoided transmission value from this database is $33 per kW‐year and
the average avoided distribution value was $55 per kw‐year, for a combined avoided T&D value of $88
per kW‐year. This value is multiplied by the capacity contribution and divided by generation—the same
way the capacity benefit was—to yield an avoided T&D cost in dollars per MWh.
Synapse is aware of no long‐term avoided transmission and distribution (T&D) cost study that has been
conducted for those entities that operate in Mississippi for use in this analysis. Synapse has assembled a
clearinghouse of publicly available reports on avoided T&D costs. Our current database includes detailed
studies on avoided costs of T&D for over 20 utilities and distribution companies that serve California,
Connecticut, Oregon, Idaho, Massachusetts, New Hampshire, Maine, Rhode Island, Utah, Vermont,
Washington, Wyoming, and Manitoba.32 For our analysis, we developed a low, mid, and high estimate of
avoided T&D costs by first separating transmission and distribution costs and then converting all costs to
2013$ values. The low value for each category (transmission and distribution) was calculated by taking
the 25th percentile of reported values; the high value used the 75th percentile. The mid value was
calculated as an average of the reported values for each category. The values for each category were
then combined to develop an estimated avoided T&D cost.
32 The values in this database are consistent with a 2013 review of avoided T&D costs of distributed solar in New York, New
Jersey, Pennsylvania, Texas, Colorado, Arizona, and California. See: Hansen, L., V. Lacy, D. Glick. 2013. A Review of Solar PV Benefit and Cost Studies, 2nd Edition. Rocky Mountain Institute. Available at: www.rmi.org/elab_emPower.

Synapse Energy Economics, Inc. Net Metering in Mississippi 29
Figure 12. Avoided transmission and distribution costs
Avoided System Losses
Avoided system losses are the reduction or elimination of costs associated with line losses that occur as
energy from centralized generation resources is transmitted to load. Usually presented as a percent of kWh
generated, these losses vary by section of the T&D system and by time of day. The greatest losses tend to
occur on secondary distribution lines during peak hours, coincident with solar distribution generation.
To account for variation in line losses, our analysis estimates avoided system losses using a weighted average
of line losses during daylight hours. This value was calculated by weighing daylight line losses of each
Mississippi T&D system (Entergy Mississippi, Mississippi Power, and the rest of the state) in proportion to the
load each system serves. Our analysis incorporates Entergy‐ and Mississippi Power‐specific data for their T&D
systems. For the remainder of the state, including SMEPA, our analysis uses national average T&D system
losses adjusted to reflect losses during the hours when solar panels generate energy.33
Avoided system losses were calculated as the product of the weighted average system losses and the
projected generation from solar panels in each year in kWh multiplied by the avoided dollars per kWh energy
cost in that same year.
33 U.S. Energy Information Administration. 2014. “How much electricity is lost in transmission and distribution in the United
States?” EIA Website: Frequently Asked Questions. Available at: http://www.eia.gov/tools/faqs/faq.cfm?id=105&t=3. Updated May 7, 2014.

Synapse Energy Economics, Inc. Net Metering in Mississippi 30
Avoided Environmental Compliance Costs
Avoided environmental compliance costs are the reduction or elimination of costs that the marginal unit
would incur from various existing and reasonably expected environmental regulations. For oil and gas
CTs, these avoided environmental compliance costs are primarily associated with avoided CO2
emissions.34
Mississippi’s distribution companies have used a price for CO2 emissions in their planning for many
years. For the Kemper IGCC project, analysts included the impacts of “existing, moderate, and
significant” future carbon regulations in their economic justification for the project.35 Entergy developed
a system‐wide Integrated Resource Plan (IRP) for all six Entergy operating companies, including Entergy
Mississippi, which modeled a CO2 price in its reference case.36 Tennessee Valley Authority’s most recent
finalized IRP also incorporates a CO2 price in seven of its eight scenarios developed for that IRP.37 Our
benefit and cost analysis uses the Synapse Mid case in our avoided environmental compliance
estimation. The Synapse Mid case forecasts a carbon price that begins in 2020 at $15 per ton, and
increases to $60 per ton in 2040.38
Avoided Risk
There are a number of risk reduction benefits of renewable generation (and energy efficiency) from
both central stations and distributed sources. The difficulties in assigning a value to these benefits lie in
(1) quantifying the risks, (2) identifying the risk reduction effects of the resources, and (3) quantifying
those risk reduction benefits. Increased electric generation from distributed solar resources will reduce
Mississippi ratepayers’ overall risk exposure by reducing or eliminating risks associated with
transmission costs, T&D losses, fuel prices, and other costs. Increasing distributed solar electricity’s
contribution to the state’s energy portfolio also helps shift project cost risks away from the utility (and
subsequently the ratepayers) and onto private‐sector solar project developers.
The most common practical approach to risk‐reduction‐benefit estimation has been to apply some
adder (adjustment factor) to avoided costs rather than to attempt a detailed technical analysis. There is,
however, little consensus in the field as to what the value of that adder should be. Current heuristic
practice would support a 10 percent adder to the avoided costs of renewables such as solar. There are
34 For more information on this topic see: Wilson, R., Biewald, B. June 2013. Best Practices in Electric Utility Integrated Resource
Planning. Synapse Energy Economics for the Regulatory Assistance Project. Available at: www.raponline.org/document/download/id/6608.
35 URS Corporation. March 7, 2014. IM Prudence Report, Mississippi Public Service Commission Kempler IGCC Project.
36 Entergy. 2012. 2012 Integrated Resource Plan, Entergy System. Available at:
https://spofossil.entergy.com/ENTRFP/SEND/2012Rfp/Documents/2012%20System%20IRP%20Report%20‐%20Final%2002Oct2012.pdf.
37 Tennessee Valley Authority. 2011. Integrated Resource Plan: TVA’s Energy and Environmental Future. Available at:
http://www.tva.com/environment/reports/irp/archive/pdf/Final_IRP_Ch6.pdf. 38 Luckow, P., E.A. Stanton, B. Biewald, J. Fisher, F. Ackerman, E. Hausman. 2013. 2013 Carbon Dioxide Price Forecast. Synapse
Energy Economics. Available at: http://synapse‐energy.com/project/synapse‐carbon‐dioxide‐price‐forecast.

Synapse Energy Economics, Inc. Net Metering in Mississippi 31
both more avoided costs and risk reduction benefits associated with distribution generation; thus, one
would expect greater absolute risk reduction benefits with distributed generation. Based on this, we
applied a 10 percent avoided risk adder when calculating avoided costs in this analysis. For more
information on the value of avoided risk and the literature review of current practices, see Appendix A
of this report.
3.4. Model Inputs: Costs
Net metered solar facilities will also result in some costs: reduced revenue to distribution companies
and administrative costs. We assume that net metered resources in Mississippi will both reduce retail
sales with their behind‐the‐meter generation and be compensated for their net energy generation.
Customer Perspective Modeling
CREST Model
In order to model costs and benefits, our analysis required the assumption that some solar net metered
projects would be developed. However, it is entirely possible that, depending on the net metering
policy, net metering would not experience widespread adoption in Mississippi. In order to determine
the likelihood of customers in Mississippi adopting rooftop solar, we estimated the financial impacts of
installing rooftop solar in Mississippi using the Cost of Renewable Energy Spreadsheet Tool (CREST)
model to estimate the cost of rooftop photovoltaic projects in Mississippi and estimate the subsidies
required to allow them to earn a competitive rate of return.39 Developed for the National Renewable
Energy Laboratory, CREST is a cash‐flow model designed to evaluate project‐based economics and
design cost‐based incentives for renewable energy.
Model Assumptions and Inputs
Using the CREST model, we analyzed residential‐scale photovoltaic projects (assumed to be 5 kW in size)
and commercial projects (500 kW). We assumed that all projects are developed and owned by the
building owner. Projects are assumed to be developed in 2015; therefore, the effects of the 30 percent
federal Investment Tax Credit (ITC) are included. Table 5 reports the inputs used in our CREST analysis.
The installed cost of photovoltaic projects continues to fall rapidly across the country, and it is difficult
to discern current average project costs. Carefully reviewed datasets tend to appear a year or two after
the fact, and information in the press or released by project developers often focuses on selected data
points that are not representative of industry averages. Our assumed project costs, shown in Table 5,
are based on ongoing review of data from government agencies and energy labs, solar industry trade
39 National Renewable Energy Laboratory. 2011. “CREST Cost of Energy Models.” Retrieved August 1, 2014. Available at:
https://financere.nrel.gov/finance/content/crest‐cost‐energy‐models.

Synapse Energy Economics, Inc. Net Metering in Mississippi 32
groups, our work in proceedings before utility commissions, and discussions with photovoltaic project
developers.
Table 5. Inputs for photovoltaic costs analysis
Residential Projects Commercial Projects
Capital Costs ($/WDC) $4.00 $3.65
O&M ($/kW‐yr) $21.00 $20.00
Federal Tax Rate (%) 28% 34%
State Tax Rate (%) 5% 5%
Inflation rate 2% 2%
Insurance (% of capital costs) 0.3% 0.3%
Federal ITC (% of capital costs) 30% 30%
Debt (% of capital costs) 40% 40%
Debt Term (years) 15 15
Interest Rate (%) 4% 4%
After‐Tax Equity IRR (%) 0% 0%
We use a 0 percent return on equity to represent a project that exactly breaks even. Therefore, the
revenue requirement the model produces represents the lowest expected revenue that would cause a
rational building owner to proceed with the project. The revenue would cover all costs, including debt
service, by the end of the project’s 25‐year life. (The payback period would be 25 years.) We have
modeled projects in this way for ease of comparison with retail electricity rates. That is, where levelized,
forecasted rates are higher than the levelized costs, projects would expect to earn a return on equity
and have a shorter payback period. Where forecasted retail rates are lower, projects would be expected
to lose money. Table 6 shows the levelized cost of energy for each of the project types and the average
of the two values.
Table 6. The estimated levelized cost of energy from rooftop photovoltaic panels in Mississippi
Project type Levelized Cost ($/MWh)
Residential 142
Commercial 129
Average 135
Finally, note that the federal ITC is scheduled to fall to 10 percent in 2016. If this occurs, it is likely to
cause an elevation in levelized costs lasting several years, even as cost reductions continue on their
recent trajectory during this period.
As shown in Table 6, our analysis indicates that the expected cost of net metered rooftop solar in
Mississippi is $129 per MWh for commercial customers and $142 per MWh for residential customers
(see Table 6). From this we can reasonably expect that more capacity of solar will be installed by
commercial customers than residential; however, without additional information it is difficult to predict
the rate of adoption and the relative share of installations between these two sectors. As a simplifying
Synapse Energy Economics, Inc. Net Metering in Mississippi 33
assumption in the modeling presented in this report, we refer to the average of the commercial and
residential levelized cost of solar: $135 per MWh.
Administrative Costs
Because Mississippi currently has no net metering program, it was necessary to assume costs for
administering the program. We conducted research sampling data from other states with net metering
programs. The incremental costs associated with managing a net metering program in most states are
difficult to separate from other normal, everyday administrative costs. However, cost data is widely
available for many states’ energy efficiency programs. We estimate that the average utility spends
between 6 percent and 9 percent of energy efficiency program costs on administrative tasks, with the
average administrator spending 7.5 percent.40 This value includes program administration, marketing,
advertising, evaluation, and market research. Based on a limited dataset on estimated costs to manage
the net metering programs in California and Vermont and a comparison of those state’s respective
energy efficiency programs, we find that administering net metering programs tends to be less costly
than administering energy efficiency programs.
In 2012, Mississippi spent approximately $12 million on energy efficiency, of which approximately $0.9
million was spent on various administration costs like the ones discussed above. For our analysis, we
assumed a value of $0.9 million per year for administrative costs associated with net metering. These
costs would include front office administrative costs, handling permitting issues, and keeping track of
net metering installations. While these costs may not prove to perfectly reflect the experience
Mississippi may have, it represents a reasonable, first order approximation of those costs.
Reduced Revenue to Distribution Companies
Distribution companies’ kilowatt‐hour sales will be reduced by net metered generation. These reduced
revenues were calculated as the amount of energy generated by net metered facilities multiplied by the
weighted average retail rate. The analysis also reflects retail rate escalation that matches the anticipated
growth rate of natural gas and also includes a discussion of the impact of reduced revenues on rates and
on the financial solvency of distribution companies.41
40 Synapse reviewed 2012 energy efficiency annual reports in 22 states in order to gather program participant cost data from
states recognized by ACEEE as leaders in energy efficiency programs. For the purpose of this research, we have defined leading or high impact states as the top 15 states in the 2013 ACEEE State Energy Efficiency Scorecard in terms of annual savings as a percentage of retail sales or absolute annual energy savings in terms of total annual MWh savings. The 22 states that are leaders in one or both of these criteria are: Arizona, California, Connecticut, Florida, Hawaii, Illinois, Indiana, Iowa, Maine, Massachusetts, Michigan, Minnesota, New Jersey, New York, North Carolina, Ohio, Oregon, Pennsylvania, Rhode Island, Texas, Vermont, and Washington.
41 Utility lost revenues are not a new cost created by the net metered systems. Lost revenues are simply a result of the need to
recover existing costs spread out over fewer sales. The existing costs that might be recovered through rate increases as a result of lost revenues are (a) not caused by the efficiency program themselves, and (b) are not a new, incremental cost. In economic terms, these existing costs are called “sunk” costs. Sunk costs should not be used to assess future resource investments because they are incurred regardless of whether the future project is undertaken. Consequently, the application

Synapse Energy Economics, Inc. Net Metering in Mississippi 34
3.5. Literature Review of Costs and Benefits Not Monetized
Avoided Externality Costs
Externality costs are typically environmental damages incurred by society (over and above the amounts
“internalized” in allowance prices). Some states choose to consider the externality costs associated with
electricity generation in their policymaking and planning. Avoided externality costs from displaced air
emissions are a benefit to the state and can be considered in benefit and cost analysis without
necessarily including these non‐market costs in an avoided cost rate. For example, the Societal Cost Test
used by some states to screen energy efficiency measures includes avoided externality costs. In regions
and states where utility commissions consider externality costs in their determination of total societal
benefits, Synapse has used a value of $100 per metric ton of CO2 as an externality cost.42 We have not,
however, monetized avoided externality costs for Mississippi.
Avoided Grid Support Services Costs
Distributed generation may contribute to reduced or deferred costs associated with grid support,
including voltage control, reduced operating reserve requirements and reactive supply. Because most of
the studies to date have focused on operating reserve requirement, and those benefits are embedded in
our capacity benefits, our analysis does not include any additional avoided grid support services.
Avoided Outage Costs
Distributed generation facilities have the potential to help customers avoid outages if the facility is
allowed to island itself off of the grid and self‐generate during an outage event. For a cost‐benefit
analysis, the value of avoiding outages is typically represented by estimating a value of lost load (VOLL)
as the amount customers would be willing to pay to avoid interruption of their electric service. A study
conducted by London Economics International on behalf of ERCOT concluded that the VOLL for
residential customers was approximately $110 per MWh and was between $125 per MWh and $6,468
per MWh for commercial and industrial customers.43 An earlier literature review conducted for ISO New
of the RIM test is not valid for analyzing the efficacy of net metered or distributed resources as it is a violation of this important economic principle.
42 For example, see: Hornby, R. et al. 2013. Avoided Energy Supply Costs in New England: 2013 Report. Synapse Energy
Economics. Available at: http://synapse‐energy.com/project/avoided‐energy‐supply‐costs‐new‐england. 43 Frayer, J., S. Keane, J. Ng. 2013. Estimating the Value of Lost Load. Prepared by London Economics on behalf of the Electric
Reliability Council of Texas, Inc. Available at: http://www.ercot.com/content/gridinfo/resource/2014/mktanalysis/ERCOT_ValueofLostLoad_LiteratureReviewandMacroeconomic.pdf.

Synapse Energy Economics, Inc. Net Metering in Mississippi 35
England found values between $2,400 per MWh and $20,000 per MWh.44 Even if these values could be
adapted to Mississippi customers, there is not sufficient evidence to indicate the extent to which solar
net metering would improve reliability, and therefore these estimates cannot be translated into
monetizable benefits of net metering at this time.
Economic Development Benefits
In states with growing net metering programs, the siting, installation, and maintenance of solar panels is
an emergent industry. A recent Synapse study estimated the employment effects of investing in solar
projects in another rural state: Montana. The study found that, compared to other clean energy
technologies, small‐scale photovoltaic provides the most job‐years per average megawatt, as illustrated
in Figure 13.45 This level of detailed analysis was not conducted for Mississippi.
Figure 13. Average annual job impacts by resource per megawatt (20‐year period)
Source: Synapse and NREL JEDI Model (industry spending patterns), IMPLAN (industry multipliers).
Solar Integration Costs
Solar integration costs are the investments distribution companies make in order to incorporate
distributed resources into the grid. Typically, Synapse sees these costs escalate alongside increasing
44 Cramton, P., J. Lien. 2000. Value of Lost Load. Available at:
http://isone.org/committees/comm_wkgrps/inactive/rsvsrmoc_wkgrp/Literature_Survey_Value_of_Lost_Load.rtf. 45 Comings, T., et al. 2014. Employment Effects of Clean Energy Investments in Montana. Synapse Energy Economics for
Montana Environmental Information Center and Sierra Club. Available at: http://www.synapse‐energy.com/Downloads/SynapseReport.2014‐06.MEIC.Montana‐Clean‐Jobs.14‐041.pdf.

Synapse Energy Economics, Inc. Net Metering in Mississippi 36
penetration levels. Our literature review found very little substantiated evidence that there are
significant costs incurred by grid operators or distribution companies as a result of low levels of solar
distributed resources. In a 2013 net metering proceeding in Colorado, Xcel Energy released its analysis
for integrating distributed solar resources at a 2 percent penetration level. At that level, which is four
times the level of penetration estimated for our analysis in Mississippi, Xcel Energy concluded that solar
distributed generation would add a $2 per MWh cost to the system.46 A 2012 study performed by Clean
Power Research analyzing 15 percent penetration concluded that integration costs were about $23 per
MWh.47
4. MISSISSIPPI NET METERING POLICY CASE RESULTS
Our Mississippi net metering policy case is based on the “mid” or reference inputs discussed above.
4.1. Policy Case Benefits
We estimated the annual potential avoided costs associated with a representative solar net metering
program in Mississippi. Figure 14 demonstrates that the short‐run benefits of net metering are
dominated by avoided energy costs.
46 Xcel Energy Services, Inc. 2013. Costs and Benefits of Distributed Solar Generation on the Public Service Company of Colorado
System. Prepared in response to CPUC Decision No. C09‐1223. Page 41. Available at: http://votesolar.org/wp‐content/uploads/2013/12/11M‐426E_PSCo_DSG_StudyReport_052313.pdf.
47 Perez, R. et al. 2012. The Value of Distributed Solar Electric Generation to New Jersey and Pennsylvania. Clean Power
Research for Mid‐Atlantic Solar Energy Industries Association and Pennsylvania Solar Energy Industries Association. Available at: http://mseia.net/site/wp‐content/uploads/2012/05/MSEIA‐Final‐Benefits‐of‐Solar‐Report‐2012‐11‐01.pdf.

Synapse Energy Economics, Inc. Net Metering in Mississippi 37
Figure 14. Annual potential benefits (avoided costs) of solar net metering in Mississippi
Avoided energy costs start at over $100 per MWh and decline over the first five years due to a gradual
transition in the displaced marginal unit from a mix of oil and gas units to gas units alone. Because oil
units are the most expensive units to operate, the benefits of net metering decline as less energy from
oil units is displaced over time. Avoided capacity costs increase over the study period, rising from $3 per
MWh in 2015 up to $26 per MWh at the end of the study period, due to the assumed increase over time
in the value of capacity to Mississippi’s distribution companies. Avoided environmental costs begin in
2020, the first year for which the Synapse CO2 price forecast projects a non‐zero value.
Figure 15 illustrates avoided costs of a net metering program in Mississippi on a 25‐year levelized basis:
$170 per MWh. Avoided energy costs account for the largest share of levelized benefits ($81 per MWh),
followed by avoided T&D costs ($40 per MWh). The value associated with reduced risk is the third
largest benefit ($15 per MWh).
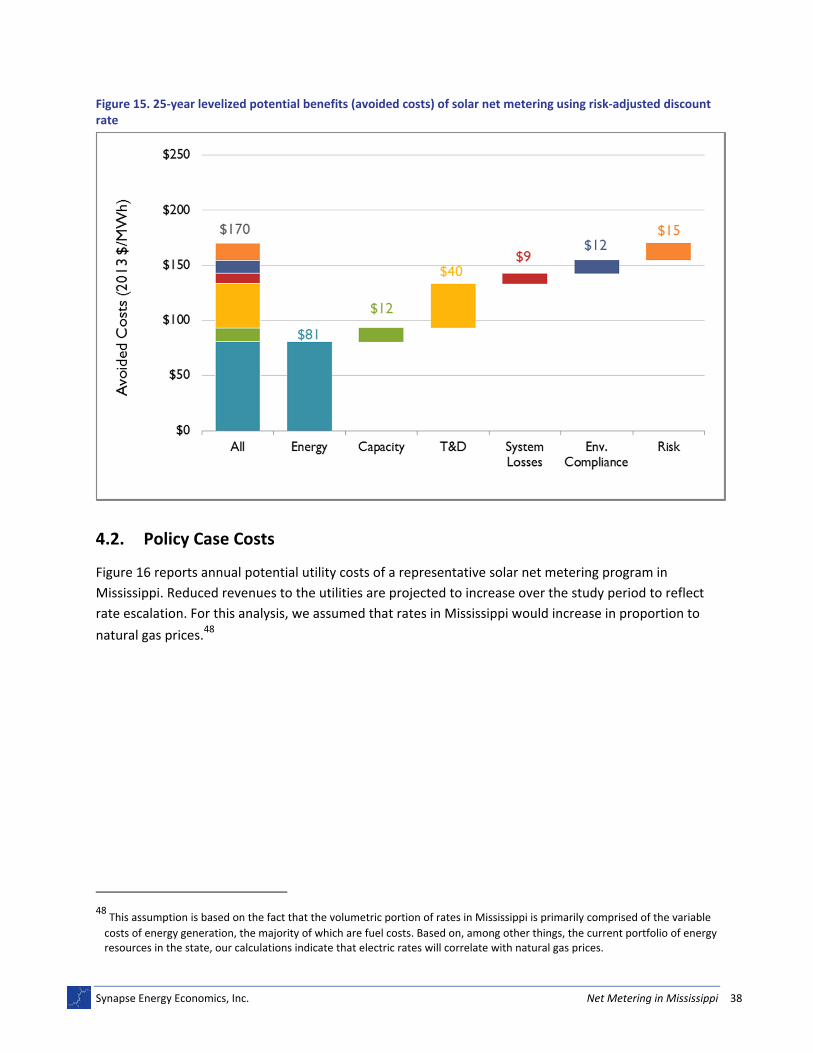
Synapse Energy Economics, Inc. Net Metering in Mississippi 38
Figure 15. 25‐year levelized potential benefits (avoided costs) of solar net metering using risk‐adjusted discount rate
4.2. Policy Case Costs
Figure 16 reports annual potential utility costs of a representative solar net metering program in
Mississippi. Reduced revenues to the utilities are projected to increase over the study period to reflect
rate escalation. For this analysis, we assumed that rates in Mississippi would increase in proportion to
natural gas prices.48
48 This assumption is based on the fact that the volumetric portion of rates in Mississippi is primarily comprised of the variable
costs of energy generation, the majority of which are fuel costs. Based on, among other things, the current portfolio of energy resources in the state, our calculations indicate that electric rates will correlate with natural gas prices.
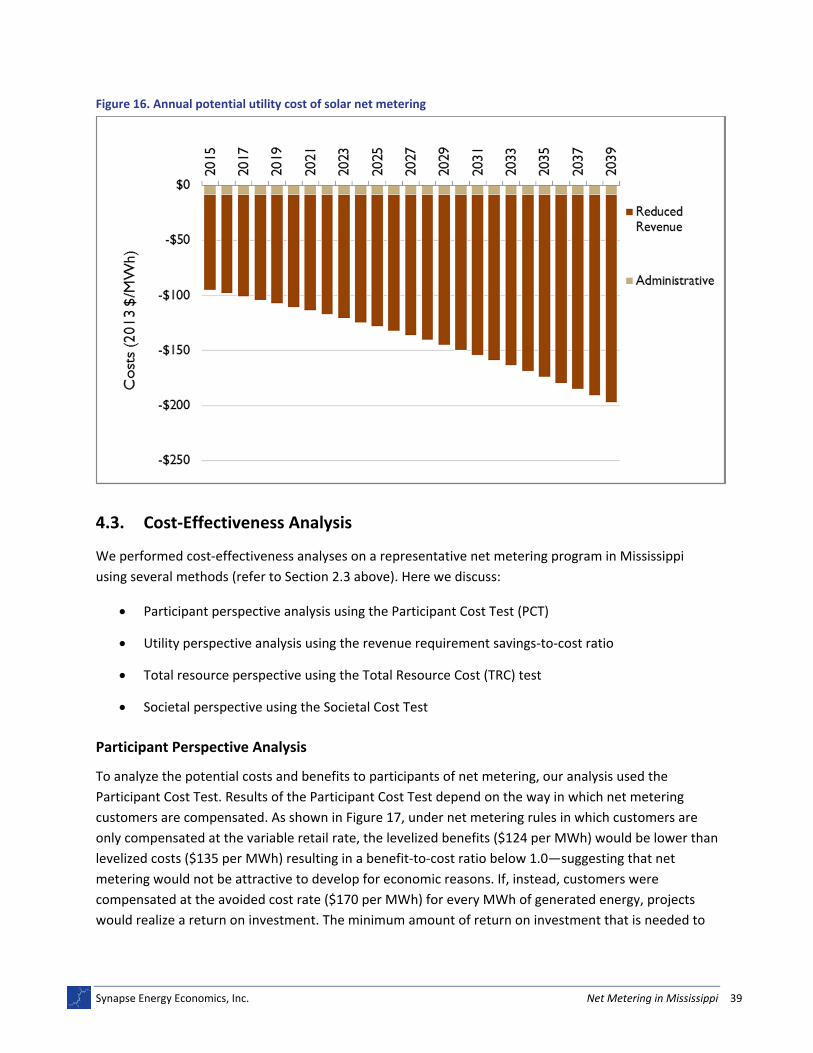
Synapse Energy Economics, Inc. Net Metering in Mississippi 39
Figure 16. Annual potential utility cost of solar net metering
4.3. Cost‐Effectiveness Analysis
We performed cost‐effectiveness analyses on a representative net metering program in Mississippi
using several methods (refer to Section 2.3 above). Here we discuss:
Participant perspective analysis using the Participant Cost Test (PCT)
Utility perspective analysis using the revenue requirement savings‐to‐cost ratio
Total resource perspective using the Total Resource Cost (TRC) test
Societal perspective using the Societal Cost Test
Participant Perspective Analysis
To analyze the potential costs and benefits to participants of net metering, our analysis used the
Participant Cost Test. Results of the Participant Cost Test depend on the way in which net metering
customers are compensated. As shown in Figure 17, under net metering rules in which customers are
only compensated at the variable retail rate, the levelized benefits ($124 per MWh) would be lower than
levelized costs ($135 per MWh) resulting in a benefit‐to‐cost ratio below 1.0—suggesting that net
metering would not be attractive to develop for economic reasons. If, instead, customers were
compensated at the avoided cost rate ($170 per MWh) for every MWh of generated energy, projects
would realize a return on investment. The minimum amount of return on investment that is needed to

Synapse Energy Economics, Inc. Net Metering in Mississippi 40
pursue a project is specific to the developer. A benefit‐cost ratio of 1.0 means that the developer breaks
even, which is unlikely to provide sufficient incentive to stimulate widespread adoption of net metering.
Figure 17. Levelized potential benefit/cost comparison under Participant Cost Test
As shown in Table 7, using the Participant Cost Test, under a net metering policy in which participants
are only compensated at the retail rate, solar net metering would have a benefit‐to‐cost ratio of 0.92. If
participants were paid the avoided costs, solar net metering would have a benefit‐to‐cost ratio of 1.26.
Table 7. Benefit‐cost ratio under the participant cost test
Compensated at retail rate
Compensated at avoided cost rate
B/C ratio 0.92 1.26
In order to determine what the 1.26 benefit‐to‐cost ratio would represent to a Mississippi ratepayer
looking to develop rooftop solar, we ran an additional CREST model run assuming the customer would
be compensated at the avoided cost rate for each unit of energy generated. If a solar net metered
project were compensated at $170 per MWh (which we estimated to be the avoided cost rate) for every
megawatt‐hour and not just excess generation, then that project might expect an approximate 3.5
percent return on equity.
The Participant Cost Test evaluates cost effectiveness from the net metering participant’s perspective.
As discussed above, our modeling for costs of solar include a 0‐percent return on investment such that a
benefit‐to‐cost ratio of 1.0 reflects “break even” conditions. The greater the benefit‐to‐cost ratio, the

Synapse Energy Economics, Inc. Net Metering in Mississippi 41
more likely that solar net metering projects will be developed. A benefit‐to‐cost ratio less than 1.0
represents a situation in which costs to the participant exceed benefits. It is possible that some
ratepayers in Mississippi might be willing to purchase solar net metering panels for reasons that are not
purely driven by a desire to make a return on investment; for example, they may value a lower emission
source of energy. One important caveat of the Participant Cost Test results shown in Table 7 is that no
benefits or cost related to change in property value as a result of installing solar panels are assumed. A
2011 Lawrence Berkeley National Laboratory analysis concluded that:
The research finds strong evidence that homes with PV systems in California have sold
for a premium over comparable homes without PV systems. More specifically, estimates
for average PV premiums range from approximately $3.9 to $6.4 per installed watt (DC)
among a large number of different model specifications, with most models coalescing
near $5.5/watt.49
A recent report conducted in Colorado by the Appraisal Institute, the nation’s largest professional
association of real estate appraisers, made a similar conclusion, stating, “solar photovoltaic systems
typically increase market value and almost always decrease marketing time of single‐family homes in the
Denver metropolitan area.”50 The extent to which the real estate market would reflect the trends
observed in California and Colorado is unclear. Moreover, according to a 2014 Sandia National
Laboratories report, real estate value impacts are affected by the photovoltaic ownership structure (if it
is leased or owned out right by the property owner).51 Consequently, this analysis omitted this potential
benefit of increased home value in the calculation of the benefit‐cost ratios.
Utility Perspective Analysis
Two tests, the Rate Impact Measure and the Utility Cost Test, are sometimes used to determine the cost
effectiveness of energy efficiency programs from the utility’s perspective. The only difference between
the RIM test and the UTC is the “lost revenues” (i.e., the reduction in the revenues as a result of reduced
consumption). If the utility is to be made financially neutral to the impacts of the energy efficiency
programs, then the utility would need to collect the lost revenues associated with the fixed cost portion
of current rates. If the utility were to recover these lost revenues over time, then we would expect to
observe an upward trend in future electricity rates.
One of the problems with the RIM test in the context of this study is that the lost revenues are not a
new cost created by the net metering programs. Lost revenues are simply a result of the need to recover
existing costs spread out over fewer sales. The existing costs that might be recovered through rate
49 Hoen, B. et. al. 2011. An Analysis of the Effects of Residential Photovoltaic Energy Systems on Home Sales Prices in California.
Lawrence Berkeley National Laboratory. Available at: http://emp.lbl.gov/sites/all/files/lbnl‐4476e.pdf. 50 Appraisal Institute. 2013. “Solar Electric Systems Positively Impact Home Values: Appraisal Institute.” Press release. Available
at: http://www.appraisalinstitute.org/solar‐electric‐systems‐positively‐impact‐home‐values‐appraisal‐institute‐/. 51 Klise G.T., J.L. Johnson. 2014. How PV System Ownership Can Impact the Market Value of Residential Homes. Sandia National
Laboratories. Available at: http://energy.sandia.gov/wp/wp‐content/gallery/uploads/SAND2014‐0239.pdf.

Synapse Energy Economics, Inc. Net Metering in Mississippi 42
increases as a result of lost revenues are (a) not caused by the efficiency program themselves, and (b)
are not a new, incremental cost. In economic terms, these existing costs are called “sunk” costs. Sunk
costs should not be used to assess future resource investments because they are incurred regardless of
whether the future project is undertaken. Application of the RIM test is a violation of this important
economic principle.
Another problem with the RIM test is that it frequently will not result in the lowest cost to customers.
Instead, it may lead to the lowest rates (all else being equal, and if the test is applied properly).
However, achieving the lowest rates is not the primary or sole goal of utility planning and regulation;
there are many goals that utilities and regulators must balance in planning the electricity system.
Maintaining low utility system costs, and therefore low customer bills on average, is often given priority
over minimizing rates. For most customers, the size of the electricity bills that they must pay is more
important than the rates underlying those bills.
Most importantly, the RIM test does not provide the specific information that utilities and regulators
need to assess the actual rate and equity impacts of energy efficiency or distributed generation. Such
information includes the impacts on long‐term average rates, the impacts on average customer bills,
and the extent to which customers participate in efficiency programs or install distributed generation
and thereby experience lower bills.
The Utility Cost Test provides some very useful information regarding the costs and benefits of energy
efficiency resources. In theory, the UCT should include all the costs and benefits to the utility system
over the long term, and therefore can provide a good indication of the extent to which average
customer bills are likely to be reduced as a result of distributed energy resources. However, when
applied to net metering, the results of the UTC are less indicative of how distributed generation will
impact customers, primarily due to the wide variety in market participants and financing methods
associated with distributed generation.
For these reasons, in this analysis we have chosen to use neither of these screening tests to investigate
the impacts of net metering from the utility perspective.
Instead, we use a revenue requirement savings‐to‐cost ratio as an indicator of whether or not a net
metering program will create upward or downward pressure on rates. Under a net metering policy
where generation is compensated at the retail rate, utilities “pay” for the energy at the retail rate and
receive a savings equivalent to the avoided cost rate. When the ratio, calculated by performing a 25‐
year levelization of avoided costs and dividing it by the 25‐year levelized variable rate, is above 1.0, this
indicates that there will be downward pressure on rates. When the ratio is below 1.0, it indicates that
there will be upward pressure on rates. The results of this analysis cannot be directly translated into a
rate or bill impact without additional analysis. Utility cost recovery and benefit sharing is dependent on
future rate cases, program design, commission rulings, market changes, and other factors. Had the
results of this test indicated that there would be upward pressure on rates, it would be necessary to
perform additional analysis on rate and bill impacts on participants and non‐participants in order to
determine what, if any, regressive cross‐subsidization was occurring.

Synapse Energy Economics, Inc. Net Metering in Mississippi 43
For the revenue requirement savings‐to‐cost ratio, our analysis used a discount rate that reflects the
utilities’ cost of capital; for this analysis, we assumed this to be a 6‐percent real discount rate. Use of this
higher discount rate does not materially change the value of the avoided costs on a levelized basis.
Under our policy reference case assumptions, over the 25‐year span of our analysis, the levelized savings
(avoided costs) outweigh the levelized costs (retail variable rate plus administrative costs), as illustrated
in Figure 18. This suggests that generation from net metering customers would put downward pressure
on rates.
Figure 18. Levelized potential benefit/cost comparison under revenue requirement cost benefit analysis
Total Resource Perspective
To determine the overall cost and benefits of a resource, this analysis employed the Total Resource Cost
test, which compares net economic costs and benefits for the state as a whole but excludes avoided
externality costs and economic development benefits. The test includes all of the avoided costs to the
utility as benefits. It would also include any non‐energy benefits as benefits if those could appropriately
be accounted for. For our analysis, the cost associated with installing the solar panels and the
administrative costs are the only costs reflected in our cost‐benefit analysis using the TRC test. The
analysis omits the potential for solar integration costs, as these are typically negligible at lower solar
penetration.
As illustrated in Figure 19, under the assumptions of our policy reference case, solar net metering would
provide net benefit to the state of Mississippi. With estimated benefits of $170 per MWh and estimated

Synapse Energy Economics, Inc. Net Metering in Mississippi 44
costs of $143 per MWh, net metered solar rooftop would result in $27 per MWh of net benefits to the
state and passes the TRC with a benefit‐to‐cost ratio of 1.19.
Figure 19. Levelized potential benefit/cost comparison under Total Resource Cost Test
Societal Perspective
As stated above, the Societal Cost Test would include all the benefits and costs of the TRC test, plus any
avoided externality costs and economic development benefits—including job creation and the potential
for increased home value—if those could appropriately be accounted for. Since this analysis did not
monetize these benefits (as explained in section 3.5), a Societal Cost Test benefit‐cost analysis was not
performed. Were these benefits included, the benefit‐to‐cost ratio would be higher than 1.19.
5. SENSITIVITY ANALYSES
We conducted sensitivity analyses—observing the impact of changing key modeling assumptions on our
results—for the following inputs: oil and gas prices, projected capacity value, avoided T&D costs, and
projected CO2 emissions costs. All are compared to our policy case scenario, in which all variables are
held at the Mid case.

Synapse Energy Economics, Inc. Net Metering in Mississippi 45
5.1. Fuel Prices
Adjusting for high or low fuel prices has only a minor impact on the potential benefits of solar net
metering, as illustrated in Figure 20. This figure also shows the levelized costs of solar for comparison.
Changing fuel costs assumptions impacts the avoided energy, the avoided system losses, and the
avoided risk benefits, with high fuel price assumptions resulting in increased benefits and low fuel price
assumptions resulting in lower benefits. All three cases—High, Mid, and Low—result in a TRC benefit‐to‐
cost ratio above 1.0, as shown in Table 8.
Figure 20. Results of fuel price sensitivities
Table 8. Avoided energy benefits and TRC test benefit/cost ratios under fuel price sensitivities
Low Mid High
Avoided Energy Benefit $78/MWh $81/MWh $83/MWh
Fuel Price Sensitivities 1.17 1.19 1.21
5.2. Capacity Values
Adjusting for a high or low forecast of capacity value has some impact on the potential benefits of solar
net metering, as illustrated in Figure 21. This figure also shows the levelized costs of solar for
comparison. Changing capacity value projections impacts the avoided capacity cost and avoided risk
benefits, with high capacity value projections resulting in increased benefits and low capacity value
projections resulting in lower benefits. All three cases—High, Mid, and Low—result in a TRC benefit to
cost ratio above 1.0, as shown in Table 9.

Synapse Energy Economics, Inc. Net Metering in Mississippi 46
Figure 21. Results of capacity value projection sensitivities
Table 9. Avoided capacity benefits and TRC test benefit/cost ratios under capacity value sensitivities
Capacity Value Sensitivities Low Mid High
Avoided Capacity Benefit $3/MWh $12/MWh $22/MWh
B/C Ratio under a TRC Test 1.11 1.19 1.26
5.3. Avoided T&D
Adjusting for high or low avoided T&D costs, which reflect the 25th and 75th percentile of our database of
avoided T&D costs, had the most noticeable impacts on the potential benefits of solar net metering, as
illustrated in Figure 22. Again, the figure shows the levelized costs of solar for comparison. Changing the
costs of T&D impacts the avoided T&D costs and the avoided risk benefits, with high capacity value
projections resulting in increased benefits and low capacity value projections resulting in lower benefits.
All three cases—High, Mid, and Low—result in a TRC benefit to cost ratio above 1.0, as shown in Table
10.

Synapse Energy Economics, Inc. Net Metering in Mississippi 47
Figure 22. Results of avoided T&D value sensitivities
Table 10. Avoided T&D benefits and TRC test benefit/cost ratios under avoided T&D cost sensitivities
Avoided T&D Sensitivities Low Mid High
Avoided T&D Benefits $18/MWh $40MWh $58/MWh
B/C Ratio under a TRC Test 1.01 1.19 1.32
5.4. CO2 Price Sensitivities
Adjusting for a high or low trajectory of CO2 emissions costs has some impact on the potential benefits
of solar net metering, as illustrated in Figure 23. This figure shows the levelized costs of solar for
comparison. Changing CO2 price forecasts impacts the avoided environmental compliance cost and
avoided risk benefits, with the high projection resulting in increased benefits and low projection
resulting in lower benefits. All three cases—High, Mid, and Low—result in a TRC benefit to cost ratio
above 1.0, as shown in Table 11.

Synapse Energy Economics, Inc. Net Metering in Mississippi 48
Figure 23. Results of CO2 forecast sensitivities
Table 11. Avoided environmental compliance costs and TRC benefit/cost ratios under CO2 cost sensitivities
CO2 Price Sensitivities Low Mid High
Avoided Environmental Compliance Costs $8/MWh $12/MWh $18/MWh
B/C Ratio under a TRC Test 1.16 1.19 1.24
5.5. Combined Sensitivities
We modeled two combined sensitivities scenarios: (1) each variable was set to the assumption that
would yield the lowest benefits for solar net metering; (2) each variable was set to the assumption that
would yield the highest benefits for solar net metering. The levelized results of this analysis are shown in
Figure 24.

Synapse Energy Economics, Inc. Net Metering in Mississippi 49
Figure 24. Results of scenario testing under combined sensitivities
As shown in Table 12, solar net metering passes the Total Resource Cost test in all but one of the
sensitivities described above.
Table 12. Summation of TRC Test benefit/cost ratios under various sensitivities
Low Mid High
Fuel Price Sensitivity 1.17 1.19 1.21
Capacity Value Sensitivities 1.11 1.19 1.26
Avoided T&D Sensitivities 1.01 1.19 1.32
CO2 Price Sensitivities 1.16 1.19 1.24
Combined Sensitivities 0.89 1.19 1.47
6. CONCLUSIONS
The analysis conducted and the results shown in this report reflect the potential costs and potential
benefits that an illustrative net metering program could provide to Mississippians. From a Total
Resource Cost perspective, solar net metered projects have the potential to provide a net benefit to
Mississippi in nearly every scenario and sensitivity analyzed. These benefits will only be realized if
customers invest in distributed generation resources. This may never happen if net metering
participants are not expected to receive a reasonable rate of return on investment. Based on the results
of the participant cost analysis, net metering participants in Mississippi would need to receive a rate

Synapse Energy Economics, Inc. Net Metering in Mississippi 50
beyond the average retail (variable) rate in order to pursue net metering. This suggests that Mississippi
may want to consider an alternative structure to any net metering program they choose to adopt. One
alternative structure would be to compensate distributed solar through a solar tariff structure similar to
the ones used in Minnesota and by TVA, and under consideration in Maine.52
By appropriately using a solar tariff structure, it would be possible to structure Mississippi’s proposed
net metering rules to allow net benefits for participants and prevent cost shifting to non‐participants. If
all avoided costs are accurately and appropriately accounted for and the consumers are paid an avoided
cost rate, then there is no cost shifting because the costs to non‐participants (those customers without
distributed generation) are equal to the benefits to non‐participants. Net metering customers should be
paid for the value of their distributed generation, but non‐participants should not bear an undue burden
as a consequence of net metering. This could be accomplished by compensating net metering customers
at the avoided cost rate through a tariff structure. If participants will be compensated at the avoided
cost rate, this value must be carefully calculated and updated periodically. The valuation process would
include a rigorous quantification and monetization of all of the benefits and costs we identified and
provided as preliminary estimates in this report.
52 The Maine Solar Energy Act, Sec. 1. 35‐A MRSA c. 34‐B Available here:
http://www.mainelegislature.org/legis/bills/bills_126th/billtexts/SP064401.asp
Synapse Energy Economics, Inc. Net Metering in Mississippi 51
APPENDIX A: VALUE OF AVOIDED RISK
The objective of this appendix is to review the current practices regarding the risk value used in avoided
cost analyses, primarily for distributed generation, and to recommend a reasonable value for a risk
adjustment factor to apply to the cost‐benefit analysis of distributed solar generation in Mississippi.
There are a number of risk reduction benefits of renewable generation (and energy efficiency), whether
those resources come from central stations or distributed sources. The difficulties in assigning a value to
these benefits lie in (1) quantifying the risks, (2) identifying the risk reduction effects of the resources,
and (3) quantifying those risk reduction benefits.
The most common practical approach has been to apply some adder (adjustment factor) to the avoided
costs rather than to attempt a more thorough technical analysis. However, there is little consensus in
the field as to what the value of that adder should be. Based on expert judgment and experience,
Synapse suggests a 10 percent adder be applied when calculating avoided costs for renewables such as
solar and wind. The literature review below demonstrates that there is wide variance in the range of
values used in practice.
Theoretical Framework
First, we will look at the types of avoided costs that might be associated with distributed generation. The
full range of possible benefits as identified in recent testimony by Rick Hornby in North Carolina is quite
extensive, as indicated by Table 13. Typically, distributed generation avoided costs are based on direct
costs that can be easily quantified, as indicated by “Yes” in the DG column below. In some situations,
attempts are made to assign values to hard‐to‐quantify categories, such as environmental, health, and
economic benefits. The table also indicates categories where there might be possible risk benefits
associated with these avoided costs. For example, renewable generation reduces the probability and
effects of energy price spikes, reducing risk in that category.
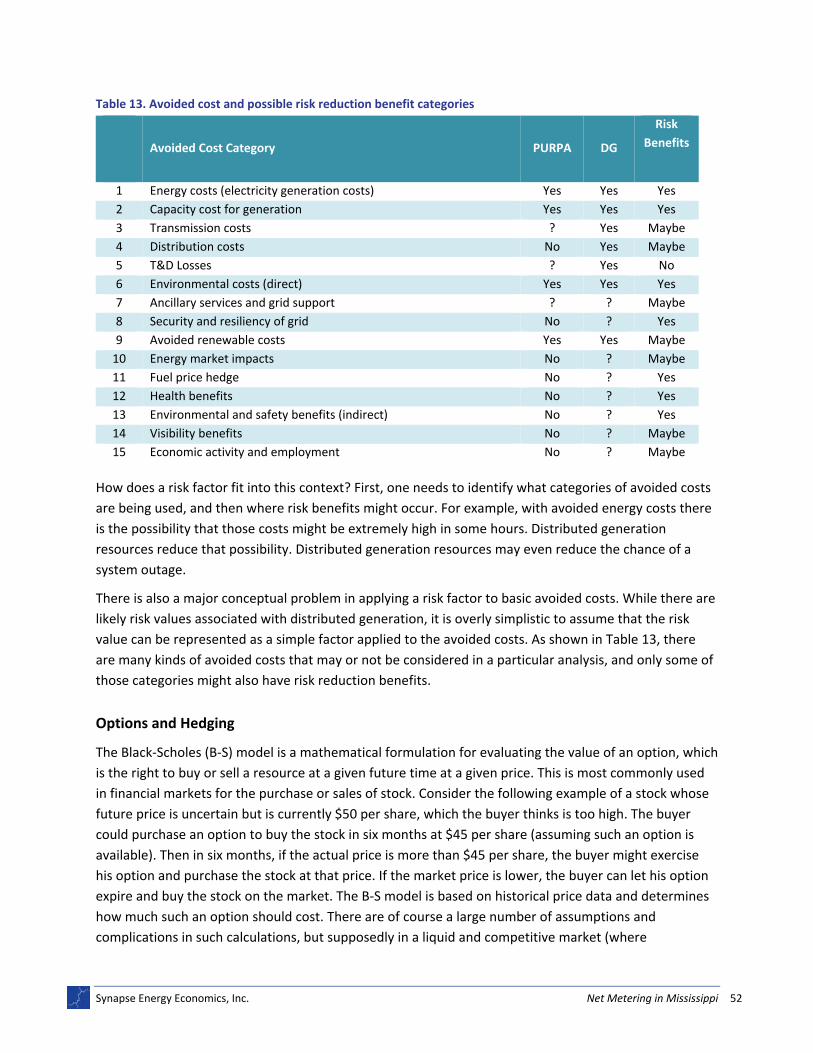
Synapse Energy Economics, Inc. Net Metering in Mississippi 52
Table 13. Avoided cost and possible risk reduction benefit categories
Avoided Cost Category PURPA DG
Risk
Benefits
1 Energy costs (electricity generation costs) Yes Yes Yes
2 Capacity cost for generation Yes Yes Yes
3 Transmission costs ? Yes Maybe
4 Distribution costs No Yes Maybe
5 T&D Losses ? Yes No
6 Environmental costs (direct) Yes Yes Yes
7 Ancillary services and grid support ? ? Maybe
8 Security and resiliency of grid No ? Yes
9 Avoided renewable costs Yes Yes Maybe
10 Energy market impacts No ? Maybe
11 Fuel price hedge No ? Yes
12 Health benefits No ? Yes
13 Environmental and safety benefits (indirect) No ? Yes
14 Visibility benefits No ? Maybe
15 Economic activity and employment No ? Maybe
How does a risk factor fit into this context? First, one needs to identify what categories of avoided costs
are being used, and then where risk benefits might occur. For example, with avoided energy costs there
is the possibility that those costs might be extremely high in some hours. Distributed generation
resources reduce that possibility. Distributed generation resources may even reduce the chance of a
system outage.
There is also a major conceptual problem in applying a risk factor to basic avoided costs. While there are
likely risk values associated with distributed generation, it is overly simplistic to assume that the risk
value can be represented as a simple factor applied to the avoided costs. As shown in Table 13, there
are many kinds of avoided costs that may or not be considered in a particular analysis, and only some of
those categories might also have risk reduction benefits.
Options and Hedging
The Black‐Scholes (B‐S) model is a mathematical formulation for evaluating the value of an option, which
is the right to buy or sell a resource at a given future time at a given price. This is most commonly used
in financial markets for the purchase or sales of stock. Consider the following example of a stock whose
future price is uncertain but is currently $50 per share, which the buyer thinks is too high. The buyer
could purchase an option to buy the stock in six months at $45 per share (assuming such an option is
available). Then in six months, if the actual price is more than $45 per share, the buyer might exercise
his option and purchase the stock at that price. If the market price is lower, the buyer can let his option
expire and buy the stock on the market. The B‐S model is based on historical price data and determines
how much such an option should cost. There are of course a large number of assumptions and
complications in such calculations, but supposedly in a liquid and competitive market (where

Synapse Energy Economics, Inc. Net Metering in Mississippi 53
participants know how to apply the B‐S model), the option price would have the B‐S value. Another issue
to consider is that the B‐S model tends to fail under unusual market situations, such as in the economic
recession of 2008.
In theory, one could apply this approach to the value of reducing energy price risk. Consider that the
expected future price of electricity is $100 per MWh, but the buyer wants to protect him‐ or herself
against it going above $110. The buyer could then purchase an option to buy at $110 per MWh 12
months from now. The cost of that option represents the cost of protection against all prices $110 and
greater at that point in time. However, option markets for electricity prices are uncommon and trading
is very thin.53 Options for natural gas products are much more active and can be used as an electricity
price hedge.54
One methodology that has been used in some analyses reviewed here is to calculate the hedge value of
a renewable or energy efficiency resource based on an imputed option value. This of course depends
strongly on the assumptions used, which have generally not been very transparent.
Let’s consider an example of how this might be implemented. Say that the avoided energy cost is
determined to be $50 per MWh, which represents the average of a range of possible values. Say
furthermore that one doesn’t care about modest price swings but is concerned about prices greater
than $75 per MWh. Then one could think of purchasing a call option with a strike price of $75, which
limits the price exposure to that price.55 The cost of that option represents the hedge value of a
resource that also eliminates that risk.
Futures Markets
Futures markets provide a way of hedging against changes in prices but lack the optional aspect. In a
futures market, one has an obligation to buy or sell at a certain price at a given future date. Supposedly
the futures price represents a balance between sellers who want to avoid a decline in prices and buyers
who want to avoid an increase in prices. Thus the risks are in balance and the price is at a neutral point.
Now if a buyer locks in a price there is the risk that the actual price is lower, but they are committed at a
higher price and thus experience a loss. But the expectation is that gains and losses balance out, at least
in the long term.
53 CME Group maintains an options market that includes PJM electricity products but only for about two years out, and trading
levels are zero for many product months. See: http://www.cmegroup.com/market‐data/settlements. 54 EIA uses short‐term natural gas energy options (which is a fairly robust market) to determine the confidence intervals for its
short term natural gas price forecast. See: http://www.eia.gov/forecasts/steo/report/natgas.cfm. 55 The closer to the expected price, the more expensive would such an option be. For example, a call option at the expected
price of $50 could easily be $5 or more based on risk associated with all the prices above that level.
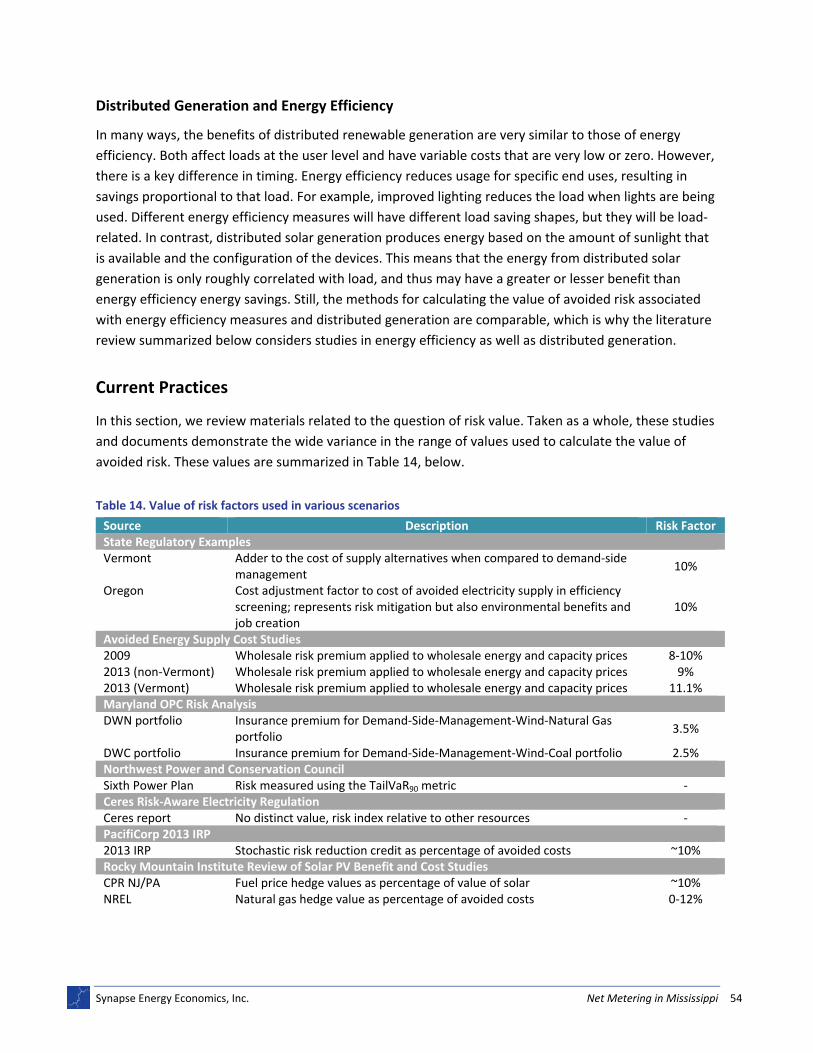
Synapse Energy Economics, Inc. Net Metering in Mississippi 54
Distributed Generation and Energy Efficiency
In many ways, the benefits of distributed renewable generation are very similar to those of energy
efficiency. Both affect loads at the user level and have variable costs that are very low or zero. However,
there is a key difference in timing. Energy efficiency reduces usage for specific end uses, resulting in
savings proportional to that load. For example, improved lighting reduces the load when lights are being
used. Different energy efficiency measures will have different load saving shapes, but they will be load‐
related. In contrast, distributed solar generation produces energy based on the amount of sunlight that
is available and the configuration of the devices. This means that the energy from distributed solar
generation is only roughly correlated with load, and thus may have a greater or lesser benefit than
energy efficiency energy savings. Still, the methods for calculating the value of avoided risk associated
with energy efficiency measures and distributed generation are comparable, which is why the literature
review summarized below considers studies in energy efficiency as well as distributed generation.
Current Practices
In this section, we review materials related to the question of risk value. Taken as a whole, these studies
and documents demonstrate the wide variance in the range of values used to calculate the value of
avoided risk. These values are summarized in Table 14, below.
Table 14. Value of risk factors used in various scenarios
Source Description Risk FactorState Regulatory Examples Vermont Adder to the cost of supply alternatives when compared to demand‐side
management 10%
Oregon Cost adjustment factor to cost of avoided electricity supply in efficiency screening; represents risk mitigation but also environmental benefits and job creation
10%
Avoided Energy Supply Cost Studies 2009 Wholesale risk premium applied to wholesale energy and capacity prices 8‐10%2013 (non‐Vermont) Wholesale risk premium applied to wholesale energy and capacity prices 9%2013 (Vermont) Wholesale risk premium applied to wholesale energy and capacity prices 11.1%Maryland OPC Risk Analysis DWN portfolio Insurance premium for Demand‐Side‐Management‐Wind‐Natural Gas
portfolio 3.5%
DWC portfolio Insurance premium for Demand‐Side‐Management‐Wind‐Coal portfolio 2.5%Northwest Power and Conservation CouncilSixth Power Plan Risk measured using the TailVaR90 metric ‐Ceres Risk‐Aware Electricity Regulation Ceres report No distinct value, risk index relative to other resources ‐PacifiCorp 2013 IRP 2013 IRP Stochastic risk reduction credit as percentage of avoided costs ~10%Rocky Mountain Institute Review of Solar PV Benefit and Cost StudiesCPR NJ/PA Fuel price hedge values as percentage of value of solar ~10%NREL Natural gas hedge value as percentage of avoided costs 0‐12%

Synapse Energy Economics, Inc. Net Metering in Mississippi 55
State Regulatory Examples
In the report Best Practices in Energy Efficiency Program Screening, Synapse authors identified two
states that account for the risk benefit of energy efficiency directly in the criteria used to screen
efficiency programs.56 Vermont applies a 10 percent adder to the cost of supply alternatives when
compared to demand‐side management investments to account for the comparatively lesser risks of
demand‐side management. Oregon adds a 10 percent cost adjustment factor to the cost of avoided
electricity supply when screening efficiency programs to represent the various benefits of energy
efficiency that are not reflected in the market; these benefits include risk mitigation but also
environmental benefits and job creation.
Avoided Energy Supply Cost (AESC) Studies
Since 2007, Synapse and a team of subcontractors have developed biannual projections of marginal
energy supply costs that would be avoided due to reductions in electricity, natural gas, and other fuels
resulting from energy efficiency programs offered to customers in New England.57 In these studies, a risk
factor identified as a “wholesale risk premium” is applied. This premium represents the difference in the
price of electricity supply from full‐requirement fixed price contracts and the sum of the wholesale
market prices for energy, capacity, and ancillary‐service in effect during that supply period. This
premium accounts for the various costs that retail electricity suppliers incur on top of wholesale market
prices, including costs to mitigate cost risks such as costs of hourly energy balancing transitional
capacity, ancillary services, uplift, and the difference between projected and actual energy requirements
due to unpredictable variations in weather, economic activity, and/or customer migration.
The wholesale risk premium is applied to both the wholesale energy and capacity prices. Estimates of
this adder based on analysis of confidential supplier bids range from 8 to 10 percent. For the AESC 2013
study,58 a value of 9 percent was used, except for Vermont where a mandated rate of 11.1 percent was
used.59
Maryland OPC Risk Analysis Study
In 2008, Synapse conducted a project in conjunction with Resource Insight on behalf of the Maryland
Office of the People’s Counsel to identify the costs and risk benefits to residential customers of
56 Woolf, T., E. Malone, K. Takahashi, W. Steinhurst. 2012. Best Practices in Energy Efficiency Program Screening. Synapse
Energy Economics for the National Home Performance Council. 57 Hornby, R. et al. 2009. Avoided Energy Supply Costs in New England: 2009 Report. Synapse Energy Economics for the AESC
Study Group, page 2‐42. 58 Hornby, R. et al. 2013. Avoided Energy Supply Costs in New England: 2013 Report. Synapse Energy Economics for the AESC
Study Group, page 5‐23, 24. 59 The approved 10 percent Vermont risk value is applied to the cost of the energy efficiency measures and thus translates
following state practice into a 11.1 percent adder to the avoided cost (i.e. 11.1% = 1.0/0.9).

Synapse Energy Economics, Inc. Net Metering in Mississippi 56
alternative strategies for meeting their electricity requirements over a long‐term planning period.60
Synapse used a Monte Carlo analysis to examine the expected costs and risks of different procurement
strategies for Standard Offer Service. A variety of strategies were considered, including contracts of
varying duration as well as energy efficiency investments and longer‐term contracts for new resources.
The risk potential was determined by calculating the TailVaR90 values (the average of the net present
values for the costliest 10 percent of outcomes) for each portfolio. Although the risk and average costs
were strongly correlated, there were some cases that were exceptions to this rule. For example, the
DWN (Demand‐Side‐Management‐Wind‐Natural Gas) portfolio had a lower cost than the DWC portfolio
(Demand‐Side‐Management‐Wind‐Coal), but a higher TailVaR90 value. The results of course depend
hugely on the assumptions used for the random variables, such as natural gas and carbon prices.
Greater uncertainty in the carbon price would likely have changed that relationship. Although the risk
was calculated, no explicit cost value was assigned to it since that depends on the value (or cost) of
avoiding that risk.
Using the DWN and DWC portfolios from this report displayed in Table 15, we can infer a risk factor. For
DWN, the expected cost was $12,023 million and the TailVaR90 was $16,223 million, representing a
possible increase of $4,200 million with a 10 percent probability. One could think then of hedging that
with a 10 percent premium of $420 million, which corresponds to a risk factor of 3.5 percent. For the
DWC case, that risk factor/insurance premium would be 2.5 percent. These risk factors only insure
against part of the risk, and are specific to this particular analysis.
Table 15. Long‐term NPV cost and TailVaR90 risk by portfolio in Maryland procurement strategies study
Source: ”Risk Analysis of Procurement Strategies for Residential Standard Offer Service,” p. 43
Northwest Power and Conservation Council (NWPCC)
The Northwest Power and Conservation Council (NWPCC) has been assessing and developing plans for
the future of energy resources in the Northwest region every five years since the organization was
60 Wallach, J., P. Chernick, D. White, R. Hornby. 2008. Risk Analysis of Procurement Strategies for Residential Standard Offer
Service. Resource Insight and Synapse Energy Economics for the Maryland Office of the People’s Counsel.

Synapse Energy Economics, Inc. Net Metering in Mississippi 57
created in 1980.61 An important element of these plans is risk assessment and management. Since the
first Power Plan, NWPCC has analyzed the value of shorter lead times and rapid implementation of
energy efficiency and renewable resources. Starting in the Fifth Power Plan in 2005, NWPCC extended
its risk assessment to incorporate risks such as electricity risk uncertainty, aluminum price uncertainty,
emission control cost uncertainty, and climate change.62
The NWPCC addressed risk by evaluating numerous energy resource portfolios against 750 futures. It
compares the risk of one portfolio (measured using the TailVaR90 metric) and the average value of a
portfolio (the most likely cost outcome for the portfolio). Figure 25 provides an illustrative example of
this analysis. The set of points corresponding to all portfolios is called a feasibility space, and the left‐
most portfolio in the feasibility space is the least‐cost portfolio for a given level of risk. The line
connecting the least‐cost portfolios is called the efficient frontier, which allows the NWPCC to narrow
their focus, typically to a fraction of 1 percent of these portfolios. NWPCC calls this entire approach to
resource planning “risk‐constrained, least‐cost planning” (NWPCC 2010, pp. 9‐5 to 9‐6).
Figure 25. Efficient frontier of feasibility space
Source: NWPCC 2005, p.6‐13.
Using this approach, the NWPCC has found “the most cost‐effective and least risky resource for the
region is improved efficiency of electricity use” (NWPCC 2010, page 3).
61 Woolf, T., E. Malone, K. Takahashi, W. Steinhurst. 2012. Best Practices in Energy Efficiency Program Screening. Synapse
Energy Economics for the National Home Performance Council. 62 Northwest Power and Conservation Council. 2010. The Sixth Northwest Conservation and Electric Power Plan. Available at:
https://www.nwcouncil.org/energy/powerplan/6/plan.
Synapse Energy Economics, Inc. Net Metering in Mississippi 58
Ceres Risk‐Aware Electricity Regulation
A 2012 study by the non‐profit organization Ceres evaluated the costs and risks of various energy
resources, and, like NWPCC, found energy efficiency to be the least cost and least risky electricity
resource.63 Ceres used the following categories to evaluate risk: fuel price risk, construction cost risk,
planning risk, reliability risk, new regulation risk, water constraint risk.
Fuel price risk stems from the volatility of prices, which historically have been driven by varying demand
for and supply of natural gas. Construction cost risk is lower for energy efficiency as compared to other
resources because conventional generation requires longer development timelines, which expose these
resources to longer‐term increases in the cost of labor and materials. For example, the construction cost
schedule of the proposed Levy nuclear power plant in Florida has been delayed five years due to
financial and design problems and its cost estimates has increased from $5 billion to $22.5 billion.64
Planning risk is introduced when electric demand growth is lower than expected, since there is a risk
that a portion of the capacity of new power plants may be unused for a long time. Ceres reported that in
January 2012, lower‐than‐expected electricity demand along with unexpectedly low natural gas prices
mothballed a brand‐new coal‐fired power plant in Minnesota. The utility (Great River Energy) was
expected to pay an estimated $30 million in 2013 just for maintenance and debt service for the plant—
energy efficiency resources that reduce load incrementally would never face this problem. Reliability risk
is also mitigated by energy efficiency resources, which substantially reduce peak demand during times
when reliability is most at risk and which slow the rate of growth of electricity peak and energy
demands, providing utilities and generation companies more time and flexibility to respond to changing
market conditions. New regulation risk is associated with the cost of complying with safety or
environmental regulations, such as EPA’s recently proposed Section 111(d) of the Clean Air Act, which
will increase the cost of fossil fuel plants. Energy efficiency is not subject to these regulations and would
in fact reduce the level of risk to the extent that efficiency displaces regulated resources. Water
constraint risk includes the availability and cost of cooling and process water; energy efficiency is not
subject to this risk, and again can mitigate the risk to the extent that efficiency resources displace
conventional resources.
The Ceres report does not assign one value to avoided risk; however, it does rank resources based on
relative levels of risk, and finds that distributed solar has one of the lowest composite risk scores of new
generation sources. Ceres charts risk against increasing cost for these resources as shown in Figure 26.
63 Binz, R., R. Sedano, D. Furey, D. Mullen. 2012. Practicing Risk‐Aware Electricity Regulation: What Every State Regulator Needs
to Know. Ceres. Available at: http://www.ceres.org/resources/reports/practicing‐risk‐aware‐electricity‐regulation/view. 64 Kaczor, B. 2010. “Florida PSC hearing testimony on nuclear rates.” Bloomberg Businessweek. Available at:
http://www.businessweek.com/ap/financialnews/D9HQ2TN80.htm.

Synapse Energy Economics, Inc. Net Metering in Mississippi 59
Figure 26. Relative cost and risk of utility generation resources
Source: Ceres 2012, figure 17, p. 37
PacifiCorp 2013 Integrated Resource Plan
In its 2013 integrated resource plan, PacifiCorp applied a stochastic risk reduction credit of $7.05 per
MWh for demand‐side management resources. This figure was estimated by taking the difference
between a comparison of deterministic PaR runs for the 2011 IRP preferred portfolio with and without
demand‐side management and a comparison of stochastic PaR runs for the 2011 IRP preferred portfolio
with and without demand‐side management and then dividing that difference by the MWh of demand‐
side management in the 2011 IRP preferred portfolio. Table N.1 of the IRP (on page 357) indicates total
avoided costs of $75.75 per MWh; therefore, $7.05 is a little less than 10 percent of the avoided cost
before the risk factor is applied.

Synapse Energy Economics, Inc. Net Metering in Mississippi 60
Rocky Mountain Institute Review of Solar PV Benefit and Cost Studies
Rocky Mountain Institute (RMI) conducted a review of solar photovoltaic benefit and cost studies.65 In
that study, RMI considers financial and security risks; a number of other types of risk, such as
environmental ones, are not considered. While RMI notes that there is little agreement on an approach
to estimating the unmonetized values of financial and security risk, it does report the risk‐related
benefits for fuel price hedge as reported by studies performed by Clean Power Research in Texas and
New Jersey/Pennsylvania, as well as studies by NREL and by a team of researchers led by Richard Duke
(RMI 2013, 35). There is a wide range in these values and they are fairly substantial, ranging from about
0.5 cents per kWh to over 3.0 cents per kWh ($5 per MWh to $30 per MWh).
The Clean Power Research (CPR) hedge benefits are based on an analysis of the volatility of natural gas
prices, which are then reflected in electricity prices. The cited Texas reports are short on numbers, but
the New Jersey/Pennsylvania report has more specifics. In the latter report, CPR calculates the levelized
value of solar in Pennsylvania and New Jersey from $256 to $318 per megawatt hour. The fuel price
hedge values range from $24 to $47 per MWh, thus roughly in the order of 10 percent.
The cited NREL study66 gives a natural gas hedge value for photovoltaics a range from 0.0 to 0.9 cents
per kWh. Overall, the total photovoltaic benefits in that study range from about 7 to 35 cents per kWh
($70 to $350 per MWh). So the hedge value fraction ranges from roughly 0 to 12 percent of the total
avoided costs.
Note also that the hedge values cited in the RMI study appear to depend largely on the volatility of
natural gas prices, which is likely to be lower in the future due to increased supply and lower prices in
the U.S.
Conclusions and Recommendations
There are certainly a variety of risk reduction benefits of renewable generation (and energy efficiency),
whether those resources come from central stations or distributed sources. The difficulties in assigning a
value to these benefits lie in:
1. Quantifying the risks,
2. Identifying the risk reduction effects of renewables, and
3. Quantifying those risk reduction benefits.
To do all three steps properly would be both difficult and contentious. None of the research and case
studies reviewed above has attempted it. The nearest example is the NWPCC Power Plans.
65 Hansen, L., L. Virginia. 2013. A Review of Solar PV Benefit and Cost Studies. Rocky Mountain Institute. Available at:
http://www.rmi.org/Knowledge‐Center%2FLibrary%2F2013‐13_eLabDERCostValue. 66 Contreras, J.L., Frantzis, L., Blazewicz, S., Pinault, D., Sawyer, H. 2008. Photovoltaics Value Analysis. Navigant Consulting.

Synapse Energy Economics, Inc. Net Metering in Mississippi 61
Current heuristic practice would support a 10 percent adder to the avoided costs for renewables such as
solar and wind. There are both more avoided cost and risk reduction benefits associated with
distributed generation (see Table 13). Thus, one would expect greater absolute risk reduction benefits
with distributed generation, but there is insufficient information to determine how that might differ on
a percentage basis.