Embed Size (px)
Citation preview

13th ICCRTS: C2 for Complex Endeavors
“Net-centric Collaboration and Situational Awareness with an Advanced User-Defined Operational Picture (UDOP)”
Topic: Collaborative Technologies for Network-Centric Operations
Authors: Jeremy Loomis, Rob Porter, Audie Hittle, Chetan Desai, Russ White
Point of Contact: Audie Hittle
Vice President, Technology Applications
ProLogic, Inc. Attn: Audie Hittle
1000 Green River Drive, Ste. 201 Fairmont, WV 26554
(978) 846-1632 [email protected]
13th ICCRTS: C2 for Complex Endeavors
1
Title: Net-centric Collaboration and Situational Awareness with an Advanced User-Defined Operational Picture (UDOP)
Abstract
Historically, government organizations have developed “operations centers” as hubs for command and control functions. Over the past decade there has been significant interest in shared situational awareness and collaboration as well as improvement in networking capabilities, which has resulted in concepts and terms such as Common Operational Picture, Common Relevant Operational Picture, and User-Defined Operational Picture. These ‘pictures’ make operational information available directly to an individual’s desktop (outside the operations centers). This paper defines and introduces the technology concepts for a User-Defined Operational Picture (UDOP) that enable collaboration by providing visual situational awareness to end-users working within an operational Network-Centric environment that is offering an increasing number of web service-enabled information sources. UDOPs are created, visualized, augmented, tailored, and shared by the organization to enhance situational awareness and support collaborative and hierarchical decision-making. The UDOP architecture supports 2D, 3D, and 4D (3D + time) visualization using COTS technologies. Implementation of a robust and flexible UDOP system relies on several key system design patterns that include Service Oriented Architecture (SOA), plug-in mechanisms, layer/filter models, and loose coupling. This paper will also describe one reference implementation of a UDOP system by reviewing an operationally deployed capability called Global Awareness Presentation Services (GAPS).
Keywords: text User Defined Operational Picture (UDOP), Net-Centric, Collaboration, Situational Awareness, 2D/3D/4D Visualization, Net-Centric

13th ICCRTS: C2 for Complex Endeavors
2
Introduction
This paper will discuss how an advanced User-Defined Operational Picture (UDOP) can support net-centric collaboration and situational awareness. It begins with some background on UDOP-related work, followed by a detailed review of an advanced net-centric UDOP architecture. Next, a discussion of UDOP-based collaboration is provided. Then, a review of some enabling technologies leads in to an overview of the operationally-deployed Global Awareness Presentation Services (GAPS) system.
Background
Recently, there is increased interest in shared situational awareness and collaboration which stems from a growing awareness of the “art of the possible” and an improvement in networking capabilities. This interest and subsequent investment has resulted in the development and rapid evolution of concepts such as the UDOP. These user defined ‘pictures’ make operational information available directly to an individual’s desktop (outside the traditional operations centers), enabling them to perform their function in support of command and control for their organization. At a high level, a UDOP has been defined as a “decision-focused view of the operational environment that organizes disparate data sources to support accurate situational awareness (SA) and timely decision-making in a distributed net-centric environment [5]”.
Prior to UDOP, the concepts of Common Operational Picture (COP) and later Common Relevant Operational Picture (CROP) were commonly used. These terms and their successor, the UDOP term, are terms that progressively enable and empower the user with exposure to information that is needed to support decision making. The COP is a single/common picture of the activities and capabilities of the forces that affect a particular theater or mission. The information that describes these activities and capabilities to the user is available and accessible over the network. The CROP, on the other hand, provides customization of COPs to support the various groups of users (e.g., logistics vs. battle management). For each “group” of users, the operational picture is pre-defined and the access to relevant information is pre-configured. UDOP, as the next concept in progression, empowers the user to create their own operational picture by specifying the information (sources and filtering). UDOP provides the most flexibility to the user in creating an operational picture that helps her to perform the job. This UDOP can then be created, augmented, tailored, and shared with other users to create an environment that supports ad-hoc collaboration amongst the users.
Early work on developing a Service-Oriented Visualization Framework (SOVF) [6] between 2000 and 2006 was a pre-cursor to the UDOP concepts described in this paper and focused primarily on technical concepts. The SOVF R&D effort created the framework largely based on the DoD guidance document on Net-Centric Data Strategy [9] and NESI [10]. SOVF described a core architectural framework that provides functionality for selection, filtering, transformation, stylizing, rendering, and updating of information for the user. Other research also provides insights into net-centric UDOP

13th ICCRTS: C2 for Complex Endeavors
3
architecture. For instance, [5] provides a good discussion that relates technical and operational contexts to highlight the benefits of a UDOP within an operational environment.
Hence, the UDOP is becoming a key building block in the process of creating, visualizing, augmenting, tailoring and sharing of vital information. These five UDOP objectives will help lay the foundation for the subsequent discussion of the UDOP architectural components:
• Creating the UDOP includes the identification of content to be included or excluded for a specific user-defined picture
• Visualization specifies how the selected content should be presented. • Augmentation of the UDOP is focused on deriving added-value based upon domain
knowledge. • Tailoring the UDOP enables the adjustment of UDOP contents to address the needs
of each user or echelon in the organization. • Sharing provides the desired ability to conduct rich collaboration across a network-
centric enterprise. These 5 objectives are consistent with readily available government architectures and they provide the guidance for UDOP software development in this rapidly evolving era of network-centric operations.
Many challenges exist in bringing R&D architectures associated with UDOP and other advanced technologies into operational environments. For instance, in spite of best efforts, data stovepiping is still rampant, preventing net-centric access for the “unanticipated user”. Another challenge is the complex schemas which are difficult to normalize across systems and Communities Of Interest (COIs). And, the rapidly changing (evolving) technologies and standards at all levels (SOA infrastructure, visualization, web applications, etc.), continue to plague system developers trying to bring the latest benefits of COTS technologies to bear for the warfighter in operational environments. Fortunately, the UDOP architecture proposed here goes a long way towards addressing many of these challenges.
Advanced UDOP Architecture
Implementation of a robust and flexible UDOP system relies on several key system design patterns that include SOA, plug-in mechanisms, layer/filter models, and loose coupling. A viable architecture for accomplishing the UDOP objectives is shown in Figure 1. This architecture includes an Information Layer, a Services Layer and an Application Layer.

13th ICCRTS: C2 for Complex Endeavors
4
Figure 1. UDOP architecture
For the purposes of this paper, the Information Layer presumes access to any/all desired sources of data via a web-enabled mechanism, such as: relevant events provided through RSS feeds, operational tracks broadcast through event-based web services, imagery served via standards-based services (e.g., OGC WMS), and weather data made available via request-response web services.. However, it should be noted that in the still-maturing net-centric DoD enterprise, the discovery, identification and authorized access to potential data sources presents its own technical and operational utility challenges.
The Services Layer provides UDOP functionality such as: a UDOP repository for the storage of UDOP templates and derived products, stylization services to aid consistency in visual representations, automatic UDOP creation services to support Machine-to-Machine (M2M) transactions, and visualization adapters that can dynamically translate request for visual content (e.g., KML network links) into web-service calls to web-enabled data sources.
Finally, the Application Layer provides the end-user interfaces for performing UDOP functions (authoring and consuming UDOPs), visualizing 2D/3D/4D UDOP-derived products—all in support of net-centric collaboration and performing operational tasks/decision-making.
To fully appreciate the power and potential of this architecture, it is worth a few minutes to understand some terminology (UDOP Template, UDOP Author, UDOP Viewer, UDOP Snapshots, Aggregation, etc.) which will be defined in the sections below.
13th ICCRTS: C2 for Complex Endeavors
5
UDOP Template
A UDOP Template (aka “recipe”) is used to define key elements for creating the picture, such as the base data, data sources, spatial filters, temporal filters, attribute filters, and symbology. Each “layer” of the UDOP specifies a data source, filters, and symbology. Note that this template does not contain any retrieved data. There are various use cases that drive the creation of UDOPs. For instance, users can utilize a standing UDOP (e.g., every day the user wants to see the “same kind of picture” to support her daily tasks) or an ad-hoc UDOP (e.g., the user assembles a UDOP to help evaluate an emerging situation). UDOPs can also be set up for different time frames: planning, execution or after-action workflows. Just as it is an accepted procedure for one person to create a result or output of their work which is then used by others, UDOPs can likewise hierarchically feed other UDOPs. To achieve maximum utility and flexibility, UDOPs need to be able to change during periods of collaboration, and they should be able to be used in sequence during execution of a workflow.
UDOP templates are metadata-rich: metadata can include a wealth of information and enables the handling of data pedigree which defines the source of the data. The metadata can also be used as a data quality indicator and metric of how “good” is this data. Additional uses include tags for data classification which identify who is allowed to see this data. Considerable work has been done in the area of metadata: both the Federal Geographic Data Committee (FGDC) Content Standard for Digital Geospatial Metadata (CSDGM) [12], ISO 19115 and DoD Discovery Metadata Standard (DDMS) provide metadata elements for description of data resources. Some key metadata tags include:
• access constraints (classification, releasibility) • citation • description • spatial reference • data quality (accuracy, completeness, etc.)
UDOP Author, Viewer & Snapshots
A UDOP Author is used to create, tailor, augment and visualize UDOP Templates. It can be used to collaborate in a UDOP Session and can generate UDOP “Snapshots”. These UDOP Snapshots are visualization products derived by “executing” the UDOP (retrieving data, filtering, and saving a fixed view). Snapshots are “fixed” resource, but can be used to quickly facilitate a common understanding. The UDOP Template Viewer includes the ability to visualize UDOP Templates (a selection of common tools, such as the ArcGIS Explorer, AGI Viewer, or Google Earth can act as a Template Viewer). The ability to view and share the UDOP Templates creates an opportunity for collaboration in any given UDOP session. The UDOP Snapshot Viewer is the lowest common denominator, making use of common tools, such as a web browser or media player to view UDOP snapshots for a quick assessment.

13th ICCRTS: C2 for Complex Endeavors
6
Aggregation
This is an overloaded term that can mean any one of many things:
• UDOP Aggregation: the “addition” of UDOP templates: UDOPA + UDOPB = UDOPC.
• UDOP Linking: connection of multiple UDOPS; e.g., UDOPC “points to” UDOPA and UDOPB.
• Data Source Aggregation: deriving new data by combining/correlating existing sources/feeds.
• Echelon Aggregation: enables the user to collapse or expand compound entities (units, formations, etc.), driven by factors such as profile (strategic/tactical) or view (near/far).
UDOP Services
These services parallel the five core UDOP objectives mentioned earlier: i.e., the creation, visualization, sharing, aggregation and collaboration associated with this network-centric operating environment. In this case, the UDOP services are defined as follows:
• Creation services assist the author clients in creating/editing/tailoring UDOPs. These services also offer high-level automatic UDOP generation.
• Visualization services, including symbology and rendering, enable centralized stylization and symbol generation.
• Sharing services such as storage and discovery leverage the UDOP Repository containing UDOP Templates and Snapshots available for browsing, previewing, loading, and modifying.
• Aggregation services support the server-side UDOP aggregation process and provide transformation services for data source aggregation.
• Collaboration services are either asynchronous via UDOP repository access, or synchronous via direct peer-to-peer mechanisms.
Data Types, Data Models, and Normalization
For the purposes of this paper, data “types” refers to a wide variety of data including: base data, maps and imagery, vectors (cities, roads, rivers, regions, etc.), vector overlays, a selection of user documents such as Air Tasking Orders, Modernized Integrated Database (MIDB) facilities and equipment, Geo-events, weather, satellites, tracks, and other relevant annotations. Concepts for modeling geospatial data include applications of geometry, 2D/3D coordinate systems, terrain information, features, topology, use of images, grid, temporal entity, sensor collection, spatial index, bi-temporality, areas/volumes, level-of-detail and whole-earth techniques.
13th ICCRTS: C2 for Complex Endeavors
7
The UDOP architecture utilizes data normalization by “data family”. This can include normalization based upon families of data, such as imagery (e.g., NITF, GeoTIFF, etc.), tracks (e.g., Cursor on Target); features (GML), weather (JMBL, GRIB, etc.), and satellites (TLE). However, more than just the data entities may need to be normalized to produce an effective and efficient environment for operations. Items such as queries, subscriptions, notifications, and result codes represent examples of these entities. Likewise, there are numerous perspectives and standards to be to be addressed in the normalization, including provider and consumer perspectives as well as Geospatial, Command and Control (C2), WMS, WFS, GML, GeoRSS, CoT, KML, C2IEDEM, TENA, SEDRIS, and C2 Core Schema to name a few. The data normalization must address core attributes, such as location, time, and affiliation to enable even basic access and use.
Data Discovery & Retrieval
Data discovery typically refers to a process in which data in an electronic form is sought and the source located. Retrieval extends the data discovery process to the next logical step, which is to acquire the data and return it to the intended user or customer. When working in a Service Oriented Architecture (SOA) framework, the concept of data discovery is extended to the relevant services as part of a Service Discovery process. Increasingly, information about such services is included in the metadata (or data about the primary data), which can be stored as content in repositories, such as the DoD Metadata Repository. High-level services, such as those provided by the Network Centric Enterprise Services (NCES), include the Universal Description, Discovery and Integration (UDDI) capability, which is a platform-independent, XML-based registry for organizations to publish service listings enabling service (data) discovery and potential reuse of the services.
Data delivery protocols are defined which describe how the data must be prepared and presented if it is to be reused by other services or applications. Additional related concepts include web services (with data retrieval concepts of push/pull, publish/subscribe, REST, etc.), RSS, sockets, file transfer protocols (e.g., e-mail, FTP, HTTP, etc.) all playing an important role in data discovery and retrieval.
Likewise, the concept of streaming data presents an entirely new set of challenges that push today’s protocols and technologies to their limits. A variety of subscription concepts, such as filters, time-limited constraints, cookies and expiration can play a role in the timely retrieval of this sort of data. Hence, the concept of notification mechanisms plays an important part in the effective use of streaming data. Polling is one approach to handling streaming data. Asynchronous callback, to a web service endpoint, is another technique. Finally, messaging (JMS, MSMQ, etc.) and e-mail can also be used. Gateways represent a solution for gaining access to networks and data when there is no direct link or common language between the requestor and source of the data.
13th ICCRTS: C2 for Complex Endeavors
8
Presentation Tier
Probably the most critical elements of any C2 visualization architecture, at least as far as the end-user is concerned, are the visualization clients themselves. These clients represent the software and hardware packaging in the presentation tier that provide the operator with the user interface with which he will access data and business logic used in performing C2 functions.
Client Roles and Footprints
There are two ways to characterize visualization clients: 1) by their role, either service consumer or author/producer; and 2) by the size of their software/hardware “footprint.”
Client Roles
• Service Consumers display information using variety of user interface methods, tables, trees, editors, and geospatial displays.
• Author/Producers generally also display information in a variety of ways, but require richer, more data-intensive software applications to support their authoring capabilities.
Client Footprints
• Rich Clients rely on local processing and storage, and are usually capable of more graphics-intensive and data-driven displays.
• Thin (Web) Clients are those that use neither local processing nor storage. These clients use products like JavaScript or AJAX to interact with an application server to provide the display.
• Hybrid Clients generally download software components, such as applets, from the server and perform some local processing. They may have a minimal installation but often do not use local storage.
Thick Client UDOP Authoring
The UDOP Author Desktop Application allows the user to perform full UDOP creation, including adding, removing, organizing, and deleting UDOP layer. The UDOP Author will then ‘execute’ the UDOP by pulling in data from each data source, applying requested filtering (balancing server-side and client-side filtering as needed), and rendering the data into a 4D (3D plus time) display. The user can now navigate in 3D, change the time point, hide/show layers, and drill into data details. When completed, the user can export snapshots and save the snapshots (along with the template) to the UDOP repository.
13th ICCRTS: C2 for Complex Endeavors
9
Thin Client UDOP Authoring
In this scenario, the user accesses a thin client UDOP Author Web Site which provides similar functionality as the thick client and can be used to create, tailor and visualize UDOP templates. The Author Web Site can be used to load UDOP templates from the Repository or to publish UDOP Templates or snapshots to the Repository. The Author Web Site thin client uses the UDOP Creation Service to create Snapshots as in the application; however, a primary difference is that thin client uses a 2D display versus the 3D display of the Author Desktop Application. There is also limited support for interaction and animation given the limits of a browser environment.
Mixed Visualization Environments
After User X creates a UDOP using the Author Application, various snapshots are generated from a selection of data sources and viewers and stored in the UDOP Repository. User Y can then discover the snapshots by browsing/searching the repository. Once discovered, User Y consumes the snapshots with relevant viewers, media players, browsers, etc. Alternately, User X could distributes the snapshots directly via e-mail to User Z who then “discovers” the snapshots by simply receiving/opening the email without first having to go to the snapshot viewers (browser, medial players, etc.). Then, User Z consumes the snapshots by using their choice of viewers on the files. This approach supports a full range of end-user environments, including disadvantaged clients.
Direct Visualization Adapters
In this scenario, assume Google Earth as the client application. With the use of Visualization Adapters, a user can add a new Network Link to the viewer for a specific data service. Then, the user specifies the feed URL with query parameters. When the network link is refreshed, the adapter provides the new Keyhole Markup Language (KML) reference. Given the network link, the user accesses a data loader to connect to a relevant data source or sources. Once connected, the adapters transform the data item into KML for subsequent viewing via Google Earth which adds the KML to a data tree. This has the advantage of using a lightweight software layer for data transformation and the data is virtually guaranteed to be up-to-date. The disadvantage, however, is that if done without a memory cache, the process always incurs a transformation delay and there is an increased load on the backend data service.
Automatic M2M Generation
In this scenario, a DoD Portal has new geospatial content due to the recent entry of a new event by User X or due to a database update. Subsequently, the portal calls the UDOP Creation Service with a High-Level request. Given the event, the UDOP server Creation Service creates a detailed UDOP Template which is then used by the Creation Service to generate UDOP snapshots. Then, the template and snapshots are published to the UDOP Repository and a link to the UDOP is sent back to the Calling Portal. It is then possible for User Y to review the UDOP by following the Portal link and viewing the snapshots stored in the Repository with their choice of browser, media player or template viewer.

13th ICCRTS: C2 for Complex Endeavors
10
Batch Processing
As implied, the Batch Processor runs scheduled batch tasks. A Batch Task will connect to data services as needed. The Batch Task will also create or update a UDOP Template as needed. Batch Tasks will support UDOP snapshots and will publish UDOP template/snapshots to the Repository. Batch Tasks can also send notifications, for instance to an external Portal, as needed. Finally, a user can subsequently review the UDOP by following a portal link and using the snapshot or template viewers to see and use the snapshots.
UDOP-Based Collaboration
This section describes how the UDOP architecture supports collaboration in a net-centric environment.
Creating a UDOP for Situational Awareness
The first step in this process involves creating a new UDOP Template with the Author, including the selection of data sources (e.g., background Globes, track layers, data from a local or personal organic data source, and a layer from an analysis service, such as the AGI or ESRI servers for weather impacts or mission plans). Then, the user selects a Template Viewer: e.g., ArcGIS Explorer, AGI Viewer, or Google Earth, depending on the user’s needs. Then, the Viewer proceeds with the retrieval of data sources from the services and the application of filters to the data (such as the use of symbolization preferences like MIL-STD 2525B). Then the user, interactively views the UDOP with the Author Application 4D display. Finally, the user saves the UDOP Template with references to the local data, filters, symbolism choices, etc. This resulting Personal UDOP then includes all the information related needed (MIDB, routes, GIS, country borders, weather forecast, etc.) and is ready for subsequent sharing.
Sharing UDOP Templates
In this process, User X generates various UDOP snapshots by defining which data sources to use with which template viewers. Then, this information, including Snapshots and Templates is written to the UDOP Repository (for storage and subsequent discovery) in the UDOP Server. At this point, User Y enters and accesses the UDOP Author Desktop Application to search or discover relevant information in the UDOP Repository. Upon discovery, User Y opens the UDOP Template in the Author Application and then views the interactive UDOP with the Author Application 4D Display, thus sharing the template and information created earlier by User X.
Asynchronous Collaboration via Snapshots
User X generates snapshots, using the processes previously noted. User X publishes those snapshots to the UDOP Repository and subsequently blogs about the UDOP to a DoD portal manually through a browser or automatically via their UDOP Author Application, and this blog reference is also entered into the UDOP Repository. User Y

13th ICCRTS: C2 for Complex Endeavors
11
discovers and then reads about the UDOP through the portal. Once discovered, User Y can then retrieve the UDOP Template as previously described under the “Sharing UDOP Templates” capability. This is one type of asynchronous collaboration, but collaboration could also occur through e-mail or other established mechanisms.
UDOP Aggregation
In this scenario, the User wants to build on the work of others, and starts by searching the UDOP Repository for Snapshots/Templates to aggregate. Then, the parameters of the aggregation are specified as part of a call to the UDOP Creation Service on the server. Once done, a combined UDOP Template is generated and UDOP snapshots depicting the aggregation are generated. Next, the UDOP templates/snapshots are published back to the UDOP Repository and optionally the aggregated UDOP is published to the DoD Portal. Once prepared, the aggregated UDOP is then available for personal or collaborative team use.
Direct Peer-to-Peer Collaboration
Peer-to-Peer collaboration holds some of the biggest potential for leveraging shared information and perspectives. A UDOP System should provide geo- and time- enabled versions of core collaboration techniques (such as whiteboard and chat), as well as other social networking techniques like virtual presence, rooms and sessions. UDOP-specific collaboration concepts include: shared annotations, shared templates, shared organic data, shared workflow and dynamically linked views.
For the Peer-to-Peer collaboration scenario, User X opens the UDOP Author Application and initiates a collaboration session in the UDOP Services layer. User X then invites Users Y and Z (via phone, email, external chat) to join the session. Users Y and Z subsequently open their own instances of the UDOP Author Application and join the session. During the session, the collaborating parties can use chat via text, share data, views, annotations, and whiteboard activities. Optionally, users can archive the collaboration session for subsequent reference or review.
Enabling Technologies
Instantiating this UDOP architecture requires several enabling technologies, including
• Geospatial Visualization and Analysis • Web and SOA Infrastructure • Messaging Protocols
Geospatial Visualization and Analysis
For the purposes of the UDOP architecture, a visualization technology agnostic approach has been taken to provide the most flexibility and to explore which technologies may be most relevant or of greatest utility to this user community. Some of these visualization

13th ICCRTS: C2 for Complex Endeavors
12
technologies include CJMTK (ArcGIS), AGI STK, Google Earth, Falcon View, NASA World Wind and Microsoft Virtual Earth. Several of these technologies are described below to provide an overview of presentation-tier capabilities.
ArcGIS and CJMTK
ArcGIS is a Geographic Information System (GIS) system produced by ESRI which includes various components applicable to and useful for Command and Control applications. The ArcGIS product line (ArcGIS Desktop, ArcGIS Server) offers a powerful set of applications for storage, analysis and mapping of geospatial data. The selection of technology components will vary depending on what the intended visualization system will be. For example, custom C2 desktop applications may take advantage of the ArcGIS Engine product to provide a framework for managing and visualizing C2 data, one may choose ArcSDE to house geospatial data in an enterprise data repository, and ArcGIS Server can be used to surface C2 data through web services for either desktop applications or thin clients running in a web browser.
Figure 2. ArcGIS Explorer surfaces data and functionality from ArcGIS Server
ArcGIS provides an extensive GIS analytical capability in which C2 data can be used to perform advanced computations (e.g. intercept calculations, line of sight) ArcGIS products provide a great deal of native support for a variety of data formats including those provided by NGA (e.g. CADRG, DTED, etc.) ArcGIS also offers some support for open standards like OGC. The ArcGIS architecture also provides a significant amount of flexibility to developers in terms of application customization. Developers can provide new format support either through raster/feature plug-ins or custom layers. ArcGIS also supports C2 data visualization with products like Military Overlay Editor (MOLE) which

13th ICCRTS: C2 for Complex Endeavors
13
provides 2525B support and offers a fairly extensive set of capabilities for generating/rendering tactical graphics.
AGI Technologies
Analytical Graphics Incorporated (http://www.agi.com) brings a suite of technologies that provide geo-dynamic analysis and display:
• Satellite Toolkit (STK) • 4DX • Dynamic Geometry Library (DGL)
STK is a standalone application, while 4DX and DGL can be used as software components in a larger system.
Figure 3. 4D visualization and analysis with 4DX
AGI technologies provide the following capabilities for globally accurate 4D (3D + time) visualization: time; coordinates, rotations, accurate earth modeling; geometry transformation engine; complex numerical algorithms, orbit propagation algorithm; waypoint propagation; sensor geometry modeling; inter-visibility access; and platform modeling (missiles, ground vehicles, ships, facilities, aircraft, satellites, sensors, transmitters, receivers, and radars).
The sophisticated STK Geometry Engine can compute azimuth and elevation angles in a coordinate frame between objects, angle rates, range, range rates, radar performance, communication link performance, etc. It can perform predictive computation of absolute values of and “constraint” satisfaction time periods for the following types of mission objectives: geometric, proximity, pointing, lighting, line-of-sight atmospheric conditions, inter-object geometry, communication link quality, radar performance measures, terrain
13th ICCRTS: C2 for Complex Endeavors
14
vertical profiles, etc. This predictive computation can include determination of “multi-constraint” satisfaction times.
The 4DX libraries are COM components that allow programmatic access to STK analysis and display capabilities. STK/X control is the main three-dimensional portion of the STK toolkit. STK/X is a control for global visualization. It allows for changing perspective, line-of-sight calculations, sun lighting. The STK/X control is time aware; in that sense, it can be described as offering four-dimensional visualization.
The DGL libraries are powerful class libraries built on version 2.0 of the Microsoft .NET platform. The DGL component technology enables users to create a variety of solutions with a modern development paradigm; from small utilities used to process proprietary data to desktop aerospace software applications, multi-user web applications, or a piece of a service-oriented architecture (SOA). DGL provides high-precision modeling of time and coordinate frames for accurate orbit and waypoint propagation of satellites, aircraft, ground vehicles and their sensors. Additionally, DGL includes numerical methods, and geometry transformation algorithms, which users can use to compute position, orientation, and inter-visibility intervals for many platforms and missions.
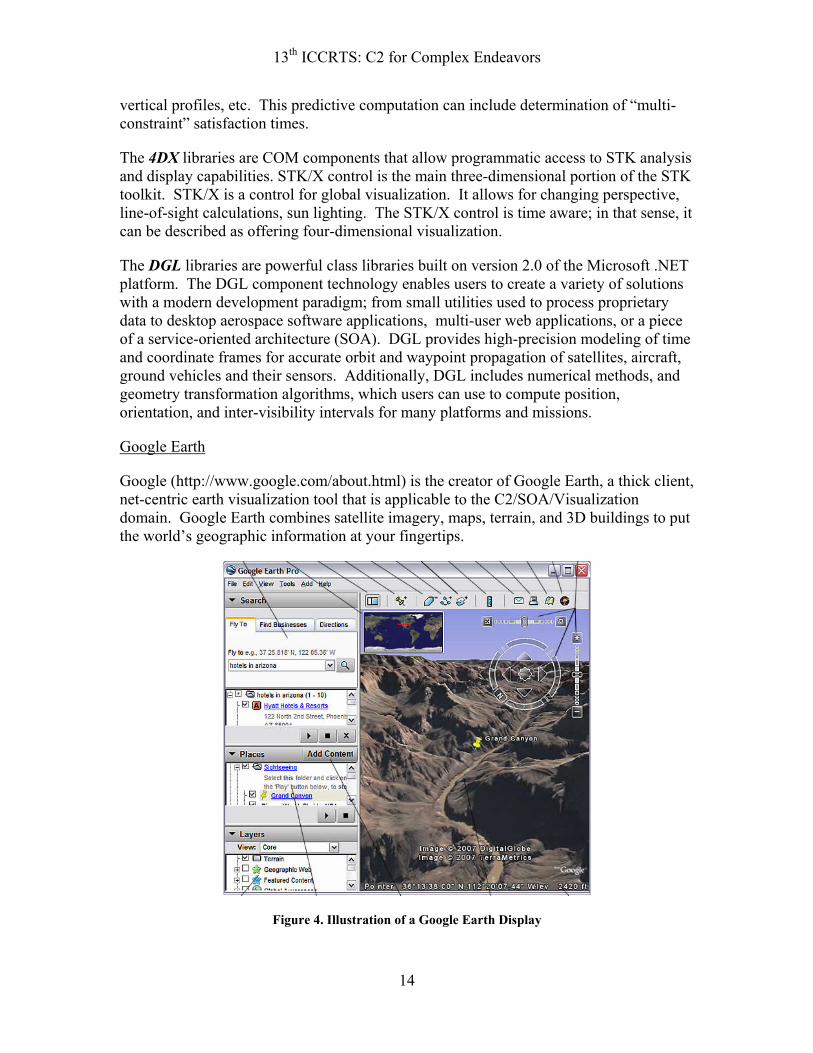
Google Earth
Google (http://www.google.com/about.html) is the creator of Google Earth, a thick client, net-centric earth visualization tool that is applicable to the C2/SOA/Visualization domain. Google Earth combines satellite imagery, maps, terrain, and 3D buildings to put the world’s geographic information at your fingertips.
Figure 4. Illustration of a Google Earth Display

13th ICCRTS: C2 for Complex Endeavors
15
Some key features:
• Fly to any location on earth. Type in an address, press Search, and the display will zoom in.
• Search for geographic features, sports venues, transportation terminals, hospitals, and more. Get driving directions.
• Tilt and rotate the view to see 3D terrain and buildings, or look up to explore the sky
• Save and share searches and favorites.
Google Earth supports network links which can be used in an SOA manner as clients to a web service that returns KML. Base imagery and map data is streamed to the Google Earth viewer as long as the viewer is on a machine connected to a network where Google Imagery servers reside (e.g., the Internet or SIPRNET).. The streaming of this data is geospatial context dependent. That is, less detailed data is streamed when the viewer is zoomed out and more detailed data is streamed when the viewer is zoomed in. In addition, when the viewer is zoomed in only the detailed data that is in the viewers field of view is streamed to the viewer.
Google Earth provides ease of navigation: it is straightforward to move around the earth and zoom in and out. A more difficult navigational concept which Google Earth incorporates is the ability to reorient north to up, which is a natural view for most people. Finally, Google Earth offers good support for “tilting” the view. This allows the viewer to not just have a nadir view of the Earth, but also more oblique angle views of the earth.
Google Earth supports automatic de-cluttering of the display. On some occasions, the user may be viewing data that has two geospatial features such as points that overlap each other. In this case one point occludes the other; or in some cases it could occlude many other features. Google Earth provides the ability to click on the occluding point. It then separates the multiple points, but adds lines pointing to their actual geospatial location. In this way all the points with their labels can be viewed at once.
Google Earth does not support time varying data very well, although recent versions of Google Earth have added a simple time slider control containing a sliding time window. Google Earth also does not provide a client-side Application Programming Interface (API)
Web and SOA Infrastructure
The two leading technology frameworks for web application development and for Service Oriented Architectures are .NET and J2EE.
.NET
According to Microsoft, the .NET Framework is “a platform for building, deploying, and running Web Services and applications. It provides a highly productive, standards-based,

13th ICCRTS: C2 for Complex Endeavors
16
multi-language environment for integrating existing investments with next-generation applications and services as well as the agility to solve the challenges of deployment and operation of Internet-scale applications. The .NET Framework consists of three main parts: the common language runtime, a hierarchical set of unified class libraries, and a componentized version of Active Server Pages called ASP.NET.
J2EE
Java 2 Platform, Enterprise Edition (J2EE) is a specification for developing and deploying multi-tiered business applications. The specification defines how the tiers interact and what they must support. J2EE is a standard and not an implementation, this allows the developer to code against a single implementation, and be assured that other implementations will be compatible.
J2EE is built on top of J2SE; it adds nothing new to the Java language. J2EE applications are developed exactly the same as any other Java application. J2EE specifies a supporting set of libraries that are to be implemented. For example, Web services support, Java Messaging Services (JMS), and JavaMail are all part of the standard. J2EE also specifies the process of deployment using standard descriptor files and java archives (jars).
Messaging Technologies
According to xmpp.org, the Extensible Messaging and Presence Protocol (XMPP) is “an open XML technology for real-time communication, which powers a wide range of applications including instant messaging, presence, media session management, shared editing, white-boarding, collaboration, lightweight middleware, content syndication, and generalized XML routing.”
As an open and extensible technology, XMPP can form the basis for domain-specific collaboration, with custom XML messages embedded in the conversation being used to convey content such as geospatial data and viewpoints.
The GAPS System
The Global Awareness Presentation Services (GAPS) system is a project conducted by the US Air Force Electronic Systems Center for USSTRATCOM. The primary objective of the GAPS system is to create visually fused global situational awareness display presentation services which support global network centric operations.
Scope
The GAPS system was architected to be open and adaptable and is being designed in an agile manner with an operational focus versus a research-orientation. It implements much of the UDOP architecture presented above and is currently deployed on the Non-Classified Internet Protocol Router Network (NIPRNET), Secure Internet Protocol Router Network (SIPRNET) and Joint Worldwide Intelligence Communications Systems (JWICS) operational environments.

13th ICCRTS: C2 for Complex Endeavors
17
Implementation
The GAPS project is differentiated from other programs by its agile approach, which integrates customer preferences on a continuous basis through multiple software iterations and frequent user feedback. The GAPS project has been integrated into other rapid development efforts such as the Global C2 Data Pilot effort championed by DISA, STRATCOM and JFCOM.
The GAPS system is based on technologies such as Microsoft .NET, ASP.NET, IIS, Google Earth, DGL, 4DX, WSE 3.0, ArcGIS Server. It is delivered in modular install packages, including the standalone “GAPS Author” and multiple server-side components: “GAPS Server”, “GAPS Workstation”, and “GAPS KML Feeds”.
Figure 5. The GAPS Author application is based on 4DX technology
Example Use Case
Over the past several months, Russian Tupolev-95 Bear Bombers have frequently flown close to Alaskan coast and US Naval carriers. Organizations throughout the US DoD and specifically the USSTRATCOM routinely collaborate to ensure maximum situational awareness of these activities and to improve response preparedness. The collaboration is aided by a pre-existing GAPS UDOP Template that specifies Alaskan region spatial filter along with pre-defined data sources that include various ground, air, and sea blue force assets. This Template is configured using batch processing to automatically create UDOP snapshots. A wide range of collaborators (Lieutenant to General, Air Force to Army) use the GAPS Repository and additional collaboration tools to review the UDOPs (and aggregate them with data such as ISR assets and weather conditions/impacts) in support of peer-to-peer collaboration. The collaboration can also benefit from the

13th ICCRTS: C2 for Complex Endeavors
18
addition of GeoRSS services from public sources such as news media to monitor information that is being discussed in the public domain. This very simple use case very quickly illustrates how a significant portion of the UDOP functionality discussed in this paper can be used to support operations. Similar use cases also support Homeland Defense and Homeland Security applications by enabling collaboration and situational awareness for local, state, and Federal Government officials and first responders.
Conclusion
The concept of a User Defined Operational Picture or UDOP is rapidly becoming a key building block in the process of creating, visualizing, augmenting, tailoring and sharing of vital operational information. Collectively, these five processes represent the key UDOP development objectives and, as collected from a particular user community, formed the basis of this paper.
This paper defined and introduced how a UDOP System supports net-centric collaboration by providing visual situational awareness to end-users working within an operational Network-Centric environment that is offering an increasing number of web service-enabled information sources. These UDOP concepts are relevant for environments where information as well as end-users are connecting and collaborating over the network in support of operations.
Implementation of a robust and flexible UDOP system relies on several key system design patterns that include Service Oriented Architecture (SOA), plug-in mechanisms, layer/filter models, and loose coupling. This paper described one reference implementation of a UDOP system by reviewing an operationally deployed capability called Global Awareness Presentation Services (GAPS).

13th ICCRTS: C2 for Complex Endeavors
19
References
[1] Alberts, D. S., Garstka, J. J., and Stein, F. P. 1999. Network Centric Warfare, Washington, DC: Command and Control Research Program.
[2] Alberts, D. S., and Hayes, R. 2006, Understanding Command and Control. Washington, DC: Command and Control Research Program.
[3] Alberts, D. S., and Hayes, R. 2003. Power to the Edge. Washington, DC: Command and Control Research Program.
[4] USAF Electronic Systems Center. 2005. Strategic Technical Plan v2.0, Hanscom AFB: USAF Electronic Systems Center, Available online at ttp://herbb.hanscom.af.mil/hot_buttons/STP/ESC_STP_v2_0_PR.pdf.
[5] Mulgund, S., and Landsman, S. 2006. User Defined Operational Pictures for Tailored Situational Awareness. 12th International Command and Control Research and Technology Symposium.
[6] ProLogic, Inc. 2005. Technical Roadmap for Developing a Service-Oriented Visualization Framework (SOVF). Prepared for USAF Electronic Systems Center, Hanscom AFB.
[7] Desai, C. J. 2005. Net-centric Temporal / Geospatial Visualization, Presented at the C2 Visualization Industry Day hosted by the C2 Battlelab, Langley, VA.
[8] Loomis, J. J., and White, R. 2006. Global Awareness Presentation Services, Presented at the C2 Summit, Hosted by USSTRATCOM, Omaha, NE.
[9] Department of Defense. 2003. Department of Defense Net-centric Data Strategy. Washington DC: DOD, Available online at http://www.defenselink.mil/cio-nii/docs/Net-Centric-Data-Strategy-2003-05-092.pdf.
[10] USAF Electronic Systems Center. 2005. Net-centric Enterprise Solutions for Interoperability (NESI), Hanscom AFB: USAF Electronic Systems Center, Available online at http://nesipublic.spawar.navy.mil/.
[11] National Security Agency (NSA) The Global Information Grid, http://www.nsa.gov/ia/industry/gig.cfm
[12] Federal Geographic Data Committee (FGDC) Content Standard for Digital Geospatial Metadata (CSDGM) / ISO 19115 (or DDMS) Elements (http://www.fgdc.gov/)