Embed Size (px)
Citation preview
1
A NESTED GENETIC ALGORITHM STRATEGY FOR THE OPTIMAL PLASTIC DESIGN OF FRAMES
A. Grecoa, F. Cannizzaroa, R.Brunob, A. Pluchinob,c
aDepartment of Civil Engineering and Architecture,
University of Catania, viale A. Doria 6, Catania, Italy bSezione INFN of Catania, via S.Sofia 64, Catania, Italy
cDepartment of Physics and Astronomy “E.Majorana” University of Catania
email: [email protected],
[email protected], [email protected], [email protected]
Abstract
An innovative strategy for the optimal design of planar frames able to resist to seismic excitations is here
proposed. The procedure is based on genetic algorithms (GA) which are performed according to a nested
structure suitable to be implemented in parallel computing on several devices. In particular, this solution
foresees two nested genetic algorithms. The first one, named ‘External GA’, seeks, among a predefined
list of profiles, the size of the structural elements of the frame which correspond to the most performing
solution associated to the highest value of an appropriate fitness function. The latter function takes into
account, among other considerations, of the seismic safety factor and the failure mode which are
calculated by means of the second algorithm, named ‘Internal GA’. The details of the proposed procedure
are provided and applications to the seismic design of two frames of different size are described.
Keywords: Frames, Optimal design; Limit analysis; Seismic performance; Elementary mechanisms
method; Genetic algorithms; NetLogo; Parallel computing.
Corresponding author: A.Greco, e-mail: [email protected], tel: +390957382251

2
1 Introduction
The design of structures is a widely debated topic in the last years, due to its complexity, to the evolution
of the analysis methods and to the conceptual advances made in the last decades towards a deeper
understanding of the structural behaviour of buildings.
The design of a structure may be faced considering different aspects and strategies with increasing levels
of complexity and elaborateness. Usually, for new constructions, the codes [1] suggest the employment
of global elastic analysis and then to singularly design each member. However, a local design does not
guarantee to have an effective global behaviour of the building, especially in seismic conditions. For the
latter reason, modern strategies of design of structures must be respectful of the concepts of global
ductility which ensures that, during an earthquake, a structure is able to dissipate an adequate amount of
energy before collapsing. Aiming at favouring a ductile behaviour of a structure, some tools, such as the
structural factor to reduce the design spectrum and the regulations associated to the strength hierarchy
[2] of beams and columns, have been more recently introduced in the design process.
Usually, especially in the case of steel structures, the economic criterion (i.e. minimum weight) is
considered as the only variable to be minimized in the design process, as long as the structural
requirements are satisfied. Within this context, the design problem consists in finding a set of variables,
namely the cross section of the members, which minimizes a certain function (weight of the structure)
under some design constraints, which have to be evaluated following a structural analysis. The latter
aspect usually prevents the formulation of explicit approaches for a comprehensive design of the
structural members of buildings. Under these hypotheses, and considering the adoption of linear analyses,
the employment of evolutionary algorithms [3] turned out to be very useful to guide the design process
[4-7].
However, the adoption of a nonlinear approach for the design of structures, even in presence of new
constructions, has been suggested by several authors both considering static [8,9] and dynamic [10,11]
3
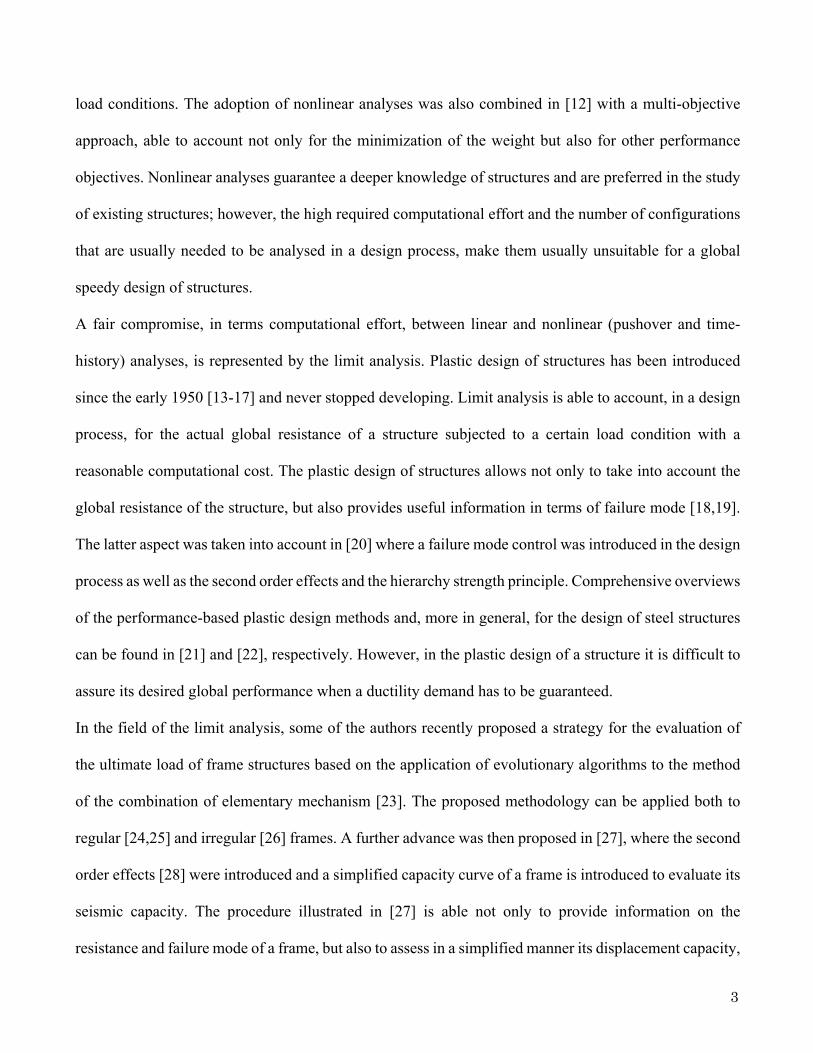
load conditions. The adoption of nonlinear analyses was also combined in [12] with a multi-objective
approach, able to account not only for the minimization of the weight but also for other performance
objectives. Nonlinear analyses guarantee a deeper knowledge of structures and are preferred in the study
of existing structures; however, the high required computational effort and the number of configurations
that are usually needed to be analysed in a design process, make them usually unsuitable for a global
speedy design of structures.
A fair compromise, in terms computational effort, between linear and nonlinear (pushover and time-
history) analyses, is represented by the limit analysis. Plastic design of structures has been introduced
since the early 1950 [13-17] and never stopped developing. Limit analysis is able to account, in a design
process, for the actual global resistance of a structure subjected to a certain load condition with a
reasonable computational cost. The plastic design of structures allows not only to take into account the
global resistance of the structure, but also provides useful information in terms of failure mode [18,19].
The latter aspect was taken into account in [20] where a failure mode control was introduced in the design
process as well as the second order effects and the hierarchy strength principle. Comprehensive overviews
of the performance-based plastic design methods and, more in general, for the design of steel structures
can be found in [21] and [22], respectively. However, in the plastic design of a structure it is difficult to
assure its desired global performance when a ductility demand has to be guaranteed.
In the field of the limit analysis, some of the authors recently proposed a strategy for the evaluation of
the ultimate load of frame structures based on the application of evolutionary algorithms to the method
of the combination of elementary mechanism [23]. The proposed methodology can be applied both to
regular [24,25] and irregular [26] frames. A further advance was then proposed in [27], where the second
order effects [28] were introduced and a simplified capacity curve of a frame is introduced to evaluate its
seismic capacity. The procedure illustrated in [27] is able not only to provide information on the
resistance and failure mode of a frame, but also to assess in a simplified manner its displacement capacity,

4
by evaluating the ultimate displacement of the control point according to the achievement of the limit
chord rotation at each of the plastic hinges involved in the collapse mechanism.
In the present paper the procedure proposed in [27], which showed to be reliable and fast and is based on
a genetic algorithm (GA), represents the internal routine (called “Internal GA”) of a nested genetic
algorithm strategy, able to design a frame with given geometry and loads. The external algorithm (called
“External GA”) selects the cross sections associated to the members of the frame, and evolves towards
the configuration which shows the highest fitness. The performance of each of the selected frame
configurations is evaluated not only according to an economic factor (minimum weight), but also
considering other meaningful aspects, that is the safety factor, a hierarchy criterion and privileging those
frames associated to a more dissipative failure mode. The strategy is implemented through a dedicated
software developed within the agent-based multiplatform environment Netlogo [29] and it has been
integrated into a Cloud based computational workflow built on top of the GARR Cloud Infrastructure,
using modern and innovative strategies allowing to easily reproduce this work in accordance to the FAIR
principles in OpenScience.
The conceived approach is a multi-objective design strategy, respectful of the main modern concepts for
an effective design of structures, but also ensuring a significant computational advantage with respect to
other nonlinear approaches based on pushover and nonlinear time history analyses. In addition, it is keen
to introduce additional design criteria and to vary the relative weights of the adopted criteria. The
procedure is validated against two significant case studies, which are duly analysed considering the
needed computational effort, and demonstrating how the designed frames are those which maximize the
defined fitness.
5
2 The proposed design strategy
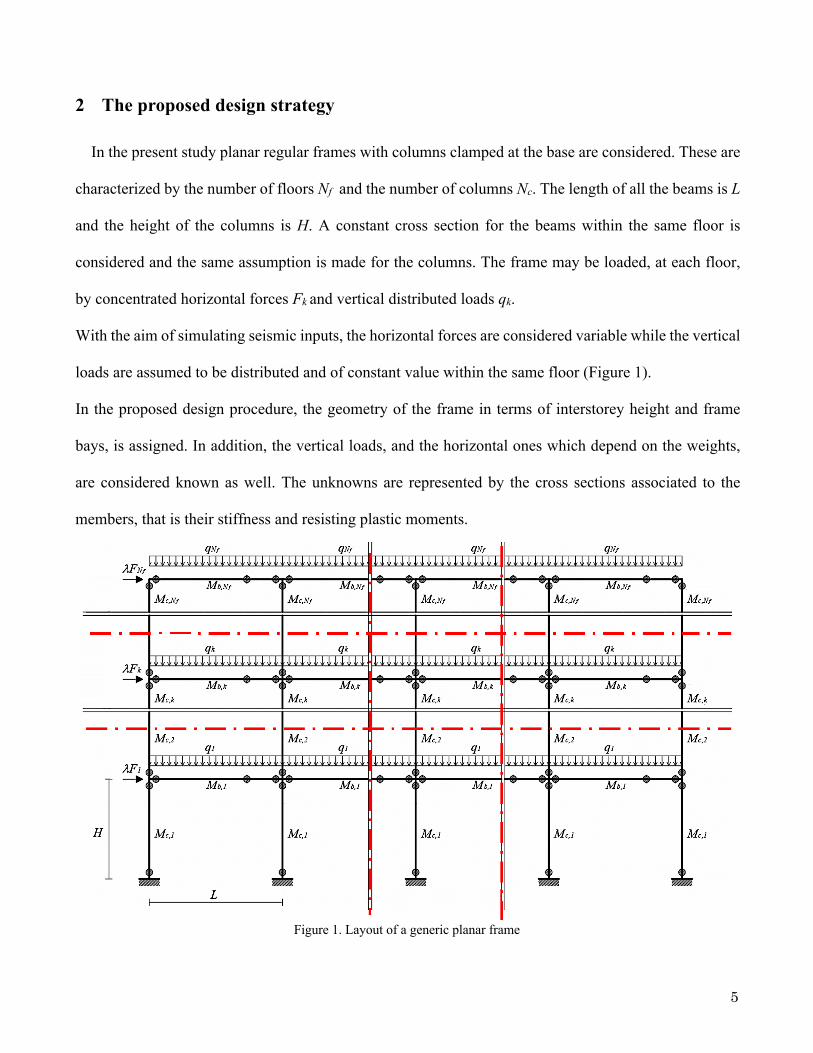
In the present study planar regular frames with columns clamped at the base are considered. These are
characterized by the number of floors Nf and the number of columns Nc. The length of all the beams is L
and the height of the columns is H. A constant cross section for the beams within the same floor is
considered and the same assumption is made for the columns. The frame may be loaded, at each floor,
by concentrated horizontal forces Fk and vertical distributed loads qk.
With the aim of simulating seismic inputs, the horizontal forces are considered variable while the vertical
loads are assumed to be distributed and of constant value within the same floor (Figure 1).
In the proposed design procedure, the geometry of the frame in terms of interstorey height and frame
bays, is assigned. In addition, the vertical loads, and the horizontal ones which depend on the weights,
are considered known as well. The unknowns are represented by the cross sections associated to the
members, that is their stiffness and resisting plastic moments.
Figure 1. Layout of a generic planar frame

6
The proposed design approach, consisting in the two nested genetic algorithms, is described in the
following subsections. Specifically, in the first subsection, the External GA, devoted to the identification
of the best set of cross sections to be assigned to the members of the frame, is described. In the second
subsection, the seismic assessment procedure proposed in [27], which constitutes the Internal GA, is
recalled. In the third subsection, the procedure for the definition and calculation of the fitness of the
generic frame, and the considerations which lead to the identification of the optimal design, are illustrated.
The whole procedure is summarized in the flow chart reported in Figure 2.
Figure 2. Flow chart of the nested algorithm.
2.1 The External GA (Design algorithm)
The main loop of the general procedure, here addressed as external, is devoted to the definition of the
cross sections to be assigned to the members of the frame. The cross sections of the structural members
7
are assumed to be variable in a predefined list of commercial profiles for steel frames or, in the case of
reinforced concrete structures, in a predefined list of cross sections conveniently chosen. Since the
procedure adopted in the present paper, in order to identify the optimal set of profiles, makes use of
genetic algorithms, a population of profile chromosomes is considered. Each individual of the population
is coded as a string of integer numbers, where each number (called “gene”) represents the considered
commercial profile within the predefined list. Therefore, a generic profile chromosome 𝐶!"#$ of the
population (k = 1, …, Pext) can be coded in the following string made of pairs of genes:
𝐶!"#$ ≡ $𝑐%& , 𝑐%' , 𝑐(& , 𝑐(' , … 𝑐)& , 𝑐)' , … , 𝑐*+& , 𝑐*+'( (1)
where 𝑐)& and 𝑐)' in each pair represent the identification codes of the cross sections of the columns and
of the beams of the i-th floor, respectively. Each chromosome in the considered population has therefore
2Nf genes.
For each profile chromosome, and therefore for each generic frame, the correspondent seismic
performance is evaluated by means of a limit analysis strategy procedure described in detail in [27],
which represents the internal algorithm in the proposed nested strategy and is briefly recalled in the next
subsection 2.2. The seismic performance of the frame, together with other engineering requirements,
contribute to the definition of the fitness of the profile chromosome and therefore to the identification of
the optimal set of cross sections, as described in subsection 2.3.
2.2 The Internal GA (Seismic assessment algorithm)
Given a profile chromosome 𝐶!"#$, the load factor lo of the horizontal forces is calculated following an
approach which takes into account global collapse mechanisms obtained by means of linear combinations
of three elementary ones: floor, beam and node mechanisms [15].

8
For each collapse mechanism, making use of the virtual work theorem, the value of the load multiplier
lo is given by:
𝜆, =𝑊)-$ −𝑊"#$.
𝑊"#$/ (2)
where 𝑊"#$/ and 𝑊"#$. represent the work done by the horizontal forces and the vertical permanent load,
respectively, and 𝑊)-$ is the internal work concentrated in the plastic hinges. Analysing all the possible
combinations of N elementary mechanisms, the minimum value of lo must be sought in order to obtain
the real collapse load.
The minimization procedure makes again use of genetic algorithms through the definition of the
population of “internal chromosomes” 𝐶0)-$ (h = 1, …, Pint) defined as:
𝐶0)-$ ≡ $𝑐%, 𝑐(, 𝑐1, … , 𝑐2 , … , 𝑐*( (3)
where 𝑐2 = 1 or 𝑐2 = 0 depending on fact that the j-th elementary mechanism is involved in the
combination or not. For these internal algorithms, a number Nint of generations will be considered. Once
the winning internal chromosome is sought through the procedure proposed in [24], the corresponding
final collapse load 𝜆& can be obtained by decreasing the load factor lo taking into account the second
order effects of the work done by the vertical loads as follows:
𝜆& = 𝜆, − 𝛾𝛿 (4)
where 𝛿 is the horizontal displacement of the top of the frame and 𝛾 is the slope of the linear post-elastic
descending branch accounting for the second order effects [27].
An approximated bilinear capacity curve, referred to a monitored point conveniently chosen at the top
floor of the frame is adopted. In Figure 3 the construction of the proposed bilinear capacity curve (black
line), which approximates the actual nonlinear one (red line) is depicted.

9
Figure 3. Approximated bilinear capacity curve [27]
It is worth higligting that, in order to take into account the progressive damage diffusion occurring in
the frame during the collapse, the initial stiffness is an appropriate reduction of the elastic stiffness
as described in [27]. The post-peak slope 𝑘3 is evaluated considering the second order effects and is equal
to 𝑘3 = −𝛾∑ 𝐹2*!24% .
The capacity curve is then truncated considering as ultimate displacement the lowest among those
associated to the achieving of limit states corresponding to two several commonly accepted principles,
namely the global base shear reduction and the achieving of ultimate chord rotations in beams.
The described approximated bilinear curve is representative of the MDOF system and therefore of the
whole frame. According to the procedure reported in [27], the properties of an equivalent SDOF system
and the demand and capacity associated to the Near Collapse (NC) Limit State are compared in order to
evaluate the safety factor. The latter is defined as the ratio between the ultimate displacements of the
equivalent elastic-plastic SDOF system and the seismic demand (displacement at the top floor of the
frame) as recommended by the codes.
ik ek
uu

10
For the evaluation of the seismic demand in the following the procedure proposed in the Italian Code
[30] is employed. In particular, the spectrum here adopted for the worked examples is computed
considering the data associated to the city of Catania (Italy), soil type B, modal damping equal to 5%.
The considered spectrum which is associated to a PGA equal to 0,283 g, is reported in the following
Figure 4.
Figure 4. Design spectrum adopted to assess the seismic vulnerability.
For each profile chromosome 𝐶!"#$two internal genetic algorithms (“Internal GA A” and “Internal GA
B”) are firstly launched for the determination of the collapse loads and failure mechanisms when mass
proportional (A) or inverse triangular (B) horizontal load distributions are applied. The consequent two
values of the collapse loads, say 𝜆&5 and 𝜆&6 , are the minimum ones corresponding to the winning
chromosomes 𝐶5)-$ and 𝐶6)-$ , obtained for the considered load distributions after several runs of the
algorithms (typically Nint=10, in order to avoid local minima). When the two collapse loads are evaluated,
the corresponding safety factors 𝑆𝐹!5 and 𝑆𝐹!6 of the profile chromosome 𝐶!"#$ with respect to expected
seismic demand are calculated.
11
2.3 Fitness calculation
In the identification of the most performant frame many requirements must be considered. One of these
is of course that both the two safety factors described in the previous paragraph must be greater than one.
Other considerations, involving for example the economic cost of the structural members (related to the
weight of the frame) and further engineering design precautions, can be introduced in the definition of
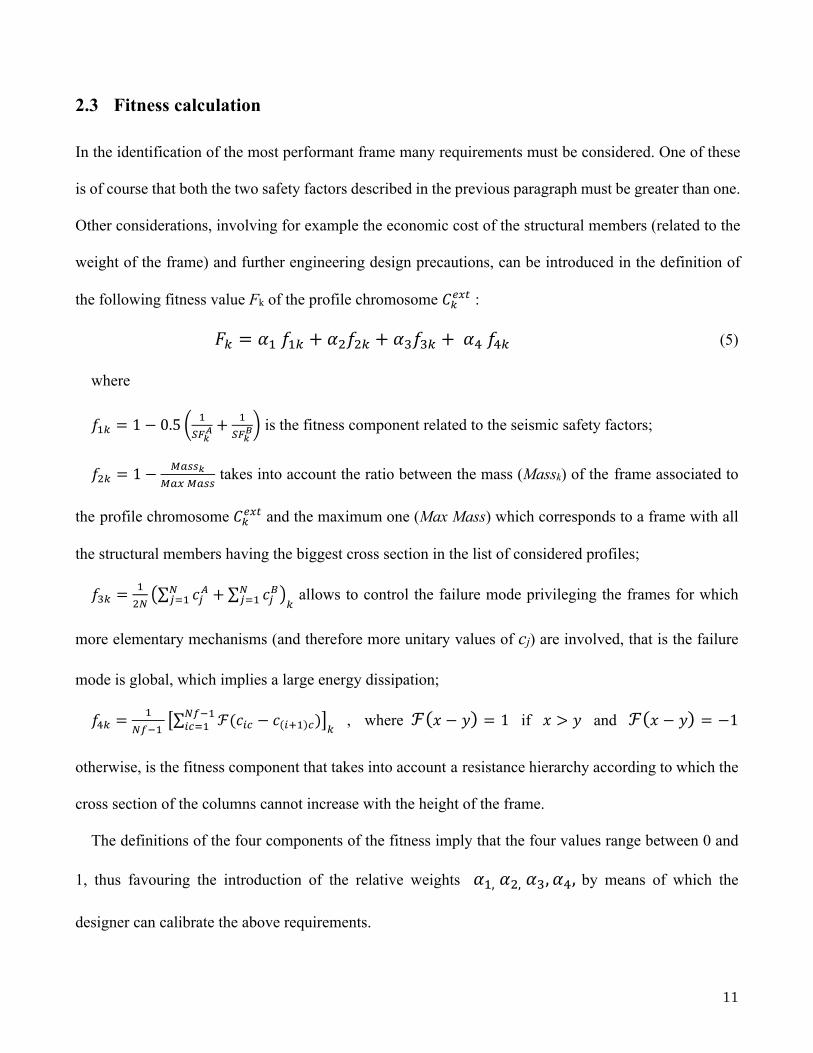
the following fitness value Fk of the profile chromosome 𝐶!"#$ :
𝐹! = 𝛼"𝑓"! + 𝛼#𝑓#! + 𝛼$𝑓$! +𝛼%𝑓%! (5)
where
𝑓%! = 1 − 0.5 8 %78"
# +%78"
$: is the fitness component related to the seismic safety factors;
𝑓(! = 1 − 9:33"9:#9:33
takes into account the ratio between the mass (Massk) of the frame associated to
the profile chromosome 𝐶!"#$ and the maximum one (Max Mass) which corresponds to a frame with all
the structural members having the biggest cross section in the list of considered profiles;
𝑓1! =%(*$∑ 𝑐25*
24% +∑ 𝑐26*24% (
! allows to control the failure mode privileging the frames for which
more elementary mechanisms (and therefore more unitary values of cj) are involved, that is the failure
mode is global, which implies a large energy dissipation;
𝑓<! =%
*+=%;∑ ℱ(𝑐)& − 𝑐()?%)&)
*+=%)&4% ?
! , where ℱ(𝑥 − 𝑦) = 1 if 𝑥 > 𝑦 and ℱ(𝑥 − 𝑦) = −1
otherwise, is the fitness component that takes into account a resistance hierarchy according to which the
cross section of the columns cannot increase with the height of the frame.
The definitions of the four components of the fitness imply that the four values range between 0 and
1, thus favouring the introduction of the relative weights 𝛼",𝛼#,𝛼$, 𝛼%, by means of which the
designer can calibrate the above requirements.
12
Once the fitness of all the profile chromosomes 𝐶!"#$ (k = 1, …, Pext) have been evaluated by means of
a parallel computing procedure, the fitness array is processed by the External GA which produces the
next generation. The process is repeated until the established number of iterations Next has been reached.
The optimal design of the frame is finally achieved considering the set of cross sections for beams and
columns associated to the highest fitness.
3 Algorithm implementation
The algorithm as a whole matches the classic case of a job workflow running Next • Pext times a direct
acyclic graph (DAG) where Next expresses the number of the External GA generations and Pext the
number of profile chromosomes to compute at each cycle. Although several commercial software
products are available to implement this kind of computational workflow, their use may be better justified
in those cases where the process flow may vary during the computation. In the case of the nested genetic
algorithm, from now on briefly called Optimal Design (OD), the computational workflow ever has a
static configuration so that it can be easily controlled by a dedicated set of shell scripts. In particular, as
shown in Figure 2, a main script is in charge of controlling the NetLogo External GA and a number of
worker scripts are in charge to execute the necessary NetLogo Internal GA, A and B, algorithms. The
worker script also computes the final fitness Fk value as soon as all λAB and λAC will be available for each
chromosome Ckext. Once all fitness values have been determined, the main script wakes up the External
GA and a new generation calculation will start till the maximum number Next of repetitions is reached.
The execution coordination among the main and workers scripts is guaranteed by a database instance
which contains just two tables, the first used by workers, holding a task queue and a chromosomes table
populated by workers, containing relevant computed values such as the fitness Fk.
The computation of the OD makes use of the virtualization based on docker containers. Since the
earlier design phases, the virtualization has been considered a key element, because it offers the
13
possibility to run on a wide range of physical platforms, especially those provided by open and private
Cloud infrastructures. This way to access computing infrastructures also becomes a key enabler to let
this work be reproducible and reusable, two important factors in the incoming age of Open Science
(www.fosteropenscience.eu/node/1420) and FAIR principles (www.go-fair.org/fair-principles/)
compliant research data. For this reason, all source codes related to the running environment setup and
the algorithm execution are publicly available in the INFN source code repository, based on GitLab
(baltig.infn.it) inside the ‘optimal design’ project (baltig.infn.it/brunor/optimal_design).
The decision of using docker (www.docker.com) to manage the virtualized resources has been made
for principally two reasons. The first is associated with the simplicity to install, use, and maintain its
environment. The second is related to its software maturity and popularity. For these reasons, docker can
be considered today a standard technology in the world of the virtualization based on containers.
The software development, testing and the final data extraction, have been done executing the OD
algorithm on top of the GARR Cloud Infrastructure (www.garr.it/en/garr-en/documents/documenti-
tecnici/3474-garr-white-paper-maggio-2017), an IaaS provider that uses the virtualization engine
OpenStack (www.openstack.org ). The total amount of resources allocated to the Optimal Design project
was:
66 Instances
100 Virtual CPUs
100 GB Virtual RAM space
1 TB Virtual storage space
132 Upmost number of volumes
Earlier tests have been made on small virtual machines or small-sized virtual clusters, while for the
final data extraction computations four virtual machines made of 24CPU, 24GB of RAM each, have been
used. All these virtual machines have been connected to the same storage volume via NFS and internally
accessible by the same path name: ‘/data’.

14
Using the VM configuration above, it was possible to configure the OD services in the following way:
Service Instances Description
db 1 Database storing the task queue and profiles chromosomes
dbmgr 1 A tiny REST-API service used by workers and main computing scripts to
perform I/O operations on top of the database
master 1 Service controlling the NetLogo External GA
worker 15 Service in charge to execute NetLogo Internal GA 1 and 2 algorithms and
perform the final Fitness calculation.
Web 1 Service used to expose an execution dashboard, a web-dav access to the
computed data, and several other minor services.
4 Applications
In the present paragraph the proposed design strategy is applied to two different steel frames with
respectively 2 and 5 storeys. Therefore, the profile chromosome size is 4 and 10, respectively. The
numbers of the external genetic algorithm generations and of the chromosomes to compute at each cycle
have been chosen respectively equal to Next=30 and Pext=100. The correspondent values for the internal
(A and B) algorithms are Nint=40 Pint=100. Three subsections are here considered; in the first one, the
computational effort required by the proposed procedure is discussed; then, the two worked examples are
described and analysed in the next two subsections.
4.1 Computational analysis of the proposed strategy
In order to provide a computing time estimation for the two considered frames which would not depend
on the number of available resources, the results summarized in Table 1 have been extracted for a single
profile chromosome, considering the average computing time (expressed in seconds) of the internal
algorithms (A and B) and the fitness calculation, extracted from the task queue.

15
Table 1. Computational effort needed by the proposed procedure.
Frame Algorithm Average seconds 2 storey frame Internal GA A; Internal GA B (single run) 10.34; 10.27
Fitness Calculation 10.18
Total time for 1 profile chromosome 20.48
Total time for the whole procedure 614.40
5 storey frame Internal GA A; Internal GA B (single run) 85.35; 85.13
Fitness Calculation 10.25
Total time for 1 profile chromosome 95.49
Total time for the whole procedure 2864.70
In the table, for each frame, the total average computing time per chromosome is reported as the sum
of the two consecutive steps: internal GA time (for a single run, further averaged over A and B) + fitness
calculation time. Since each one of the Pext = 100 profile chromosomes is elaborated in parallel during a
single generation (as well as the 10 runs of each Internal algorithm), the total average computing time
for the whole procedure can be obtained simply multiplying the previous total time for the Next = 30
generations of the external GA and is also reported in bold for both the cases.
Of course, these values hold for unlimited (and homogeneous) resources, but in real cases they depend
on the number of cores effectively available in the virtual infrastructure and on their performance.
Furthermore, it must be pointed out that computing time strongly depends also on the kind of physical
resources beyond the virtualized ones, here provided by the GARR institute; this time can be different if
other cloud providers are adopted or if physical resources are directly used.
4.2 Two-storey frame
The considered frame, reported in Figure 5, has 2 bays each one of length 4 m and 2 storeys with
interstorey height equal to 3 m. The beams are subjected to a permanent distributed vertical load equal to

16
50 kN/m. According to standard seismic analyses two horizontal force distributions are considered,
namely a mass proportional force distribution and an inverse triangular one. The relevant horizontal
forces are summarized in Table 2.
Table 2. Horizontal force distributions (in kN) for the two-storey frame. Force distribution
Mass proportional Inverse triangular F1 400 266.67 F2 400 533.33
Figure 5. First benchmark planar frame (length in m, forces in kN)
The objective of the design strategy is to select the best set of profiles for beams and columns among a
predefined list. In the present application reference is made to steel profiles in the class HEA and 10
possible cross sections are considered as reported in Table 3. Axial and shear deformability are neglected.
The Young’s modulus adopted for the steel is equal to 210000 MPa.
For the considered frame, the generic profile chromosome for the application of the external genetic
algorithm has 4 genes corresponding respectively to the ID of the profile of the beams and columns at
the first and second floor. Since each gene can assume ten different values, the overall number of possible

17
different chromosomes in the population is Pmax = 104. The adopted relative weights are a1=0.2, a2=0.6,
a3=0.1 and a4=0.1.
Table 3. Predefined list of the considered set of adopted cross sections
ID Profile I [cm4] A [cm2] Wp [cm3] Mp [KNm]
1 HE 140A 1033 10.2 173.5 40.7725
2 HE 160A 1673 13.21 245.1 57.5985
3 HE 180A 2510 14.47 324.9 76.3515
4 HE 200A 3692 18.08 429.5 100.9325
5 HE 220A 5410 20.67 568.5 133.5975
6 HE 240A 7763 25.18 744.6 174.981
7 HE 260A 10450 28.76 919.8 216.153
8 HE 280A 13670 31.74 1112 261.32
9 HE 300 A 18260 37.28 1383 325.005
10 HE 320A 22930 41.13 1628 382.58
Performing the proposed nested algorithm strategy, several profile chromosomes are analysed and the
one with the highest fitness will be considered as the winner. In Table 4 the five profile chromosomes
correspondent to the highest values of the fitness are reported together with each rate defined in Eq.(5).
Aiming at a deeper insight on the differences between the above results, more details related to the first
two profile chromosomes shown in the table are provided in the following. In particular, for each one of
the two correspondent frames, the value of the collapse load multiplier lc, the correspondent collapse
mechanism, the ultimate displacement of the equivalent elastic-plastic SDOF system dcu, the seismic
demand dmax and the related safety factors SF for the two considered load conditions are reported in Table
5.

18
Table 4. Five winning profile chromosomes for the two-storey frame
Profile chromosome Fitness f1 (a1=0.2) f2 (a2=0.6) f3 (a3=0.1) f4 (a4=0.1)
[5 5 3 4] 0.613 0.641 0.542 0.6 1
[4 4 3 4] 0.608 0.422 0.574 0.8 1
[5 5 4 4] 0.601 0.656 0.516 0.6 1
[6 5 4 4] 0.594 0.601 0.491 0.8 1
[4 5 3 4] 0.589 0.598 0.559 0.35 1
In the same table, in the bottom panels, a visual representation of the temporal spreading of the winning
profiles among the population of chromosomes is reported for the two cases. In particular, the population
of Pext = 100 profile chromosomes, indicated by coloured cells (different colours correspond to different
chromosomes), is reported in the x-axis, while in the y-axis (from bottom to top) the sequence of the
Next = 30 generations of the external GA is shown: the temporal convergence towards a single colour
expresses the diffusion of the winning chromosome among the population. The single coloured cells,
randomly distributed in the top part of the figure, represent random mutations of the winning
chromosome produced by the GA.
It is interesting to highlight that the fitness of the profile chromosome [5 5 3 4] turns out to be greater
than that of [4 4 3 4] because the former has higher values of the safety factors in both the load conditions.
Nevertheless, it must be pointed out that the latter profile chromosome is associated to smaller
dimensions of the cross sections of columns and beams at the first floor and therefore its realization is
economically more convenient. This consideration allows to underline that the provided results are
deeply related to the weights introduced for each component of the fitness function which can be
conveniently calibrated according to desired requirements.

19
Table 5. Comparison between two profile chromosomes of the two-storey frame
[5 5 3 4] [4 4 3 4]
λAB 0.301 0.239
Collapse Mech_A
dcuA 0.247 0.186
dmaxA 0.114 0.140
SFA
2.167 1.324
λAC 0.271 0.215
Collapse Mech_B
dcuB 0.250 0.187
DmaxB 0.129 0.150
SFB 1.945 1.250
Temporal
spreading

20
4.3 Five-storey frame
The second application refers to a frame with three bays and five storeys. The storey height is equal
to 3.2 m and the length of the bays is 6.5 m (Figure 6). The beams are subjected to a permanent distributed
vertical load equal to 25 kN/m while the horizontal forces in the two considered load conditions are
reported in Table 6.
Figure 6. Second benchmark planar frame (length in m, forces in kN)

21
Table 6. Horizontal force distributions (in kN) for the five-storey frame.
Force distribution Mass proportional Inverse triangular
F1 325.00 108.33 F2 325.00 216.67 F3 325.00 325.00 F4 325.00 433.33 F5 325.00 541.67
Table 7 reports the five profile chromosomes, obtained with the proposed design strategy, which
correspond to the highest values of the fitness. Each rate of the fitness defined in Eq.(5) is also reported.
Table 7. Five winning profile chromosomes for the five-storey frame
Profile chromosome Fitness f1 (a1=0.2) f2 (a2=0.6) f3 (a3=0.1) f4 (a4=0.1)
[5 3 5 3 5 2 3 2 1 1] 0.690 0.580 0.624 1 1
[6 3 6 3 5 3 4 3 1 2] 0.687 0.738 0.582 0.895 1
[6 3 5 4 5 3 4 3 1 2] 0.685 0.743 0.582 0.868 1
[7 4 5 4 3 3 3 3 1 2] 0.684 0.763 0.588 0.789 1
[8 3 7 3 4 3 4 3 1 2] 0.677 0.744 0.563 0.894 1
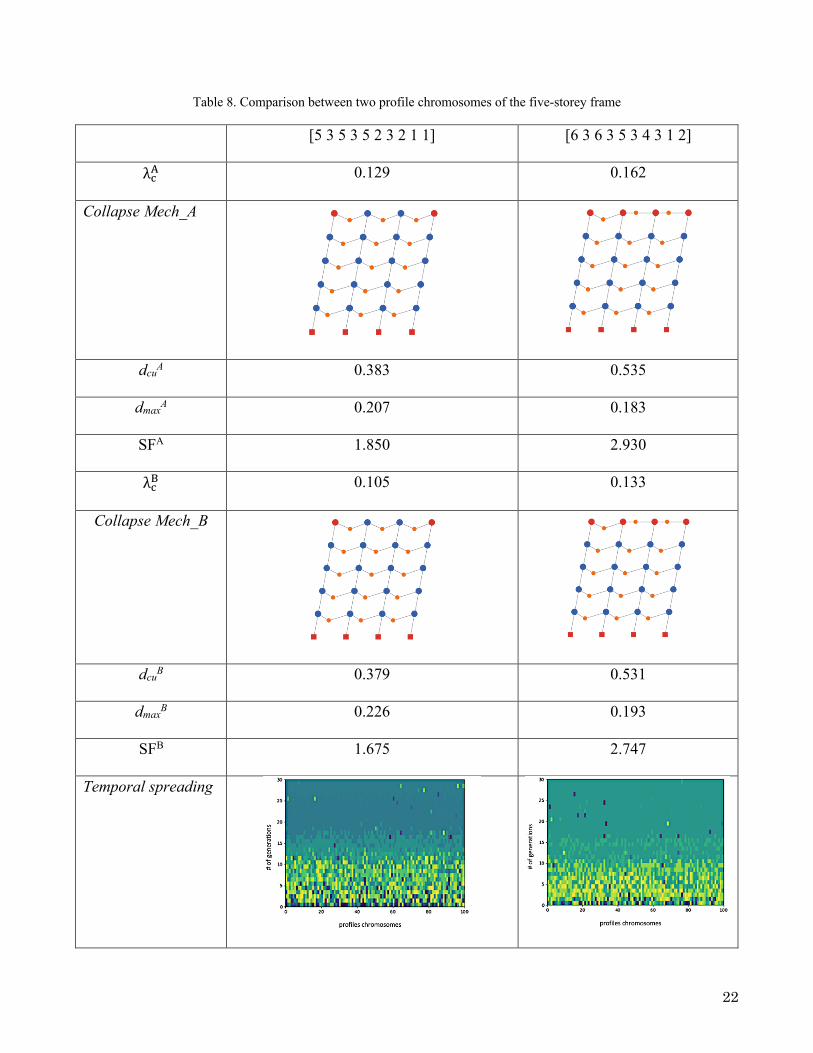
Again, for this frame a comparison between the two best profile chromosomes is performed and the
details are reported in Table 8.
It is interesting to point out that, adopting in the design processes of the two and five storey frames the
same values of the relative weights 𝛼",𝛼#,𝛼$, 𝛼%, the safety factors and the total mass play different
roles in the identification of the winning profile chromosome. Actually, differently than what happened
for the smaller frame described in the previous paragraph, in the case of the five storey frame, the
chromosome with the best fitness has smaller safety factors with respect to those of the second one but
its total mass (and therefore its economic cost) is smaller.
22
Table 8. Comparison between two profile chromosomes of the five-storey frame
[5 3 5 3 5 2 3 2 1 1] [6 3 6 3 5 3 4 3 1 2]
λAB 0.129 0.162
Collapse Mech_A
dcuA 0.383 0.535
dmaxA 0.207 0.183
SFA 1.850 2.930
λAC 0.105 0.133
Collapse Mech_B
dcuB 0.379 0.531
dmaxB 0.226 0.193
SFB 1.675 2.747
Temporal spreading

23
In fact, as it can be easily noticed, all the structural members of the winning profile chromosome have
cross sections smaller, or at least equal, to those of the frame described by the second best chromosome.
It is worth noticing anyway that the difference between the values of the fitness of the two best
chromosomes is small and therefore, as already pointed out, a small change in the relative weights could
lead to different final results. Therefore, according to his wishes, the designer can privilege one of the
introduced requirements ore add some new ones in the definition of the fitness of a profile chromosome.
5 Conclusions
The present paper proposes an original multi-objective strategy for the optimal plastic design of frames
subjected to seismic excitations. The procedure is based on the application of two different genetic
algorithms launched in a nested structure. In particular, when the geometry (lengths of the beams and of
the columns) and loads acting on the frame that must be designed are assigned, the external algorithm is
able to explore among different configurations associated to different size of the cross sections of the
member. Each configuration is associated to a fitness that considers many engineering requirements for
an optimal design and embeds the modern concepts to assure a good overall behaviour of the structure
(e.g. global ductility, hierarchy criterion, high energy dissipation in seismic conditions). One of these
requirements is the safety factor of the considered frame with respect to seismic expected excitations and
this is calculated by means of the internal genetic algorithm. In addition, the economic cost in the
realization of the frame, related to its total mass, is accounted for. The application of the proposed
procedure to two steel frames of different size allows highlighting the importance of the definition of the
fitness and of the weights associated to each one of its components. The proposed procedure must be
therefore considered as a proposal for a new design strategy which can be either enriched taking into
account other fitness components or opportunely calibrated according to specific requirements. It is
24
worth noticing that the software implementation has been conceived in order to let this work be
reproducible and reusable, according to the Open Science paradigm and FAIR principles.
Acknowledgments
This research was funded by the University of Catania, with the projects "Linea di intervento 2 e Starting Grant del Piano di incentivi per la ricerca di Ateneo 2020/2022 " of the Departments of Civil Engineering and Architecture and Physics and Astronomy "Ettore Majorana" and by the Italian Ministry of University and Research with the project “PRIN2017 linea Sud: Stochastic forecasting in complex systems”. Part of the resources used in this work have been provided by the Cloud infrastructure at GARR, the Italian Research and Education Network.
References
1. EN 1998-3 (2005) (English): Eurocode 8: Design of structures for earthquake resistance – Part 3: Assessment and retrofitting of buildings [Authority: The European Union Per Regulation 305/2011, Directive 98/34/EC, Directive 2004/18/EC]
2. Sasmal, S., Ramanjaneyulu, K. Evaluation of strength hierarchy of beam-column joints of existing RC structures under seismic type loading (2012) Journal of Earthquake Engineering.
3. Gen Mitsuo, Cheng Runwei. Genetic algorithms and engineering optimization,vol. 7. John Wiley & Sons; 2000.
4. Kaveh, A., Talatahari, S. Optimum design of skeletal structures using imperialist competitive algorithm (2010) Computers and Structures.
5. Kaveh, A., Ghafari, M.H., Gholipour, Y. Optimum seismic design of steel frames considering the connection types (2017) Journal of Constructional Steel Research.
6. Kaveh, A., Biabani Hamedani, K., Milad Hosseini, S., Bakhshpoori, T. Optimal design of planar steel frame structures utilizing meta-heuristic optimization algorithms (2020) Structures.
7. Maheri, M.R., Talezadeh, M. An Enhanced Imperialist Competitive Algorithm for optimum design of skeletal structures (2018) Swarm and Evolutionary Computation.
8. Gholizadeh, S. Performance-based optimum seismic design of steel structures by a modified firefly algorithm and a new neural network (2015) Advances in Engineering Software.
9. Mansouri, S.F., Maheri, M.R. Performance-based seismic design of steel frames using constraint control method (2019) Advances in Structural Engineering.
10. Málaga-Chuquitaype, C., Elghazouli, A.Y., Bento, R. Rigid-plastic models for the seismic design and assessment of steel framed structures (2009) Earthquake Engineering and Structural Dynamics.
11. Mergos, P.E. Efficient optimum seismic design of reinforced concrete frames with nonlinear structural analysis procedures 2018) Structural and Multidisciplinary Optimization.
12. Fragiadakis, M., Lagaros, N.D., Papadrakakis, M. Performance-based multiobjective optimum design of steel structures considering life-cycle cost (2006) Structural and Multidisciplinary Optimization.

25
13. Hill R (1950). The mathematical theory of plasticity, Oxford University Press.
14. Heyman, J. (1971). Plastic Design of Frames. Cambridge: Cambridge University Press.
15. Neal BG (1977). The Plastic Methods of Structural Analysis, Chapman and Hall
16. Livesley RK. Linear programming in structural analysis and design. In:Gallagher RH et al., editors. Optimum structural design. New York: Wiley;1977 [Chapter 6].
17. Horne MR, Morris LJ (1981). Plastic Design of Low-Rise Frames, Constrado Monographs, Collins, London.
18. Kaneko, I., Maier, G. Optimum design of plastic structures under displacement constraints (1981) Computer Methods in Applied Mechanics and Engineering.
19. Park, H.S., Adeli, H. A neural dynamics model for structural optimization-Application to plastic design of structures (1995) Computers and Structures.
20. Mazzolani, F.M., Piluso, V. Plastic design of seismic resistant steel frames (1997) Earthquake Engineering and Structural Dynamics, 26 (2), pp. 167-191.
21. Goel, S.C., Liao, W.C., Bayat, M.R., Chao, S.H. Performance-based plastic design (PBPD) method for earthquake-resistant structures: An overview (2010) Structural Design of Tall and Special Buildings.
22. da Silva, L.S., Simões, R., Gervásio, H. Design of Steel Structures (2014) Design of Steel Structures.
23. B.G. Neal, P.S. Symonds, The calculations of collapse loads for framed structures (1951). Journal of Institution of Civil Engineering, 35, pp. 21-40.
24. Greco, A., Cannizzaro, F., Pluchino, A. Seismic collapse prediction of frame structures by means of genetic algorithms (2017) Engineering Structures, 143, pp. 152-168.
25. Greco, A., Pluchino, A., Cannizzaro, F. An improved ant colony optimization algorithm and its applications to limit analysis of frame structures (2019) Engineering Optimization. 51(11), pp. 1867-1883
26. Greco, A., Cannizzaro, F., Pluchino, A. Automatic evaluation of plastic collapse conditions for planar frames with vertical irregularities (2019) Engineering with Computers, 35 (1), pp. 57-73.
27. Greco, A., Cannizzaro, F., Pluchino, A. A novel procedure for the assessment of the seismic performance of frame structures by means of limit analysis. Bull Earthquake Eng 18, 4363–4386 (2020).
28. Challamel, N. An application of large displacement limit analysis to frame structures (2009) Structural Engineering and Mechanics, 33 (2), pp. 159-177.
29. U. Wilensky, NetLogo, http://ccl.northwestern.edu/netlogo. Center for Connected Learning and Computer-Based Modeling. Northwestern University, Evanston, IL 1999.
30. Norme Tecniche per le Costruzioni (NTC2018) (2018) Gazzetta Ufficiale, n. 42 del 20/02/2018-Supplemento ordinario no. 8 (in Italian)