Embed Size (px)
Citation preview
Metabolomic Profile of Umbilical Cord Blood Plasma fromEarly and Late Intrauterine Growth Restricted (IUGR)Neonates with and without Signs of Brain VasodilationMagdalena Sanz-Cortés1☯, Rodrigo J. Carbajo2☯, Fatima Crispi1, Francesc Figueras1, Antonio Pineda-Lucena2*, Eduard Gratacós1*
1 Department of Maternal-Fetal Medicine, Institute Clinic of Gynecology, Obstetrics and Neonatology, Hospital Clinic, Institut de Investigacions BiomèquesAugust Pi-Sunyer (IDIBAPS), Universitat de Barcelona, Barcelona, Spain, 2 Structural Biochemistry Laboratory, Centro de Investigación Príncipe Felipe,Valencia, Spain
Abstract
Objectives: To characterize via NMR spectroscopy the full spectrum of metabolic changes in umbilical vein bloodplasma of newborns diagnosed with different clinical forms of intrauterine growth restriction (IUGR).Methods: 23 early IUGR cases and matched 23 adequate-for-gestational-age (AGA) controls and 56 late IUGRcases with 56 matched AGAs were included in this study. Early IUGR was defined as a birth weight <10th centile,abnormal umbilical artery (UA) Doppler and delivery <35 weeks. Late IUGR was defined as a birth weight <10th
centile with normal UA Doppler and delivery >35 weeks. This group was subdivided in 18 vasodilated (VD) and 38non-VD late IUGR fetuses. All AGA patients had a birth weight >10th centile. 1H nuclear magnetic resonance (NMR)metabolomics of the blood samples collected from the umbilical vein at delivery was obtained. Multivariate statisticalanalysis identified several metabolites that allowed the discrimination between the different IUGR subgroups, andtheir comparative levels were quantified from the NMR data.Results: The NMR-based analysis showed increased unsaturated lipids and VLDL levels in both early and late IUGRsamples, decreased glucose and increased acetone levels in early IUGR. Non-significant trends for decreasedglucose and increased acetone levels were present in late IUGR, which followed a severity gradient when the VDand non-VD subgroups were considered. Regarding amino acids and derivatives, early IUGR showed significantlyincreased glutamine and creatine levels, whereas the amounts of phenylalanine and tyrosine were decreased in earlyand late-VD IUGR samples. Valine and leucine were decreased in late IUGR samples. Choline levels weredecreased in all clinical subforms of IUGR.Conclusions: IUGR is not associated with a unique metabolic profile, but important changes are present in differentclinical subsets used in research and clinical practice. These results may help in characterizing comprehensivelyspecific alterations underlying different IUGR subsets.
Citation: Sanz-Cortés M, Carbajo RJ, Crispi F, Figueras F, Pineda-Lucena A, et al. (2013) Metabolomic Profile of Umbilical Cord Blood Plasma from Earlyand Late Intrauterine Growth Restricted (IUGR) Neonates with and without Signs of Brain Vasodilation . PLoS ONE 8(12): e80121. doi:10.1371/journal.pone.0080121
Editor: Olivier Baud, Hôpital Robert Debré, France
Received June 4, 2013; Accepted September 30, 2013; Published December 2, 2013
Copyright: © 2013 Sanz-Cortés et al. This is an open-access article distributed under the terms of the Creative Commons Attribution License, whichpermits unrestricted use, distribution, and reproduction in any medium, provided the original author and source are credited.
Funding: This study was financed by Fundacion dexeus (www.fundaciondexeus.org). The funders had no role in study design, data collection andanalysis, decision to publish or preparation of the manuscript.
Competing interests: The authors have declared that no competing interests exist.
* Email: [email protected] (EG); [email protected] (APL)
☯ These authors contributed equally to this work.
Introduction
Intrauterine growth restriction (IUGR) affects 7-10% of allpregnancies [1] and is defined by the underachievement of thegenetic growth potential in the fetus. IUGR is associated withan increased risk for adverse perinatal outcome [2–4] and longterm fetal programming in the form of cardiovascular disease,
metabolic syndrome and neurological deficits [5–8]. The early-onset forms of IUGR represent the most severe [6,9] but lessprevalent presentation of this condition. Early-onset IUGR isconsistently associated with abnormalities in feto-placentalDoppler and with severe placental insufficiency [10–12]. Late-onset forms of IUGR, -also referred to as small for gestationalage (SGA) [2]-, are far more prevalent than early IUGR, but
PLOS ONE | www.plosone.org 1 December 2013 | Volume 8 | Issue 12 | e80121
they represent a more heterogeneous condition. While, as awhole, late-onset IUGR is associated with signs of placentalinjury and poorer perinatal outcome [13], there are importantindividual differences in the feto-placental Doppler responseand a proportion of these fetuses present with relatively normalperinatal outcomes. There is general agreement that it is likelythat different causes may lead to late-onset IUGR [14] and thatpart of late IUGR fetuses are merely constitutionally small [15].However, clinical clues to differentiate specific groups withinthis diagnostic category are still scarce. Research over recentyears has demonstrated that a subgroup of late-onset IUGRhave signs of increased brain perfusion as measured by middlecerebral artery (MCA) Doppler [16].This subset hasconsistently been reported to present poorer perinatal outcome[16–19]. In contrast, fetuses with normal brain Doppler havesimilar outcomes when compared to fetuses with normalgrowth [16,19]. Since brain vasodilation is a response tohypoxia [20], it has been suggested that late IUGR fetuses withincreased brain perfusion represent milder forms of a “late-onset placental disease” group with milder but similar featuresto early-IUGR fetuses [16,21]. However, there are no groundsto support these assumptions. In addition, it is unknownwhether those SGA fetuses with no Doppler changes in braincirculation are merely milder forms of the same disease,whether they are constitutionally small fetuses, or whether theyrepresent another pathogenic pathway leading to abnormallylow fetal growth.
Metabolomics is considered a powerful approach to studythe multivariate metabolic responses to physiological and/orpathological stressors, providing integrative information aboutpatterns of disease [22–24]. Recently, two studies reported thatthe metabolic blood profiles of IUGR newborns expresssignificant differences in glucose and amino acid metaboliclevels in comparison with controls [25,26]. However, thespecific metabolomic patterns of the different clinical forms ofIUGR have not been investigated. We hypothesized thatmetabolomics could be helpful in elucidating whether there arepathophysiological differences behind the above describedIUGR subsets.
The aim of this prospective study was to characterize the fullspectrum of metabolic changes in cord blood plasma ofnewborns diagnosed with different clinical forms of IUGR. Weused a metabolomics approach based on 1H-NMRspectroscopy. Three clinical groups of early-onset IUGR, late-onset IUGR with normal brain Doppler and late-onset IUGRwith Doppler signs of vasodilation were recruited andcompared with matched normally grown neonates.
Materials and Methods
This study was conducted at the Maternofetal MedicineResearch Group, Hospital Clinic, Barcelona Spain and at theCentro de Investigación Príncipe Felipe, Valencia, Spain. Thestudy protocol was approved by the Hospital Clinic ofBarcelona ethics committee and all patients that were includedfor this study provided a written informed consent for theirinclusion in the study and the blood obtained from theirneonates as their legal guardians. IRB (2012/7684)
Study populationsThe study design was a prospective cohort study that
included 79 cases diagnosed with IUGR (23 early and 56 lateIUGR) and 79 control subjects (23 matched for early IUGR and56 for late IUGR) with a birth weight appropriate for gestationalage. Pregnancies were dated by the first-trimester crown-rumplength measurement [27]. Patients that were enrolled in thisstudy were identified before delivery from singletonpregnancies by performing a detailed ultrasound-Dopplerassessment within one week before delivery. In all studyparticipants full prenatal information was available. Our samplewas classified in early and late IUGR defined as an estimatedand confirmed birth weight below the 10th centile according tolocal standards [28]. Additional defining criteria for early IUGRfetuses: 1) Gestational age at birth 34 weeks or less; 2)Umbilical artery Doppler pulsatility index (PI) >95th centile [29]in at least two consecutive examinations 24 hours apart. LateIUGR neonates were also defined by: 1) Gestational age atdelivery equal or above 35 weeks; 2) Normal umbilical arteryDoppler PI (below 95th centile) [29]. Late IUGR samples weredivided into two subgroups: Vasodilated late-IUGR if theypresented a MCA PI value <5th centile [30] in at least twoconsecutive examinations 24 hours apart and non-vasodilatedlate IUGR cases if their MCA PI was >5th centile. Controlsubjects were singleton appropriate-for-gestational-age (AGA)fetuses (birth weight >10th centile according to local standards[28]) that were matched with cases by gestational age atdelivery (± 7 days) and gender. Subjects were considered non-eligible in the presence of any of the following: Congenitalmalformations or chromosomal defects, congenital infections,clinical chorioamnionitis or maternal disease such asautoimmune disease or the presence of cardiovascular riskfactors such as diabetes mellitus, pregestational dyslipidemiaor BMI >35.
Clinical and Ultrasound parametersAll IUGR fetuses underwent a detailed anatomical and
Doppler examination. Prenatal Doppler parameters such asumbilical artery PI and MCA PI were prospectively recorded.Prenatal Doppler ultrasound examinations were performedusing a Siemens Sonoline Antares scanner (Siemens medicalsystems, Malvern, PA, USA) and a 6-2 MHz linear-curved-array transducer. Spectral Doppler parameters were obtainedautomatically from three or more consecutive waveforms withthe angle of insonation as close to zero as possible. Umbilicalartery PI was obtained on a free floating cord loop. MCA PIwas obtained in a transversal view of the fetal head, at its originfrom the circle of Willis.
The administration of oral or endovenous maternal drugs twoweeks before or at delivery was recorded in all IUGR casesand controls.
Samples500 µl of blood was obtained from the umbilical vein after
cord clamping at delivery from each subject and kept in EDTA-treated tubes. All samples were processed within 1 hour.Plasma was separated by centrifugation at 3000 rpm for 10minutes at 4°C; samples were stored immediately at -80°C in
Metabolomic Profile in IUGR
PLOS ONE | www.plosone.org 2 December 2013 | Volume 8 | Issue 12 | e80121
aliquots such that freeze-thawing was minimized. Sampleswere transported in dry ice for the metabolomics analysis.
Preparation of neonatal serum samples for metabolomicanalysis by 1H-NMR was carried out according to establishedprotocols [31,32]. Before analysis, the samples were thawed atroom temperature. 200 µl of sample was mixed with 400 µl of0.9% saline solution (wt/vol, NaCl in 90% H2O/10% D2O) andthen centrifuged at 11,400 rpm for 5 min at 4°C. 550 µl of thesupernatant was added to a 5 mm NMR tube, kept in ice, andleft at room temperature for 30 minutes before measurement.Case and control samples were selected for analysis in arandom order.
A preparation of the drugs that were administered to themother before or at delivery was obtained for NMR analysis(100% D2O, 500 µl final volume).
NMR SpectroscopyAll spectra were recorded at 27°C with a Bruker Ultrashield
Plus Avance II 600 MHz spectrometer (Bruker Biospin,Rheinstetten, Germany) equipped with a 5-mm cryogenically-cooled TCI probe. For each serum sample Carr-Purcell-Meiboom-Gill (CPMG) [33] and noesy1D spectra wereacquired. The CPMG relaxation-editing pulse sequence wascollected with a total of 128 accumulations and 32K data pointsover a spectral width of 20 ppm. The number of loops was setto total 40 ms of spin-spin relaxation delay and a 3 s relaxationdelay was included between FIDs during which waterirradiation was applied to suppress the H2O signal. 1H noesy1Dspectra were collected using 128 scans, 32K data points, 20ppm of spectral width, 4 s relaxation delay and 10 ms of mixingtime. Water presaturation was applied during both relaxationand mixing times. For both experiments a line broadening of1.0 Hz was applied to the FID which was zero-filled to doublethe number of Fourier domain points. Spectra were phasedmanually and the baseline corrected automatically usingTopSpin (v. 1.3, Bruker BioSpin, Rheinstetten, Germany).Chemical shifts were referenced internally to the CH3
resonance of alanine at 1.47 ppm. To aid in metaboliteidentification 2D J-resolved (8 transients and 80 increments),1H,1H-TOCSY and 13C-HSQC experiments were acquired forselected samples, using 256-512 increments, 32-128 transientsand 1.5 s for relaxation delay. For reference and possibleinterferences in metabolite identification, 1H NMR spectra in100% D2O (32 scans, 32K data points, 14 ppm of spectralwidth) were recorded for all the maternal drugs supplied.
Data processing and statistical analysisEach NMR spectrum was used to construct data matrices for
the statistical analysis by dividing it (from 10.0 to 0.0 ppm) intobuckets of fixed (0.05 ppm) or variable sizes that wereintegrated using Amix (v. 3.9.7, Bruker BioSpin, Rheinstetten,Germany). The water resonance region (5.15-4.40 ppm) wasexcluded from the analysis. Buckets were normalized to thesum of total spectral intensity to minimize potential differencesin concentration between samples. The identification ofmetabolites was performed through a combination of 1H/13Cchemical shifts, J-couplings, TOCSY NMR data and theircomparison to metabolite NMR parameters described in
literature references 34,35. For the quantification of selectedmetabolites, the region or regions corresponding to their NMRsignals in the CPMG spectra were integrated. The areas inbetween the relevant regions were also integrated to fully coverthe spectral width of the 1H (0-10 ppm) with the exception ofthe water signal region (4.40-5.15 ppm) that was convenientlyexcluded. The integrated spectrum was then normalized tototal area. Results were presented as mean ± standard error ofthe mean (s.e.m.). Statistical significance of the data wasdetermined using the non-parametric Mann-Whitney U test orANOVA (Tukey-Kramer post hoc test) where appropriate. P-values < 0.05 were considered to be statistically significant.
Multivariate data analysis was performed using SIMCA-P+ v.12.0 (Umetrics AB, Umeå, Sweden). Data were scaled usingthe Pareto method (each value divided by the square root ofthe standard deviation of each variable), which is normally thebest choice in the case of spectroscopic data as it decreasesthe relative importance of highly abundant metabolites but atthe same time preserves data structure. Mean centering wasapplied to the scaled data. Unsupervised principal componentsanalysis (PCA) was used for the overview of individual classesand all classes jointly, to observe clustering or separationtrends and for the identification of outliers. PCA loading plotswere used to identify metabolites responsible for anyseparation observed. Supervised multivariate analysis wascarried out with Partial Least Squares Discriminant Analysis(PLS-DA) and orthogonal PLS-DA (OPLS-DA). Evaluation ofthe PLS/OPLS-DA models was performed using the goodness-of-fit parameter R2Y (variation in class membership explainedby the model) and the predictive ability parameter Q2
(goodness of prediction, calculated by 7-fold internal cross-validation). Models were externally validated by building amodel with 2/3 of the data set and predicting the remaining 1/3in turn, using Fisher’s probability as quality probe of theclassification (<0.01 generally considered a good prediction).Classification results were used to define True Positives (TP),True Negatives (TN), False Positives (FP) and False Negatives(FN) and therefore calculate as percent sensitivity [TP/(TP +FN) × 100] and specificity [TN/(TN + FP) × 100]. The CV-ANOVA (Analysis Of Variance testing of Cross-Validatedpredictive residuals) included in SIMCA was also used forassessing the reliability of the PLS/OPLS models. P-values(likelihood of obtaining such a classification by chance) lowerthan 0.05 were indicative of a significant model. In those OPLSmodels showing clear separation between classes in the scoreplots, the metabolites responsible for the separation wereidentified from the loading and the predictive S-plots(combination of modelled covariance and modelled correlationin a scatter plot). Those variables presenting high magnitudeand reliability in the S-plot and adequate confidence intervals inthe loading plot were further investigated for putative biomarkeridentification.
Student’s t test for independent samples and Pearson’s X2 orFisher’s exact tests were used to compare quantitative andqualitative clinical and demographic data respectively usingSPSS statistical software, version 17.0 (SPSS for Windows,SPSS Inc, Chicago, IL, USA). A p value < 0.05 was consideredstatistically significant.
Metabolomic Profile in IUGR
PLOS ONE | www.plosone.org 3 December 2013 | Volume 8 | Issue 12 | e80121
Results
Study populationsFrom the initially selected samples, 3 obtained from early
IUGR cases and 1 AGA sample from the late subset had to beexcluded due to the detection of sample contamination at themoment of aliquotation (3) and the repeal from the parents tobe included in this study (1), leaving 20 cases vs. 23 controls inthe early subset and 56 cases vs. 55 controls in the late subsetfor metabolomic analysis.
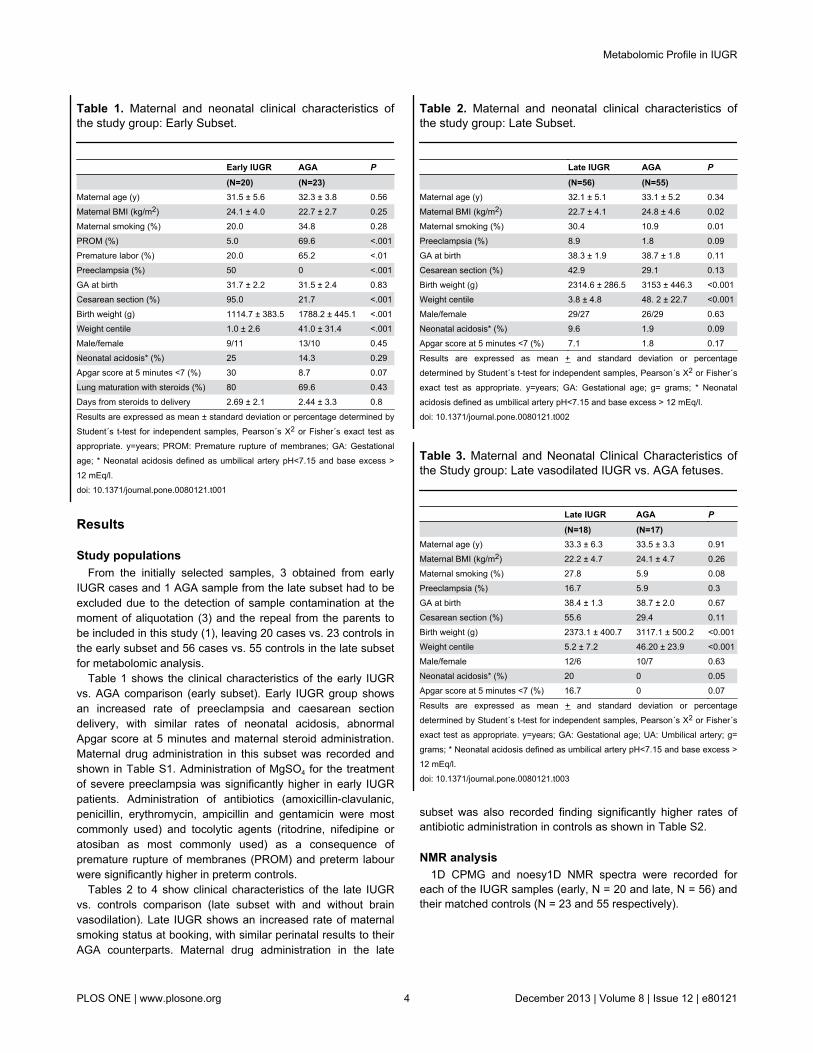
Table 1 shows the clinical characteristics of the early IUGRvs. AGA comparison (early subset). Early IUGR group showsan increased rate of preeclampsia and caesarean sectiondelivery, with similar rates of neonatal acidosis, abnormalApgar score at 5 minutes and maternal steroid administration.Maternal drug administration in this subset was recorded andshown in Table S1. Administration of MgSO4 for the treatmentof severe preeclampsia was significantly higher in early IUGRpatients. Administration of antibiotics (amoxicillin-clavulanic,penicillin, erythromycin, ampicillin and gentamicin were mostcommonly used) and tocolytic agents (ritodrine, nifedipine oratosiban as most commonly used) as a consequence ofpremature rupture of membranes (PROM) and preterm labourwere significantly higher in preterm controls.
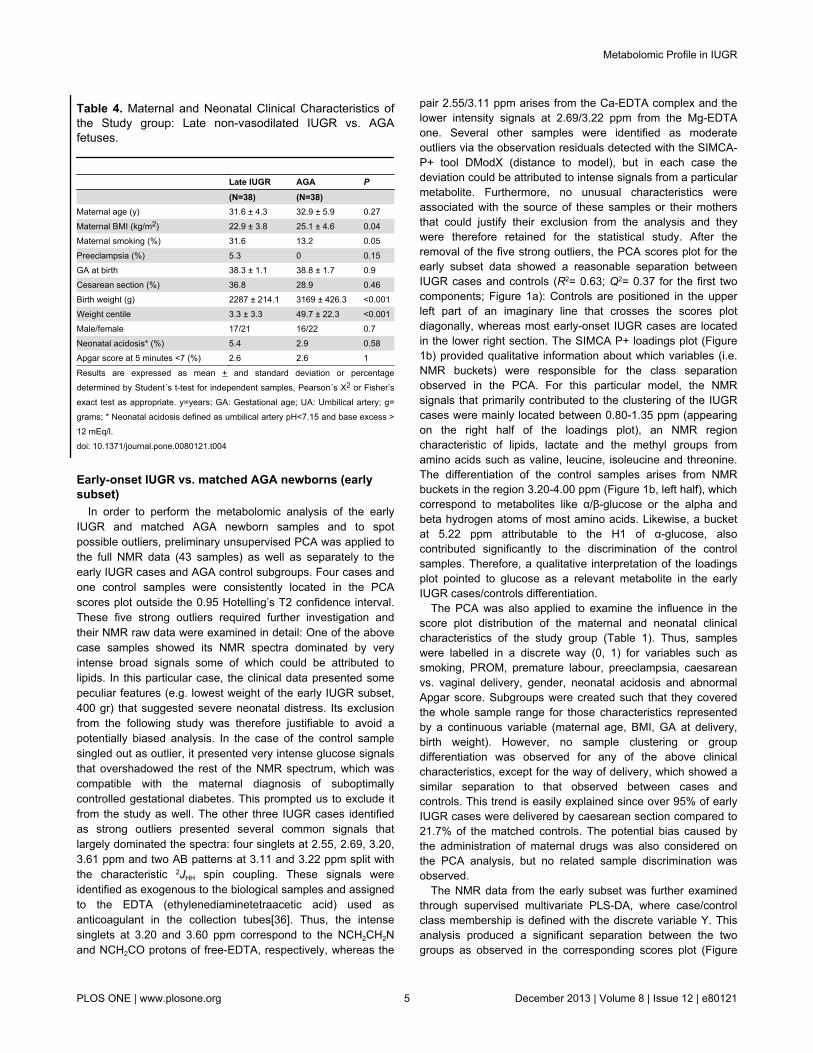
Tables 2 to 4 show clinical characteristics of the late IUGRvs. controls comparison (late subset with and without brainvasodilation). Late IUGR shows an increased rate of maternalsmoking status at booking, with similar perinatal results to theirAGA counterparts. Maternal drug administration in the late
Table 1. Maternal and neonatal clinical characteristics ofthe study group: Early Subset.
Early IUGR AGA P (N=20) (N=23) Maternal age (y) 31.5 ± 5.6 32.3 ± 3.8 0.56Maternal BMI (kg/m2) 24.1 ± 4.0 22.7 ± 2.7 0.25Maternal smoking (%) 20.0 34.8 0.28PROM (%) 5.0 69.6 <.001Premature labor (%) 20.0 65.2 <.01Preeclampsia (%) 50 0 <.001GA at birth 31.7 ± 2.2 31.5 ± 2.4 0.83Cesarean section (%) 95.0 21.7 <.001Birth weight (g) 1114.7 ± 383.5 1788.2 ± 445.1 <.001Weight centile 1.0 ± 2.6 41.0 ± 31.4 <.001Male/female 9/11 13/10 0.45Neonatal acidosis* (%) 25 14.3 0.29Apgar score at 5 minutes <7 (%) 30 8.7 0.07Lung maturation with steroids (%) 80 69.6 0.43Days from steroids to delivery 2.69 ± 2.1 2.44 ± 3.3 0.8
Results are expressed as mean ± standard deviation or percentage determined byStudent´s t-test for independent samples, Pearson´s X2 or Fisher´s exact test asappropriate. y=years; PROM: Premature rupture of membranes; GA: Gestationalage; * Neonatal acidosis defined as umbilical artery pH<7.15 and base excess >12 mEq/l.doi: 10.1371/journal.pone.0080121.t001
subset was also recorded finding significantly higher rates ofantibiotic administration in controls as shown in Table S2.
NMR analysis1D CPMG and noesy1D NMR spectra were recorded for
each of the IUGR samples (early, N = 20 and late, N = 56) andtheir matched controls (N = 23 and 55 respectively).
Table 2. Maternal and neonatal clinical characteristics ofthe study group: Late Subset.
Late IUGR AGA P (N=56) (N=55) Maternal age (y) 32.1 ± 5.1 33.1 ± 5.2 0.34Maternal BMI (kg/m2) 22.7 ± 4.1 24.8 ± 4.6 0.02Maternal smoking (%) 30.4 10.9 0.01Preeclampsia (%) 8.9 1.8 0.09GA at birth 38.3 ± 1.9 38.7 ± 1.8 0.11Cesarean section (%) 42.9 29.1 0.13Birth weight (g) 2314.6 ± 286.5 3153 ± 446.3 <0.001Weight centile 3.8 ± 4.8 48. 2 ± 22.7 <0.001Male/female 29/27 26/29 0.63Neonatal acidosis* (%) 9.6 1.9 0.09Apgar score at 5 minutes <7 (%) 7.1 1.8 0.17
Results are expressed as mean + and standard deviation or percentagedetermined by Student´s t-test for independent samples, Pearson´s X2 or Fisher´sexact test as appropriate. y=years; GA: Gestational age; g= grams; * Neonatalacidosis defined as umbilical artery pH<7.15 and base excess > 12 mEq/l.doi: 10.1371/journal.pone.0080121.t002
Table 3. Maternal and Neonatal Clinical Characteristics ofthe Study group: Late vasodilated IUGR vs. AGA fetuses.
Late IUGR AGA P (N=18) (N=17) Maternal age (y) 33.3 ± 6.3 33.5 ± 3.3 0.91Maternal BMI (kg/m2) 22.2 ± 4.7 24.1 ± 4.7 0.26Maternal smoking (%) 27.8 5.9 0.08Preeclampsia (%) 16.7 5.9 0.3GA at birth 38.4 ± 1.3 38.7 ± 2.0 0.67Cesarean section (%) 55.6 29.4 0.11Birth weight (g) 2373.1 ± 400.7 3117.1 ± 500.2 <0.001Weight centile 5.2 ± 7.2 46.20 ± 23.9 <0.001Male/female 12/6 10/7 0.63Neonatal acidosis* (%) 20 0 0.05Apgar score at 5 minutes <7 (%) 16.7 0 0.07
Results are expressed as mean + and standard deviation or percentagedetermined by Student´s t-test for independent samples, Pearson´s X2 or Fisher´sexact test as appropriate. y=years; GA: Gestational age; UA: Umbilical artery; g=grams; * Neonatal acidosis defined as umbilical artery pH<7.15 and base excess >12 mEq/l.doi: 10.1371/journal.pone.0080121.t003
Metabolomic Profile in IUGR
PLOS ONE | www.plosone.org 4 December 2013 | Volume 8 | Issue 12 | e80121
Early-onset IUGR vs. matched AGA newborns (earlysubset)
In order to perform the metabolomic analysis of the earlyIUGR and matched AGA newborn samples and to spotpossible outliers, preliminary unsupervised PCA was applied tothe full NMR data (43 samples) as well as separately to theearly IUGR cases and AGA control subgroups. Four cases andone control samples were consistently located in the PCAscores plot outside the 0.95 Hotelling’s T2 confidence interval.These five strong outliers required further investigation andtheir NMR raw data were examined in detail: One of the abovecase samples showed its NMR spectra dominated by veryintense broad signals some of which could be attributed tolipids. In this particular case, the clinical data presented somepeculiar features (e.g. lowest weight of the early IUGR subset,400 gr) that suggested severe neonatal distress. Its exclusionfrom the following study was therefore justifiable to avoid apotentially biased analysis. In the case of the control samplesingled out as outlier, it presented very intense glucose signalsthat overshadowed the rest of the NMR spectrum, which wascompatible with the maternal diagnosis of suboptimallycontrolled gestational diabetes. This prompted us to exclude itfrom the study as well. The other three IUGR cases identifiedas strong outliers presented several common signals thatlargely dominated the spectra: four singlets at 2.55, 2.69, 3.20,3.61 ppm and two AB patterns at 3.11 and 3.22 ppm split withthe characteristic 2JHH spin coupling. These signals wereidentified as exogenous to the biological samples and assignedto the EDTA (ethylenediaminetetraacetic acid) used asanticoagulant in the collection tubes[36]. Thus, the intensesinglets at 3.20 and 3.60 ppm correspond to the NCH2CH2Nand NCH2CO protons of free-EDTA, respectively, whereas the
Table 4. Maternal and Neonatal Clinical Characteristics ofthe Study group: Late non-vasodilated IUGR vs. AGAfetuses.
Late IUGR AGA P (N=38) (N=38) Maternal age (y) 31.6 ± 4.3 32.9 ± 5.9 0.27Maternal BMI (kg/m2) 22.9 ± 3.8 25.1 ± 4.6 0.04Maternal smoking (%) 31.6 13.2 0.05Preeclampsia (%) 5.3 0 0.15GA at birth 38.3 ± 1.1 38.8 ± 1.7 0.9Cesarean section (%) 36.8 28.9 0.46Birth weight (g) 2287 ± 214.1 3169 ± 426.3 <0.001Weight centile 3.3 ± 3.3 49.7 ± 22.3 <0.001Male/female 17/21 16/22 0.7Neonatal acidosis* (%) 5.4 2.9 0.58Apgar score at 5 minutes <7 (%) 2.6 2.6 1
Results are expressed as mean + and standard deviation or percentagedetermined by Student´s t-test for independent samples, Pearson´s X2 or Fisher’sexact test as appropriate. y=years; GA: Gestational age; UA: Umbilical artery; g=grams; * Neonatal acidosis defined as umbilical artery pH<7.15 and base excess >12 mEq/l.doi: 10.1371/journal.pone.0080121.t004
pair 2.55/3.11 ppm arises from the Ca-EDTA complex and thelower intensity signals at 2.69/3.22 ppm from the Mg-EDTAone. Several other samples were identified as moderateoutliers via the observation residuals detected with the SIMCA-P+ tool DModX (distance to model), but in each case thedeviation could be attributed to intense signals from a particularmetabolite. Furthermore, no unusual characteristics wereassociated with the source of these samples or their mothersthat could justify their exclusion from the analysis and theywere therefore retained for the statistical study. After theremoval of the five strong outliers, the PCA scores plot for theearly subset data showed a reasonable separation betweenIUGR cases and controls (R2= 0.63; Q2= 0.37 for the first twocomponents; Figure 1a): Controls are positioned in the upperleft part of an imaginary line that crosses the scores plotdiagonally, whereas most early-onset IUGR cases are locatedin the lower right section. The SIMCA P+ loadings plot (Figure1b) provided qualitative information about which variables (i.e.NMR buckets) were responsible for the class separationobserved in the PCA. For this particular model, the NMRsignals that primarily contributed to the clustering of the IUGRcases were mainly located between 0.80-1.35 ppm (appearingon the right half of the loadings plot), an NMR regioncharacteristic of lipids, lactate and the methyl groups fromamino acids such as valine, leucine, isoleucine and threonine.The differentiation of the control samples arises from NMRbuckets in the region 3.20-4.00 ppm (Figure 1b, left half), whichcorrespond to metabolites like α/β-glucose or the alpha andbeta hydrogen atoms of most amino acids. Likewise, a bucketat 5.22 ppm attributable to the H1 of α-glucose, alsocontributed significantly to the discrimination of the controlsamples. Therefore, a qualitative interpretation of the loadingsplot pointed to glucose as a relevant metabolite in the earlyIUGR cases/controls differentiation.
The PCA was also applied to examine the influence in thescore plot distribution of the maternal and neonatal clinicalcharacteristics of the study group (Table 1). Thus, sampleswere labelled in a discrete way (0, 1) for variables such assmoking, PROM, premature labour, preeclampsia, caesareanvs. vaginal delivery, gender, neonatal acidosis and abnormalApgar score. Subgroups were created such that they coveredthe whole sample range for those characteristics representedby a continuous variable (maternal age, BMI, GA at delivery,birth weight). However, no sample clustering or groupdifferentiation was observed for any of the above clinicalcharacteristics, except for the way of delivery, which showed asimilar separation to that observed between cases andcontrols. This trend is easily explained since over 95% of earlyIUGR cases were delivered by caesarean section compared to21.7% of the matched controls. The potential bias caused bythe administration of maternal drugs was also considered onthe PCA analysis, but no related sample discrimination wasobserved.
The NMR data from the early subset was further examinedthrough supervised multivariate PLS-DA, where case/controlclass membership is defined with the discrete variable Y. Thisanalysis produced a significant separation between the twogroups as observed in the corresponding scores plot (Figure
Metabolomic Profile in IUGR
PLOS ONE | www.plosone.org 5 December 2013 | Volume 8 | Issue 12 | e80121
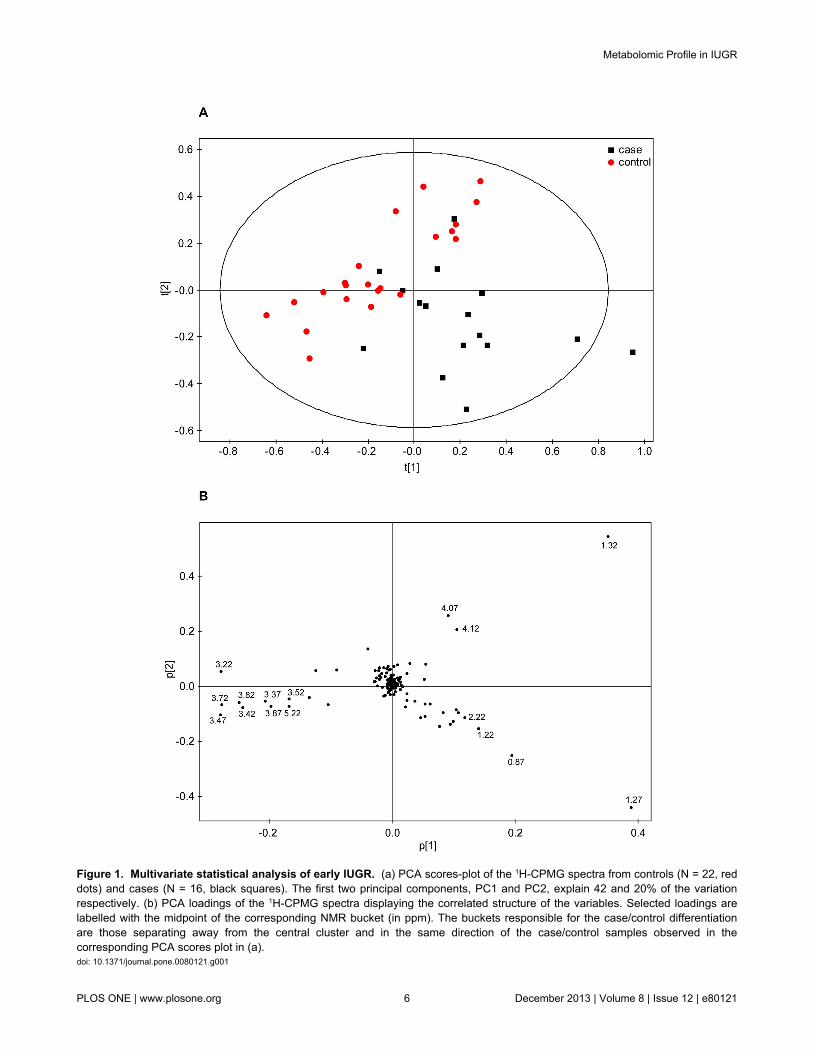
Figure 1. Multivariate statistical analysis of early IUGR. (a) PCA scores-plot of the 1H-CPMG spectra from controls (N = 22, reddots) and cases (N = 16, black squares). The first two principal components, PC1 and PC2, explain 42 and 20% of the variationrespectively. (b) PCA loadings of the 1H-CPMG spectra displaying the correlated structure of the variables. Selected loadings arelabelled with the midpoint of the corresponding NMR bucket (in ppm). The buckets responsible for the case/control differentiationare those separating away from the central cluster and in the same direction of the case/control samples observed in thecorresponding PCA scores plot in (a).doi: 10.1371/journal.pone.0080121.g001
Metabolomic Profile in IUGR
PLOS ONE | www.plosone.org 6 December 2013 | Volume 8 | Issue 12 | e80121
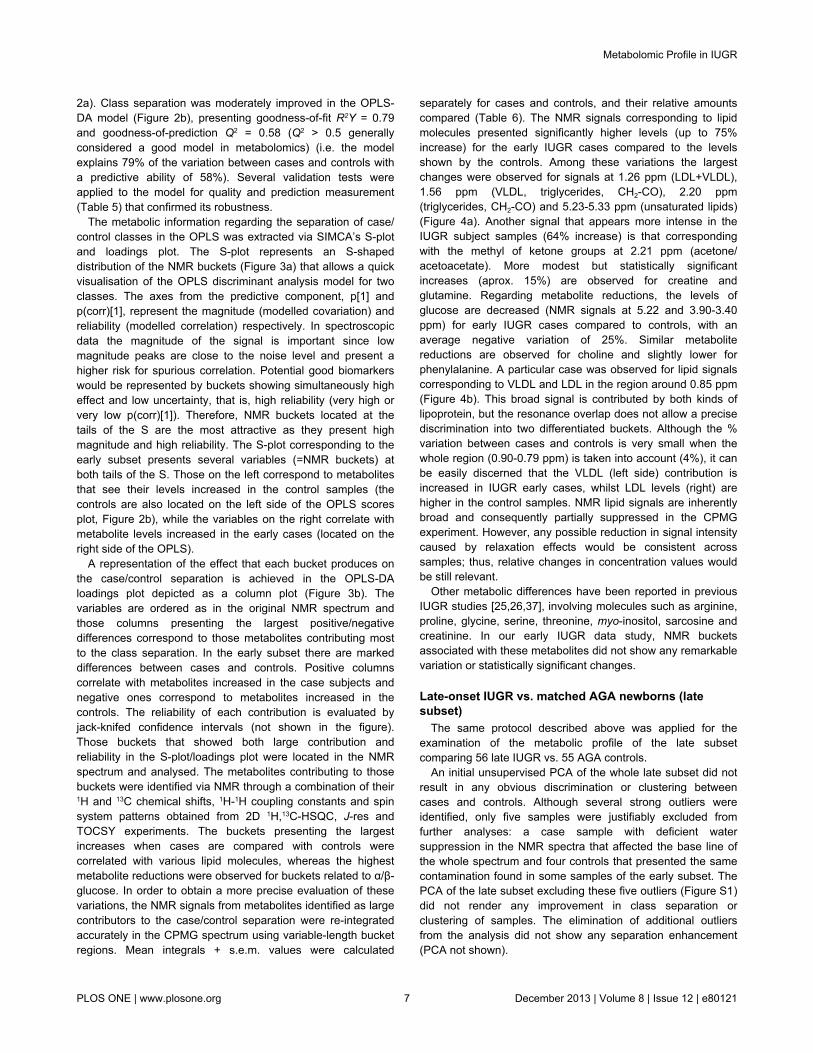
2a). Class separation was moderately improved in the OPLS-DA model (Figure 2b), presenting goodness-of-fit R2Y = 0.79and goodness-of-prediction Q2 = 0.58 (Q2 > 0.5 generallyconsidered a good model in metabolomics) (i.e. the modelexplains 79% of the variation between cases and controls witha predictive ability of 58%). Several validation tests wereapplied to the model for quality and prediction measurement(Table 5) that confirmed its robustness.
The metabolic information regarding the separation of case/control classes in the OPLS was extracted via SIMCA’s S-plotand loadings plot. The S-plot represents an S-shapeddistribution of the NMR buckets (Figure 3a) that allows a quickvisualisation of the OPLS discriminant analysis model for twoclasses. The axes from the predictive component, p[1] andp(corr)[1], represent the magnitude (modelled covariation) andreliability (modelled correlation) respectively. In spectroscopicdata the magnitude of the signal is important since lowmagnitude peaks are close to the noise level and present ahigher risk for spurious correlation. Potential good biomarkerswould be represented by buckets showing simultaneously higheffect and low uncertainty, that is, high reliability (very high orvery low p(corr)[1]). Therefore, NMR buckets located at thetails of the S are the most attractive as they present highmagnitude and high reliability. The S-plot corresponding to theearly subset presents several variables (=NMR buckets) atboth tails of the S. Those on the left correspond to metabolitesthat see their levels increased in the control samples (thecontrols are also located on the left side of the OPLS scoresplot, Figure 2b), while the variables on the right correlate withmetabolite levels increased in the early cases (located on theright side of the OPLS).
A representation of the effect that each bucket produces onthe case/control separation is achieved in the OPLS-DAloadings plot depicted as a column plot (Figure 3b). Thevariables are ordered as in the original NMR spectrum andthose columns presenting the largest positive/negativedifferences correspond to those metabolites contributing mostto the class separation. In the early subset there are markeddifferences between cases and controls. Positive columnscorrelate with metabolites increased in the case subjects andnegative ones correspond to metabolites increased in thecontrols. The reliability of each contribution is evaluated byjack-knifed confidence intervals (not shown in the figure).Those buckets that showed both large contribution andreliability in the S-plot/loadings plot were located in the NMRspectrum and analysed. The metabolites contributing to thosebuckets were identified via NMR through a combination of their1H and 13C chemical shifts, 1H-1H coupling constants and spinsystem patterns obtained from 2D 1H,13C-HSQC, J-res andTOCSY experiments. The buckets presenting the largestincreases when cases are compared with controls werecorrelated with various lipid molecules, whereas the highestmetabolite reductions were observed for buckets related to α/β-glucose. In order to obtain a more precise evaluation of thesevariations, the NMR signals from metabolites identified as largecontributors to the case/control separation were re-integratedaccurately in the CPMG spectrum using variable-length bucketregions. Mean integrals + s.e.m. values were calculated
separately for cases and controls, and their relative amountscompared (Table 6). The NMR signals corresponding to lipidmolecules presented significantly higher levels (up to 75%increase) for the early IUGR cases compared to the levelsshown by the controls. Among these variations the largestchanges were observed for signals at 1.26 ppm (LDL+VLDL),1.56 ppm (VLDL, triglycerides, CH2-CO), 2.20 ppm(triglycerides, CH2-CO) and 5.23-5.33 ppm (unsaturated lipids)(Figure 4a). Another signal that appears more intense in theIUGR subject samples (64% increase) is that correspondingwith the methyl of ketone groups at 2.21 ppm (acetone/acetoacetate). More modest but statistically significantincreases (aprox. 15%) are observed for creatine andglutamine. Regarding metabolite reductions, the levels ofglucose are decreased (NMR signals at 5.22 and 3.90-3.40ppm) for early IUGR cases compared to controls, with anaverage negative variation of 25%. Similar metabolitereductions are observed for choline and slightly lower forphenylalanine. A particular case was observed for lipid signalscorresponding to VLDL and LDL in the region around 0.85 ppm(Figure 4b). This broad signal is contributed by both kinds oflipoprotein, but the resonance overlap does not allow a precisediscrimination into two differentiated buckets. Although the %variation between cases and controls is very small when thewhole region (0.90-0.79 ppm) is taken into account (4%), it canbe easily discerned that the VLDL (left side) contribution isincreased in IUGR early cases, whilst LDL levels (right) arehigher in the control samples. NMR lipid signals are inherentlybroad and consequently partially suppressed in the CPMGexperiment. However, any possible reduction in signal intensitycaused by relaxation effects would be consistent acrosssamples; thus, relative changes in concentration values wouldbe still relevant.
Other metabolic differences have been reported in previousIUGR studies [25,26,37], involving molecules such as arginine,proline, glycine, serine, threonine, myo-inositol, sarcosine andcreatinine. In our early IUGR data study, NMR bucketsassociated with these metabolites did not show any remarkablevariation or statistically significant changes.
Late-onset IUGR vs. matched AGA newborns (latesubset)
The same protocol described above was applied for theexamination of the metabolic profile of the late subsetcomparing 56 late IUGR vs. 55 AGA controls.
An initial unsupervised PCA of the whole late subset did notresult in any obvious discrimination or clustering betweencases and controls. Although several strong outliers wereidentified, only five samples were justifiably excluded fromfurther analyses: a case sample with deficient watersuppression in the NMR spectra that affected the base line ofthe whole spectrum and four controls that presented the samecontamination found in some samples of the early subset. ThePCA of the late subset excluding these five outliers (Figure S1)did not render any improvement in class separation orclustering of samples. The elimination of additional outliersfrom the analysis did not show any separation enhancement(PCA not shown).
Metabolomic Profile in IUGR
PLOS ONE | www.plosone.org 7 December 2013 | Volume 8 | Issue 12 | e80121
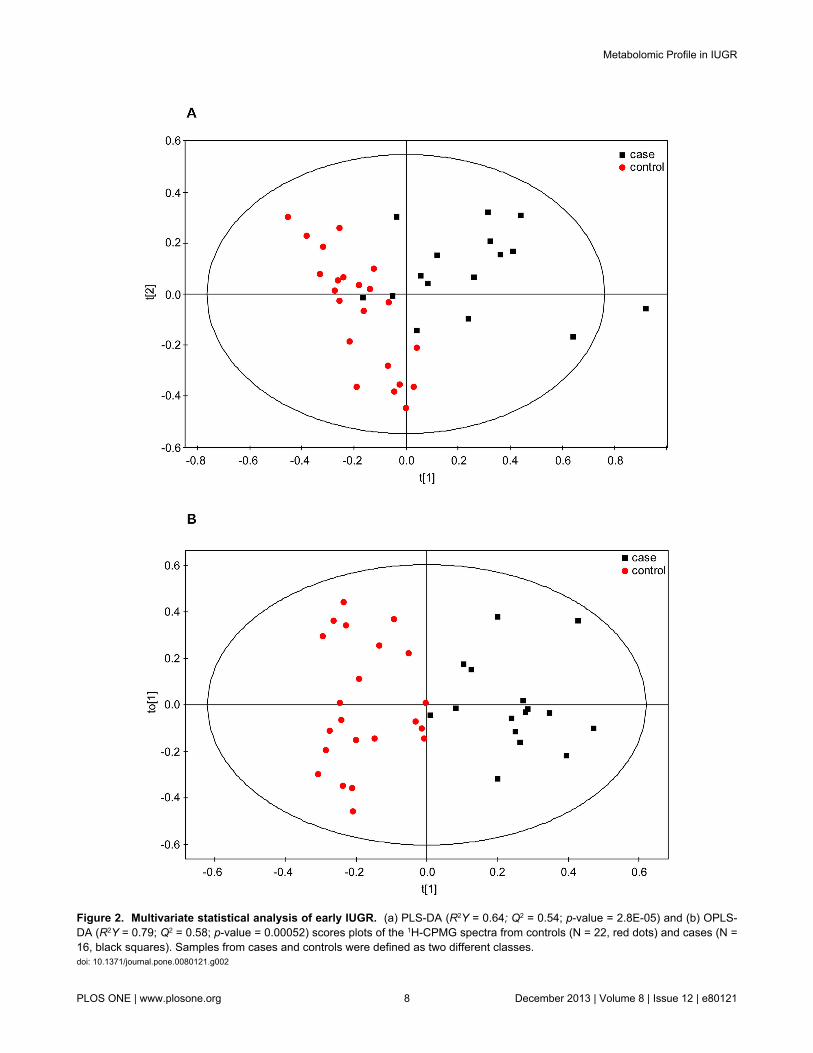
Figure 2. Multivariate statistical analysis of early IUGR. (a) PLS-DA (R2Y = 0.64; Q2 = 0.54; p-value = 2.8E-05) and (b) OPLS-DA (R2Y = 0.79; Q2 = 0.58; p-value = 0.00052) scores plots of the 1H-CPMG spectra from controls (N = 22, red dots) and cases (N =16, black squares). Samples from cases and controls were defined as two different classes.doi: 10.1371/journal.pone.0080121.g002
Metabolomic Profile in IUGR
PLOS ONE | www.plosone.org 8 December 2013 | Volume 8 | Issue 12 | e80121
Analogously to the analysis carried out on the early subset,the PCA was also applied to the late samples for theexamination of the maternal and neonatal clinicalcharacteristics, but no clustering or group differentiation wasobserved.
The subsequent supervised PLS/OPLS discriminant analysison the late subset samples showed a uniform overlap betweencase/control classes (Figure S2a and Figure S2b), presentingvery low goodness-of-fit and prediction values and poorexternal validation parameters (Table 5). A variable selectionprocess was then applied by first removing from the analysisbuckets from the NMR spectra that did not present any signal,and second by only retaining those variables that showedreliable (acceptable confidence-intervals) contributions. Theresulting models did not improve the fitness and predictionvalues obtained with the full range of NMR variables, indicatingthat there was not a clear separation between cases andcontrols in the late subset. The metabolites identified in theearly subset as relevant were also evaluated here; samemetabolite variations as those found in the early subset weredetected, but to a lesser extent (Table 7). Thus, an increase oflipid concentration was again observed for the IUGR cases,although in a lower variation (up to 20%) than in the earlysubset. Glucose levels were again slightly decreased (-5.8%)but the result could not be considered statistically significant.Other metabolites found relevant in the early subset study(acetone/acetoacetate, creatine, phenylalanine) did not presentany significant difference in the late subset analysis. Althoughwith relatively modest numbers, a particular case is presentedby the amino acid glutamine which showed a 14.8% increase inthe early IUGR cases, but a decrease of nearly 10% for the lateIUGR subjects compared to the control samples. Similar
Table 5. IUGR multivariate statistical analysis parametersand model validation values.
Model R2X R2Y Q2 pa SensitivitybSpecificitybFishersprob.c
EarlyPLS-DA
0.61 0.64 0.54 2.84E-05 100 88 1E-07
EarlyOPLS-DA
0.75 0.79 0.58 0.0005 100 95.6 1E-09
Late(all)
PLS-DA
0.45 0.22 0.07 0.133 66 64 0.0018
Late(all)
OPLS-DA
0.71 0.30 0.17 0.005 70.7 78 8.3E-07
Late(VD)
PLS-DA
0.59 0.47 0.32 0.022 77.8 75 0.0027
Late(VD)
OPLS-DA
0.59 0.47 0.32 0.019 77.8 75 0.0027
a p values were obtained from a two-way analysis of variance (ANOVA). b
Classification results were used to define True Positives (TP), True Negatives(TN), False Positives (FP) and False Negatives (FN) and therefore calculate aspercent sensitivity [TP/(TP + FN) × 100] and specificity [TN/ (TN + FP) × 100]. c
Probability of a particular classification result occurring by chance and is satisfiedwhen p<0.05 for 95% confidence. VD: Vasodilated.doi: 10.1371/journal.pone.0080121.t005
reductions in metabolite levels were also observed for choline,alanine, valine, tyrosine and leucine.
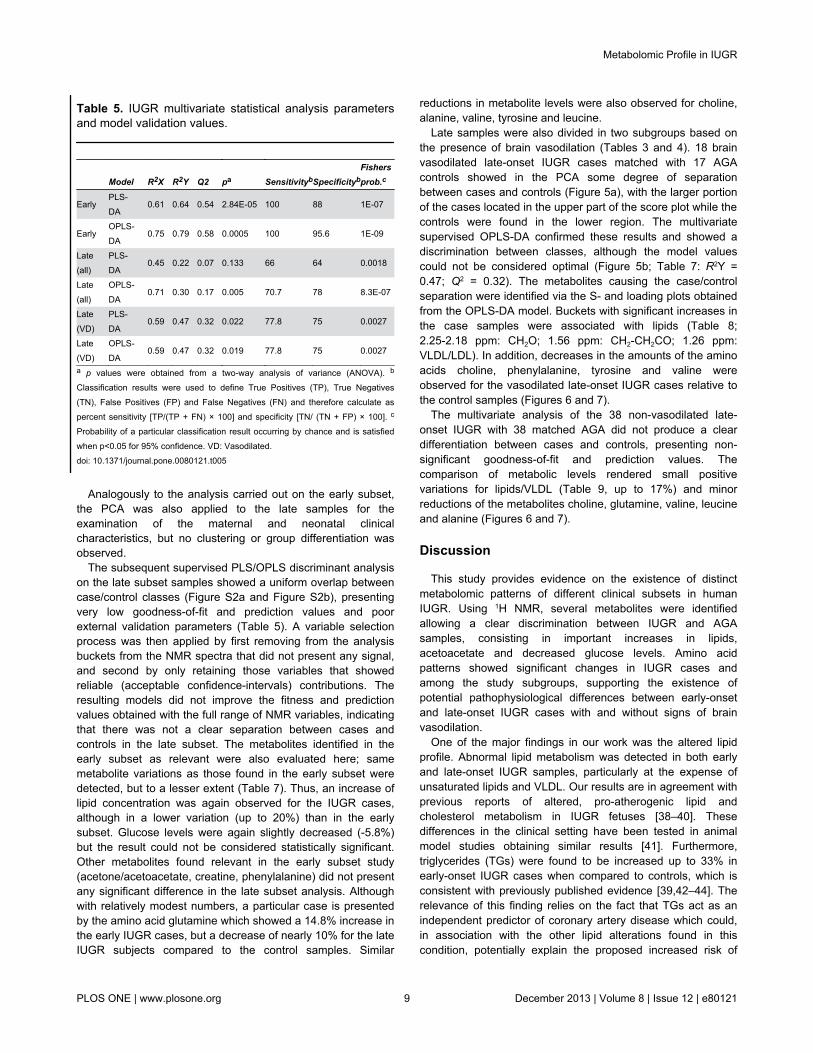
Late samples were also divided in two subgroups based onthe presence of brain vasodilation (Tables 3 and 4). 18 brainvasodilated late-onset IUGR cases matched with 17 AGAcontrols showed in the PCA some degree of separationbetween cases and controls (Figure 5a), with the larger portionof the cases located in the upper part of the score plot while thecontrols were found in the lower region. The multivariatesupervised OPLS-DA confirmed these results and showed adiscrimination between classes, although the model valuescould not be considered optimal (Figure 5b; Table 7: R2Y =0.47; Q2 = 0.32). The metabolites causing the case/controlseparation were identified via the S- and loading plots obtainedfrom the OPLS-DA model. Buckets with significant increases inthe case samples were associated with lipids (Table 8;2.25-2.18 ppm: CH2O; 1.56 ppm: CH2-CH2CO; 1.26 ppm:VLDL/LDL). In addition, decreases in the amounts of the aminoacids choline, phenylalanine, tyrosine and valine wereobserved for the vasodilated late-onset IUGR cases relative tothe control samples (Figures 6 and 7).
The multivariate analysis of the 38 non-vasodilated late-onset IUGR with 38 matched AGA did not produce a cleardifferentiation between cases and controls, presenting non-significant goodness-of-fit and prediction values. Thecomparison of metabolic levels rendered small positivevariations for lipids/VLDL (Table 9, up to 17%) and minorreductions of the metabolites choline, glutamine, valine, leucineand alanine (Figures 6 and 7).
Discussion
This study provides evidence on the existence of distinctmetabolomic patterns of different clinical subsets in humanIUGR. Using 1H NMR, several metabolites were identifiedallowing a clear discrimination between IUGR and AGAsamples, consisting in important increases in lipids,acetoacetate and decreased glucose levels. Amino acidpatterns showed significant changes in IUGR cases andamong the study subgroups, supporting the existence ofpotential pathophysiological differences between early-onsetand late-onset IUGR cases with and without signs of brainvasodilation.
One of the major findings in our work was the altered lipidprofile. Abnormal lipid metabolism was detected in both earlyand late-onset IUGR samples, particularly at the expense ofunsaturated lipids and VLDL. Our results are in agreement withprevious reports of altered, pro-atherogenic lipid andcholesterol metabolism in IUGR fetuses [38–40]. Thesedifferences in the clinical setting have been tested in animalmodel studies obtaining similar results [41]. Furthermore,triglycerides (TGs) were found to be increased up to 33% inearly-onset IUGR cases when compared to controls, which isconsistent with previously published evidence [39,42–44]. Therelevance of this finding relies on the fact that TGs act as anindependent predictor of coronary artery disease which could,in association with the other lipid alterations found in thiscondition, potentially explain the proposed increased risk of
Metabolomic Profile in IUGR
PLOS ONE | www.plosone.org 9 December 2013 | Volume 8 | Issue 12 | e80121
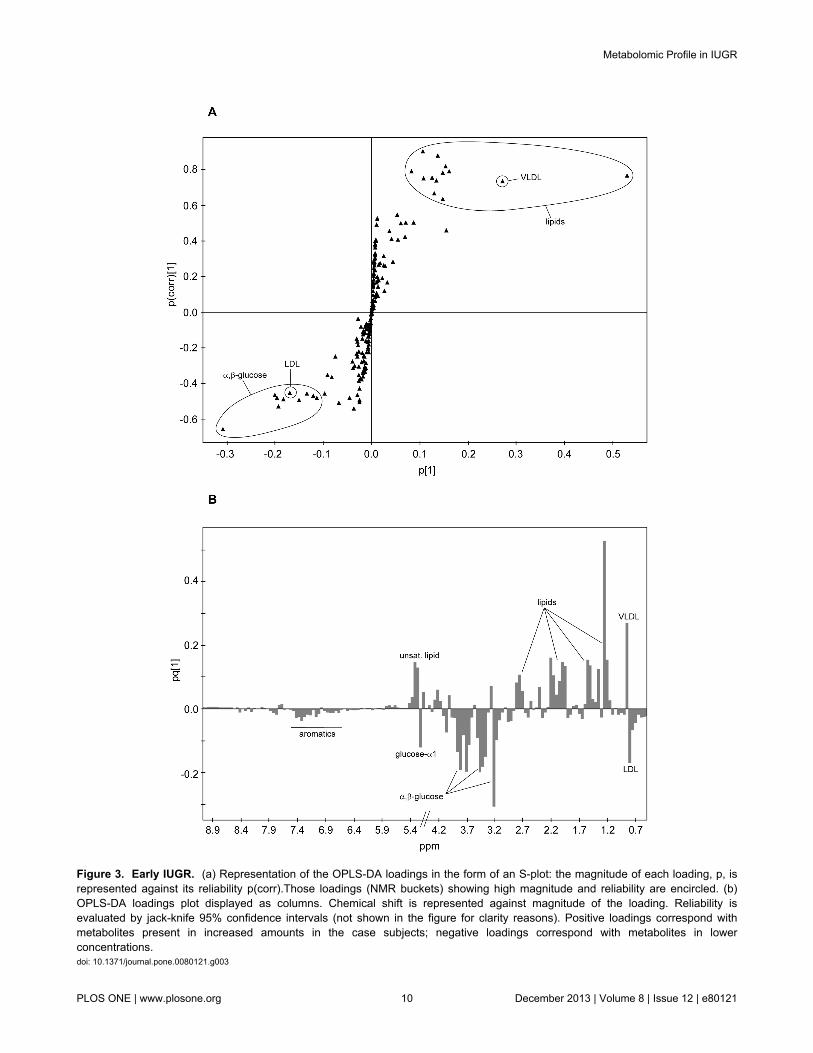
Figure 3. Early IUGR. (a) Representation of the OPLS-DA loadings in the form of an S-plot: the magnitude of each loading, p, isrepresented against its reliability p(corr).Those loadings (NMR buckets) showing high magnitude and reliability are encircled. (b)OPLS-DA loadings plot displayed as columns. Chemical shift is represented against magnitude of the loading. Reliability isevaluated by jack-knife 95% confidence intervals (not shown in the figure for clarity reasons). Positive loadings correspond withmetabolites present in increased amounts in the case subjects; negative loadings correspond with metabolites in lowerconcentrations.doi: 10.1371/journal.pone.0080121.g003
Metabolomic Profile in IUGR
PLOS ONE | www.plosone.org 10 December 2013 | Volume 8 | Issue 12 | e80121
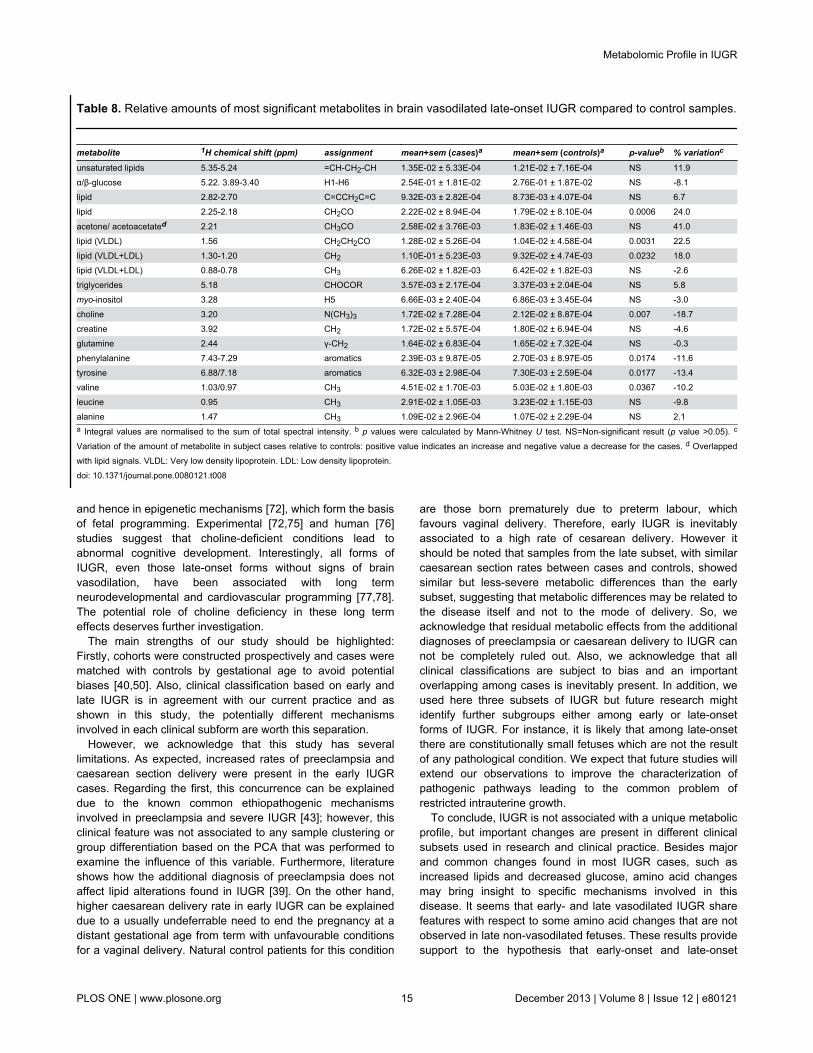
cardiovascular disease in later life in IUGR cases [42]. As tothe nature of the underlying pathophysiological mechanismsinvolved in these findings, abnormal lipid metabolism in IUGRcould be explained by both chronic exposure to hypoxia andundernutrition: Hypoxic damage can induce significantderangements in plasmatic lipids during perinatal life resultingin hyperlipidemia [45] and also increased cholesterol esters inhypoxia-cultured placental tissue [46]. In addition, increasedcholesterol levels are associated to starving conditions such asanorexia nervosa [47,48]. Moreover, reports from animal modelin undernourished conditions show an increase of free fattyacids in arterial plasma and an impaired clearance of TG-richlipoproteins [49]. All subgroups of IUGR were associated withsignificant changes in lipids, but there was a gradation ofseverity with more marked changes in severe cases (Figure 6).The presence of significant differences also in non-vasodilatedlate-onset IUGR cases supports the notion that at least a largeproportion of these fetuses are not constitutionally small.
In agreement with previous studies [41,50–53], early-onsetIUGR showed significant decreases in glucose levels andsignificant increases in ketones. A non-significant trend wasobserved for late IUGR subgroups. Differences between earlyand late onset forms should be interpreted in line with previousfindings in which glucose levels were inversely correlated to theclinical severity of IUGR [50,51,54]. As to the mechanismsinvolved in these findings, it is known that growth restrictedfetuses maintain lower glucose concentrations to increasetransplacental glucose gradient, which will keep the glucoseuptake across the placenta of limited size [51]. Additionally,under growth restricted conditions glycolytic processes areenhanced by hypoxia-inducible factors [46], resulting in a more
pronounced metabolic-substrate deficient situation with anincreased ketogenesis.
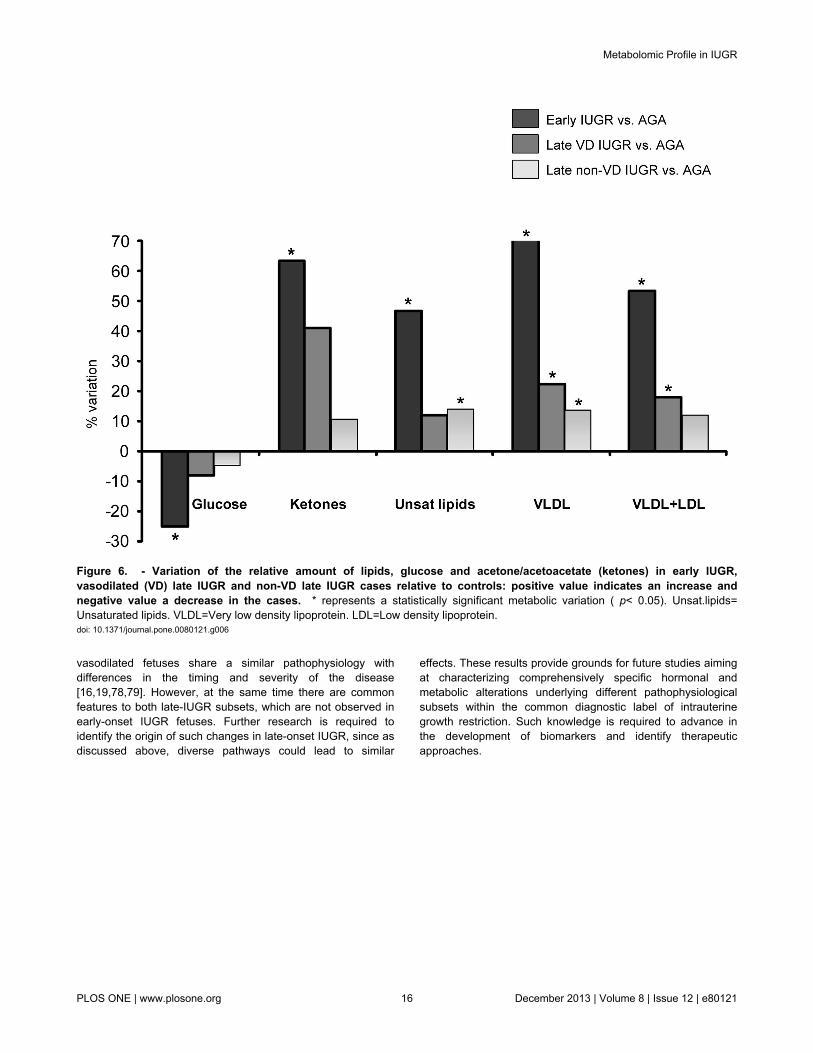
Specific changes in the amino acid profile provided aninteresting insight which suggested important differencesamong the clinical subsets studied. Glutamine levels werefound to be increased in early IUGRs as compared withmatched controls. This finding is in line with previous studies invery low birth weight and also in early-IUGR preterm neonates[25,53]. Glutamine concentration in fetal blood depends on thetransfer from maternal blood but also on placental synthesis[55]. Fetal glutamine is next to glucose as one of the mainsources of cellular energy in fetal life [55]. It also plays a keyrole in fetal neurodevelopment being a precursor of alpha-amino butyric acid, a neurotransmission inhibitor [55].Increased glutamine levels in severe IUGR could be explainedby the inherent hypercatabolic status of this condition, inassociation to decreased glucose levels [56,57]. This lack ofenergy substrates may convey to increase glutamine supply tothe fetus through different mechanisms [53]. When the differentlate-IUGR subsets were considered in regard to glutaminelevels, thought-provoking differences were found: whilevasodilated late-IUGR cases did not show any significantchange, there was a significant decrease in the non-vasodilated late-IUGR cases (Figure 7). The explanation forthis is unclear. However, this finding could be understood in thelight of other pathologies with decreased glutamine levels suchas in chronic stress conditions [58,59]. It is tempting tospeculate that similar mechanisms may be involved here;whereas an overexposure to glucocorticoids is involved inchronic stress, it may as well play an important role in thisclinical subform of IUGR. Indeed, increased corticosteroid
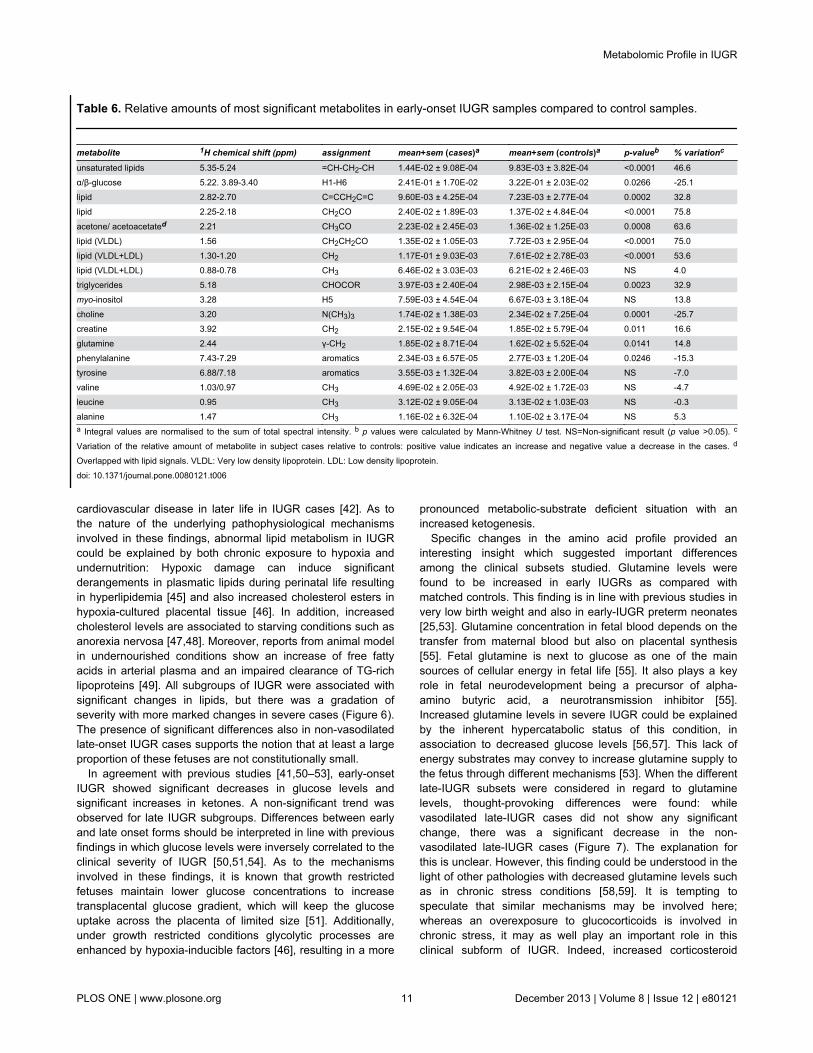
Table 6. Relative amounts of most significant metabolites in early-onset IUGR samples compared to control samples.
metabolite 1H chemical shift (ppm) assignment mean+sem (cases)a mean+sem (controls)a p-valueb % variationc
unsaturated lipids 5.35-5.24 =CH-CH2-CH 1.44E-02 ± 9.08E-04 9.83E-03 ± 3.82E-04 <0.0001 46.6α/β-glucose 5.22. 3.89-3.40 H1-H6 2.41E-01 ± 1.70E-02 3.22E-01 ± 2.03E-02 0.0266 -25.1lipid 2.82-2.70 C=CCH2C=C 9.60E-03 ± 4.25E-04 7.23E-03 ± 2.77E-04 0.0002 32.8lipid 2.25-2.18 CH2CO 2.40E-02 ± 1.89E-03 1.37E-02 ± 4.84E-04 <0.0001 75.8
acetone/ acetoacetated 2.21 CH3CO 2.23E-02 ± 2.45E-03 1.36E-02 ± 1.25E-03 0.0008 63.6lipid (VLDL) 1.56 CH2CH2CO 1.35E-02 ± 1.05E-03 7.72E-03 ± 2.95E-04 <0.0001 75.0lipid (VLDL+LDL) 1.30-1.20 CH2 1.17E-01 ± 9.03E-03 7.61E-02 ± 2.78E-03 <0.0001 53.6lipid (VLDL+LDL) 0.88-0.78 CH3 6.46E-02 ± 3.03E-03 6.21E-02 ± 2.46E-03 NS 4.0triglycerides 5.18 CHOCOR 3.97E-03 ± 2.40E-04 2.98E-03 ± 2.15E-04 0.0023 32.9myo-inositol 3.28 H5 7.59E-03 ± 4.54E-04 6.67E-03 ± 3.18E-04 NS 13.8choline 3.20 N(CH3)3 1.74E-02 ± 1.38E-03 2.34E-02 ± 7.25E-04 0.0001 -25.7creatine 3.92 CH2 2.15E-02 ± 9.54E-04 1.85E-02 ± 5.79E-04 0.011 16.6glutamine 2.44 γ-CH2 1.85E-02 ± 8.71E-04 1.62E-02 ± 5.52E-04 0.0141 14.8phenylalanine 7.43-7.29 aromatics 2.34E-03 ± 6.57E-05 2.77E-03 ± 1.20E-04 0.0246 -15.3tyrosine 6.88/7.18 aromatics 3.55E-03 ± 1.32E-04 3.82E-03 ± 2.00E-04 NS -7.0valine 1.03/0.97 CH3 4.69E-02 ± 2.05E-03 4.92E-02 ± 1.72E-03 NS -4.7leucine 0.95 CH3 3.12E-02 ± 9.05E-04 3.13E-02 ± 1.03E-03 NS -0.3alanine 1.47 CH3 1.16E-02 ± 6.32E-04 1.10E-02 ± 3.17E-04 NS 5.3a Integral values are normalised to the sum of total spectral intensity. b p values were calculated by Mann-Whitney U test. NS=Non-significant result (p value >0.05). c
Variation of the relative amount of metabolite in subject cases relative to controls: positive value indicates an increase and negative value a decrease in the cases. d
Overlapped with lipid signals. VLDL: Very low density lipoprotein. LDL: Low density lipoprotein.doi: 10.1371/journal.pone.0080121.t006
Metabolomic Profile in IUGR
PLOS ONE | www.plosone.org 11 December 2013 | Volume 8 | Issue 12 | e80121
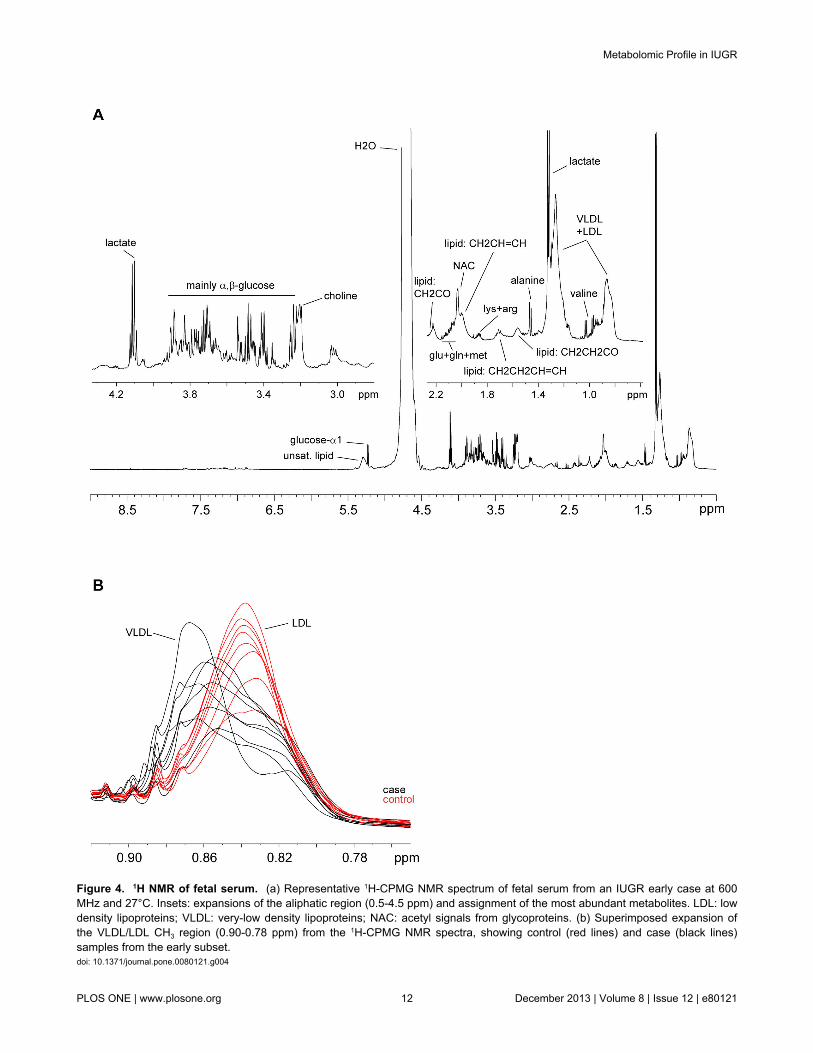
Figure 4. 1H NMR of fetal serum. (a) Representative 1H-CPMG NMR spectrum of fetal serum from an IUGR early case at 600MHz and 27°C. Insets: expansions of the aliphatic region (0.5-4.5 ppm) and assignment of the most abundant metabolites. LDL: lowdensity lipoproteins; VLDL: very-low density lipoproteins; NAC: acetyl signals from glycoproteins. (b) Superimposed expansion ofthe VLDL/LDL CH3 region (0.90-0.78 ppm) from the 1H-CPMG NMR spectra, showing control (red lines) and case (black lines)samples from the early subset.doi: 10.1371/journal.pone.0080121.g004
Metabolomic Profile in IUGR
PLOS ONE | www.plosone.org 12 December 2013 | Volume 8 | Issue 12 | e80121
transfer to the fetus has long been suggested as a potentialpathogenic pathway of IUGR in humans [60,61].
Increased creatine levels in early IUGR could be interpretedas well by a metabolic-substrate deficient condition. Creatine isan essential metabolite for energy metabolism through theproduction of ATP and increased levels have been reported inpreterm IUGR neonates [62] in IUGR-induced gilts [41].
Phenylalanine and tyrosine levels were decreased similarlyin early and late vasodilated IUGR cases. Tyrosine issynthesized from the essential amino acid phenylalanine.Previously published results from in vitro and in vivo studies onphenylalanine in IUGR conditions have yielded controversialinformation [25,41,46,63], which could be explained byimportant differences in the selection of IUGR cases included.In general, studies focusing on early-onset severe IUGR casesshowed decreased phenylalanine levels [63], attributed to analtered placental transport, plausibly resulting from a“damaged” placental tissue and the inherent hypercatabolicstate in IUGR [41,63]. The observation of a similar decrease inphenylalanine in the group of vasodilated late-IUGR fetusescould support the hypothesis that this clinical subset representsa late form of placental insufficiency [16]. The implications ofdecreased phenylalanine and tyrosine as neurotransmitterprecursors in these clinical forms, both associated with adverseneurological outcome [10,64–66], deserves furtherinvestigation. Finally, non-vasodilated late IUGR wasassociated with a remarkably distinct response in relation withphenylalanine and tyrosine suggesting a more prominent roleof other mechanisms as discussed above.
Leucine and valine were significantly decreased in bothforms of late IUGR regardless the presence or absence of
brain vasodilation, but not in early IUGR. Valine and leucine,together with isoleucine, are defined as branched-chain aminoacids (BCAA). The data goes in line with other reports from lateIUGR fetuses in which all BCAA were decreased [67]. Ourobservations suggest that changes in these amino acids couldbe a characteristic feature of IUGR late in gestation. Again,diverse pathways might concur to explain these results. On onehand, plasmatic concentrations of BCAA are prominentlyreduced during chronic malnutrition [68,69]. However,exposure to increased glucocorticoids has similar effects tofood restriction on BCAA aminotransferase and other enzymesregulating the catabolism and plasma concentrations of theseamino acids [70]. The reason for the lack of changes in BCAAin early-onset IUGR is unclear. Previous studies suggest thatBCAA could be transiently increased or remain unchangedduring states of severe starvation [71], which might helpexplain our observations.
Decreased choline concentrations were found in all IUGRsubsets, with a progression across clinical severity in early(25.7% decrease), vasodilated late (18.7%) and non-vasodilated late IUGR cases (9%). Choline is an essentialmetabolite under a high demand during pregnancy. Largeamounts of this amino acid are delivered to the fetus across theplacenta [72]. Circulating choline has also been reported to bereduced under malnutrition [73] and reductions in IUGR couldbe due to impaired transplacental supply. However, this doesnot exclude other pathways, since reduced serum levels havealso been described in response to glucocorticoid therapy andchronic stress [74]. Choline has a key role inneurodevelopment, being the precursor of phosphatidylcholinefor myelinization [75]. It has a crucial role in DNA methylation
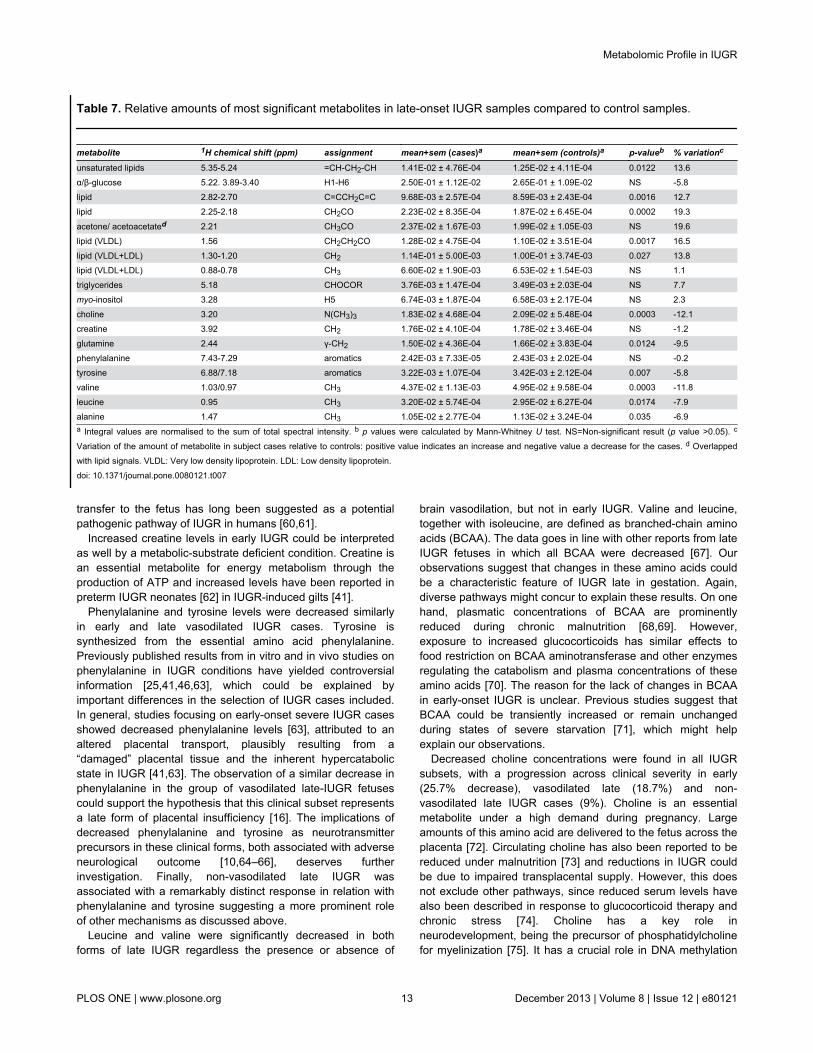
Table 7. Relative amounts of most significant metabolites in late-onset IUGR samples compared to control samples.
metabolite 1H chemical shift (ppm) assignment mean+sem (cases)a mean+sem (controls)a p-valueb % variationc
unsaturated lipids 5.35-5.24 =CH-CH2-CH 1.41E-02 ± 4.76E-04 1.25E-02 ± 4.11E-04 0.0122 13.6α/β-glucose 5.22. 3.89-3.40 H1-H6 2.50E-01 ± 1.12E-02 2.65E-01 ± 1.09E-02 NS -5.8lipid 2.82-2.70 C=CCH2C=C 9.68E-03 ± 2.57E-04 8.59E-03 ± 2.43E-04 0.0016 12.7lipid 2.25-2.18 CH2CO 2.23E-02 ± 8.35E-04 1.87E-02 ± 6.45E-04 0.0002 19.3
acetone/ acetoacetated 2.21 CH3CO 2.37E-02 ± 1.67E-03 1.99E-02 ± 1.05E-03 NS 19.6lipid (VLDL) 1.56 CH2CH2CO 1.28E-02 ± 4.75E-04 1.10E-02 ± 3.51E-04 0.0017 16.5lipid (VLDL+LDL) 1.30-1.20 CH2 1.14E-01 ± 5.00E-03 1.00E-01 ± 3.74E-03 0.027 13.8lipid (VLDL+LDL) 0.88-0.78 CH3 6.60E-02 ± 1.90E-03 6.53E-02 ± 1.54E-03 NS 1.1triglycerides 5.18 CHOCOR 3.76E-03 ± 1.47E-04 3.49E-03 ± 2.03E-04 NS 7.7myo-inositol 3.28 H5 6.74E-03 ± 1.87E-04 6.58E-03 ± 2.17E-04 NS 2.3choline 3.20 N(CH3)3 1.83E-02 ± 4.68E-04 2.09E-02 ± 5.48E-04 0.0003 -12.1creatine 3.92 CH2 1.76E-02 ± 4.10E-04 1.78E-02 ± 3.46E-04 NS -1.2glutamine 2.44 γ-CH2 1.50E-02 ± 4.36E-04 1.66E-02 ± 3.83E-04 0.0124 -9.5phenylalanine 7.43-7.29 aromatics 2.42E-03 ± 7.33E-05 2.43E-03 ± 2.02E-04 NS -0.2tyrosine 6.88/7.18 aromatics 3.22E-03 ± 1.07E-04 3.42E-03 ± 2.12E-04 0.007 -5.8valine 1.03/0.97 CH3 4.37E-02 ± 1.13E-03 4.95E-02 ± 9.58E-04 0.0003 -11.8leucine 0.95 CH3 3.20E-02 ± 5.74E-04 2.95E-02 ± 6.27E-04 0.0174 -7.9alanine 1.47 CH3 1.05E-02 ± 2.77E-04 1.13E-02 ± 3.24E-04 0.035 -6.9a Integral values are normalised to the sum of total spectral intensity. b p values were calculated by Mann-Whitney U test. NS=Non-significant result (p value >0.05). c
Variation of the amount of metabolite in subject cases relative to controls: positive value indicates an increase and negative value a decrease for the cases. d Overlappedwith lipid signals. VLDL: Very low density lipoprotein. LDL: Low density lipoprotein.doi: 10.1371/journal.pone.0080121.t007
Metabolomic Profile in IUGR
PLOS ONE | www.plosone.org 13 December 2013 | Volume 8 | Issue 12 | e80121
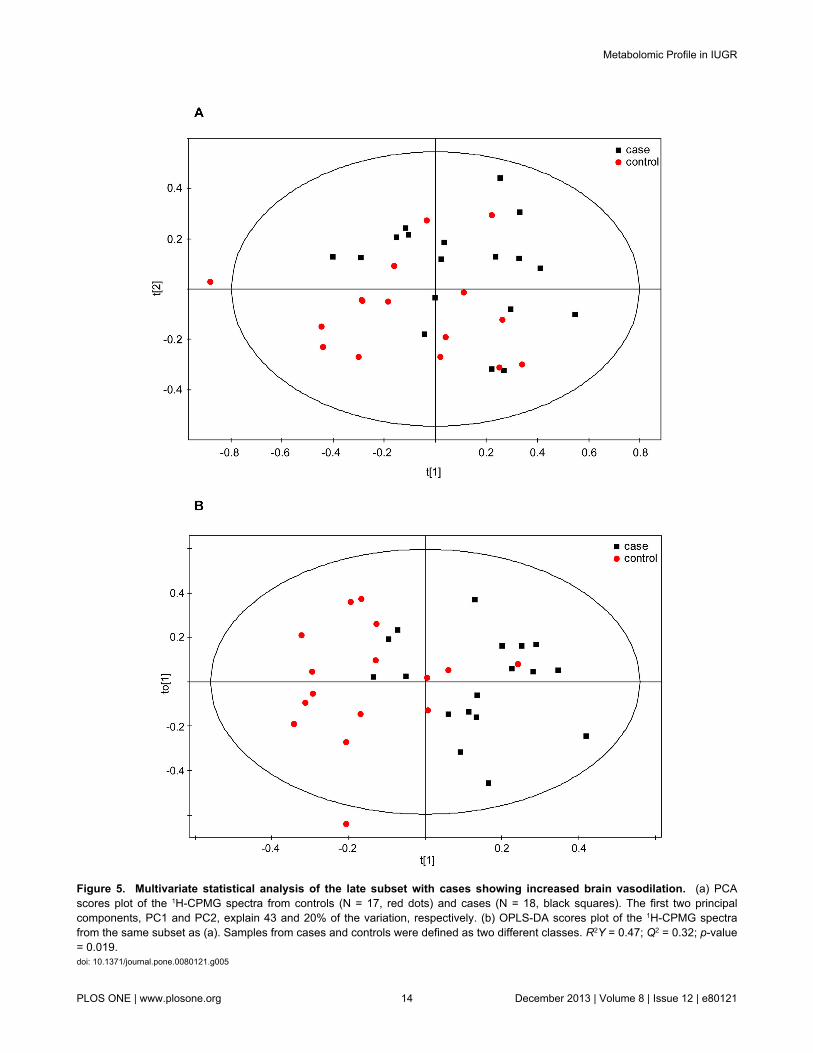
Figure 5. Multivariate statistical analysis of the late subset with cases showing increased brain vasodilation. (a) PCAscores plot of the 1H-CPMG spectra from controls (N = 17, red dots) and cases (N = 18, black squares). The first two principalcomponents, PC1 and PC2, explain 43 and 20% of the variation, respectively. (b) OPLS-DA scores plot of the 1H-CPMG spectrafrom the same subset as (a). Samples from cases and controls were defined as two different classes. R2Y = 0.47; Q2 = 0.32; p-value= 0.019.doi: 10.1371/journal.pone.0080121.g005
Metabolomic Profile in IUGR
PLOS ONE | www.plosone.org 14 December 2013 | Volume 8 | Issue 12 | e80121
and hence in epigenetic mechanisms [72], which form the basisof fetal programming. Experimental [72,75] and human [76]studies suggest that choline-deficient conditions lead toabnormal cognitive development. Interestingly, all forms ofIUGR, even those late-onset forms without signs of brainvasodilation, have been associated with long termneurodevelopmental and cardiovascular programming [77,78].The potential role of choline deficiency in these long termeffects deserves further investigation.
The main strengths of our study should be highlighted:Firstly, cohorts were constructed prospectively and cases werematched with controls by gestational age to avoid potentialbiases [40,50]. Also, clinical classification based on early andlate IUGR is in agreement with our current practice and asshown in this study, the potentially different mechanismsinvolved in each clinical subform are worth this separation.
However, we acknowledge that this study has severallimitations. As expected, increased rates of preeclampsia andcaesarean section delivery were present in the early IUGRcases. Regarding the first, this concurrence can be explaineddue to the known common ethiopathogenic mechanismsinvolved in preeclampsia and severe IUGR [43]; however, thisclinical feature was not associated to any sample clustering orgroup differentiation based on the PCA that was performed toexamine the influence of this variable. Furthermore, literatureshows how the additional diagnosis of preeclampsia does notaffect lipid alterations found in IUGR [39]. On the other hand,higher caesarean delivery rate in early IUGR can be explaineddue to a usually undeferrable need to end the pregnancy at adistant gestational age from term with unfavourable conditionsfor a vaginal delivery. Natural control patients for this condition
are those born prematurely due to preterm labour, whichfavours vaginal delivery. Therefore, early IUGR is inevitablyassociated to a high rate of cesarean delivery. However itshould be noted that samples from the late subset, with similarcaesarean section rates between cases and controls, showedsimilar but less-severe metabolic differences than the earlysubset, suggesting that metabolic differences may be related tothe disease itself and not to the mode of delivery. So, weacknowledge that residual metabolic effects from the additionaldiagnoses of preeclampsia or caesarean delivery to IUGR cannot be completely ruled out. Also, we acknowledge that allclinical classifications are subject to bias and an importantoverlapping among cases is inevitably present. In addition, weused here three subsets of IUGR but future research mightidentify further subgroups either among early or late-onsetforms of IUGR. For instance, it is likely that among late-onsetthere are constitutionally small fetuses which are not the resultof any pathological condition. We expect that future studies willextend our observations to improve the characterization ofpathogenic pathways leading to the common problem ofrestricted intrauterine growth.
To conclude, IUGR is not associated with a unique metabolicprofile, but important changes are present in different clinicalsubsets used in research and clinical practice. Besides majorand common changes found in most IUGR cases, such asincreased lipids and decreased glucose, amino acid changesmay bring insight to specific mechanisms involved in thisdisease. It seems that early- and late vasodilated IUGR sharefeatures with respect to some amino acid changes that are notobserved in late non-vasodilated fetuses. These results providesupport to the hypothesis that early-onset and late-onset
Table 8. Relative amounts of most significant metabolites in brain vasodilated late-onset IUGR compared to control samples.
metabolite 1H chemical shift (ppm) assignment mean+sem (cases)a mean+sem (controls)a p-valueb % variationc
unsaturated lipids 5.35-5.24 =CH-CH2-CH 1.35E-02 ± 5.33E-04 1.21E-02 ± 7.16E-04 NS 11.9α/β-glucose 5.22. 3.89-3.40 H1-H6 2.54E-01 ± 1.81E-02 2.76E-01 ± 1.87E-02 NS -8.1lipid 2.82-2.70 C=CCH2C=C 9.32E-03 ± 2.82E-04 8.73E-03 ± 4.07E-04 NS 6.7lipid 2.25-2.18 CH2CO 2.22E-02 ± 8.94E-04 1.79E-02 ± 8.10E-04 0.0006 24.0
acetone/ acetoacetated 2.21 CH3CO 2.58E-02 ± 3.76E-03 1.83E-02 ± 1.46E-03 NS 41.0lipid (VLDL) 1.56 CH2CH2CO 1.28E-02 ± 5.26E-04 1.04E-02 ± 4.58E-04 0.0031 22.5lipid (VLDL+LDL) 1.30-1.20 CH2 1.10E-01 ± 5.23E-03 9.32E-02 ± 4.74E-03 0.0232 18.0lipid (VLDL+LDL) 0.88-0.78 CH3 6.26E-02 ± 1.82E-03 6.42E-02 ± 1.82E-03 NS -2.6triglycerides 5.18 CHOCOR 3.57E-03 ± 2.17E-04 3.37E-03 ± 2.04E-04 NS 5.8myo-inositol 3.28 H5 6.66E-03 ± 2.40E-04 6.86E-03 ± 3.45E-04 NS -3.0choline 3.20 N(CH3)3 1.72E-02 ± 7.28E-04 2.12E-02 ± 8.87E-04 0.007 -18.7creatine 3.92 CH2 1.72E-02 ± 5.57E-04 1.80E-02 ± 6.94E-04 NS -4.6glutamine 2.44 γ-CH2 1.64E-02 ± 6.83E-04 1.65E-02 ± 7.32E-04 NS -0.3phenylalanine 7.43-7.29 aromatics 2.39E-03 ± 9.87E-05 2.70E-03 ± 8.97E-05 0.0174 -11.6tyrosine 6.88/7.18 aromatics 6.32E-03 ± 2.98E-04 7.30E-03 ± 2.59E-04 0.0177 -13.4valine 1.03/0.97 CH3 4.51E-02 ± 1.70E-03 5.03E-02 ± 1.80E-03 0.0367 -10.2leucine 0.95 CH3 2.91E-02 ± 1.05E-03 3.23E-02 ± 1.15E-03 NS -9.8alanine 1.47 CH3 1.09E-02 ± 2.96E-04 1.07E-02 ± 2.29E-04 NS 2.1a Integral values are normalised to the sum of total spectral intensity. b p values were calculated by Mann-Whitney U test. NS=Non-significant result (p value >0.05). c
Variation of the amount of metabolite in subject cases relative to controls: positive value indicates an increase and negative value a decrease for the cases. d Overlappedwith lipid signals. VLDL: Very low density lipoprotein. LDL: Low density lipoprotein.doi: 10.1371/journal.pone.0080121.t008
Metabolomic Profile in IUGR
PLOS ONE | www.plosone.org 15 December 2013 | Volume 8 | Issue 12 | e80121
vasodilated fetuses share a similar pathophysiology withdifferences in the timing and severity of the disease[16,19,78,79]. However, at the same time there are commonfeatures to both late-IUGR subsets, which are not observed inearly-onset IUGR fetuses. Further research is required toidentify the origin of such changes in late-onset IUGR, since asdiscussed above, diverse pathways could lead to similar
effects. These results provide grounds for future studies aimingat characterizing comprehensively specific hormonal andmetabolic alterations underlying different pathophysiologicalsubsets within the common diagnostic label of intrauterinegrowth restriction. Such knowledge is required to advance inthe development of biomarkers and identify therapeuticapproaches.
Figure 6. - Variation of the relative amount of lipids, glucose and acetone/acetoacetate (ketones) in early IUGR,vasodilated (VD) late IUGR and non-VD late IUGR cases relative to controls: positive value indicates an increase andnegative value a decrease in the cases. * represents a statistically significant metabolic variation ( p< 0.05). Unsat.lipids=Unsaturated lipids. VLDL=Very low density lipoprotein. LDL=Low density lipoprotein.doi: 10.1371/journal.pone.0080121.g006
Metabolomic Profile in IUGR
PLOS ONE | www.plosone.org 16 December 2013 | Volume 8 | Issue 12 | e80121
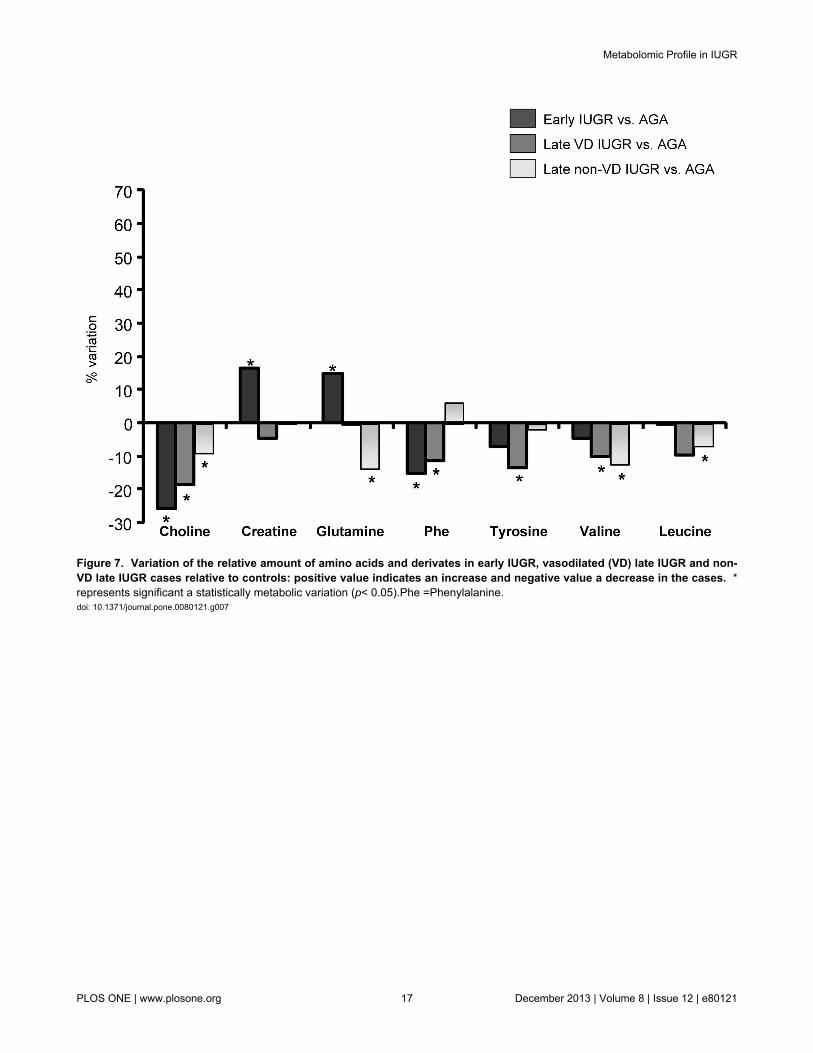
Figure 7. Variation of the relative amount of amino acids and derivates in early IUGR, vasodilated (VD) late IUGR and non-VD late IUGR cases relative to controls: positive value indicates an increase and negative value a decrease in the cases. *represents significant a statistically metabolic variation (p< 0.05).Phe =Phenylalanine.doi: 10.1371/journal.pone.0080121.g007
Metabolomic Profile in IUGR
PLOS ONE | www.plosone.org 17 December 2013 | Volume 8 | Issue 12 | e80121
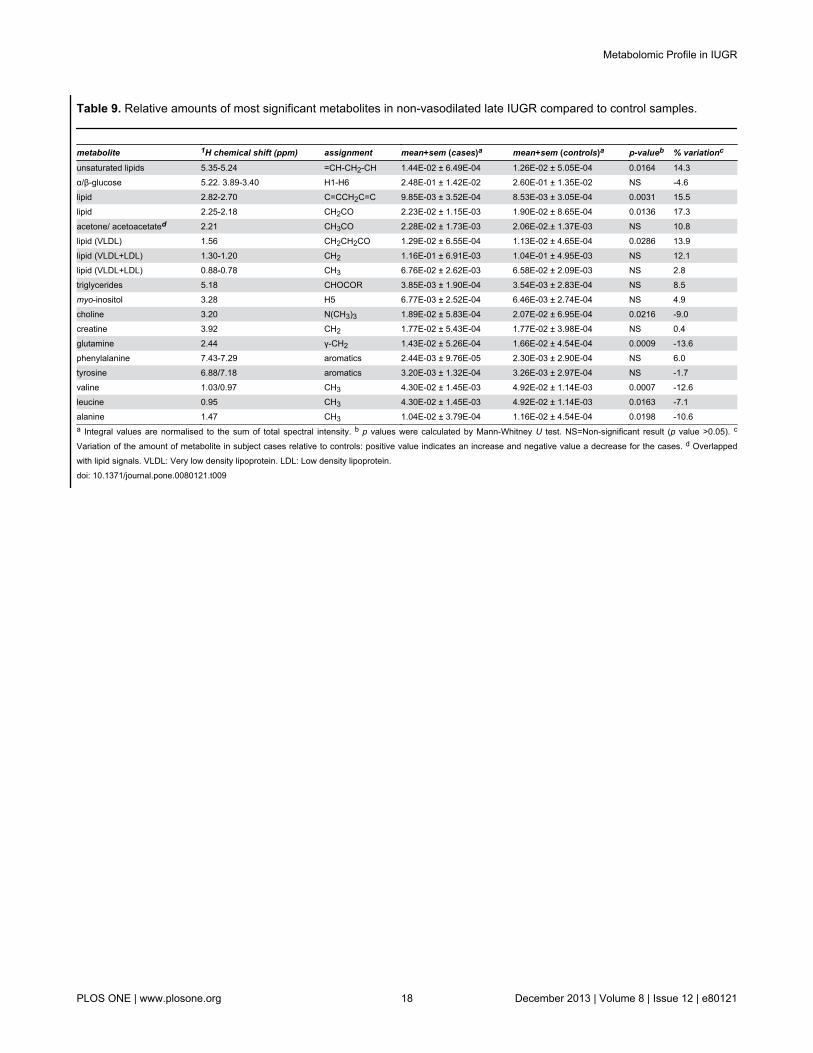
Table 9. Relative amounts of most significant metabolites in non-vasodilated late IUGR compared to control samples.
metabolite 1H chemical shift (ppm) assignment mean+sem (cases)a mean+sem (controls)a p-valueb % variationc
unsaturated lipids 5.35-5.24 =CH-CH2-CH 1.44E-02 ± 6.49E-04 1.26E-02 ± 5.05E-04 0.0164 14.3α/β-glucose 5.22. 3.89-3.40 H1-H6 2.48E-01 ± 1.42E-02 2.60E-01 ± 1.35E-02 NS -4.6lipid 2.82-2.70 C=CCH2C=C 9.85E-03 ± 3.52E-04 8.53E-03 ± 3.05E-04 0.0031 15.5lipid 2.25-2.18 CH2CO 2.23E-02 ± 1.15E-03 1.90E-02 ± 8.65E-04 0.0136 17.3
acetone/ acetoacetated 2.21 CH3CO 2.28E-02 ± 1.73E-03 2.06E-02.± 1.37E-03 NS 10.8lipid (VLDL) 1.56 CH2CH2CO 1.29E-02 ± 6.55E-04 1.13E-02 ± 4.65E-04 0.0286 13.9lipid (VLDL+LDL) 1.30-1.20 CH2 1.16E-01 ± 6.91E-03 1.04E-01 ± 4.95E-03 NS 12.1lipid (VLDL+LDL) 0.88-0.78 CH3 6.76E-02 ± 2.62E-03 6.58E-02 ± 2.09E-03 NS 2.8triglycerides 5.18 CHOCOR 3.85E-03 ± 1.90E-04 3.54E-03 ± 2.83E-04 NS 8.5myo-inositol 3.28 H5 6.77E-03 ± 2.52E-04 6.46E-03 ± 2.74E-04 NS 4.9choline 3.20 N(CH3)3 1.89E-02 ± 5.83E-04 2.07E-02 ± 6.95E-04 0.0216 -9.0creatine 3.92 CH2 1.77E-02 ± 5.43E-04 1.77E-02 ± 3.98E-04 NS 0.4glutamine 2.44 γ-CH2 1.43E-02 ± 5.26E-04 1.66E-02 ± 4.54E-04 0.0009 -13.6phenylalanine 7.43-7.29 aromatics 2.44E-03 ± 9.76E-05 2.30E-03 ± 2.90E-04 NS 6.0tyrosine 6.88/7.18 aromatics 3.20E-03 ± 1.32E-04 3.26E-03 ± 2.97E-04 NS -1.7valine 1.03/0.97 CH3 4.30E-02 ± 1.45E-03 4.92E-02 ± 1.14E-03 0.0007 -12.6leucine 0.95 CH3 4.30E-02 ± 1.45E-03 4.92E-02 ± 1.14E-03 0.0163 -7.1alanine 1.47 CH3 1.04E-02 ± 3.79E-04 1.16E-02 ± 4.54E-04 0.0198 -10.6a Integral values are normalised to the sum of total spectral intensity. b p values were calculated by Mann-Whitney U test. NS=Non-significant result (p value >0.05). c
Variation of the amount of metabolite in subject cases relative to controls: positive value indicates an increase and negative value a decrease for the cases. d Overlappedwith lipid signals. VLDL: Very low density lipoprotein. LDL: Low density lipoprotein.doi: 10.1371/journal.pone.0080121.t009
Metabolomic Profile in IUGR
PLOS ONE | www.plosone.org 18 December 2013 | Volume 8 | Issue 12 | e80121
Supporting Information
Figure S1. Multivariate statistical analysis of the latesubset. PCA scores plot of the 1H-CPMG spectra from controls(N = 51, red dots) and cases (N = 55, black squares). The firsttwo principal components, PC1 and PC2 explain 36 and 30%of the variation, respectively.(TIF)
Figure S2. Multivariate statistical analysis of the latesubset. (a) PLS-DA (R2Y = 0.22; Q2 = 0.07; p-value = 0.133,statistically non-significant) and (b) OPLS-DA (R2Y = 0.30; Q2
=0.17; p-value = 0.005) scores plots of the 1H-CPMG spectrafrom the controls (N = 51, red dots) and cases (N = 55, blacksquares). Samples from cases and controls were defined astwo different classes.
(TIF)
Table S1. Maternal drug administration in early IUGRsubset.(DOC)
Table S2. Maternal drug administration in late IUGRsubset.(DOC)
Author Contributions
Conceived and designed the experiments: MSC RJC FC FFEG APL. Performed the experiments: MSC RJC APL. Analyzedthe data: MSC RJC FC FF EG APL. Contributed reagents/materials/analysis tools: MSC RJC FC FF EG APL. Wrote themanuscript: MSC RJC FC FF EG APL.
References
1. Bernstein IM, Horbar JD, Badger GJ, Ohlsson A, Golan A (2000)Morbidity and mortality among very-low-birth-weight neonates withintrauterine growth restriction. The Vermont Oxford Network. Am JObstet Gynecol 182: 198-206. doi:10.1016/S0002-9378(00)70513-8.PubMed: 10649179.
2. McCowan LM, Harding JE, Stewart AW (2000) Umbilical artery Dopplerstudies in small for gestational age babies reflect disease severity.BJOG 107: 916-925. doi:10.1111/j.1471-0528.2000.tb11092.x.PubMed: 10901565.
3. Figueras F, Eixarch E, Gratacos E, Gardosi J (2008) Predictiveness ofantenatal umbilical artery Doppler for adverse pregnancy outcome insmall-for-gestational-age babies according to customised birthweightcentiles: population-based study. BJOG 115: 590-594. doi:10.1111/j.1471-0528.2008.01670.x. PubMed: 18333939.
4. Cruz-Lemini M, Crispi F, Van Mieghem T, Pedraza D, Cruz-Martínez Ret al. (2012) Risk of perinatal death in early-onset intrauterine growthrestriction according to gestational age and cardiovascular Dopplerindices: a multicenter study. Fetal Diagn Ther 32: 116-122. doi:10.1159/000333001. PubMed: 22777088.
5. Barker DJ (1995) Fetal origins of coronary heart disease. BMJ 311:171-174. doi:10.1136/bmj.311.6998.171. PubMed: 7613432.
6. Arcangeli T, Thilaganathan B, Hooper R, Khan KS, Bhide A (2012)Neurodevelopmental delay in small babies at term. A systematicreview. Ultrasound Obstet Gynecol.
7. Kaijser M, Bonamy AK, Akre O, Cnattingius S, Granath F et al. (2008)Perinatal risk factors for ischemic heart disease: disentangling the rolesof birth weight and preterm birth. Circulation 117: 405-410. doi:10.1161/CIRCULATIONAHA.107.710715. PubMed: 18172034.
8. Palinski W, Napoli C (2008) Impaired fetal growth, cardiovasculardisease, and the need to move on. Circulation 117: 341-343. doi:10.1161/CIRCULATIONAHA.107.750133. PubMed: 18212299.
9. Hoyert DL, Mathews TJ, Menacker F, Strobino DM, Guyer B (2006)Annual summary of vital statistics: 2004. Pediatrics 117: 168-183. doi:10.1542/peds.2005-2587. PubMed: 16396875.
10. Baschat AA (2011) Neurodevelopment following fetal growth restrictionand its relationship with antepartum parameters of placentaldysfunction. Ultrasound Obstet Gynecol 37: 501-514. doi:10.1002/uog.9008. PubMed: 21520312.
11. Hecher K, Bilardo CM, Stigter RH, Ville Y, Hackelöer BJ et al. (2001)Monitoring of fetuses with intrauterine growth restriction: a longitudinalstudy. Ultrasound Obstet Gynecol 18: 564-570. doi:10.1046/j.0960-7692.2001.00590.x. PubMed: 11844190.
12. Bilardo CM, Wolf H, Stigter RH, Ville Y, Baez E et al. (2004)Relationship between monitoring parameters and perinatal outcome insevere, early intrauterine growth restriction. Ultrasound Obstet Gynecol23: 119-125. doi:10.1002/uog.965. PubMed: 14770389.
13. Figueras F, Eixarch E, Meler E, Iraola A, Figueras J et al. (2008) Small-for-gestational-age fetuses with normal umbilical artery Doppler havesuboptimal perinatal and neurodevelopmental outcome. Eur J ObstetGynecol Reprod Biol 136: 34-38. doi:10.1016/j.ejogrb.2007.02.016.PubMed: 17434250.
14. Miller J, Turan S, Baschat AA (2008) Fetal growth restriction. SeminPerinatol 32: 274-280. doi:10.1053/j.semperi.2008.04.010. PubMed:18652928.
15. Figueras F, Oros D, Cruz-Martinez R, Padilla N, Hernandez-Andrade Eet al. (2009) Neurobehavior in term, small-for-gestational age infantswith normal placental function. Pediatrics 124: e934-e941. doi:10.1542/peds.2008-3346. PubMed: 19858151.
16. Cruz-Martínez R, Figueras F, Hernandez-Andrade E, Oros D, GratacosE (2011) Fetal brain Doppler to predict cesarean delivery fornonreassuring fetal status in term small-for-gestational-age fetuses.Obstet Gynecol 117: 618-626. doi:10.1097/AOG.0b013e31820b0884.PubMed: 21343765.
17. Severi FM, Bocchi C, Visentin A, Falco P, Cobellis L et al. (2002)Uterine and fetal cerebral Doppler predict the outcome of third-trimestersmall-for-gestational age fetuses with normal umbilical artery Doppler.Ultrasound Obstet Gynecol 19: 225-228. doi:10.1046/j.1469-0705.2002.00652.x. PubMed: 11896941.
18. Hershkovitz R, Kingdom JC, Geary M, Rodeck CH (2000) Fetalcerebral blood flow redistribution in late gestation: identification ofcompromise in small fetuses with normal umbilical artery Doppler.Ultrasound Obstet Gynecol 15: 209-212. doi:10.1046/j.1469-0705.2000.00079.x. PubMed: 10846776.
19. Oros D, Figueras F, Cruz-Martinez R, Padilla N, Meler E et al. (2010)Middle versus anterior cerebral artery Doppler for the prediction ofperinatal outcome and neonatal neurobehavior in term small-for-gestational-age fetuses with normal umbilical artery Doppler.Ultrasound Obstet Gynecol 35: 456-461. doi:10.1002/uog.7588.PubMed: 20178115.
20. Hecher K, Snijders R, Campbell S, Nicolaides K (1995) Fetal venous,intracardiac, and arterial blood flow measurements in intrauterinegrowth retardation: relationship with fetal blood gases. Am J ObstetGynecol 173: 10-15. doi:10.1016/0002-9378(95)90161-2. PubMed:7631665.
21. Cruz-Martinez R, Figueras F, Oros D, Padilla N, Meler E et al. (2009)Cerebral blood perfusion and neurobehavioral performance in full-termsmall-for-gestational-age fetuses. Am J Obstet Gynecol 201: 474:e471-e477. PubMed: 19631930.
22. Goodacre R, Vaidyanathan S, Dunn WB, Harrigan GG, Kell DB (2004)Metabolomics by numbers: acquiring and understanding globalmetabolite data. Trends Biotechnol 22: 245-252. doi:10.1016/j.tibtech.2004.03.007. PubMed: 15109811.
23. Allen J, Davey HM, Broadhurst D, Heald JK, Rowland JJ et al. (2003)High-throughput classification of yeast mutants for functional genomicsusing metabolic footprinting. Nat Biotechnol 21: 692-696. doi:10.1038/nbt823. PubMed: 12740584.
24. Romero R, Espinoza J, Gotsch F, Kusanovic JP, Friel LA et al. (2006)The use of high-dimensional biology (genomics, transcriptomics,proteomics, and metabolomics) to understand the preterm parturitionsyndrome. BJOG 113 Suppl 3: 118-135. doi:10.1111/j.1471-0528.2006.01150.x. PubMed: 17206980.
25. Favretto D, Cosmi E, Ragazzi E, Visentin S, Tucci M et al. (2012) Cordblood metabolomic profiling in intrauterine growth restriction. Anal
Metabolomic Profile in IUGR
PLOS ONE | www.plosone.org 19 December 2013 | Volume 8 | Issue 12 | e80121
Bioanal Chem 402: 1109-1121. doi:10.1007/s00216-011-5540-z.PubMed: 22101423.
26. Ivorra C, García-Vicent C, Chaves FJ, Monleón D, Morales JM et al.(2012) Metabolomic profiling in blood from umbilical cords of low birthweight newborns. J Transl Med 10: 142. doi:10.1186/1479-5876-10-142. PubMed: 22776444.
27. Robinson HP, Fleming JE (1975) A critical evaluation of sonar "crown-rump length" measurements. Br J Obstet Gynaecol 82: 702-710. doi:10.1111/j.1471-0528.1975.tb00710.x. PubMed: 1182090.
28. Figueras F, Meler E, Iraola A, Eixarch E, Coll O et al. (2008)Customized birthweight standards for a Spanish population. Eur JObstet Gynecol Reprod Biol 136: 20-24. doi:10.1016/j.ejogrb.2006.12.015. PubMed: 17287065.
29. Arduini D, Rizzo G (1990) Normal values of Pulsatility Index from fetalvessels: a cross-sectional study on 1556 healthy fetuses. J Perinat Med18: 165-172. doi:10.1515/jpme.1990.18.3.165. PubMed: 2200862.
30. Baschat AA, Gembruch U (2003) The cerebroplacental Doppler ratiorevisited. Ultrasound Obstet Gynecol 21: 124-127. doi:10.1002/uog.20.PubMed: 12601831.
31. Beckonert O, Keun HC, Ebbels TM, Bundy J, Holmes E et al. (2007)Metabolic profiling, metabolomic and metabonomic procedures forNMR spectroscopy of urine, plasma, serum and tissue extracts. NatProtoc 2: 2692-2703. doi:10.1038/nprot.2007.376. PubMed: 18007604.
32. Bernini P, Bertini I, Luchinat C, Nincheri P, Staderini S et al. (2011)Standard operating procedures for pre-analytical handling of blood andurine for metabolomic studies and biobanks. J Biomol NMR 49:231-243. doi:10.1007/s10858-011-9489-1. PubMed: 21380509.
33. Meiboom S, Gill D (1958) Modified spin echo method for measuringnuclear relaxation times. Review of Scientific Instruments 29: 688-691.doi:10.1063/1.1716296.
34. Nicholson JK, Foxall PJ, Spraul M, Farrant RD, Lindon JC (1995) 750MHz 1H and 1H-13C NMR spectroscopy of human blood plasma. AnalChem 67: 793-811. doi:10.1021/ac00101a004. PubMed: 7762816.
35. Lindon JC (2010) Biofluids studied by NMR spectroscopy.Encyclopedia of Spectroscopy and Spectrometry. Elsevier. p. 128.
36. Barton RH, Waterman D, Bonner FW, Holmes E, Clarke R et al. (2010)The influence of EDTA and citrate anticoagulant addition to humanplasma on information recovery from NMR-based metabolic profilingstudies. Mol Biosyst 6(1): 215-224. doi:10.1039/b907021d. PubMed:20024083.
37. Story L, Damodaram MS, Allsop JM, McGuinness A, Patel A et al.(2011) Brain metabolism in fetal intrauterine growth restriction: a protonmagnetic resonance spectroscopy study. Am J Obstet Gynecol 205:483: e481-e488. PubMed: 21861969.
38. Leduc L, Delvin E, Ouellet A, Garofalo C, Grenier E et al. (2011)Oxidized low-density lipoproteins in cord blood from neonates withintra-uterine growth restriction. Eur J Obstet Gynecol Reprod Biol 156:46-49. doi:10.1016/j.ejogrb.2011.01.007. PubMed: 21324580.
39. Pecks U, Brieger M, Schiessl B, Bauerschlag DO, Piroth D et al. (2012)Maternal and fetal cord blood lipids in intrauterine growth restriction. JPerinat Med 40: 287-296. PubMed: 22505508.
40. Pecks U, Caspers R, Schiessl B, Bauerschlag D, Piroth D et al. (2012)The evaluation of the oxidative state of low-density lipoproteins inintrauterine growth restriction and preeclampsia. Hypertens Pregnancy31: 156-165. doi:10.3109/10641955.2010.544805. PubMed: 21250891.
41. Lin G, Liu C, Feng C, Fan Z, Dai Z et al. (2012) Metabolomic analysisreveals differences in umbilical vein plasma metabolites betweennormal and growth-restricted fetal pigs during late gestation. J Nutr142: 990-998. doi:10.3945/jn.111.153411. PubMed: 22513987.
42. Kaser S, Ebenbichler CF, Wolf HJ, Sandhofer A, Stanzl U et al. (2001)Lipoprotein profile and cholesteryl ester transfer protein in neonates.Metabolism 50: 723-728. doi:10.1053/meta.2001.23307. PubMed:11398152.
43. Alvino G, Cozzi V, Radaelli T, Ortega H, Herrera E et al. (2008)Maternal and fetal fatty acid profile in normal and intrauterine growthrestriction pregnancies with and without preeclampsia. Pediatr Res 64:615-620. doi:10.1203/PDR.0b013e31818702a2. PubMed: 19034199.
44. Matorras R, Perteagudo L, Nieto A, Sanjurjo P (1994) Intrauterinegrowth retardation and plasma fatty acids in the mother and the fetus.Eur J Obstet Gynecol Reprod Biol 57: 189-193. doi:10.1016/0028-2243(94)90299-2. PubMed: 7713295.
45. Raff H, Bruder ED, Jankowski BM, Goodfriend TL (2000) Neonatalhypoxic hyperlipidemia in the rat: effects on aldosterone andcorticosterone synthesis in vitro. Am J Physiol Regul Integr CompPhysiol 278: R663-R668. PubMed: 10712286.
46. Horgan RP, Broadhurst DI, Dunn WB, Brown M, Heazell AE et al.(2010) Changes in the metabolic footprint of placental explant-conditioned medium cultured in different oxygen tensions fromplacentas of small for gestational age and normal pregnancies.
Placenta 31: 893-901. doi:10.1016/j.placenta.2010.07.002. PubMed:20708797.
47. Mordasini R, Klose G, Greten H (1978) Secondary type IIhyperlipoproteinemia in patients with anorexia nervosa. Metabolism 27:71-79. doi:10.1016/0026-0495(78)90125-7. PubMed: 201820.
48. Arden MR, Weiselberg EC, Nussbaum MP, Shenker IR, Jacobson MS(1990) Effect of weight restoration on the dyslipoproteinemia ofanorexia nervosa. J Adolesc Health Care 11: 199-202. doi:10.1016/0197-0070(90)90348-6. PubMed: 2358386.
49. Yaffee S, Gold A, Sampugna J (1980) Effects of prolonged starvationon plasma free fatty acid levels and fatty acid composition ofmyocardial total lipids in the rat. J Nutr 110: 2490-2496. PubMed:7441376.
50. Regnault TR, Teng C, de Vrijer B, Galan HL, Wilkening RB et al. (2010)The tissue and plasma concentration of polyols and sugars in sheepintrauterine growth retardation. Exp Biol Med (Maywood) 235:999-1006. PubMed: 20576742.
51. Marconi AM, Paolini C, Buscaglia M, Zerbe G, Battaglia FC et al.(1996) The impact of gestational age and fetal growth on the maternal-fetal glucose concentration difference. Obstet Gynecol 87: 937-942.doi:10.1016/0029-7844(96)00048-8. PubMed: 8649702.
52. Engineer N, Kumar S (2010) Perinatal variables and neonataloutcomes in severely growth restricted preterm fetuses. Acta ObstetGynecol Scand 89: 1174-1181. doi:10.3109/00016349.2010.501370.PubMed: 20804344.
53. Tea I, Le Gall G, Küster A, Guignard N, Alexandre-Gouabau MC et al.(2012) 1H-NMR-based metabolic profiling of maternal and umbilicalcord blood indicates altered materno-foetal nutrient exchange inpreterm infants. PLOS ONE 7: e29947. doi:10.1371/journal.pone.0029947. PubMed: 22291897.
54. Marconi AM, Ronzoni S, Vailati S, Bozzetti P, Morabito A et al. (2009)Neonatal morbidity and mortality in intrauterine growth restricted(IUGR) pregnancies is predicated upon prenatal diagnosis of clinicalseverity. Reprod Sci 16: 373-379. doi:10.1177/1933719108327591.PubMed: 19087980.
55. Neu J (2001) Glutamine in the fetus and critically ill low birth weightneonate: metabolism and mechanism of action. J Nutr 131:2585S-2589S; discussion: 11533317.
56. Kuhn KS, Schuhmann K, Stehle P, Darmaun D, Fürst P (1999)Determination of glutamine in muscle protein facilitates accurateassessment of proteolysis and de novo synthesis-derived endogenousglutamine production. Am J Clin Nutr 70: 484-489. PubMed: 10500016.
57. Darmaun D, Roig JC, Auestad N, Sager BK, Neu J (1997) Glutaminemetabolism in very low birth weight infants. Pediatr Res 41: 391-396.doi:10.1203/00006450-199703000-00015. PubMed: 9078541.
58. Muhlbacher F, Kapadia CR, Colpoys MF, Smith RJ, Wilmore DW(1984) Effects of glucocorticoids on glutamine metabolism in skeletalmuscle. Am J Physiol 247: E75-E83. PubMed: 6146264.
59. Ardawi MS, Jamal YS (1990) Glutamine metabolism in skeletal muscleof glucocorticoid-treated rats. Clin Sci (Lond) 79: 139-147. PubMed:1975227.
60. Nugent JL, Wareing M, Palin V, Sibley CP, Baker PN et al. (2013)Chronic glucocorticoid exposure potentiates placental chorionic plateartery constriction: implications for aberrant fetoplacental vascularresistance in fetal growth restriction. Endocrinology 154: 876-887. doi:10.1210/en.2012-1927. PubMed: 23295737.
61. Sloboda DM, Newnham JP, Challis JR (2000) Effects of repeatedmaternal betamethasone administration on growth and hypothalamic-pituitary-adrenal function of the ovine fetus at term. J Endocrinol 165:79-91. doi:10.1677/joe.0.1650079. PubMed: 10750038.
62. Dessì A, Atzori L, Noto A, Visser GH, Gazzolo D et al. (2011)Metabolomics in newborns with intrauterine growth retardation (IUGR):urine reveals markers of metabolic syndrome. J Matern Fetal NeonatalMed 24 Suppl 2: 35-39. doi:10.3109/14767058.2011.605868. PubMed:21767100.
63. Paolini CL, Marconi AM, Ronzoni S, Di Noio M, Fennessey PV et al.(2001) Placental transport of leucine, phenylalanine, glycine, andproline in intrauterine growth-restricted pregnancies. J Clin EndocrinolMetab 86: 5427-5432. doi:10.1210/jc.86.11.5427. PubMed: 11701717.
64. Eixarch E, Meler E, Iraola A, Illa M, Crispi F et al. (2008)Neurodevelopmental outcome in 2-year-old infants who were small-for-gestational age term fetuses with cerebral blood flow redistribution.Ultrasound Obstet Gynecol 32: 894-899. doi:10.1002/uog.6249.PubMed: 19035538.
65. Geva R, Eshel R, Leitner Y, Fattal-Valevski A, Harel S (2006) Memoryfunctions of children born with asymmetric intrauterine growthrestriction. Brain Res 1117: 186-194. doi:10.1016/j.brainres.2006.08.004. PubMed: 16962082.
Metabolomic Profile in IUGR
PLOS ONE | www.plosone.org 20 December 2013 | Volume 8 | Issue 12 | e80121
66. Leitner Y, Fattal-Valevski A, Geva R, Eshel R, Toledano-Alhadef H etal. (2007) Neurodevelopmental outcome of children with intrauterinegrowth retardation: a longitudinal, 10-year prospective study. J ChildNeurol 22: 580-587. doi:10.1177/0883073807302605. PubMed:17690065.
67. Cetin I, Corbetta C, Sereni LP, Marconi AM, Bozzetti P et al. (1990)Umbilical amino acid concentrations in normal and growth-retardedfetuses sampled in utero by cordocentesis. Am J Obstet Gynecol 162:253-261. doi:10.1016/0002-9378(90)90860-A. PubMed: 2301500.
68. Palova S, Charvat J, Masopust J, Klapkova E, Kvapil M (2007)Changes in the plasma amino acid profile in anorexia nervosa. J IntMed Res 35: 389-394. doi:10.1177/147323000703500314. PubMed:17593868.
69. Hiroshige K, Sonta T, Suda T, Kanegae K, Ohtani A (2001) Oralsupplementation of branched-chain amino acid improves nutritionalstatus in elderly patients on chronic haemodialysis. Nephrol DialTransplant 16: 1856-1862. doi:10.1093/ndt/16.9.1856. PubMed:11522870.
70. You YN, Short KR, Jourdan M, Klaus KA, Walrand S et al. (2009) Theeffect of high glucocorticoid administration and food restriction onrodent skeletal muscle mitochondrial function and protein metabolism.PLOS ONE 4: e5283. doi:10.1371/journal.pone.0005283. PubMed:19381333.
71. Elia M, Farrell R, Ilic V, Smith R, Williamson DH (1980) The removal ofinfused leucine after injury, starvation and other conditions in man. ClinSci (Lond) 59: 275-283. PubMed: 7428295.
72. Zeisel SH, Niculescu MD (2006) Perinatal choline influences brainstructure and function. Nutr Rev 64: 197-203. doi:10.1111/j.1753-4887.2006.tb00202.x. PubMed: 16673755.
73. Sheard NF, Tayek JA, Bistrian BR, Blackburn GL, Zeisel SH (1986)Plasma choline concentration in humans fed parenterally. Am J ClinNutr 43: 219-224. PubMed: 3080867.
74. Ilcol YO, Yilmaz Z, Ulus IH (2003) Serum free and phospholipid-boundcholine decrease after surgery and methylprednisolone administrationin dogs. Neurosci Lett 339: 195-198. doi:10.1016/S0304-3940(03)00035-1. PubMed: 12633886.
75. Montoya DA, White AM, Williams CL, Blusztajn JK, Meck WH et al.(2000) Prenatal choline exposure alters hippocampal responsivenessto cholinergic stimulation in adulthood. Brain Res. Dev Brain Res 123:25-32. doi:10.1016/S0165-3806(00)00075-4.
76. Nurk E, Refsum H, Bjelland I, Drevon CA, Tell GS et al. (2012) Plasmafree choline, betaine and cognitive performance: the Hordaland HealthStudy. Br J Nutr: 1-9. PubMed: 22717142.
77. Crispi F, Bijnens B, Figueras F, Bartrons J, Eixarch E et al. (2010) Fetalgrowth restriction results in remodeled and less efficient hearts inchildren. Circulation 121: 2427-2436. doi:10.1161/CIRCULATIONAHA.110.937995. PubMed: 20497977.
78. Crispi FF, Cruz-Lemini M, Bartrons J, Bijnens B, Gratacos E (2012)Cardiovascular programming in children born small for gestational ageand relationship with prenatal signs of severity. Am J Obstet Gynecol,207: 121.e1. PubMed: 22717268.
79. Figueras F, Cruz-Martinez R, Sanz-Cortes M, Arranz A, Illa M et al.(2011) Neurobehavioral outcomes in preterm, growth-restricted infantswith and without prenatal advanced signs of brain-sparing. UltrasoundObstet Gynecol 38: 288-294. doi:10.1002/uog.9041. PubMed:21557369.
Metabolomic Profile in IUGR
PLOS ONE | www.plosone.org 21 December 2013 | Volume 8 | Issue 12 | e80121