Embed Size (px)
Citation preview

Neonatal NutritionNeonatal Nutrition Growth Expectations, Growth Expectations,
ParenteralParenteral & & EnteralEnteral Nutrition Nutrition ConsiderationsConsiderations
Suzanne Smith, MS, RD, LDSuzanne Smith, MS, RD, LDNeonatal Dietitian Neonatal Dietitian
Levine ChildrenLevine Children’’s Hospital s Hospital ASCOM# 60755
Pager ID# 8237
3/2011

Selected Criteria for Preterm Infants at Selected Criteria for Preterm Infants at Highest Nutrition Risk in the NICU settingHighest Nutrition Risk in the NICU setting
< 1000 grams< 1000 grams<30 weeks gestation <30 weeks gestation IUGR / SGAIUGR / SGAMultiple gestation, (discordance between multiples)Multiple gestation, (discordance between multiples)>15% weight loss from birth>15% weight loss from birth> 1> 1--2 weeks with continued weight loss / poor weight gain2 weeks with continued weight loss / poor weight gainUnable to advance Unable to advance enteralenteral
feedings, prolonged need for IV nutritionfeedings, prolonged need for IV nutritionConjugated Conjugated BilirubinBilirubin
> 2 mg/> 2 mg/dLdLChronic lung diseaseChronic lung diseaseNECNECGastrointestinal issuesGastrointestinal issuesRisk for or development of Risk for or development of osteopeniaosteopenia(unable to tolerate fortified human milk or premature (unable to tolerate fortified human milk or premature formula, formula, serum phosphorus < 4 mg/serum phosphorus < 4 mg/dLdL, serum alkaline phosphate > 600 U/L), serum alkaline phosphate > 600 U/L)
Groh-Wargo, S. & Sapsford, A. Enteral
Nutrition Support of the Preterm Infant in the Neonatal Intensive Care Unit. Nutr Clin Pract 2009;24;363.
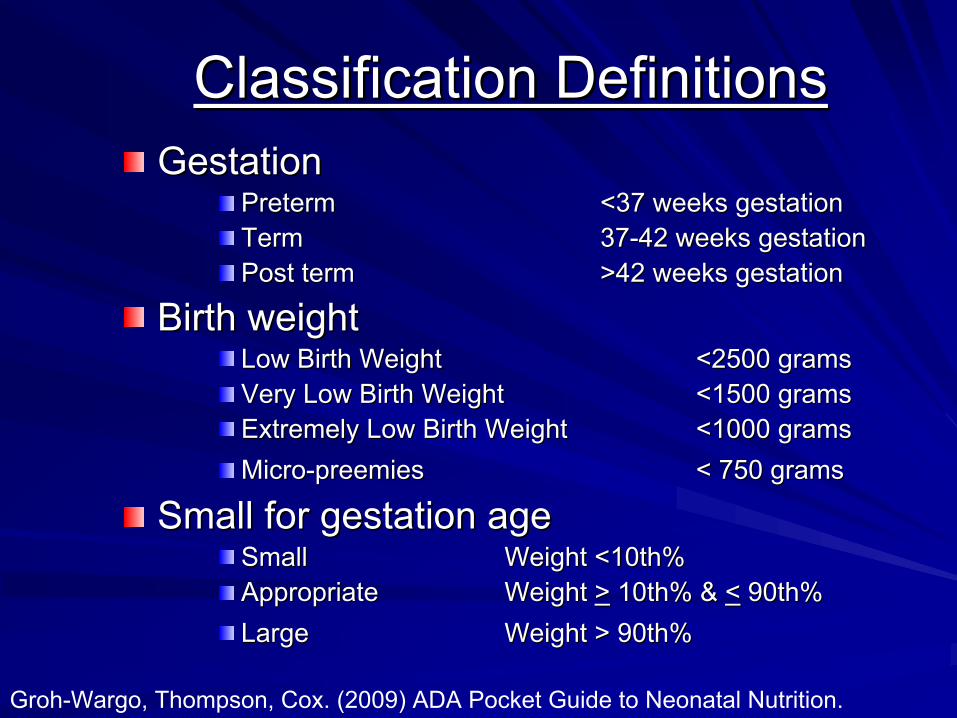
Classification DefinitionsClassification DefinitionsGestationGestation
PretermPreterm
<37 weeks gestation<37 weeks gestationTermTerm
3737--42 weeks gestation42 weeks gestationPost termPost term
>42 weeks gestation>42 weeks gestation
Birth weightBirth weightLow Birth WeightLow Birth Weight
<2500 grams<2500 gramsVery Low Birth WeightVery Low Birth Weight
<1500 grams<1500 gramsExtremely Low Birth WeightExtremely Low Birth Weight
<1000 grams<1000 gramsMicroMicro--preemiespreemies
< 750 grams< 750 grams
Small for gestation ageSmall for gestation ageSmallSmall
Weight <10th%Weight <10th%Appropriate Appropriate Weight Weight >>
10th% & 10th% & <<
90th%90th%Large Large Weight > 90th%Weight > 90th%
Groh-Wargo, Thompson, Cox. (2009) ADA Pocket Guide to Neonatal Nutrition.
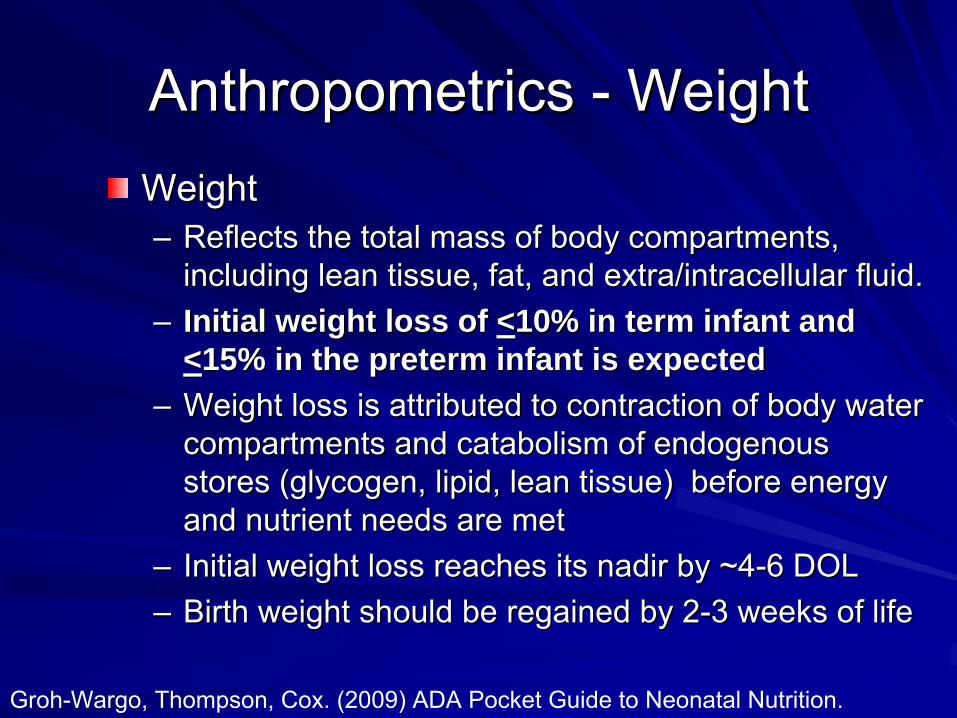
Anthropometrics Anthropometrics --
Weight Weight WeightWeight––
Reflects the total mass of body compartments, Reflects the total mass of body compartments, including lean tissue, fat, and extra/intracellular fluid.including lean tissue, fat, and extra/intracellular fluid.
––
Initial weight loss of Initial weight loss of <<10% in term infant and 10% in term infant and <<15% in the preterm infant is expected15% in the preterm infant is expected
––
Weight loss is attributed to contraction of body water Weight loss is attributed to contraction of body water compartments and catabolism of endogenous compartments and catabolism of endogenous stores (glycogen, lipid, lean tissue) before energy stores (glycogen, lipid, lean tissue) before energy and nutrient needs are metand nutrient needs are met
––
Initial weight loss reaches its nadir by ~4Initial weight loss reaches its nadir by ~4--6 DOL6 DOL––
Birth weight should be regained by 2Birth weight should be regained by 2--3 weeks of life 3 weeks of life
Groh-Wargo, Thompson, Cox. (2009) ADA Pocket Guide to Neonatal Nutrition.

Age Related Changes in Age Related Changes in Body CompositionBody Composition
0
20
40
60
80
100
WaterProteinFat
Water 87 79 70 60Protein 8 11 10 10Fat 5 10 20 30
1.0 kg 2.0 kg 3.5 kg 10.5 kg
Groh-Wargo, Thompson, Cox. (2009) ADA Pocket Guide to Neonatal Nutrition.

Anthropometrics Anthropometrics --
WeightWeightWeight gain is based on normal intrauterine growth Weight gain is based on normal intrauterine growth averagesaveragesWeight needs to be assessed dailyWeight needs to be assessed daily––
PretermPreterm
Infant <2000 gramsInfant <2000 grams
1515--20 grams/20 grams/kgkg/day/dayInfant >2000 grams Infant >2000 grams 2525--35 grams per day35 grams per day
––
Term InfantsTerm InfantsFirst 3 months of lifeFirst 3 months of life
2020--30 grams per day30 grams per day
Averaging weight gain over past 7 days Averaging weight gain over past 7 days [Monday[Monday’’s weight s weight ––
last Mondaylast Monday’’s weight / 7 / todays weight / 7 / today’’s wt in kg]s wt in kg]
Thinking Point Thinking Point →→
Weight gain is not always an Weight gain is not always an accurate measure of growth 2accurate measure of growth 2°°
changes in fluid statuschanges in fluid status
Groh-Wargo, Thompson, Cox. (2009) ADA Pocket Guide to Neonatal Nutrition.

Anthropometrics Anthropometrics --
WeightWeight
Use Use birth weight for first 7 days of lifebirth weight for first 7 days of life for for ALL calculationsALL calculationsUse current or Use current or daily weight after DOL 7daily weight after DOL 7If there is a big fluctuation in birth weight vs. If there is a big fluctuation in birth weight vs. current weight, an analysis weight may current weight, an analysis weight may need to be usedneed to be usedMonitor for unusual weights 2Monitor for unusual weights 2°°
fluid, scales, fluid, scales,
or equipmentor equipment

Anthropometrics Anthropometrics --
LengthLengthLength measurements more accurately Length measurements more accurately reflect lean body mass and is not influenced reflect lean body mass and is not influenced by fluid statusby fluid statusLength is more difficult to accurately measureLength is more difficult to accurately measurePretermPreterm
Based on normal intrauterine growthBased on normal intrauterine growthIncremental gain in crownIncremental gain in crown--heel length heel length 0.80.8--1.1cm/week1.1cm/week
TermTermFirst 3 months of life, infants grow 0.69First 3 months of life, infants grow 0.69--0.75cm/week0.75cm/week
Groh-Wargo, Thompson, Cox. (2009) ADA Pocket Guide to Neonatal Nutrition.

Anthropometrics Anthropometrics --
Head Head CircumferenceCircumference
Head growth correlates well with brain growth Head growth correlates well with brain growth during fetal development, infancy, and during fetal development, infancy, and childhood and with later developmental childhood and with later developmental achievement in preterm infantsachievement in preterm infantsPrePre--termterm
Recommended growthRecommended growth
0.50.5--1.0 cm/week1.0 cm/week
TermTermFirst 3 months of lifeFirst 3 months of life
0.5 cm/week0.5 cm/week
Groh-Wargo, Thompson, Cox. (2009) ADA Pocket Guide to Neonatal Nutrition.

Growth ChartsGrowth Charts2 types available2 types available––
Intrauterine growth data Intrauterine growth data
––
Postnatal growth dataPostnatal growth dataLocated in Located in SernerSerner, , NeodataNeodata, & Paper , & Paper ChartChartIdeal growth chart to use in NICU = FentonIdeal growth chart to use in NICU = Fenton
as it is based on fetal growth dataas it is based on fetal growth dataThinking PointThinking Point→→
Which is more concerning: Which is more concerning:
Symmetric or Asymmetric SGA?Symmetric or Asymmetric SGA?
Fenton TR. BMC Pediatrics 2003;3:13.

Reporting InfantReporting Infant’’s Growth s Growth During RoundsDuring Rounds
Sunday evening all growth parameters are obtainedSunday evening all growth parameters are obtainedReport growth parameters on Monday morning Report growth parameters on Monday morning roundsrounds––
Weight, rate of gain over past 7 days Weight, rate of gain over past 7 days
< 2 kg = report weight gain/per kg over the past 7 days< 2 kg = report weight gain/per kg over the past 7 daysIf infant is not back to birth weight, express weight loss as a If infant is not back to birth weight, express weight loss as a % of % of birth weight birth weight
––
Use Fenton Growth Charts to document growth Use Fenton Growth Charts to document growth percentilespercentiles
––
Length, rate of growth and percentileLength, rate of growth and percentile––
HC, rate of growth and percentileHC, rate of growth and percentile

Indications for TPNIndications for TPNFunctional immaturity of GI tractFunctional immaturity of GI tractNecrotizing Necrotizing EnterocolitisEnterocolitisCongenital GI anomalies Congenital GI anomalies ––
GastroschisisGastroschisis, , omphaloceleomphalocele, bowel obstruction, bowel , bowel obstruction, bowel atresiaatresia
MalabsorptionMalabsorption
syndromssyndroms––
SBS, CF, SBS, CF, meconiummeconium
ileusileus
Impaired GI motility Impaired GI motility ––
Prematurity, Prematurity, ileusileus
from surgery/sepsis, from surgery/sepsis, HirshsprungHirshsprung’’ss
diseasedisease
Impaired GI perfusion that decreases GI motility Impaired GI perfusion that decreases GI motility ––
Congenital heart disease, PDA, hypotensionCongenital heart disease, PDA, hypotension
Inadequate Inadequate enteralenteral
nutrient intake nutrient intake
Groh-Wargo, Thompson, Cox. (2009) ADA Pocket Guide to Neonatal Nutrition.

The Role of TPN in the NICUThe Role of TPN in the NICUInitially, the role of TPN is to provide sufficient Initially, the role of TPN is to provide sufficient calories and AA to prevent negative energy calories and AA to prevent negative energy and nitrogen balanceand nitrogen balance––
Minimum intake of 60 nonMinimum intake of 60 non--protein kcal/kg/day and protein kcal/kg/day and 2.5 g AA/kg/day2.5 g AA/kg/day
The rate of catabolism is higher in smaller The rate of catabolism is higher in smaller infants and the need for positive nitrogen infants and the need for positive nitrogen balance is more pronouncedbalance is more pronouncedSecondary, the role of TPN is to provide Secondary, the role of TPN is to provide enough energy to support adequate growth enough energy to support adequate growth and weight gainand weight gain––
Provide 70Provide 70--80 non80 non--protein kcal/kg/day and 3.5protein kcal/kg/day and 3.5--
4g/kg/day of protein 4g/kg/day of protein

IV AccessIV AccessPeripheral (Peripheral (osmolarityosmolarity
<1000 <1000 mOsmmOsm/L)/L)
––
Maximum Dextrose 11% Maximum Dextrose 11% >11% associated with >11% associated with ↑↑
incidence of phlebitis and skin sloughing incidence of phlebitis and skin sloughing secondary to secondary to osmolarityosmolarity
––
MidlineMidlineCentralCentral––
Maximum Dextrose 25% Maximum Dextrose 25% --
try not to go >D15 try not to go >D15
––
UVCUVCPICC / PCVC PICC / PCVC ––
Maximum Dextrose 25% Maximum Dextrose 25% --
try not to go >D15 try not to go >D15

Initial Fluid StatusInitial Fluid StatusGeneral GuidelinesGeneral Guidelines
<750 grams<750 grams
8080--100 100 mLmL/kg/day/kg/day>751 grams>751 grams
80 80 mLmL/kg/day/kg/day
Term InfantsTerm Infants
60 60 mLmL/kg/day/kg/day
Postnatal fluid restriction during the first 1Postnatal fluid restriction during the first 1--3 3 days is associated with reduced incidence of days is associated with reduced incidence of CLDCLDIncrease fluids by 10Increase fluids by 10--20 20 mLmL/kg daily until you /kg daily until you reach ~130 reach ~130 mL/kg/dmL/kg/d
for PNfor PN
EN fluid goal is ~150ml/kg/dEN fluid goal is ~150ml/kg/d
Groh-Wargo, Thompson, Cox. (2009) ADA Pocket Guide to Neonatal Nutrition.

Factors that increase IWLFactors that increase IWLIncreased ActivityIncreased ActivityRDSRDSLow Relative HumidityLow Relative HumidityHigh Ambient TemperatureHigh Ambient TemperatureFeverFeverELBWELBWMetabolic Acidosis (Metabolic Acidosis (↑↑respiratory loss)respiratory loss)Cardiac Disease Cardiac Disease ((↑↑respiratory loss)respiratory loss)Skin Breakdown, Injury, or Congenital DefectsSkin Breakdown, Injury, or Congenital DefectsPhototherapyPhototherapy
Radiant WarmersRadiant Warmers
Groh-Wargo, Thompson, Cox. (2009) ADA Pocket Guide to Neonatal Nutrition.

Factors that decrease IWLFactors that decrease IWLHumidified IncubatorHumidified IncubatorHumidified Inspired GasHumidified Inspired GasDouble Wall IncubatorDouble Wall IncubatorTopical AgentsTopical Agents
Groh-Wargo, Thompson, Cox. (2009) ADA Pocket Guide to Neonatal Nutrition.

Miscellaneous Fluid LossesMiscellaneous Fluid LossesChest Tube DrainageChest Tube DrainageGastric SuctionGastric SuctionVomitingVomitingThird Spacing LossThird Spacing LossDiarrheaDiarrheaPhototherapy (Phototherapy (↑↑stool water losses)stool water losses)GlycosuriaGlycosuria
((↑↑urinary water losses)urinary water losses)
High Renal Solute Load High Renal Solute Load ((↑↑urine fluid loss)urine fluid loss)Infants with abdominal wall defects Infants with abdominal wall defects
Groh-Wargo, Thompson, Cox. (2009) ADA Pocket Guide to Neonatal Nutrition.

Indications for Fluid RestrictionIndications for Fluid RestrictionRenal FailureRenal FailureCHF, significant PDACHF, significant PDAMeningitisMeningitisPostoperative status Postoperative status --
inappropriate inappropriate
antidiureticantidiuretic
hormone secretion with hormone secretion with decreased urine outputdecreased urine output
Groh-Wargo, Thompson, Cox. (2009) ADA Pocket Guide to Neonatal Nutrition.

Components of TPN Components of TPN MacronutrientsMacronutrients––
DextroseDextrose
––
Amino AcidsAmino Acids––
LipidsLipids
MicronutrientsMicronutrients––
ElectrolytesElectrolytes
––
Vitamins & Minerals Vitamins & Minerals ––
Trace ElementsTrace Elements
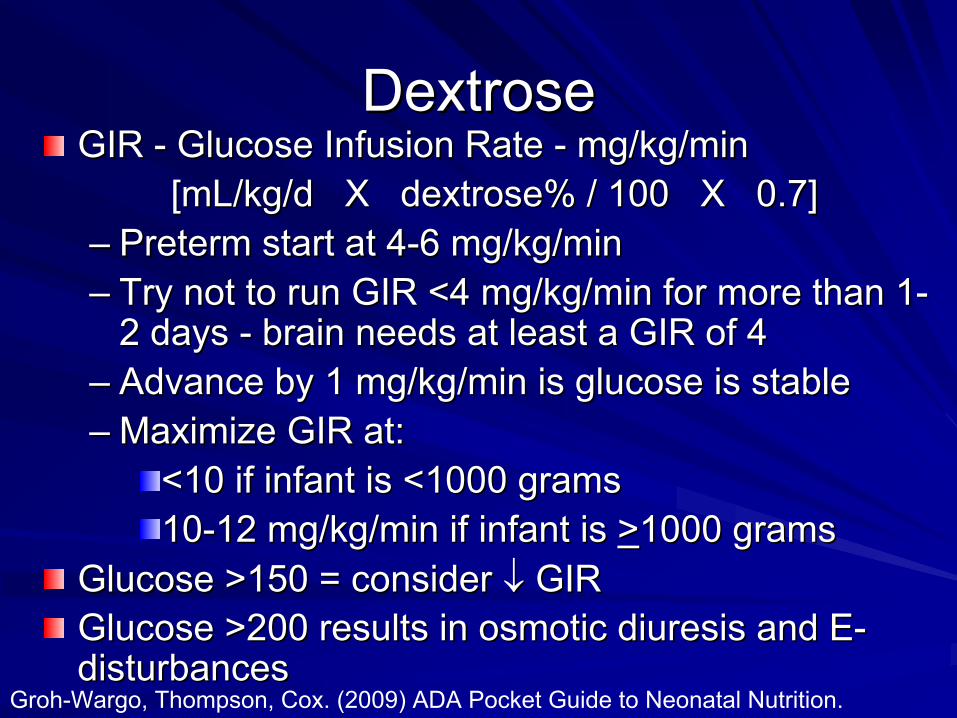
DextroseDextroseGIR GIR --
Glucose Infusion Rate Glucose Infusion Rate --
mg/kg/minmg/kg/min
[[mL/kg/dmL/kg/d
X dextrose% / 100 X 0.7]X dextrose% / 100 X 0.7]––
Preterm start at 4Preterm start at 4--6 mg/kg/min6 mg/kg/min
––
Try not to run GIR <4 mg/kg/min for more than 1Try not to run GIR <4 mg/kg/min for more than 1-- 2 days 2 days --
brain needs at least a GIR of 4brain needs at least a GIR of 4
––
Advance by 1 mg/kg/min is glucose is stableAdvance by 1 mg/kg/min is glucose is stable––
Maximize GIR at: Maximize GIR at:
<10 if infant is <1000 grams<10 if infant is <1000 grams1010--12 mg/kg/min if infant is 12 mg/kg/min if infant is >>1000 grams1000 grams
Glucose >150 = consider Glucose >150 = consider ↓↓
GIRGIRGlucose >200 results in osmotic Glucose >200 results in osmotic diuresisdiuresis
and Eand E--
disturbances disturbances Groh-Wargo, Thompson, Cox. (2009) ADA Pocket Guide to Neonatal Nutrition.
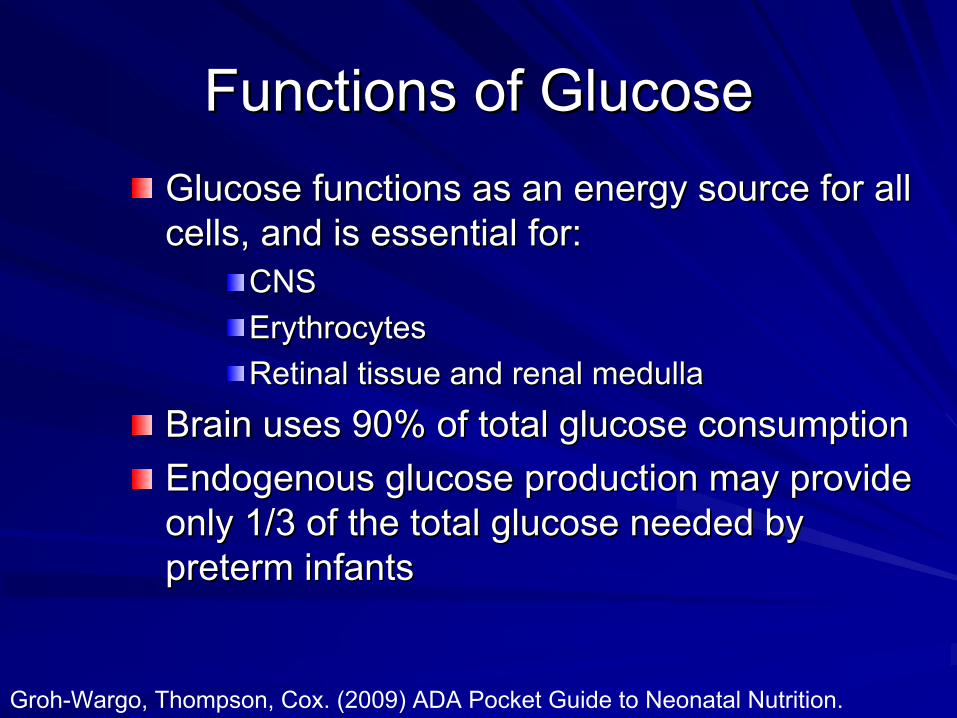
Functions of GlucoseFunctions of GlucoseGlucose functions as an energy source for all Glucose functions as an energy source for all cells, and is essential for:cells, and is essential for:
CNSCNSErythrocytesErythrocytesRetinal tissue and renal medullaRetinal tissue and renal medulla
Brain uses 90% of total glucose consumptionBrain uses 90% of total glucose consumptionEndogenous glucose production may provide Endogenous glucose production may provide only 1/3 of the total glucose needed by only 1/3 of the total glucose needed by preterm infantspreterm infants
Groh-Wargo, Thompson, Cox. (2009) ADA Pocket Guide to Neonatal Nutrition.
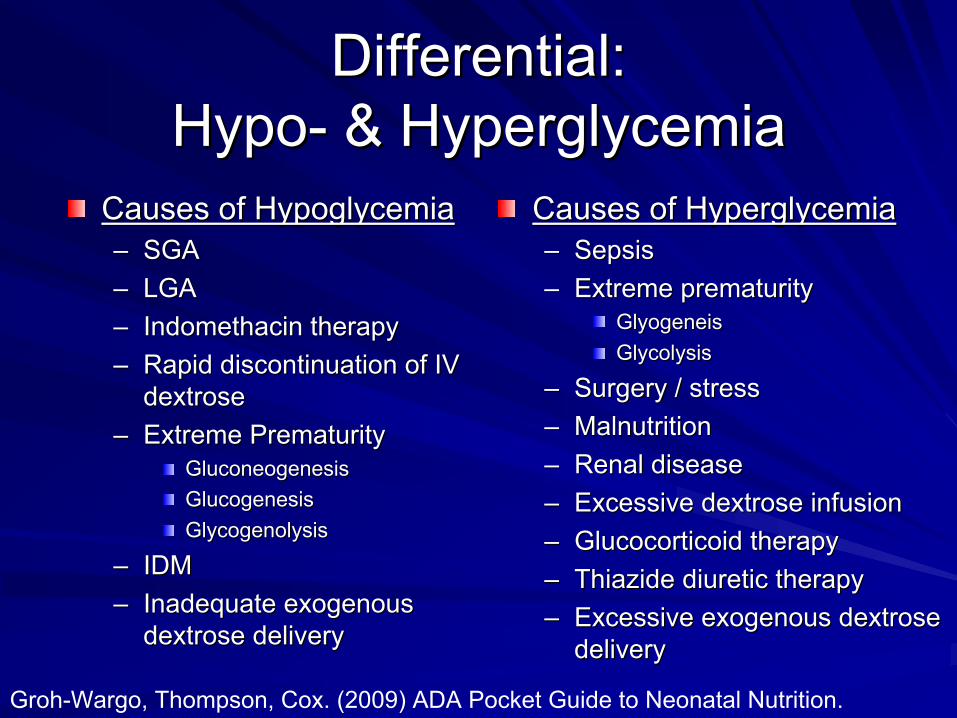
Differential:Differential: HypoHypo--
& Hyperglycemia & Hyperglycemia
Causes of HypoglycemiaCauses of Hypoglycemia––
SGASGA––
LGALGA––
IndomethacinIndomethacin
therapy therapy ––
Rapid discontinuation of IV Rapid discontinuation of IV dextrose dextrose
––
Extreme Prematurity Extreme Prematurity GluconeogenesisGluconeogenesisGlucogenesisGlucogenesisGlycogenolysisGlycogenolysis
––
IDMIDM––
Inadequate exogenous Inadequate exogenous dextrose delivery dextrose delivery
Causes of HyperglycemiaCauses of Hyperglycemia––
Sepsis Sepsis ––
Extreme prematurity Extreme prematurity GlyogeneisGlyogeneisGlycolysisGlycolysis
––
Surgery / stressSurgery / stress––
Malnutrition Malnutrition ––
Renal disease Renal disease ––
Excessive dextrose infusion Excessive dextrose infusion ––
GlucocorticoidGlucocorticoid
therapy therapy ––
ThiazideThiazide
diuretic therapy diuretic therapy ––
Excessive exogenous dextrose Excessive exogenous dextrose delivery delivery
Groh-Wargo, Thompson, Cox. (2009) ADA Pocket Guide to Neonatal Nutrition.

ProteinProtein
Written as Written as gm/kg/daygm/kg/day––
Preterm start at 3.0 Preterm start at 3.0 gm/kg/daygm/kg/day
––
Advance by 0.5Advance by 0.5--1.0 1.0 gm/kg/daygm/kg/day
––
Maximum of 4.0 Maximum of 4.0 gm/kg/daygm/kg/day
Protein is essential for:Protein is essential for:––
Cell MaturationCell Maturation
––
RemodelingRemodeling––
GrowthGrowth
––
Functional activity of enzymes Functional activity of enzymes and transport proteinsand transport proteins
The average well LBW infant The average well LBW infant receiving no exogenous protein receiving no exogenous protein source loses 1% of endogenous source loses 1% of endogenous protein stores daily.protein stores daily.
Groh-Wargo, Thompson, Cox. (2009) ADA Pocket Guide to Neonatal Nutrition.

Intravenous LipidsIntravenous Lipids
Written in Written in gm/kg/daygm/kg/day––
Preterm start at 1.5 Preterm start at 1.5 gm/kg/daygm/kg/day
––
Advance by 0.5Advance by 0.5--1.0 1.0 gm/kg/daygm/kg/day
––
MaximumMaximum Lipid 3.0 Lipid 3.0 gm/kg/daygm/kg/day
Concentrated energy sourceConcentrated energy sourceEssential for normal growth Essential for normal growth and development, including and development, including retinal development and retinal development and function, brain development, function, brain development, and cell structures and and cell structures and functionfunctionEssential to prevent fatty Essential to prevent fatty acid deficiencyacid deficiency––
Can develop w/in 72 hours of Can develop w/in 72 hours of birth birth
0.50.5--1.0 gm/kg/d1.0 gm/kg/dGroh-Wargo, Thompson, Cox. (2009) ADA Pocket Guide to Neonatal Nutrition.

NonNon--Protein Calorie : Nitrogen RatioProtein Calorie : Nitrogen RatioNPC:N Ratio = NonNPC:N Ratio = Non--protein calories / nitrogen from PROprotein calories / nitrogen from PRO––
NonNon--Protein Calories =Protein Calories =calories from CHO (GIR x 4.9) + calories from Fat (gm/kg Fat x 10)
––
Nitrogen = Nitrogen = grams/kg of protein / 6.25grams/kg of protein / 6.25
Ratio indicates if you are providing enough Ratio indicates if you are providing enough calories from noncalories from non--protein substrates so that the protein substrates so that the baby does not use the protein for energy baby does not use the protein for energy --
rather rather
endogenous deposition of lean body mass endogenous deposition of lean body mass RatiosRatios––
OptimalOptimal
> 130> 130––
LowLow
< 130< 130
Give more dextrose or lipid Give more dextrose or lipid ––
High High > 200 Give more protein and less dextrose> 200 Give more protein and less dextrose
Groh-Wargo, Thompson, Cox. (2009) ADA Pocket Guide to Neonatal Nutrition.

Composition of TPNComposition of TPNCalculating TPN CaloriesCalculating TPN Calories––
CHO (50CHO (50--55%)55%)Gm/kg CHO X 3.4 or Gm/kg CHO X 3.4 or GIR X 4.9 GIR X 4.9 Combine to get total calories from Combine to get total calories from
––
Protein (10Protein (10--20%)20%)
TPN per kgTPN per kgGm/kg/d of PRO X 4Gm/kg/d of PRO X 4
––
Fat (30Fat (30--50%) 50%) Gm/kg/d of FAT X 10Gm/kg/d of FAT X 10
Lower energy requirements for PN than EN Lower energy requirements for PN than EN b/cb/c
there are no there are no requirements for digestion of fecal losses due to incomplete requirements for digestion of fecal losses due to incomplete
absorption (80absorption (80--100 kcal/kg)100 kcal/kg)
Groh-Wargo, Thompson, Cox. (2009) ADA Pocket Guide to Neonatal Nutrition.

Electrolytes and MineralsElectrolytes and MineralsDo not need to add on DOL 1Do not need to add on DOL 1--22Labs reflect maternal values for the first Labs reflect maternal values for the first 1212--24 hours of life24 hours of lifeDo not want to make drastic changes to Do not want to make drastic changes to electrolytes electrolytes ––
want to correct gradually without over want to correct gradually without over correctioncorrection
––
allow for natural allow for natural diuresisdiuresis

SodiumSodiumNormal value 136Normal value 136--143 143 mEqmEq/L/LStart at 2 Start at 2 mEqmEq/kg/day/kg/dayGoal is 2Goal is 2--5 5 mEqmEq/kg/day based on infant /kg/day based on infant needsneedsLook at fluid status before correcting Look at fluid status before correcting sodium levelssodium levelsAdd once the Add once the diuresisdiuresis
phase begins phase begins
Groh-Wargo, Thompson, Cox. (2009) ADA Pocket Guide to Neonatal Nutrition.

Sodium Continued Sodium Continued Some clinical conditions affecting Some clinical conditions affecting exogenous sodium requirementsexogenous sodium requirements––
Extreme prematurity = limited renal tubular Extreme prematurity = limited renal tubular sodium resodium re--absorption absorption
Infants with Infants with ↑↑
fractional excretion require more fractional excretion require more exogenous Na+exogenous Na+
––
Abdominal wall defects = sodium wastingAbdominal wall defects = sodium wasting––
SBSSBS
––
Premature skin Premature skin
Groh-Wargo, Thompson, Cox. (2009) ADA Pocket Guide to Neonatal Nutrition.

PotassiumPotassiumNormal value 4.1Normal value 4.1--5.6 5.6 mEqmEq/L/LStart at 1 Start at 1 mEqmEq/kg/day/kg/dayGoal is 2Goal is 2--3 3 mEqmEq/kg/day based on infant /kg/day based on infant needsneedsIf the level is high, find out if it was a heel If the level is high, find out if it was a heel stick and if the lab is reporting stick and if the lab is reporting hemolysishemolysisAdd once the Add once the diuresisdiuresis
phase beginsphase begins
Groh-Wargo, Thompson, Cox. (2009) ADA Pocket Guide to Neonatal Nutrition.

Potassium ContinuedPotassium ContinuedNonNon--oliguricoliguric
hyperkalemiahyperkalemia
is commonis common
––
Extreme prematurity Extreme prematurity ––
Bruising Bruising
––
Catabolism Catabolism ––
Metabolic acidosis Metabolic acidosis
––
Potassium intake Potassium intake
Groh-Wargo, Thompson, Cox. (2009) ADA Pocket Guide to Neonatal Nutrition.

EE--
Carriers Carriers
NaNa
1)1) AcetateAcetate2) Phosphorus2) Phosphorus3) Chloride3) Chloride
K K

AcetateAcetateNormal valuesNormal values––
BicarbBicarb
2020--24 (on renal)24 (on renal)
––
pCO2 35pCO2 35--45 (on blood gas)45 (on blood gas)––
Base excess Base excess ––2 to +2 (on blood gas)2 to +2 (on blood gas)
Start at 1mEq/kg/dayStart at 1mEq/kg/dayAdjust based on infant needsAdjust based on infant needsMay need to sacrifice phosphorus to May need to sacrifice phosphorus to provide acetateprovide acetate
Groh-Wargo, Thompson, Cox. (2009) ADA Pocket Guide to Neonatal Nutrition.

Chloride Chloride Normal value 97Normal value 97--104 104 mEqmEq/L/LNecessary to correct other electrolyte Necessary to correct other electrolyte imbalancesimbalances““leftleft--overover””; Na and K added to TPN with ; Na and K added to TPN with acetate and phosphate first, then with acetate and phosphate first, then with chloridechloride
Groh-Wargo, Thompson, Cox. (2009) ADA Pocket Guide to Neonatal Nutrition.
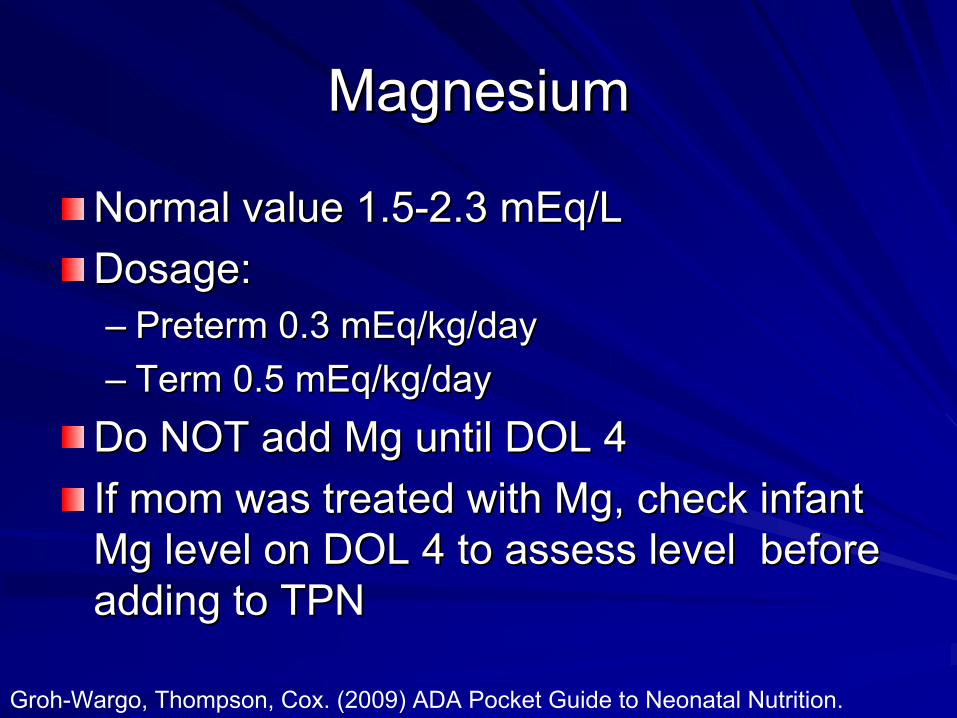
MagnesiumMagnesium
Normal value 1.5Normal value 1.5--2.3 2.3 mEqmEq/L/LDosage:Dosage:––
Preterm 0.3 Preterm 0.3 mEqmEq/kg/day/kg/day
––
Term 0.5 Term 0.5 mEqmEq/kg/day/kg/dayDo NOT add Mg until DOL 4Do NOT add Mg until DOL 4If mom was treated with Mg, check infant If mom was treated with Mg, check infant Mg level on DOL 4 to assess level before Mg level on DOL 4 to assess level before adding to TPNadding to TPN
Groh-Wargo, Thompson, Cox. (2009) ADA Pocket Guide to Neonatal Nutrition.

Calcium and PhosphateCalcium and PhosphateCalciumCalcium––
NormalNormal
<1 week 6<1 week 6--10mg/dL10mg/dL33--7 wks 87 wks 8--11mg/dL11mg/dL3mo3mo--1yr 91yr 9--12mg/dL 12mg/dL
––
Start at 2mEq/kg/dayStart at 2mEq/kg/day––
Advance to 2.5Advance to 2.5--
3.0mEq/kg/day3.0mEq/kg/day––
Maintain a 1.3Maintain a 1.3--1.7:1 1.7:1 ratio with phosphorusratio with phosphorus
––
Can start on Can start on onon day 1 day 1 w/o PO4w/o PO4
PhosphorusPhosphorus––
NormalNormal
<1wk<1wk
6.16.1--11.7mg/dL11.7mg/dL33--7wk 5.37wk 5.3--8.3 mg/8.3 mg/dLdL1mo. 5.01mo. 5.0--9.5 mg/9.5 mg/dLdL
––
Start at 1.3 Start at 1.3 mmolmmol/kg/day/kg/day
––
Advance to 1.5Advance to 1.5-- 2mmol/kg/day2mmol/kg/day
––
Maintain a 2:1 Maintain a 2:1 Calcium:PhosCalcium:Phos
ratio for ratio for
solubilitysolubility
Groh-Wargo, Thompson, Cox. (2009) ADA Pocket Guide to Neonatal Nutrition.

Clinical Case StudyClinical Case StudyNeonate receiving subNeonate receiving sub--optimal TPN optimal TPN Laboratory Studies Reveal:Laboratory Studies Reveal:––
↓↓
P04P04
––
↑↑AlkPhosAlkPhos––
↑↑CaCa
What do you do?What do you do?

Inversing Ca:PO4 RatioInversing Ca:PO4 RatioNeonate receiving subNeonate receiving sub--optimal TPN with optimal TPN with ↓↓
P04, and P04, and ↑↑CaCaRational: Rational: ––
Hormonal Control of CalciumHormonal Control of Calcium
1) PTH1) PTH2) 2) CalcitriolCalcitriol
[1,25(OH)[1,25(OH)22
DD33
]]3) 3) CalcitoninCalcitonin
TPN Prescription:TPN Prescription:––
Inverse Ca:PO4 Ratio for 48Inverse Ca:PO4 Ratio for 48--72 hours72 hours
Vachharajani, A., et. al. (2009) Metabolic Bone Disease of Prematurity. NeoReviews, (10), 8. p. 402-408.

Trace ElementsTrace ElementsStandard Trace MineralsStandard Trace Minerals––
Chromium 0.26mcg/kgChromium 0.26mcg/kg
––
Copper 26mcg/kg, Copper 26mcg/kg, ––
Manganese 7.8mcg/kg, Manganese 7.8mcg/kg,
––
Selenium 3.1mcg/kg, Selenium 3.1mcg/kg, ––
Zinc 400 mcg/kg Zinc 400 mcg/kg
Hepatic Trace Minerals Hepatic Trace Minerals
Renal Trace MineralsRenal Trace Minerals
Tsang, R., DeMarini, S., Rath, L. L. Fluids, electrolytes, vitamins, and trace minerals. In C. Kenner, J. W. Lott (Eds.).Comprehensive neonatal nursing: A physiologic perspective. 3rd ed. St. Louis: Saunders; 2003: 409-424.
Zlotkin, S., Atkinson, S., & Lockitch, G. (1996) Trace elements in nutrition for premature infants. Clinics in Perinatology. 22:223–240.

CholestasisCholestasisHepatic Trace Minerals (direct Hepatic Trace Minerals (direct bilibili >2.0mg/dL)>2.0mg/dL)––
Copper is excreted through the liver and infants with Copper is excreted through the liver and infants with limited Cu excretion 2limited Cu excretion 2°°
cholestasischolestasis
or other conditions or other conditions
that reduce bile excretion should not receive full that reduce bile excretion should not receive full dosingdosing
––
D/C supplemental ManganeseD/C supplemental Manganese––
Chromium 0.2mcg/kg, Copper 10 mcg/kg, Selenium Chromium 0.2mcg/kg, Copper 10 mcg/kg, Selenium 2mcg/kg, Zinc 400 mcg/kg 2mcg/kg, Zinc 400 mcg/kg
Consider reducing lipids to 1Consider reducing lipids to 1--2 gm/kg2 gm/kgReinshagenReinshagen et al 2008 >1 gm of lipid during et al 2008 >1 gm of lipid during bouts of bouts of cholestasischolestasis ↑↑oxidant load and oxidant load and tissue damage.tissue damage.
Rao, R. & Georgieff, M. Microminerals. In Tsang, R., Uauy, R., Koletzko, B., & Zlotkin, S. (Eds.) Nutrition of the Perterm
Infant: Scientific Basis and Pratical
Guidelines. 2nd ed. Cincinnati:Digital
Educatioon
Publishing, Inc.; 2005: 277-310.Reinshagen, K. et.al.The
chronic liver disease in patients with short bowel syndrome: etiology and treatment. Minerva Pediatr. 2009 Jun;61(3):273-81.

EnterohepaticEnterohepatic
Circulation of BileCirculation of Bile Hunt & Groff ,1990Hunt & Groff ,1990

How does the PN cause liver How does the PN cause liver damage?damage?
EnteralEnteral lipidslipids
EnteralEnteral lipids are lipids are absorbed by the absorbed by the enterocytesenterocytes in the form of in the form of a micelle and packed into a micelle and packed into chylomicronschylomicronsThe The chylomicronschylomicronsacquire acquire apolipoproteinsapolipoproteinsfrom the circulating HDL from the circulating HDL and then are metabolized and then are metabolized by the liverby the liver
ParenteralParenteral lipidslipidsThe Intravenous lipid (IL) The Intravenous lipid (IL) emulsions such as Intraemulsions such as Intra--Lipids Lipids mimic the size and structure of mimic the size and structure of chylomicronschylomicrons but contain only but contain only W6 FA and W6 FA and TGsTGsdevoid of cholesterol and devoid of cholesterol and proteinproteinIL depend on IL depend on apolipoproteinapolipoprotein E, E, lipoprotein lipase and LDLlipoprotein lipase and LDL--receptors for clearancereceptors for clearanceIL may be cleared as whole IL may be cleared as whole particles not by the liver but by particles not by the liver but by other tissues thereby causing other tissues thereby causing TPN induced TPN induced steatosissteatosis
ChingChing, , GuraGura, , ModiModi, & , & JaksicJaksic, , Nutrition in Clinical Practice,2007,Nutrition in Clinical Practice,2007, 22 (6)22 (6)

Renal InsufficiencyRenal Insufficiency
Renal Trace Minerals (urine output is Renal Trace Minerals (urine output is <1.0mL/kg/hr for >2days and/or with elevated <1.0mL/kg/hr for >2days and/or with elevated creatininecreatinine) ) ––
Selenium and Chromium is excreted through Selenium and Chromium is excreted through the kidney and supplementation should be the kidney and supplementation should be decreases or D/C if renal function is impaireddecreases or D/C if renal function is impaired
––
Chromium 0.1mcg/kg, Copper 20mcg/kg, Chromium 0.1mcg/kg, Copper 20mcg/kg, Manganese 1mcg/kg, Selenium 1mcg/kg, Zinc Manganese 1mcg/kg, Selenium 1mcg/kg, Zinc 400 mcg/kg400 mcg/kg
Tsang, R., DeMarini, S., Rath, L. L. Fluids, electrolytes, vitamins, and trace minerals. In C. Kenner, J. W. Lott (Eds.).Comprehensive neonatal nursing: A physiologic perspective. 3rd ed. St. Louis: Saunders; 2003: 409-424.
Zlotkin, S., Atkinson, S., & Lockitch, G. (1996) Trace elements in nutrition for premature infants. Clinics in Perinatology. 22:223–240.
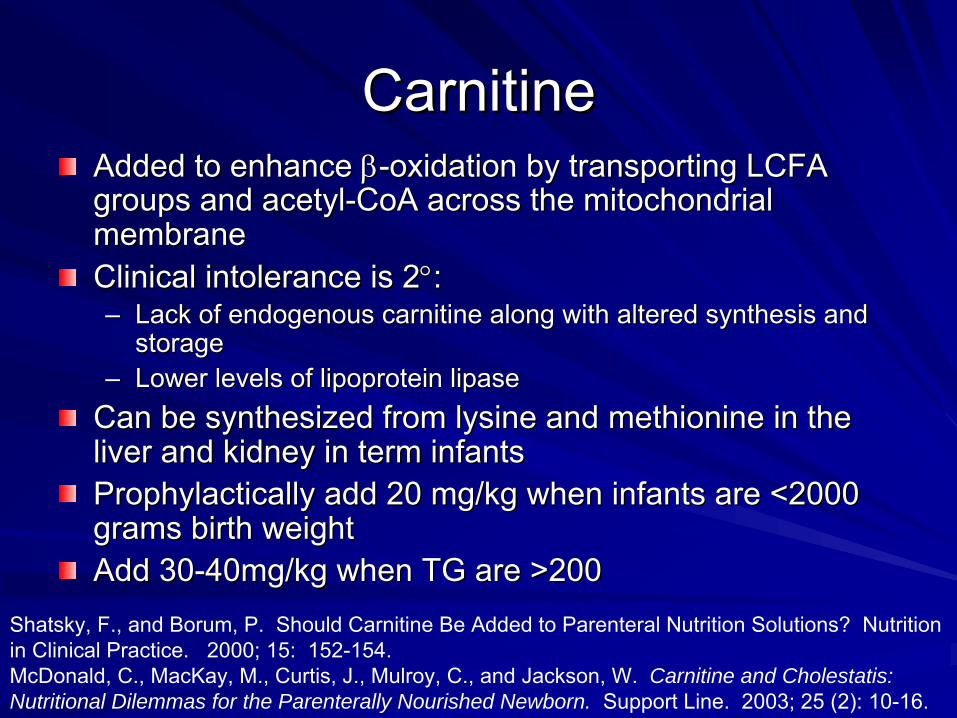
CarnitineCarnitineAdded to enhance Added to enhance ββ--oxidation by transporting LCFA oxidation by transporting LCFA groups and acetylgroups and acetyl--CoACoA
across the mitochondrial across the mitochondrial
membranemembraneClinical intolerance is 2Clinical intolerance is 2°°::––
Lack of endogenous Lack of endogenous carnitinecarnitine
along with altered synthesis and along with altered synthesis and storagestorage
––
Lower levels of lipoprotein lipase Lower levels of lipoprotein lipase Can be synthesized from lysine and Can be synthesized from lysine and methioninemethionine
in the in the
liver and kidney in term infantsliver and kidney in term infantsProphylacticallyProphylactically
add 20 mg/kg when infants are <2000 add 20 mg/kg when infants are <2000
grams birth weightgrams birth weightAdd 30Add 30--40mg/kg when TG are >20040mg/kg when TG are >200
Shatsky, F., and Borum, P. Should Carnitine
Be Added to Parenteral
Nutrition Solutions? Nutrition in Clinical Practice. 2000; 15: 152-154.McDonald, C., MacKay, M., Curtis, J., Mulroy, C., and Jackson, W. Carnitine and Cholestatis: Nutritional Dilemmas for the Parenterally Nourished Newborn. Support Line. 2003; 25 (2): 10-16.

CysteineCysteinePreterm infants lack the ability to Preterm infants lack the ability to synthesize synthesize cysteinecysteine
from from methioninemethionine
Can create a small metabolic acidosis in Can create a small metabolic acidosis in very small infants very small infants --
give acetate to buffergive acetate to buffer
↑↑
Ca/PO4 solubility Ca/PO4 solubility Helps to Helps to ↓↓
incidence of PNALDincidence of PNALD
Always add Always add 40 mg/gm protein40 mg/gm protein
Groh-Wargo, Thompson, Cox. (2009) ADA Pocket Guide to Neonatal Nutrition.

Heparin & Multivitamin Heparin & Multivitamin
Heparin Heparin ––
If a PCVC has been If a PCVC has been ordered, add to TPN ordered, add to TPN ––
watch watch osmolarityosmolarity––
Automatically Automatically calculated by calculated by computerized TPN computerized TPN program program
––
1 unit / 1 unit / mLmL
Multivitamin Multivitamin ––
Automatically dosed Automatically dosed by computerized TPN by computerized TPN program based on program based on infantinfant’’s weights weight
––
MVI includes:MVI includes:Vitamin A, B1, B2, B12, Vitamin A, B1, B2, B12, C, D, E, K, biotin, C, D, E, K, biotin, dexpanthemoldexpanthemol, folic , folic acid, acid, niacinamindeniacinaminde

TPN Considerations with TPN Considerations with Clinical Conditions Clinical Conditions --
SBSSBS
Protocol posted in office Protocol posted in office TPN @ 130 ml/kg/dTPN @ 130 ml/kg/d––
GIR 12GIR 12--1414
––
PRO 4 PRO 4 g/kg/dg/kg/d––
Lipid 0.5Lipid 0.5--2 2 g/kg/dg/kg/d
––
Hepatic Trace Elements When Direct Hepatic Trace Elements When Direct BiliBili
is >2is >2––
Zantac 2mg/kg/d (debatable) Zantac 2mg/kg/d (debatable)
––
Monitor serum sodium closely 2Monitor serum sodium closely 2°°
↑↑exogenous exogenous requirements requirements
Wessel, J. & Kocoshis,S. Nutritional Management of Infants with Short Bowel Syndrome, Sem Perinatology, 2007, 31 (2) 104.
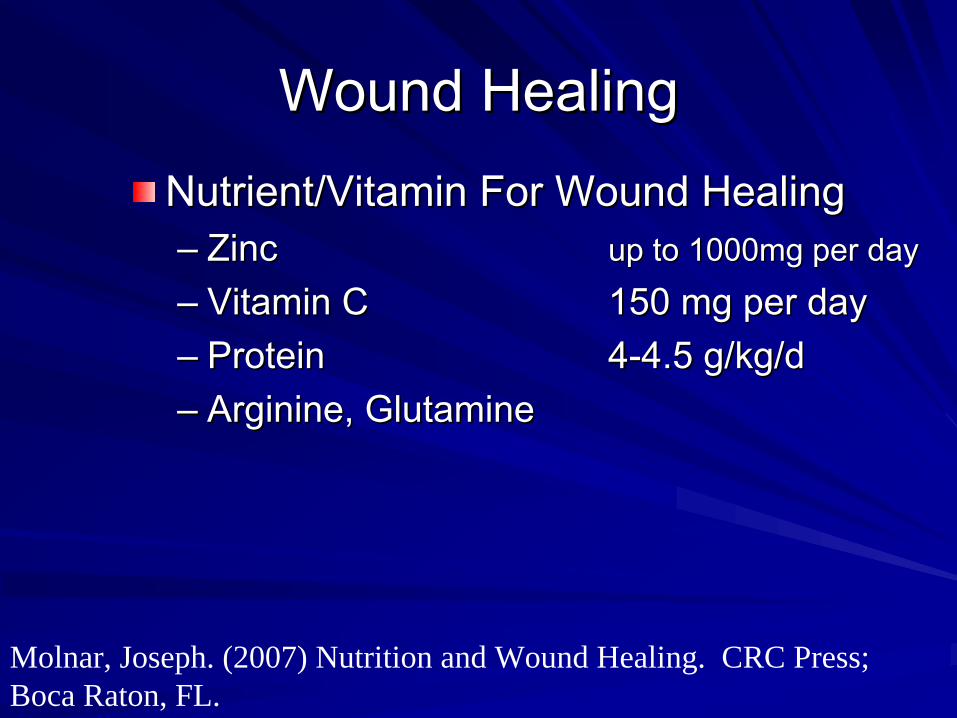
Wound Healing Wound Healing Nutrient/Vitamin For Wound HealingNutrient/Vitamin For Wound Healing––
Zinc Zinc up to 1000mg per day up to 1000mg per day
––
Vitamin CVitamin C
150 mg per day 150 mg per day ––
ProteinProtein
44--4.5 4.5 g/kg/dg/kg/d
––
ArginineArginine, Glutamine , Glutamine
Molnar, Joseph. (2007) Nutrition and Wound Healing. CRC Press; Boca Raton, FL.

TPN Monitoring TPN Monitoring Check with NeonatologistCheck with Neonatologist…….generally:.generally:––
RFP after birth RFP after birth
–– If 50% of TFV is from TPN If 50% of TFV is from TPN
Q Monday & Thursday (unless something Q Monday & Thursday (unless something abnormal) abnormal) ––
RFP RFP ––
TGsTGs
(if abnormal) (if abnormal)
Q 2 weeks Q 2 weeks ––
LFTsLFTs
–– If an infant is on full If an infant is on full EnteralEnteral
Feeds Feeds
Neonatologist will decide Neonatologist will decide ––
RFP (only if following something abnormal) RFP (only if following something abnormal) ––
LFT (only if following LFT (only if following ALkALk
phosphos/direct /direct bilibili))––
Hct/HgbHct/Hgb
weeklyweekly

TFV = PN +EN TFV = PN +EN When to incorporate When to incorporate enteralenteral
feeds in total feeds in total
fluid volume fluid volume Typically EN volume is included in TFV Typically EN volume is included in TFV when feeding advancement is writtenwhen feeding advancement is writtenDiscontinuing TPN Discontinuing TPN ––
If an infant has access issues, determine the If an infant has access issues, determine the cost:benefitcost:benefit
ratio of the line placementratio of the line placement
––
Generally discontinue TPN when EN reaches Generally discontinue TPN when EN reaches 100100--120mL/kg/d 120mL/kg/d

Restarting TPN (Restarting TPN (i.e.NPOi.e.NPO) after ) after Being on ENBeing on EN
What do you do with your TPN when an What do you do with your TPN when an infant is made NPO after being on EN?infant is made NPO after being on EN?––
GenerallyGenerally…….prescribe maximized amounts of .prescribe maximized amounts of macromacro--
& micronutrients& micronutrients
GIR = 8GIR = 8--1010PROPRO= 4= 4Lipid = 3Lipid = 3Na = 3Na = 3K = 2K = 2Ca/PO4 = 2:1Ca/PO4 = 2:1

EnteralEnteral
Nutrition Information Nutrition Information
Promote BM for all infants unless Promote BM for all infants unless contraindicatedcontraindicatedInfants born <1500grams can receive Infants born <1500grams can receive donor milk; must sign consent formdonor milk; must sign consent formInfants start on 20 kcal per ounce of Infants start on 20 kcal per ounce of breastmilkbreastmilk..Generally feeds are started Q3 hours NG Generally feeds are started Q3 hours NG for preemies not able to for preemies not able to popoRefer to feeding protocol for volume and Refer to feeding protocol for volume and advancement advancement

EnteralEnteral
Nutrition Information Nutrition Information Fortify feeds of breast milk once infant is Fortify feeds of breast milk once infant is taking 100taking 100--120ml/kg/d120ml/kg/d––
fortify breast milk with HMF (infortify breast milk with HMF (in--patient) to 22 kcal/oz patient) to 22 kcal/oz --
if tolerated after 24if tolerated after 24--48 hours increase to 24 kcal/oz 48 hours increase to 24 kcal/oz using HMF if using HMF if warrentedwarrented
22 kcal/oz = 1 22 kcal/oz = 1 pktpkt
HMF + 50 HMF + 50 mLmL
of breast milkof breast milk24 kcal/oz = 1 24 kcal/oz = 1 pktpkt
HMF + 25 HMF + 25 mLmL
of breast milk of breast milk
D/c Recipe / All D/c Recipe / All popo
feeds / >34 weeks feeds / >34 weeks ––
22 kcal/oz = 22 kcal/oz =
½½
teaspoon of teaspoon of Enfacare/NeosureEnfacare/Neosure
powder + 90 powder + 90 mLmL
of BM of BM ––
24 kcal/oz = 24 kcal/oz =
1 teaspoon of 1 teaspoon of Enfacare/NeosureEnfacare/Neosure
powder + 90 powder + 90 mLmL
of BM of BM

How MuchHow Much……How LongHow Long……How OftenHow Often
Universal recommendations to be made to mothers by staff Universal recommendations to be made to mothers by staff during during lactogenesislactogenesisPump dependent mothers should be at 500ml by end of Pump dependent mothers should be at 500ml by end of week one. There are 2 weeks of hormonal assistance to week one. There are 2 weeks of hormonal assistance to establish a motherestablish a mother’’s milk supply, so we need to recognize s milk supply, so we need to recognize there is a problem prior to this time. there is a problem prior to this time. ––
Volumes Volumes (HOW MUCH)(HOW MUCH)Day 4 Day 4 350 350 mLmL
Q Day Q Day
Day 7 Day 7 500 500 mLmL
Q Day Q Day ––
Time Time (HOW LONG)(HOW LONG)1010--15 minutes per side 15 minutes per side 2 min past last drop or 102 min past last drop or 10--15 minutes per side on day 3 15 minutes per side on day 3
––
Frequency Frequency (HOW OFTEN)(HOW OFTEN)Every 2Every 2--3 hours 3 hours

Formula Choices Formula Choices
Infants <2000 g birth weightInfants <2000 g birth weight Enfamil Premature 24 Enfamil Premature 24 Special Care 24, 30Special Care 24, 30
Infants >2000g and <36 weeksInfants >2000g and <36 weeks EnfacareEnfacare 22 or 22 or NeosureNeosure 2222
Term infants >36 weeksTerm infants >36 weeks Enfamil or Enfamil or SimilacSimilac

MVI and Vitamin D MVI and Vitamin D AAP Recommendation AAP Recommendation ––
Breast fed infantBreast fed infant
400IU Q day 400IU Q day
––
Formula fed infant taking <1L formula Q day Formula fed infant taking <1L formula Q day 400IU Q day 400IU Q day
Start MVI with iron once infant achieves full feedsStart MVI with iron once infant achieves full feeds<2kg <2kg 0.5 0.5 mLmL
Q day Q day
>2 kg>2 kg
1 1 mLmL
Q day Q day
Wagner,C., Greer, F., et.al. (2008) Prevention of Rickets and Vitamin D Deficiency in Infants, Children, and Adolescents. Pediatrics, 122 (5), 1141-1152.