Embed Size (px)
Citation preview
Neighbourhoods and housing submarkets in the city of Barcelona
Dionysia Lambiri
The University of Reading
19th Advanced Summer School in Regional Science
University of Groningen, 4-12 July 2006
Motivation and aims of the study
Barcelona: a well-documented city Barcelona: a heterogeneous city
Aims: Examination of change in the urban neighbourhoods
of the municipality of Barcelona Identification of housing submarkets Link the identified submarkets with submarkets in
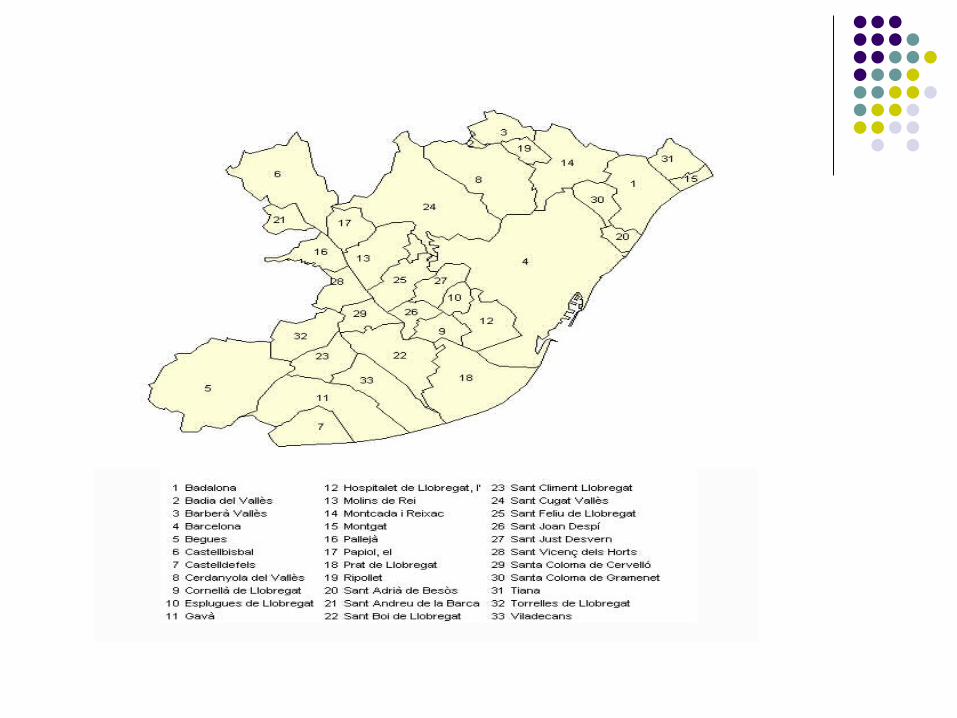
neighbouring municipalities
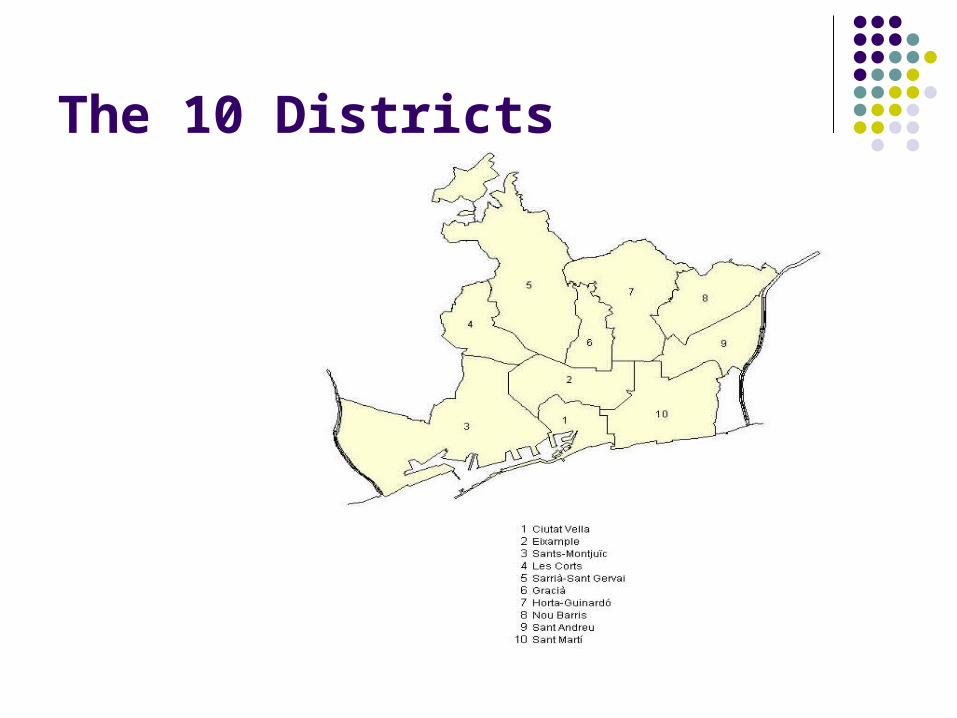
The 10 Districts
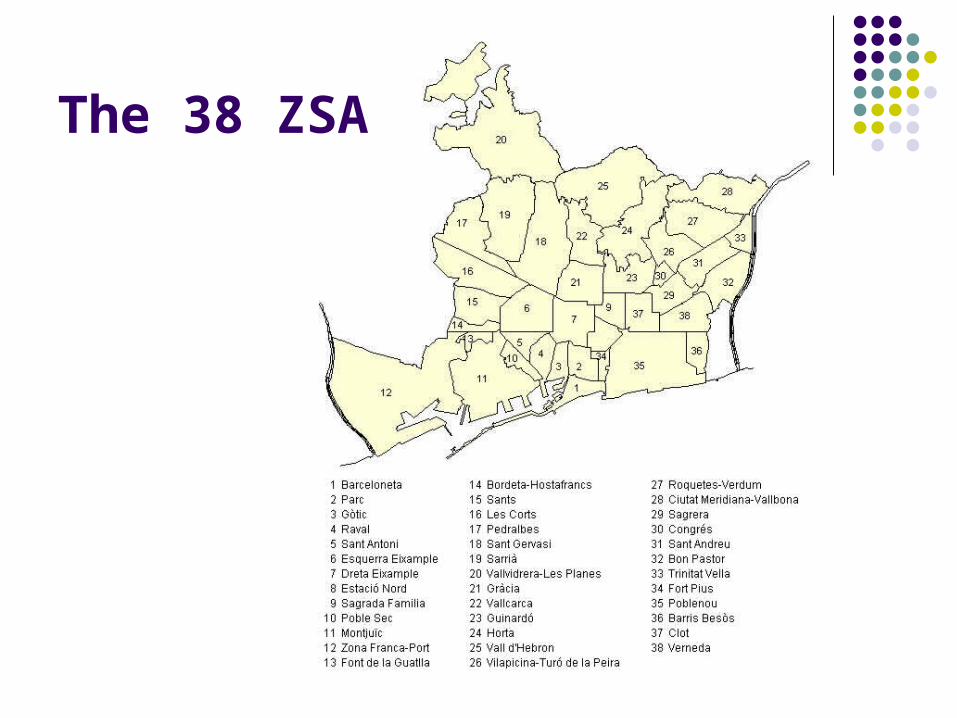
The 38 ZSA
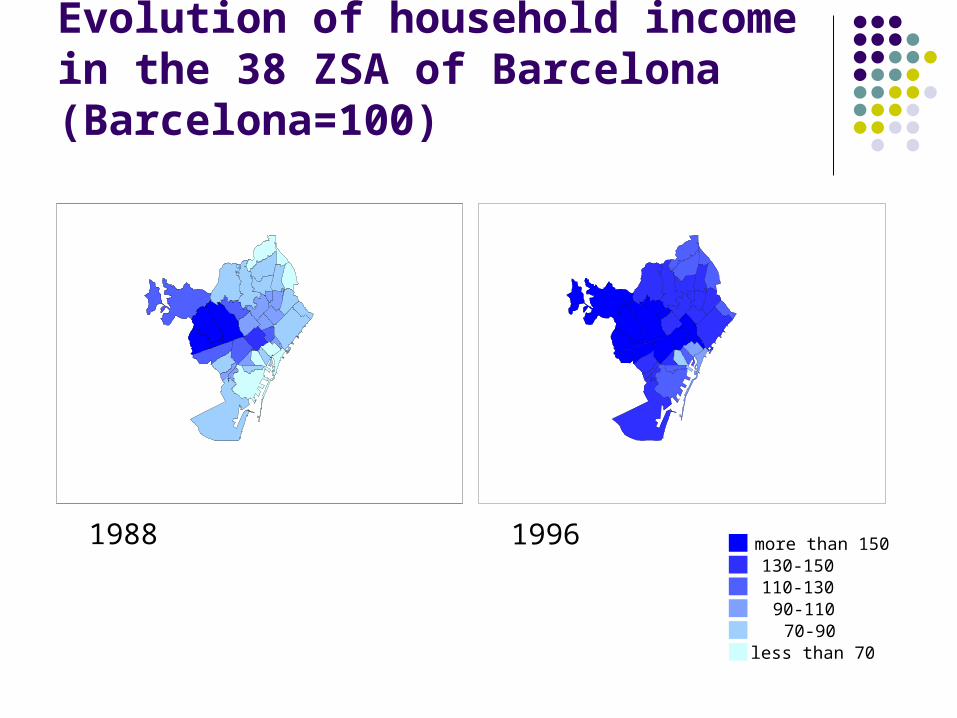
Evolution of household income in the 38 ZSA of Barcelona (Barcelona=100)
1988 1996 more than 150130-150110-130
90-11070-90
less than 70
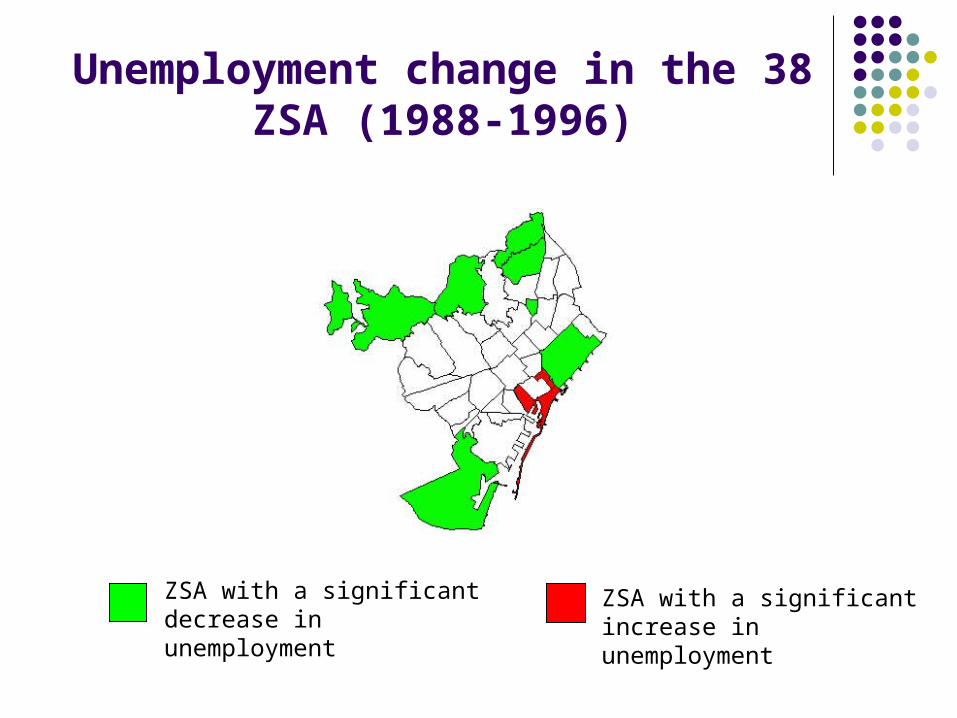
Unemployment change in the 38 ZSA (1988-1996)
ZSA with a significant decrease in unemployment
ZSA with a significant increase in unemployment
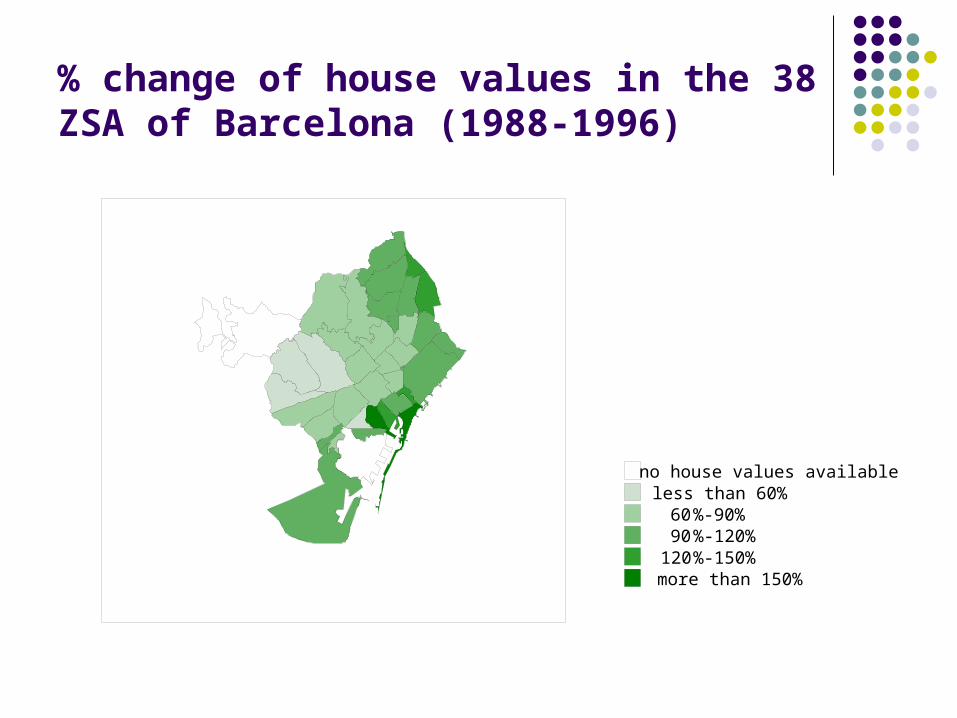
% change of house values in the 38 ZSA of Barcelona (1988-1996)
no house values availableless than 60%60%-90%90%-120%
120%-150%more than 150%
0 0.2 0.4 0.6 0.8 1 1.2 1.4
CIUTATVELLA
EIXAMP LE
SANTS-MONTJ UiC
LES CORTS-P EDRALBES
SARRIA-SANT GERVASI
GRACIA
HORTA-GUINARDO
NOU BARRIS
SANT ANDREU
SANT MARTI
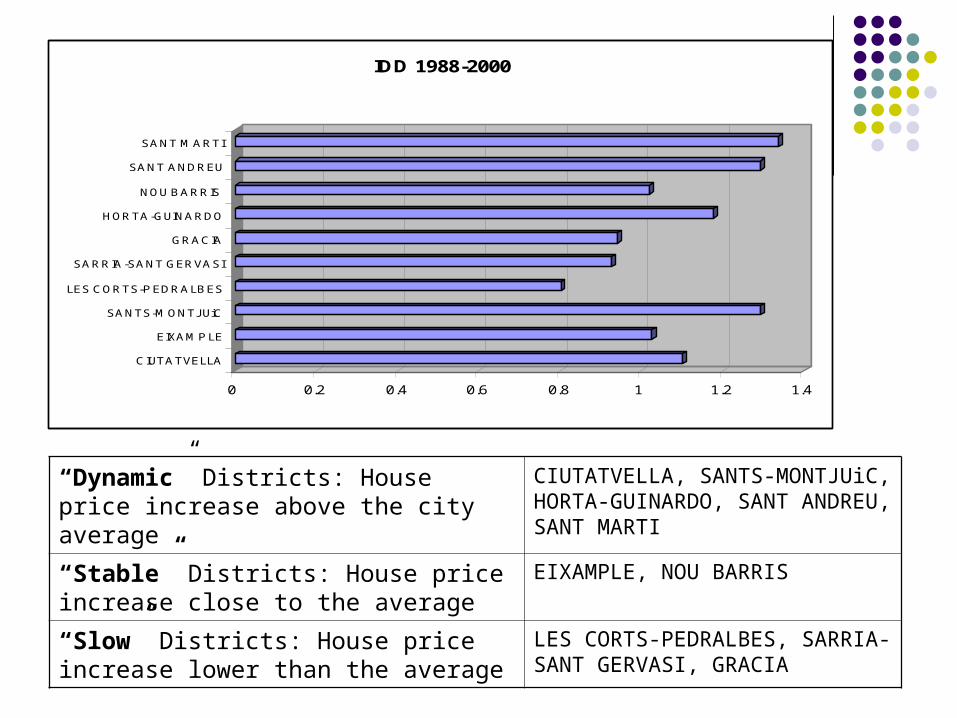
IDD 1988-2000
“Dynamic” Districts: House price increase above the city average
CIUTATVELLA, SANTS-MONTJUiC, HORTA-GUINARDO, SANT ANDREU, SANT MARTI
“Stable” Districts: House price increase close to the average
EIXAMPLE, NOU BARRIS
“Slow” Districts: House price increase lower than the average
LES CORTS-PEDRALBES, SARRIA-SANT GERVASI, GRACIA
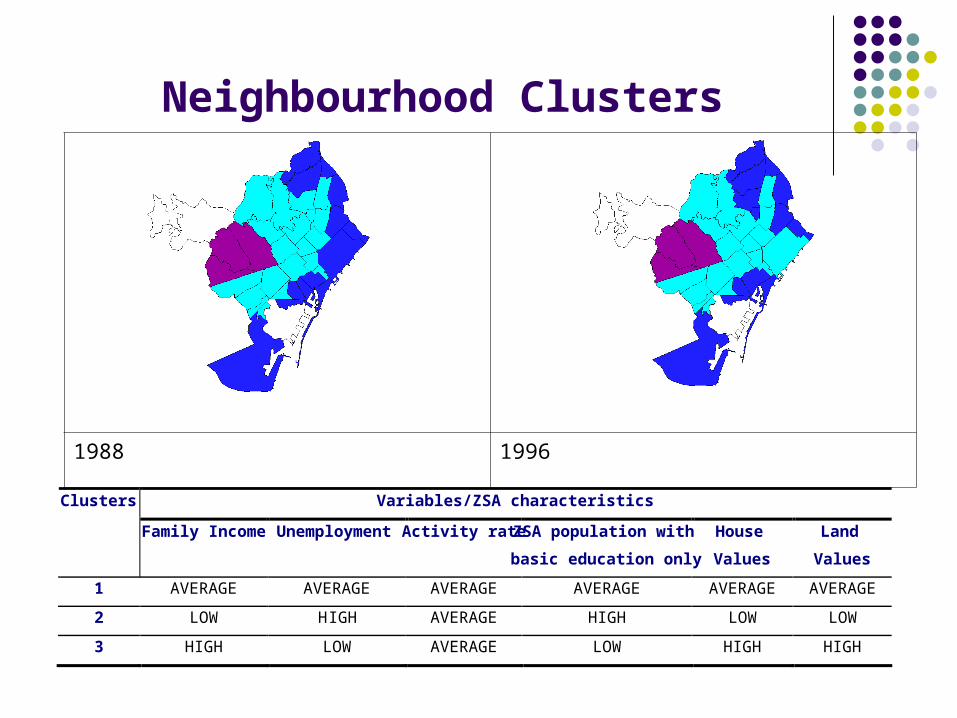
Neighbourhood Clusters
Variables/ZSA characteristics Clusters
Family Income Unemployment Activity rate ZSA population with
basic education only
House
Values
Land
Values
1 AVERAGE AVERAGE AVERAGE AVERAGE AVERAGE AVERAGE
2 LOW HIGH AVERAGE HIGH LOW LOW
3 HIGH LOW AVERAGE LOW HIGH HIGH
1988 1996
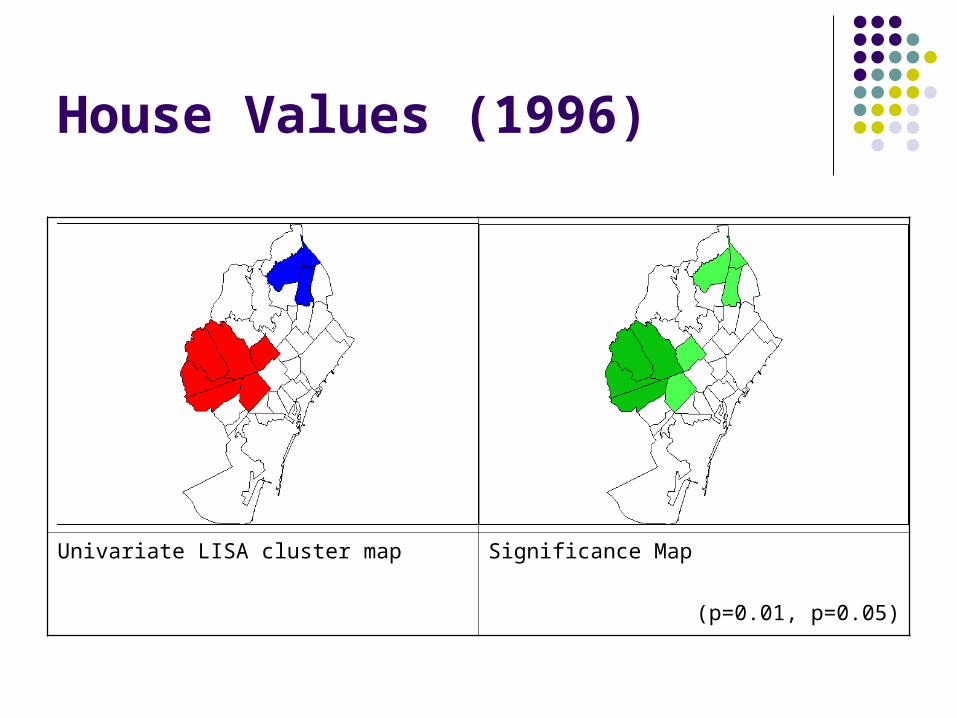
House Values (1996)
Univariate LISA cluster map Significance Map
(p=0.01, p=0.05)
Questions
Spatial weights to use in very small spatial disaggregation levels like ZSA
Linking clusters of neighbourhoods with neighbouring municipalities. Problems of scale?
Possible extensions to hedonic estimation of house prices including spatial effects