Embed Size (px)
Citation preview

Neighborhood matters: How characteristics of the
residential environment relate to physical activity, sedentary
behavior, and body mass index among African American
adults
Larkin L. Strong, PhD
Lorraine R. Reitzel, PhDUniversity of Texas MD Anderson Cancer Center
Department of Health Disparities Research

• Brief overview and study sample
• A tale of two studies
– Study 1: Associations of perceived neighborhood physical and social environments with physical activity and television viewing in African American men and women
– Study 2: Density and proximity of fast food restaurants and body mass index among African Americans
Agenda

• Growing interest in how neighborhood factors influence health and health behaviors over and above individual-level factors
• Very little research has focused on African American populations in this regard
• African Americans at particular risk of health disparities
• More understanding is needed to inform policy and interventions to affect these disparities
Brief Overview

• Project CHURCH– Creating a Higher Understanding of cancer Research and
Community Health– Designed to assess behavioral, social, and environmental
cancer risk factors in 1,501 African American adults– Cross-sectional analysis of self-reported baseline data
collected in 2008-2009
• Setting– Large mega-church in Houston, TX
• Sampling Protocols– Participants recruited through church media channels– Inclusion: >age 18; residence in Houston area; functional
telephone number; must attend church
Study Sample

Strong LL, Reitzel LR, Wetter DW, McNeill LH
American Journal of Health Promotion. 2013;27(6):401-9.
Study 1

• Most adults in the US– Are not physically
active– Spend over 50% of
their waking time in sedentary behaviors
• Some racial/ethnic groups are disproportionately affected
Introduction
0102030405060
%
Series10
2
4
6
8
White BlackHispanic Asian/other
Hrs/day
CDC BRFSS, 2011
The Nielsen Company, 2011
Moderate-to-Vigorous Physical Activity (PA)
TV Viewing

• Strong evidence that characteristics of the built environment are associated with PA
• What about sedentary behavior?
• What about the role of the neighborhood social environment?
The Role of the Environment

• To investigate the associations of perceived aspects of neighborhood social and physical environments with PA and TV viewing in a large, church-based sample of African American men and women
Study Purpose

• Measures– Outcomes
• Meeting PA guidelines (International Physical Activity Questionnaire; yes/no)
• Average TV viewing time per day (log-transformed)
– Neighborhood Perceptions• Social Cohesion and Trust (Sampson et al., 1997)• Neighborhood Problems (Steptoe & Feldman, 2001)
• Analysis– Multivariate generalized estimating equations
• Stratified by gender• Controlled for sociodemographics
Methodology (cont’d)

N= 1,374– Age = 45.5 (12.6)– 76% female– 50% <Bachelor’s degree– 45% married/living with partner– 25% unemployed– 25% <$40,000 annual income– BMI = 31.7 (7.2)
• 29.8% overweight, 53.9% obese
Results: Participant Characteristics

Results: Neighborhood Problems
Percent reporting neighborhood conditions as a problema
Men (n=349)
%
Women (n=1,025)
%
Litter in the streets 30 33
Smells and fumes 14 16
Walking around after dark** 27 40
Problems with dogs** 24 34
Noise from traffic or other homes* 22 29
Lack of entertainment 22 24
Traffic and road safety problems 21 22
Lack of places to shop 22 25
Vandalism* 33 39
Disturbances by neighbors/youngsters 29 26
aConditions dichotomized to represent “some problem/serious problem” and “not a problem”
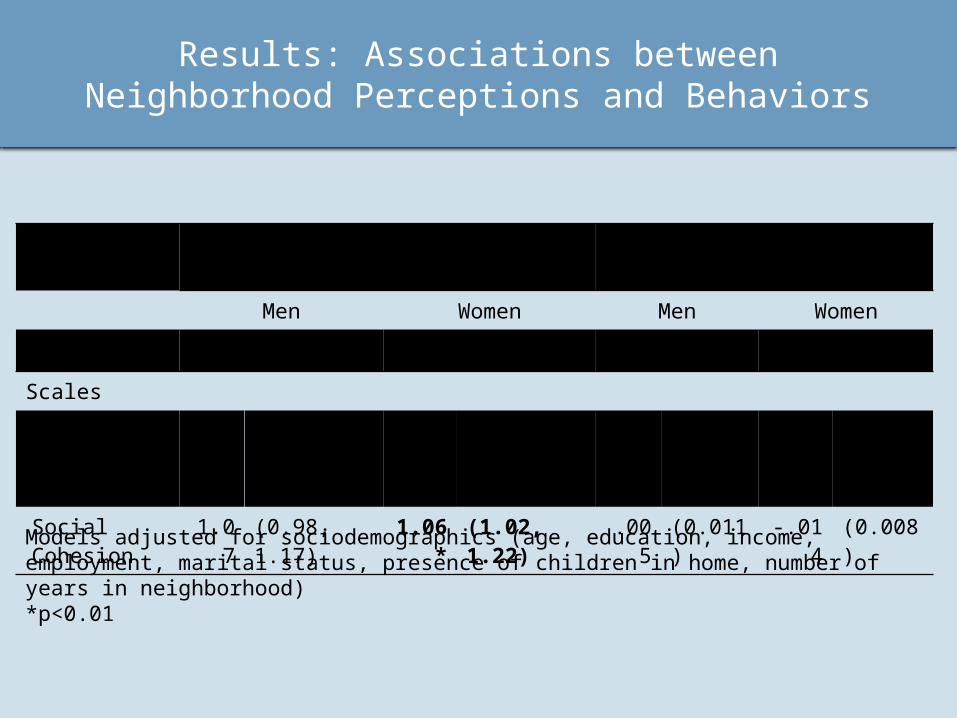
Results: Associations between Neighborhood Perceptions and Behaviors
Physical Activity Log-transformed TV Viewing
Men Women Men Women
OR (95% CI) OR (95% CI) β (SE) β (SE)
Scales
Neighborhood Problems 0.92 (0.84, 1.00) 0.99 (0.95, 1.03) .002 (0.010) .017* (0.006)
Social Cohesion 1.07 (0.98, 1.17) 1.06* (1.02, 1.22) .005 (0.011) -.014 (0.008)
Models adjusted for sociodemographics (age, education, income, employment, marital status, presence of children in home, number of years in neighborhood)*p<0.01

Predicted Mean Daily TV Viewing
10 20 300
0.51
1.52
2.53
3.54
4.55
Women Men
Neighborhood Problems
Hrs
/day
Predicted Probabilities of Meeting PA Guidelines
5 10 15 20 250
0.10.20.30.40.50.60.70.80.9
1
Women Men
Social Cohesion
Predicted Outcomes
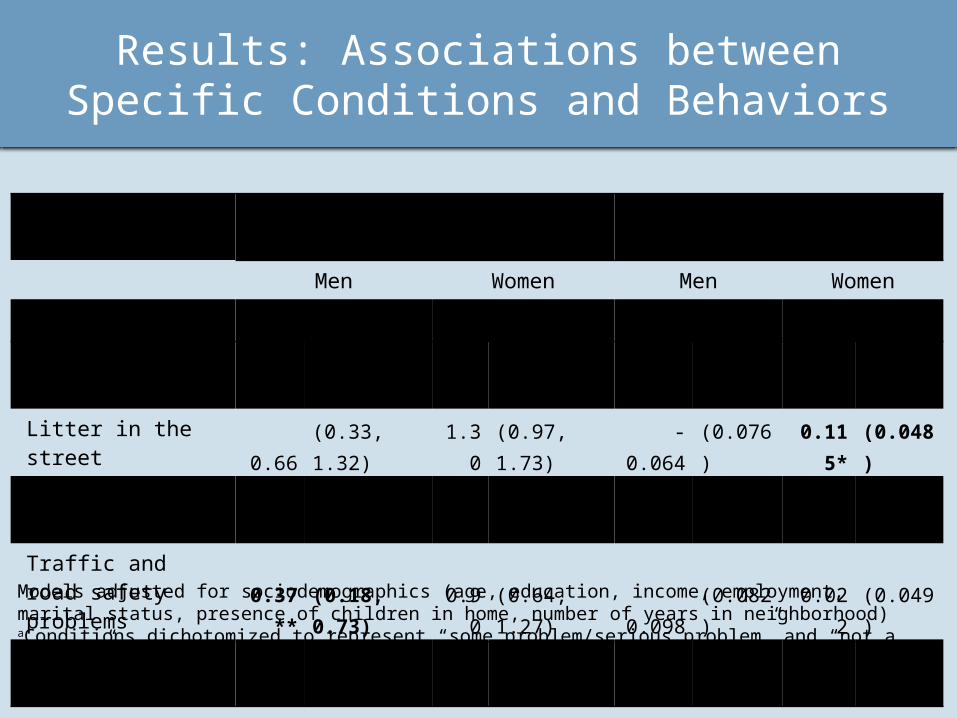
Results: Associations between Specific Conditions and Behaviors
Physical Activity Log-transformed TV Viewing
Men Women Men Women
OR (95% CI) OR (95% CI) β (SE) β (SE)
Individual Conditionsa
Litter in the street 0.66 (0.33, 1.32) 1.30 (0.97, 1.73) -0.064 (0.076) 0.115* (0.048)
Walking around after dark 0.48* (0.24, 0.98) 0.81 (0.64, 1.03) -0.014 (0.075) 0.110* (0.043)
Traffic and road safety problems 0.37** (0.18, 0.73) 0.90 (0.64, 1.27) 0.098 (0.082) 0.022 (0.049)
Lack of places to shop 0.49 (0.24, 1.02) 0.78 (0.57, 1.09) -0.002 (0.074) 0.103* (0.043)
Models adjusted for sociodemographics (age, education, income, employment, marital status, presence of children in home, number of years in neighborhood)aConditions dichotomized to represent “some problem/serious problem” and “not a problem”*p<0.05**p<0.01

• Cross-sectional data• Self-report
– Recall, social desirability bias, e.g. IPAQ
• Neighborhood data are subjective, may not represent actual conditions
• Convenience sample of church-based African American adults– May not be generalizable
Limitations
• Among the first studies to suggest that social and physical aspects of neighborhood environments may affect sedentary in addition to active behaviors
• Social cohesion was positively associated with PA, although only significant in women
• Perceiving greater disorder within neighborhood was associated with increased TV viewing in women
• Identified specific neighborhood conditions associated with PA in men and TV viewing in women
Conclusions

• Important to consider neighborhood social characteristics and the design and conditions of physical environment for intervention/policy efforts
• Intervention strategy – facilitate positive interactions among residents while also promoting healthy behaviors
• Additional research is needed to understand the mechanisms through which neighborhood attributes affect behavior
Implications
Reitzel LR, Regan SD, Nguyen N, Cromley EK, Strong LL, Wetter DW, McNeill LH
American Journal of Public Health. Published online ahead of print May 16, 2013: e1-e7. doi:10.2105/AJPH.2012.301140
Study 2

• Racial/ethnic disparities in obesity prevalence – 38.8% African American vs 36.2% White men– 58.5% African American vs 32.2% White women
• BMI gap is widening too• African American neighborhoods have higher
density of FFRs than White neighborhoods• Studies suggest FFR availability and FF
consumption stronger among non-Whites than Whites
• African Americans may be more likely to consume FF if available, and it is more likely to be available
Background
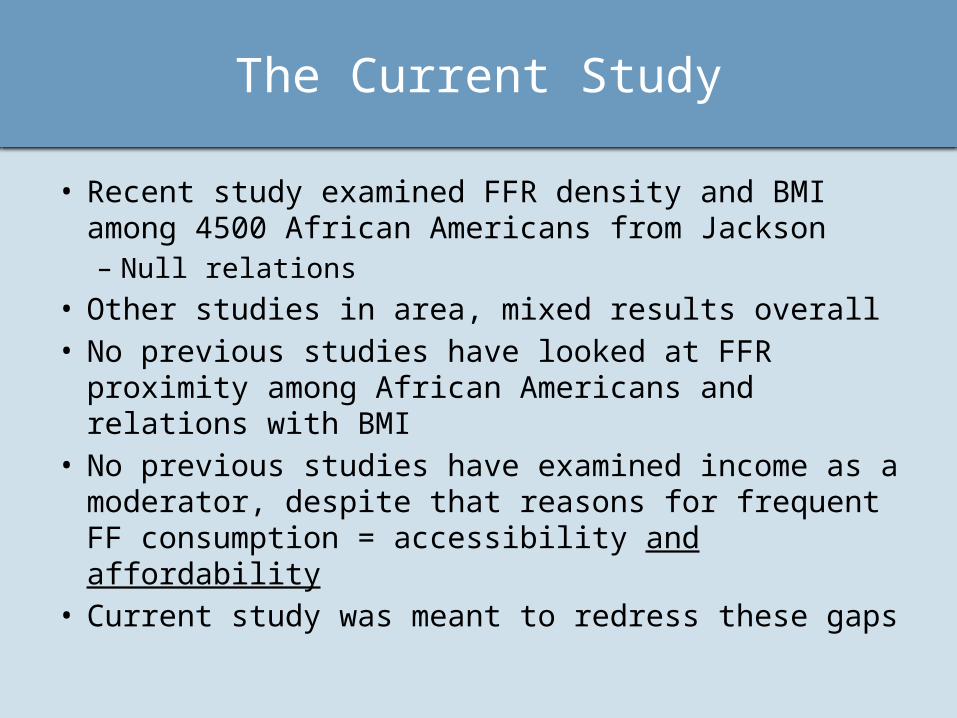
• Recent study examined FFR density and BMI among 4500 African Americans from Jackson– Null relations
• Other studies in area, mixed results overall• No previous studies have looked at FFR proximity
among African Americans and relations with BMI• No previous studies have examined income as a
moderator, despite that reasons for frequent FF consumption = accessibility and affordability
• Current study was meant to redress these gaps
The Current Study

• Obtained FFR addresses from InfoUSA• FFRs = limited service restaurants, hamburger/
hotdog establishments• Geocoded residential addresses of study sample
and FFR addresses• Calculated FFR density at 0.5, 1, 2, and 5 miles
around participant’s homes• Calculated proximity to closest FFR from the
home• BMI – calculated from height/weight measured
twice by stadiometer/scale
Methodology

Fast Food Restaurants
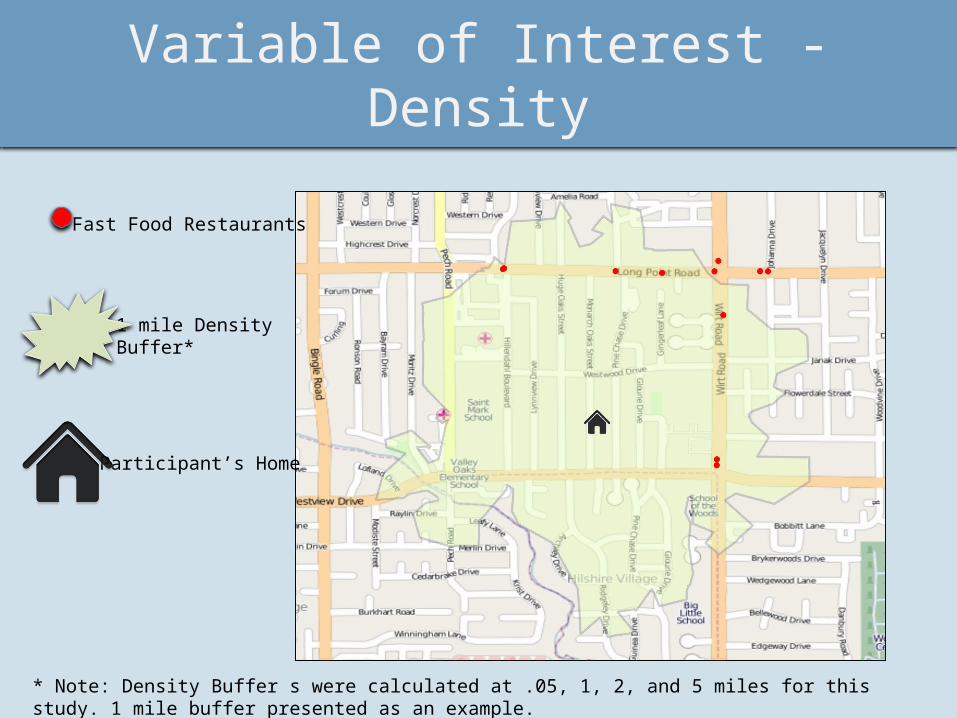
Variable of Interest - Density
Fast Food Restaurants
Participant’s Home
1 mile Density Buffer*
* Note: Density Buffer s were calculated at .05, 1, 2, and 5 miles for this study. 1 mile buffer presented as an example.

Variable of Interest - Proximity
Fast Food Restaurants
Proximity to Closest Fast Food Restaurant
Participant’s Home
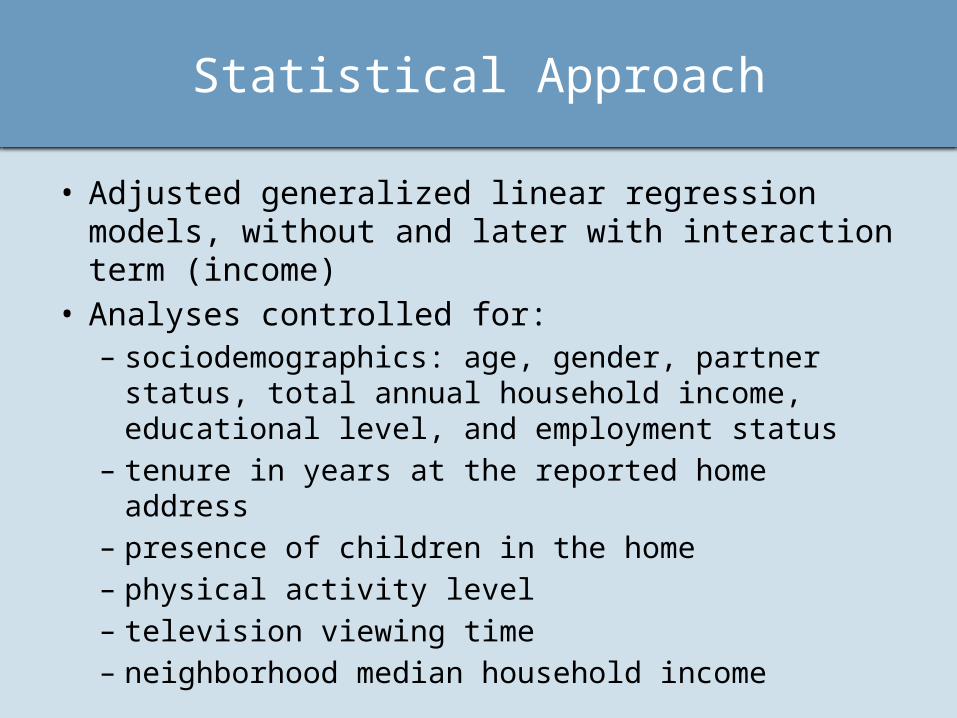
• Adjusted generalized linear regression models, without and later with interaction term (income)
• Analyses controlled for:– sociodemographics: age, gender, partner status,
total annual household income, educational level, and employment status
– tenure in years at the reported home address– presence of children in the home– physical activity level– television viewing time– neighborhood median household income
Statistical Approach

• Mean # of FFRs– 2.5 (1.9) in .5 mile buffer; 4.5 (4.2) in 1 mile
buffer; 11.4 (9.8) in 2 mile buffer; 71.3 (50.4) in 5 mile buffer
• Main effects were non-significant • Significant interaction terms at 0.5, 1, & 2 miles• Stratified analyses: density = BMI for
participants earning <$40,000/year – 0.5 mile buffer (b = 1.15; p= .009)– 1 mile buffer (b = 1.23; p= .008)– 2 mile buffer (b = 1.69; p= .025)
Results: FFR Density & BMI
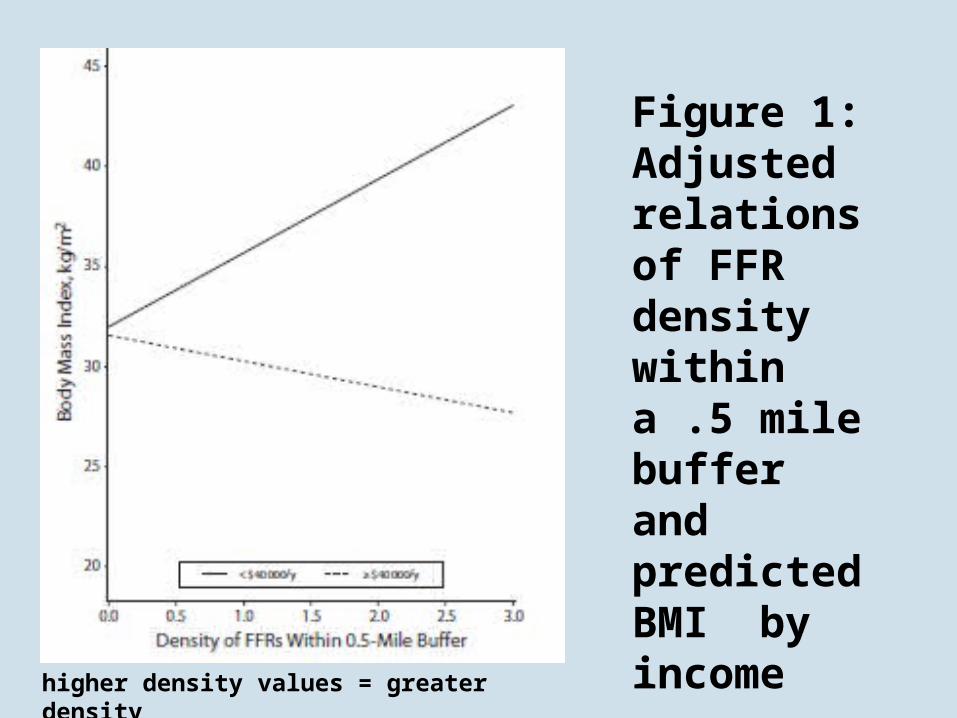
Figure 1: Adjusted relations of FFR density within a .5 mile buffer and predicted BMI by income
higher density values = greater density
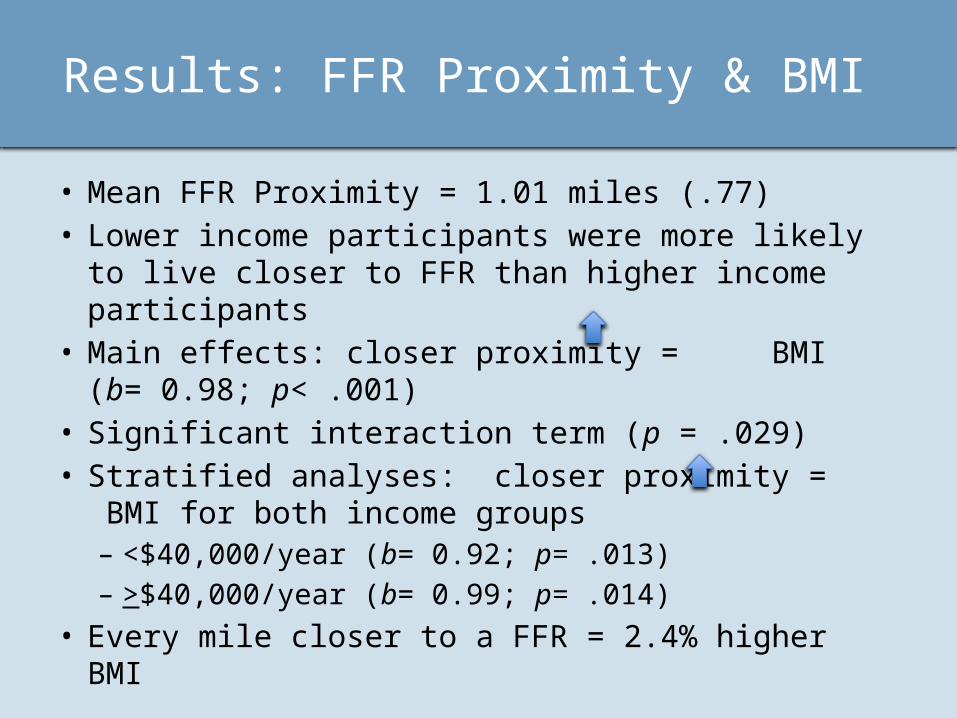
• Mean FFR Proximity = 1.01 miles (.77)• Lower income participants were more likely to
live closer to FFR than higher income participants
• Main effects: closer proximity = BMI (b= 0.98; p< .001)
• Significant interaction term (p = .029)• Stratified analyses: closer proximity = BMI for
both income groups– <$40,000/year (b= 0.92; p= .013)– >$40,000/year (b= 0.99; p= .014)
• Every mile closer to a FFR = 2.4% higher BMI
Results: FFR Proximity & BMI

Figure 1: Adjusted relations of FFR proximity and predicted BMI by income
higher proximity values = greater distance

Implications
• Why links between FFR density and BMI among lower income participants?– More affordable? More convenient? More
exposure (cueing)? Places for socialization? Transportation issues?
• Why links between FFR proximity and BMI?– Only need 1 to purchase FF? Ease and
convenience? Cueing? Transportation?
• Utility of zoning laws or conditional use permits to regulate locations and numbers of FFRs around residential areas

• Cross-sectional• Need to assess consumption frequency and
consumption choices• Need to understand entire food landscape• No information on disposable income• No information in FFR locations around other
locations of importance (e.g., work)• Sample was mostly female, well-educated,
church-going, metropolitan/urban
Limitations

– The University Cancer Foundation– The Duncan Family Institute – The Ms. Regina J. Rogers Gift: Health Disparities
Research Program– The Cullen Trust for Health Care Endowed Chair
Funds for Health Disparities Research– The Morgan Foundation Funds for Health
Disparities Research and Educational Programs– The National Cancer Institute through The
University of Texas MD Anderson's Cancer Center Support Grant (grant number CA016672)
Research Support