Embed Size (px)
Citation preview

1
NEI 12‐16, “Guidance for Performing Criticality Analyses of Fuel Storage at Light‐
Water Reactor Power Plants”
NRC/NEI Meeting on SFP Criticality GuidanceFebruary 19th 2014 • Rockville, MD

2
Introduction and Meeting Objectives
Kristopher CummingsSenior Project Manager, Used FuelNRC/NEI Meeting on SFP Criticality Guidance
February 19th, 2014 • Rockville, MD
3
AgendaTime Subject Presenter
8:30 am Welcome, Introductions and Meeting Purpose Kris Cummings, NEI
8:45 am Overview of EPRI Depletion Benchmarks Albert Machiels, EPRI
9:00 am Use of Measured Flux Map Data to Determine Depletion Uncertainty
Kord Smith, MIT
10:15 am Break
10:30 am Application of EPRI Depletion Method Dale Lancaster, NuclearConsultants.com
11:00 am Isotopic Benchmarking Bob Hall, Dominion
12:00 am Lunch
1:00 pm BWR Cold Critical Experiments Kristen Bennett, GEH
2:00 pm Burnup Uncertainty Andrew Blanco, Westinghouse
4
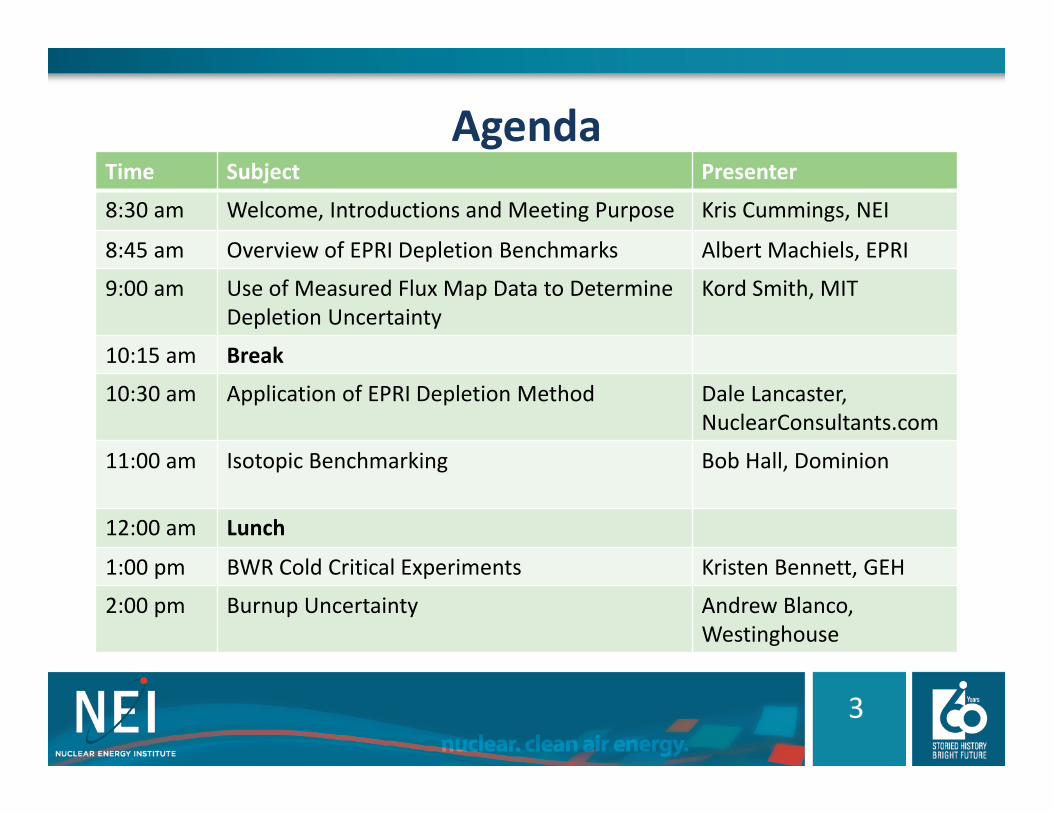
Agenda (cont.)Time Subject Presenter
2:30 pm Content of Technical Specification Kris Cummings, NEI
3:00 pm Break
3:15 pm Multiple Misloads Kris Cummings, NEI
4:15 pm Eccentric Positioning Uncertainty Kris Cummings, NEI
4:45 pm Summary of Actions Captured/Overview of Next step
Kris Cummings, NEI

5
Meeting Purpose
• Reach resolution on methods to be used in spent fuel pool criticality analysis.
• Focus on issues around depletion code benchmarking, Tech Spec content, uncertainties and multiple misloads.
• Identify areas needing additional description, justification or explanation in NEI 12‐16.

Albert J. MachielsSenior Technical Executive
NRC/NEI Meeting on SFP Criticality GuidanceFebruary 19, 2014
Rockville, MD
PWR Fuel Reactivity Depletion Benchmarks Using Flux Map Data
A Roadmap to Available Documents

2© 2014 Electric Power Research Institute, Inc. All rights reserved.
Contents
• Contributors
• Motivation
• Main Documents
• Interactions with OECD/NEA
• MIT’s BEAVRS
• Concluding Remarks

3© 2014 Electric Power Research Institute, Inc. All rights reserved.
Contributors
• Prof. Kord Smith, MIT (Presenter)– Prof. Benoit Forget– Geoffrey Gunow– Bryan Herman– Nick Horelik
• Dr. Dale Lancaster, NuclearConsultants.com (Presenter)• Studsvik Scandpower Team
– Mehdi Asgari– Tamer Bahadir– Rodolofo Ferrer
• Made possible by Duke Energy (44 cycles of operational data from four reactors)

4© 2014 Electric Power Research Institute, Inc. All rights reserved.
Problem StatementExisting criticality benchmarks have been portrayed as
insufficient by regulators in light of operational/licensing changes being sought by utilities
Depletion uncertainty approaches that could increase licensee flexibility in addressing spent fuel criticality
concerns
Desired Outcome

5© 2014 Electric Power Research Institute, Inc. All rights reserved.
Depletion Uncertainty Quantification
Quantification through critical benchmarks and chemical
assays
Leverage operational data
to generate benchmarks
EPRI approach ORNL approach

6© 2014 Electric Power Research Institute, Inc. All rights reserved.
Fuel Reactivity Depletion Benchmarks1. “Benchmarks for Quantifying Fuel Reactivity Depletion
Uncertainty,” EPRI Report 1022909 (August 2011)http://www.epri.com/abstracts/Pages/ProductAbstract.aspx?ProductId=000000000001022909
ICNC 2011 “Experimental Benchmarks For Quantifying Fuel Reactivity Depletion Uncertainty” by K. Smith et al. (Edinburgh, Scotland, Sept. 19 – 22, 2011)
K. Smith et al., “Depletion Reactivity Benchmarks – Part 1: Experimental Benchmarks For Quantifying PWR Fuel Reactivity Depletion Uncertainty,” Nuclear Technology, Vol. 185, pp. 39-56 (January 2014)
2. “Utilization of the EPRI Depletion Benchmarks for Burnup Credit Validation,” EPRI Report 1025203 (April 2012)http://www.epri.com/abstracts/Pages/ProductAbstract.aspx?ProductId=000000000001025203ICNC 2011 “Utilization Of The EPRI Fuel Reactivity Depletion Benchmarks In PWR Spent Fuel Pool Criticality Analysis” by D. Lancaster et al. (Edinburgh, Scotland, Sept. 19 – 22, 2011)
D. Lancaster et al., “Depletion Reactivity Benchmarks – Part 2: Utilization In PWR Spent Fuel Pool Criticality Analysis,” Nuclear Technology, Vol. 185, pp. 57-70 (January 2014)

7© 2014 Electric Power Research Institute, Inc. All rights reserved.
International Handbook of Evaluated Reactor Physics Benchmark Experiments (IRPhEP)• June 2012 – January 2013: OECD/NEA Review
– Focus should be on Hot Full Power (HFP) conditions• Cold, Cooled Reactivity Depletion Benchmarks (Appendix B).
– Use of CASMO-SIMULATE as a reactivity meter• Would other tools give the same results?
– Derivation of uncertainties• Completeness?• Provide data set?
– OECD/NEA Report formatting• Improvements required.
• Published as a “draft” in the “International Handbook of Evaluated Reactor Physics Benchmark Experiments,” NEA Nuclear Science Committee, NEA/NSC/DOC (2006)1, May 2013 Edition. (ISBN 978-92-64-99208-5). Entry: DUKE-PWR-POWER-001

8© 2014 Electric Power Research Institute, Inc. All rights reserved.
MIT’s BEAVRS Project Opportunity: U. S. Utility made
available two cycles of detailed, measured PWR operational data
N. Horelik, B. Herman, B. Forget, and K. Smith. “Benchmark for Evaluation and Validation of Reactor Simulations (BEAVRS), v1.0.1,” Proc. Int. Conf. Mathematics and Computational Methods Applied to Nuc. Sci. & Eng., Sun Valley, Idaho, (May 2013)
Benchmark for Evaluation and Validation of Reactor Simulations,Rev. 1.1.1, MIT Computational Reactor Physics Group (October 31, 2013). Available at the MIT website: http://crpg.mit.edu/pub/beavrs
9© 2014 Electric Power Research Institute, Inc. All rights reserved.
MIT and OECD/NEA Projects Using BEAVRS
• Completed– “PWR Fuel reactivity Depletion Verification and Uncertainty
Using Flux Map Data,” EPRI Report 3002001948 (January 17, 2014)http://www.epri.com/abstracts/Pages/ProductAbstract.aspx?ProductId=000000003002001948
• Ongoing– MIT
• Focus on perturbation protocol and treatment for quantifying uncertainties
• Planned– Joint MIT/OECD-NEA project
• MIT: CASMO/ENDF/SIMULATE• OECD/NEA: LWRWIMS/JEFF/PANTHER

10© 2014 Electric Power Research Institute, Inc. All rights reserved.
Other Publications
• Submitted to PHYSOR 2014– “SOLUTION OF THE BEAVRS BENCHMARK USING THE nTRACER
DIRECT WHOLE CORE TRANSPORT CODE,” by Min Ryu (Seoul National University) et al. “This new PWR benchmark addresses the shortcomings of the previous light water reactor (LWR) benchmarks by providing highly-detailed as-is design data and also measurement data for two cycles. Since most institutions cannot have access to this kind of utility proprietary information, this benchmark is very much valuable.”
• “ANALYSIS OF SELECT BEAVRS PWR BENCHMARK CYCLE 1 RESULTS USING MC21 AND OPENMC” by D. J. Kelly (Knolls Atomic Power Laboratory) et al.
–Presented and published at NCSD 2013• “EPRI DEPLETION BENCHMARK CALCULATIONS USING
PARAGON” by V.N. Kucukboyaci (Westinghouse)

11© 2014 Electric Power Research Institute, Inc. All rights reserved.
Concluding Remarks
• Experimental benchmarks of burnup reactivity decrement, which are independent of analysis codes, have been created– Benchmarks can be used to determine bias and
uncertainty of applicant’s specific analysis tools• Ongoing work ongoing at MIT provides opportunities for
other analysts to independently verify the approach retained for creating the depletion reactivity benchmarks– Planned collaboration with OECD/NEA
• The team is looking forward to regulatory feedback as part of the review of NEI’s Guidance for Performing Criticality Analyses of Fuel Storage at Light-Water Reactor Power Plants

12© 2014 Electric Power Research Institute, Inc. All rights reserved.
Other EPRI-sponsored Contributions Not Cited in the Main Presentation– “Utilization of the EPRI Depletion Benchmarks for Burnup
Credit Validation” by D. Lancaster and A. Machiels, PHYSOR 2012 (Knoxville, TN, April 15 – 20, 2012)
− “Benefits of the Delta k of Depletion Benchmarks,” NEI Used Fuel Management Conference, by D. Lancaster and A. Machiels (St. Petersburg, FL, May 9, 2012)
− “Depletion Reactivity Benchmarks Derived from Measured Pressurized Water Reactor Flux Maps” by A. Machiels, RIC 2013 (Washington DC, March 13, 2013)
− “Use of EPRI Depletion Benchmarks for Transport Criticality Burnup Credit ,” by D. Lancaster and A. Machiels, PATRAM 2013 (San Francisco, CA, August 18 – 23, 2013)
− “Benefits of Using EPRI Depletion Reactivity Benchmarks for Burnup Credit Validation ,” by D. Lancaster and A. Machiels, NCSD 2013 (Wilmington, NC, September 29 – October 3, 2013)

Slide title 36pt
Slide subtitle 18pt
Using Measured Flux Map Data To Determine Fuel Burnup Reactivity Uncertainty
Kord S. Smith (MIT) Albert Machiels (EPRI) Hatice Akkurt (EPRI) Presentation to NRC Feb. 19, 2014

Slide title
36 pt
Text 24 pt
Bullets level 2 20 pt
2
What is the Bottom Line?
• EPRI experimental benchmarks of burnup reactivity decrement have been created which are independent of analysis codes.
• Total uncertainty of cold experimental fuel reactivity decrements are < 650 pcm (< 0.65% delta-k).
• EPRI benchmarks can be used to determine biases and uncertainty of applicant’s specific analysis tools.
Feb. 19, 2014 Using Measured Flux Map Data to Determine Fuel Burnup Reactivity Uncertainty

Slide title
36 pt
Text 24 pt
Bullets level 2 20 pt
3
Outline
• Overview: flux maps and assembly reactivities
• Duke Energy’s PWR models/data/qualification with Studsvik CMS
• EPRI methodology: implementation details
• HFP reactivity decrement biases and uncertainties
• HFP to cold uncertainties with TSUNAMI
• Cold biases and uncertainties
• Reactivity decrement benchmarks
• Summary
Feb. 19, 2014 Using Measured Flux Map Data to Determine Fuel Burnup Reactivity Uncertainty

Slide title
36 pt
Text 24 pt
Bullets level 2 20 pt
4
Flux Maps: In-Core Fission Rate Measurements • Miniature fission chambers are inserted
in the central instrument tubes of selected assemblies.
– BOC calculations required by NRC to be within a prescribed tolerance of measurement - to assure core loading.
– Required every 30 days by NRC to guarantee that the core is operating within design margins
– Measurement used to calibrate certain safety systems (e.g., ex-core detectors)
• High precision (<1% statistical error) measurement of the core-wide distribution of fission rates.
• Historical flux maps are used in NRC submittals to determine 95/95 confidence intervals on predicted core power distributions and assembly burnups.
Feb. 19, 2014 Using Measured Flux Map Data to Determine Fuel Burnup Reactivity Uncertainty
R P N M L K J H G F E D C B A0.499 0.4830.491 0.4830.008 0.000
0.369 0.998 0.9960.389 1.008 0.991-‐0.020 -‐0.006 0.004
1.195 1.081 0.998 0.3701.175 1.069 0.985 0.3820.020 0.012 0.012 -‐0.012
0.610 0.997 1.3150.627 0.994 1.323-‐0.017 0.003 -‐0.008
1.309 1.330 1.309 1.1771.298 1.331 1.304 1.1700.010 -‐0.001 0.005 0.007
0.484 1.082 1.3310.479 1.071 1.3320.004 0.011 -‐0.001
1.191 1.276 1.236 1.2701.179 1.287 1.224 1.2740.011 -‐0.011 0.011 -‐0.004
0.475 1.196 1.232 1.209 1.317 1.195 0.9960.478 1.183 1.224 1.206 1.319 1.178 0.995-‐0.003 0.013 0.008 0.003 -‐0.002 0.017 0.001
0.958 1.278 1.332 0.4970.951 1.272 1.317 0.5010.007 0.006 0.014 -‐0.004
1.2961.298-‐0.002
0.355 1.306 1.233 1.308 0.3540.372 1.323 1.212 1.305 0.370-‐0.018 -‐0.017 0.020 0.004 -‐0.015
1.294 1.192 1.1701.305 1.182 1.173-‐0.011 0.009 -‐0.003
0.876 1.170 1.196 0.3690.876 1.188 1.183 0.3830.000 -‐0.018 0.013 -‐0.0140.369 0.956 1.000 0.6110.395 0.938 0.996 0.642-‐0.026 0.018 0.003 -‐0.032
0.354 0.4750.366 0.476-‐0.012 -‐0.001
S3-‐MEAS
13
14
15Reaction RateSIMULATE-‐3MEASURED
12
1
2
3
4
5
6
7
8
9
10
11
Slide title
36 pt
Text 24 pt
Bullets level 2 20 pt
5
Basis For The EPRI Uncertainty Methodology
1. Critical LWR cores provide a continuous source of measured reactivities for both fresh and depleted fuel assemblies at full-power conditions.
2. Predictions of in-core reaction rate spatial distributions are very sensitive to the accuracy of computed assembly reactivities.
3. Evaluation of the (batch-wise) fuel assembly reactivity that minimizes the average (r.m.s.) difference between computed and measured reaction rates is used to deduce the error in computed assembly reactivities.
4. By examining hundreds or thousands of in-core measurements, the burnup dependence of the error in computed assembly reactivities (and its uncertainty) can be deduced.
Feb. 19, 2014 Using Measured Flux Map Data to Determine Fuel Burnup Reactivity Uncertainty

Slide title
36 pt
Text 24 pt
Bullets level 2 20 pt
6
Simplest of Nodal Core Models: FLARE Model
Feb. 19, 2014 Using Measured Flux Map Data to Determine Fuel Burnup Reactivity Uncertainty
6
1
( ),p
p p qpp qp
q
kS w S w Sλ∞
=
= +∑
2 2 2
6
1
2
(1 )( / 2 ) ( / )
1
/
pq p p
pp pqq
p p p
w g M h g M h
w w
M D=
= − +
= −
= Σ
∑
• Source (e.g. Power, Detector Signal, etc.) are sensitive to reactivity of the assembly.
• PWR Migration areas are almost a constant (e.g., not very uncertain).
• Chao’s diffusive homogeneity/backward diffusion theory use the same principles. • Modern nodal codes are also very sensitive to k-infinity of the fuel assembly.
Slide title
36 pt
Text 24 pt
Bullets level 2 20 pt
7
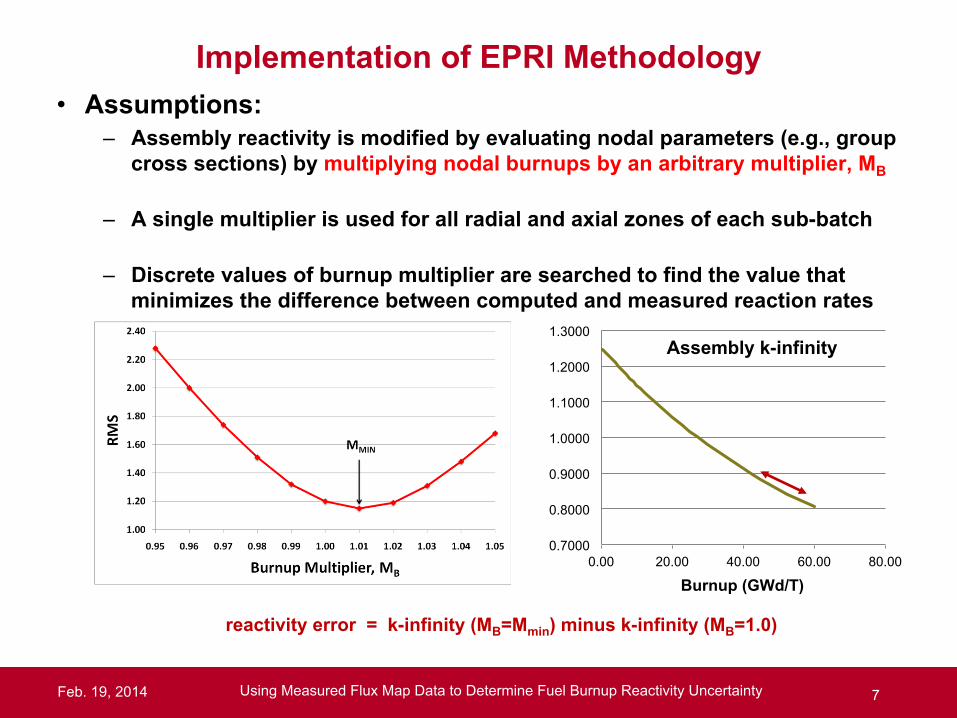
Implementation of EPRI Methodology • Assumptions:
– Assembly reactivity is modified by evaluating nodal parameters (e.g., group cross sections) by multiplying nodal burnups by an arbitrary multiplier, MB
– A single multiplier is used for all radial and axial zones of each sub-batch
– Discrete values of burnup multiplier are searched to find the value that minimizes the difference between computed and measured reaction rates
Feb. 19, 2014 Using Measured Flux Map Data to Determine Fuel Burnup Reactivity Uncertainty
reactivity error = k-infinity (MB=Mmin) minus k-infinity (MB=1.0)
0.7000
0.8000
0.9000
1.0000
1.1000
1.2000
1.3000
0.00 20.00 40.00 60.00 80.00
Assembly k-infinity
Burnup (GWd/T)

Slide title
36 pt
Text 24 pt
Bullets level 2 20 pt
8
Sensitivity of Flux Maps To Sub-Batch Reactivity
Feb. 19, 2014 Using Measured Flux Map Data to Determine Fuel Burnup Reactivity Uncertainty
R P N M L K J H G F E D C B A-‐0.005 -‐0.0230.008 0.0000.020 0.022
-‐0.046 -‐0.045 0.012-‐0.020 -‐0.006 0.0040.006 0.032 -‐0.003
0.032 -‐0.017 -‐0.042 -‐0.0390.020 0.012 0.012 -‐0.0120.007 0.039 0.064 0.013
-‐0.056 -‐0.051 0.061-‐0.017 0.003 -‐0.0080.020 0.055 -‐0.062
0.032 0.069 0.027 -‐0.0420.010 -‐0.001 0.005 0.007-‐0.010 -‐0.066 -‐0.015 0.055
-‐0.013 -‐0.018 0.0380.004 0.011 -‐0.0010.026 0.038 -‐0.040
0.039 0.031 0.064 -‐0.0110.011 -‐0.011 0.011 -‐0.004-‐0.014 -‐0.053 -‐0.039 0.002
-‐0.008 0.025 0.080 0.042 0.057 0.029 0.009-‐0.003 0.013 0.008 0.002 -‐0.002 0.017 0.0010.001 0.001 -‐0.059 -‐0.037 -‐0.056 0.005 -‐0.007
-‐0.009 0.048 0.084 -‐0.0170.007 0.006 0.014 -‐0.0040.022 -‐0.036 -‐0.051 0.009
-‐0.005-‐0.0020.001
-‐0.039 0.005 0.092 0.026 -‐0.036-‐0.018 -‐0.017 0.020 0.004 -‐0.0150.003 -‐0.037 -‐0.047 -‐0.016 0.005
-‐0.015 0.037 -‐0.048-‐0.012 0.009 -‐0.003-‐0.009 -‐0.016 0.040
-‐0.057 -‐0.068 0.025 -‐0.0410.000 -‐0.018 0.013 -‐0.0140.054 0.029 0.001 0.011-‐0.052 0.002 -‐0.036 -‐0.070-‐0.026 0.018 0.003 -‐0.0310.000 0.033 0.041 0.006
-‐0.033 -‐0.005
-‐0.012 -‐0.001 MB=0.9 4.2%0.008 0.003 MB=1.0 1.2%
MB=1.1 3.3%
6
1
2
3
4
5
13
14
r.m.s. diff15
7
8
9
10
11
12

Slide title
36 pt
Text 24 pt
Bullets level 2 20 pt
9
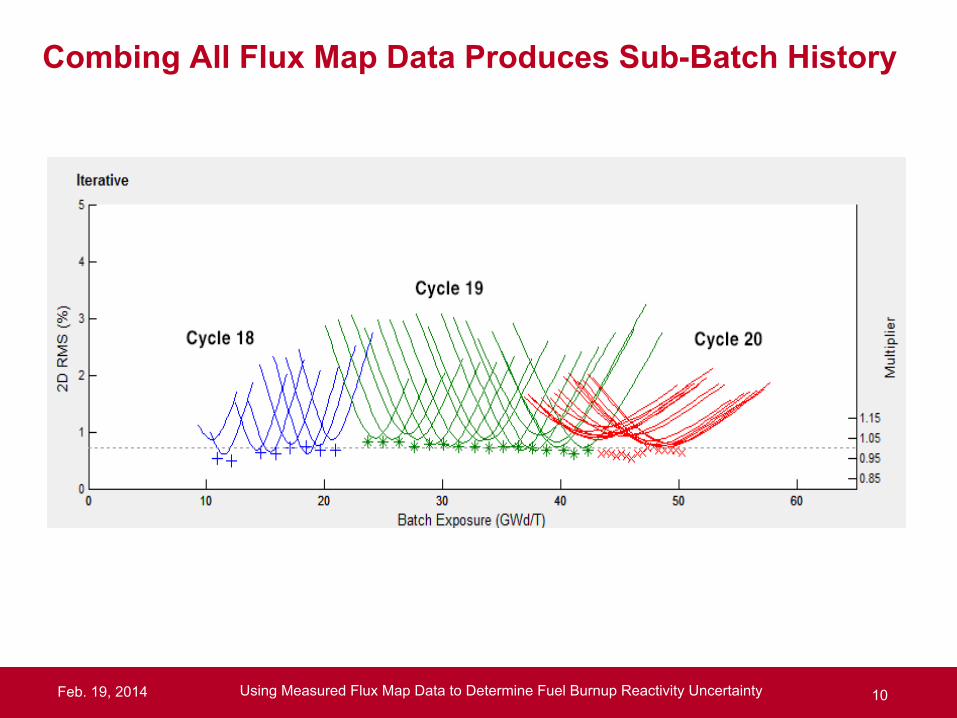
Each Flux Map Produces One Data Point Per Sub-Batch
Feb. 19, 2014 Using Measured Flux Map Data to Determine Fuel Burnup Reactivity Uncertainty
• Each flux map results in one burnup multiplier that produces the minimum r.m.s. difference between calculated and measured reaction rates
• The sub-batch multipliers are then converted to reactivity error at each flux map
reactivity error = k-infinity (MB=Mmin) minus k-infinity (MB=1.0)
Slide title
36 pt
Text 24 pt
Bullets level 2 20 pt
10
Combing All Flux Map Data Produces Sub-Batch History
Feb. 19, 2014 Using Measured Flux Map Data to Determine Fuel Burnup Reactivity Uncertainty

Slide title
36 pt
Text 24 pt
Bullets level 2 20 pt
11
Analysis Procedure • For each Flux Map:
- 10 iterative passes to find minimum r.m.s. difference of calculated
and measured reaction rates
- Loop over all sub-batches in the core - Loop over burnup multipliers, MB, in increments of 0.01 (from 0.85 to 1.15) - Save MB that minimizes r.m.s. difference
• > 4000 SIMULATE-3 calculations per flux map
Feb. 19, 2014 Using Measured Flux Map Data to Determine Fuel Burnup Reactivity Uncertainty
Slide title
36 pt
Text 24 pt
Bullets level 2 20 pt
12
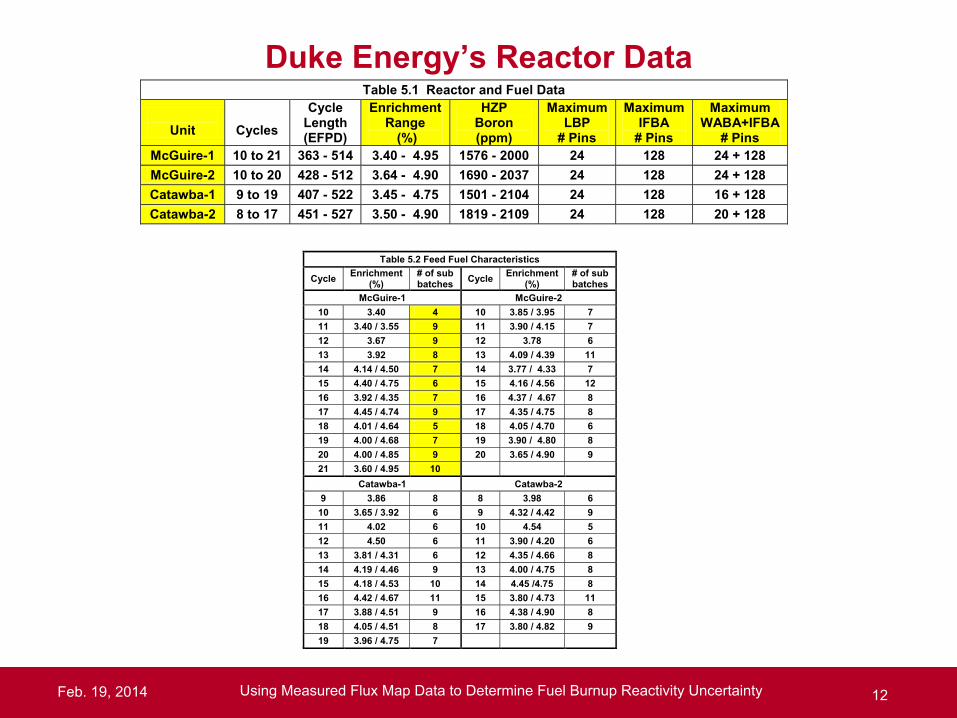
Duke Energy’s Reactor Data
Feb. 19, 2014 Using Measured Flux Map Data to Determine Fuel Burnup Reactivity Uncertainty
Table 5.1 Reactor and Fuel Data
Unit
Cycles
Cycle Length (EFPD)
Enrichment Range
(%)
HZP Boron (ppm)
Maximum LBP
# Pins
Maximum IFBA
# Pins
Maximum WABA+IFBA
# Pins McGuire-1 10 to 21 363 - 514 3.40 - 4.95 1576 - 2000 24 128 24 + 128 McGuire-2 10 to 20 428 - 512 3.64 - 4.90 1690 - 2037 24 128 24 + 128 Catawba-1 9 to 19 407 - 522 3.45 - 4.75 1501 - 2104 24 128 16 + 128 Catawba-2 8 to 17 451 - 527 3.50 - 4.90 1819 - 2109 24 128 20 + 128
Table 5.2 Feed Fuel Characteristics
Cycle Enrichment (%)
# of sub batches Cycle Enrichment
(%) # of sub batches
McGuire-1 McGuire-2 10 3.40 4 10 3.85 / 3.95 7 11 3.40 / 3.55 9 11 3.90 / 4.15 7 12 3.67 9 12 3.78 6 13 3.92 8 13 4.09 / 4.39 11 14 4.14 / 4.50 7 14 3.77 / 4.33 7 15 4.40 / 4.75 6 15 4.16 / 4.56 12 16 3.92 / 4.35 7 16 4.37 / 4.67 8 17 4.45 / 4.74 9 17 4.35 / 4.75 8 18 4.01 / 4.64 5 18 4.05 / 4.70 6 19 4.00 / 4.68 7 19 3.90 / 4.80 8 20 4.00 / 4.85 9 20 3.65 / 4.90 9 21 3.60 / 4.95 10
Catawba-1 Catawba-2 9 3.86 8 8 3.98 6 10 3.65 / 3.92 6 9 4.32 / 4.42 9 11 4.02 6 10 4.54 5 12 4.50 6 11 3.90 / 4.20 6 13 3.81 / 4.31 6 12 4.35 / 4.66 8 14 4.19 / 4.46 9 13 4.00 / 4.75 8 15 4.18 / 4.53 10 14 4.45 /4.75 8 16 4.42 / 4.67 11 15 3.80 / 4.73 11 17 3.88 / 4.51 9 16 4.38 / 4.90 8 18 4.05 / 4.51 8 17 3.80 / 4.82 9 19 3.96 / 4.75 7

Slide title
36 pt
Text 24 pt
Bullets level 2 20 pt
13
CASMO/SIMULATE Models Set Up from Design Data
Feb. 19, 2014 Using Measured Flux Map Data to Determine Fuel Burnup Reactivity Uncertainty
0
200
400
600
800
1000
1200
1400
1600
0 100 200 300 400 500 600
Bor
on C
once
ntra
tion
(ppm
)
Cycle Burnup (EFPD)
Fig. 5.1 Comparison of SIMULATE and Measured Boron Letdowns for Catawba Unit-2, Cycle 13
Measured
Comparison of CASMO-4/SIMULATE-3 and Measured Reaction Rates
Reactor
# of Flux Maps
Mean Radial (2D) r.m.s. Difference
(%)
Mean Nodal (3D) r.m.s. Difference
(%) McGuire-1 164 1.22 2.56 McGuire-2 160 1.16 2.78 Catawba-1 174 1.23 2.51 Catawba-2 169 1.26 2.91
Average 1.22 2.69
Studsvik CMS INTERPIN-4 (1D Fuel Pin) CASMO-4 (2D Lattice) CASMO-5 (2D Lattice) CMSLINK (Data linking) SIMULATE-3 (3D Core/T-H)

Slide title
36 pt
Text 24 pt
Bullets level 2 20 pt
14
Question: Minimize 2D or 3D r.m.s. Differences?
Feb. 19, 2014 Using Measured Flux Map Data to Determine Fuel Burnup Reactivity Uncertainty
• 2D and 3D r.m.s. minimizations examined – no significant
difference in Burnup Multipliers observed • Final implementation:
• Search on 3D r.m.s. difference to find best burnup multiplier • 2D r.m.s. are improved - as result of 3D r.m.s. minimization

Slide title
36 pt
Text 24 pt
Bullets level 2 20 pt
15
Measured Sub-Batch Reactivity Data Points
Feb. 19, 2014 Using Measured Flux Map Data to Determine Fuel Burnup Reactivity Uncertainty
• 4 reactors, 44 cycles, 667 flux maps, 1 million measured signals • 2.7 million CASMO-4/SIMULATE-3 cases • Produced >2500 sub-batch measured reactivities
reactivity decrement error = k-infinity (MB=Mmin) minus k-infinity (MB=1.0)
Slide title
36 pt
Text 24 pt
Bullets level 2 20 pt
16
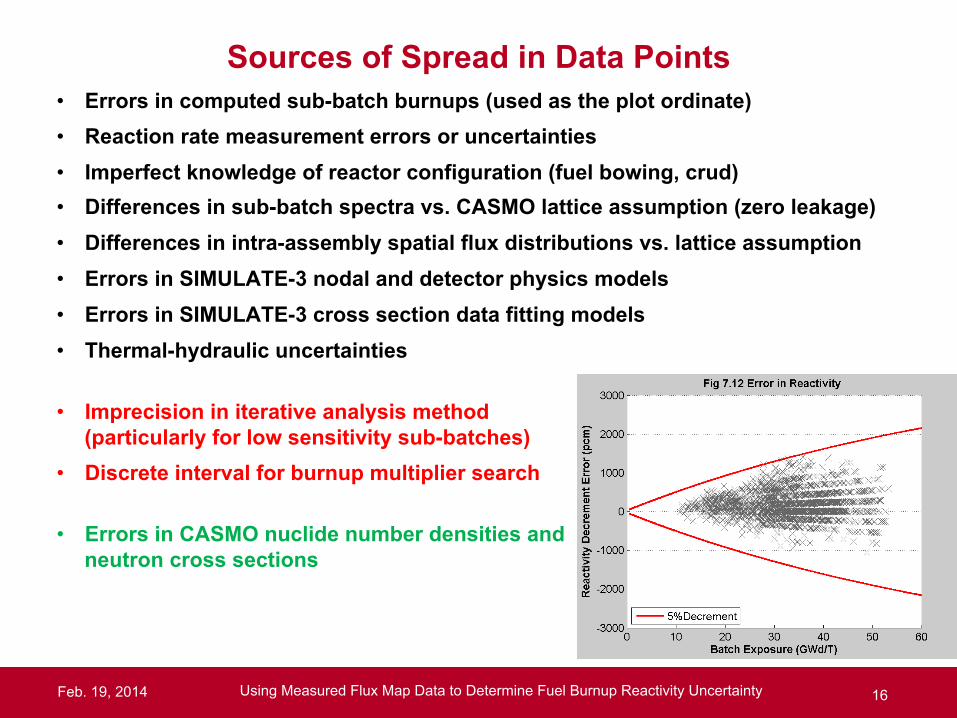
Sources of Spread in Data Points
Feb. 19, 2014 Using Measured Flux Map Data to Determine Fuel Burnup Reactivity Uncertainty
• Errors in computed sub-batch burnups (used as the plot ordinate) • Reaction rate measurement errors or uncertainties • Imperfect knowledge of reactor configuration (fuel bowing, crud) • Differences in sub-batch spectra vs. CASMO lattice assumption (zero leakage) • Differences in intra-assembly spatial flux distributions vs. lattice assumption • Errors in SIMULATE-3 nodal and detector physics models • Errors in SIMULATE-3 cross section data fitting models • Thermal-hydraulic uncertainties
• Imprecision in iterative analysis method
(particularly for low sensitivity sub-batches) • Discrete interval for burnup multiplier search
• Errors in CASMO nuclide number densities and
neutron cross sections

Slide title
36 pt
Text 24 pt
Bullets level 2 20 pt
17
Eliminate Low Sensitivity Points and Batches < 12
Feb. 19, 2014 Using Measured Flux Map Data to Determine Fuel Burnup Reactivity Uncertainty

Slide title
36 pt
Text 24 pt
Bullets level 2 20 pt
18
• Linear and quadratic regression examined • Constrained to 0.0 decrement error at 0.0 GWd/T • Variance assumed to be linear in burnup (heteroscedastic) • Confidence intervals here assume total correlation within sub-
batch/cycle (each measurement is not independent)
Reactivity Bias Determined From Regression Fits
Feb. 19, 2014 Using Measured Flux Map Data to Determine Fuel Burnup Reactivity Uncertainty

Slide title
36 pt
Text 24 pt
Bullets level 2 20 pt
19
Linear and Quadratic Regressions Are Similar
Feb. 19, 2014 Using Measured Flux Map Data to Determine Fuel Burnup Reactivity Uncertainty
Burnup (GWd/T) 10 - 20 20 - 30 30 - 40 40 - 50 50 - 60 # of Data Points 176 458 809 357 47

Slide title
36 pt
Text 24 pt
Bullets level 2 20 pt
20
Small Differences Between Individual Reactor Units
Feb. 19, 2014 Using Measured Flux Map Data to Determine Fuel Burnup Reactivity Uncertainty

Slide title
36 pt
Text 24 pt
Bullets level 2 20 pt
21
No Significant Differences vs. Enrichment
Feb. 19, 2014 Using Measured Flux Map Data to Determine Fuel Burnup Reactivity Uncertainty

Slide title
36 pt
Text 24 pt
Bullets level 2 20 pt
22
• Create a library with known defect - no lumped fission product absorption • Perform all 2.7 million SIMULATE cases with defective library • Perform regression fit to measured sub-batch decrement error • Compare measured decrement with known decrement (e.g., compute error)
The reactivity decrement of the library is measured to within 145 pcm.
Do Regression Fits Accurately Determine Reactivity Bias?
Feb. 19, 2014 Using Measured Flux Map Data to Determine Fuel Burnup Reactivity Uncertainty
0
20
40
60
80
100
120
140
160
180
200
0.00 10.00 20.00 30.00 40.00 50.00 60.00
Difference (pcm)
Burnup (GWd/T)
Difference in Reactivity Decrement Errors (Measured vs. Known Decrement Change)
Slide title
36 pt
Text 24 pt
Bullets level 2 20 pt
23
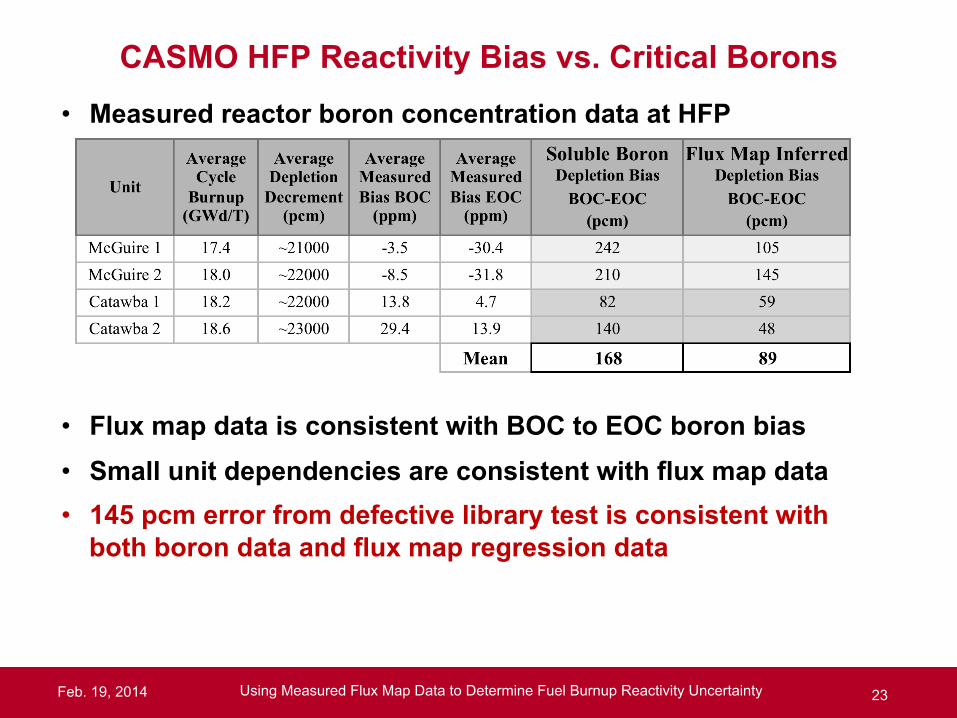
CASMO HFP Reactivity Bias vs. Critical Borons • Measured reactor boron concentration data at HFP
• Flux map data is consistent with BOC to EOC boron bias • Small unit dependencies are consistent with flux map data • 145 pcm error from defective library test is consistent with
both boron data and flux map regression data
Feb. 19, 2014 Using Measured Flux Map Data to Determine Fuel Burnup Reactivity Uncertainty

Slide title
36 pt
Text 24 pt
Bullets level 2 20 pt
24
CASMO HFP Reactivity Bias and Uncertainty • Use quadratic regression fits to determine bias • Conservatively assume:
– 145 pcm difference is taken as a one-sigma uncertainty – 2-sigma uncertainty applied independent of fuel burnup
Real uncertainty is much closer to confidence than prediction intervals
Feb. 19, 2014 Using Measured Flux Map Data to Determine Fuel Burnup Reactivity Uncertainty
Table 7.1 Measured CASMO Reactivity Decrement Bias (change needed to match measurement) Burnup (GWd/T) 10.0 20.0 30.0 40.0 50.0 60.0 CASMO-4 Bias (pcm) 92 153 182 181 148 84 CASMO-5 Bias (pcm) 22 49 78 110 146 185 Uncertainty (pcm) 290 290 290 290 290 290

Slide title
36 pt
Text 24 pt
Bullets level 2 20 pt
25
HFP to Cold Uncertainties: TSUNAMI Analysis • Measured CASMO HFP uncertainties account for both:
– Isotopic inventory (number density) uncertainties – Cross section uncertainty (at hot conditions) of k-infinity
• Isotopic inventory not changed in going to cold conditions, assume bias due to isotopics is the same at HFP and cold
• Use CASMO number densities vs. lattice burnup • Compute cross section uncertainty of reactivity with TSUNAMI
Feb. 19, 2014 Using Measured Flux Map Data to Determine Fuel Burnup Reactivity Uncertainty
Burnup (GWd/T) 0.5 10. 20. 30. 40. 50. 60. k-inf Hot 1.02068 1.08597 1.08298 1.03600 0.97772 0.92176 0.87200
Uncertainty (pcm) 1034 1104 1211 1265 1295 1311 1323 k-inf Cold 1.16103 1.23979 1.25419 1.21057 1.14557 1.07995 1.01883
Uncertainty (pcm) 1015 1087 1209 1281 1326 1361 1388
Slide title
36 pt
Text 24 pt
Bullets level 2 20 pt
26
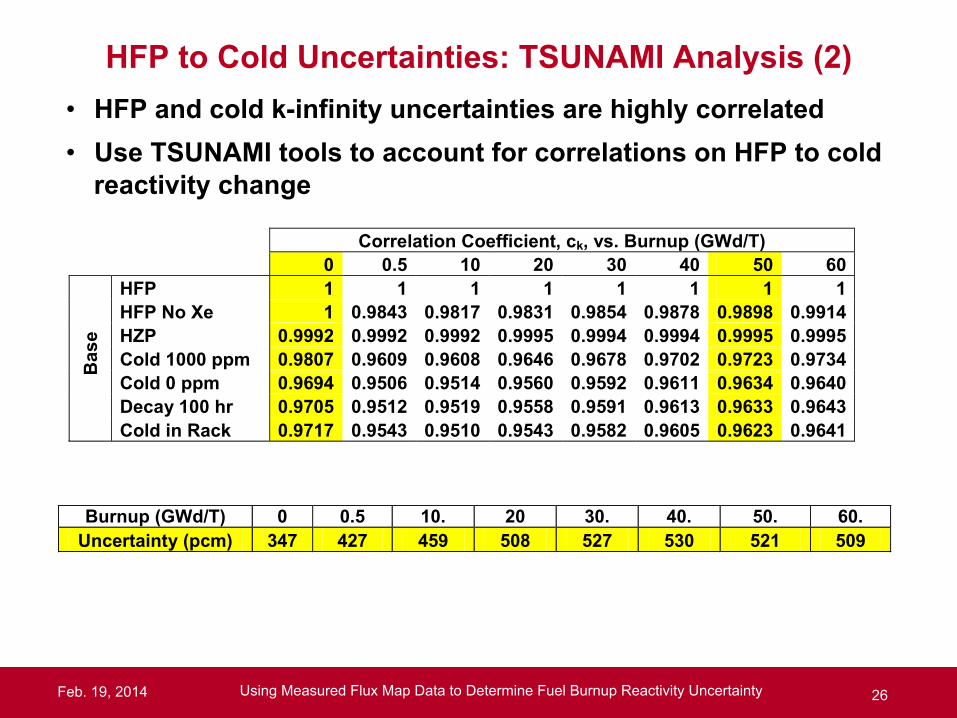
HFP to Cold Uncertainties: TSUNAMI Analysis (2) • HFP and cold k-infinity uncertainties are highly correlated • Use TSUNAMI tools to account for correlations on HFP to cold
reactivity change
Feb. 19, 2014 Using Measured Flux Map Data to Determine Fuel Burnup Reactivity Uncertainty
Burnup (GWd/T) 0 0.5 10. 20 30. 40. 50. 60. Uncertainty (pcm) 347 427 459 508 527 530 521 509
Correlation Coefficient, ck, vs. Burnup (GWd/T)
0 0.5 10 20 30 40 50 60
Bas
e
HFP 1 1 1 1 1 1 1 1 HFP No Xe 1 0.9843 0.9817 0.9831 0.9854 0.9878 0.9898 0.9914 HZP 0.9992 0.9992 0.9992 0.9995 0.9994 0.9994 0.9995 0.9995 Cold 1000 ppm 0.9807 0.9609 0.9608 0.9646 0.9678 0.9702 0.9723 0.9734 Cold 0 ppm 0.9694 0.9506 0.9514 0.9560 0.9592 0.9611 0.9634 0.9640 Decay 100 hr 0.9705 0.9512 0.9519 0.9558 0.9591 0.9613 0.9633 0.9643 Cold in Rack 0.9717 0.9543 0.9510 0.9543 0.9582 0.9605 0.9623 0.9641

Slide title
36 pt
Text 24 pt
Bullets level 2 20 pt
27
• Assume largest observed uncertainty applies to all lattices
• Cold BOL uncertainty of SFP/cask analysis come from criticals,
so we need the additional uncertainty in HFP to Cold reactivity
HFP to Cold Rack Reactivity vs. Burnup (GWd/T)
Burnup (GWd/T)
0.0 10. 20. 30. 40. 50. 60.
Base Reactivity (pcm) -10145 -6291 -4658 -4002 -4097 -4601 -5344 Uncertainty 222 324 353 358 356 349 339
128 IFBA 24 WABA
Reactivity (pcm) -10405 -6684 -4858 -4094 -4130 -4626 -5347 Uncertainty 212 317 352 364 354 346 341
3.50 % Enrichment
Reactivity (pcm) -12437 -7382 -5715 -5839 -6687 -7688 -8688 Uncertainty 204 330 364 357 349 343 337
4.25 % Enrichment
Reactivity (pcm) -11101 -6740 -5028 -4684 -5123 -5916 -6873 Uncertainty 211 327 357 359 350 342 337
Small Fuel Radius
Reactivity (pcm) -10351 -6443 -4808 -4163 -4327 -4881 -6715 Uncertainty 217 321 351 356 353 345 334
HFP to Cold Uncertainty
Feb. 19, 2014 Using Measured Flux Map Data to Determine Fuel Burnup Reactivity Uncertainty
Table 8.6 HFP to Cold Uncertainty (2 sigma) vs. Burnup Burnup (GWd/T) 0.0 10.0 20.0 30.0 40.0 50.0 60.0 Uncertainty (pcm) 365 498 555 550 537 521 512
Table 8.7 HFP to Cold Additional Uncertainty (2 sigma) vs. Burnup Burnup (GWd/T) 10.0 20.0 30.0 40.0 50.0 60.0 Uncertainty (pcm) 367 441 435 419 397 385
HFP to Cold Reactivity vs. Burnup (GWd/T)
Burnup (GWd/T)
0.0 10. 20. 30. 40. 50. 60.
Base Reactivity (pcm) 9867 11425 12605 13919 14986 15891 16527 Uncertainty 347 459 508 527 530 521 509
128 IFBA 24 WABA
Reactivity (pcm) 9977 11367 12556 13916 15009 15888 16612 Uncertainty 337 450 508 533 531 521 512
3.50 % Enrichment
Reactivity (pcm) 12703 13078 14402 15525 16266 16734 17034 Uncertainty 365 498 555 550 537 518 500
4.25 % Enrichment
Reactivity (pcm) 11069 12209 13469 14747 15699 16415 16931 Uncertainty 350 473 529 540 534 520 508
Small Fuel Radius
Reactivity (pcm) 9957 11480 12662 13975 15050 15942 15629 Uncertainty 340 456 505 525 529 518 500

Slide title
36 pt
Text 24 pt
Bullets level 2 20 pt
28
Correlation Coefficients Between Lattice Types • All lattices are extremely similar because:
– U-238 is almost constant – Structural materials are almost constant – Enrichment range is very narrow in LWRs
Feb. 19, 2014 Using Measured Flux Map Data to Determine Fuel Burnup Reactivity Uncertainty
Correlation Coefficient, ck, vs. Burnup (GWd/T)
0 0.5 10 20 30 40 50 60
HFP
Base 1 1 1 1 1 1 1 1 128 I 24 W 0.9989 0.9990 0.9998 0.9999 0.9999 1 1 1 3.5 % Enrichment 0.9927 0.9931 0.9831 0.9870 0.9898 0.9919 0.9939 0.9958 4.25 % Enrichment 0.9985 0.9984 0.9963 0.9969 0.9976 0.9980 0.9984 0.9988 Small Fuel Rad. 0.9999 0.9998 0.9999 0.9999 0.9999 0.9999 0.9999 0.9999
Col
d 0
ppm
D
ecay
100
hr Base 1 1 1 1 1 1 1 1
128 I 24 W 0.9988 0.9986 0.9997 0.9999 1 1 1 1 3.5 % Enrichment 0.9941 0.9939 0.9818 0.9836 0.9860 0.9885 0.9912 0.9937 4.25 % Enrichment 0.9988 0.9987 0.9962 0.9963 0.9968 0.9972 0.9977 0.9983 Small Fuel Rad. 1 0.9999 0.9999 0.9999 0.9999 0.9999 0.9999 0.9999
Col
d R
ack
Geo
met
ry Base 1 1 1 1 1 1 1 1
128 I 24 W 0.9988 0.9992 0.9997 0.9999 1 1 1 1 3.5 % Enrichment 0.9940 0.9941 0.9817 0.9835 0.986 0.9884 0.9910 0.9936 4.25 % Enrichment 0.9988 0.9988 0.9961 0.9963 0.9968 0.9972 0.9977 0.9982 Small Fuel Rad. 1 0.9999 0.9999 0.9999 0.9999 1 0.9999 0.9999
Slide title
36 pt
Text 24 pt
Bullets level 2 20 pt
29
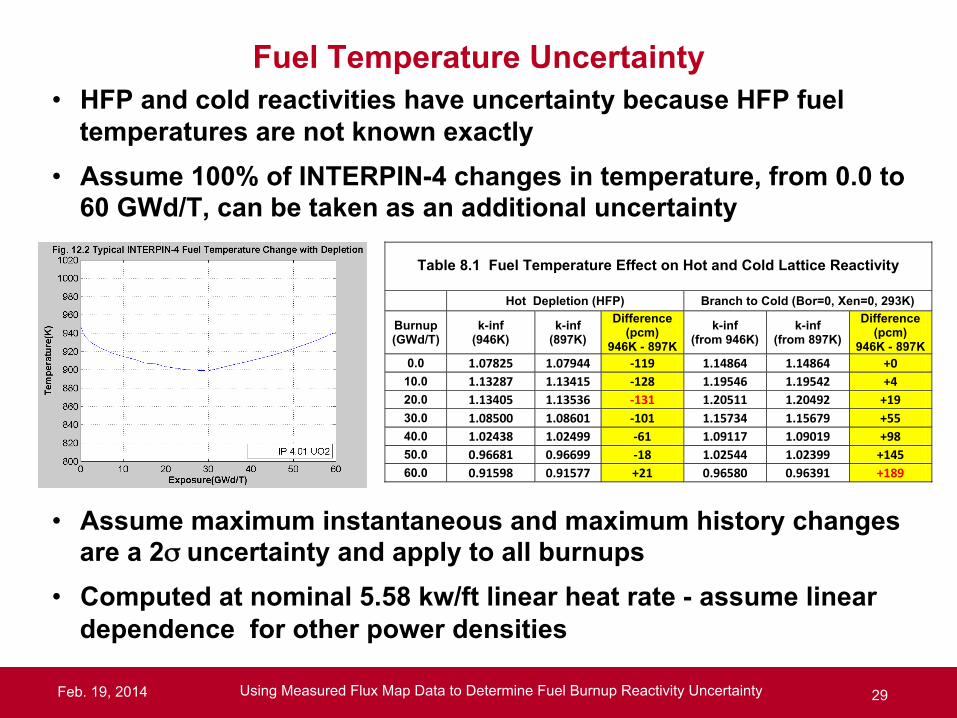
Fuel Temperature Uncertainty
Feb. 19, 2014 Using Measured Flux Map Data to Determine Fuel Burnup Reactivity Uncertainty
Table 8.1 Fuel Temperature Effect on Hot and Cold Lattice Reactivity
Hot Depletion (HFP) Branch to Cold (Bor=0, Xen=0, 293K)
Burnup (GWd/T)
k-inf (946K)
k-inf (897K)
Difference (pcm)
946K - 897K k-inf
(from 946K) k-inf
(from 897K) Difference
(pcm) 946K - 897K
0.0 1.07825 1.07944 -‐119 1.14864 1.14864 +0 10.0 1.13287 1.13415 -‐128 1.19546 1.19542 +4 20.0 1.13405 1.13536 -‐131 1.20511 1.20492 +19 30.0 1.08500 1.08601 -‐101 1.15734 1.15679 +55 40.0 1.02438 1.02499 -‐61 1.09117 1.09019 +98 50.0 0.96681 0.96699 -‐18 1.02544 1.02399 +145 60.0 0.91598 0.91577 +21 0.96580 0.96391 +189
• HFP and cold reactivities have uncertainty because HFP fuel temperatures are not known exactly
• Assume 100% of INTERPIN-4 changes in temperature, from 0.0 to 60 GWd/T, can be taken as an additional uncertainty
• Assume maximum instantaneous and maximum history changes
are a 2σ uncertainty and apply to all burnups • Computed at nominal 5.58 kw/ft linear heat rate - assume linear
dependence for other power densities
Slide title
36 pt
Text 24 pt
Bullets level 2 20 pt
30
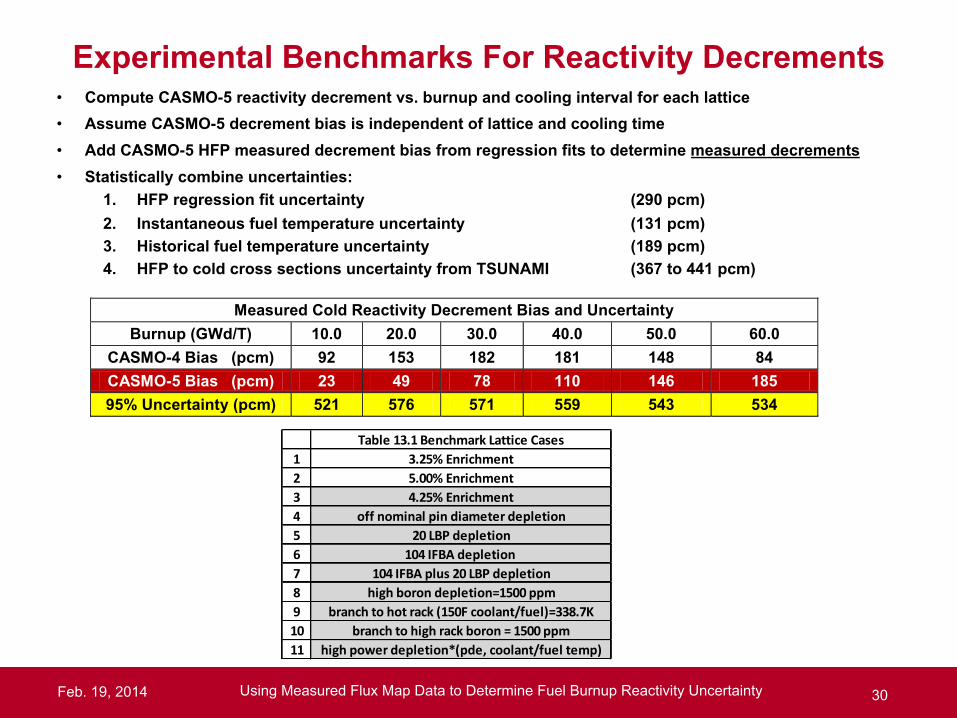
Experimental Benchmarks For Reactivity Decrements • Compute CASMO-5 reactivity decrement vs. burnup and cooling interval for each lattice • Assume CASMO-5 decrement bias is independent of lattice and cooling time • Add CASMO-5 HFP measured decrement bias from regression fits to determine measured decrements • Statistically combine uncertainties:
1. HFP regression fit uncertainty (290 pcm) 2. Instantaneous fuel temperature uncertainty (131 pcm) 3. Historical fuel temperature uncertainty (189 pcm) 4. HFP to cold cross sections uncertainty from TSUNAMI (367 to 441 pcm)
Feb. 19, 2014 Using Measured Flux Map Data to Determine Fuel Burnup Reactivity Uncertainty
Measured Cold Reactivity Decrement Bias and Uncertainty Burnup (GWd/T) 10.0 20.0 30.0 40.0 50.0 60.0
CASMO-4 Bias (pcm) 92 153 182 181 148 84 CASMO-5 Bias (pcm) 23 49 78 110 146 185 95% Uncertainty (pcm) 521 576 571 559 543 534
Table 13.1 Benchmark Lattice Cases
1 3.25% Enrichment2 5.00% Enrichment3 4.25% Enrichment4 off nominal pin diameter depletion5 20 LBP depletion6 104 IFBA depletion 7 104 IFBA plus 20 LBP depletion8 high boron depletion=1500 ppm9 branch to hot rack (150F coolant/fuel)=338.7K10 branch to high rack boron = 1500 ppm11 high power depletion*(pde, coolant/fuel temp)

Slide title
36 pt
Text 24 pt
Bullets level 2 20 pt
31
11 Reactivity Decrement Benchmarks
Feb. 19, 2014 Using Measured Flux Map Data to Determine Fuel Burnup Reactivity Uncertainty
Case 10 20 30 40 50 601 -‐0.1779 -‐0.2754 -‐0.3589 -‐0.4303 -‐0.4876 N/A2 -‐0.1606 -‐0.2457 -‐0.3218 -‐0.3932 -‐0.4600 -‐0.52063 -‐0.1683 -‐0.2589 -‐0.3393 -‐0.4131 -‐0.4791 -‐0.53534 -‐0.1682 -‐0.2592 -‐0.3404 -‐0.4152 -‐0.4825 -‐0.53975 -‐0.2462 -‐0.2757 -‐0.3400 -‐0.4092 -‐0.4722 -‐0.52616 -‐0.2165 -‐0.2643 -‐0.3371 -‐0.4101 -‐0.4765 -‐0.53347 -‐0.2911 -‐0.2834 -‐0.3383 -‐0.4062 -‐0.4694 -‐0.52398 -‐0.1684 -‐0.2569 -‐0.3343 -‐0.4045 -‐0.4668 -‐0.51979 -‐0.1698 -‐0.2602 -‐0.3398 -‐0.4126 -‐0.4775 -‐0.532610 -‐0.1289 -‐0.2082 -‐0.2803 -‐0.3467 -‐0.4056 -‐0.454911 -‐0.1750 -‐0.2631 -‐0.3392 -‐0.4078 -‐0.4685 -‐0.5200
Table 14.2 Measured Reactivity Decrement
Burnup (GWd/T)
Table 13.1 Benchmark Lattice Cases1 3.25% Enrichment2 5.00% Enrichment3 4.25% Enrichment4 off nominal pin diameter depletion5 20 LBP depletion6 104 IFBA depletion 7 104 IFBA plus 20 LBP depletion8 high boron depletion=1500 ppm9 branch to hot rack (150F coolant/fuel)=338.7K10 branch to high rack boron = 1500 ppm11 high power depletion*(pde, coolant/fuel temp)

Slide title
36 pt
Text 24 pt
Bullets level 2 20 pt
32
Sensitivity of Benchmarks to Lattice Code/Library • Generate benchmarks with different code/libraries and compare:
– CASMO-5 ENDF/B-VII vs. CASMO-4 (ENDF/B-IV&VI,JEF-1&2)
<2% reactivity decrement dependence on cross section library/code
Benchmarks are insensitive to the lattice code/library
Feb. 19, 2014 Using Measured Flux Map Data to Determine Fuel Burnup Reactivity Uncertainty
Case 10 20 30 40 50 601 -‐0.65 -‐0.03 0.58 1.11 1.57 N/A2 -‐1.22 -‐0.60 -‐0.19 0.27 0.80 1.333 -‐1.03 -‐0.41 0.04 0.55 1.12 1.604 -‐1.02 -‐0.43 -‐0.01 0.54 1.06 1.575 -‐0.35 -‐0.17 0.07 0.56 1.06 1.556 0.10 -‐0.01 0.15 0.51 0.96 1.397 0.12 0.20 0.27 0.58 1.00 1.408 -‐0.97 -‐0.30 0.15 0.68 1.22 1.679 -‐1.22 -‐0.62 -‐0.13 0.39 0.96 1.4410 -‐1.04 -‐0.37 0.15 0.76 1.39 1.9611 -‐0.45 0.07 0.51 0.99 1.51 1.97
Table 9.1 % Difference in Reactivity Decrement (C4-‐C5) No Cooling
Slide title
36 pt
Text 24 pt
Bullets level 2 20 pt
33
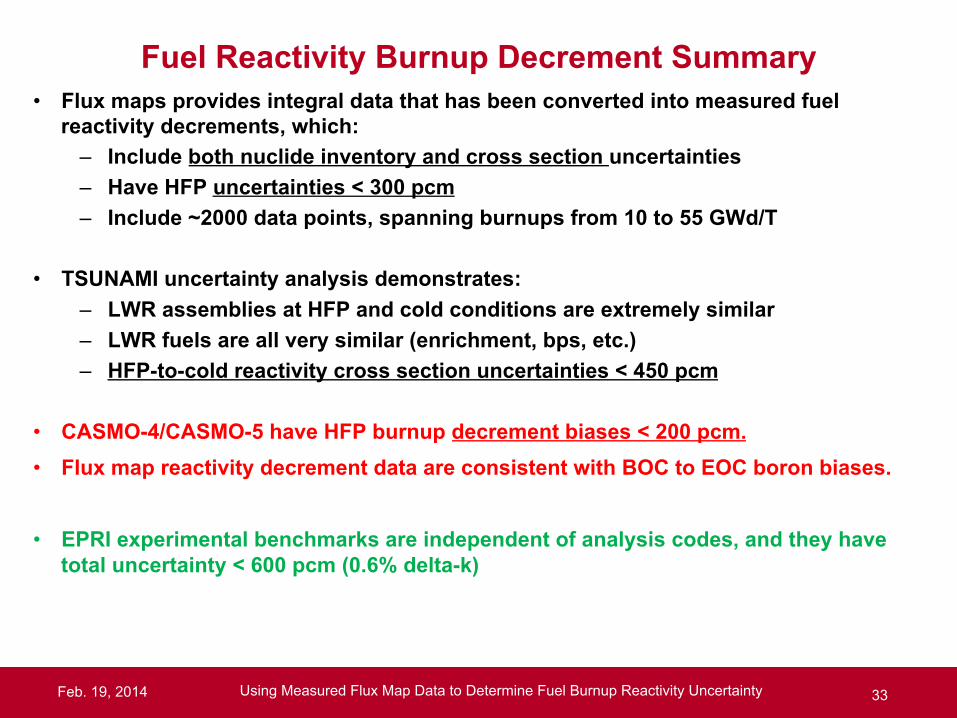
Fuel Reactivity Burnup Decrement Summary • Flux maps provides integral data that has been converted into measured fuel
reactivity decrements, which: – Include both nuclide inventory and cross section uncertainties – Have HFP uncertainties < 300 pcm – Include ~2000 data points, spanning burnups from 10 to 55 GWd/T
• TSUNAMI uncertainty analysis demonstrates:
– LWR assemblies at HFP and cold conditions are extremely similar – LWR fuels are all very similar (enrichment, bps, etc.) – HFP-to-cold reactivity cross section uncertainties < 450 pcm
• CASMO-4/CASMO-5 have HFP burnup decrement biases < 200 pcm. • Flux map reactivity decrement data are consistent with BOC to EOC boron biases.
• EPRI experimental benchmarks are independent of analysis codes, and they have total uncertainty < 600 pcm (0.6% delta-k)
Feb. 19, 2014 Using Measured Flux Map Data to Determine Fuel Burnup Reactivity Uncertainty

Slide title
36 pt
Text 24 pt
Bullets level 2 20 pt
34
Bottom Line
• EPRI benchmarks can be used to determine biases and uncertainty of applicant’s SFP or cask criticality tools.
• Cold reactivity decrement uncertainties far smaller than Kopp’s 5% criteria. (< 2.0% uncertainty is supportable at high burnups)
Feb. 19, 2014 Using Measured Flux Map Data to Determine Fuel Burnup Reactivity Uncertainty

Slide title
36 pt
Text 24 pt
Bullets level 2 20 pt
35 Feb. 19, 2014 Using Measured Flux Map Data to Determine Fuel Burnup Reactivity Uncertainty
Thank You!

1
Application of EPRI Depletion Method
Dale LancasterNuclearConsultants.com
NRC/NEI Meeting on SFP Criticality GuidanceFebruary 19th 2014 • Rockville, MD
2
Topics
• Theory• Bias and Uncertainty • Example Application• Comparison To Other Methods• Advantages of the EPRI Benchmarks for Depletion Reactivity Validation
• Conclusions
3
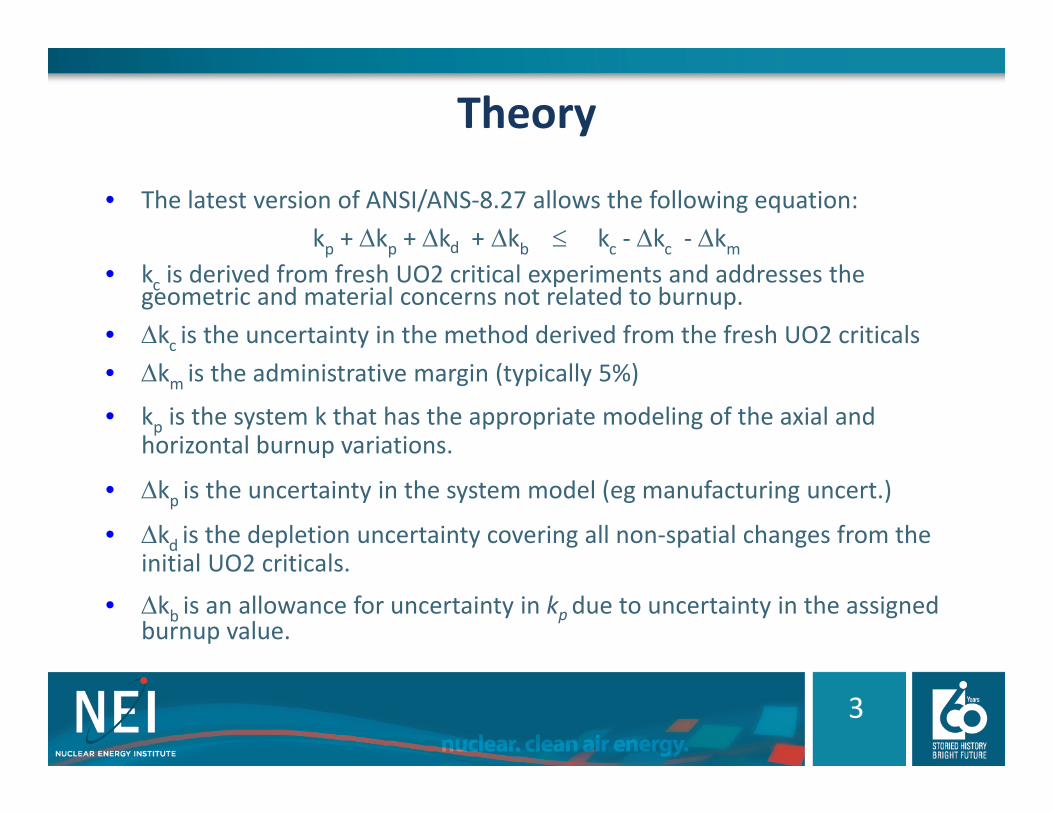
Theory
• The latest version of ANSI/ANS‐8.27 allows the following equation:kp + kp + kd + kb kc ‐ kc ‐ km
• kc is derived from fresh UO2 critical experiments and addresses the geometric and material concerns not related to burnup.
• kc is the uncertainty in the method derived from the fresh UO2 criticals• km is the administrative margin (typically 5%)
• kp is the system k that has the appropriate modeling of the axial and horizontal burnup variations.
• kp is the uncertainty in the system model (eg manufacturing uncert.)
• kd is the depletion uncertainty covering all non‐spatial changes from the initial UO2 criticals.
• kb is an allowance for uncertainty in kpdue to uncertainty in the assigned burnup value.

4
Depletion Reactivity Bias & Uncertainty
• The Depletion Reactivity Bias and Uncertainty, kd , must be based on measured data.
• The EPRI depletion benchmarks provide that measured data.
• Historically, this approach was taken but with an assumed uncertainty (no bias) of 5% of the reactivity of depletion (Kopp memo).
• Alternatively, rather than use kd , one can use uncertainties in isotopic content and isotopic worth (NUREG/CR‐7108 and 7109)
5
Bias and Uncertainty
• The difference between the calculated delta k of depletion and the EPRI benchmark is a bias.
• Although there are multiple benchmarks each represents a different condition.
• The variation in the calculated bias is not due to a random event but the difference in the condition.
• The uncertainty is the uncertainty in the benchmarks (not the variation in biases).
6
Bias and Uncertainty
• The temperature model is a large uncertainty in the EPRI benchmarks so the uncertainty in the benchmarks are a function of kw/ft.
• The uncertainty should be a function of burnup but the uncertainties associated with going from hot to cold conditions overwhelmed the burnup dependence. (Due to the small size of the HFPuncertainty a conservative constant uncertainty was selected.)
7
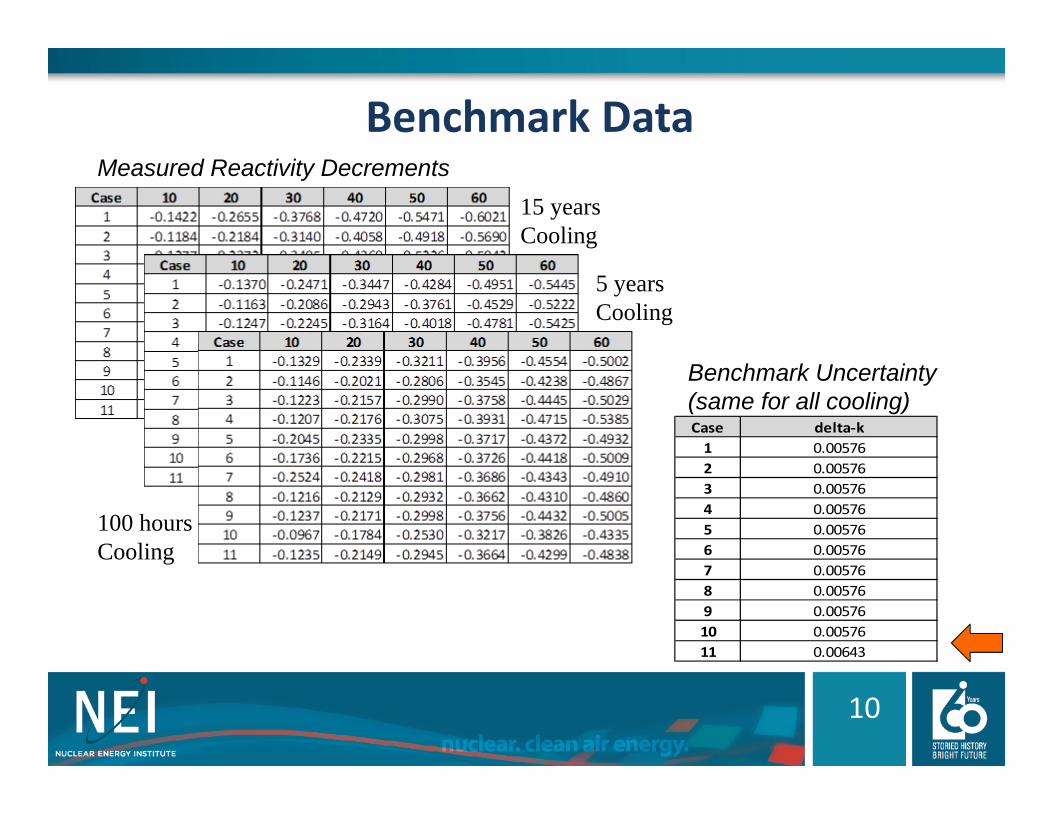
Bias and Uncertainty
• Two uncertainties are reported:- 0.00576 for 38.1 W/gm U, and - 0.00643 for 57.2 W/gm U
• 57.2 W/gm corresponds to a 1.5 peaking factor.
• Conservatively use 0.0064.

8
Example Application
• EPRI sponsored “Utilization of the EPRI Depletion Benchmarks for Burnup Credit Validation,” EPRI Report 1025203 (April 2012)http://www.epri.com/abstracts/Pages/ProductAbstract.aspx?ProductId=000000000001025203
• Used SCALE 6.1 and various libraries
• This example will use 238 Group ENDF/B‐VII library

9
Benchmark Lattice Cases
Benchmark Lattice Cases
1 3.25% Enrichment 2 5.00% Enrichment 3 4.25% Enrichment 4 off-nominal pin diameter depletion 5 20 WABA depletion 6 104 IFBA depletion 7 104 IFBA plus 20 WABA depletion 8 high boron depletion = 1500 ppm 9 branch to hot rack (150°F coolant/fuel) = 338.7K
10 branch to high rack boron = 1500 ppm 11 high power depletion (power, coolant/fuel temp)
High Power is 1.5 times average power of 38.1 W/gm
10
Benchmark Data
Benchmark Uncertainty (same for all cooling)
Measured Reactivity Decrements
Case1234567891011
0.005760.00643
0.005760.005760.005760.005760.00576
0.005760.00576
0.005760.00576
delta‐k
15 years Cooling
5 years Cooling
100 hours Cooling
11
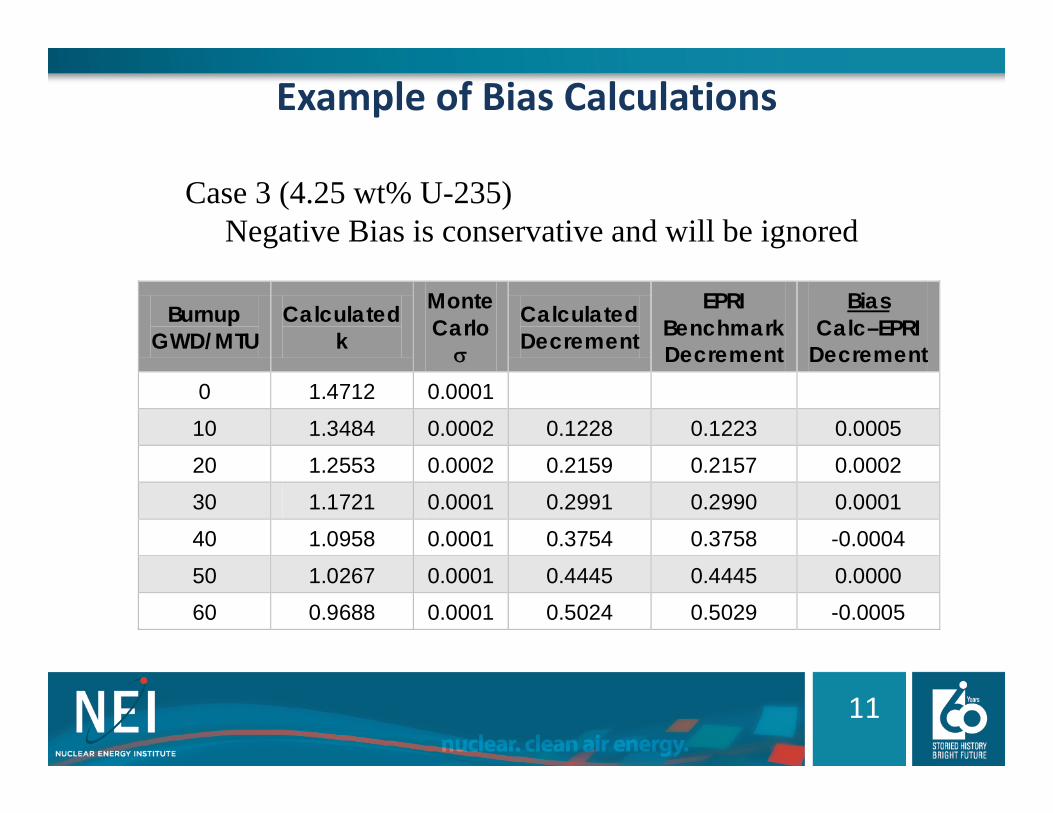
Example of Bias Calculations
Burnup GWD/MTU
Calculated k
Monte Carlo
Calculated Decrement
EPRI Benchmark Decrement
Bias Calc–EPRI
Decrement 0 1.4712 0.0001
10 1.3484 0.0002 0.1228 0.1223 0.0005 20 1.2553 0.0002 0.2159 0.2157 0.0002 30 1.1721 0.0001 0.2991 0.2990 0.0001 40 1.0958 0.0001 0.3754 0.3758 -0.0004 50 1.0267 0.0001 0.4445 0.4445 0.0000 60 0.9688 0.0001 0.5024 0.5029 -0.0005
Case 3 (4.25 wt% U-235)Negative Bias is conservative and will be ignored

12
EPRI Benchmark Biases

13
Case 30 GWD/T
13.25% enrichment
depletion -0.0017
25.00% enrichment
depletion 0
34.25% enrichment
depletion -0.0005
4off-nominal pin
depletion -0.0018
5 20 WABA depletion 0.0001
6 104 IFBA depletion 0.0001
7104 IFBA, 20 WABA
depletion 0.0007
8high boron depletion
= 1500 ppm -0.0001
9branch to hot rack =
338.7K -0.0005
10branch to rack
boron = 1500 ppm -0.0018
11high power density
depletion -0.0005
Higher Enriched Case 2 -3 0.0005Bigger Pin Case 3-4 0.0013WABA + IFBA Case 7-3 0.0012Higher ppm depltete Case 8-3 0.0004Hotter Rack Case 9-3 0.0000Poisoned Rack Case 10-3 0.0000Higher Power Case 11-3 0.0000
Sum of Case 3 plus deltas 0.0029
Several of the effects can happen at the same time.
The bias needs to come from the combined effects
Need to cover all burnups and cooling times.
Final Bias Selected was 0.003
14
Advantages of the EPRI Benchmarks for Depletion Reactivity Validation
• Analysis of EPRI benchmarks match closely the analysis for the pool.- Chemical Assay analysis require special treatment to get pin isotopics – Pool analysis use assembly isotopics.
• The EPRI benchmarks are easy to perform.• All the isotopes and changes with the fuel are contained in the depletion reactivity.
15
Advantages of the EPRI Benchmarks for Depletion Reactivity Validation
• Since individual benchmarks have low biases so the analysis can help improve modeling - The uncertainty associated with each chemical assay is so high little can be learned from an individual assay.
• The documentation is easy to find, including example applications

16
Conclusions
• The EPRI Depletion Benchmarks use power distributions to determine measurement inferred depletion reactivities.
• The depletion reactivities include the change in isotopic concentrations as well as the macro cross sections.
• The EPRI benchmarks are easy to perform and closely match the analysis methods for the spent fuel pool.

17
Conclusions
• The depletion reactivity includes all isotopes and material changes.
• The uncertainties and bias from using the EPRI benchmarks are similar to the much more complex chemical assay analysis.
• The uncertainties and bias are smaller than the Kopp memo.

1
Isotopic and Worth Benchmarking
Bob HallConsulting Engineer, Dominion
NRC/NEI Meeting on SFP Criticality GuidanceFebruary 19th, 2014• Rockville, MD
2
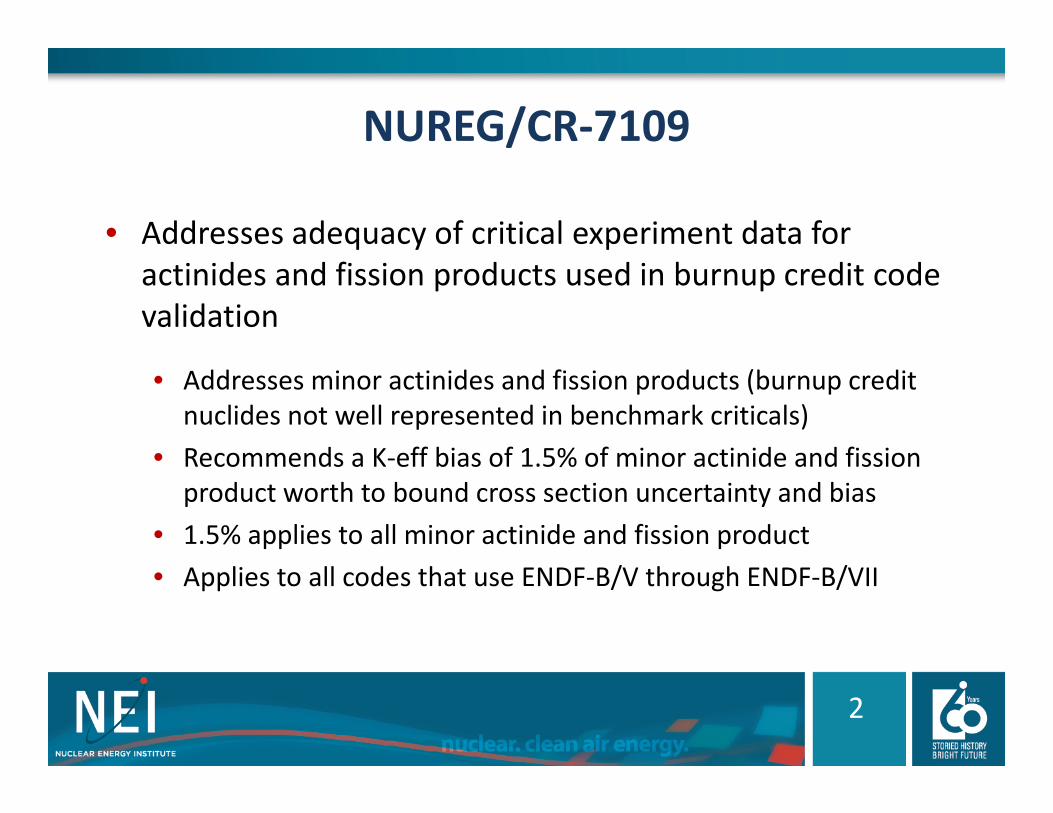
NUREG/CR‐7109
• Addresses adequacy of critical experiment data for actinides and fission products used in burnup credit code validation
• Addresses minor actinides and fission products (burnup credit nuclides not well represented in benchmark criticals)
• Recommends a K‐eff bias of 1.5% of minor actinide and fission product worth to bound cross section uncertainty and bias
• 1.5% applies to all minor actinide and fission product• Applies to all codes that use ENDF‐B/V through ENDF‐B/VII

3
NUREG/CR‐7108• Addresses K‐eff bias and uncertainty associated with predicted burnup credit nuclide concentrations
• Compares radiochemical assay (RCA) measurements of depleted fuel samples to SCALE 6.1 calculated nuclide concentrations
• Provides two methods to determine bias and uncertainty using isotopic validation
• Monte Carlo method• Direct Difference method
• K‐eff bias and uncertainty for Direct Difference are “comparable to, but smaller than” for Monte Carlo
• Monte Carlo method is not accessible for independent analyses

4
NUREG/CR‐7108
• Key Conclusions:
• Using SCALE 6.1 and the ENDF/B‐VII nuclear data results in a small overprediction of K‐eff
• Uncertainties in the calculated U‐235 and Pu‐239 concentrations contribute ~90‐95% of the K‐eff bias uncertainty of all 28 nuclides evaluated
• Uncertainties in calculated FP concentrations are small (< 3% of the K‐eff bias uncertainty)

5
Monte Carlo Method Results
Positive bias means K‐eff is overpredicted

6
Monte Carlo and Direct Difference Results
Positive difference means K‐eff is under‐predicted

7
Observations• K‐eff uncertainty derived by the two methods is similar at discharge burnups
• The burnup bins used in the Monte Carlo approach results in poor resolution of uncertainty as a function of burnup • 3 Major actinide bins: 0‐15, 15‐40, > 40 GWd/T• 2 Minor actinide bins: 0‐40 and >40 GWd/T• Fission products: all burnups lumped together
8
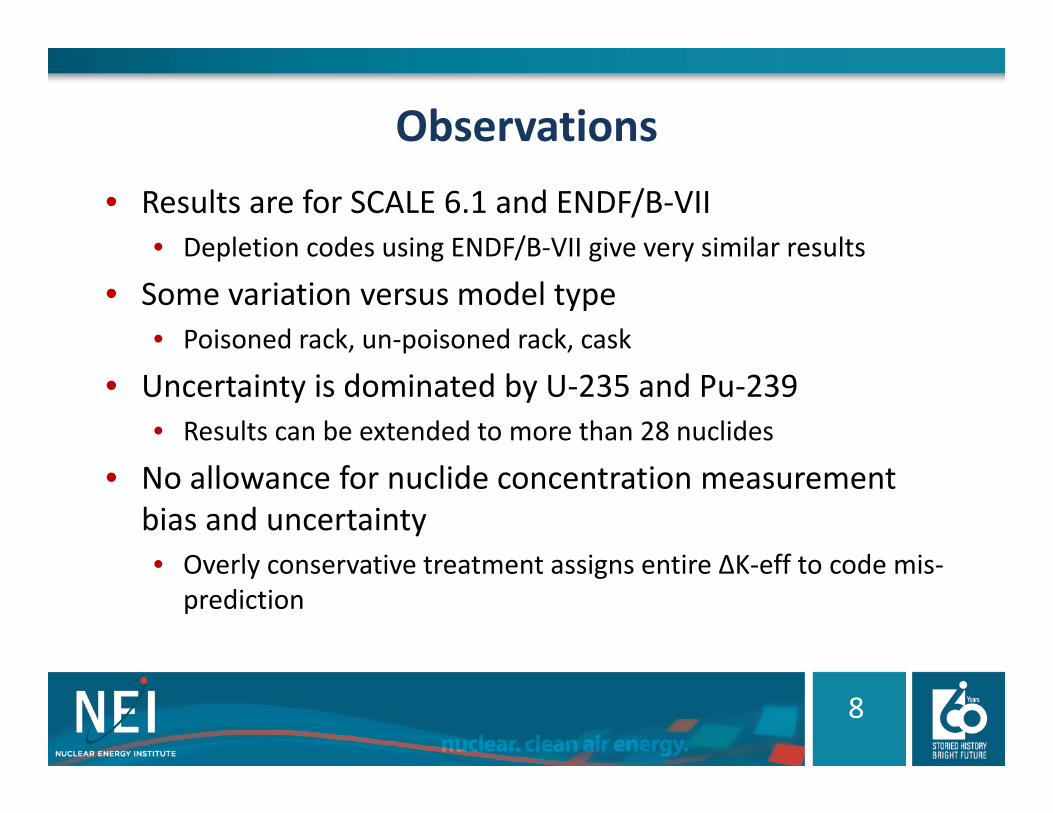
Observations• Results are for SCALE 6.1 and ENDF/B‐VII
• Depletion codes using ENDF/B‐VII give very similar results
• Some variation versus model type• Poisoned rack, un‐poisoned rack, cask
• Uncertainty is dominated by U‐235 and Pu‐239• Results can be extended to more than 28 nuclides
• No allowance for nuclide concentration measurement bias and uncertainty • Overly conservative treatment assigns entire ∆K‐eff to code mis‐
prediction

9
• Isotopic Composition Measurement Uncertainty
• NUREG/CR‐6811 caution is not addressed in NUREG/CR‐7108:
“This source of error [RCA uncertainty] can represent a potentially large source of the overall uncertainty in isotopic validation. Radiochemical analysis of spent fuel is complex and difficult, and the uncertainties associated with the nuclide measurements can be significant.
When computer code predictions are benchmarked against experimental data, the differences between calculations and observation are often incorrectly attributed to the bias and uncertainty of the code, because it is usually not possible to differentiate between code errors and experimental errors.”

10
Chemical Assay Critique• NUREG/CR‐7108 uses 100 assay candidates• Sample N‐9C‐J for H. B. Robinson should be eliminated• Taken from under an Inconel grid
• Some TMI data is questionable • Has no effect if using bounding approach• Increases standard deviation if using statistical method
• Two samples from Calvert Cliffs BT03 were incorrectly analyzed (removed permanent BAs)
11
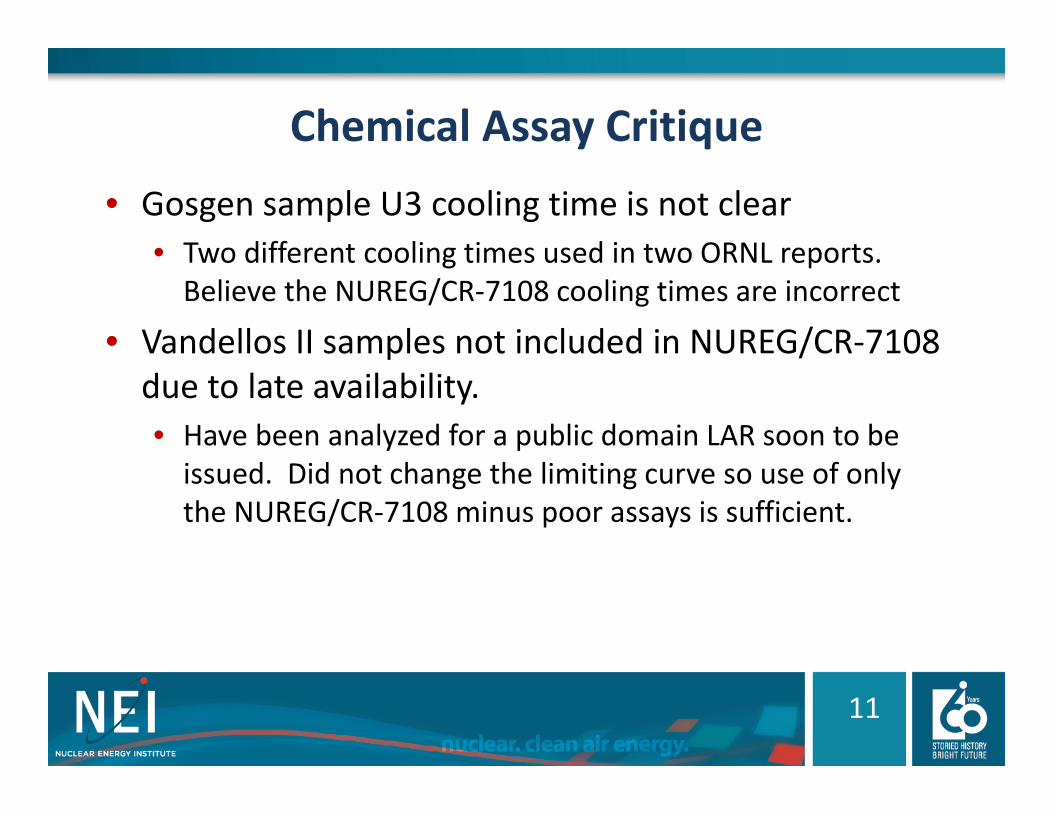
Chemical Assay Critique• Gosgen sample U3 cooling time is not clear
• Two different cooling times used in two ORNL reports.Believe the NUREG/CR‐7108 cooling times are incorrect
• Vandellos II samples not included in NUREG/CR‐7108 due to late availability. • Have been analyzed for a public domain LAR soon to be issued. Did not change the limiting curve so use of only the NUREG/CR‐7108 minus poor assays is sufficient.

12
Analysis Alternatives• Use direct difference results (exclude some assays)
• Demonstrate consistency with CR‐7108 rack model • Use SCALE 6.1 or demonstrate consistency with SCALE 6.1
burnup worth• Develop conservative ∆K uncertainty vs burnup function• Extend ∆K uncertainty vs burnup function to all nuclides used
• Fraction of burnup credit beyond 28 nuclides is not large• Can convert ∆K uncertainty to % uncertainty if burnup credit ∆K is determined (apply % uncertainty to total burnup credit taken)

13

14

15
Analysis Alternatives• Calculate direct difference (exclude 4 assays)
• Model direct difference cases with depletion model• Calculate direct difference ∆K using LAR rack model • Develop conservative ∆K uncertainty vs burnup function • Extend ∆K uncertainty vs burnup function to all nuclides used
• Fraction of burnup credit beyond 28 nuclides is not large• U‐235 and Pu‐239 differences dominate
16

17
Direct‐Difference Bias and Uncertainty
18
Comparison To Other Methods
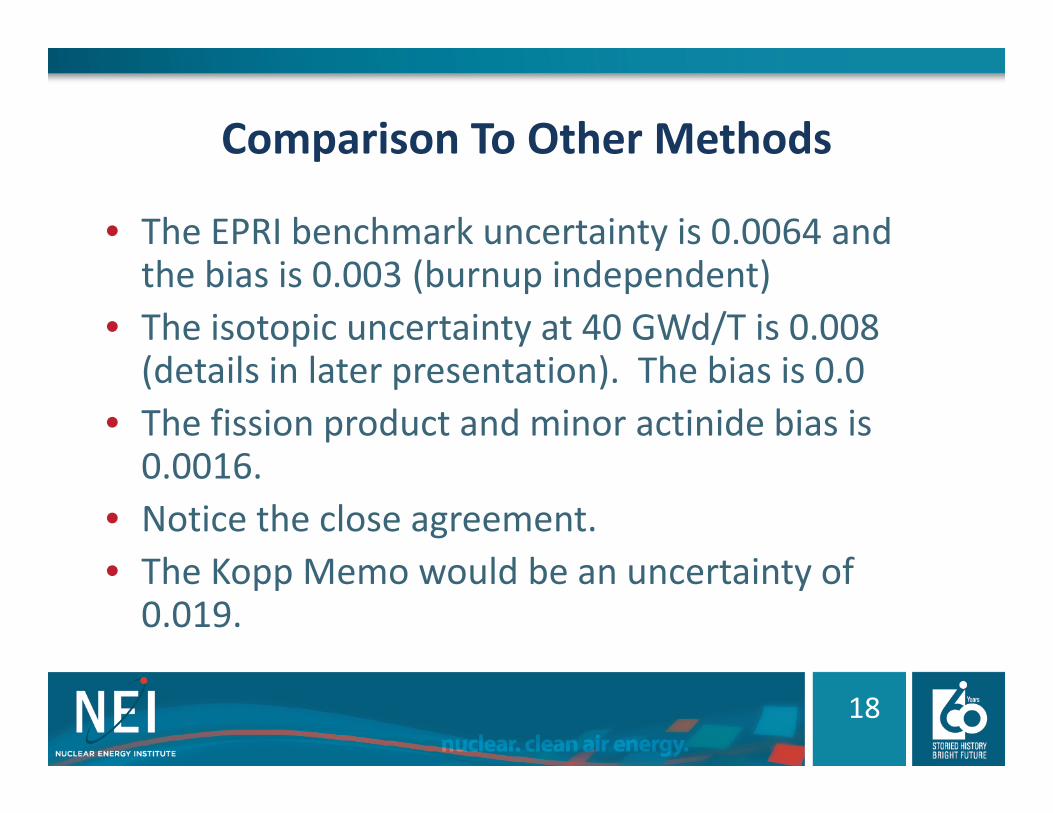
• The EPRI benchmark uncertainty is 0.0064 and the bias is 0.003 (burnup independent)
• The isotopic uncertainty at 40 GWd/T is 0.008 (details in later presentation). The bias is 0.0
• The fission product and minor actinide bias is 0.0016.
• Notice the close agreement.• The Kopp Memo would be an uncertainty of 0.019.

19
Summary• Apply K‐eff bias of 1.5% of minor actinide and fission product worth
• Use of direct difference data is inherently conservative due to assignment of all differences to code uncertainty
• ENDF/B‐VII tends to conservatively underestimate burnupcredit
• Direct difference data can be used to derive values for burnup credit uncertainty
• Considering this recent isotopic benchmarking and the EPRI depletion methodology the 5% depletion uncertainty is acceptable.

1
Burnup Uncertainty
Andrew BlancoTechnical Lead – Spent Fuel Pool Criticality Safety
Westinghouse Electric CompanyNRC/NEI Public Meeting on NEI 12‐16
2/19/2014 • Rockville, MD

2
Overview
• Definition• Calculation of Burnup Uncertainty• Size of Burnup Uncertainty• Application of Burnup Uncertainty• Recommendations
3
Definition
• The Burnup Uncertainty, or Burnup Measurement Uncertainty, (BMU) is an uncertainty representing the maximum potential reactivity impact of deviations between an assembly’s “true” and estimated burnup based on reactor records.
• Incorporated in analyses because burnup measurement campaigns to confirm true assembly burnup are not part of used fuel management at site.

4
Calculation of Burnup Uncertainty
• There are a number of ways to calculate BMU, two common methods are:
BMU = 0.0X*(Burnup)*(δk/δBU); BMU = (k(1‐0.0X)BU – kBU)
- X = percent deviation between true and estimated burnup
• X is traditionally assumed to be 5% (0.05)
• Alternatively, utilities can reduce burnup of assemblies by 5% instead of incorporating the uncertainty

5
Size of Burnup Uncertainty
• To calculate BMU, knowledge of an appropriate value for “X” is needed- Historically 5% has been used
• Both EPRI and ORNL have performed studies to evaluate the accuracy of reactor records:- TR‐112054, “Determination of the Accuracy of Utility Spent‐Fuel Burnup Records”, EPRI, 1999.
- NUREG/CR‐6998, “Review of Information for Spent Nuclear Fuel Confirmation,” ORNL, 2009.
6
Size of Burnup Uncertainty (cont’d)
• The EPRI and ORNL reports agree that burnup estimations are within 5% of the true assembly burnup- When using properly calibrated core follow software which is updated with in‐core measurements the uncertainty is less than 2%

7
Application of Burnup Uncertainty
• Burnup Uncertainty has traditionally been a separately assessed uncertainty- RSSed with the other uncertainties in the sum of biases and uncertainties
8
Summary
• Burnup Uncertainty should be accounted for by including a separately assessed uncertainty in the calculation of the sum of biases and uncertainties- Use of 5% is conservative without being unduly penalizing
• Alternatively, discharge burnups can be directly modified to account for the burnup uncertainty.

1
Technical Specification Content
Kristopher CummingsSr. Project Manager, Used Fuel Programs
February 19th, 2014 • Rockville, MD

2
Topics of Discussion
• Plant Systems (Section 3.7)• Design Features (Section 4.0)• Future Tech Spec Changes (after NEI 12‐16 endorsement)
• Summary/Conclusions
3
Plant Systems (Section 3.7)
• LCO for Fuel Storage Pool Boron Concentration:- If LCO found to not be met, required actions are to suspend movement of fuel and initiate actions to restore boron concentration immediately
- Surveillance Requirement:• Frequency is 7 days or in accordance with the Surveillance Frequency Control Program (typically weekly)

4
Plant Systems (Section 3.7)• An LCO for fuel storage loading patterns
- If LCO found to not be met, required action is to immediately initiate action to move non‐complying fuel assembly to an acceptable storage location
- Surveillance Requirements:• Each fuel assembly, fuel insert, neutron absorber insert, hardware shall meet the storage loading patterns in the Design Features section (Section 4.0) prior to storing the fuel assembly in the rack.

5
Design Features (Section 4.0)
• Section 4.3 covers Fuel Storage:- Requirements for new and spent fuel storage, burnup/enrichment, neutron absorber insert locations, fuel inserts (i.e., RCCAs)
- Burnup/enrichment/cooling time requirements should be specified as an equation or in tabular form. Graphical representation (figures) are not necessary and should not be solely relied upon for loading curves

6
Future Tech Spec Changes• Currently the Design Features section of the Tech Spec for the spent fuel pool can be quite large, depending on the number of storage loading patterns
• This is in contradiction with the size/detail associated with the Tech Specs for the reactor.
• Propose developing a “Pool Operating Limits Report” (POLR) to place detailed loading patterns, with Tech Specs reserved for appropriate design criteria:- Max enrichment, keff limits, rack pitch.

7
Summary/Conclusions
• Current approach to Tech Specs (fuel loading patterns and soluble boron level) provide appropriate protection of public health and safety.
• Future efforts to simplify Tech Spec and develop a more flexible approach (i.e., POLR) will be pursued subsequent to the NRC endorsement of NEI 12‐16.
1
Multiple Misloads
Kristopher CummingsSr. Project Manager, Used Fuel Programs
February 19th, 2014 • Rockville, MD

2
Topics of Discussion
• Administrative Controls• Event Tree Analysis/Human Factors• Post Movement Verification• Blocking Devices• Multiple Misload Scenarios• Summary/Conclusions
3
Administrative Controls
• Additional procedural controls can be instituted to ensure multiple misloads are prevented.- Validated software implementation to provide:
• Surveillance reports to show acceptability of storage configurations
• Graphical representation to augment manual verification• Pre‐verify planned fuel moves and configuration• Visual (color coded) maps showing acceptability
- Need detailed administrative procedures for implementation

4
Administrative Controls
• To prevent categorization and storage cell selection errors:- Training, qualification and experience of nuclear engineers and operators
- Documentation of fuel assembly characteristics- Operating experience with validated software- Independent verification of validated software output (Fuel Transfer Logs ‐ FTLs)
- Independent categorization of affected assemblies and prep of FTLs by qualified individuals
- Training of qualified individuals in new TS criteria.

5
Event Tree Analysis• EPRI has previously analyzed
the likelihood of a criticality event due to fuel assembly misload in a transportation cask
• This method could be used to assess the event tree and likelihood of a misload in a spent fuel pool.
• Requires a specific storage configuration to be assessed (difficult to assess generically).
Source: EPRI Report 1016635
6
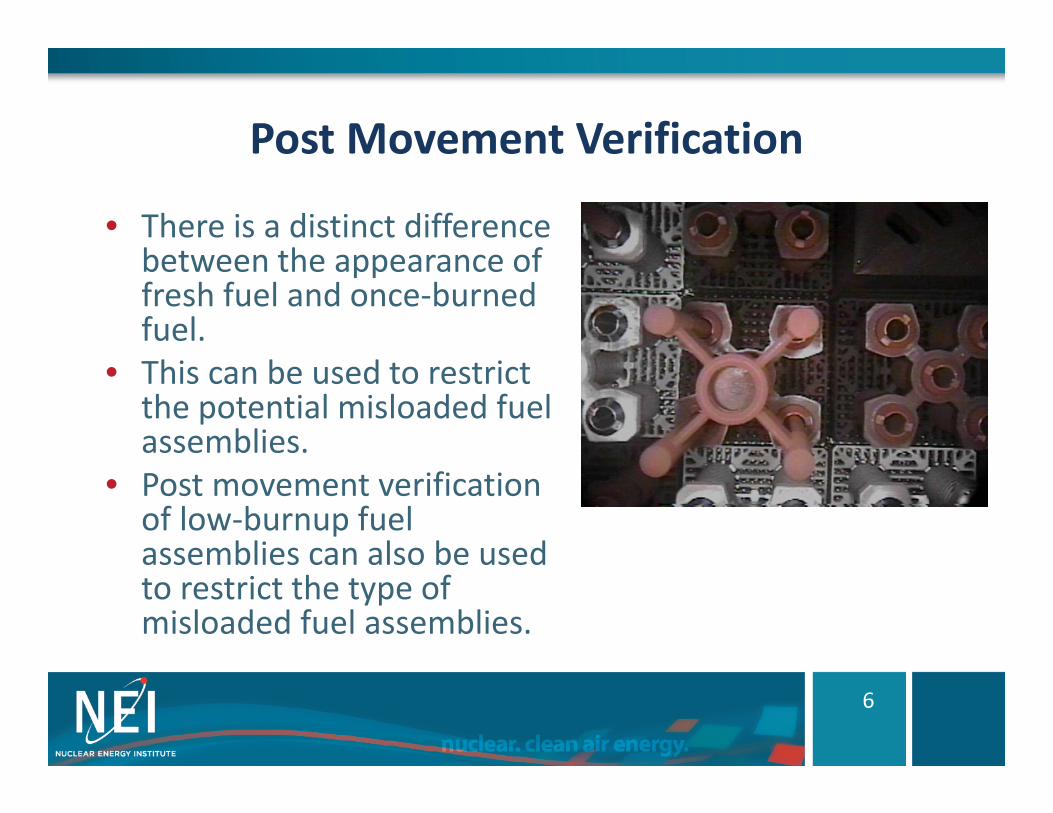
Post Movement Verification
• There is a distinct difference between the appearance of fresh fuel and once‐burned fuel.
• This can be used to restrict the potential misloaded fuel assemblies.
• Post movement verification of low‐burnup fuel assemblies can also be used to restrict the type of misloaded fuel assemblies.
7
Post Movement Verification
• After fuel assemblies are placed in the pool a confirmation of the fuel assembly location is performed.
• Verification of the location of high reactivity fuel (i.e., fresh or once‐burned fuel assemblies) in the spent fuel pool to ensure proper placement.
8
Storage Cell Blocking Devices• Blocking devices are physical hardware installed to prevent
inadvertent placement of a fuel assembly in the storage cell.• Features needed in a blocking device:
- Semi‐permanent (cannot be moved by normal handling tool)- “Lock in‐place” feature to ensure no inadvertent movement of
blocking device.- Ability of blocking device to be moved needs to be balanced with
ability for flexibility in storage configurations- Needs to be simple to ensure cost‐effective implementation- Allows for continued buoyancy driven fluid flow in storage cell- Does not need to prevent a dropped fuel assembly from entering the
storage cell (but single misload needs to address this situation)• Use of blocking devices can be credited to prevent a misloaded
assembly in a location with a blocking device

9
Multiple Misload Scenarios
• The use of admin controls, event tree analysis, post move verification and blocking devices will be used to inform the appropriate misloading scenarios to be addressed via analysis.
• Must be determined on a case‐by‐case basis depending on complexity of storage configurations
• Example: A straightforward Region 1 – Region 2 pool could analyze misloaded once‐burned fuel assemblies in Region 2.
• Demonstrate that keff < 0.95 at Tech Spec soluble boron content to ensure regulatory compliance
10
Summary/Conclusions• Multiple misloads are generally not applicable to BWR racks with maximum reactivity criteria.
• Soluble boron (controlled by Tech Spec LCO) provides the primary safety feature to prevent a criticality event, even in the case of multiple misloads.
• Combination of robust administrative controls, event tree analysis, post move verification and blocking devices can be used to inform a reasonable assumption for multiple misload analysis

1
Eccentric Positioning Uncertainty
Kristopher CummingsSr. Project Manager, Used Fuel Programs
February 19th, 2014 • Rockville, MD
2
Topics of Discussion
• Bias versus an Uncertainty• Why Eccentric Positioning is an Uncertainty• Comparison to Other Biases/Uncertainties• Precedence of Eccentricity as an Uncertainty• How to Determine the Effect of Eccentricity• Preliminary Results• Summary/Conclusions

3
Bias versus Uncertainty• Bias has traditionally been defined in the context of the criticality code validation/analysis methods (mean difference between experiment and calculation – Kopp)
• Bias has since been extended to other areas (temperature bias, fuel assembly design) where known effects that effect all assemblies are applied conservatively (versus making a statistical argument for application as an uncertainty).
4
Bias versus Uncertainty• Uncertainty has traditionally been defined in the context of manufacturing tolerances – maximize the parameter of interest within tolerance range (Kopp)
• Effects of uncertainties are statistically combined (square‐root sum of the squares).
• An uncertainty is applied when the parameter of interest can vary (independently) on a per‐unit basis (i.e., each fuel pellet, fuel rod, storage cell, etc.)

5
Why is Eccentric Positioning is an Uncertainty• The location of assemblies in the cell is random within the boundaries of the cell walls.
• How close the assembly can be placed to the storage cell wall is dictated by the fuel assembly envelope (from manufacturing drawings)
• This is directly analogous to the treatment of manufacturing tolerances, where there is a nominal value and a range (plus/minus) of possible values.
• Each assembly placement is independent of the placement of other assemblies.

6
Examples of Other Biases/Uncertainties
Biases Uncertainties
Criticality Code Bias Fuel Assembly Manufacturing Tolerances
Moderator Temperature Effect Uncertainty in Depletion Calculations
Fuel Assembly Type Uncertainty in Calculated Burnup
Storage Cell Bulging Storage Rack Manufacturing Tolerances
Effect of Residual Carbon (Carborundum)
7
Precedence of Eccentricity as an Uncertainty
• NRC has found acceptable the application of eccentric positioning as an uncertainty:- Prairie Island (Sept 2013) – ML11236A134- Palisades (Jan. 2012) – ML110380083- Turkey Point (Nov. 2011) – ML110560336
• Applications prior to 2011 were also approved by the NRC with eccentricity being applied as an uncertainty.

8
How to Determine the Effect of Eccentricity
Reflective/Periodic Boundary Conditions
• Assume 4 assemblies are eccentrically located and determine the reactivity difference from the reference condition (centered).
• The calculated reactivity is the maximum displacement from center and is statistically combined with other uncertainties.
• The limiting condition is often with centered assemblies but both conditions shall be analyzed.
• Larger arrangement (greater than 2x2) of assemblies skewed to a central point is unnecessary since the effect is small and we are already counting 4 random events as one.

9
Preliminary Results • Eccentric positioning is only positive when no fixed neutron absorber is present.
• Going to lattice sizes larger than 2x2 (i.e., 4x4, 8x8, 12x12) shows an asymptotically increasing effect. No additional increase in the 20x20 case.
• Effect is larger for Region 1 (flux‐trap) racks than Region 2
• Maximum effect was ~ 0.0080 k at high enrichment, no burnup (high reactivity).

10
Summary/Conclusions
• Fuel location is random within the storage cell dimensions; appropriate to be applied as an uncertainty.
• NRC has already approved eccentricity as an uncertainty of multiple applications in past and recent applications
• Need to reach agreement on how to model eccentricity to be treated as an uncertainty.