Embed Size (px)
Citation preview
7/31/2019 Negroes Et Al., 2012
http://slidepdf.com/reader/full/negroes-et-al-2012 1/10
O R I G I N A L A R T I C L E
Nuno Negro ˜ es • Rahel Sollmann • Carlos FonsecaAnah T. A. Ja ´ como • Eloy Revilla • Leandro Silveira
One or two cameras per station? Monitoring jaguarsand other mammals in the Amazon
Received: 8 January 2011/ Accepted: 12 February 2012Ó The Ecological Society of Japan 2012
Abstract Camera trapping has become a popular tech-nique to monitor carnivore populations due to its use-fulness in estimating abundance. Nevertheless, there area number of problems associated with study design
which are motivating researchers to search for a com-promise that ensures improvement of precision whilebeing cost-effective. We have used data from a capture– recapture study in a forested area in central Brazil toevaluate the effectiveness of using one versus two cam-eras per trapping station for determining jaguar (Pan-thera onca) density and capture rates of several othermammals. The capture rate for the jaguar and otherspecies recorded with only one camera was lower thanthat with two cameras. The number of jaguars identifiedusing photos from one camera ranged between six andseven animals, but reached ten individuals when two-camera sets were used where pictures of both flanks
could be positively individualized. These differences,combined with different estimates of effective sampledarea size, resulted in jaguar densities estimates rangingfrom 2.18 to 5.40 and 3.99 individuals/100 km2 whenone and two cameras were used per station, respectively(using the half-MMDM and Heterogeneity model).
Based on our results, we recommend the use of twocameras per station for jaguar density monitoring toensure reasonable levels of reliability and accuracy of estimates despite a small sample size.
Keywords Camera-trapping Æ Closed mark–recapturemodels Æ Population density Æ Panthera onca Æ
Relative abundance
Introduction
The use of camera trapping to study different aspects of animal ecology has become popular in recent years as anefficient tool to obtain data on rare and cryptic species(Kelly 2008; Rowcliffe and Carbone 2008). Camera trap-ping is currently a recurrent tool in both conservation
biology and ecology, being commonly applied in speciessurveys, abundance estimations, nest depredation studies,and/or estimates of vital rates (Karanth 1995; Hernandezetal. 1997; Silveira et al. 2003; Trolle 2003; Trolle and Ke ´ ry2005; Johnson et al. 2006; Karanth et al. 2006; Linkie et al.2006; Dillon and Kelly 2007; Rowcliffe and Carbone 2008;Tobler et al. 2008; Negro ˜ es et al. 2011).
One of the most common uses of camera trapping isto determine the relative or absolute density of elusivespecies (Trolle and Ke ´ ry 2005), with the former usuallybased on photographic capture rates, i.e., number of photos per unit effort (O’Brien et al. 2003), and the latterbased on a combination of camera trapping data and
closed population capture–recapture modeling (e.g.,Karanth and Nichols 1998). To apply such models tocamera trapping data, several premises need to be ful-filled: (1) animals must bear individually identifiablemarks (spots, stripes, scars, or artificial tags); (2) allanimals inhabiting the study area must have a proba-bility >0 of being detected; (3) sampling time should beshort relative to the species population dynamics (forlarge felids about 2 months are suggested) to approxi-mate a closed population; (4) sampling design shouldmaximize capture probability (Karanth and Nichols
N. Negro ˜ es (&) Æ C. FonsecaCenter for Environmental and Marine Studies (CESAM)and Biology Department, Aveiro University,Campus Universita ´ rio de Santiago, 3810-193 Aveiro, PortugalE-mail: [email protected].: +351-277394467Fax: +351-277394580
N. Negro ˜ es Æ E. RevillaDepartment of Conservation Biology, Estacio ´ n Biolo ´ gica deDonana, Consejo Superior de Investigaciones Cientı ´ficas (CSIC),Calle Americo Vespucio s/n, 41092 Seville, Spain
N. Negro ˜ es Æ R. Sollmann Æ A. T. A. Ja ´ como Æ L. SilveiraJaguar Conservation Fund, Caixa-Postal 193, GO-341 km 84,Zona Rural, Mineiros, GO 75.830-000, Brazil
R. SollmannLeibniz Institute for Zoo and Wildlife Research,Alfred-Kowalke-Str. 17, 10315 Berlin, Germany
Ecol ResDOI 10.1007/s11284-012-0938-4
7/31/2019 Negroes Et Al., 2012
http://slidepdf.com/reader/full/negroes-et-al-2012 2/10
1998, 2002; Stanley and Burnham 1999; Silver et al.2004; Rowcliffe and Carbone 2008; Negro ˜ es et al. 2010;Sarmento et al. 2010).
For optimal individual identification in most species,pictures of both sides of an individual are needed and,therefore, the standard sampling protocol requires set-ting two camera-traps facing each other at each sam-pling station (Silver 2004). This considerably increasescosts associated with sampling. However, as project re-sources are generally limited, researchers need to find acompromise that ensures the collection accurate datawithin economic constraints. A combined strategy thatmanages both the number of trapping stations and thetrapping grid arrangement has been applied to addressthis issue (e.g., Karanth and Nichols 2002; O’Brien et al.2003; Dillon and Kelly 2008), but such an approach maynot always be feasible depending on the logistics at thestudy site. To date, no study has investigated the effectof using one versus two camera-traps at each samplingstation on abundance and density estimates. Overall,sampling protocols are still open to debate, particularlyin terms of trap distance and estimation of the sampled
area (Soisalo and Cavalcanti 2006; Dillon and Kelly2007; Maffei and Noss 2008; Balme et al. 2009), withonly a few studies having looked at the consequences of different designs (Harmsen 2006; Dillon and Kelly 2007;Maffei and Noss 2008; Balme et al. 2009).
The jaguar Panthera onca (Linnaeus, 1758) is thelargest cat in the Americas, with a wide distribution thatstretches from the Southwestern USA/Mexico toNorthern Argentina. The elusive nature of this speciesmakes it difficult to detect and monitor populations(Rabinowitz and Nottigham 1986). In the last decade,the use of remote triggered photographic cameras hasmade a strong contribution to the increase in informa-
tion on jaguar density and biology (Silver 2004; Silveret al. 2004). However, population status remains largelyunknown throughout the majority of its range, and thedeclining status impairs research focused on populationdynamics, which forms the basis for conservation guid-ance (Karanth et al. 2003; Sanderson et al. 2002).
Knowledge of a species’ density per se does not provideenough information to evaluate population stability ordesign conservation policies (Harmsen 2006). Thus, ouraim is to establish a long-term monitoring protocol toreliably estimate jaguar density and abundance of otherspecies using camera trapping. To do so, we need to knowhow the use of one or two camera-traps per sampling sta-
tion affects: (1) abundance and density estimates for the jaguar and (2) the photographic rates for most commonlarge- and medium-sized species in the study area.
Materials and methods
Study area
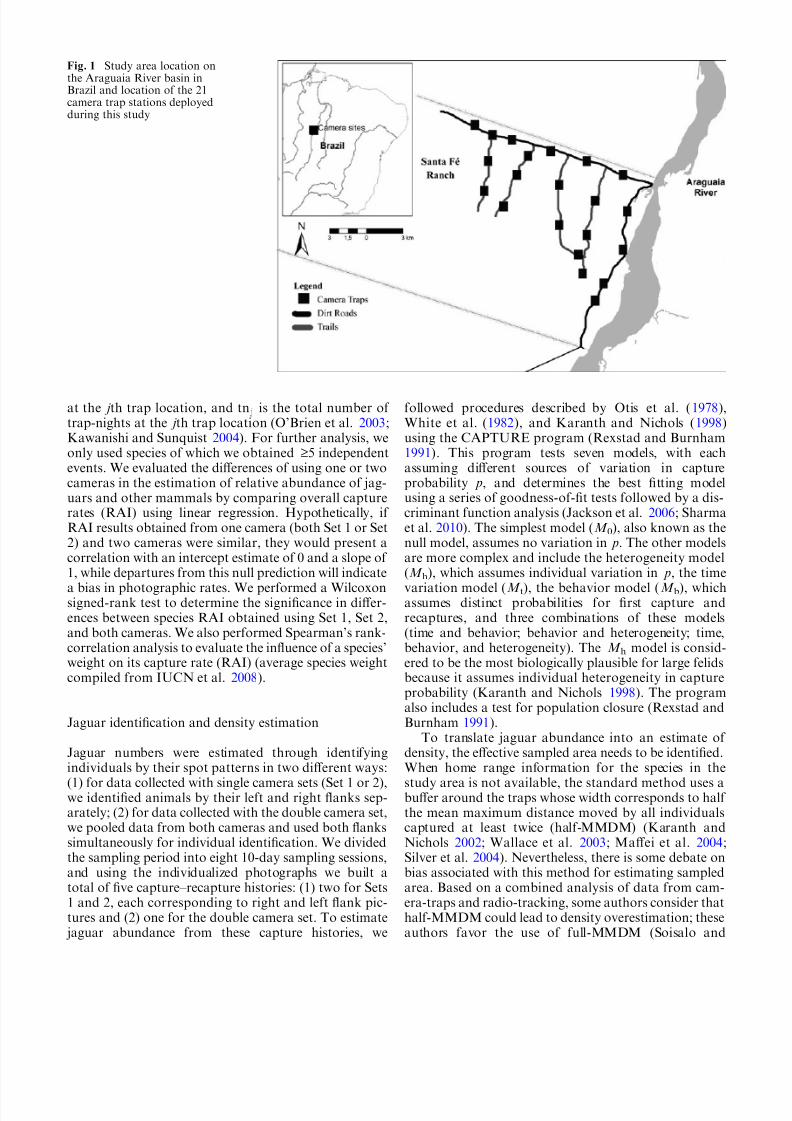
The study was carried out at Santa Fe ´ Ranch (SFR09°34¢S, 50°21¢W), a 65,000-ha beef cattle ranch in
southeastern Para ´ State (southern border of the Amazonin central Brazil), within the Araguaia River basin.Fieldwork was done in a 35,000-ha continuous patch of semi-deciduous tropical forest bordering the AraguaiaRiver, which constitutes the farm’s forest reserve(obligatory by Brazilian legislation). The rest of the farmis occupied by cattle pasture and human infrastructures(houses and offices). The climate presents a strong sea-sonality, with a characteristic rainy season from Octoberto March (1,700 mm/year on average) and a dry seasonbetween April and September.
Camera trapping
The study was conducted from September to November2007. Sampling consisted of 21 trap stations placed alongroads and trails, concentrated within the patch of tropicalforest located inside the farm’s reserve (Fig. 1). Each trapstation location was established following signs of jaguaror prey use in order to increase detection probability(Harmsen et al. 2010). The distance between stations
varied from 1.5 to 3.4 km (mean 2.9 km). The minimumhome range size of a jaguar is considered to be 10 km2
(Rabinowitz and Nottigham 1986); therefore, theoreti-cally, this design ensures that all jaguars in the sampledarea were to some extent exposed to camera-traps and thushad a probability of capture >0 (Karanth and Nichols2002; Silver 2004; Silveret al. 2004). Each station consistedof two passive infrared camera-traps (model LeafRiverC1-BU; Vibrashine, Taylorsville, MS) strapped to treesapproximately 50–70 cm above the ground (Silver 2004).The cameras were placed on each side of the roads/trails,facing each other with a lateral offset of about half a meterto avoid flash interference between them (Karanth 1995),
and were programmed to take photographs 24 h/day witha 5-min interval between consecutive photos. The state of the film and battery was checked on a regular basis(15–20 days) throughout the 80-day survey period. Foreach sampling station, cameras were assigned to Set 1 orSet 2, with Set 1 representing the first choice location thatwould have been used if only one camera trap had beenavailable, taking direct sunlight exposition and distance tothe path into account.
Photographic rates
For each photograph we recorded the species, number of individuals, date, and hour. For each species we con-sidered consecutive photos as independent records—if taken more than 1 h apart or if different individualscould be identified (O’Brien et al. 2003). We calculatedphotographic rates [relative abundance indices (RAI)]using the formula of O’Brien et al. (2003):
RAIi ¼ ðgiR jnij=R jtn jÞ Â 100 ð1Þ
where gi is an average group size for i th species, nij is thenumber of independent ‘‘detections’’ for the i th species
7/31/2019 Negroes Et Al., 2012
http://slidepdf.com/reader/full/negroes-et-al-2012 3/10
at the j th trap location, and tn j is the total number of trap-nights at the j th trap location (O’Brien et al. 2003;Kawanishi and Sunquist 2004). For further analysis, weonly used species of which we obtained ‡5 independentevents. We evaluated the differences of using one or twocameras in the estimation of relative abundance of jag-uars and other mammals by comparing overall capturerates (RAI) using linear regression. Hypothetically, if RAI results obtained from one camera (both Set 1 or Set2) and two cameras were similar, they would present acorrelation with an intercept estimate of 0 and a slope of 1, while departures from this null prediction will indicate
a bias in photographic rates. We performed a Wilcoxonsigned-rank test to determine the significance in differ-ences between species RAI obtained using Set 1, Set 2,and both cameras. We also performed Spearman’s rank-correlation analysis to evaluate the influence of a species’weight on its capture rate (RAI) (average species weightcompiled from IUCN et al. 2008).
Jaguar identification and density estimation
Jaguar numbers were estimated through identifyingindividuals by their spot patterns in two different ways:
(1) for data collected with single camera sets (Set 1 or 2),we identified animals by their left and right flanks sep-arately; (2) for data collected with the double camera set,we pooled data from both cameras and used both flankssimultaneously for individual identification. We dividedthe sampling period into eight 10-day sampling sessions,and using the individualized photographs we built atotal of five capture–recapture histories: (1) two for Sets1 and 2, each corresponding to right and left flank pic-tures and (2) one for the double camera set. To estimate jaguar abundance from these capture histories, we
followed procedures described by Otis et al. (1978),White et al. (1982), and Karanth and Nichols (1998)using the CAPTURE program (Rexstad and Burnham1991). This program tests seven models, with eachassuming different sources of variation in captureprobability p, and determines the best fitting modelusing a series of goodness-of-fit tests followed by a dis-criminant function analysis (Jackson et al. 2006; Sharmaet al. 2010). The simplest model (M 0), also known as thenull model, assumes no variation in p. The other modelsare more complex and include the heterogeneity model(M h), which assumes individual variation in p, the time
variation model (M t), the behavior model (M b), whichassumes distinct probabilities for first capture andrecaptures, and three combinations of these models(time and behavior; behavior and heterogeneity; time,behavior, and heterogeneity). The M h model is consid-ered to be the most biologically plausible for large felidsbecause it assumes individual heterogeneity in captureprobability (Karanth and Nichols 1998). The programalso includes a test for population closure (Rexstad andBurnham 1991).
To translate jaguar abundance into an estimate of density, the effective sampled area needs to be identified.When home range information for the species in the
study area is not available, the standard method uses abuffer around the traps whose width corresponds to half the mean maximum distance moved by all individualscaptured at least twice (half-MMDM) (Karanth andNichols 2002; Wallace et al. 2003; Maffei et al. 2004;Silver et al. 2004). Nevertheless, there is some debate onbias associated with this method for estimating sampledarea. Based on a combined analysis of data from cam-era-traps and radio-tracking, some authors consider thathalf-MMDM could lead to density overestimation; theseauthors favor the use of full-MMDM (Soisalo and
Fig. 1 Study area location onthe Araguaia River basin inBrazil and location of the 21camera trap stations deployedduring this study
7/31/2019 Negroes Et Al., 2012
http://slidepdf.com/reader/full/negroes-et-al-2012 4/10
Cavalcanti 2006; Dillon and Kelly 2008), while otherssuggest the opposite (Balme et al. 2009). Consequently,and for comparison reasons, both full-MMDM andhalf-MMDM (using data from all recapture individualswithin each capture history) have been computed tocalculate the effective sampled area (Karanth and Nic-hols 2002; Silver 2004; Soisalo and Cavalcanti 2006;Salom-Pe ´ rez et al. 2007; Balme et al. 2009).
We used logistic regression to evaluate the probabil-ity that any new jaguar photo was from a known (re-sponse variable = 0) or unknown individual (responsevariable = 1) as a function of the sampling event (de-fined by the eight 10-day consecutive sampling sessions).
We assessed model fit using likelihood ratio test statistics(Hosmer and Lemeshow 2000). Non-parametric statis-tics were performed employing R v.8.2 free statisticalsoftware, while linear and logistic regressions were exe-cuted using SigmaPlot 11.0 (Systat Software, San Jose,CA).
Results
Photographic rates
During a sampling effort of 1,680 camera-nights we
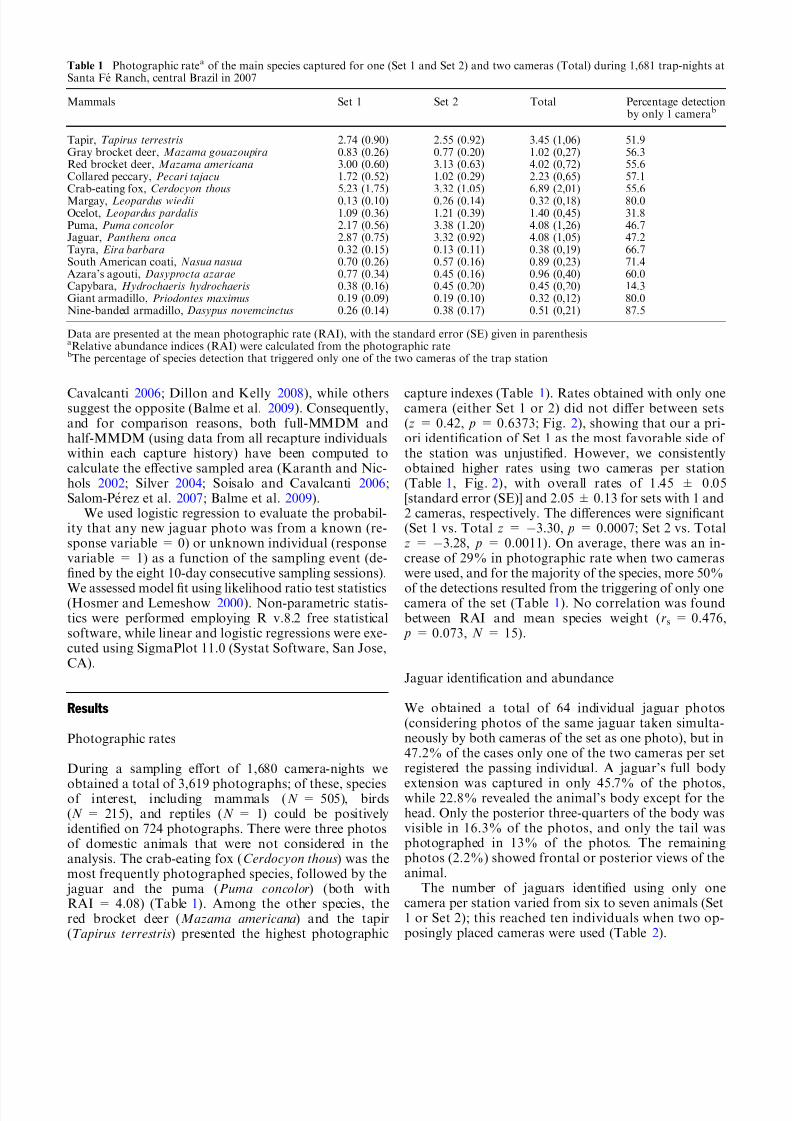
obtained a total of 3,619 photographs; of these, speciesof interest, including mammals (N = 505), birds(N = 215), and reptiles (N = 1) could be positivelyidentified on 724 photographs. There were three photosof domestic animals that were not considered in theanalysis. The crab-eating fox (Cerdocyon thous) was themost frequently photographed species, followed by the jaguar and the puma (Puma concolor) (both withRAI = 4.08) (Table 1). Among the other species, thered brocket deer (Mazama americana) and the tapir(Tapirus terrestris) presented the highest photographic
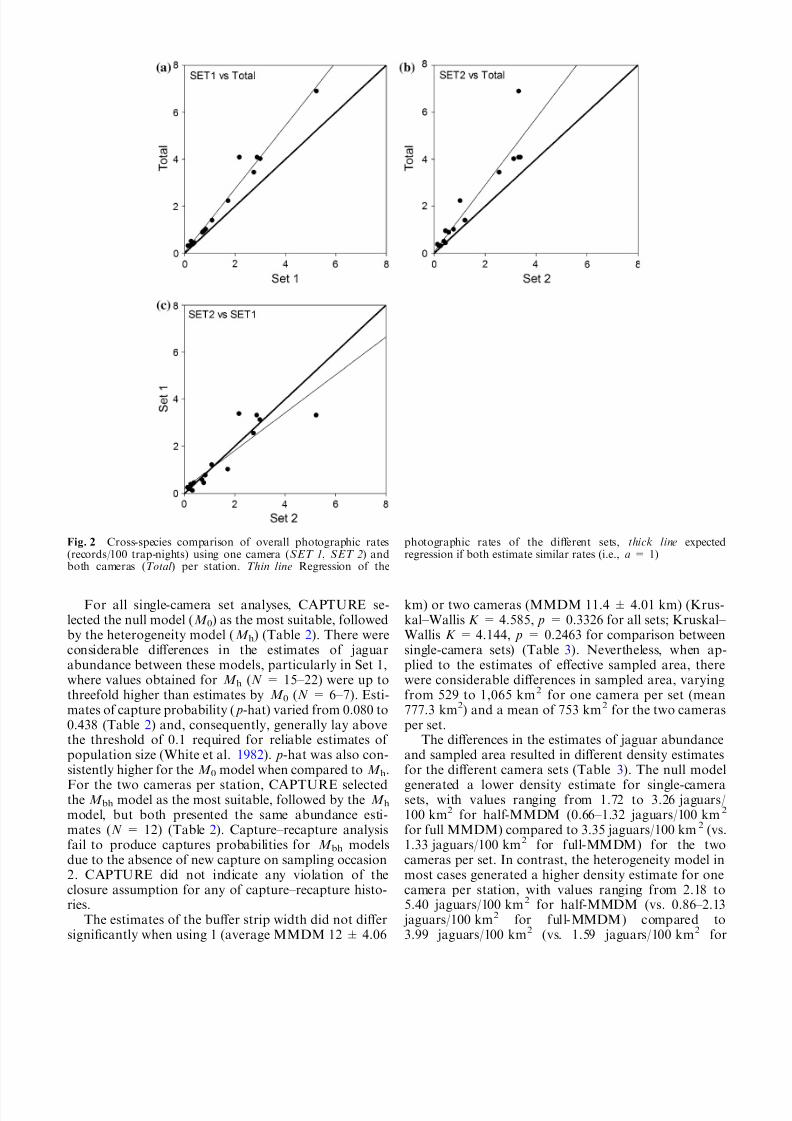
capture indexes (Table 1). Rates obtained with only onecamera (either Set 1 or 2) did not differ between sets(z = 0.42, p = 0.6373; Fig. 2), showing that our a pri-ori identification of Set 1 as the most favorable side of the station was unjustified. However, we consistentlyobtained higher rates using two cameras per station(Table 1, Fig. 2), with overall rates of 1.45 ± 0.05[standard error (SE)] and 2.05 ± 0.13 for sets with 1 and2 cameras, respectively. The differences were significant(Set 1 vs. Total z = À3.30, p = 0.0007; Set 2 vs. Totalz = À3.28, p = 0.0011). On average, there was an in-crease of 29% in photographic rate when two cameraswere used, and for the majority of the species, more 50%
of the detections resulted from the triggering of only onecamera of the set (Table 1). No correlation was foundbetween RAI and mean species weight (rs = 0.476, p = 0.073, N = 15).
Jaguar identification and abundance
We obtained a total of 64 individual jaguar photos(considering photos of the same jaguar taken simulta-neously by both cameras of the set as one photo), but in47.2% of the cases only one of the two cameras per setregistered the passing individual. A jaguar’s full body
extension was captured in only 45.7% of the photos,while 22.8% revealed the animal’s body except for thehead. Only the posterior three-quarters of the body wasvisible in 16.3% of the photos, and only the tail wasphotographed in 13% of the photos. The remainingphotos (2.2%) showed frontal or posterior views of theanimal.
The number of jaguars identified using only onecamera per station varied from six to seven animals (Set1 or Set 2); this reached ten individuals when two op-posingly placed cameras were used (Table 2).
Table 1 Photographic ratea of the main species captured for one (Set 1 and Set 2) and two cameras (Total) during 1,681 trap-nights atSanta Fe ´ Ranch, central Brazil in 2007
Mammals Set 1 Set 2 Total Percentage detectionby only 1 camerab
Tapir, Tapirus terrestris 2.74 (0.90) 2.55 (0.92) 3.45 (1,06) 51.9Gray brocket deer, Mazama gouazoupira 0.83 (0.26) 0.77 (0.20) 1.02 (0,27) 56.3Red brocket deer, Mazama americana 3.00 (0.60) 3.13 (0.63) 4.02 (0,72) 55.6Collared peccary, Pecari tajacu 1.72 (0.52) 1.02 (0.29) 2.23 (0,65) 57.1Crab-eating fox, Cerdocyon thous 5.23 (1.75) 3.32 (1.05) 6.89 (2,01) 55.6Margay, Leopardus wiedii 0.13 (0.10) 0.26 (0.14) 0.32 (0,18) 80.0Ocelot, Leopardus pardalis 1.09 (0.36) 1.21 (0.39) 1.40 (0,45) 31.8Puma, Puma concolor 2.17 (0.56) 3.38 (1.20) 4.08 (1,26) 46.7Jaguar, Panthera onca 2.87 (0.75) 3.32 (0.92) 4.08 (1,05) 47.2Tayra, Eira barbara 0.32 (0.15) 0.13 (0.11) 0.38 (0,19) 66.7South American coati, Nasua nasua 0.70 (0.26) 0.57 (0.16) 0.89 (0,23) 71.4Azara’s agouti, Dasyprocta azarae 0.77 (0.34) 0.45 (0.16) 0.96 (0,40) 60.0Capybara, Hydrochaeris hydrochaeris 0.38 (0.16) 0.45 (0.20) 0.45 (0,20) 14.3Giant armadillo, Priodontes maximus 0.19 (0.09) 0.19 (0.10) 0.32 (0,12) 80.0Nine-banded armadillo, Dasypus novemcinctus 0.26 (0.14) 0.38 (0.17) 0.51 (0,21) 87.5
Data are presented at the mean photographic rate (RAI), with the standard error (SE) given in parenthesisaRelative abundance indices (RAI) were calculated from the photographic ratebThe percentage of species detection that triggered only one of the two cameras of the trap station
7/31/2019 Negroes Et Al., 2012
http://slidepdf.com/reader/full/negroes-et-al-2012 5/10
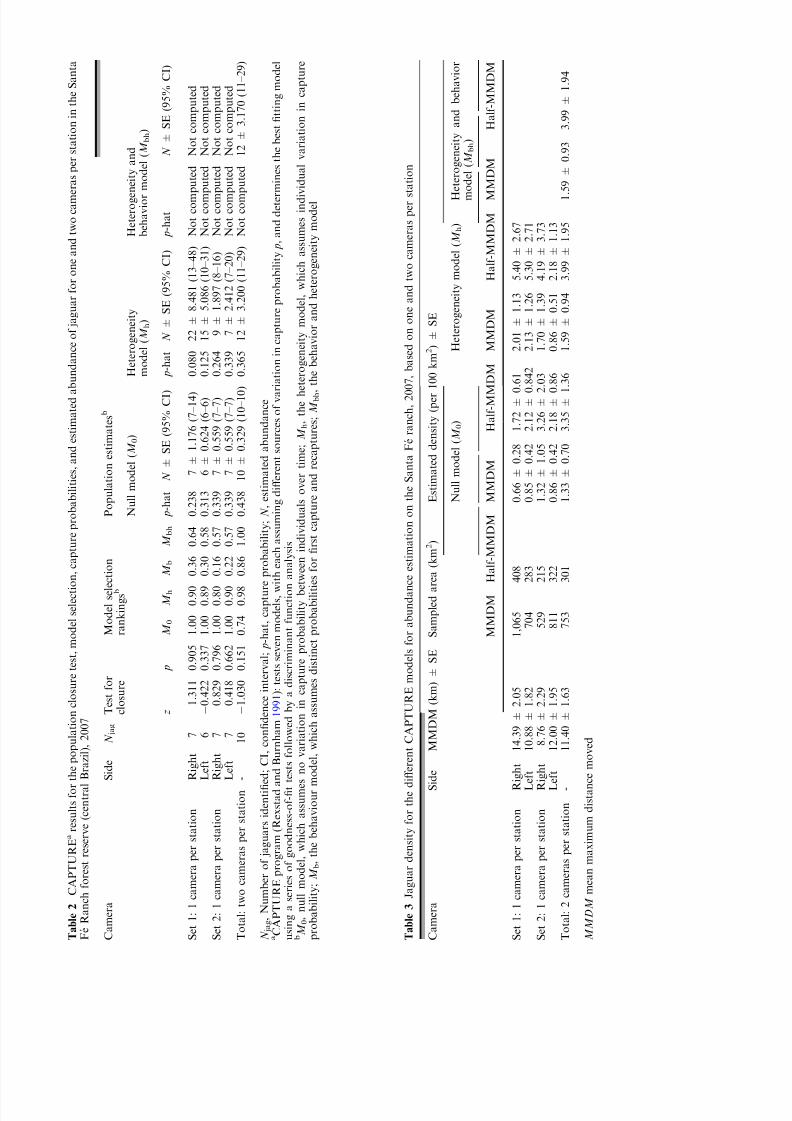
For all single-camera set analyses, CAPTURE se-lected the null model (M 0) as the most suitable, followedby the heterogeneity model (M h) (Table 2). There wereconsiderable differences in the estimates of jaguarabundance between these models, particularly in Set 1,where values obtained for M h (N = 15–22) were up tothreefold higher than estimates by M 0 (N = 6–7). Esti-mates of capture probability ( p-hat) varied from 0.080 to0.438 (Table 2) and, consequently, generally lay abovethe threshold of 0.1 required for reliable estimates of population size (White et al. 1982). p-hat was also con-sistently higher for the M 0 model when compared to M h.
For the two cameras per station, CAPTURE selectedthe M bh model as the most suitable, followed by the M hmodel, but both presented the same abundance esti-mates (N = 12) (Table 2). Capture–recapture analysisfail to produce captures probabilities for M bh modelsdue to the absence of new capture on sampling occasion2. CAPTURE did not indicate any violation of theclosure assumption for any of capture–recapture histo-ries.
The estimates of the buffer strip width did not differsignificantly when using 1 (average MMDM 12 ± 4.06
km) or two cameras (MMDM 11.4 ± 4.01 km) (Krus-kal–Wallis K = 4.585, p = 0.3326 for all sets; Kruskal– Wallis K = 4.144, p = 0.2463 for comparison betweensingle-camera sets) (Table 3). Nevertheless, when ap-plied to the estimates of effective sampled area, therewere considerable differences in sampled area, varyingfrom 529 to 1,065 km2 for one camera per set (mean777.3 km2) and a mean of 753 km2 for the two camerasper set.
The differences in the estimates of jaguar abundanceand sampled area resulted in different density estimatesfor the different camera sets (Table 3). The null model
generated a lower density estimate for single-camerasets, with values ranging from 1.72 to 3.26 jaguars/100 km2 for half-MMDM (0.66–1.32 jaguars/100 km2
for full MMDM) compared to 3.35 jaguars/100 km2 (vs.1.33 jaguars/100 km2 for full-MMDM) for the twocameras per set. In contrast, the heterogeneity model inmost cases generated a higher density estimate for onecamera per station, with values ranging from 2.18 to5.40 jaguars/100 km2 for half-MMDM (vs. 0.86–2.13 jaguars/100 km2 for full-MMDM) compared to3.99 jaguars/100 km2 (vs. 1.59 jaguars/100 km2 for
Fig. 2 Cross-species comparison of overall photographic rates(records/100 trap-nights) using one camera (SET 1, SET 2) andboth cameras (Total ) per station. Thin line Regression of the
photographic rates of the different sets, thick line expectedregression if both estimate similar rates (i.e., a = 1)
7/31/2019 Negroes Et Al., 2012
http://slidepdf.com/reader/full/negroes-et-al-2012 6/10
T a b l e 2
C A P T U R E a
r e s u l t s f o r
t h e p o p u l a t i o n c l o s u r e t e s t , m o d e l s e l e c t i o n , c a p t u r e p r o b a b i l i t i e s , a n d e s t i m a t e d a
b u n d a n c e o f j a g u a r f o r o n e a n d t w o c a m e r a s p e r s t a t i o n i n t h e S a n t a
F e ´ R a n c h f o r e s t r e s e r v e ( c e n t r a l
B r a z i l ) , 2 0 0 7
C a m e r a
S i d e
N j a g
T e s t f o r
c l o s u r e
M o d e l s e l e c t i o n
r a n k i n g s
b
P o p u l a t i o n e s t i m a t e s b
N u l l m o d e l ( M 0 )
H e t e r o g e n e i t y
m o d e l ( M h )
H e t e r o g e n e i t y a n d
b e h a v i o r
m o d e l ( M b h )
z
p
M 0
M h
M b
M b h
p - h a t N ±
S E ( 9 5 %
C I )
p - h a t N ±
S E ( 9 5 %
C I )
p - h a t
N ±
S E ( 9 5 %
C I )
S e t 1 : 1 c a m e r a p e r s t a t i o n
R i g h t
7
1 . 3 1 1
0 . 9 0 5
1 . 0 0
0 . 9 0
0 . 3 6
0 . 6 4
0 . 2 3 8
7 ±
1 . 1 7 6 ( 7 – 1 4 )
0 . 0 8 0
2 2 ±
8 . 4 8 1 ( 1 3 – 4 8 ) N o t c o m p u t e d
N o t c o m p u t e d
L e f t
6
À 0 . 4 2 2
0 . 3 3 7
1 . 0 0
0 . 8 9
0 . 3 0
0 . 5 8
0 . 3 1 3
6 ±
0 . 6 2 4 ( 6 – 6 )
0 . 1 2 5
1 5 ±
5 . 0 8 6 ( 1 0 – 3 1 ) N o t c o m p u t e d
N o t c o m p u t e d
S e t 2 : 1 c a m e r a p e r s t a t i o n
R i g h t
7
0 . 8 2 9
0 . 7 9 6
1 . 0 0
0 . 8 0
0 . 1 6
0 . 5 7
0 . 3 3 9
7 ±
0 . 5 5 9 ( 7 – 7 )
0 . 2 6 4
9 ±
1 . 8 9 7 ( 8 – 1 6 )
N o t c o m p u t e d
N o t c o m p u t e d
L e f t
7
0 . 4 1 8
0 . 6 6 2
1 . 0 0
0 . 9 0
0 . 2 2
0 . 5 7
0 . 3 3 9
7 ±
0 . 5 5 9 ( 7 – 7 )
0 . 3 3 9
7 ±
2 . 4 1 2 ( 7 – 2 0 )
N o t c o m p u t e d
N o t c o m p u t e d
T o t a l : t w o c a m e r a s p e r s t a t i o n
-
1 0
À 1 . 0 3 0
0 . 1 5 1
0 . 7 4
0 . 9 8
0 . 8 6
1 . 0 0
0 . 4 3 8
1 0 ±
0 . 3 2 9 ( 1 0 – 1 0 ) 0 . 3 6 5
1 2 ±
3 . 2 0 0 ( 1 1 – 2 9 ) N o t c o m p u t e d
1 2 ±
3 . 1 7 0 ( 1 1 – 2 9 )
N j a g , N u m b e r o f j a g u a r s i d e n t i fi e d ; C I , c o n fi d e n c e i n t e r v a l ; p - h a t , c a p t u r e p r o b a b i l i t y ; N , e s t i m a t e d a b u n d a n c e
a C A P T U R E p r o g r a m ( R e x s t a d a
n d B u r n h a m 1 9 9 1 ) : t e s t s s e v e n m o d e l s , w
i t h e a c h a s s u m i n g d i ff e r e n t s o u r c e s o f v a r i a t i o n i n c a p t u r e p r o b a b i l i t y p , a n d d e t e r m i n e s t h e b e s t fi t t i n g m o d e l
u s i n g a s e r i e s o f g o o d n e s s - o f - fi t t e s t s f o l l o w e d b y a d i s c r i m i n a n t f u n c t i o n
a n a l y s i s
b M 0 , n u l l m o d e l , w h i c h a s s u m e s n o v a r i a t i o n i n c a p t u r e p r o b a b i l i t y b e
t w e e n i n d i v i d u a l s o v e r t i m e ; M h , t h e h e t e r o g e n e i t y m o d e l , w h i c h a s s u m e s i n d i v i d u a l v a r i a t i o n i n c a p t u r e
p r o b a b i l i t y ; M b , t h e b e h a v i o u r m
o d e l , w h i c h a s s u m e s d i s t i n c t p r o b a b i l i t i e s f o r fi r s t c a p t u r e a n d r e c a p t u r e s ; M b h ,
t h e b e h a v i o r a n d h e t e r o g e n e i t y m o d e l
T a b l e 3
J a g u a r d e n s i t y f o r t h e d
i ff e r e n t C A P T U R E m o d e l s f o r a b u n d a n
c e e s t i m a t i o n o n t h e S a n t a F e ´ r a n c h , 2 0 0 7 , b a s e d o n o n e a n d t w o c a m e r a s p e r s t a t i o n
C a m e r a
S i d e
M M D M
( k m ) ±
S E
S a m p l e d a r e a ( k m
2 )
E s t i m a t e d d e n s i t y ( p e r 1 0 0 k m
2 ) ±
S E
N u l l m o d e l ( M 0 )
H e t e r o g e n e i t y m o d e l ( M h )
H
e t e r o g e n e i t y a n d b e h a v i o r
m
o d e l ( M b h )
M M D M
H a l f - M M D M
M M D M
H a l f - M M
D M
M M D M
H a l f - M M D M
M
M D M
H a l f - M M D M
S e t 1 : 1 c a m e r a p e r s t a t i o n
R i g h t
1 4 . 3 9 ±
2 . 0 5
1 , 0 6 5
4 0 8
0 . 6 6 ±
0 . 2 8
1 . 7 2 ± 0
. 6 1
2 . 0 1 ±
1 . 1 3
5 . 4 0 ±
2 . 6 7
L e f t
1 0 . 8 8 ±
1 . 8 2
7 0 4
2 8 3
0 . 8 5 ±
0 . 4 2
2 . 1 2 ± 0
. 8 4 2
2 . 1 3 ±
1 . 2 6
5 . 3 0 ±
2 . 7 1
S e t 2 : 1 c a m e r a p e r s t a t i o n
R i g h t
8 . 7 6 ±
2 . 2 9
5 2 9
2 1 5
1 . 3 2 ±
1 . 0 5
3 . 2 6 ± 2
. 0 3
1 . 7 0 ±
1 . 3 9
4 . 1 9 ±
3 . 7 3
L e f t
1 2 . 0 0 ±
1 . 9 5
8 1 1
3 2 2
0 . 8 6 ±
0 . 4 2
2 . 1 8 ± 0
. 8 6
0 . 8 6 ±
0 . 5 1
2 . 1 8 ±
1 . 1 3
T o t a l : 2 c a m e r a s p e r s t a t i o n -
1 1 . 4 0 ±
1 . 6 3
7 5 3
3 0 1
1 . 3 3 ±
0 . 7 0
3 . 3 5 ± 1
. 3 6
1 . 5 9 ±
0 . 9 4
3 . 9 9 ±
1 . 9 5
1 . 5 9 ±
0 . 9 3
3 . 9 9 ±
1 . 9 4
M M D M m e a n m a x i m u m d i s t a n c e m o v e d
7/31/2019 Negroes Et Al., 2012
http://slidepdf.com/reader/full/negroes-et-al-2012 7/10
full-MMDM) computed for two cameras per set. Thislast estimate for two cameras per station matched thedensity computed for the M bh model.
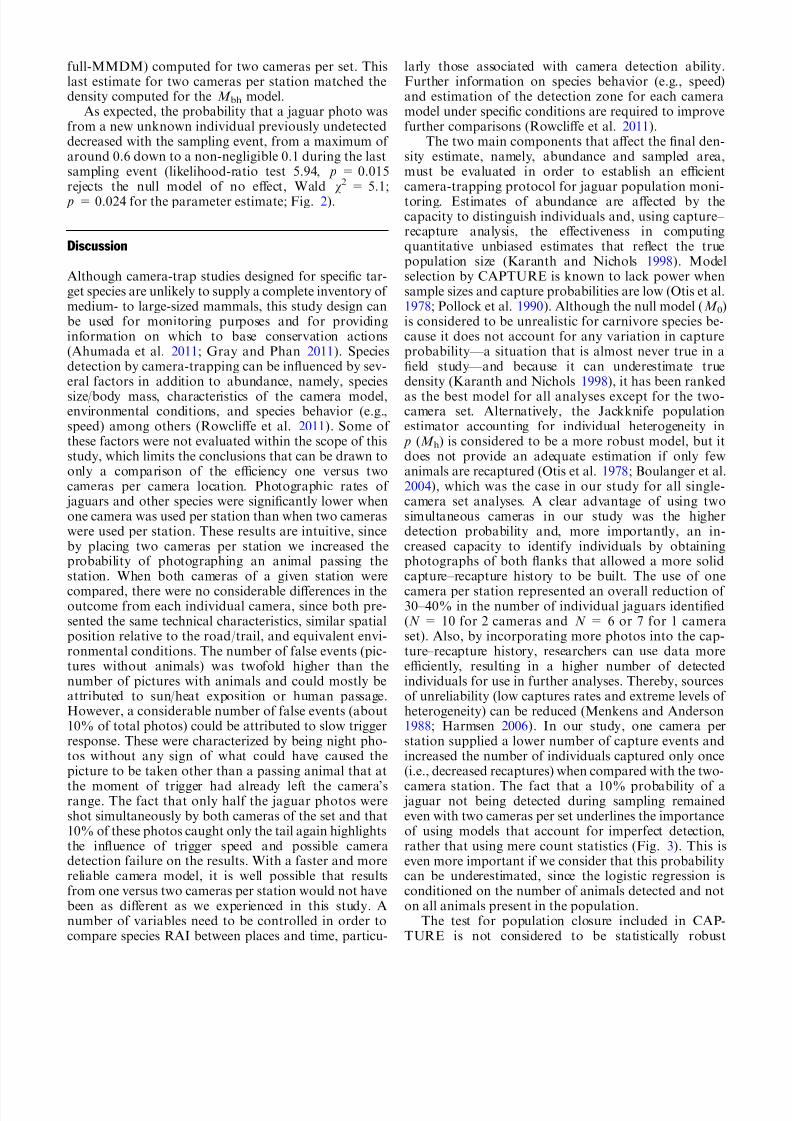
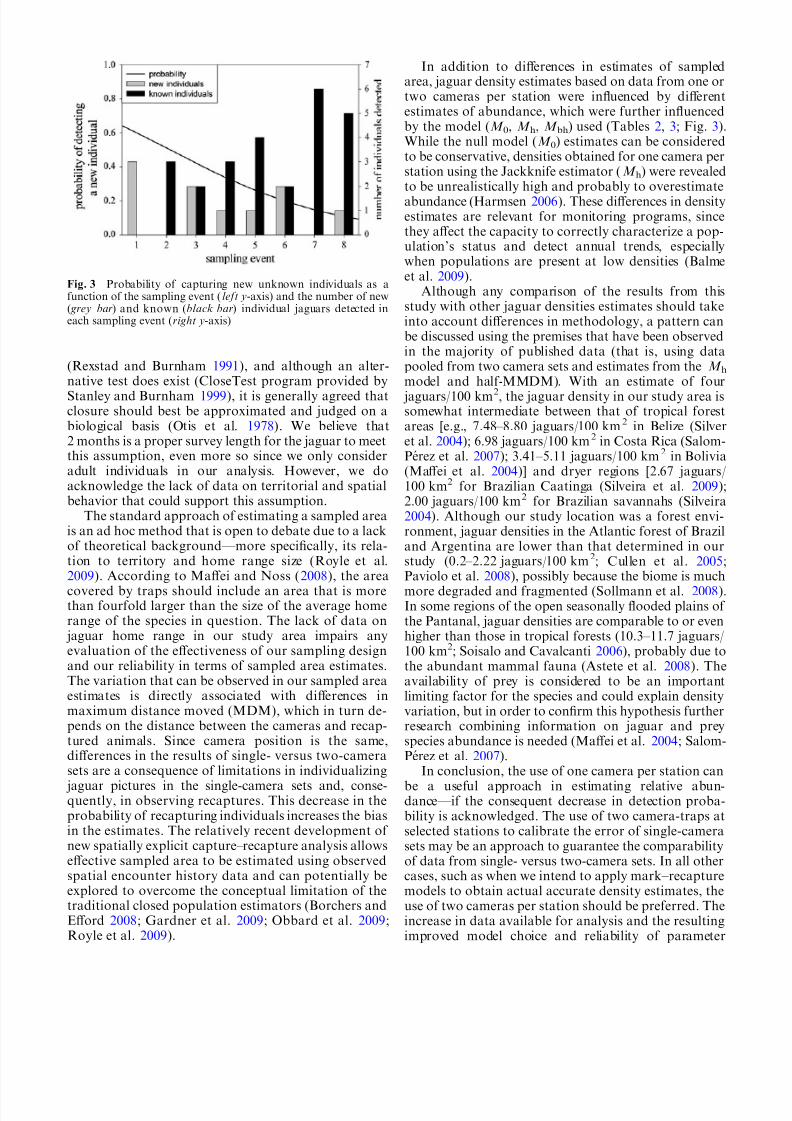
As expected, the probability that a jaguar photo wasfrom a new unknown individual previously undetecteddecreased with the sampling event, from a maximum of around 0.6 down to a non-negligible 0.1 during the lastsampling event (likelihood-ratio test 5.94, p = 0.015rejects the null model of no effect, Wald v
2 = 5.1; p = 0.024 for the parameter estimate; Fig. 2).
Discussion
Although camera-trap studies designed for specific tar-get species are unlikely to supply a complete inventory of medium- to large-sized mammals, this study design canbe used for monitoring purposes and for providinginformation on which to base conservation actions(Ahumada et al. 2011; Gray and Phan 2011). Speciesdetection by camera-trapping can be influenced by sev-eral factors in addition to abundance, namely, species
size/body mass, characteristics of the camera model,environmental conditions, and species behavior (e.g.,speed) among others (Rowcliffe et al. 2011). Some of these factors were not evaluated within the scope of thisstudy, which limits the conclusions that can be drawn toonly a comparison of the efficiency one versus twocameras per camera location. Photographic rates of jaguars and other species were significantly lower whenone camera was used per station than when two cameraswere used per station. These results are intuitive, sinceby placing two cameras per station we increased theprobability of photographing an animal passing thestation. When both cameras of a given station were
compared, there were no considerable differences in theoutcome from each individual camera, since both pre-sented the same technical characteristics, similar spatialposition relative to the road/trail, and equivalent envi-ronmental conditions. The number of false events (pic-tures without animals) was twofold higher than thenumber of pictures with animals and could mostly beattributed to sun/heat exposition or human passage.However, a considerable number of false events (about10% of total photos) could be attributed to slow triggerresponse. These were characterized by being night pho-tos without any sign of what could have caused thepicture to be taken other than a passing animal that at
the moment of trigger had already left the camera’srange. The fact that only half the jaguar photos wereshot simultaneously by both cameras of the set and that10% of these photos caught only the tail again highlightsthe influence of trigger speed and possible cameradetection failure on the results. With a faster and morereliable camera model, it is well possible that resultsfrom one versus two cameras per station would not havebeen as different as we experienced in this study. Anumber of variables need to be controlled in order tocompare species RAI between places and time, particu-
larly those associated with camera detection ability.Further information on species behavior (e.g., speed)and estimation of the detection zone for each cameramodel under specific conditions are required to improvefurther comparisons (Rowcliffe et al. 2011).
The two main components that affect the final den-sity estimate, namely, abundance and sampled area,must be evaluated in order to establish an efficientcamera-trapping protocol for jaguar population moni-toring. Estimates of abundance are affected by thecapacity to distinguish individuals and, using capture– recapture analysis, the effectiveness in computingquantitative unbiased estimates that reflect the truepopulation size (Karanth and Nichols 1998). Modelselection by CAPTURE is known to lack power whensample sizes and capture probabilities are low (Otis et al.1978; Pollock et al. 1990). Although the null model (M 0)is considered to be unrealistic for carnivore species be-cause it does not account for any variation in captureprobability—a situation that is almost never true in afield study—and because it can underestimate truedensity (Karanth and Nichols 1998), it has been ranked
as the best model for all analyses except for the two-camera set. Alternatively, the Jackknife populationestimator accounting for individual heterogeneity in p (M h) is considered to be a more robust model, but itdoes not provide an adequate estimation if only fewanimals are recaptured (Otis et al. 1978; Boulanger et al.2004), which was the case in our study for all single-camera set analyses. A clear advantage of using twosimultaneous cameras in our study was the higherdetection probability and, more importantly, an in-creased capacity to identify individuals by obtainingphotographs of both flanks that allowed a more solidcapture–recapture history to be built. The use of one
camera per station represented an overall reduction of 30–40% in the number of individual jaguars identified(N = 10 for 2 cameras and N = 6 or 7 for 1 cameraset). Also, by incorporating more photos into the cap-ture–recapture history, researchers can use data moreefficiently, resulting in a higher number of detectedindividuals for use in further analyses. Thereby, sourcesof unreliability (low captures rates and extreme levels of heterogeneity) can be reduced (Menkens and Anderson1988; Harmsen 2006). In our study, one camera perstation supplied a lower number of capture events andincreased the number of individuals captured only once(i.e., decreased recaptures) when compared with the two-
camera station. The fact that a 10% probability of a jaguar not being detected during sampling remainedeven with two cameras per set underlines the importanceof using models that account for imperfect detection,rather that using mere count statistics (Fig. 3). This iseven more important if we consider that this probabilitycan be underestimated, since the logistic regression isconditioned on the number of animals detected and noton all animals present in the population.
The test for population closure included in CAP-TURE is not considered to be statistically robust
7/31/2019 Negroes Et Al., 2012
http://slidepdf.com/reader/full/negroes-et-al-2012 8/10
(Rexstad and Burnham 1991), and although an alter-native test does exist (CloseTest program provided by
Stanley and Burnham 1999), it is generally agreed thatclosure should best be approximated and judged on abiological basis (Otis et al. 1978). We believe that2 months is a proper survey length for the jaguar to meetthis assumption, even more so since we only consideradult individuals in our analysis. However, we doacknowledge the lack of data on territorial and spatialbehavior that could support this assumption.
The standard approach of estimating a sampled areais an ad hoc method that is open to debate due to a lackof theoretical background—more specifically, its rela-tion to territory and home range size (Royle et al.2009). According to Maffei and Noss (2008), the area
covered by traps should include an area that is morethan fourfold larger than the size of the average homerange of the species in question. The lack of data on jaguar home range in our study area impairs anyevaluation of the effectiveness of our sampling designand our reliability in terms of sampled area estimates.The variation that can be observed in our sampled areaestimates is directly associated with differences inmaximum distance moved (MDM), which in turn de-pends on the distance between the cameras and recap-tured animals. Since camera position is the same,differences in the results of single- versus two-camerasets are a consequence of limitations in individualizing
jaguar pictures in the single-camera sets and, conse-quently, in observing recaptures. This decrease in theprobability of recapturing individuals increases the biasin the estimates. The relatively recent development of new spatially explicit capture–recapture analysis allowseffective sampled area to be estimated using observedspatial encounter history data and can potentially beexplored to overcome the conceptual limitation of thetraditional closed population estimators (Borchers andEfford 2008; Gardner et al. 2009; Obbard et al. 2009;Royle et al. 2009).
In addition to differences in estimates of sampledarea, jaguar density estimates based on data from one ortwo cameras per station were influenced by differentestimates of abundance, which were further influencedby the model (M 0, M h, M bh) used (Tables 2, 3; Fig. 3).While the null model (M 0) estimates can be consideredto be conservative, densities obtained for one camera perstation using the Jackknife estimator (M h) were revealedto be unrealistically high and probably to overestimateabundance (Harmsen 2006). These differences in densityestimates are relevant for monitoring programs, sincethey affect the capacity to correctly characterize a pop-ulation’s status and detect annual trends, especiallywhen populations are present at low densities (Balmeet al. 2009).
Although any comparison of the results from thisstudy with other jaguar densities estimates should takeinto account differences in methodology, a pattern canbe discussed using the premises that have been observedin the majority of published data (that is, using datapooled from two camera sets and estimates from the M hmodel and half-MMDM). With an estimate of four
jaguars/100 km2, the jaguar density in our study area issomewhat intermediate between that of tropical forestareas [e.g., 7.48–8.80 jaguars/100 km2 in Belize (Silveret al. 2004); 6.98 jaguars/100 km2 in Costa Rica (Salom-Perez et al. 2007); 3.41–5.11 jaguars/100 km2 in Bolivia(Maffei et al. 2004)] and dryer regions [2.67 jaguars/100 km2 for Brazilian Caatinga (Silveira et al. 2009);2.00 jaguars/100 km2 for Brazilian savannahs (Silveira2004). Although our study location was a forest envi-ronment, jaguar densities in the Atlantic forest of Braziland Argentina are lower than that determined in ourstudy (0.2–2.22 jaguars/100 km2; Cullen et al. 2005;Paviolo et al. 2008), possibly because the biome is much
more degraded and fragmented (Sollmann et al. 2008).In some regions of the open seasonally flooded plains of the Pantanal, jaguar densities are comparable to or evenhigher than those in tropical forests (10.3–11.7 jaguars/100 km2; Soisalo and Cavalcanti 2006), probably due tothe abundant mammal fauna (Astete et al. 2008). Theavailability of prey is considered to be an importantlimiting factor for the species and could explain densityvariation, but in order to confirm this hypothesis furtherresearch combining information on jaguar and preyspecies abundance is needed (Maffei et al. 2004; Salom-Perez et al. 2007).
In conclusion, the use of one camera per station can
be a useful approach in estimating relative abun-dance—if the consequent decrease in detection proba-bility is acknowledged. The use of two camera-traps atselected stations to calibrate the error of single-camerasets may be an approach to guarantee the comparabilityof data from single- versus two-camera sets. In all othercases, such as when we intend to apply mark–recapturemodels to obtain actual accurate density estimates, theuse of two cameras per station should be preferred. Theincrease in data available for analysis and the resultingimproved model choice and reliability of parameter
Fig. 3 Probability of capturing new unknown individuals as afunction of the sampling event (left y-axis) and the number of new( grey bar) and known (black bar) individual jaguars detected ineach sampling event (right y-axis)
7/31/2019 Negroes Et Al., 2012
http://slidepdf.com/reader/full/negroes-et-al-2012 9/10
estimates are especially important when dealing with arare and cryptic species that will almost inevitably yielda low sample size, even with the best sampling designpossible. When designing a study, researchers shouldlocate stations on roads and well-established open trails(Harmsen et al. 2010). When available, site-specificinformation on jaguar home range size should be con-sidered for deciding on the spacing of cameras, and auniform sampling design should be established that al-lows possible exploration of a new spatially explicitcapture–recapture analysis as an alternative to the tra-ditional one (Royle et al. 2009).
Camera-trapping, although limited by various meth-odological constraints, has proved to be a useful tool foraccessing the density of several large carnivore species;as such, it has provided valuable data that have beenused to evaluate the success of conservation efforts andhuman impact on natural populations. However, smalldatasets, which are likely to arise from sampling rareand cryptic species, can cause erroneous model selectionfor the estimation of abundance, as well as lead to biasedestimates of spatial parameters (here the MDM). Both
aspects largely influence the final density estimate. Fur-ther, insufficient data can lead to estimates that lack thereliability needed for management decisions or biologi-cal inference. Here, we show that for the jaguar, which isa species of conservation concern, the use of two cameratraps per sampling station has clear advantages over theuse of single-camera stations and that the former shouldbe used whenever possible to achieve reasonable levels of reliability in parameter estimates. Additional studiesshould be performed to further optimize this method,particularly in the setting of spatially explicit capture– recapture approaches that could overcome standardmethodological constraints.
The Brazilian Amazon basin is suffering from in-creased human pressure due to deforestation, which isespecially evident at the southern border of the Amazon,where it merges with the Cerrado savannahs—an areacalled the arc of deforestation. Here, the agriculturalfrontier is moving into the Amazon forest, leaving thelandscape extremely fragmented. Although the estab-lishment of protected areas (PA) has increased in recentyears (Schulman et al. 2007), these may not be enough tosecure jaguar population dynamics at a larger scale. Theimportance of private forest reserves for landscape-scale jaguar conservation is highlighted by our results, giventhat they can sustain considerable densities of this spe-
cies, and others. Especially in the context of fragmen-tation, these reserves can also play an important role inlandscape connectivity when considering a meta-popu-lation structure for the jaguar. Understanding this spe-cies’ population status and landscape use, not onlyinside PA, is essential in order to establish national andregional management plans.
Acknowledgments Financial support was provided by the JaguarConservation Fund, Ideawild, and the Center for Knowledge inTropical Biodiversity. Fundaca ˜o para a Ciencia e Tecnologia
(FCT-MCT) provided Nuno Negro ˜ es with a PhD grant (SRFH/BD/23894/2005). We are indebted with Marcos Mariani fromFazenda Santa Fe ´ for permission to study on his property as well asfor the logistic support to carry out our study. We are also gratefulto Pedro Sarmento for reviewing and commenting on an early draftand to the two anonymous reviewers whose comments helped im-prove the quality of the paper.
References
Ahumada JA, Silva CEF, Gajapersad K, Hallam C, Hurtado J,Martin E, McWilliam A, Mugerwa B, O’Brien TG, Rovero F,Sheil D, Spironello WR, Winarni N, Andelman SJ (2011)Community structure and diversity of tropical forest mammals:data from a global camera trap network. Philos Trans R Soc B366:2703–2711
Astete S, Sollmann R, Silveira L (2008) Comparative jaguar ecol-ogy in Brazil. Cat News 4:9–14
Balme GA, Hunter LTB, Slotow R (2009) Evaluating methods forcounting cryptic carnivores. J Wildl Manag 73:433–441
Borchers DL, Efford MG (2008) Spatially explicit maximum like-lihood methods for capture–recapture studies. Biometrics64:377–385
Boulanger J, Stenhouse G, Munro R (2004) Sources of heteroge-
neity bias when DNA mark-recapture sampling methods areapplied to grizzly bear (Ursus arctos) populations. J Mammal85:618–624
Cullen L Jr, Abreu KC, Sana D, Nava AFD (2005) Jaguars aslandscape detectives for the upper Parana ´ River corridor,Brazil. Natureza e Conservaca ˜o 3:147–161
Dillon A, Kelly MJ (2007) Ocelot Leopardus pardalis in Belize: theimpact of trap spacing and distance moved on density esti-mates. Oryx 41:469–477
Dillon A, Kelly MJ (2008) Ocelot home range, overlap and density:comparing radio telemetry with camera trapping. J Zool275:391–398
Gardner B, Royle JA, Wegan MT (2009) Hierarchical models forestimating density from DNA mark–recapture studies. Ecology90:1106–1115
Gray TNE, Phan C (2011) Habit preferences and activity patterns
of the larger mammal community in Phnom Prich WildlifeSanctuary, Cambodia. Raffles Bull Zool 59:311–318Harmsen BJ (2006) The use of camera traps for estimating abun-
dance and studying the ecology of jaguars ( Panthera onca). PhDdissertation, University of Southampton, Southhampton
Harmsen BJ, Foster RJ, Silver S, Ostro L, Doncaster CP (2010)Differential use of trails by forest mammals and the implica-tions for camera-trap studies: a case study from Belize. Bio-tropica 42:126–133
Hernandez F, Rollins D, Cantu R (1997) An evaluation of Trail-master camera systems for identifying ground-nest predators.Wildl Soc Bull 25:848–853
Hosmer DW, Lemeshow S (2000) Applied logistic regression. Wi-ley, New York
IUCN, Conservation International, Arizona State University,Texas A & M University, University of Rome, University of
Virginia, Zoological Society London (2008) An analysis of mammals on the 2008 IUCN Red List. http://www.iucnredlist.org/mammals. Downloaded on 9 October 2008
Jackson RM, Roe JD, Wangchuk R, Hunter DO (2006) Estimatingsnow leopard population abundances using photography andcapture–recapture techniques. Wildl Soc Bull 34:772–781
Johnson A, Vongkhamheng C, Hedemark M, Saithongdam T(2006) Effects of human–carnivore conflict on tiger (Pantheratigris) and prey population in Lao PDR. Anim Conserv9:421–430
Karanth KU (1995) Estimating tiger Panthera tigris populationsfrom camera-trap data using capture–recapture models. BiolConserv 71:333–338
7/31/2019 Negroes Et Al., 2012
http://slidepdf.com/reader/full/negroes-et-al-2012 10/10
Karanth KU, Nichols JD (1998) Estimating tiger (Panthera tigris)populations form camera-trap data using capture–recaptures.Ecology 79:2852–2862
Karanth KU, Nichols JD (2002) Monitoring tigers and their prey.A manual for researchers, managers and conservationists intropical Asia. Center for Wildlife Studies, Bangalore
Karanth KU, Nichols JD, Seidensticker J, Dinerstein E, SmithJLD, McDougal C, Johnsingh AJT, Chundawat RS, Thapar V(2003) Science deficiency in conservation in practice: the mon-itoring of tiger populations in India. Anim Conserv 6:141–146
Karanth KU, Nichols JD, Kumar NS, Hines JE (2006) Assessing
tiger population dynamics using photographic capture–re-capture sampling. Ecology 87:2925–2937
Kawanishi K, Sunquist ME (2004) Conservation status of tigers ina primary rainforest of Peninsular Malaysia. Biol Conserv120:329–344
Kelly MJ (2008) Design, evaluate, refine: camera trap studies forelusive species. Anim Conserv 11:182–184
Linkie M, Chapron G, Martyr DJ, Holden J, Leader-Williams N(2006) Assessing the viability of tiger sub-populations in afragmented landscape. J Appl Ecol 43:576–586
Maffei L, Noss AJ (2008) How small is too small? Camera trapsurvey areas and density estimates for ocelots in the BolivianChaco. Biotropica 40:71–75
Maffei L, Cuellar E, Noss AJ (2004) One thousand jaguars (Pan-thera onca) in Bolivian Chaco? Camera trapping in the Kaa-IyaNational Park. J Zool 262:295–304
Menkens GE, Anderson SH (1988) Estimation of small-mammalpopulation size. Ecology 69:1952–1959
Negro ˜ es N, Sarmento P, Cruz J, Eira C, Revilla E, Fonseca C,Sollmann R, Torres NM, Furtado MM, Ja ´ como ATA, SilveiraL (2010) The use of camera trapping to estimate puma (Pumaconcolor) density and influencing factors in a forest habitat of Central Brazil. J Wildl Manag 74(6):1195–1203
Negro ˜ es N, Revilla E, Fonseca C, Soares AMVM, Ja ´ como ATA,Silveira L (2011) Private forest reserves can aid in preserving thecommunity of medium and large-sized vertebrates in theAmazon arc of deforestation. Biodivers Conserv 20:505–518
O¢Brien T, Kinnard MF, Wibisono HT (2003) Crouching tigers,hidden prey: Sumatran tiger and prey populations in a tropicalforest landscape. Anim Conserv 6:131–139
Obbard ME, Howe EJ, Kyle CJ (2009) Empirical comparison of density estimators for large carnivores. J Appl Ecol 47:76–84
Otis DL, Burnham KP, White GC, Anderson DR (1978) Statisticalinference from capture data on close population. Wildl Monogr62:1–135
Paviolo A, De Angelo CD, Di Blanco YE, Di Bitetti MS (2008)Jaguar Panthera onca population decline in the Upper Parana ´Atlantic Forest of Argentina and Brazil. Oryx 42:554–561
Pollock KH, Nichols JD, Brownie C, Hines JE (1990) Statisticalinference for capture–recapture experiments. Wildl Monogr107:1–97
Rabinowitz AR Jr, Nottigham BG (1986) Ecology and behaviourof the jaguar (Panthera onca) in Belize, Central America. J Zool210:149–159
Rexstad E, Burnham KP (1991) User’s guide for interpretativeprogram CAPTURE. Colorado Cooperative Fish and WildlifeResearch Unit, Colorado State University, Fort Collins
Rowcliffe JM, Carbone C (2008) Surveys using camera traps: are
we looking to a brighter future? Anim Conserv 11:185–186
Rowcliffe JM, Carbone C, Jansen PA, Kays R, Kranstauber B(2011) Quantifying the sensitivity of camera traps: an adapteddistance sampling approach. Methods Ecol Evol 2:464–476
Royle JA, Karanth KU, Gopalaswamy AM, Kumar NS (2009)Bayesian inference in camera trapping studies for a class of spatial capture–recapture models. Ecology 90:3233–3244
Salom-Pe ´ rez R, Carrillo E, Sa ´ ens JC, Mora M (2007) Criticalcondition of the jaguar in Corcovado National Park, CostaRica. Oryx 41:51–56
Sanderson EW, Redford RH, Chetkiewicz CB, Medellin R, Rabi-nowitz A, Robinson J, Taber A (2002) Planning to save a
species: the jaguar as a model. Conserv Biol 16:58–72Sarmento P, Cruz J, Eira C, Fonseca C (2010) Habitat selection
and abundance of common genets Genetta genetta using cameracapture–mark–recapture data. Eur J Wildl Res 56:59–66
Schulman L, Ruokolainen K, Junikka L, Saaksjarvi IE, Salo M, Ju-vonen S-K, Salo J, Higgins M (2007) Amazonian biodiversity andprotected areas: do they meet? Biodivers Conserv 16:3011–3051
Sharma RK, Jhala Y, Quershi Q, Vattakaven J, Gopal R, Noyak K(2010) Evaluating capture–recapture population and densityestimation of tigers in a population with known parameters.Anim Conserv 13:94–101
Silveira L (2004) Ecologia comparada e conservaca ˜o da onca-pintada(Panthera onca) e onca-parda (Puma concolor), no Cerrado ePantanal. PhD dissertation University of Brazilia, Brazilia
Silveira L, Ja ´ como ATA, Diniz-Filho JAF (2003) Camera trap, linetransect census and track surveys: a comparative evaluation.
Biol Conserv 114:351–355Silveira L, Jacomo ATA, Astete S, Sollmann R, Torres NM,
Furtado MM, Marinho-Filho J (2009) Jaguar density in theCaatinga of Northeastern Brazil. Oryx 44:104–109
Silver S (2004) Assessing jaguar abundance using remotely trig-gered cameras. Wildlife Conservation Society, New York
Silver S, Ostro LE, Marsh LK, Maffei L, Noss AJ, Kelly MJ,Wallace RB, Go ´ mez H, Ayala G (2004) The use of camera trapsfor estimating jaguar Panthera onca abundance and densityusing capture/recapture analysis. Oryx 38:148–154
Soisalo MK, Cavalcanti SMC (2006) Estimating the density of a jaguar population in the Brazilian Pantanal using camera-trapsand capture–recapture sampling in combination with GPSradio-telemetry. Biol Conserv 129:487–496
Sollmann R, Torres NM, Silveira L (2008) Jaguar conservation inBrazil: the role of protected areas. Cat News 4:15–20
Stanley TR, Burnham KP (1999) A closure test for time-specificcapture–recapture data. Environ Ecol Stat 6:197–209
Tobler MW, Carrillo-Percastegui SE, Leite Pitman R, Mares R,Powell G (2008) An evaluation of camera traps for inventoryinglarge- and medium size terrestrial forest mammals. AnimConserv 11:169–178
Trolle M (2003) Mammal survey in the southeastern Pantanal,Brazil. Biodivers Conserv 12:823–836
TrolleM, Ke ´ ry M (2005)Camera-trap study of ocelotand other secretivemammals in the northern Pantanal. Mammalia 69:409–416
Wallace RB, Gomez H, Ayala G, Espinoza F (2003) Cameratrapping for jaguar (Panthera onca) in the Tuichi Valley, Boli-via. Mastozool Neotrop 10:5–11
White GC, Anderson DR, Burnham, KP, Otis DL (1982) Capture– recapture and removal methods for sampling closed popula-tions. Los Alamos National Laboratory Publication LA-8787-
NERP. Los Alamos National Laboratory, Los Alamos