Embed Size (px)
Citation preview
NEEM Manufactured Homes
Field Test Results
David Baylon, Ecotope
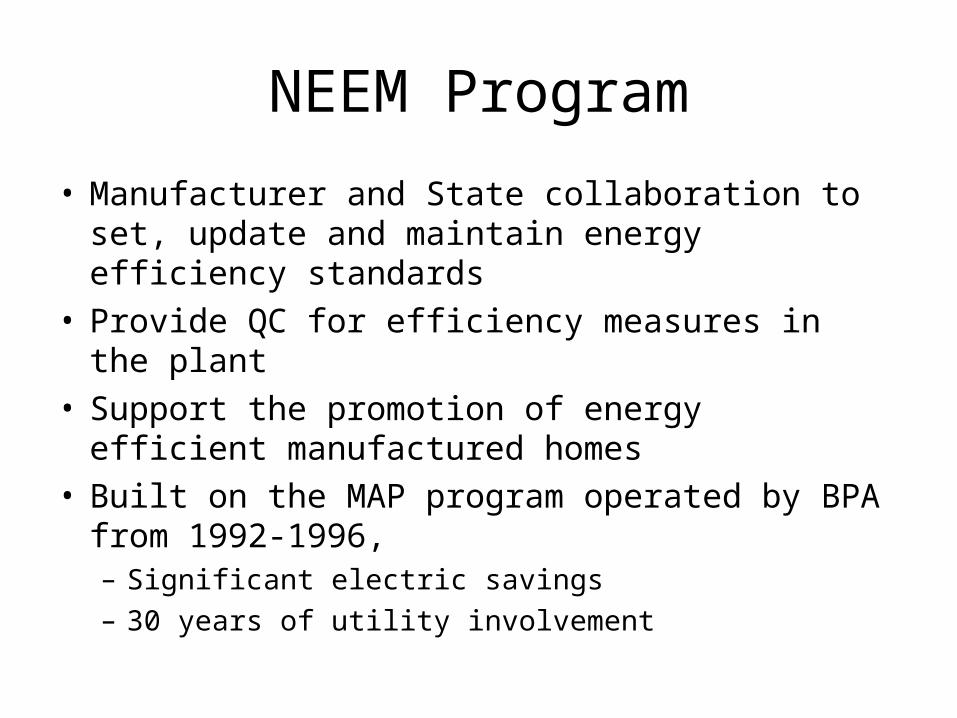
NEEM Program
• Manufacturer and State collaboration to set, update and maintain energy efficiency standards
• Provide QC for efficiency measures in the plant• Support the promotion of energy efficient
manufactured homes• Built on the MAP program operated by BPA from
1992-1996, – Significant electric savings– 30 years of utility involvement
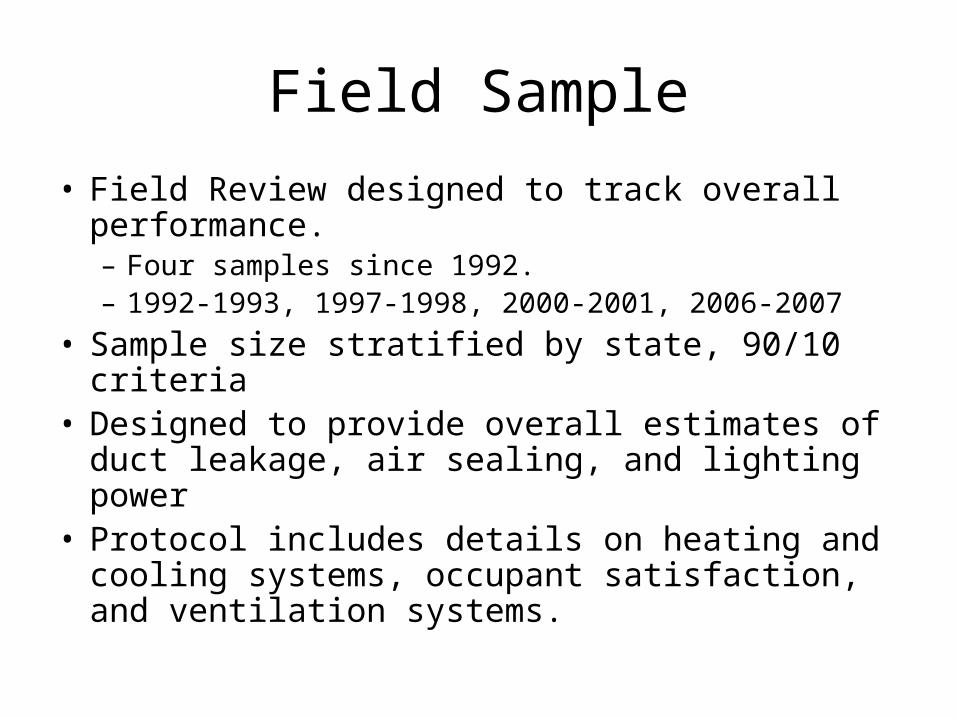
Field Sample
• Field Review designed to track overall performance. – Four samples since 1992.– 1992-1993, 1997-1998, 2000-2001, 2006-2007
• Sample size stratified by state, 90/10 criteria• Designed to provide overall estimates of duct
leakage, air sealing, and lighting power• Protocol includes details on heating and cooling
systems, occupant satisfaction, and ventilation systems.
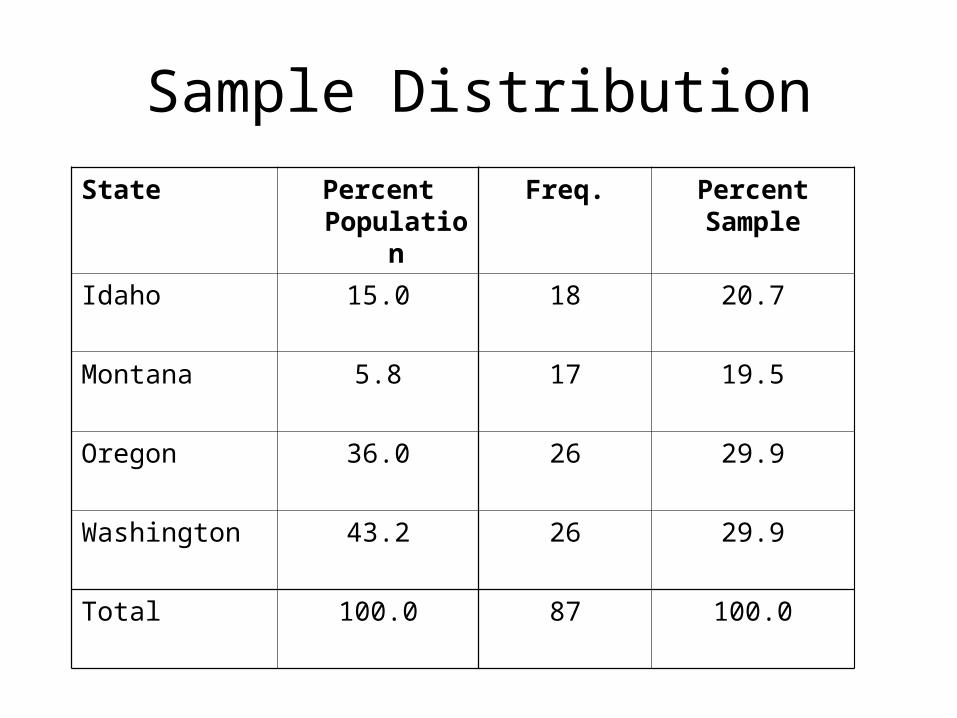
Sample Distribution
State Percent Population
Freq. PercentSample
Idaho 15.0 18 20.7
Montana 5.8 17 19.5
Oregon 36.0 26 29.9
Washington 43.2 26 29.9
Total 100.0 87 100.0
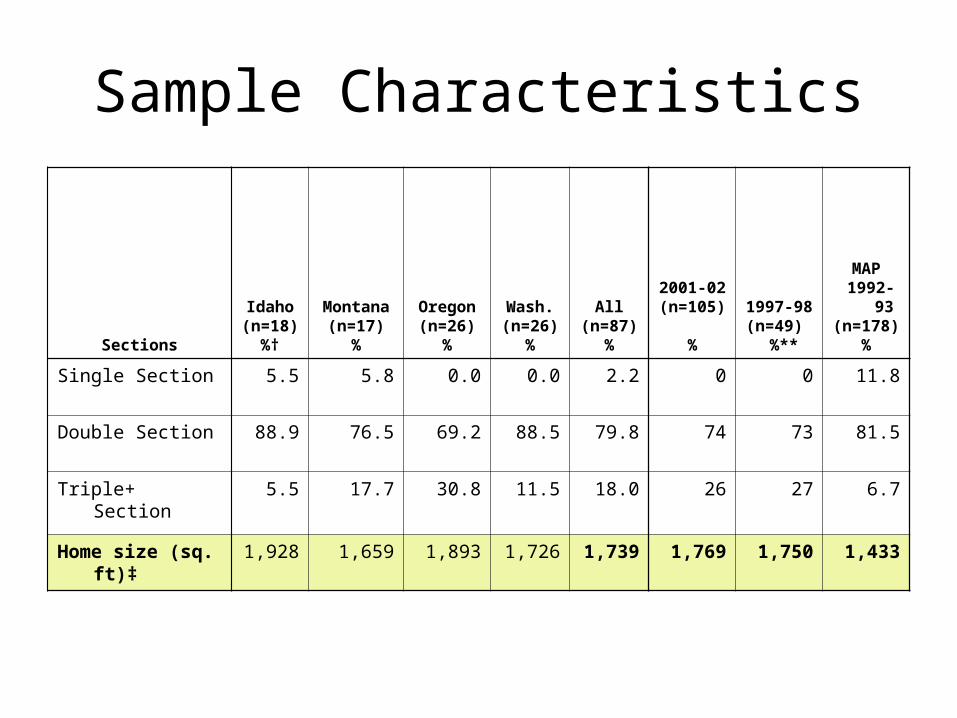
Sample Characteristics
Sections
Idaho(n=18)
%†
Montana(n=17)
%
Oregon(n=26)
%
Wash.(n=26)
%
All(n=87)
%
2001-02(n=105)
%
1997-98(n=49)
%**
MAP 1992-93(n=178)
%
Single Section 5.5 5.8 0.0 0.0 2.2 0 0 11.8
Double Section 88.9 76.5 69.2 88.5 79.8 74 73 81.5
Triple+ Section 5.5 17.7 30.8 11.5 18.0 26 27 6.7
Home size (sq. ft)‡
1,928 1,659 1,893 1,726 1,739 1,769 1,750 1,433
Lighting Review
• Establish a lighting baseline for this sector
• Compare results to 2005 site built baseline
• Determine the current saturation of high efficacy lighting
• Develop lighting power density for manufactured homes
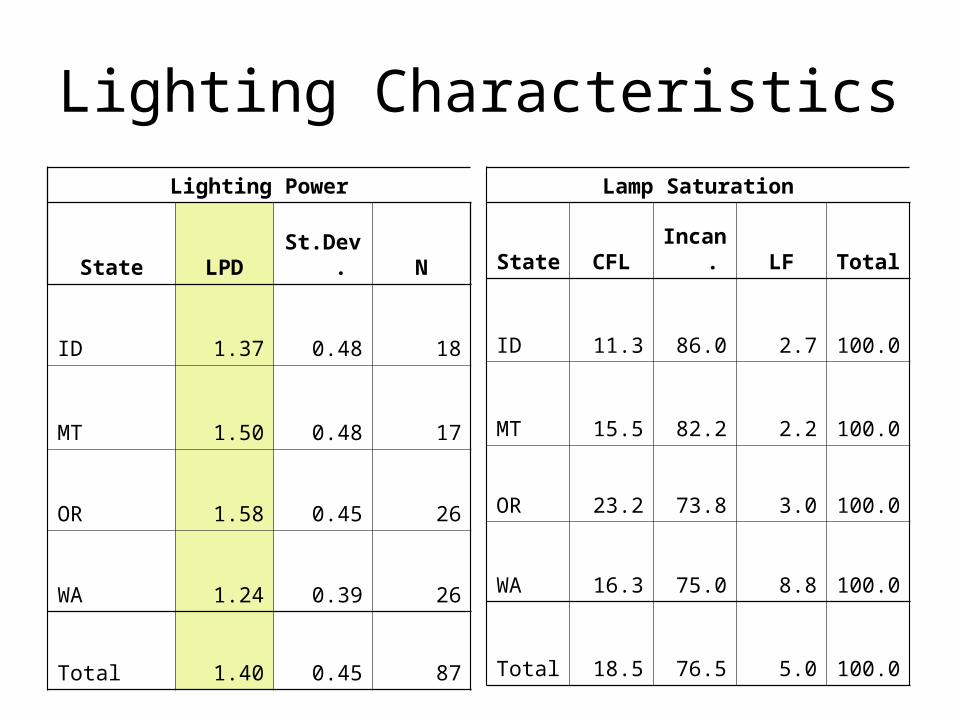
Lighting Characteristics
Lighting Power
State LPD St.Dev. N
ID 1.37 0.48 18
MT 1.50 0.48 17
OR 1.58 0.45 26
WA 1.24 0.39 26
Total 1.40 0.45 87
Lamp Saturation
State CFL Incan. LF Total
ID 11.3 86.0 2.7 100.0
MT 15.5 82.2 2.2 100.0
OR 23.2 73.8 3.0 100.0
WA 16.3 75.0 8.8 100.0
Total 18.5 76.5 5.0 100.0
Lighting results
• LPD about 20% lower than SF baseline
• With common technologies LPD compared to SF Baseline about 15% lower
• CFL saturation about twice SF Baseline
• Linear Florescent shows similar saturation
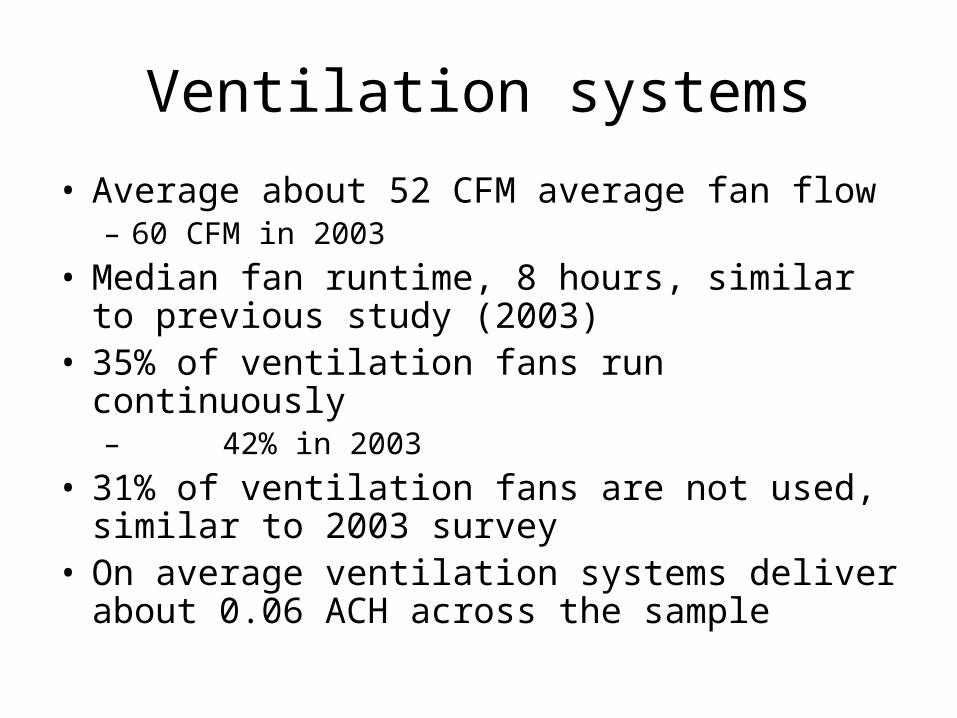
Ventilation systems
• Average about 52 CFM average fan flow– 60 CFM in 2003
• Median fan runtime, 8 hours, similar to previous study (2003)
• 35% of ventilation fans run continuously – 42% in 2003
• 31% of ventilation fans are not used, similar to 2003 survey
• On average ventilation systems deliver about 0.06 ACH across the sample
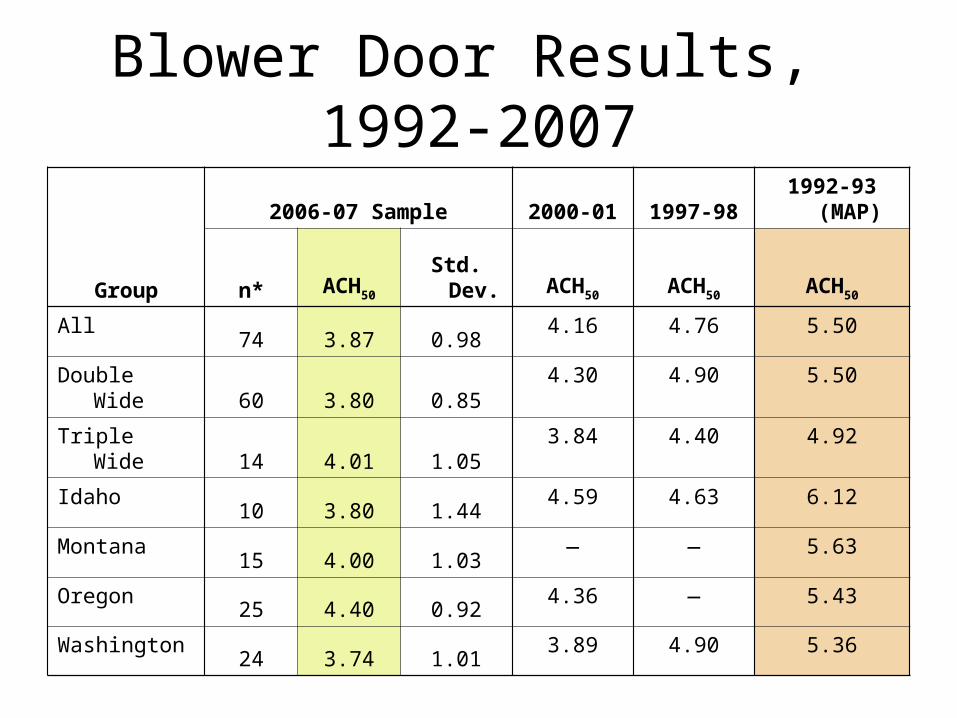
Group
2006-07 Sample 2000-01 1997-981992-93
(MAP)
n* ACH50 Std. Dev. ACH50 ACH50 ACH50
All 74 3.87 0.98
4.16 4.76 5.50
Double Wide60 3.80 0.85
4.30 4.90 5.50
Triple Wide14 4.01 1.05
3.84 4.40 4.92
Idaho10 3.80 1.44
4.59 4.63 6.12
Montana15 4.00 1.03
— — 5.63
Oregon25 4.40 0.92
4.36 — 5.43
Washington24 3.74 1.01
3.89 4.90 5.36
Blower Door Results, 1992-2007
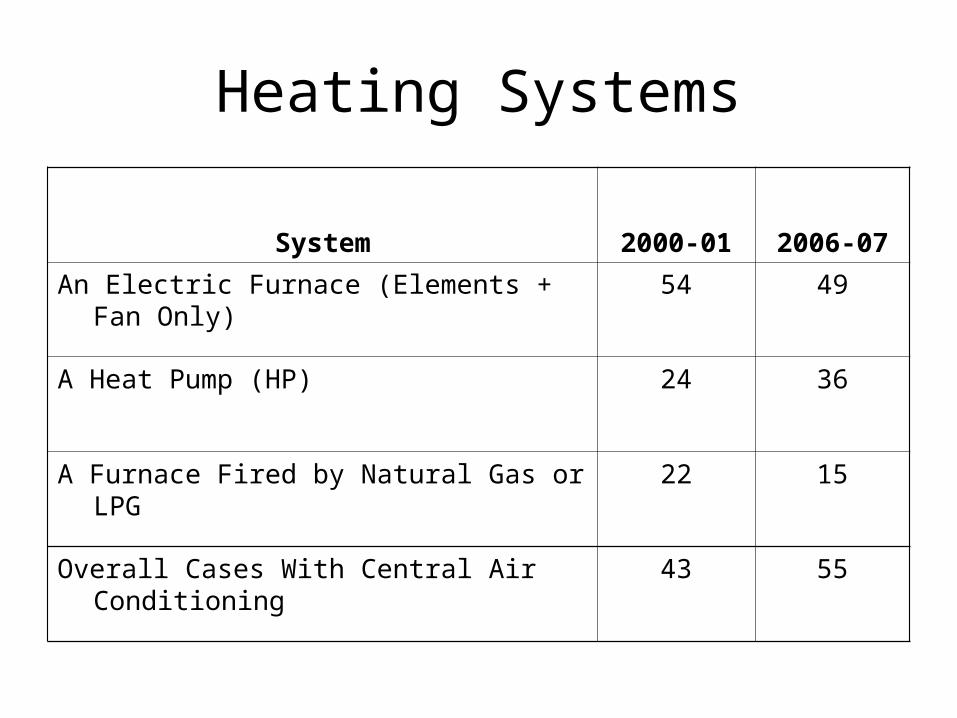
System 2000-01 2006-07
An Electric Furnace (Elements + Fan Only) 54 49
A Heat Pump (HP) 24 36
A Furnace Fired by Natural Gas or LPG 22 15
Overall Cases With Central Air Conditioning 43 55
Heating Systems
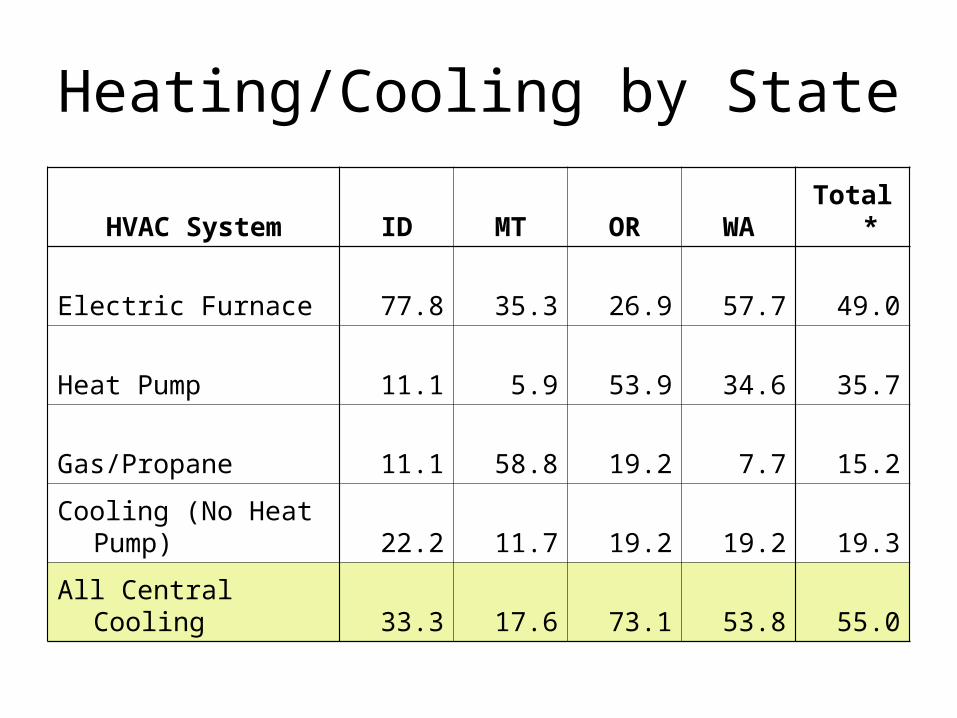
HVAC System ID MT OR WA Total*
Electric Furnace 77.8 35.3 26.9 57.7 49.0
Heat Pump 11.1 5.9 53.9 34.6 35.7
Gas/Propane 11.1 58.8 19.2 7.7 15.2
Cooling (No Heat Pump) 22.2 11.7 19.2 19.2 19.3
All Central Cooling 33.3 17.6 73.1 53.8 55.0
Heating/Cooling by State
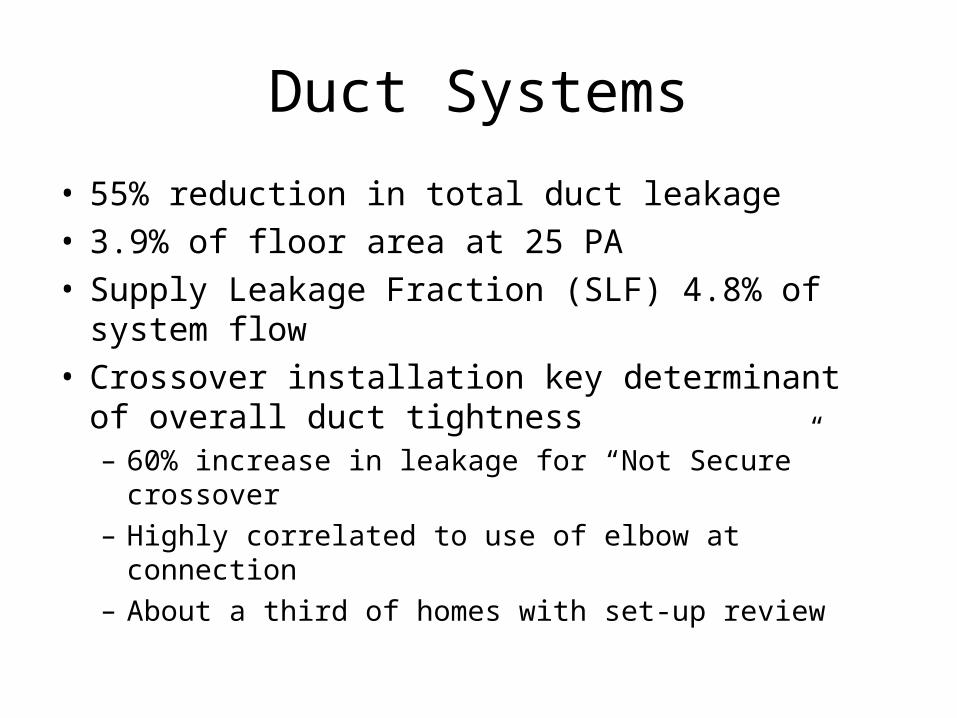
Duct Systems
• 55% reduction in total duct leakage• 3.9% of floor area at 25 PA• Supply Leakage Fraction (SLF) 4.8% of system
flow• Crossover installation key determinant of overall
duct tightness – 60% increase in leakage for “Not Secure” crossover– Highly correlated to use of elbow at connection– About a third of homes with set-up review
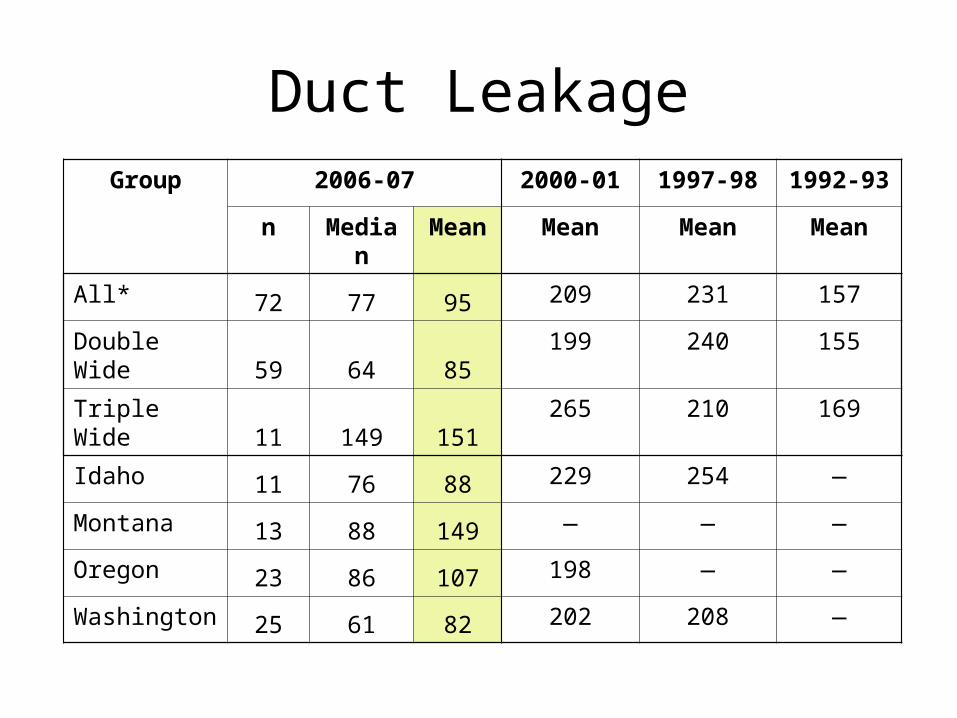
Duct LeakageGroup 2006-07 2000-01 1997-98 1992-93
n Median Mean Mean Mean Mean
All* 72 77 95 209 231 157
Double Wide 59 64 85 199 240 155
Triple Wide 11 149 151 265 210 169
Idaho 11 76 88 229 254 —
Montana 13 88 149 — — —
Oregon 23 86 107 198 — —
Washington 25 61 82 202 208 —
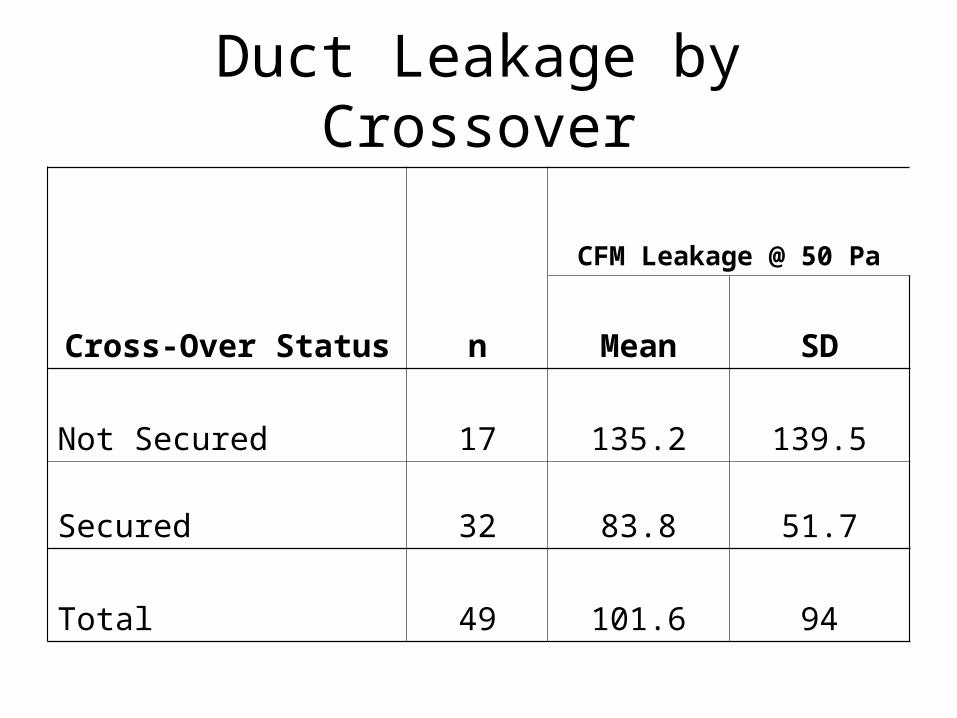
Cross-Over Status n
CFM Leakage @ 50 Pa
Mean SD
Not Secured 17 135.2 139.5
Secured 32 83.8 51.7
Total 49 101.6 94
Duct Leakage by Crossover
Billing Analysis
• Bills collected for the sample
• 83 valid bills (87 Cases)
• Billing analysis using VBDD (~PRISM)
• 63 Cases used
• Heat Pumps very problematic
• Heating predicted in 37 weather sites
• Normalized to 18 TMY3 weather sites

Heating Energy Use “Current” Weather (KBtu/sf) Heating System Zone 1 Zone 2 Zone 3 Total
Heat Pump
Mean 8.86 11.64 11.57 9.97
Std. Dev. 4.61 8.45 – 6.06
N 12 7 1 20
Electric Resistance
Mean 14.3 21.3 24.14 18.8
Std. Dev. 5.11 10.38 6.35 8.31
N 15 10 8 33
Gas
Mean 18.09 29.17 32.62 29.37
Std. Dev. 4.03 – 4.86 7.35
N 2 1 7 10
Total
Mean 12.31 17.98 27.06 17.68
Std. Dev. 5.62 10.61 7.95 9.83
N 29 18 16 63
Billing Analysis, Heating
Calibration & Savings
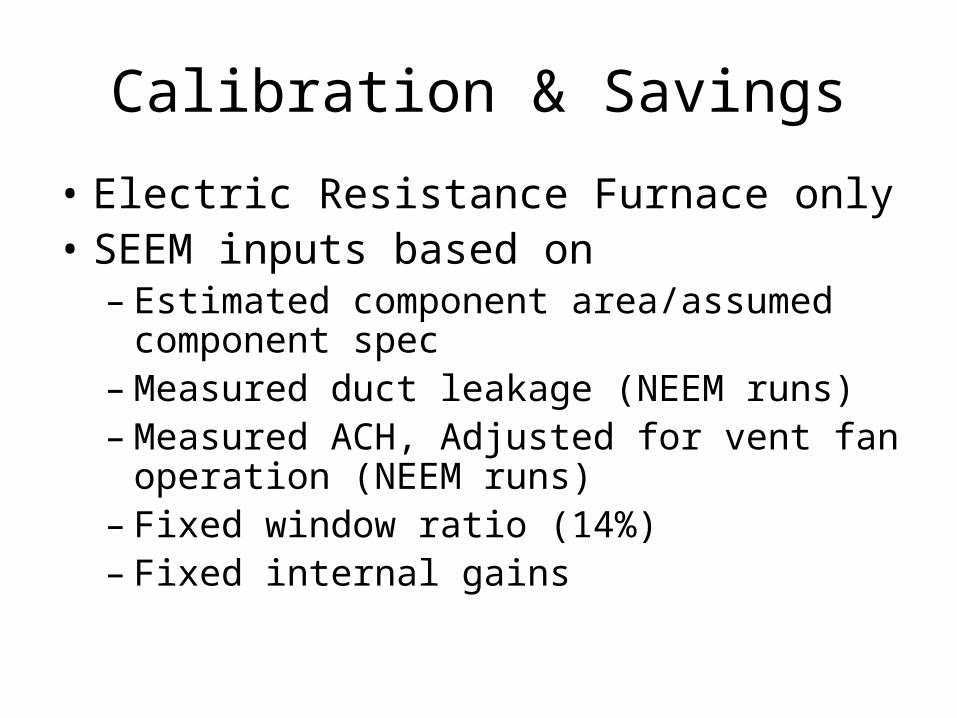
• Electric Resistance Furnace only • SEEM inputs based on
– Estimated component area/assumed component spec
– Measured duct leakage (NEEM runs)– Measured ACH, Adjusted for vent fan
operation (NEEM runs)– Fixed window ratio (14%)– Fixed internal gains

Calibration & Savings
• Bills normalized to TMY3 sites • SEEM runs completed to those sites
– Initial adjustments on component specs– Adjustments on infiltration estimates
• SEEM runs completed for baseline assumptions• Savings calculated from each run and
aggregated by climate• Program savings developed and adjusted for
home size (in each zone)
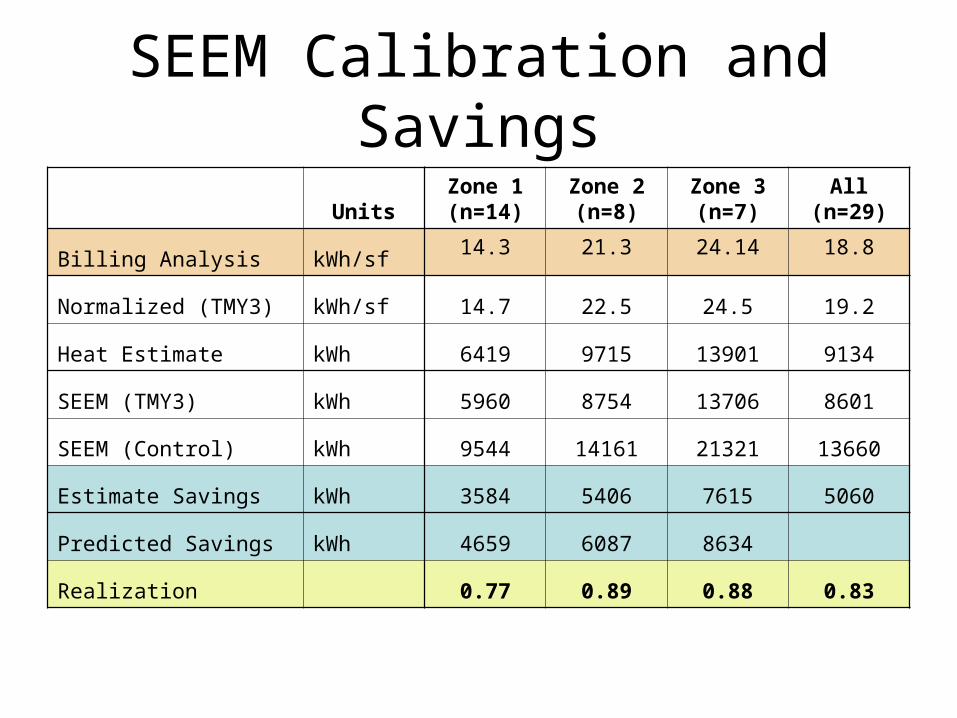
UnitsZone 1(n=14)
Zone 2(n=8)
Zone 3(n=7)
All(n=29)
Billing Analysis kWh/sf14.3 21.3 24.14 18.8
Normalized (TMY3) kWh/sf 14.7 22.5 24.5 19.2
Heat Estimate kWh 6419 9715 13901 9134
SEEM (TMY3) kWh 5960 8754 13706 8601
SEEM (Control) kWh 9544 14161 21321 13660
Estimate Savings kWh 3584 5406 7615 5060
Predicted Savings kWh 4659 6087 8634
Realization 0.77 0.89 0.88 0.83
SEEM Calibration and Savings
Results
• NEEM program has developed a predictable savings mechanism for this sector.
• Lighting shows some consistency with site built assumptions
• Consistent effort has corrected the deficiencies over time
• Billing analysis corroborates the simulation results used for NEEM savings estimates


![NEEM BASED PESTICIDE - KRISHNAkrishna.nic.in/PDFfiles/MSME/Chemical/NEEM BASED PESTICIDE[1].pdf · 1 neem based pesticide contents section i product characteristics section ii product](https://img.pdfslide.us/doc/110x75/5a9f50e47f8b9a84178cab86/neem-based-pesticide-based-pesticide1pdf1-neem-based-pesticide-contents-section.jpg)