Embed Size (px)
Citation preview
8/13/2019 Needs report: appendix E
http://slidepdf.com/reader/full/needs-report-appendix-e 1/235
100-RG-PNC-00000-900008 | Summer 2010
Appendix EPotential Source Control and SUDS Applications
Annex 1: SUDS Evaluation for Example Areas

8/13/2019 Needs report: appendix E
http://slidepdf.com/reader/full/needs-report-appendix-e 2/235
100-RG-PNC-00000-900008 Printed 07/09/2010

8/13/2019 Needs report: appendix E
http://slidepdf.com/reader/full/needs-report-appendix-e 3/235
London Tideway Tunnels ProgrammeThames Tunnel Project Needs Report
Potential source control and SUDS appl ications:Land use and retrofit options
28 th April 2010
Richard Ashley
Virginia StovinSarah MooreLouise HurleyLinda Lewis
Adrian Saul
University of Sheffield

8/13/2019 Needs report: appendix E
http://slidepdf.com/reader/full/needs-report-appendix-e 4/235
Potential source control and SUDS appl ications:
Land use and retrofit options
Table of Contents
Land use and retrofit options ................................................................................................................. 1
Figures ..................................................................................................................................................... 4
Tables ...................................................................................................................................................... 6
Acknowledgements ................................................................................................................................. 8
Land use and retrofit options ................................................................................................................. 1
Executive summary ................................................................................................................................. 1
1. Introduction and objectives ............................................................................................................ 5
2. Work carried out ........................................................................................................................... 10
3. Methodology for selection of options for retrofitting .................................................................. 12
3.1 Existing frameworks for the selection of options ................................................................. 12
3.2 Framework used in the study............................................................................................... 15 3.2.1 Review of available SUDS options and ranking of performance potential .......................... 15
4. Identification of subcatchments and performance criteria .......................................................... 18
4.1 Identification of subcatchments ........................................................................................... 18
4.2 Performance and performance assessment ......................................................................... 24
4.2.1 Hydraulic and other aspects of the performance of SUDS elements .................................. 25
4.2.2 Sewerage performance assessment .................................................................................... 32
5. Practicalities of retrofitting SUDS ................................................................................................. 34
5.1 Overview of benefits of using SUDS retrofits ....................................................................... 34
5.2 Summary of difficulties in using SUDS retrofits .................................................................... 38
5.2.1 Legal and regulatory issues ........................................................................................... 38
5.2.2 Transfer of burdens and responsibilities ...................................................................... 38
5.2.3 Maintenance, operational needs, risks and health and safety ..................................... 39
5.2.4 Incentivisation ............................................................................................................... 39
8/13/2019 Needs report: appendix E
http://slidepdf.com/reader/full/needs-report-appendix-e 5/235
5.2.5 Practicalities of construction ........................................................................................ 39
5.2.6 Acceptability and awareness ........................................................................................ 39
6. Catchment scale disconnection strategies ................................................................................... 41
6.1 Initial Approach – ANNEX 1 disconnection scenarios ........................................................... 41
6.2 Land use types and suitability for retrofit ............................................................................. 41
6.3 Method 1 – ‘typical’ disconnection profiles by land ‐use types ............................................ 41
6.4 Method 2 – Land‐use categories within OS MasterMap ...................................................... 43
6.5 Assignment of Impermeable/Pervious Areas ....................................................................... 45
6.6 Results ................................................................................................................................... 46
7. Cost ‐ benefit assessment of detailed retrofit designs ................................................................. 48
7.1 Calculation of Whole Life Costs ............................................................................................ 48
7.2 SUDS Unit costs ..................................................................................................................... 50
7.2.1 Pocket raingardens ....................................................................................................... 54
7.2.2 Permeable road surfaces .............................................................................................. 54
7.2.3 Detention basins ........................................................................................................... 55
7.2.4 Swales ........................................................................................................................... 55
7.2.5 Green roofs ................................................................................................................... 56
7.2.6 Roof downspout disconnection .................................................................................... 56
8. Using exemplar designs to evaluate the disconnection options and cost ‐benefits for the three
subcatchments ...................................................................................................................................... 57
8.1 Lytton Grove subarea (Appendix E.1) ................................................................................... 57
8.2 Carlton Drive Subarea (Appendix E.2) ................................................................................... 59
8.3 Chartfield Avenue Subarea (Appendix E.3) ........................................................................... 60
8.4 Summary of lessons from exemplar designs ........................................................................ 61
9. Upscaling costs .............................................................................................................................. 62
10. Disconnection scenarios for modelling purposes ..................................................................... 63
10.1 Initial results from the modelling of disconnection scenarios .................................................. 63
10.1.1 Overview of global disconnection scenarios...................................................................... 63
10.1.2 Overview of feasible disconnection scenarios ................................................................... 64
10.2 Refined Approach – Final disconnection scenarios ............................................................. 65 10.2.1 Introduction to refinements .............................................................................................. 65

8/13/2019 Needs report: appendix E
http://slidepdf.com/reader/full/needs-report-appendix-e 6/235
8/13/2019 Needs report: appendix E
http://slidepdf.com/reader/full/needs-report-appendix-e 7/235
D.4.3 Normative lock‐in; how to transform systems ........................................................... 112
D.5 Implementation of non ‐piped/sewered systems ............................................................... 113
D.6 Non ‐piped/sewer systems and water quality ..................................................................... 113
D.7 Non ‐piped/sewered systems and water quantity .............................................................. 113 D.8 Perceptions of non ‐piped/sewered systems ...................................................................... 114
D.9 Current surface water management initiatives .................................................................. 114
D.10 Use and adoption of SUDS by Sewerage Undertakers .................................................... 115
D.11 Added benefits of ‘joined ‐up’ surface water management ............................................ 116
E.1 Lytton Grove Subarea retrofit SUDS ................................................................................... 117
14. ....................................................................................................................................................... 132
E.2 Carlton Drive Subarea SUDS ............................................................................................... 143 15. ....................................................................................................................................................... 148
E.3 Chartfield Avenue subarea SUDS ........................................................................................ 155
16. ....................................................................................................................................................... 158
Appendix F ‐ photographic record of areas used in exemplar designs ............................................... 159
ANNEX 1 ‐ SUDS Evaluation for Example Areas .................................................................................. 168
Figures
Figure 1‐1 The place of SUDS within the Water Sensitive Urban Design framework (adapted from
Landcom, 2009 and CIRIA, 2007) ............................................................................................................ 7 Figure 3‐1a SNIFFER Framework – Phase I Feasibility Assessment ...................................................... 13 Figure 3‐2 Generic hierarchies for SUDS retrofit Selection proposed by Stovin et al (2007) ............... 14 Figure 3‐3 Approach taken in this study to the selection and evaluation of the effectiveness of
retrofit SUDS ......................................................................................................................................... 15 Figure 4‐1 The three subcatchments investigated (not to scale) (numbers refer to images in Figure
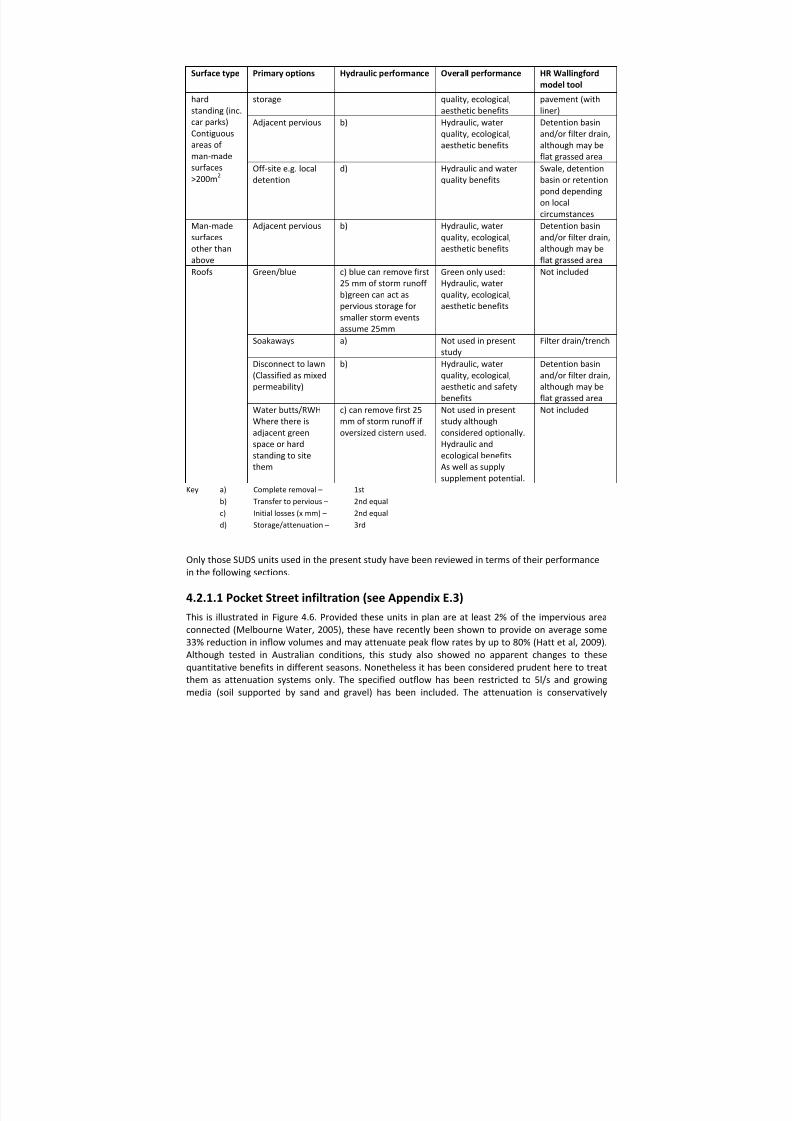
4.5) ........................................................................................................................................................ 18 Figure 4‐2 West Putney Mastermap subcatchment characterisation .................................................. 19 Figure 4‐3 Putney Bridge Mastermap subcatchment characterisation ................................................ 20 Figure 4‐4 Frogmore (Buckhold Road) Mastermap subcatchment characterisation ........................... 21 Figure 4‐5(a) Putney Bridge subcatchment......................................................................................... 22 Figure 4‐6 Pocket rain gardens in Auckland New Zealand .................................................................... 27 Figure 4‐7 Permeable block paving (from Interpave website) ............................................................. 28 Figure 4‐8 Off ‐line local detention basin (Orleans, France) .................................................................. 28
Figure 4‐9 Swales .................................................................................................................................. 29 Figure 4‐10 Downspout connected to pervious area in Seattle, USA ................................................... 30

8/13/2019 Needs report: appendix E
http://slidepdf.com/reader/full/needs-report-appendix-e 8/235
Figure 4‐11 Green roofs in Rotherham, Yorkshire ................................................................................ 31 Figure 4‐12 Slimline RWH tanks in an access pathway to a property in Melbourne ............................ 32 Figure 6‐1 Comparison of drainage/disconnection land ‐use categories by land ‐use category for Sub‐
catchments 1 & 2 .................................................................................................................................. 42 Figure 8‐1 Example of the extensive green areas in municipal housing in the Lytton Grove area that
could accommodate detention basins .................................................................................................. 58 Figure 8‐2 Example of paved hard standing in the Lytton Grove area that could be converted to
permeable pavement ............................................................................................................................ 58 Figure 8‐3 Carlton Drive showing flat roofed apartment blocks and wide road .................................. 59 Figure 8‐4 Chartfield Avenue illustrating the width of the road and potential to fit pocket raingardens .............................................................................................................................................................. 60 Figure 10 ‐1 Examples of municipal housing surrounded by generous grounds ................................... 65 Figure 10 ‐2 Land‐use categories within each of the Frogmore (Buckhold Road) sub ‐catchments,
compared with the exemplar design case, Lytton Grove sub ‐areas 1 to 4 .......................................... 66
Figure 10 ‐3 Comparison between remaining impermeable area for feasible and refined disconnection strategies ....................................................................................................................... 68 Figure 12 ‐1 Water stored temporarily on the highway in Skokie (Carr & Walesh. 2008) .................... 75 Figure B‐0‐1 Criteria for Pocket road SUDS .......................................................................................... 90 Figure B‐0‐2 Example houses deemed suitable for disconnection to gardens ..................................... 91 Figure B‐0‐3 Example of all properties deemed suitable for disconnection to adjacent land ............. 91 Figure E‐0‐1 Lytton Grove sub ‐catchment with sub ‐areas showing roads highlighted ...................... 117 Figure E‐0‐2 Option 1 – detention basins all in the lowest area (1) adjacent to Lytton Grove .......... 119 Figure E‐0‐3 Area 2 – potential for local storage of surface water. .................................................... 122 Figure E‐0‐4 Area 3 – potential for local storage of surface water ..................................................... 123 Figure E‐0‐5 Area 4 – potential for local storage of surface water. .................................................... 124 Figure E‐0‐6 required detention basin area for areas 1‐4 if located entirely in area 1. (Swales and
piped connections not shown). .......................................................................................................... 126 Figure E‐0‐7 Area 5 disconnect back roofs to gardens ....................................................................... 133 Figure E‐0‐8 Area 6 .............................................................................................................................. 134 Figure E‐0‐9 Area 7 .............................................................................................................................. 135 Figure E‐0‐10 Area 8 ............................................................................................................................ 136 Figure E‐0‐11 Area 9 ............................................................................................................................ 137 Figure E‐0‐12 Area 10 .......................................................................................................................... 138 Figure E‐0‐13 Area 11 .......................................................................................................................... 139
Figure E‐0‐14 Area 12 .......................................................................................................................... 140 Figure E‐0‐15 Area 13 .......................................................................................................................... 141 Figure E‐0‐16 Main and local roads .................................................................................................... 142 Figure E‐0‐17 Carlton Drive and adjacent properties ......................................................................... 144 Figure E‐ 0‐18 Carlton Drive Area 1 .................................................................................................... 149 Figure E‐0‐19 Carlton Drive Area 2 ..................................................................................................... 150 Figure E‐0‐20 Carlton Drive Area 3 ..................................................................................................... 151 Figure E‐0‐21 Carlton Drive Area 4 ..................................................................................................... 152 Figure E‐0‐22 Carlton Drive Area 5 ..................................................................................................... 153
Figure E‐0‐23 Carlton Drive Area 6 ..................................................................................................... 153 Figure E‐0‐24 Carlton Drive Roads ...................................................................................................... 154
8/13/2019 Needs report: appendix E
http://slidepdf.com/reader/full/needs-report-appendix-e 9/235
Figure E‐0‐25 Pocket rain garden in road edge in Brisbane ................................................................ 155 Figure E‐0‐26 On‐street pocket rain gardens (after Smith et al., 2007) ............................................. 155 Figure E‐0‐27 Chartfield Avenue ......................................................................................................... 156 Figure E‐0‐28 Genoa Road leading from Chartfield Avenue (looking south with Chartfield Avenue in
the distance) ....................................................................................................................................... 156 Figure F‐0‐1 A new development in the vicinity of Lytton Grove (Clockhouse Place) with significant
hard standing ...................................................................................................................................... 159 Figure F‐0‐2 Garages associated with the development in Figure F‐1 (it is unlikely that this is
permeable) .......................................................................................................................................... 159 Figure F‐0‐3 Lytton Grove looking west towards the lowest point .................................................... 160 Figure F‐0‐4 Some drives off Lytton Grove are already permeable .................................................... 160 Figure F‐0‐5 Lytton Grove ‐ speed humps may be replaceable by pocket rain gardens .................... 161 Figure F‐0‐6 The Kersfield Estate off Lytton Grove has lots of grassed areas and disused hard standing
areas (looking SW) .............................................................................................................................. 161
Figure F‐0‐7 looking in the opposite direction (NE) to Figure F‐6 ....................................................... 162 Figure F‐0‐8 Kersfield Estate lower end .............................................................................................. 162 Figure F‐0‐9 Kersfield Estate middle area ........................................................................................... 163 Figure F‐0‐10 Top end of Kersfield Estate ........................................................................................... 163 Figure F‐0‐11 Apartments off Carlton Drive ....................................................................................... 164 Figure F‐0‐12 An existing rain garden off Carlton Drive ..................................................................... 164 Figure F‐0‐13 Paved areas for car parking for apartments on Carlton Drive ...................................... 165 Figure F‐0‐14 Speed humps in Carlton Drive ...................................................................................... 165 Figure F‐0‐15 Chartfield Avenue and adjoining roads (no speed humps) .......................................... 166 Figure F‐0‐16 Junction of Chartfield Avenue and Genoa Avenue ....................................................... 166 Figure F‐0‐17 Paved drive on Chartfield Avenue (unlikely to be permeable) ..................................... 167 Figure F‐0‐18 One of a few apartment blocks in the vicinity of Chartfield Avenue (Genoa Avenue) 167
TablesTable 3‐1 Potential SUDS, preference and indicative hydraulic performance ..................................... 16
Table 4‐1 SUDS Hydraulic and overall performance ............................................................................. 25
Table 5‐1 Summary of the benefits of SUDS options (CIRIA, 2007) ..................................................... 36
Table 5‐2 Summary of potential benefits of stormwater separation (Cascade, 2009) ........................ 37
Table 6‐1 Retrofit SUDS options, SQL queries and Hydraulic preferences ........................................... 44 Table 6‐2 Hydraulic modelling options for retrofit SUDS ..................................................................... 45
Table 6‐3 Distribution of impermeable area by MasterMap land ‐use category .................................. 45
Table 6‐4 Disconnection scenarios for InfoWorks modelling ............................................................... 47
Table 7‐1 Outline of hydrologic/hydraulic parameters used in UKWIR/WERF WLC model ................. 49
Table 7‐2 SUDS unit costs ..................................................................................................................... 51
Table 7‐3 Pocket raingarden whole life costings .................................................................................. 54
Table 7‐4 Permeable pavement whole life costing for lighter vehicle loading .................................... 55
Table 7‐5 Whole life costing of detention basins ................................................................................. 55
Table 7‐6 Whole life costing of swales .................................................................................................. 55
Table 7‐7 Capital costs for roof downspout disconnection with some maintenance allowance ......... 56

8/13/2019 Needs report: appendix E
http://slidepdf.com/reader/full/needs-report-appendix-e 10/235
Table 9‐1 Unit costs of municipal housing areas other than roof, road or manmade land
disconnections ...................................................................................................................................... 62
Table 9‐2 Ball‐park estimates for scheme costs ‐ all areas – nearest £1M ........................................... 62
Table 10 ‐1 Sample performance improvements associated with 50% disconnection of impervious
area for the October 2000 event .......................................................................................................... 64
Table 10 ‐2 Assumed disconnection rates and InfoWorks modelling categories for 'municipal housing'
areas ...................................................................................................................................................... 66
Table 10 ‐3 Assumed uptake levels for the refined disconnection strategies ....................................... 67
Table 10 ‐4 Combined area disconnections ........................................................................................... 68
Table 10 ‐5 Final design scenario allocations of existing impermeable area (%) .................................. 68
Table A‐0‐1 Examples of types of SUDS available for surface water attenuation ................................ 81
Table A‐0‐2 Quantity performance of selected SUDS (source: SUDS manual, CIRIA, 2007, Table 5.7) 83
Table A‐ 0‐3 Effectiveness of source controls on water quantity downstream (adapted from
Weinstein et al, 2006) ........................................................................................................................... 84
Table E‐0‐1potential sizes of drainage units in Area 1 ........................................................................ 120 Table E‐0‐2 potential impervious areas that could be disconnected in areas 1‐4.............................. 120
Table E‐0‐3 present value costs of the detention basins A‐D in Area 1. ............................................. 120
Table E‐0‐4 present value costs for swales and associated pipework in Area 1. ............................... 121
Table E‐0‐5 costs of alternative potential detention storage and connecting swales in areas 2‐4. ... 125
Table E‐0‐6 present value costs of the detention basins A‐C in Area 1, Figure E.6. ........................... 125
Table E‐0‐7 Impervious areas in the remainder of the Lytton Grove Subcatchment ......................... 127
Table E‐0‐8 Options and costs for alternative drainage for subareas 5‐13 and the roads in the Lytton
Grove Subcatchment .......................................................................................................................... 129
Table E‐0‐9 Lytton Grove Subcatchment retrofit SUDS summary ...................................................... 132
Table E‐0‐10 Carlton Drive and adjacent properties – distribution of types of area (m2) .................. 143
Table E‐0‐11 Carlton Drive characteristics and costs of retrofits by Subarea .................................... 145
Table E‐0‐12 Summary of Carlton Drive costs of retrofits by Subarea ............................................... 148
Table E‐0‐13 Chartfield Avenue SUDS units and costs ........................................................................ 157
Table E‐0‐14 Chartfield Avenue areas attenuated and summary of costs ......................................... 158

8/13/2019 Needs report: appendix E
http://slidepdf.com/reader/full/needs-report-appendix-e 11/235
Acknowledgements
The use and application of the Whole Life SUDS costing tool described in Section 7 and used in the
detailed designs in Section 8, was supported by Bridget Woods ‐Ballard of H R Wallingford under subcontract. The project team are also grateful for the input from and guidance provided by the
project steering group from CH2M Hill, Halcrow and Thames Water.
All mapping reproduced by permission of ordnance survey on behalf of HMSO. © Crown copyright
and database right 2009. All rights reserved. Ordnance Survey Licence number 100019345.
All maps produced using the British National Grid projection.
8/13/2019 Needs report: appendix E
http://slidepdf.com/reader/full/needs-report-appendix-e 12/235
1
Potential source control and SUDS applications:
Land use and retrofit options
Executive summary
The Thames Tideway Tunnel has been designed to significantly reduce the spill flows from CombinedSewer Overflows (CSOs) and Pumping Stations into the River Thames. The planned interventionstrategy to transfer the flow into the tunnel has, in many cases, resulted in costly diversion structures.However, in some instances the volumes and magnitudes of the spilled flow are relatively small andthis has raised the question as to whether other options such as the introduction of SustainableDrainage Systems (SUDS), could see a potential benefit in the reduction of the spilled flow and hencein a reduced cost or the entire elimination of some diversion or overflow structures. This needs to bebalanced against the cost and practicability of the implementation of SUDS systems within existing
urbanised areas in the London Tideway Tunnels (LTT) catchment.This report provides an assessment of the potential of and options for stormwater disconnection usingretrofit SUDS techniques for 3 of the subcatchments in the London Tideway Tunnels (LTT)catchment. These are the West Putney, Putney Bridge and Frogmore (Buckhold Road) CombinedSewer Overflow catchments. The objective of the study was to determine whether or not there wasscope for stormwater disconnection that would be effective at reducing the frequency and spills fromthe Combined Sewer Overflows (CSOs) and comply with the Urban Waste Water Treatment Directive(UWWTD) at less cost and potentially greater benefit than the traditional sewered approach.
There is growing evidence globally that alternatives to piped or sewered systems, usually hybridresponses to stormwater problems, using combinations of ‘natural’ drainage systems and piped orsewered where necessary, are more flexible, adaptable and ultimately more resilient to on-goingmajor changes such as due to climate. These systems also have the added benefits of being able to
improve the quality of the stormwater running off surfaces and can also be used to enhance theliveability of urban areas by the introduction of water features and more green space; also providingopportunities for cooling and carbon sinks, important responses to climate change.
The retrofit stormwater options considered here are so-called ‘sustainable drainage systems’ (SUDS),defined as: “surface water drainage systems developed in line with the ideals of sustainabledevelopment” (CIRIA, 2007). These systems comprise combinations of source controls, such asgreen roofs; local controls, including collective areas draining to permeable pavements; and end ofsystem controls such as detention basins and ponds. These systems should be seen as part of a‘treatment train’ whereby a number of SUDS are used together in a combined portfolio of responses.
Potential SUDS options that may be applicable in the relatively dense areas of London have beenreviewed and selected within a preference hierarchy of applications based on published guidance onretrofitting. Their overall potential for reducing the CSO discharges was assessed using a computermodel of the London drainage system, the InfoWorks CS© London Tideway Tunnels seweragesimulation model.
Initially ‘global’ figures were used to test whether or not disconnection of stormwater inputs to theLondon Tideway Tunnels sewer network would potentially be useful. Assuming it were possible toremove the flows coming off 50% of the existing impermeable areas it was found that there could besignificant improvements to the CSO spill behaviour. Some, but less significant, improvements inspills were also found for the use of SUDS systems that removed or attenuated the initial 50millimetres of runoff from contributing areas.
The greatest reduction in overflow was seen when 50% of the impermeable area was removed,reducing the overflow volume at West Putney by 55%, at Putney Bridge by 78% and for Frogmore(Buckhold Road) CSO by 77% during the typical year. The number of overflow events during the yearwas also reduced, but only slightly for the West Putney CSO, and 16 and 10 spill events per yearrespectively for the Putney Bridge and Frogmore (Buckhold Road) CSOs. Disconnecting 50% of theimpermeable area from the entire LTT catchment reduced the total overflow volume by 54%,
8/13/2019 Needs report: appendix E
http://slidepdf.com/reader/full/needs-report-appendix-e 13/235
however, this represents the disconnection of some 10,327 ha of hard surfaces such as roofs, drives,car parks, roads and pavements, a not inconsiderable amount.
Estimation of the potential ‘on the ground’ reduction in contributing impervious areas, as opposed tothe theoretical reductions above, was carried out in two stages. Firstly an assessment was made byassessing the applicability of a retrofit SUDS option by physical, mapped, characteristics of theunderlying surface and local topography by inspection using GIS OS Mastermap. A series of logicalSQL queries were determined that could be used to automatically select areas of land that wereapparently suitable for each potential retrofit option. From this a more realistic set of disconnectionoptions than the global 50% was generated and found by modelling to be potentially valuable forreducing CSO spills.
The assumed global disconnection figure of 50% and the GIS semi-automatic estimation of areas thatcould be disconnected outlined above, were further refined by a detailed investigation of the realpotential for disconnection by undertaking feasibility designs for retrofitting a range of SUDSmeasures. These were in trial areas that included converting road surfaces to porous; fitting shallowbasins in grassed areas to slow down the rate of flow into the sewer network; disconnecting thedownpipes from back roof areas of houses and directing them on to lawns; installing pocket raingardens in streets (which also serve to calm traffic); and converting paved and car parking areas fromimpervious to pervious surfaces.
The opportunity to disconnect stormwater in these detailed areas was considered in terms of thepracticability on the ground. In these areas, although chosen for their good potential, the practical useof SUDS, based on an evaluation of the realistic local opportunities for disconnection, was found to beconsiderably less promising than originally assessed. This more refined disconnection strategyresulted in approximately 37% of the existing impermeable area being disconnectable. Thedisconnected flows were diverted to a mixture of initial loss, pervious area and storage attenuation.The most receptive of the three trial subcatchments, Frogmore (Buckhold Road), was shown bymodelling to spill 10 times in a typical year when the impermeable area was reduced by 50%.Correspondingly spill frequency for a 37% reduction would be more than 10 spills per year.
In parallel with the above, the whole life costs (capital and operational) for the final disconnectionoptions have been determined, at a cost of some £28M-£59M over a lifetime of 50 years for each ofthe 3 subcatchments. This assessment has been based on the methodology and database originallydeveloped for (new) SUDS by UKWIR/WERF in 2005 and subsequently updated by H R Wallingford.This has used data developed in a joint US-UK study with a time base of 2002. In the whole life costassessments the unit costs have been scaled up by an inflation factor of 1.25 (to 2009) and theTreasury discount rate has been taken as 3.5% in the analysis.
A review of the potential intangible and other costs and benefits in non-monetary terms has alsoidentified where these may be significant and add considerable value to the application of retrofitstormwater disconnections. This is particularly significant for mitigating and adapting to future climatechange, for which SUDS are much more resilient than piped/sewered drainage systems and can alsobring added benefits in terms of green space and amelioration of heat island problems.
As there are many associated benefits from using alternatives to piped and sewered drainagesystems for stormwater management; not only benefits relevant to the duties of the SewerageUndertakers, there may be a case for the costs of implementation being shared between the variousbeneficiaries, rather than borne by the Sewerage Undertaker alone.
Overall it is concluded in the present study that it is technically feasible to retrofit stormwaterdisconnection measures using SUDS which could potentially be effective at reducing the CSO spillsinto the River Thames. However, spill frequencies are likely to remain above 10 events per typicalyear even in areas where the strategy is the most practical.
There are also significant logistical, legal and regulatory impediments to the utilisation of SUDS asproposed, in the short to medium term. These include:
It would be necessary to engage with the very wide range and large numbers of individualstakeholders who would become involved directly and indirectly to ensure acceptability of thealternative arrangements;
There may be problems in defining responsibility for the long-term operation and maintenance of theretrofit SUDS. Although under the new Flood and Water Management Act 2010 and delivery of

8/13/2019 Needs report: appendix E
http://slidepdf.com/reader/full/needs-report-appendix-e 14/235
Surface Water Management Plans , Lead Local Flood and other Authorities will play a main role inadopting and managing any new SUDS in the future;
Using SUDS in the way proposed transfers the burden of stormwater management from theUndertaker to a variety of other stakeholders each of whom may be more or less competent toassume that responsibility and this would potentially increase the risks of poor performance and couldlead to third party problems due to exceedences / overflows when systems fail to perform asexpected;
If the proposals were to go ahead, there would be widespread disruption to local areas as the widenumber and types of SUDS proposed are constructed;
Expenditure by the Sewerage Undertakers in England should be directed only to investment insewerage assets, making investments in SUDS currently problematical;
There would be a need to obtain planning and building regulatory approval for the retrofit SUDS andalso the disconnection arrangements;
Agreements would be needed to access and in some cases, purchase, the land needed for the retrofitSUDS;
There would be a need to reach agreement with the roads/highway authority for the SUDS proposedin the roads and highwaysNotwithstanding the above, it is expected that the passing of the Flood and Water Management Act 2010 could address some of these major impediments for new developments and areas undergoing
redevelopment. The Act, however, does not deal specifically with retrofitting altered stormwater
management measures and how these would be dealt with still remains to be seen. The proposed
approach is also in keeping with current initiatives to pass on the true costs of stormwater
management from Ofwat, and as given in the Walker Review (December 2009) report.

8/13/2019 Needs report: appendix E
http://slidepdf.com/reader/full/needs-report-appendix-e 15/235
8/13/2019 Needs report: appendix E
http://slidepdf.com/reader/full/needs-report-appendix-e 16/235
1. Introduction and objectives
The Tideway Tunnels are being designed to significantly reduce the spill flows from Combined Sewer
Overflows (CSOs) and Pumping Stations into the River Thames in London. The planned intervention strategies to transfer the flow into the tunnel have, in many cases, resulted in costly diversion
structures. However, in some instances the volumes and magnitudes of the spilled flow are
relatively small and this has raised the question as to whether other options, for example, the
introduction of Sustainable Drainage Systems (SUDS)1, could see a potential benefit in the reduction
of the spilled flow and hence in a reduced cost, or the entire elimination of some diversion or
overflow structures, balanced against the cost and practicability of the implementation of SUDS
systems within the urbanised areas. The latter not only include the selection and design costs; the
capital and construction costs but also the social, economic and environmental costs and impacts
associated with their acceptance and agreed implementation with all stakeholders, particularly the
public.
This report considers the potential to influence the performance of the stormwater system by
reducing the frequency, volumes and flows of overflow at certain of the CSOs, within three of the
sub ‐catchments – Putney Bridge, West Putney and Frogmore (Buckhold Road), by use of source
control and other SUDS techniques within the sub ‐catchments. The report considers the
performance and cost benefit potential associated with the application of SUDS within the three
areas which collectively cover the highly urbanised inner urban areas and less urbanised, more
peripheral areas that form part of the overall sewer network.
The overall objective of the study has been to review the potential for source control and other
SUDS options to reduce stormwater flows to CSOs in the Thames catchment, by the following:
Reviewing and defining pilot catchments for the evaluation of the above as examples of what may be achievable.
Defining specific opportunities within the pilot catchments in terms of technical,
environmental and practicability criteria and evaluating the performance in terms of flow reduction and consequences for downstream CSO spill flows, volumes and
frequency reduction
Evaluating the social, regulatory and other opportunities and barriers to implementation
of the useable opportunities (as defined above) based on desk studies.
Estimation of the potential cost ‐benefits of the usable options based on readily available
data and tools (e.g. WERF/UKWIR, 2005)
Recommendations for the selection of the primary retrofit options in the studied
catchments and the practicability and value of implementation.
Recommend further work to support the better definition and utilisation of source
control and SUDS measures for the Thames catchment as a whole.
There has been a growing awareness amongst policy makers and regulators that surface water
drainage will become an increasing challenge in the future. In her recent interim report Walker (The
Independent Review of Charging for Household Water and Sewerage Services, 2009), focusing on
householders, points out that: “The surface water drainage charge is on average 9 per cent of the combined household water and sewerage bill, but varies significantly between companies. Surface
1 Defined as: “surface water drainage systems developed in line with the ideals of sustainable development “
(CIRIA, 2007).
8/13/2019 Needs report: appendix E
http://slidepdf.com/reader/full/needs-report-appendix-e 17/235
water drainage will be an increasingly significant issue in the future, as the likely effect of climate change – bringing shorter and heavier periods of rainfall – has potential implications for the necessary size of sewers, which in turn has implications for future costs .”
The review goes on to say: “Implementing these recommendations will have an impact on the future costs for sewerage companies of surface water and highway drainage. In particular, sustainable drainage systems (SUDS) will reduce the amount of water that runs off into the sewerage system. These recommendations highlight the importance of ensuring the capacity of the sewerage system achieves an acceptably low risk of surface flooding in the future. It will be important to establish the right incentives to encourage SUDS where appropriate, as SUDS offer an alternative to increasing the capacity of the sewerage system; it therefore reduces the need to make investment in the future and helps achieve lower future bills. This would also accord with the fairness principles of complying with the ‘polluter pays’ principle, reflecting in charges the costs that particular customers impose on the system.” (Walker, 2009).
Whilst encouraging to the use of non ‐piped/sewered drainage systems, these sentiments apply to
new developments and the control of extensions to paving gardens and similar areas. Although it
does recognise some of the problems: “For existing households, it is difficult to exclude households from the benefits of rainwater drainage services; whether a property is flooded will depend largely on the drainage services supplied to all neighbouring properties, and not simply to their own property. On the other hand, the costs a particular property imposes on the system depend on its drained area .”
The interim recommendation in relation to households: “looking to the future, it has to be recognised that households will need to be incentivized to consider SUDS as a way of alleviating the likely effects of climate change in rainfall patterns. It is important to start looking now at what can be done to minimise future problems caused by an increase in peak rainwater run ‐off. To achieve this, there needs to be an incentive for existing homes to reduce the amount of water run ‐off from a
property. The review team recommends that Defra, the Assembly government, the Environment Agency, Ofwat and sewerage companies should consider how the future charging system could incentivise householders to minimise the amount of rainwater run ‐off from existing and new households, including incentives to install small ‐scale sustainable drainage systems.”
In the present study the focus is on managing existing dense urban areas using retrofit stormwater
drainage systems and is not restricted only to households, but covers all developed areas within the
London Tideway Tunnels catchment.
The use of retrofit SUDS to materially influence the use of the London Tideway tunnels, has been
variously considered previously and their utilisation discounted for large ‐scale benefits although
there were some initial indications that there may be value in investigating these options further
(Binnie, Black & Veatch, 2002; Jacobs, 2006).
Globally there is widespread agreement that the use of SUDS or non ‐piped/sewered drainage
systems as part of a much broader approach to stormwater management planning wherever feasible
for stormwater management is preferable and generally more sustainable as part of a ‘whole ‐
systems approach’ (e.g. Weinstein et al, 2009) and can add a wide range of multi ‐benefits to urban
environments within a ‘green infrastructure’ approach advocated by the Centre for Neighbourhood
Technology (Wise et al, 2010). Outside the UK the approach is known variously as: Water Sensitive
Urban Design (WSUD) in Australasia (Engineers Australia, 2006); and as Low Impact development
(LID) (and/or Water Sensitive Planning and Design) that includes Best Management Practices (BMPs)
in the USA (e.g. France, 2002). In continental Europe a number of initiatives have taken the same
approach and recent and on ‐going studies are attempting to develop guidance and decision support tools for the application of these approaches – e.g. the pan ‐European DayWater project (Thevenot,
8/13/2019 Needs report: appendix E
http://slidepdf.com/reader/full/needs-report-appendix-e 18/235
2008) and the Danish 2BG project (Jensen, 2008). Even in the UK, the forthcoming Technology
Strategy Board business case considering opportunities in the priority technology area of Integrated
Urban Water Management (IUWM) has identified the need to manage the water cycle more
holistically. As well as advocating the use of WSUD in land use planning, storm ‐water and
wastewater source control and pollution prevention; storm ‐water flow and quality management and
the use of mixtures of soft (ecological/green) and hard (infrastructure) technologies are identified as three of the main ways of realising the benefits from IUWM (TSB, in print).
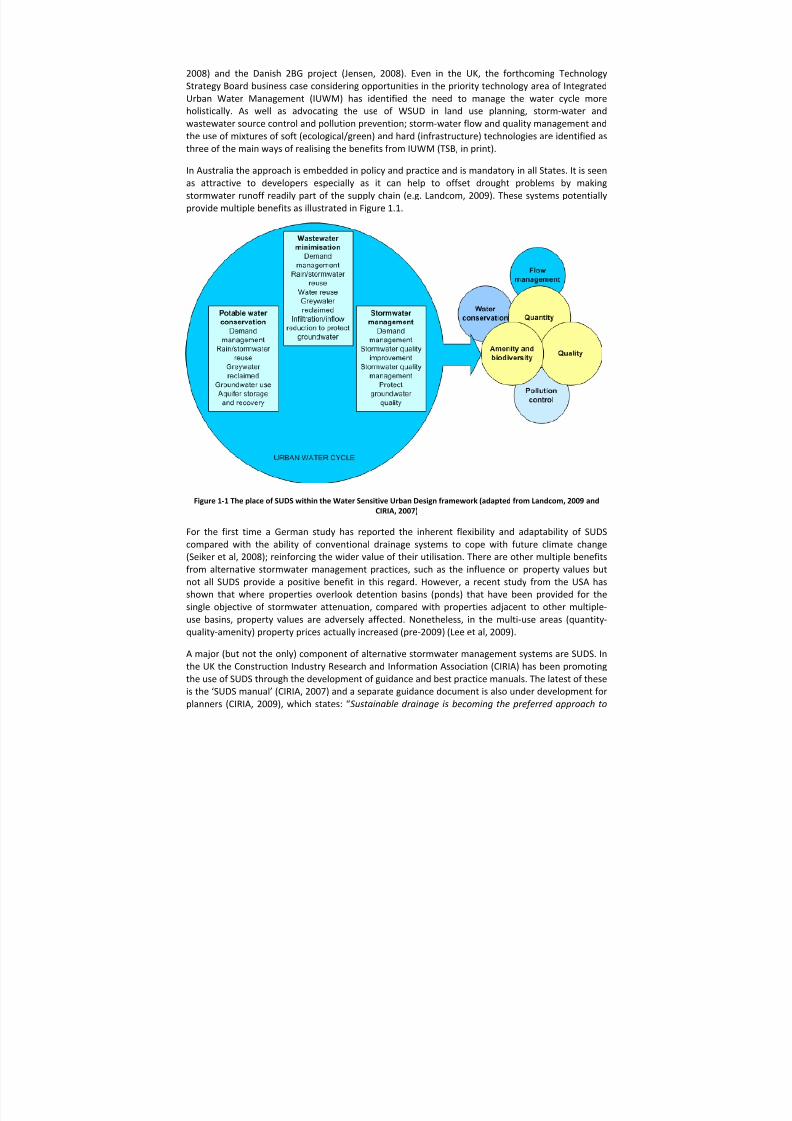
In Australia the approach is embedded in policy and practice and is mandatory in all States. It is seen
as attractive to developers especially as it can help to offset drought problems by making
stormwater runoff readily part of the supply chain (e.g. Landcom, 2009). These systems potentially
provide multiple benefits as illustrated in Figure 1.1.
Figure 1‐1 The place of SUDS within the Water Sensitive Urban Design framework (adapted from Landcom, 2009 and CIRIA, 2007)
For the first time a German study has reported the inherent flexibility and adaptability of SUDS
compared with the ability of conventional drainage systems to cope with future climate change
(Seiker et al, 2008); reinforcing the wider value of their utilisation. There are other multiple benefits from alternative stormwater management practices, such as the influence on property values but
not all SUDS provide a positive benefit in this regard. However, a recent study from the USA has
shown that where properties overlook detention basins (ponds) that have been provided for the
single objective of stormwater attenuation, compared with properties adjacent to other multiple ‐
use basins, property values are adversely affected. Nonetheless, in the multi ‐use areas (quantity ‐
quality ‐amenity) property prices actually increased (pre ‐2009) (Lee et al, 2009).
A major (but not the only) component of alternative stormwater management systems are SUDS. In
the UK the Construction Industry Research and Information Association (CIRIA) has been promoting
the use of SUDS through the development of guidance and best practice manuals. The latest of these
is the ‘SUDS manual’ (CIRIA, 2007) and a separate guidance document is also under development for planners (CIRIA, 2009), which states: “Sustainable drainage is becoming the preferred approach to
8/13/2019 Needs report: appendix E
http://slidepdf.com/reader/full/needs-report-appendix-e 19/235
managing rainfall and surface water in developments. Delivering sustainable drainage systems (SUDS) can provide a number of benefits for those that live, work and play in or around a development. They can help manage flood risk and water quality as well as provide better places to live by providing habitat for wildlife and improved amenity ”. In Figure 1.1 the CIRIA (2007) vision of the use of SUDS, shown in yellow, is related to the larger picture of WSUD as now being practiced
elsewhere in many parts of the world.
Unlike Australia, in the UK the use of SUDS techniques as part of this holistic and more integrated
approach to urban water management, is only now beginning to emerge. In England, there is a
preponderance of interest in the water quantity management aspects of these systems, despite the
coming need to better control urban runoff diffuse pollution as required under the Water
Framework Directive. The difficulties of taking an integrated approach in England relate to the
fragmentation of responsibilities and different scope of the key players in the management of the
urban water cycle. Hence much of the benefits of this approach cannot be readily realised despite
attempts to encourage the use of SUDS in planning guidance. In the study reported here, TW are
concerned to provide a better quality of water in the Tideway Thames by controlling the polluting
impacts from the existing combined sewer overflow (CSO) discharges, a requirement under the
Urban Wastewater Treatment Directive, but also to enhance the ecology and usability of the River.
Longer term there may be a wish to address the potential for potable and other water uses from
stormwater in the Tideway Thames catchments and also to provide a system that will enable
developers, local authorities and others to enhance amenity and other benefits as is now being
promoted in the USA (Wise et al, 2010). This may include addressing climate change problems such
as the better management of the urban heat island through ‘greening’ (e.g. Mitchell et al,2008); the
enhancement of streetscapes using water features and the direct use of stormwater for supply
purposes. However, the immediate need is to manage the stormwater in the Thames Tideway (TT) catchments such that the frequency, volume and rate of spills from the existing CSOs are reduced to
acceptable levels as indicated by the Urban Waste Water Treatment Directive (UWWTD). Therefore
this report concentrates on the potential use of SUDS retrofitted into the Thames catchments as a means of reducing the rate and volume of runoff into the sewer network, through stormwater
disconnection. In this study no consideration is given to the additional value of managing the
stormwater for local flood risk reduction or other purposes other than as possible additional
potential benefits from using SUDS as an alternative.
A difficulty in applying the wide range of guidance for using SUDS, WSUD and LID approaches to the
Thames catchments is that most of the available guidance is aimed at new developments, whereas
what is required in this study is to attempt to retrofit SUDS into the existing urban areas in London.
There is much less guidance available as to how best to do this. In the UK there is no specific
guidance for retrofitting and the only studies have been those by SNIFFER (2006); Stovin & Swan
(2007); Stovin et al (2007). Recently a number of pilot studies conducted by Defra but focused on flood risk management, have showed that the well ‐planned use of retrofit SUDS is a feasible
alternative to conventional piped/sewered systems (Gill, 2008) and retrofitting non ‐piped systems is
a key component of the first generation of Surface Water Management Plans (SWMPs, Defra, 2010)
e.g. Falconer (2009). In the USA retrofitting is virtually ‘standard practice’ employed to reduce the
size of large sewer storage tunnels (Natural Resources Defence Council, 2006; Weinstein et al, 2006),
although much of the approach relies on usable infiltration capacity. US Guidance is also available
from the Center for Watershed Protection (2007).
The present report considers a much wider range of SUDS options than in the other recent studies
looking at their use in London and shows that technically and hydraulically, there is scope for SUDS
to reduce certain CSO spill volumes and frequencies. However, the practicalities of application on

8/13/2019 Needs report: appendix E
http://slidepdf.com/reader/full/needs-report-appendix-e 20/235
the ground make their implementation difficult and not without considerable risk within current
Governance and regulatory regimes. This report is laid out as summarised below:
In section 2 the work undertaken and methods used are introduced.
In Section 3 the approach to the selection of retrofit SUDS options is set out.
Section 4 deals with the performance criteria for the SUDS units
Section 5 reviews the practicalities of utilisation of retrofit SUDS for the Thames catchment.
Section 6 illustrates by way of example, the detailed application of retrofit SUDS for selected
areas.
Section 7 outlines the approach used to assess the disconnection of stormwater potential at
Thames catchment scale.
Section 8 considers available information about the cost benefits of retrofitting SUDS and
stormwater disconnection.
Section 9 up scales the results from the detailed analyses in Section 6 from the three
catchments investigated in detail to estimate the costs of application.
Section 10 considers the usage of the disconnection findings in Thames catchment hydraulic
modelling.
Section 11 summarises the investigation and gives conclusions.
Recommendations are given in Section 12.
Appendices are provided for:
The definition of the types of SUDS and their potential effectiveness for stormwater
disconnection is given in Appendix A
The SUDS considered in detail are illustrated in Appendix B
An examination of the current cost ‐benefit approaches available from UKWIR studies in
Appendix C
Practicalities of retrofitting in the areas investigated in detail in Appendix D
Details of the designs and costings for the example areas investigated in Appendix E
An illustrative photographic record of the areas examined in detail is given in Appendix F.
8/13/2019 Needs report: appendix E
http://slidepdf.com/reader/full/needs-report-appendix-e 21/235
2. Work carried out
This study has been undertaken by staff from the Pennine Water Group (PWG) at the University of
Sheffield, supported by HR Wallingford Ltd over an intense period of time from March – June 2009. This work has been carried out in association with CH2M Hill and Halcrow Group. The former
undertaking computational modelling of the TT sewerage network to evaluate the effectiveness or
otherwise of the disconnection options and the latter managing this study.
The core staff from PWG are amongst the leading UK proponents of the use of SUDS systems and
collectively have experience that is particularly relevant in: SUDS modelling and design (flow
quantity and quality); retrofit SUDS specification; accounting and economics of water systems and
related asset management; integrated urban drainage system modelling; design and adaptation to
climate change; futures and scenario analysis; sustainability assessment; local and catchment–wide
flood risk management; water system governance; diffuse pollution modelling and management;
and public
engagement.
Close
working
with
a
number
of
local
authorities
and
water
and
sewerage
managers in each of the countries of the UK and overseas, also ensures a wide vision and
understanding of the potential for the use of SUDS systems and also the barriers to implementation.
The PWG has also been previously involved in the development of the Thames (TTT) schemes
through: involvement in the original Thames Tideway Strategic Study (TTSS) steering group; in the
independent review of the 2007 proposals on behalf of Ofwat, working with Jacobs consulting; in an
initial computational model assessment of the regime proposed for sediment flushing from the
operational tunnels.
Following an initial introduction to the scope and requirements of the study, an overview of the
potential catchments to be examined was provided by the TT project team. From this, 3
subcatchments were selected as potentially providing benefits from retrofit stormwater disconnections as their sewerage system performance were such that relatively modest stormwater
disconnections (removing, slowing down or reducing the volume of flows entering the systems)
could potentially improve CSO spill performance. The subcatchments were also considered as areas
where there may be opportunities for retrofitting in terms of available land, density of properties
and open space. These areas are considered in Section 3.
The work concentrated initially on the technical, environmental and practicability aspects of selecting potential candidate retrofit options within each of the three test subcatchments. The
approach followed a sequence of: reviewing land uses, potential sites for retrofitting following the
framework given in Section 3 and using a GIS platform developed for and with PWG, in conjunction
with CH2M Hill to make a coarse estimate of what disconnections might be feasible at a large scale based on a hierarchy of preferred SUDS options. This provided the information for CH2M Hill to
make a first analysis of the potential effect of disconnection on the performance of the CSOs. A site
visit was able to determine on the ground opportunities for carrying out detailed designs and
costings as examples and then these were related to the wider Thames catchment GIS‐based
analysis to determine a more realistic potential disconnection assessment and overall cost
estimates. Option design had to utilise simple approaches in view of the time available, and outline
SUDS design was provided through the HR Wallingford SUDS whole life costing tool (WERF/UKWIR, 2005) that is continually being enhanced as new cost data become available.
After selection of the feasible options, the other elements of retrofit option selection and design
were considered. These relate to the local implications and practicability of utilisation (and
construction) of each option. An overview of water quality and environmental implications was also
undertaken (without any attempt at quality modelling). This provided a more detailed assessment of

8/13/2019 Needs report: appendix E
http://slidepdf.com/reader/full/needs-report-appendix-e 22/235
the likely regulatory, social, institutional (inc. adoptability) aspects of the primary candidate retrofit
options and identified key barriers to implementation and potential future changes in regulation
that may assist utilisation. To avoid raising undue adverse community reactions at this stage, the
assessment has been entirely desk ‐based with limited site visits.
It was expected that in order to compare the cost ‐benefits of the retrofit vs the ‘traditional’ options,
it would be necessary to review the way in which the TTT costs and benefits have been determined.
However, it proved not to be possible to interact with the TTT team sufficiently to do this. Hence,
the review of costs and benefits in this report are stand ‐alone. Hence, there may be certain aspects
of the costs ‐benefits and values presented here that are not commensurate with the interpretation
and assumptions made in the TTT studies.
A master list of potentially viable and cost ‐effective retrofit options has been drawn up considered in
terms of their implementation potential, including an assessment of taking a staged adaptive
approach over a period of time – and even potentially using these options in the future to
supplement the TTT as climate and other demands increase with time. Recommendations for
further staged assessments of the need and opportunities for retrofitting have also been defined.
The final conclusions provide recommendations for potential retrofit within the 3 studied
catchments and also the possibilities for scaling up across the London area, draining to the tunnel as
a whole.

8/13/2019 Needs report: appendix E
http://slidepdf.com/reader/full/needs-report-appendix-e 23/235
8/13/2019 Needs report: appendix E
http://slidepdf.com/reader/full/needs-report-appendix-e 24/235
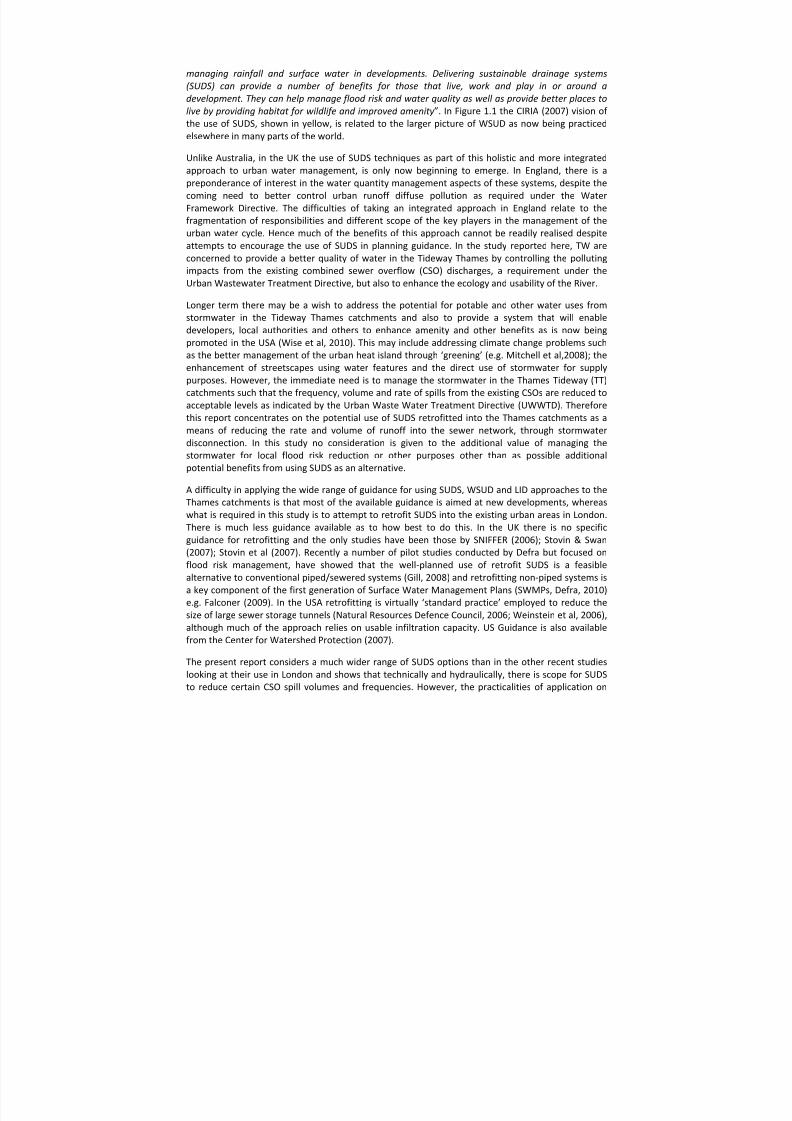
MCDM – Multi ‐criteria ‐decision ‐making
Figure 3‐1a SNIFFER Framework – Phase I Feasibility Assessment
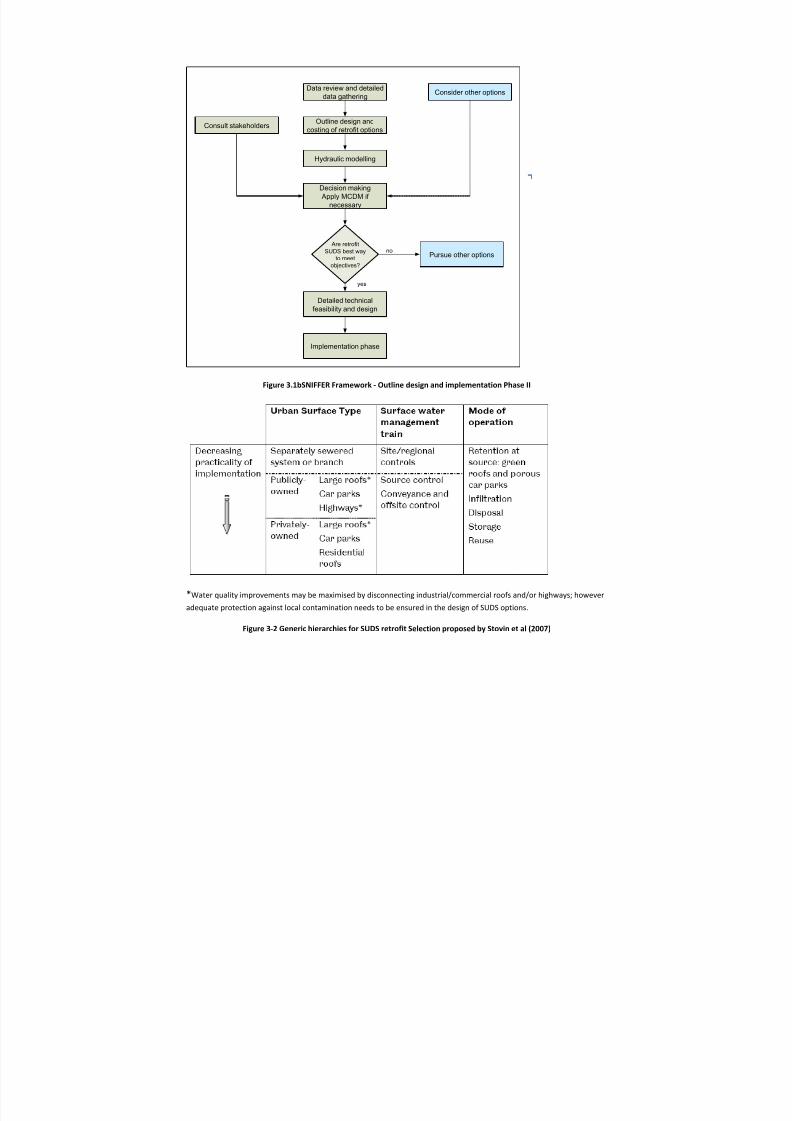
In a later study, Stovin et al (2007) built on an earlier methodology developed by Swan (2003) and
devised a hierarchy for selection of SUDS site for retrofit, Figure 3.2. This indicates a preference system for looking for the sites/SUDS options that will provide ‘quick‐wins’ first, in terms of being
the most straightforward to implement and also having a potentially significant impact.
8/13/2019 Needs report: appendix E
http://slidepdf.com/reader/full/needs-report-appendix-e 25/235
Data review and detaileddata gathering
Outline design andcosting of retrofit options
Hydraulic modelling
Decision making Apply MCDM if
necessary
Consider other options
Consult stakeholders
Are retrofitSUDS best way
to meetobjectives?
Detailed technicalfeasibility and design
Implementation phase
Pursue other optionsno
yes
Figure 3.1bSNIFFER Framework ‐ Outline design and implementation Phase II
*Water quality improvements may be maximised by disconnecting industrial/commercial roofs and/or highways; however
adequate protection against local contamination needs to be ensured in the design of SUDS options.
Figure 3‐2 Generic hierarchies for SUDS retrofit Selection proposed by Stovin et al (2007)
8/13/2019 Needs report: appendix E
http://slidepdf.com/reader/full/needs-report-appendix-e 26/235
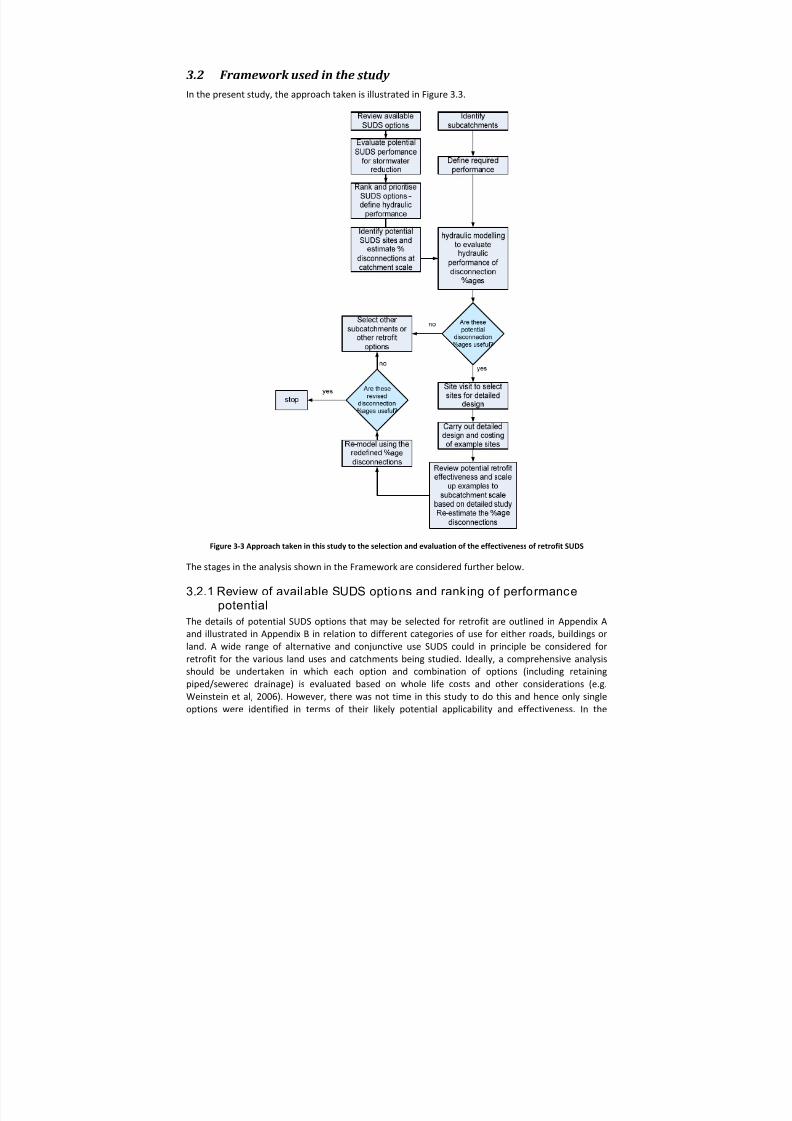
3.2 Framework used in the study In the present study, the approach taken is illustrated in Figure 3.3.
Figure 3‐3 Approach taken in this study to the selection and evaluation of the effectiveness of retrofit SUDS
The stages in the analysis shown in the Framework are considered further below.
3.2.1 Review of available SUDS options and rank ing o f performancepotential
The details of potential SUDS options that may be selected for retrofit are outlined in Appendix A
and illustrated in Appendix B in relation to different categories of use for either roads, buildings or
land. A wide range of alternative and conjunctive use SUDS could in principle be considered for
retrofit for the various land uses and catchments being studied. Ideally, a comprehensive analysis
should be undertaken in which each option and combination of options (including retaining
piped/sewered drainage) is evaluated based on whole life costs and other considerations (e.g.
Weinstein et al, 2006). However, there was not time in this study to do this and hence only single
options were identified in terms of their likely potential applicability and effectiveness. In the
8/13/2019 Needs report: appendix E
http://slidepdf.com/reader/full/needs-report-appendix-e 27/235
detailed analysis, Section 8, only one option was examined in detail for each land use investigated as
there was not time to compare alternatives. Expert judgement has been used to select what were
considered likely to be the most options.
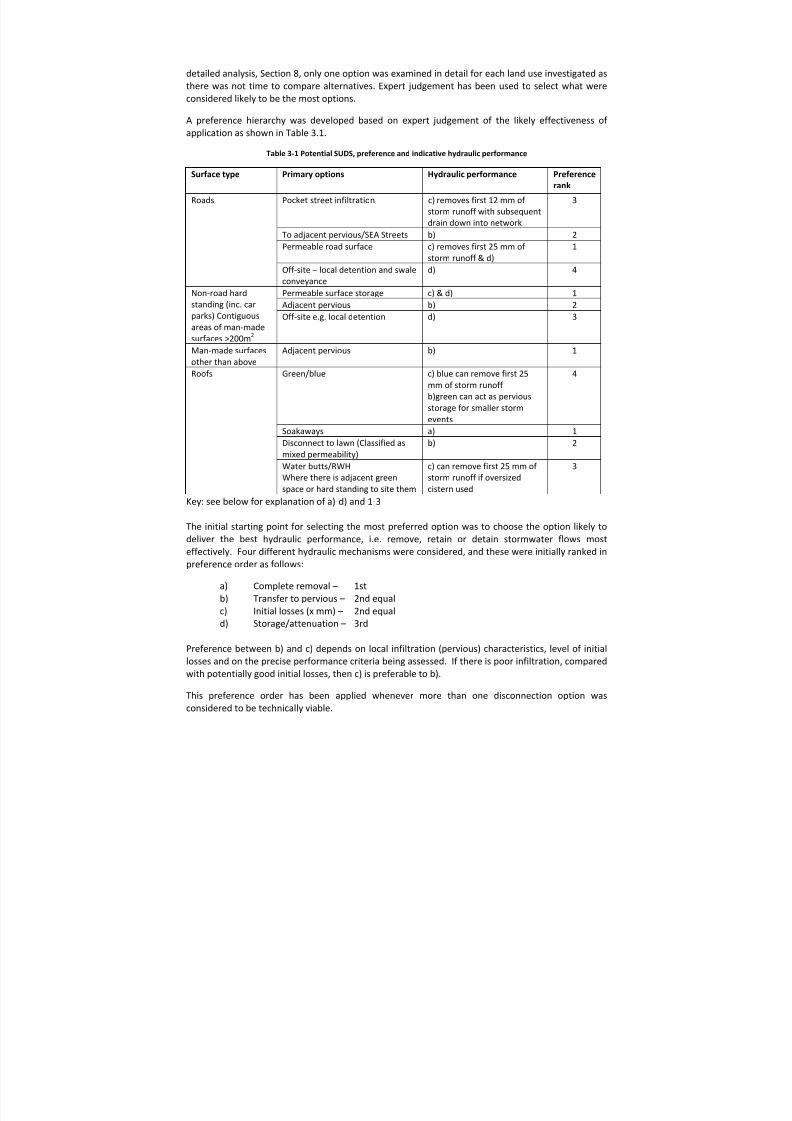
A preference hierarchy was developed based on expert judgement of the likely effectiveness of application as shown in Table 3.1.
Table 3‐1 Potential SUDS, preference and indicative hydraulic performance
Surface type Primary options Hydraulic performance Preference rank
Roads Pocket street infiltration c) removes first 12 mm of storm runoff with subsequent
drain down into network
3
To adjacent pervious/SEA Streets b) 2
Permeable road surface c) removes first 25 mm of storm runoff & d)
1
Off ‐site – local detention and swale
conveyance d) 4
Non ‐road hard
standing (inc. car
parks) Contiguous
areas of man ‐made
surfaces >200m 2
Permeable surface storage c) & d) 1
Adjacent pervious b) 2
Off ‐site e.g. local detention d) 3
Man ‐made surfaces
other than above Adjacent pervious b) 1
Roofs Green/blue c) blue can remove first 25
mm of storm runoff b)green can act as pervious
storage for smaller storm
events
4
Soakaways a) 1
Disconnect to lawn (Classified as
mixed permeability) b) 2
Water butts/RWHWhere there is adjacent green
space or hard standing to site them
c) can remove first 25 mm of storm runoff if oversized
cistern used
3
Key: see below for explanation of a) ‐d) and 1‐3
The initial starting point for selecting the most preferred option was to choose the option likely to
deliver the best hydraulic performance, i.e. remove, retain or detain stormwater flows most
effectively. Four different hydraulic mechanisms were considered, and these were initially ranked in preference order as follows:
a) Complete removal – 1st
b) Transfer to pervious – 2nd equal
c) Initial losses (x mm) – 2nd equal
d) Storage/attenuation – 3rd
Preference between b) and c) depends on local infiltration (pervious) characteristics, level of initial
losses and on the precise performance criteria being assessed. If there is poor infiltration, compared
with potentially good initial losses, then c) is preferable to b).
This preference order has been applied whenever more than one disconnection option was considered to be technically viable.

8/13/2019 Needs report: appendix E
http://slidepdf.com/reader/full/needs-report-appendix-e 28/235
The initial evaluation considered source control options only, in keeping with the preference
hierarchy promoted by the Center for Watershed Protection (2007) and Weinstein et al (2006). This
was because ‘regional controls’ (CIRIA, 2007), such as storage ponds, detention basins an inter ‐
linking swales were considered as ‘end ‐of ‐system’ options, collecting runoff from a succession or
number of contributing areas. Given the available guidance, the study concentrated initially on
source controls as the best options as part of potential downstream ‘treatment trains’. This assumption was found subsequently to be too limiting in the subcatchments investigated as these
had considerable areas of green space that was found to be suitable for regional, or near end of system, SUDS (Section 8). This led to a re ‐evaluation of the potential stormwater disconnections
from the initial appraisal and the final analysis (Section 9) and a refinement of the preference order
(Section 4.2.1).
8/13/2019 Needs report: appendix E
http://slidepdf.com/reader/full/needs-report-appendix-e 29/235
4. Identif ication of subcatchments and performancecriteria
4.1
Identification of
subcatchments
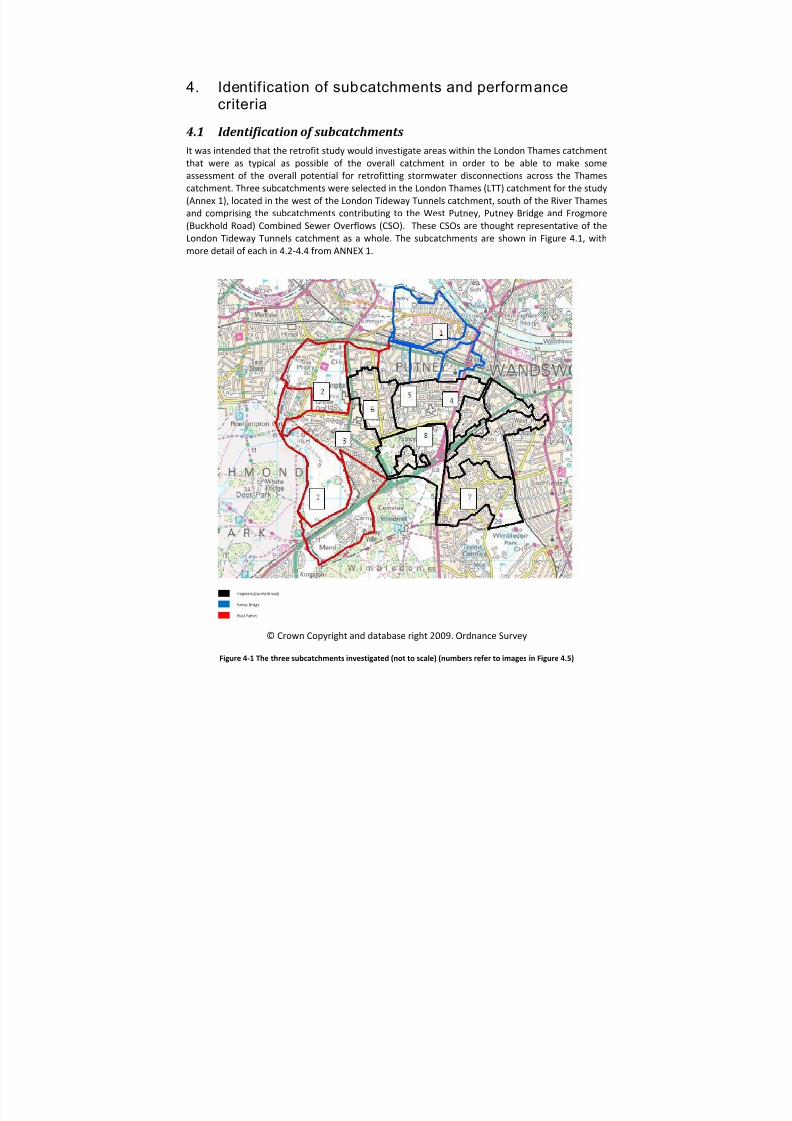
It was intended that the retrofit study would investigate areas within the London Thames catchment
that were as typical as possible of the overall catchment in order to be able to make some
assessment of the overall potential for retrofitting stormwater disconnections across the Thames
catchment. Three subcatchments were selected in the London Thames (LTT) catchment for the study
(Annex 1), located in the west of the London Tideway Tunnels catchment, south of the River Thames
and comprising the subcatchments contributing to the West Putney, Putney Bridge and Frogmore
(Buckhold Road) Combined Sewer Overflows (CSO). These CSOs are thought representative of the
London Tideway Tunnels catchment as a whole. The subcatchments are shown in Figure 4.1, with
more detail of each in 4.2 ‐4.4 from ANNEX 1.
© Crown Copyright and database right 2009. Ordnance Survey
Figure 4‐1 The three subcatchments investigated (not to scale) (numbers refer to images in Figure 4.5)
8/13/2019 Needs report: appendix E
http://slidepdf.com/reader/full/needs-report-appendix-e 30/235
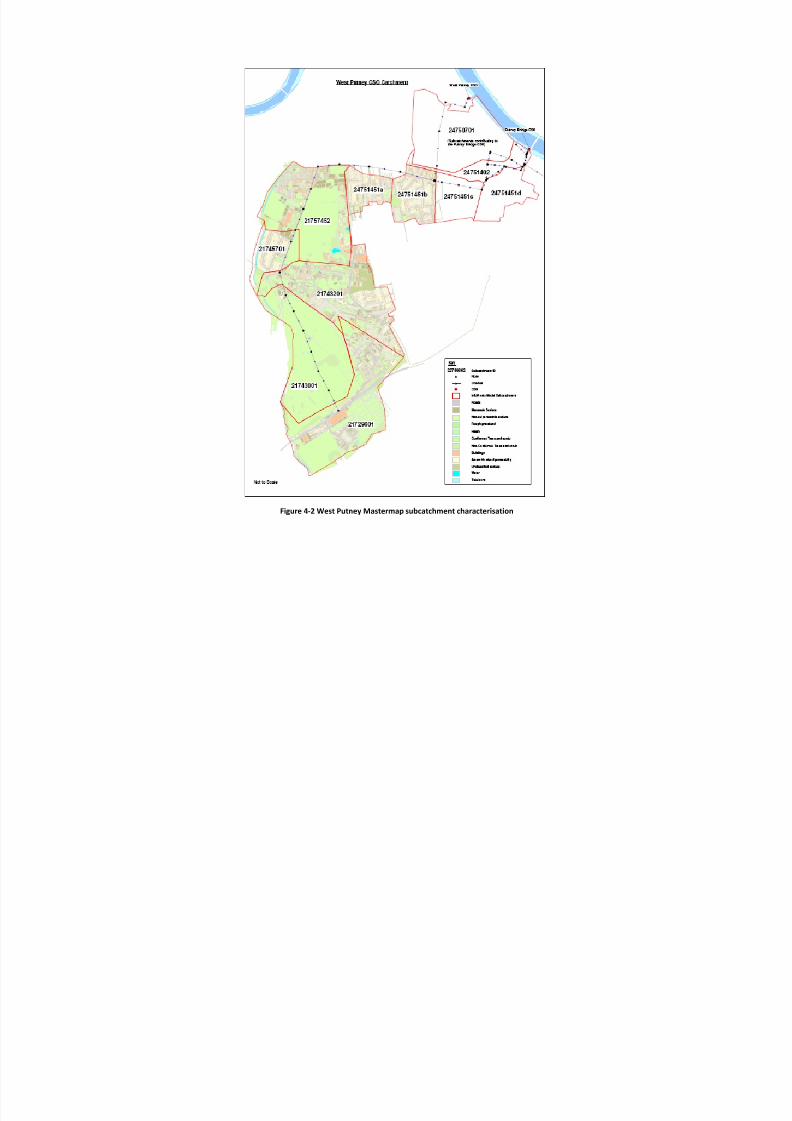
Figure 4‐2 West Putney Mastermap subcatchment characterisation
8/13/2019 Needs report: appendix E
http://slidepdf.com/reader/full/needs-report-appendix-e 31/235
20
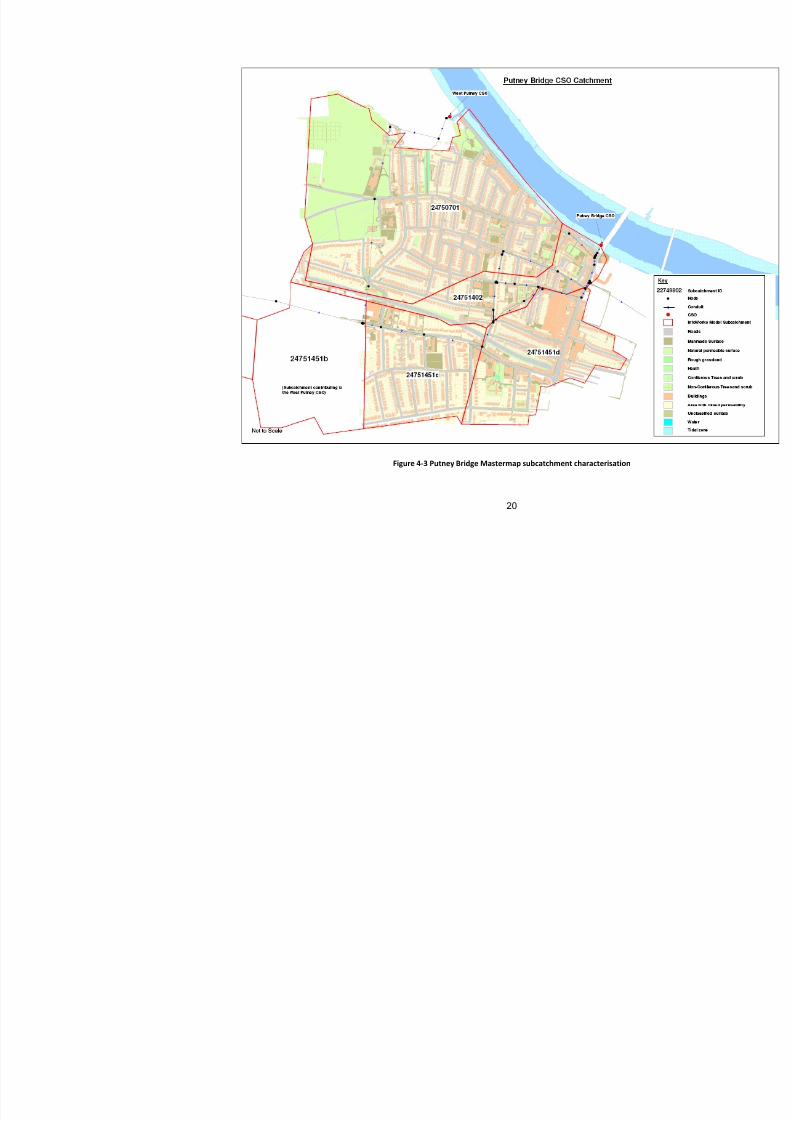
Figure 4‐3 Putney Bridge Mastermap subcatchment characterisation
8/13/2019 Needs report: appendix E
http://slidepdf.com/reader/full/needs-report-appendix-e 32/235
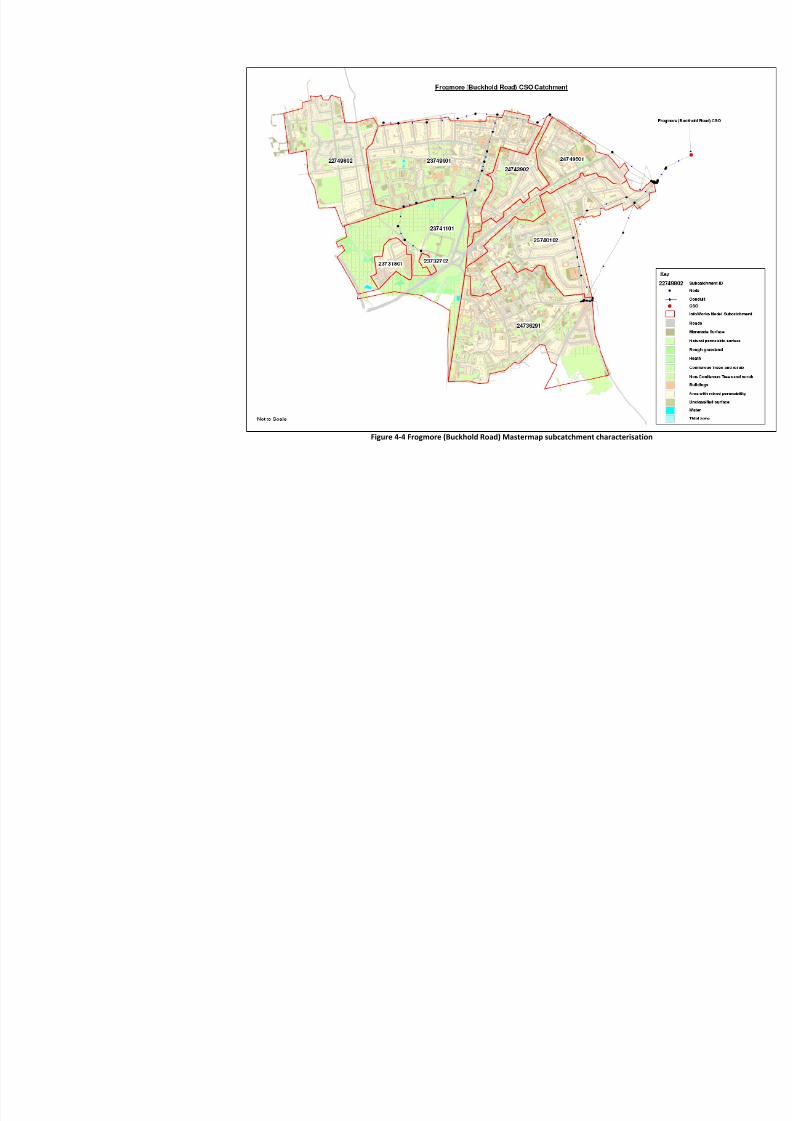
Figure 4‐4 Frogmore (Buckhold Road) Mastermap subcatchment characterisation
8/13/2019 Needs report: appendix E
http://slidepdf.com/reader/full/needs-report-appendix-e 33/235
22
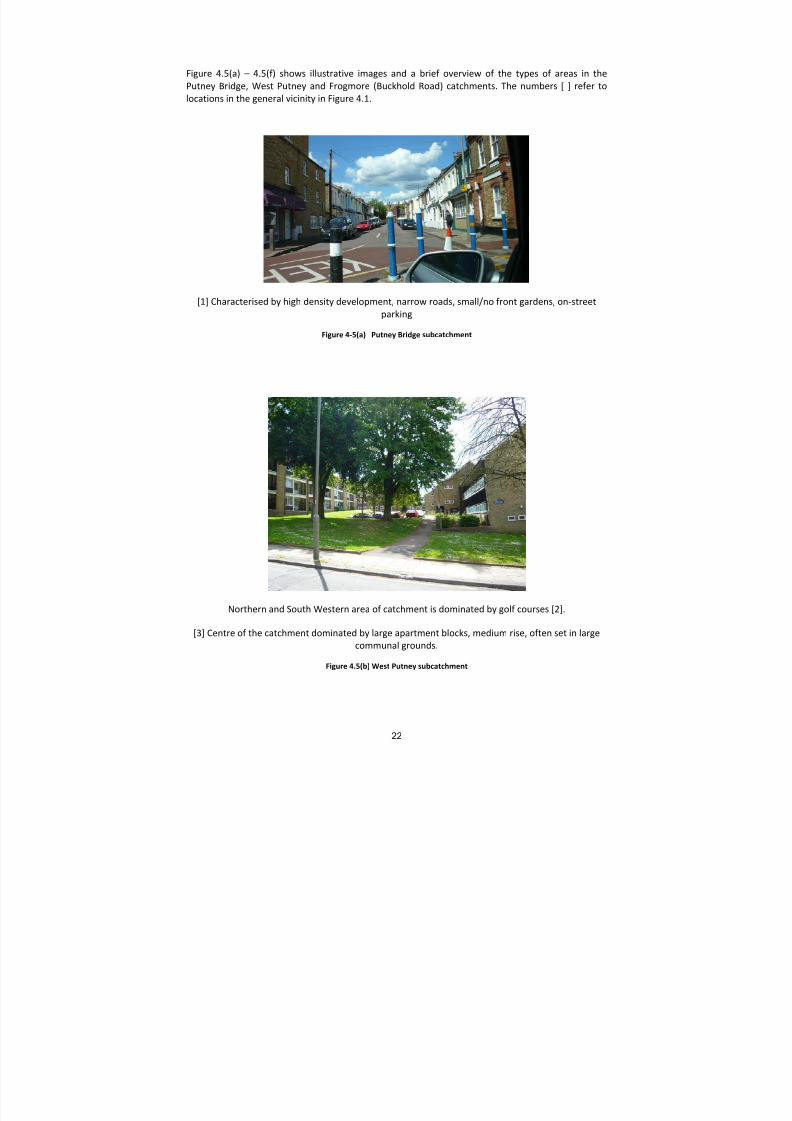
Figure 4.5(a) – 4.5(f) shows illustrative images and a brief overview of the types of areas in the
Putney Bridge, West Putney and Frogmore (Buckhold Road) catchments. The numbers [ ] refer to
locations in the general vicinity in Figure 4.1.
[1] Characterised by high density development, narrow roads, small/no front gardens, on ‐street
parking
Figure 4‐5(a) Putney Bridge subcatchment
Northern and South Western area of catchment is dominated by golf courses [2].
[3] Centre of the catchment dominated by large apartment blocks, medium rise, often set in large
communal grounds.
Figure 4.5(b) West Putney subcatchment

8/13/2019 Needs report: appendix E
http://slidepdf.com/reader/full/needs-report-appendix-e 34/235
Much of the Frogmore catchment is characterised by large apartment blocks [3], particularly in area
[4]. Medium density housing, often with large back gardens is found in the NE Frogmore catchment
[5]. These areas often have wider roads than other residential areas. Many houses have off ‐street parking with partially paved front gardens.
Figure 4.5(c) Frogmore (Buckhold Road) subcatchment
There are also Institutional Buildings, such as hospitals. Large buildings, often with lots of landscaped
grounds and paved areas
Figure 4.5(d) Frogmore (Buckhold Road) subcatchment
8/13/2019 Needs report: appendix E
http://slidepdf.com/reader/full/needs-report-appendix-e 35/235
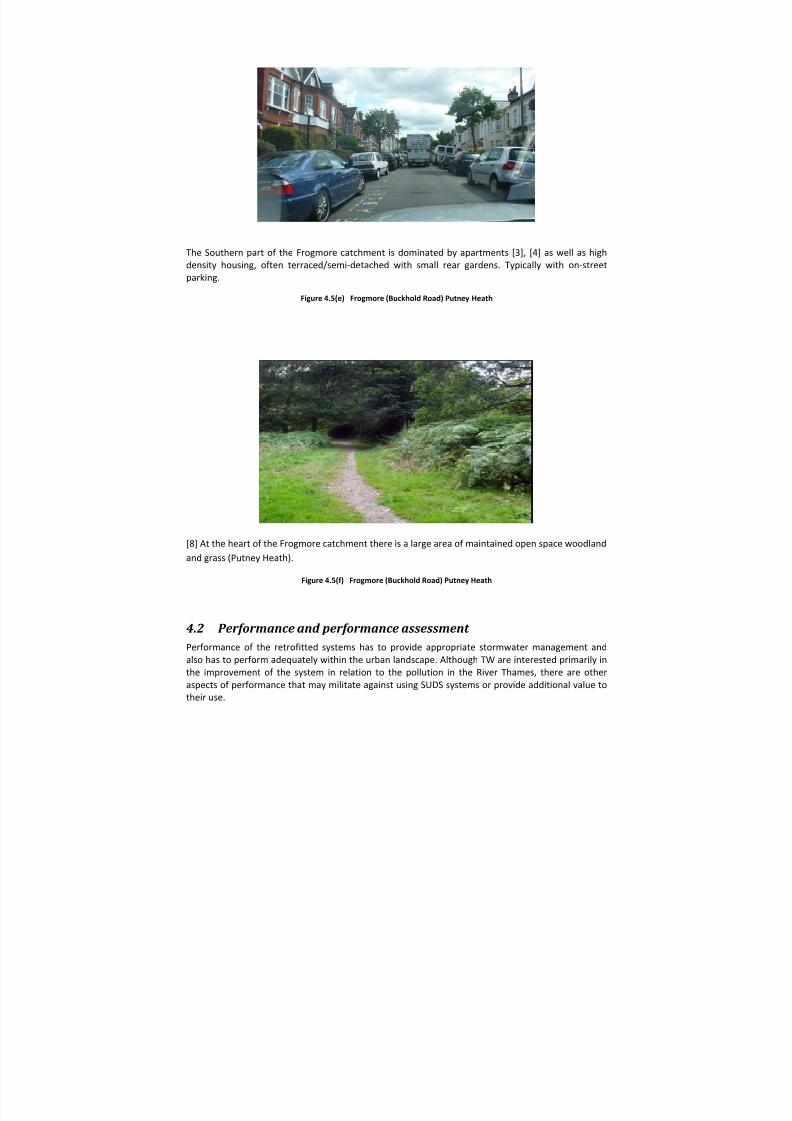
The Southern part of the Frogmore catchment is dominated by apartments [3], [4] as well as high
density housing, often terraced/semi ‐detached with small rear gardens. Typically with on ‐street
parking.
Figure 4.5(e) Frogmore (Buckhold Road) Putney Heath
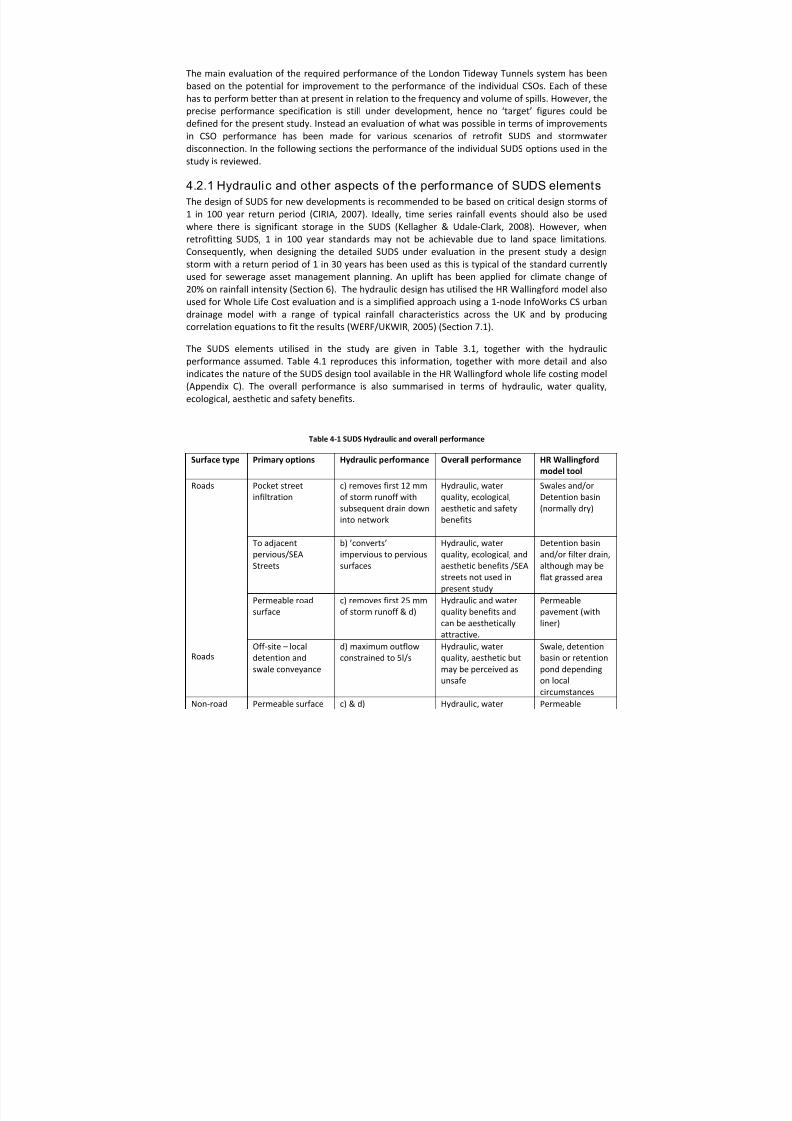
[8] At the heart of the Frogmore catchment there is a large area of maintained open space woodland
and grass (Putney Heath).
Figure 4.5(f) Frogmore (Buckhold Road) Putney Heath
4.2 Performance and performance assessment Performance of the retrofitted systems has to provide appropriate stormwater management and
also has to perform adequately within the urban landscape. Although TW are interested primarily in
the improvement of the system in relation to the pollution in the River Thames, there are other
aspects of performance that may militate against using SUDS systems or provide additional value to
their use.
8/13/2019 Needs report: appendix E
http://slidepdf.com/reader/full/needs-report-appendix-e 36/235
The main evaluation of the required performance of the London Tideway Tunnels system has been
based on the potential for improvement to the performance of the individual CSOs. Each of these
has to perform better than at present in relation to the frequency and volume of spills. However, the
precise performance specification is still under development, hence no ‘target’ figures could be
defined for the present study. Instead an evaluation of what was possible in terms of improvements
in CSO performance has been made for various scenarios of retrofit SUDS and stormwater disconnection. In the following sections the performance of the individual SUDS options used in the
study is reviewed.
4.2.1 Hydrauli c and other aspects o f the performance of SUDS elementsThe design of SUDS for new developments is recommended to be based on critical design storms of 1 in 100 year return period (CIRIA, 2007). Ideally, time series rainfall events should also be used
where there is significant storage in the SUDS (Kellagher & Udale ‐Clark, 2008). However, when
retrofitting SUDS, 1 in 100 year standards may not be achievable due to land space limitations.
Consequently, when designing the detailed SUDS under evaluation in the present study a design
storm with a return period of 1 in 30 years has been used as this is typical of the standard currently
used for sewerage asset management planning. An uplift has been applied for climate change of 20% on rainfall intensity (Section 6). The hydraulic design has utilised the HR Wallingford model also
used for Whole Life Cost evaluation and is a simplified approach using a 1‐node InfoWorks CS urban
drainage model with a range of typical rainfall characteristics across the UK and by producing
correlation equations to fit the results (WERF/UKWIR, 2005) (Section 7.1).
The SUDS elements utilised in the study are given in Table 3.1, together with the hydraulic
performance assumed. Table 4.1 reproduces this information, together with more detail and also
indicates the nature of the SUDS design tool available in the HR Wallingford whole life costing model
(Appendix C). The overall performance is also summarised in terms of hydraulic, water quality,
ecological, aesthetic and safety benefits.
Table 4‐1 SUDS Hydraulic and overall performance
Surface type Primary options Hydraulic performance Overall performance HR Wallingford model tool
Roads
Roads
Pocket street
infiltration c) removes first 12 mmof storm runoff with
subsequent drain down
into network
Hydraulic, water
quality, ecological,
aesthetic and safety
benefits
Swales and/or
Detention basin
(normally dry)
To adjacent
pervious/SEA Streets
b) ’converts’
impervious to pervious surfaces
Hydraulic, water
quality, ecological, and aesthetic benefits /SEA
streets not used in
present study
Detention basin
and/or filter drain, although may be
flat grassed area
Permeable road
surface c) removes first 25 mm
of storm runoff & d) Hydraulic and water
quality benefits and
can be aesthetically
attractive.
Permeable
pavement (with
liner)
Off ‐site – local
detention and
swale conveyance
d) maximum outflow
constrained to 5l/s Hydraulic, water
quality, aesthetic but
may be perceived as
unsafe
Swale, detention
basin or retention
pond depending
on local
circumstances Non ‐road Permeable surface c) & d) Hydraulic, water Permeable
8/13/2019 Needs report: appendix E
http://slidepdf.com/reader/full/needs-report-appendix-e 37/235
Surface type Primary options Hydraulic performance Overall performance HR Wallingford model tool
hard
standing (inc.
car parks)
Contiguous
areas of man ‐made
surfaces
>200m 2
storage quality, ecological,
aesthetic benefits pavement (with
liner)
Adjacent pervious b) Hydraulic, water
quality, ecological,
aesthetic benefits
Detention basin
and/or filter drain,
although may be
flat grassed area
Off ‐site e.g. local
detention d) Hydraulic and water
quality benefits Swale, detention
basin or retention
pond depending
on local
circumstances
Man ‐made
surfaces
other than
above
Adjacent pervious b) Hydraulic, water
quality, ecological,
aesthetic benefits
Detention basin
and/or filter drain,
although may be
flat grassed area
Roofs Green/blue c) blue can remove first
25 mm of storm runoff b)green can act as
pervious storage for
smaller storm events
assume 25mm
Green only used:
Hydraulic, water
quality, ecological,
aesthetic benefits
Not included
Soakaways a) Not used in present
study Filter drain/trench
Disconnect to lawn
(Classified as mixed
permeability)
b) Hydraulic, water
quality, ecological,
aesthetic and safety
benefits
Detention basin
and/or filter drain,
although may be
flat grassed area
Water butts/RWH
Where there is
adjacent green
space or hard
standing to site
them
c) can remove first 25
mm of storm runoff if oversized cistern used.
Not used in present
study although
considered optionally.
Hydraulic and
ecological benefits
As well as supply
supplement potential.
Not included
Key a) Complete removal – 1st
b) Transfer to pervious – 2nd equal
c) Initial losses (x mm) – 2nd equal
d) Storage/attenuation – 3rd
Only those SUDS units used in the present study have been reviewed in terms of their performance
in the following sections.
4.2.1.1 Pocket Street infiltration (see Appendix E.3) This is illustrated in Figure 4.6. Provided these units in plan are at least 2% of the impervious area
connected (Melbourne Water, 2005), these have recently been shown to provide on average some
33% reduction in inflow volumes and may attenuate peak flow rates by up to 80% (Hatt et al, 2009).
Although tested in Australian conditions, this study also showed no apparent changes to these
quantitative benefits in different seasons. Nonetheless it has been considered prudent here to treat
them as attenuation systems only. The specified outflow has been restricted to 5l/s and growing
media (soil supported by sand and gravel) has been included. The attenuation is conservatively
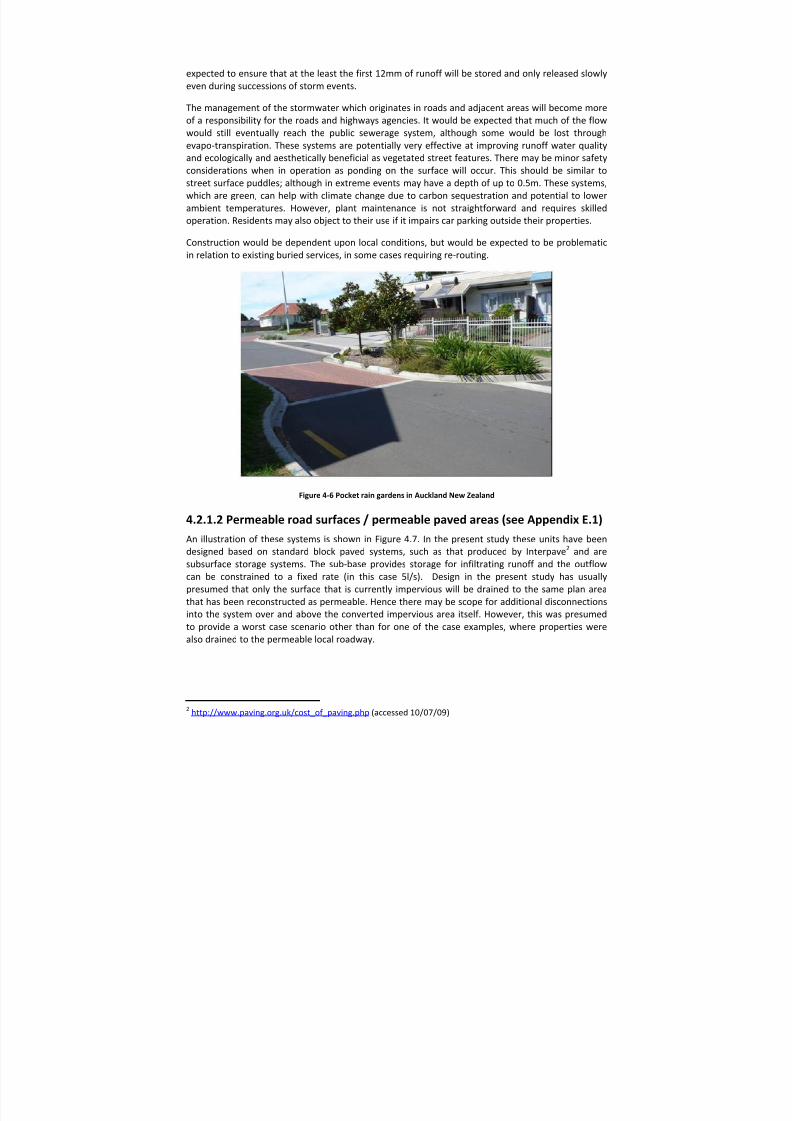
8/13/2019 Needs report: appendix E
http://slidepdf.com/reader/full/needs-report-appendix-e 38/235
expected to ensure that at the least the first 12mm of runoff will be stored and only released slowly
even during successions of storm events.
The management of the stormwater which originates in roads and adjacent areas will become more
of a responsibility for the roads and highways agencies. It would be expected that much of the flow
would still eventually reach the public sewerage system, although some would be lost through
evapo ‐transpiration. These systems are potentially very effective at improving runoff water quality
and ecologically and aesthetically beneficial as vegetated street features. There may be minor safety
considerations when in operation as ponding on the surface will occur. This should be similar to
street surface puddles; although in extreme events may have a depth of up to 0.5m. These systems,
which are green, can help with climate change due to carbon sequestration and potential to lower
ambient temperatures. However, plant maintenance is not straightforward and requires skilled
operation. Residents may also object to their use if it impairs car parking outside their properties.
Construction would be dependent upon local conditions, but would be expected to be problematic
in relation to existing buried services, in some cases requiring re ‐routing.
Figure 4‐6 Pocket rain gardens in Auckland New Zealand
4.2.1.2 Permeable road surfaces / permeable paved areas (see Appendix E.1)
An illustration of these systems is shown in Figure 4.7. In the present study these units have been
designed based on standard block paved systems, such as that produced by Interpave2
and are subsurface storage systems. The sub ‐base provides storage for infiltrating runoff and the outflow
can be constrained to a fixed rate (in this case 5l/s). Design in the present study has usually
presumed that only the surface that is currently impervious will be drained to the same plan area
that has been reconstructed as permeable. Hence there may be scope for additional disconnections
into the system over and above the converted impervious area itself. However, this was presumed
to provide a worst case scenario other than for one of the case examples, where properties were
also drained to the permeable local roadway.
2 http://www.paving.org.uk/cost_of_paving.php (accessed 10/07/09)
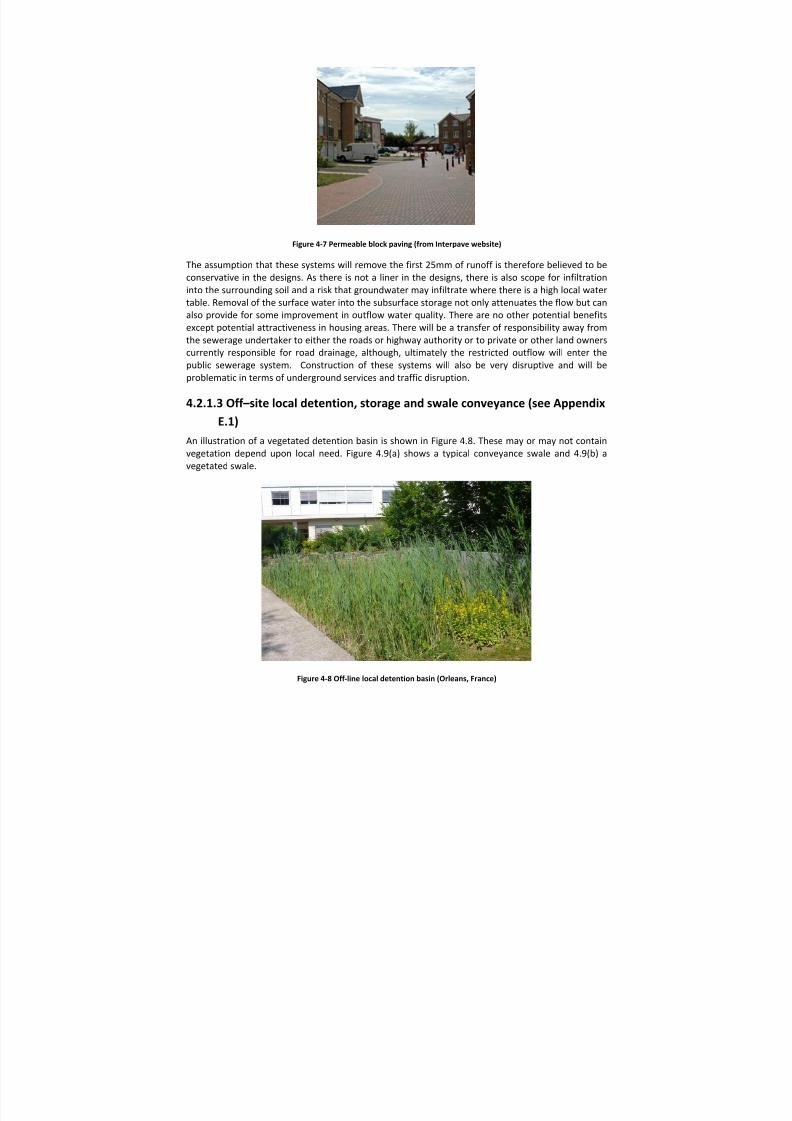
8/13/2019 Needs report: appendix E
http://slidepdf.com/reader/full/needs-report-appendix-e 39/235
Figure 4‐7 Permeable block paving (from Interpave website)
The assumption that these systems will remove the first 25mm of runoff is therefore believed to be
conservative in the designs. As there is not a liner in the designs, there is also scope for infiltration into the surrounding soil and a risk that groundwater may infiltrate where there is a high local water
table. Removal of the surface water into the subsurface storage not only attenuates the flow but can
also provide for some improvement in outflow water quality. There are no other potential benefits
except potential attractiveness in housing areas. There will be a transfer of responsibility away from
the sewerage undertaker to either the roads or highway authority or to private or other land owners
currently responsible for road drainage, although, ultimately the restricted outflow will enter the
public sewerage system. Construction of these systems will also be very disruptive and will be
problematic in terms of underground services and traffic disruption.
4.2.1.3 Off–site local detention, storage and swale conveyance (see Appendix E.1)
An illustration of a vegetated detention basin is shown in Figure 4.8. These may or may not contain
vegetation depend upon local need. Figure 4.9(a) shows a typical conveyance swale and 4.9(b) a
vegetated swale.
Figure 4‐8 Off ‐line local detention basin (Orleans, France)
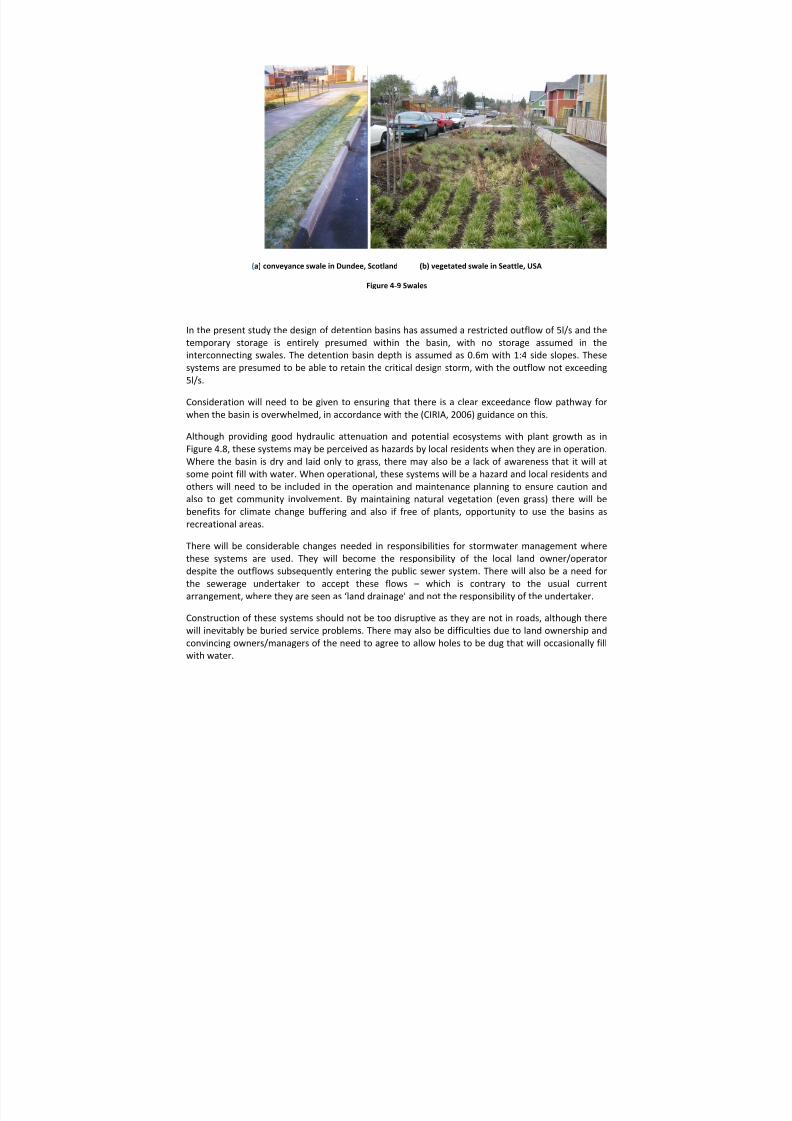
8/13/2019 Needs report: appendix E
http://slidepdf.com/reader/full/needs-report-appendix-e 40/235
(a) conveyance swale in Dundee, Scotland (b) vegetated swale in Seattle, USA
Figure 4‐9 Swales
In the present study the design of detention basins has assumed a restricted outflow of 5l/s and the
temporary storage is entirely presumed within the basin, with no storage assumed in the
interconnecting swales. The detention basin depth is assumed as 0.6m with 1:4 side slopes. These
systems are presumed to be able to retain the critical design storm, with the outflow not exceeding
5l/s.
Consideration will need to be given to ensuring that there is a clear exceedance flow pathway for
when the basin is overwhelmed, in accordance with the (CIRIA, 2006) guidance on this.
Although providing good hydraulic attenuation and potential ecosystems with plant growth as in
Figure 4.8, these systems may be perceived as hazards by local residents when they are in operation.
Where the basin is dry and laid only to grass, there may also be a lack of awareness that it will at
some point fill with water. When operational, these systems will be a hazard and local residents and
others will need to be included in the operation and maintenance planning to ensure caution and
also to get community involvement. By maintaining natural vegetation (even grass) there will be
benefits for climate change buffering and also if free of plants, opportunity to use the basins as
recreational areas.
There will be considerable changes needed in responsibilities for stormwater management where
these systems are used. They will become the responsibility of the local land owner/operator
despite the outflows subsequently entering the public sewer system. There will also be a need for
the sewerage undertaker to accept these flows – which is contrary to the usual current
arrangement, where they are seen as ‘land drainage’ and not the responsibility of the undertaker.
Construction of these systems should not be too disruptive as they are not in roads, although there
will inevitably be buried service problems. There may also be difficulties due to land ownership and
convincing owners/managers of the need to agree to allow holes to be dug that will occasionally fill with water.
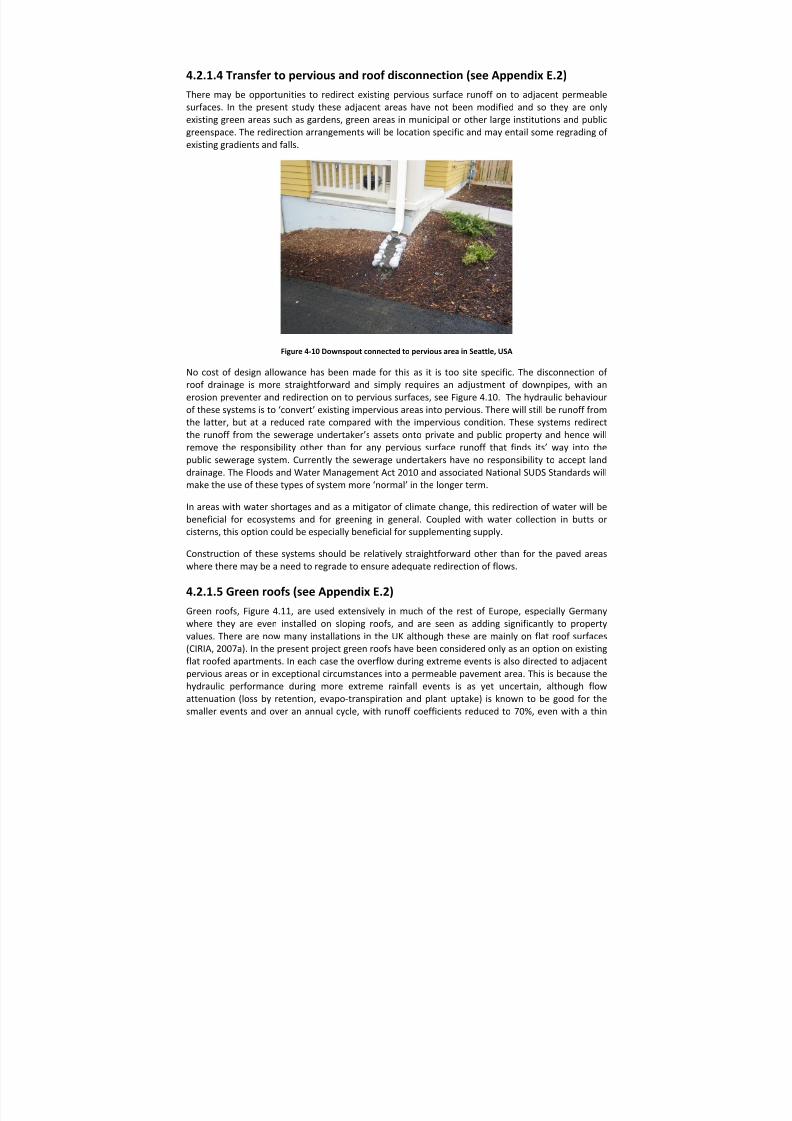
8/13/2019 Needs report: appendix E
http://slidepdf.com/reader/full/needs-report-appendix-e 41/235
4.2.1.4 Transfer to pervious and roof disconnection (see Appendix E.2) There may be opportunities to redirect existing pervious surface runoff on to adjacent permeable
surfaces. In the present study these adjacent areas have not been modified and so they are only
existing green areas such as gardens, green areas in municipal or other large institutions and public
greenspace. The redirection arrangements will be location specific and may entail some regrading of existing gradients and falls.
Figure 4‐10 Downspout connected to pervious area in Seattle, USA
No cost of design allowance has been made for this as it is too site specific. The disconnection of roof drainage is more straightforward and simply requires an adjustment of downpipes, with an
erosion preventer and redirection on to pervious surfaces, see Figure 4.10. The hydraulic behaviour
of these systems is to ‘convert’ existing impervious areas into pervious. There will still be runoff from
the latter, but at a reduced rate compared with the impervious condition. These systems redirect
the runoff from the sewerage undertaker’s assets onto private and public property and hence will remove the responsibility other than for any pervious surface runoff that finds its’ way into the
public sewerage system. Currently the sewerage undertakers have no responsibility to accept land
drainage. The Floods and Water Management Act 2010 and associated National SUDS Standards will make the use of these types of system more ‘normal’ in the longer term.
In areas with water shortages and as a mitigator of climate change, this redirection of water will be
beneficial for ecosystems and for greening in general. Coupled with water collection in butts or
cisterns, this option could be especially beneficial for supplementing supply.
Construction of these systems should be relatively straightforward other than for the paved areas where there may be a need to regrade to ensure adequate redirection of flows.
4.2.1.5 Green roofs (see Appendix E.2)
Green roofs, Figure 4.11, are used extensively in much of the rest of Europe, especially Germany
where they are even installed on sloping roofs, and are seen as adding significantly to property
values. There are now many installations in the UK although these are mainly on flat roof surfaces
(CIRIA, 2007a). In the present project green roofs have been considered only as an option on existing
flat roofed apartments. In each case the overflow during extreme events is also directed to adjacent
pervious areas or in exceptional circumstances into a permeable pavement area. This is because the
hydraulic performance during more extreme rainfall events is as yet uncertain, although flow
attenuation (loss by retention, evapo ‐transpiration and plant uptake) is known to be good for the
smaller events and over an annual cycle, with runoff coefficients reduced to 70%, even with a thin
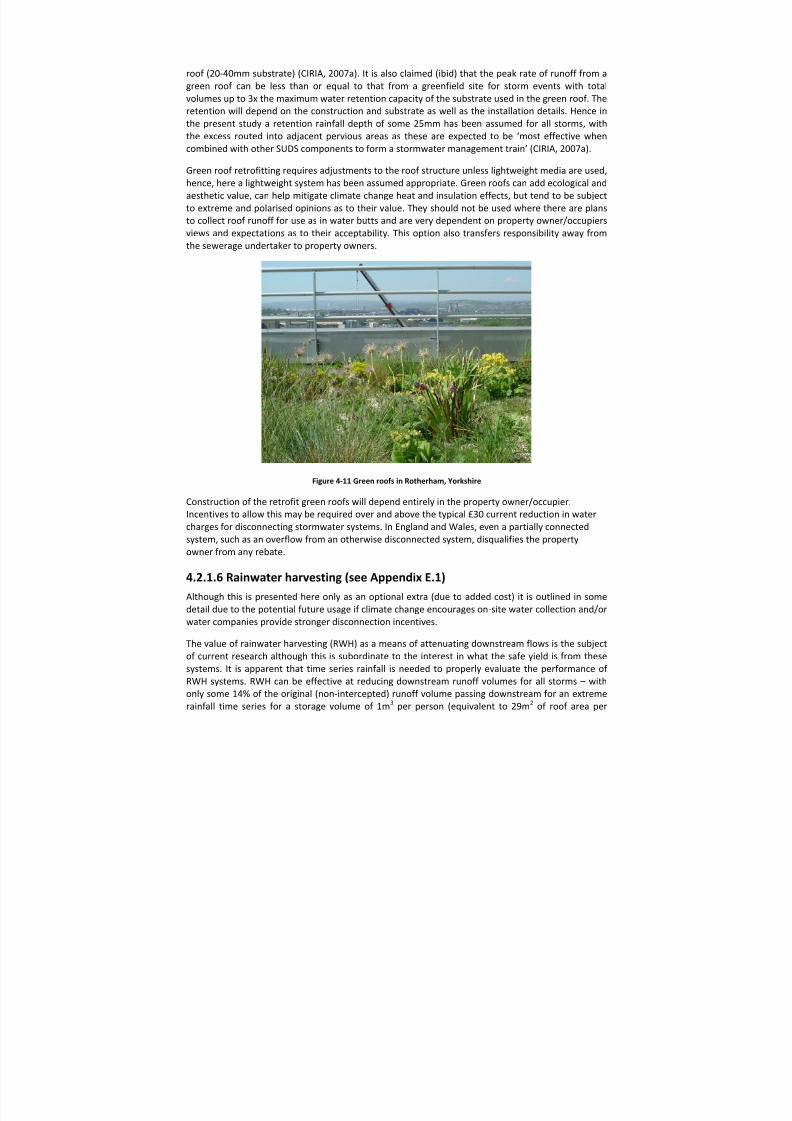
8/13/2019 Needs report: appendix E
http://slidepdf.com/reader/full/needs-report-appendix-e 42/235
roof (20 ‐40mm substrate) (CIRIA, 2007a). It is also claimed (ibid) that the peak rate of runoff from a
green roof can be less than or equal to that from a greenfield site for storm events with total
volumes up to 3x the maximum water retention capacity of the substrate used in the green roof. The
retention will depend on the construction and substrate as well as the installation details. Hence in
the present study a retention rainfall depth of some 25mm has been assumed for all storms, with
the excess routed into adjacent pervious areas as these are expected to be ‘most effective when combined with other SUDS components to form a stormwater management train’ (CIRIA, 2007a).
Green roof retrofitting requires adjustments to the roof structure unless lightweight media are used,
hence, here a lightweight system has been assumed appropriate. Green roofs can add ecological and
aesthetic value, can help mitigate climate change heat and insulation effects, but tend to be subject
to extreme and polarised opinions as to their value. They should not be used where there are plans
to collect roof runoff for use as in water butts and are very dependent on property owner/occupiers
views and expectations as to their acceptability. This option also transfers responsibility away from
the sewerage undertaker to property owners.
Figure 4‐11 Green roofs in Rotherham, Yorkshire
Construction of the retrofit green roofs will depend entirely in the property owner/occupier.
Incentives to allow this may be required over and above the typical £30 current reduction in water
charges for disconnecting stormwater systems. In England and Wales, even a partially connected
system, such as an overflow from an otherwise disconnected system, disqualifies the property
owner from any rebate.
4.2.1.6 Rainwater harvesting (see Appendix E.1) Although this is presented here only as an optional extra (due to added cost) it is outlined in some
detail due to the potential future usage if climate change encourages on ‐site water collection and/or
water companies provide stronger disconnection incentives.
The value of rainwater harvesting (RWH) as a means of attenuating downstream flows is the subject
of current research although this is subordinate to the interest in what the safe yield is from these
systems. It is apparent that time series rainfall is needed to properly evaluate the performance of RWH systems. RWH can be effective at reducing downstream runoff volumes for all storms – with
only some 14% of the original (non ‐intercepted) runoff volume passing downstream for an extreme rainfall time series for a storage volume of 1m 3 per person (equivalent to 29m 2 of roof area per

8/13/2019 Needs report: appendix E
http://slidepdf.com/reader/full/needs-report-appendix-e 43/235
person in a UK study (Kellagher & Udale ‐Clarke, 2008). Another study found that storage of 0.75m 3
per person reduces the downstream flow volume to 20% of the original (Kellagher and Franco, 2005)
and storage of 1.5m 3 per head showed a 50% reduction in downstream peak flows for most events.
Overall it has been found that retrofitting RWH systems can significantly reduce flood frequencies
and volumes in areas that suffer from frequent flooding (ibid) although it is necessary to increase the
size of RWH tanks above what is required purely for RWH purposes. It can be concluded that RWH
can significantly reduce volumes downstream provided tanks are of the order of 1m 3 per head and
that it is possible to assume an initial loss of 50mm for each event for modelling purposes; although
in the present study this has been reduced to 25mm to account for uncertainty.
To ensure effective flood volume reduction: Assume up to a 1m 3 tank per person, although it could
be smaller – a 2m 3 tank per property (3.3 dwellers). For modelling, an initial loss of 25mm at the
start of the event is feasible in areas where there are a substantial number (>50%) of RWH
installations.
Although there are now lots of types of tank – some that can double as garden fences (Figure 4.12)
or be fitted into small roof spaces or under houses, Figure 4.13, meaning that lack of space may not be an impediment to retrofitting; there is no incentive for UK property owners and dwellers to fit
these at the present time as mains provided water is so cheap.
Figure 4‐12 Slimline RWH tanks in an access pathway to a property in Melbourne
Figure 4‐13 Ecosac (www.ecosac.com. au) flexible rainwater storage system
Retrofit of these RWH systems is best done by a specialist service provider. There are a number in
the UK with experience and construction should not be an impediment.
4.2.2 Sewerage performance assessmentThe London Tideway Tunnels catchment is being modelled using an InfoWorks CS computer
simulation model. Because of the complexity of the sewer network it has not been possible to model
every individual sewer and pipe length and the smallest diameter in the model is 375mm. SUDS
units, especially those used for source control, operate at a very local scale and caution is required
when using large ‐scale sewerage models to represent SUDS. For this study no attempt has been

8/13/2019 Needs report: appendix E
http://slidepdf.com/reader/full/needs-report-appendix-e 44/235
made to model the SUDS units themselves, rather their effects in terms of changing the current
stormwater runoff and inputs to the sewer network have been modelled by CH2M Hill.
Descriptions of the application of the model to the retrofit SUDS options are given in ANNEX 1. For
this work the London Tideway Tunnels model has been amended to represent the change in
contributing areas produced by the various SUDS options. General disconnection options were
modelled as reductions in impermeable contributing area which was modelled as both lost and
transferred to permeable areas. Initial losses through rainfall capture techniques were also
modelled before the site specific options (produced by PWG) were investigated for the three CSO
test subcatchments.
In the London Tideway Tunnels studies, the December typical year and October 2000 rainfall events
represent the most severe recorded events for the typical year and 154 event rainfall series
respectively. The London Tideway Tunnels catchment model simulations have been carried out with
these and with the various specified SUDS options to produce the most extreme overflows at the
CSOs. The complete typical year rainfall has also been simulated to provide a representation of the
number of spills and total overflow that could be expected at CSOs during the annual series (Annex
1).
The InfoWorks CS model for the London Tideway Tunnels has been modified to provide a better
means of assessing the potential effect of removal and attenuation of stormwater runoff by the
retrofitted SUDS (Annex 1). Assessment of changes in the effective impervious contributing areas
and in initial storage (Table 3.1) from the retrofits was based on the contributing impervious area
changes for each of the Subcatchment InfoWorks node IDs within each of the 3 test subcatchments
Annex 1.
The potential changes to contributing areas were assessed by PWG (Sections 6 & 9) and used in the
London Tideway Tunnels InfoWorks model to assess the changes in the system CSO performance.
The process
is
described
in
LTTD,
2009:
the
model
was
first
amended
so
that
the
areas
for
each
source control option matched the areas provided by PWG. In InfoWorks this was done by adjusting
area percentage in the various subareas contributing to the nodes in each of the subcatchments.
For example in subarea 21757452 (West Putney subcatchment) the impermeable area was reduced
from 22.0% (19.2ha) to 5.61% (4.9ha) based on detailed analysis of surfaces and source control
options by PWG.
Areas with initial losses were also added to the model subcatchments. For example subarea
21757452 (West Putney subcatchment) was estimated to have potential for 4.81% of the subarea to
be subject to initial losses, equivalent to an area of 4.2 hectares.
Any contributing area with storage was represented as being lost in the subcatchment as the flow
would be captured by the SUDS storage volume and returned to the system slowly after the CSO event.

8/13/2019 Needs report: appendix E
http://slidepdf.com/reader/full/needs-report-appendix-e 45/235
5. Practicalities of retrofi tting SUDS
The opportunities for and difficulties of retrofitting SUDS in urban areas are reviewed by SNIFFER (2006) and Stovin et al (2007). Technically, provided there is adequate land area available, virtually
any of the options in Appendix A and B could be retrofitted. There are limitations as regards
infiltration based SUDS, however, as these require sufficient infiltration capacity in the underlying
soil to operate. They also risk contaminating groundwater and compromising aquifers being used for
supply purposes. Ironically, the guidance available from the USA for retrofitting (Weinstein et al,
2006; Center for Watershed Protection, 2007) promotes the use of infiltration BMPs preferentially
for retrofits and also for the control of water quantity (Table A3, Appendix A). As it is unlikely that
there is significant infiltration potential in the London Tideway Tunnels catchments (Binnie, Black &
Veatch, 2002) this option has been discounted in the present study. As a consequence, all of the
SUDS units used in this study have had any infiltration capacity discounted; although to save on
costs, no impervious liners have been used in any of the designs so there may be some limited
infiltration.
In addition, in the designs the groundwater level has been considered to be low enough (typically
1m below ground level) so as not to impede the performance of the SUDS units.
According to Stovin et al (2007): “The lack of implementation (of retrofit SUDS) (associated with this project) reflects a level of complexity in the legislation and management of urban storm water.”
The report goes on to suggest the need for legislative change in England and Wales:
1. “Simplification of the current system for storm water management in England and Wales. 2. Reviews of both the ‘right to connect’ and ‘permitted development rights’. 3. Greater transparency and flexibility in drainage charging to provide incentives for property
owners to implement full or partial stormwater disconnection or to provide attenuation.”
Since the 2007 report was published there have been initiatives by Government and the main
stakeholders to address some of the factors discouraging the use of retrofit SUDS to deal with
stormwater problems. The Floods and Water Management Act 2010, has confirmed the place of the
Environment Agency as having a supervisory overview function in relation to all flood risk
management in England. The Act has also addressed the right to connect problem, removing this as
an automatic right and therefore preventing the reconnection to sewer of previously disconnected
SUDS. As regards item (3) above, recent moves to implement full cost charging for large
impermeable surface area contributors has been supported by Ofwat, although the implementation
of this, especially to public buildings such as churches and community buildings has proven politically
difficult and a more gradual introduction of full‐cost charges increasing over time is now being
implemented.
However, these are not the only impediments to the widespread introduction of retrofit stormwater
measures. These are considered in Appendix D and summarised in the following sections, based on
Stovin et al, 2007.
5.1 Overview of benefits of using SUDS retrofits The SUDS manual (CIRIA, 2007) provides a table that indicates not only the hydraulic performance of these systems but also the quality and other benefits, Table 5.1.
Many of the benefits accrue to society rather than the owner/operator of the SUDS units.

8/13/2019 Needs report: appendix E
http://slidepdf.com/reader/full/needs-report-appendix-e 46/235
In addition, the bearer of the costs of retrofitting may not be the beneficiary.
The options used in the present study are shown with blue boxes in Table 5.1. It is apparent that
these options all have potential environmental benefits as well as effective hydraulic and water
quality control.
The whole life costs of the retrofits in this present study are considered in Sections 7 and 9. The
SUDS manual gives some guidance on the assessment of intangible benefits:
“Theoretically, a benefit assessment would account for:
1. The hydraulic benefits, including peak flow rate reductions, storm runoff volume reductions, and enhancements to river baseflow and aquifer recharge;
2. The pollutant loading reductions achieved by the system, and associated benefits to in‐stream ecology, human health, and human value perceptions;
3. The amenity and recreational benefit enjoyed by those who live close to the SUDS scheme; 4. The additional value of properties adjacent or within view of the SUDS scheme;
5.
The ecological
value
of
the
SUDS
systems
themselves.
The Government recognises that although there are techniques available to value the environment, environmental benefits have to be considered within a situation ‐specific context. The Green Book (HM Treasury, 2003) stated that ‘wider social and environmental costs and benefits for which there is no market price need to be brought into any assessment. They will often be more difficult to assess but are important and should not be ignored simply because they cannot be easily costed.’”
Table 5.2 gives a summary of the potential benefits from the use of measures for stormwater
separation from the point of view of the sewerage undertaker from Cascade (2009) which shows a
similar view of the potential benefits as the SUDS manual. In order to monetise the benefits into a
decision support tool, the Cascade study has derived benefit values from WaSC stated preference
surveys or as standard values (e.g. carbon emissions, traffic congestion) (Appendix C). No attempt
has been made in the present study to use this rather tenuous approach.

8/13/2019 Needs report: appendix E
http://slidepdf.com/reader/full/needs-report-appendix-e 47/235
36
Table 5‐1 Summary of the benefits of SUDS options (CIRIA, 2007)
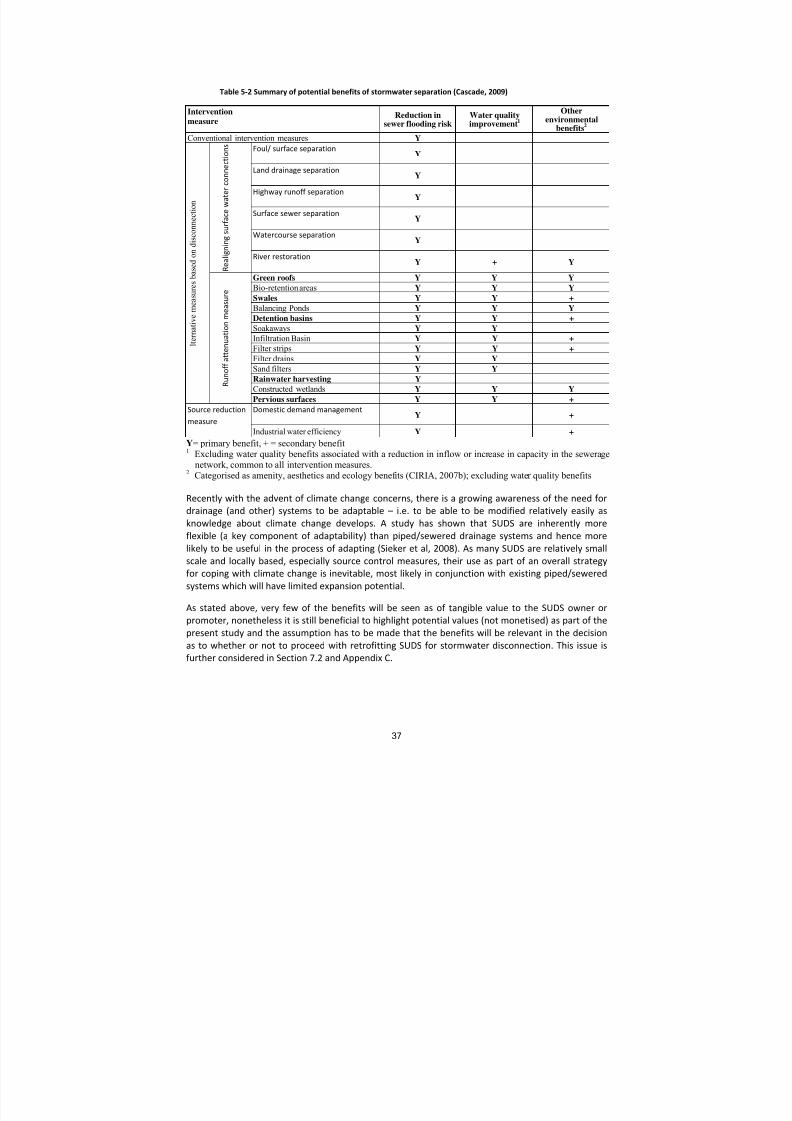
8/13/2019 Needs report: appendix E
http://slidepdf.com/reader/full/needs-report-appendix-e 48/235
37
Table 5‐2 Summary of potential benefits of stormwater separation (Cascade, 2009)
Interventionmeasure
Reduction insewer flooding risk
Water qualityimprovement 1
Otherenvironmental
benefits 2
Conventional intervention measures Y
l t e r n a t i v e m e a s u r e s b a s e d o n
d i s c o n n e c t i o n
R e a l i g n i n g s u r f a c e w a t e r c o n n e c t i o n s Foul/ surface separation
Y
Land drainage separation Y
Highway runoff separation Y
Surface sewer separation Y
Watercourse separation Y
River restoration Y + Y
R u n o f f a t t e n u a t i o n m e a s u r e
Green roofs Y Y YBio-retention areas Y Y YSwales Y Y +Balancing Ponds Y Y YDetention basins Y Y +Soakaways Y YInfiltration Basin Y Y +Filter strips Y Y +Filter drains Y YSand filters Y YRainwater harvesting YConstructed wetlands Y Y YPervious surfaces Y Y +
Source reduction
measure
Domestic demand management
Y +
Industrial water efficiency Y +Y= primary benefit, + = secondary benefit1 Excluding water quality benefits associated with a reduction in inflow or increase in capacity in the sewerage
network, common to all intervention measures.2 Categorised as amenity, aesthetics and ecology benefits (CIRIA, 2007b); excluding water quality benefits
Recently with the advent of climate change concerns, there is a growing awareness of the need for
drainage (and other) systems to be adaptable – i.e. to be able to be modified relatively easily as
knowledge about climate change develops. A study has shown that SUDS are inherently more
flexible (a key component of adaptability) than piped/sewered drainage systems and hence more
likely to be useful in the process of adapting (Sieker et al, 2008). As many SUDS are relatively small
scale and locally based, especially source control measures, their use as part of an overall strategy
for coping with climate change is inevitable, most likely in conjunction with existing piped/sewered
systems which will have limited expansion potential.
As stated above, very few of the benefits will be seen as of tangible value to the SUDS owner or
promoter, nonetheless it is still beneficial to highlight potential values (not monetised) as part of the
present study and the assumption has to be made that the benefits will be relevant in the decision
as to whether or not to proceed with retrofitting SUDS for stormwater disconnection. This issue is
further considered in Section 7.2 and Appendix C.
8/13/2019 Needs report: appendix E
http://slidepdf.com/reader/full/needs-report-appendix-e 49/235
5.2 Summary of difficulties in using SUDS retrofits Appendix C considers the issues involved in assessing the whole life costs of these systems and
Section 7 the application to this present study. Appendix D considers the practicalities of using SUDS, with reference to the limited studies on retrofitting. Here a summary of the practical difficulties of application is provided. The following is not a fully comprehensive list, but includes the most
significant points.
5.2.1 Legal and regulatory issues In the present study, as in all their wastewater related actions, TW are responsible for
‘effectually draining’ the London Tideway Tunnels area. Disconnection of stormwater inputs as
proposed here, may be construed as a dereliction of this duty as the responsibility will be
passed on to others, many of whom will not have the capacity to manage their new
alternative drainage systems.
Even if there is disconnection, the arrangements must comply with the Building Regulations in
force and under Section 106 of the Water Industry Act, there has been a right by the property
owner to subsequently reconnect at any time in the future if they wish.
The Flood and Water Management Act 2010 will, once enacted fully, amend the right to
reconnect. However, compliance with Building Regulations will remain.
The new Act will also provide the means for other players, such as local authorities, to become
more involved, with surface water management plans already encouraging the use of SUDS
and as the SUDS Approval Body (SAB) involved in the delivery and management of SUDS. They
are also expected to take on the role of maintenance and operation although this is still under
consideration. At present, however, this applies only to redevelopment and newly constructed
systems that have passed through the planning and building regulatory approval process.
The transfer of communal private sewer responsibilities to sewerage undertakers in the next 5
year period
will
also
incur
a
new
and
risky
burden
for
local
sewerage
undertakers.
This
may
potentially provide new opportunities to alter the existing drainage arrangements,
disconnecting any areas that are draining stormwater systems and making these into SUDS.
Road and highway drainage authorities have the right to connect their drainage to the public
sewer network. In theory, but not in practice, there could be a charge levied for this. Whilst
this charge is not made explicit there will be no incentive for these authorities to disconnect
and use alternative drainage systems.
5.2.2 Transfer of burdens and responsibil ities There is only limited experience by property owners/managers/occupiers in managing their
own drainage systems. It is unlikely that even where there is experience already, this will not
have included management of SUDS. Hence any transfer of responsibilities by disconnection will need to be supported by a capacity building and engagement process. This will have to be
funded by TW.
If the draft Floods and Water Management Bill is implemented (and this may not be for
several years), there may be a duty on local authorities in particular to take up responsibilities
for managing SUDS in their area. At present, however, any transfer will become the
responsibility of the property/land owner/road or highway authority. There is no apparent
incentive for any of these to take up responsibility for their own drainage systems rather than
rely on TW to provide a service at a very low cost.

8/13/2019 Needs report: appendix E
http://slidepdf.com/reader/full/needs-report-appendix-e 50/235
5.2.3 Maintenance, operational needs, risks and health and safety There is only limited experience in operating and maintaining SUDS systems in the UK. There
is even less experience in the potentially more complex management of retrofit systems. This
means that retrofitting SUDS may introduce greater risks that the systems will not provide the
expected service.
Surface SUDS, such as open water bodies require special consideration as regards human
health and safety. In the present study there are no SUDS that will have permanent open
water surfaces, although in times of heavy rainfall, the detention basins, swales and rain
gardens will have standing water in them. It is not practical to fence these off and
arrangements will have to be made to ensure that residents and others in the locality are
aware that they will from time to time fill with water and what precautions to take in that
event. This should be the responsibility of TW.
Although the retrofit SUDS in this study have been designed to cope with a 1 in 30 year design
storm in the present study, to match the usual performance of urban sewers, there may be a
greater risk that overland exceedance flows from the retrofit SUDS may be of greater
magnitude than
the
flows
that
could
occur
when
the
underground
sewerage
system
is
no
longer able to cope. Further consideration of the behaviour of SUDS under exceedence
conditions is required to ensure safe systems.
5.2.4 Incentivisation Existing arrangements for charging for stormwater runoff and management are such that the
real cost of this is not transferred to the user of the service. Recent attempts by sewerage
undertakers to charge by impervious area connected, whilst supported by Ofwat, have met
with considerable public resistance. The gradual ramping up of charges over time is to be
welcomed and may provide an incentive, if appropriate reductions in these charges can be
offered, to encourage the take ‐up of disconnection options. Current rebates of circa £30 per
household disconnected do not apply to partial disconnection and are in any case too trivial for the householder to wish to take on the personal responsibility for their own drainage.
Proper charging for highway drainage should be introduced so that this can be used to
incentivise the disconnection of this source from the public sewerage system.
5.2.5 Practicalities of const ruct ion Retrofitting of any large scale measures in urban areas is always problematic. The location of
and need to move underground and buried services can be costly and at times almost
impossible unless at great cost. This is a location specific problem and may if found to be too
costly, completely prohibit an otherwise effective and practicable retrofit.
As well
as
the
usual
problems
of
complying
with
environmental
legislation
and
requirements
in constructing anything, several of the options proposed in the present study entail digging
up and working in roads. This will lead to traffic disruption, noise control problems and other
environmental difficulties. When finalising any retrofit options these problems will need to be
accounted for.
5.2.6 Acceptability and awareness As it is proposed to transfer the responsibility for stormwater management away from TW, it
will be important to engage early on in the planning of this with the key stakeholders in order
to get their agreement. By early engagement, rather than attempts to impose changes, it is
more likely that a consensual approach can be developed.
It will be necessary to engage not only those directly affected (i.e. those whose drainage is to be disconnected) but the wider community. Most of the SUDS proposed here are surface

8/13/2019 Needs report: appendix E
http://slidepdf.com/reader/full/needs-report-appendix-e 51/235
features and hence will affect the entire neighbourhood and local authority aspirations and
activities in relation to streetscapes. Ideally the SUDS should be seen as an opportunity to
enhance neighbourhoods as part of the new ‘green infrastructure’ initiatives and it may be
necessary to work with local planners, landscape architects and others to take advantage of this.
8/13/2019 Needs report: appendix E
http://slidepdf.com/reader/full/needs-report-appendix-e 52/235
6. Catchment scale disconnection strategies
This section explains the the disconnection strategies that were initially determined and modelled by
the London Tideway Tunnels Delivery Team (Annex 1), and explains how these have subsequently been refined (Section 10).
6.1 Initial Approach – ANNEX 1 disconnection scenarios This section describes the methodology that was initially adopted to identify potential retrofit SUDS
options, to select preferred retrofit SUDS options and, ultimately, to provide input data for
InfoWorks to enable the hydraulic impacts of proposed disconnections to be modelled. OS
MasterMap data was utilized to associate potential retrofit SUDS options with particular areas of land. Note that the anticipated use of Department of Communities and Local Government GLUD
(Generalised Land Use Database) data, which would have provided additional information about
Land Use
characteristics
than
can
be
gathered
from
OS
Mastermap
data
alone,
was
rejected
at
an
early stage due to software stability and data incompatibility issues. However, given the widespread
use of MasterMap data, the approach developed is expected to be more generic and transferable.
6.2 Land use types and suitability for retrofit In view of the innovative nature of this study, two alternative approaches were initially considered:
1. Assignment of ‘typical’ disconnection profiles to a set of zonal land ‐use types, such as ‘high‐
density terraced housing’, ‘detached houses with large gardens’, ‘municipal medium ‐rise
housing blocks’, etc.
2. Using the land ‐use categories within OS MasterMap, combined with logical SQL queries, to
determine suitability for a range of retrofit SUDS options.
6.3 Method 1 – ‘typical’ disconnection profiles by land -use types The disconnection strategies were initially evaluated by first identifying generic land ‐use types, then
identifying the potential retrofit SUDS options associated with each type. This was done at a
detailed level for two of the subareas within the Frogmore (Buckhold Road) subcatchment:
24743902 and 23749901. The remaining subareas were then classified according to the generic
land ‐use types, and average disconnection opportunity profiles applied. However, this data is not
presented here, as the approach has now been superseded. Two limitations of this approach led to
it being abandoned in favour of the second option:
It was not as straightforward as initially expected to derive classification criteria, and
significant differences were observed between the characteristics of areas subjectively
placed within the same nominal (land use and building type) category. This meant that the
overall distribution of disconnection options by zonal land ‐use type was not as consistent as
might have been hoped for. Five zonal land ‐use types common over the two sub ‐
catchments are compared in Figure 6.1. In most cases there is a reasonable correlation, but
not always. Differences for categories 1 and 2 in (High‐Density, Low‐Rise apartments), and
for category 2 (pervious) in (Flat roofed apartments in grounds) and (Pitched roofed
apartments in grounds) are significant, and therefore raise potential
uncertainties/inconsistencies in the interpolation technique.
The process of classifying areas into the generic land ‐use types is manual, time ‐consuming
and ultimately somewhat subjective.
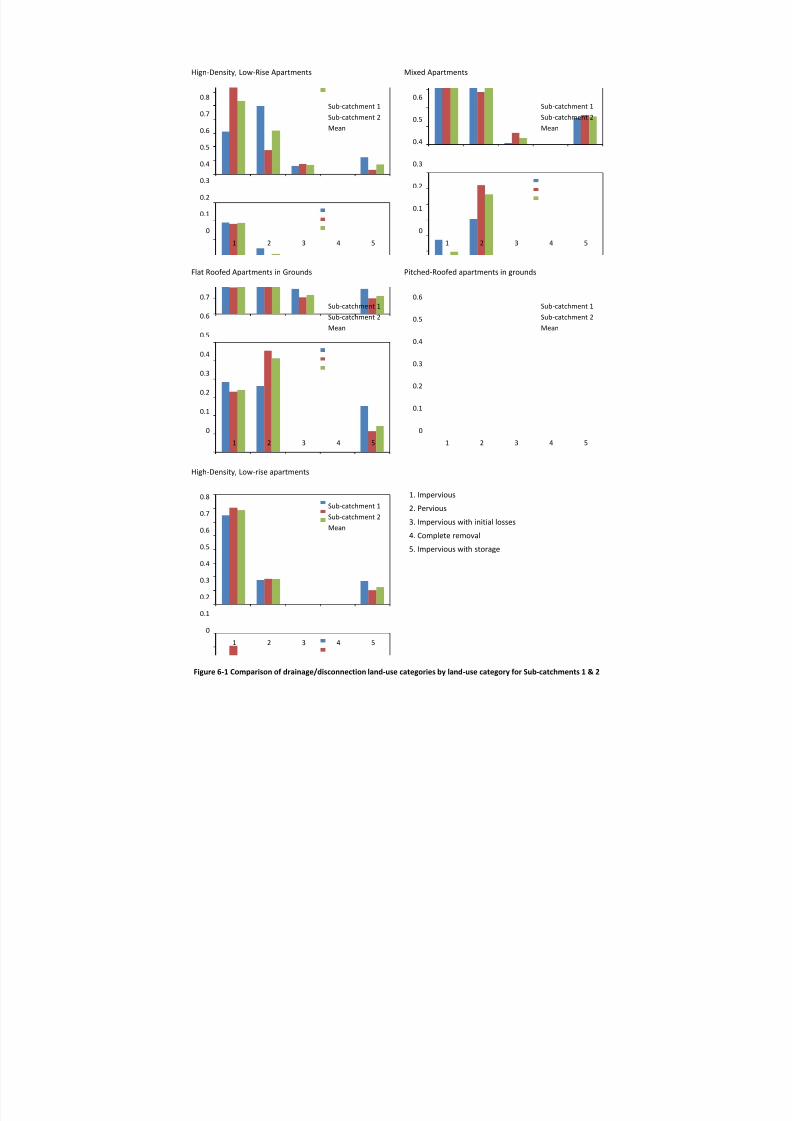
8/13/2019 Needs report: appendix E
http://slidepdf.com/reader/full/needs-report-appendix-e 53/235
Hign‐Density, Low‐Rise Apartments
0
0.1
0.2
0.3
0.4
0.5
0.6
0.7
0.8
1 2 3 4 5
Sub ‐catchment 1Sub ‐catchment 2Mean
Mixed Apartments
0
0.1
0.2
0.3
0.4
0.5
0.6
1 2 3 4 5
Sub ‐catchment 1Sub ‐catchment 2Mean
Flat Roofed Apartments in Grounds
0
0.1
0.2
0.3
0.4
0.5
0.6
0.7
1 2 3 4 5
Sub ‐catchment 1Sub ‐catchment 2Mean
Pitched ‐Roofed apartments in grounds
0
0.1
0.2
0.3
0.4
0.5
0.6
1 2 3 4 5
Sub ‐catchment 1Sub ‐catchment 2Mean
High‐Density, Low‐rise apartments
0
0.1
0.2
0.3
0.4
0.5
0.6
0.7
0.8
1 2 3 4 5
Sub ‐catchment 1Sub ‐catchment 2Mean
1. Impervious
2. Pervious
3. Impervious with initial losses
4. Complete removal
5. Impervious with storage
Figure 6‐1 Comparison of drainage/disconnection land ‐use categories by land ‐use category for Sub ‐catchments 1 & 2

8/13/2019 Needs report: appendix E
http://slidepdf.com/reader/full/needs-report-appendix-e 54/235
6.4 Method 2 – Land -use categories within OS MasterMap In the second approach, the applicability of a retrofit SUDS technique was determined by physical,
mapped, characteristics of the underlying surface and local topography. For example, hydraulically
effective retrofit SUDS options for roofs are governed by factors such as the pitch of the roof, and
the presence of garden/greenspace. A series of logical SQL queries have therefore been determined
that select areas of land that are suitable for each retrofit option. The main advantage of this
approach is that it is consistent, replicable and less time consuming than the original approach, and
can be readily applied to existing data with minimal preparation. In addition, the SQL queries can
easily be linked to other GIS layers, such as geology, or topography; allowing the method to be
further refined in the future.
OS MasterMap data are classified into 3 main themes: Roads Tracks and Paths (which includes roads,
pavements, paths/tracks); Buildings; and Land (which is subdivided into ‘manmade’, ‘natural’ and
‘mixed permeability’ – predominantly gardens). There is also an ‘other’ category, giving rise to six
land ‐use types in total.
Table 6.1 highlights the options that were considered potentially feasible for retrofit to each of the three predominantly impermeable land ‐use types (i.e. Roads, Buildings and Manmade Land). These
options are described and illustrated more fully in Appendix A and B and also introduced in Section
3.2.1. For each potential disconnection option, relevant SQL queries were generated. These are
itemised in Table 6.1. In some cases additional manual digitization was required; this is also
highlighted in Table 6.1. Detailed information on how suitabilities were evaluated using
MasterMap/SQL may be found in Appendix B. It should be noted that the novelty of the SQL‐based
approach in this context means that there remains considerable scope to refine it, and the following
limitations should be acknowledged:
There is a need to be careful not to ‘disconnect’ too many impermeable areas to the same
area of adjacent land – currently this is checked for manually;
This uses a fairly crude selection of buildings/gardens – more work could be done to increase
the reliability of the selection;
Ideally the assessment would include other datasets, such as geology or topography, to
produce more reliable and practicable representations of the likely disconnection options;
Some options, deemed unlikely for application within this study, have not had the relevant
SQLs developed.
This process generated layers indicating where each option might be feasible. Given that – in some
locations – more than one option might be possible, it was necessary to rank the options according
to the set of preferences given in Section 3.2.1.
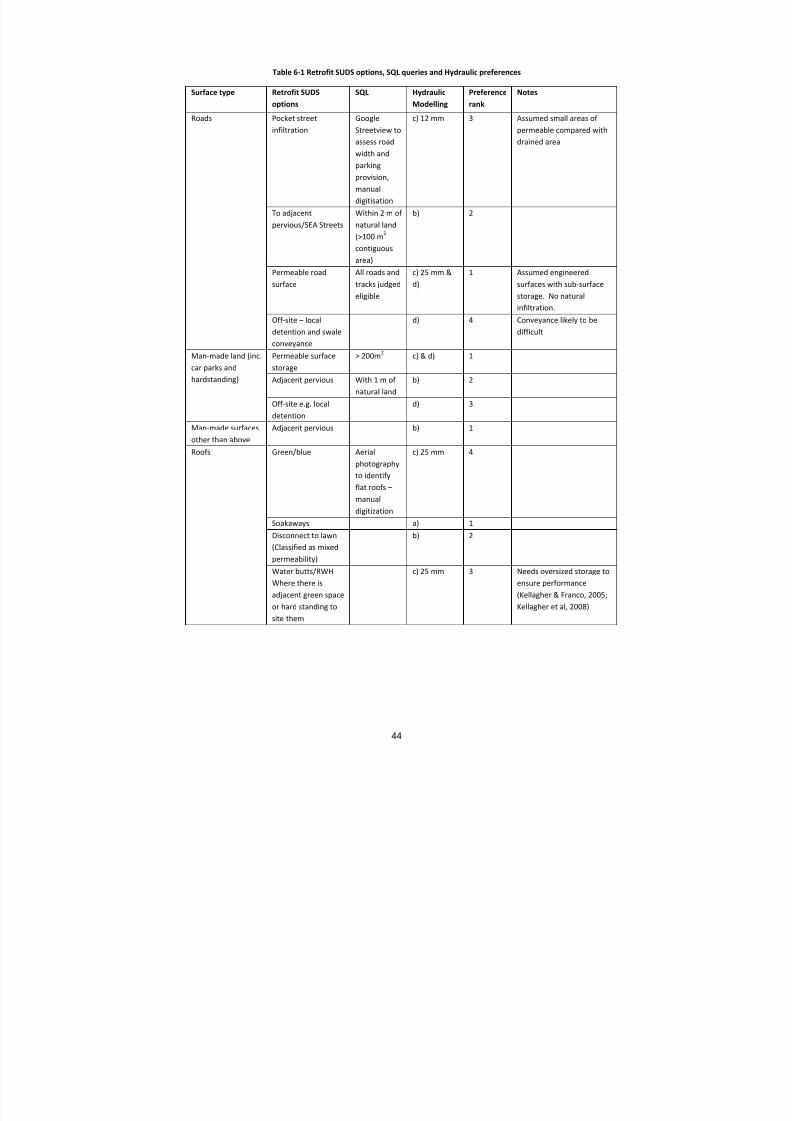
8/13/2019 Needs report: appendix E
http://slidepdf.com/reader/full/needs-report-appendix-e 55/235
44
Table 6‐1 Retrofit SUDS options, SQL queries and Hydraulic preferences
Surface type Retrofit SUDS options
SQL Hydraulic Modelling
Preference rank
Notes
Roads Pocket street
infiltration
Streetview to
assess road
width and
parking
provision,
manual
digitisation
c) 12 mm 3 Assumed small areas of
permeable compared with
drained area
To adjacent
pervious/SEA Streets
Within 2 m of
natural land
(>100 m2
contiguous
area)
b) 2
Permeable road
surface
All roads and
tracks judged
eligible
c) 25 mm &
d)
1 Assumed engineered
surfaces with sub ‐surface
storage. No natural
infiltration.
Off ‐site – local
detention and swale
conveyance
d) 4 Conveyance likely to be
difficult
Man ‐made land (inc.
car parks and
hardstanding)
Permeable surface
storage
> 200m 2 c) & d) 1
Adjacent pervious With 1 m of
natural land
b) 2
Off ‐site e.g. local
detention
d) 3
Man ‐made surfaces
other than above
Adjacent pervious b) 1
Roofs Green/blue Aerial
photography
to identify
flat roofs –
manual
digitization
c) 25 mm 4
Soakaways a) 1
Disconnect to lawn
(Classified as mixed
permeability)
b) 2
Water butts/RWH
Where there is
adjacent green space
or hard standing to
site them
c) 25 mm 3 Needs oversized storage to
ensure performance
(Kellagher & Franco, 2005;
Kellagher et al, 2008)

8/13/2019 Needs report: appendix E
http://slidepdf.com/reader/full/needs-report-appendix-e 56/235
45
As described in Section 3.2.1, the initial selection of the most preferred option was to choose the
option likely to deliver the best hydraulic performance, i.e. remove, retain or detain stormwater
flows most effectively. Four different hydraulic mechanisms were considered, and these were
initially ranked in preference order as follows:
a) Complete removal – 1st
b) Transfer to pervious – 2nd equal
c) Initial losses (x mm) – 2nd equal
d) Storage/attenuation – 3rd
Preference between b) and c) depends on local infiltration (pervious) characteristics, level of initial
losses and on the precise performance criteria being assessed. If there is poor infiltration, compared
with potentially good initial losses, then c) is preferable to b).
Modelling is then required to determine the ‘best’ option in terms of the overall benefits. In some
cases two hydraulic options are expected to result (see Table 6.2), giving rise to a complete list of six
hydraulic modelling options for disconnection scenarios.
Table 6‐2 Hydraulic modelling options for retrofit SUDS
1 Impervious with Initial Losses (12mm)
2 Impervious with Initial Losses (25mm)
3 Complete removal
4 Impervious area with storage/attenuation5 Transfer to pervious
6 Initial Losses and Storage/attenuation
6.5
Assignment of
Impermeable/Pervious
Areas
Specific areas to be disconnected were initially determined using the SQL queries. This generated a
set of data for each InfoWorks node, comprising the six MasterMap land ‐use categories, plus up to
six alternative InfoWorks SUDS hydraulic modelling recommendations. For all areas not deemed
suitable for disconnection, the distributions of impermeable/pervious surface shown in Table 6.3
were assumed.
Table 6‐3 Distribution of impermeable area by MasterMap land ‐use category
MasterMap land ‐use Percentage
Impermeable
Roads Tracks and Paths 70% Buildings 100%
Manmade Land 90%
Natural Land 15%
Gardens 50%
Other 100%
The disconnection scenarios were therefore presented in terms of % impermeable, % pervious, or
one of the six SUDS hydraulic model types indicated in Table 6.2. Table 6.1 highlights the complete
range of disconnection options that have been evaluated for each of the MasterMap land ‐use categories. It also explains how each of these physical options may be modelled (i.e. through a
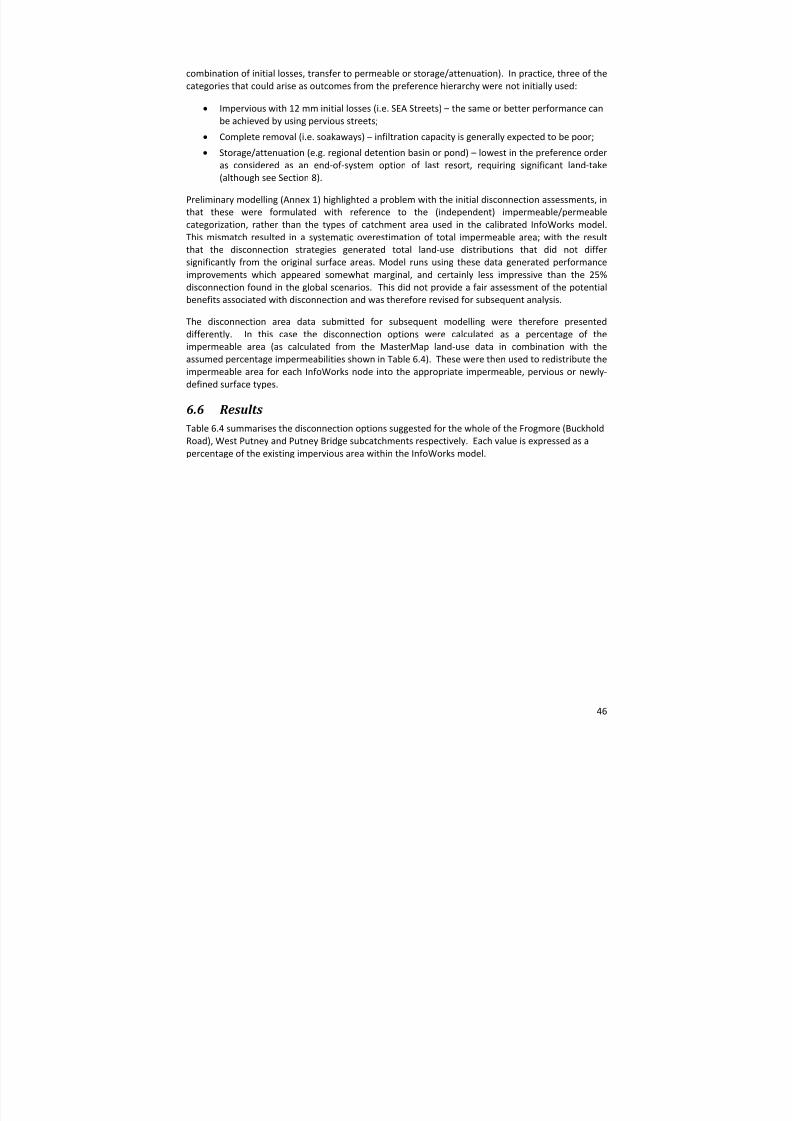
8/13/2019 Needs report: appendix E
http://slidepdf.com/reader/full/needs-report-appendix-e 57/235
46
combination of initial losses, transfer to permeable or storage/attenuation). In practice, three of the
categories that could arise as outcomes from the preference hierarchy were not initially used:
Impervious with 12 mm initial losses (i.e. SEA Streets) – the same or better performance can
be achieved by using pervious streets;
Complete removal (i.e. soakaways) – infiltration capacity is generally expected to be poor; Storage/attenuation (e.g. regional detention basin or pond) – lowest in the preference order
as considered as an end ‐of ‐system option of last resort, requiring significant land ‐take
(although see Section 8).
Preliminary modelling (Annex 1) highlighted a problem with the initial disconnection assessments, in
that these were formulated with reference to the (independent) impermeable/permeable
categorization, rather than the types of catchment area used in the calibrated InfoWorks model.
This mismatch resulted in a systematic overestimation of total impermeable area; with the result
that the disconnection strategies generated total land ‐use distributions that did not differ
significantly from the original surface areas. Model runs using these data generated performance
improvements which appeared somewhat marginal, and certainly less impressive than the 25% disconnection found in the global scenarios. This did not provide a fair assessment of the potential
benefits associated with disconnection and was therefore revised for subsequent analysis.
The disconnection area data submitted for subsequent modelling were therefore presented
differently. In this case the disconnection options were calculated as a percentage of the
impermeable area (as calculated from the MasterMap land ‐use data in combination with the
assumed percentage impermeabilities shown in Table 6.4). These were then used to redistribute the
impermeable area for each InfoWorks node into the appropriate impermeable, pervious or newly ‐
defined surface types.
6.6
Results
Table 6.4 summarises the disconnection options suggested for the whole of the Frogmore (Buckhold
Road), West Putney and Putney Bridge subcatchments respectively. Each value is expressed as a
percentage of the existing impervious area within the InfoWorks model.
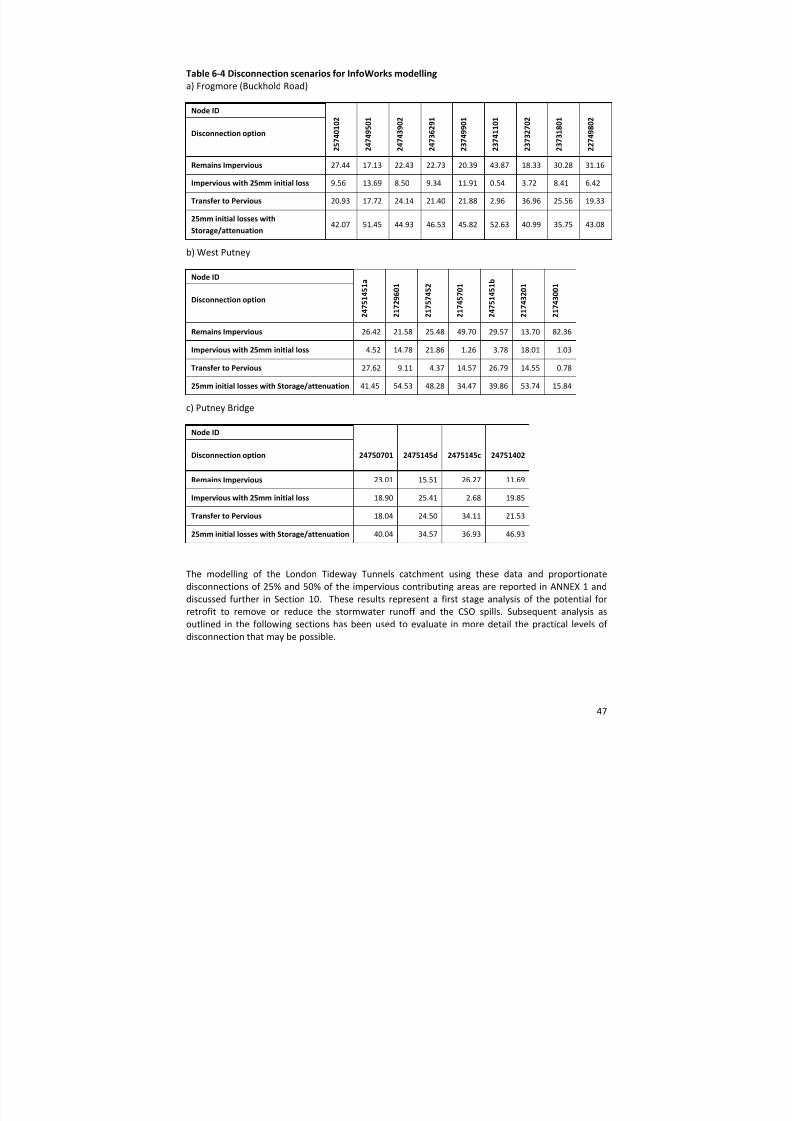
8/13/2019 Needs report: appendix E
http://slidepdf.com/reader/full/needs-report-appendix-e 58/235
47
Table 6‐4 Disconnection scenarios for InfoWorks modelling a) Frogmore (Buckhold Road)
Node ID
Disconnection option
2 5 7 4 0 1 0 2
2 4 7 4 9 5 0 1
2 4 7 4 3 9 0 2
2 4 7 3 6 2 9 1
2 3 7 4 9 9 0 1
2 3 7 4 1 1 0 1
2 3 7 3 2 7 0 2
2 3 7 3 1 8 0 1
2 2 7 4 9 8 0 2
Remains Impervious 27.44 17.13 22.43 22.73 20.39 43.87 18.33 30.28 31.16
Impervious with 25mm initial loss 9.56 13.69 8.50 9.34 11.91 0.54 3.72 8.41 6.42
Transfer to Pervious 20.93 17.72 24.14 21.40 21.88 2.96 36.96 25.56 19.33
25mm initial losses with Storage/attenuation 42.07 51.45 44.93 46.53 45.82 52.63 40.99 35.75 43.08
b) West Putney
Node ID
Disconnection option
2 4 7 5 1 4 5 1 a
2 1 7 2 9 6 0 1
2 1 7 5 7 4 5 2
2 1 7 4 5 7 0 1
2 4 7 5 1 4 5 1 b
2 1 7 4 3 2 0 1
2 1 7 4 3 0 0 1
Remains Impervious 26.42 21.58 25.48 49.70 29.57 13.70 82.36
Impervious with 25mm initial loss 4.52 14.78 21.86 1.26 3.78 18.01 1.03
Transfer to Pervious 27.62 9.11 4.37 14.57 26.79 14.55 0.78
25mm initial losses with Storage/attenuation 41.45 54.53 48.28 34.47 39.86 53.74 15.84
c) Putney Bridge
Node ID
Disconnection option 24750701 2475145d 2475145c 24751402
Remains Impervious 23.01 15.51 26.27 11.69
Impervious with 25mm initial loss 18.90 25.41 2.68 19.85
Transfer to Pervious 18.04 24.50 34.11 21.53
25mm initial losses with Storage/attenuation 40.04 34.57 36.93 46.93
The modelling of the London Tideway Tunnels catchment using these data and proportionate
disconnections of 25% and 50% of the impervious contributing areas are reported in ANNEX 1 and
discussed further in Section 10. These results represent a first stage analysis of the potential for
retrofit to remove or reduce the stormwater runoff and the CSO spills. Subsequent analysis as
outlined in the following sections has been used to evaluate in more detail the practical levels of disconnection that may be possible.

8/13/2019 Needs report: appendix E
http://slidepdf.com/reader/full/needs-report-appendix-e 59/235
48
7. Cost - benefit assessment of detailed retrofi t designs
7.1
Calculation of
Whole
Life
Costs
The SUDS manual (CIRIA, 2007) recommends the use of a Whole Life Cost (WLC) approach to
evaluating SUDS in order that ongoing costs are taken into account at the planning and feasibility
stage. This approach incorporates the present day value of the scheme and the costs associated with
its operation over its expected useful life. The benefits that are likely to accrue over the lifetime of the scheme may not be apparent at installation, therefore a long ‐term view is required. The SUDS
manual lists the benefits of the WLC approach as giving:
• improved understanding of long ‐term investment requirements, in addition to capital costs;
• more robust decision making at project appraisal stage;
• improved assessment of long term risks to drainage system performance and inclusion of
monitoring and management plans to minimise these risks; and
• reduced uncertainties associated with the development of adoption agreements, and
commuted sum contributions.
There are limited sources of reliable data for UK applications that deal with all aspects of the costs of new ‐build SUDS and there are even fewer dealing with retrofitting. Certain studies include direct
costs (e.g. Swan, 2003, Swan & Stovin, 2007), and UKWIR investigations provide comprehensive
attempts to look at Whole Life costs and benefits (WERF/UKWIR, 2005, UKWIR, 2005; UKWIR, 2009).
The 2005 studies have been regularly updated since by HR Wallingford. The 2009 study is intended
to help inform sewerage undertakers about the whole ‐life costs and benefits of stormwater
disconnection especially from combined sewerage systems. In this report, the updated HR
Wallingford methodology has been utilised for the detailed analysis and the results have then been
reviewed in the light of the UKWIR (2009) study.
The UKWIR/WERF (2005) WLC assessment as adapted by HR Wallingford (UKWIR, 2006a) is a model
based approach using spreadsheet tools that allow for the systematic and consistent identification of capital costs and on ‐going expenditure to estimate the whole life costs of individual components of SUDS‐based drainage systems. The 2006 study made attempts to quantify the likely implications of future waste management strategies. The model has two complementary modes of application: site
specific and generic application. It includes separate unit models for:
retention ponds;
detention basins;
swales;
filter drain/trenches, and
permeable pavements.
These models have been matched to the options selected for the study in Table 7.1 (from Stovin et
al, 2009).
The hydrological/hydraulic analysis is simple and uses look ‐up tables. As an example, it uses the
information given in Table 7.1 for detention basin design and costing.
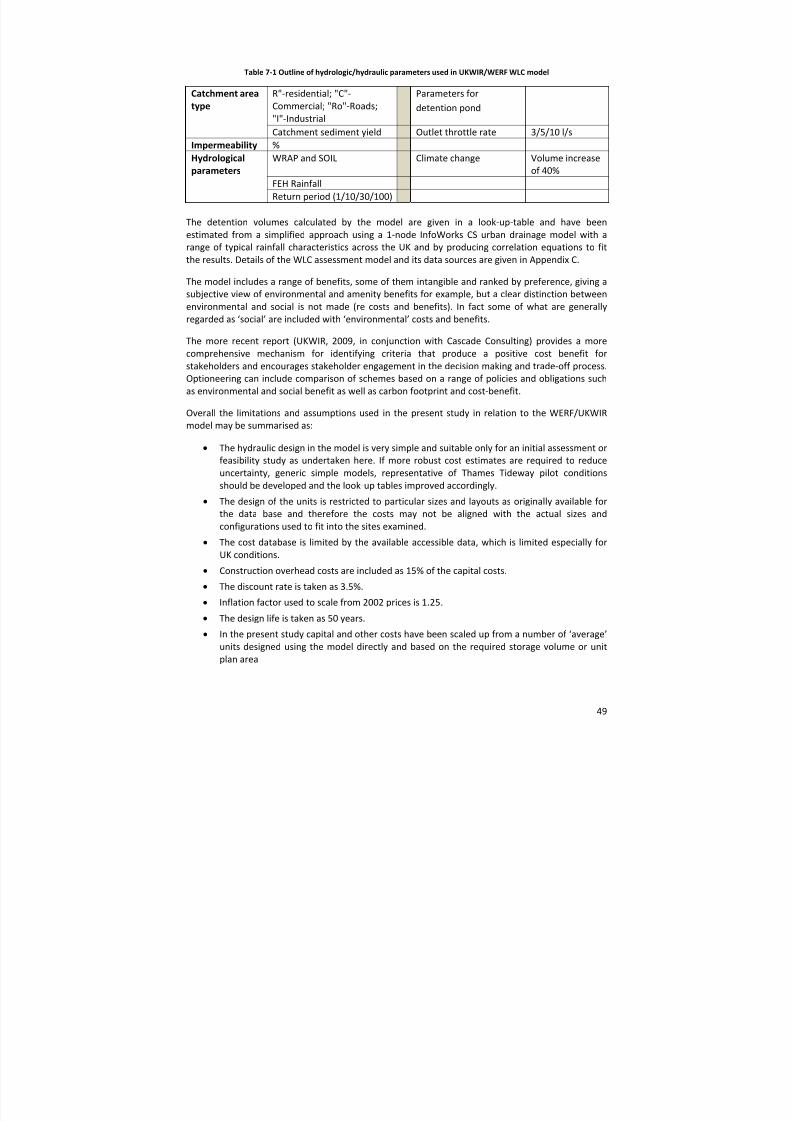
8/13/2019 Needs report: appendix E
http://slidepdf.com/reader/full/needs-report-appendix-e 60/235
49
Table 7‐1 Outline of hydrologic/hydraulic parameters used in UKWIR/WERF WLC model
Catchment area type
R"‐residential; "C"‐
Commercial; "Ro"‐Roads;
"I"‐Industrial
Parameters for
detention pond
Catchment sediment yield Outlet throttle rate 3/5/10 l/s
Impermeability %
Hydrological parameters
WRAP and SOIL Climate change Volume increase
of 40%
FEH Rainfall
Return period (1/10/30/100)
The detention volumes calculated by the model are given in a look ‐up ‐table and have been
estimated from a simplified approach using a 1‐node InfoWorks CS urban drainage model with a
range of typical rainfall characteristics across the UK and by producing correlation equations to fit
the results. Details of the WLC assessment model and its data sources are given in Appendix C.
The model includes a range of benefits, some of them intangible and ranked by preference, giving a
subjective view of environmental and amenity benefits for example, but a clear distinction between
environmental and social is not made (re costs and benefits). In fact some of what are generally
regarded as ‘social’ are included with ‘environmental’ costs and benefits.
The more recent report (UKWIR, 2009, in conjunction with Cascade Consulting) provides a more
comprehensive mechanism for identifying criteria that produce a positive cost benefit for
stakeholders and encourages stakeholder engagement in the decision making and trade ‐off process.
Optioneering can include comparison of schemes based on a range of policies and obligations such
as environmental and social benefit as well as carbon footprint and cost ‐benefit.
Overall the limitations and assumptions used in the present study in relation to the WERF/UKWIR model may be summarised as:
The hydraulic design in the model is very simple and suitable only for an initial assessment or
feasibility study as undertaken here. If more robust cost estimates are required to reduce
uncertainty, generic simple models, representative of Thames Tideway pilot conditions
should be developed and the look ‐up tables improved accordingly.
The design of the units is restricted to particular sizes and layouts as originally available for
the data base and therefore the costs may not be aligned with the actual sizes and
configurations used to fit into the sites examined.
The cost database is limited by the available accessible data, which is limited especially for
UK conditions.
Construction overhead costs are included as 15% of the capital costs.
The discount rate is taken as 3.5%.
Inflation factor used to scale from 2002 prices is 1.25.
The design life is taken as 50 years.
In the present study capital and other costs have been scaled up from a number of ‘average’
units designed using the model directly and based on the required storage volume or unit
plan area

8/13/2019 Needs report: appendix E
http://slidepdf.com/reader/full/needs-report-appendix-e 61/235
50
Not all of the elements of the associated infrastructure for each designed unit have been
costed in detail; for example, associated and connecting pipework has been costed based on
aggregated estimates and ‘averaged’ costs from the design of a few of the units
The potential (and relative scaled) environmental and ecological benefit costs provided in
the WERF/UKWIR model have not been used in the assessment, due to their potential
subjectivity, nor has the associated pollution costs or flood damage prevention costs. The benefit cost approach is similar in both HRW and the Cascade models in terms of needing an
intangible ‘unit’ benefit value (Cascade uses a willingness to pay value from the most recent
public surveys) which is scaled up by numbers affected. The values suggested in the HRW
model are those available at the time (in 2003) and are therefore out of date. Both models
require site ‐specific data; otherwise the numbers are of limited value, being indicative only.
Where appropriate, for certain units, the cost of sediment removal and associated
maintenance has also been included.
The analysis in this study draws on both approaches in order to provide a robust and
comprehensive view of the whole life costs and potential benefits of the SUDS schemes
proposed.
7.2 SUDS Unit costs A review of published unit costs of SUDS was undertaken as part of the costing process. This relies
heavily on the HR Wallingford whole life costing model (Appendix C) as shown in Table 7.2. The
costings for the SUDS used are explained in the following Sections.

8/13/2019 Needs report: appendix E
http://slidepdf.com/reader/full/needs-report-appendix-e 62/235
51
Table 7‐2 SUDS unit costs
Surface type
Primary options
Swan costs (construction)
new rather
than retrofit (2002 prices factored 1.25)
Wallingford costs
Costs used in the present study/comments
Performance and
HR
Wallingford model tool
Roads Pocket streetinfiltration
Infiltrationtrench.Inc.membraneand distributorpipework. £92-£125 per mlength.
WLC: £229/m 2 ofconstructed unit(7 x 5m) £29/m 2 of road surfacedrained(constructioncosts £7.6/m 2 &£112/m 2
respectively)Does not includecosts of roadreinstatement orservicedisruption
£225/m 2 (£112construction cost)of unit areaconstructed (7 x5m x0.9m depth).and £29/m 2 (£7.6/m 2 construction) ofroad area drained.Not used so far inUK
Infiltrationtrench and/orDetentionbasin (normallydry).
To adjacentpervious/SEAStreets
Assume as forpermeable roadsurface, but unitsmay have larger
plan area andsmaller depthmore likedetention basins(see below).
Costs ofredirecting roadand other localdrainage depend
on localcircumstances. Allow WLC of £121per m 2 asequivalent topermeable pavingfor roads below.
Detentionbasin and/orfilter drain,although may
be flat grassedarea
Permeableroad surface
Mediumtrafficked: WLC£121/m 2 and£110/m 2 capital
cost.Potentially usepermeablepavement withhigh loading(5000kg)£130/m 2 and£118/m 2.These do notinclude servicerelocation costs
Not consideredfeasible in shortterm in UK exceptfor certain non-
main or trunkroads. Mediumtrafficked: WLC£121/m 2 and£110/m 2 capitalcost.Potentially usepermeablepavement withhigh loading(5000kg) £130/m 2 and £118/m 2.
Permeablepavement(without liner)

8/13/2019 Needs report: appendix E
http://slidepdf.com/reader/full/needs-report-appendix-e 63/235
52
Surface type
Primary options
Swan costs (construction)
new rather than retrofit (2002 prices factored 1.25)
Wallingford costs
Costs used in the present study/comments
Performance and
HR Wallingford model tool
Roads Off-site –localdetention andswaleconveyance
Swales: inc.costs of localconnections.£22 - £25 inc.reinstatement
Swale asconnections -costs £21-£25/m.
Swale WLC,includingpipework :£247/m length or£40 -£70/m 2
SUDS manual:Swale 15 yeardesign life. Capex- £12.50/m 2.Regular Opex -£0.1/m 2.Occasional Opex -£0.15/m 2.Remedial Opex -£2.0/m 2 Monitoring -£0.05/m 2
Swale,detention basinor retentionponddepending onlocalcircumstances
Non-roadhardstanding(inc. carparks)Contiguousareas ofman-madesurfaces>200m 2
Permeablesurfacestorage
Grasscrete:£78/m 2.
WLC: £121/m 2 based onformpave (2009)data and lightaxle load(2000kg)
Formpave suggest£100-£1000 peryear formaintenance.SUDS manual(2006) for 40 yearlife: Capex £54/m 2 Opex £0.4/m 2.£168/m 2 Scott-Wilson Interpave
SUDS manual :0.8m 3 storedper m 2 ofpervioussurface.Permeablepavement(without liner)
Adjacentpervious
Costs ofredirecting roadand other localdrainage dependon localcircumstances
Detentionbasin and/orfilter drain,although maybe flat grassedarea
Off-site e.g.localdetention
Ponds: £44-£70/m 3 unlined butincludingpipework.
WLC modelgives £39/m 3 fordetention basinwithout pipeworkand with liner
Swale,detention basinor retentionponddepending onlocalcircumstances
Man-madesurfacesother thanabove
Adjacentpervious
Costs ofredirecting roadand other localdrainage dependon localcircumstances –take as the samefor disconnectingroof downpipes£160 per 65m 2 i.e.£2.50 per m 2.
Detentionbasin and/orfilter drain,although maybe flat grassedarea
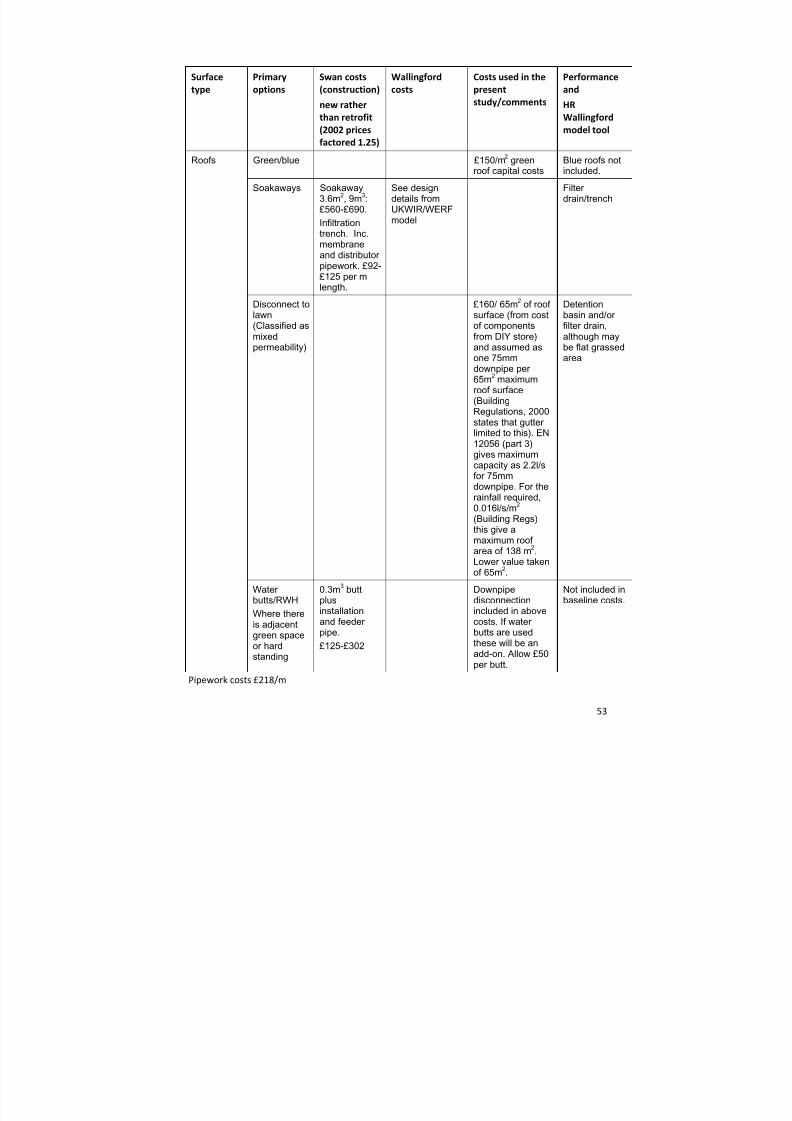
8/13/2019 Needs report: appendix E
http://slidepdf.com/reader/full/needs-report-appendix-e 64/235
53
Surface type
Primary options
Swan costs (construction)
new rather than retrofit (2002 prices factored 1.25)
Wallingford costs
Costs used in the present study/comments
Performance and
HR Wallingford model tool
Roofs Green/blue £150/m 2 greenroof capital costs
Blue roofs notincluded.
Soakaways Soakaway3.6m 2, 9m 3:£560-£690.Infiltrationtrench. Inc.membraneand distributorpipework. £92-
£125 per mlength.
See designdetails fromUKWIR/WERFmodel
Filterdrain/trench
Disconnect tolawn(Classified asmixedpermeability)
£160/ 65m 2 of roofsurface (from costof componentsfrom DIY store)and assumed asone 75mmdownpipe per65m 2 maximumroof surface(Building
Regulations, 2000states that gutterlimited to this). EN12056 (part 3)gives maximumcapacity as 2.2l/sfor 75mmdownpipe. For therainfall required,0.016l/s/m 2 (Building Regs)this give amaximum roof
area of 138 m2
.Lower value takenof 65m 2.
Detentionbasin and/orfilter drain,although maybe flat grassedarea
Waterbutts/RWHWhere thereis adjacentgreen spaceor hardstanding
0.3m 3 buttplusinstallationand feederpipe.£125-£302
Downpipedisconnectionincluded in abovecosts. If waterbutts are usedthese will be anadd-on. Allow £50per butt.
Not included inbaseline costs.
Pipework costs £218/m
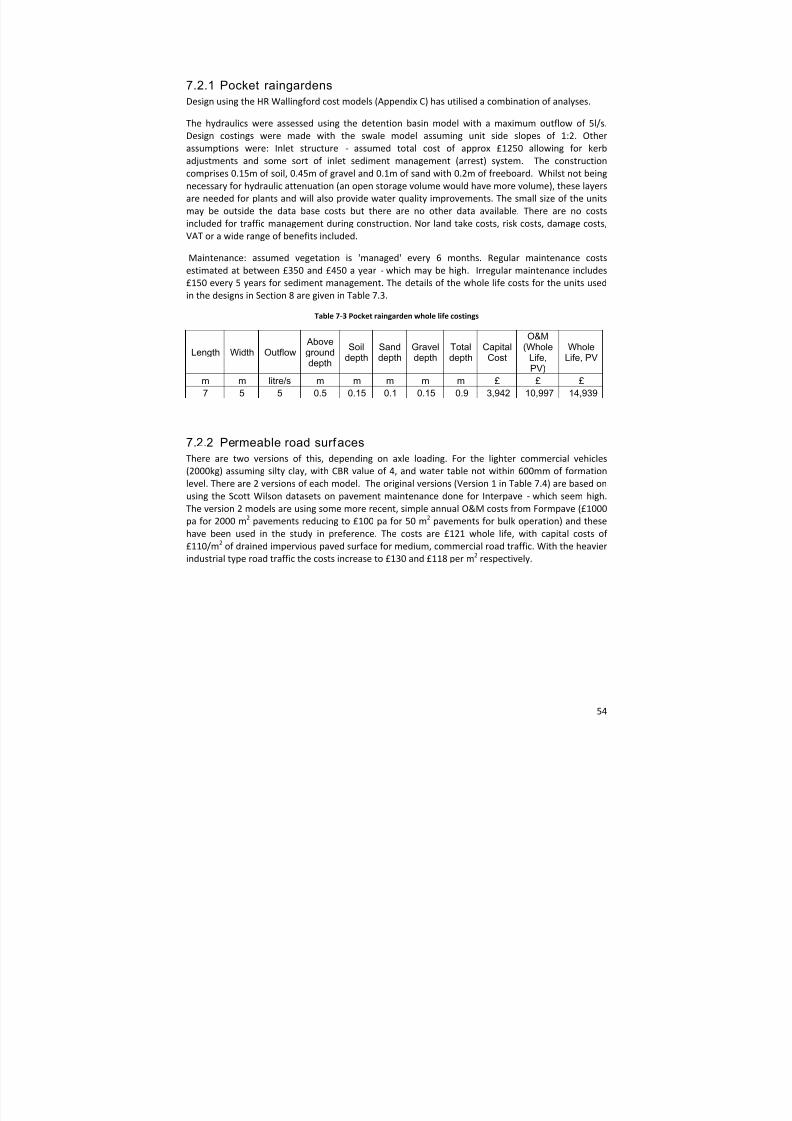
8/13/2019 Needs report: appendix E
http://slidepdf.com/reader/full/needs-report-appendix-e 65/235
54
7.2.1 Pocket raingardensDesign using the HR Wallingford cost models (Appendix C) has utilised a combination of analyses.
The hydraulics were assessed using the detention basin model with a maximum outflow of 5l/s.
Design costings were made with the swale model assuming unit side slopes of 1:2. Other assumptions were: Inlet structure ‐ assumed total cost of approx £1250 allowing for kerb
adjustments and some sort of inlet sediment management (arrest) system. The construction
comprises 0.15m of soil, 0.45m of gravel and 0.1m of sand with 0.2m of freeboard. Whilst not being
necessary for hydraulic attenuation (an open storage volume would have more volume), these layers
are needed for plants and will also provide water quality improvements. The small size of the units
may be outside the data base costs but there are no other data available. There are no costs
included for traffic management during construction. Nor land take costs, risk costs, damage costs,
VAT or a wide range of benefits included.
Maintenance: assumed vegetation is 'managed' every 6 months. Regular maintenance costs
estimated at between £350 and £450 a year ‐ which may be high. Irregular maintenance includes
£150 every 5 years for sediment management. The details of the whole life costs for the units used
in the designs in Section 8 are given in Table 7.3.
Table 7‐3 Pocket raingarden whole life costings
Length Width Outflow Abovegrounddepth
Soildepth
Sanddepth
Graveldepth
Totaldepth
CapitalCost
O&M(Whole
Life,PV)
WholeLife, PV
m m litre/s m m m m m £ £ £7 5 5 0.5 0.15 0.1 0.15 0.9 3,942 10,997 14,939
7.2.2 Permeable road surfacesThere are two versions of this, depending on axle loading. For the lighter commercial vehicles
(2000kg) assuming silty clay, with CBR value of 4, and water table not within 600mm of formation
level. There are 2 versions of each model. The original versions (Version 1 in Table 7.4) are based on
using the Scott Wilson datasets on pavement maintenance done for Interpave ‐ which seem high.
The version 2 models are using some more recent, simple annual O&M costs from Formpave (£1000
pa for 2000 m2 pavements reducing to £100 pa for 50 m2 pavements for bulk operation) and these
have been used in the study in preference. The costs are £121 whole life, with capital costs of £110/m 2 of drained impervious paved surface for medium, commercial road traffic. With the heavier
industrial type road traffic the costs increase to £130 and £118 per m2 respectively.
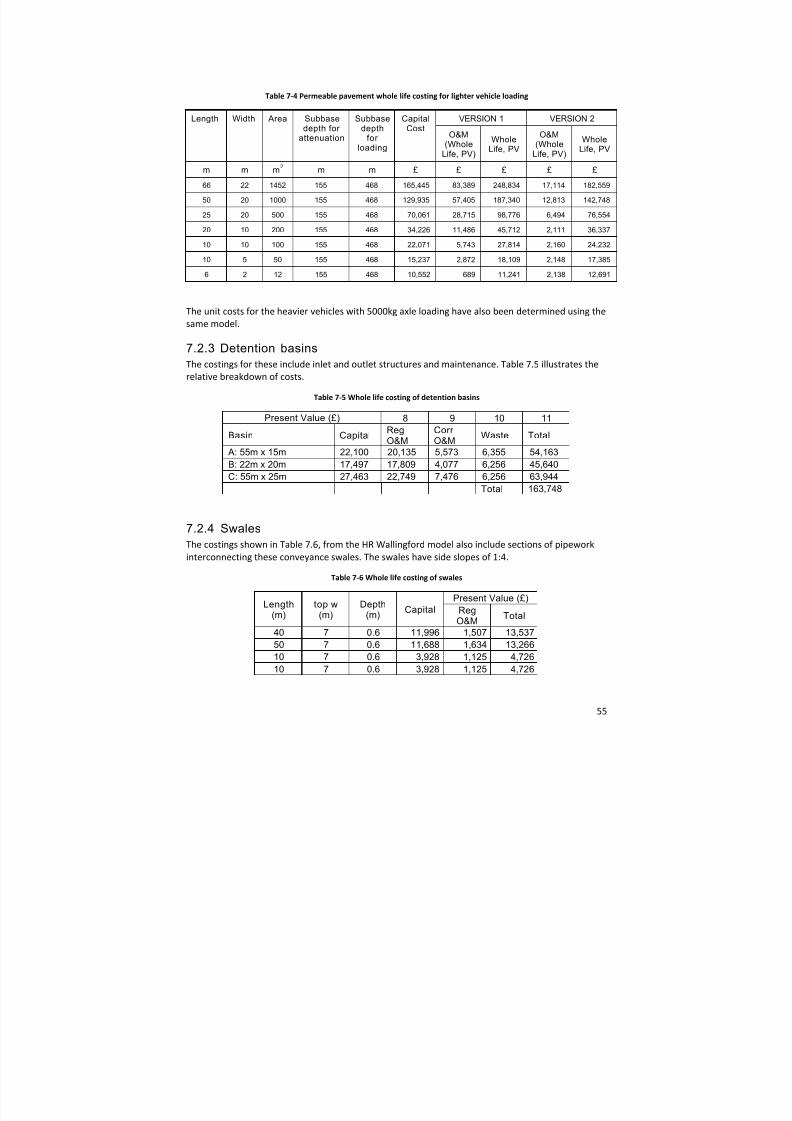
8/13/2019 Needs report: appendix E
http://slidepdf.com/reader/full/needs-report-appendix-e 66/235
55
Table 7‐4 Permeable pavement whole life costing for lighter vehicle loading
Length Width Area Subbasedepth for
attenuation
Subbasedepth
forloading
CapitalCost
VERSION 1 VERSION 2
O&M(WholeLife, PV)
WholeLife, PV
O&M(WholeLife, PV)
WholeLife, PV
m m m 2 m m £ £ £ £ £
66 22 1452 155 468 165,445 83,389 248,834 17,114 182,559
50 20 1000 155 468 129,935 57,405 187,340 12,813 142,748
25 20 500 155 468 70,061 28,715 98,776 6,494 76,554
20 10 200 155 468 34,226 11,486 45,712 2,111 36,337
10 10 100 155 468 22,071 5,743 27,814 2,160 24,232
10 5 50 155 468 15,237 2,872 18,109 2,148 17,385
6 2 12 155 468 10,552 689 11,241 2,138 12,691
The unit costs for the heavier vehicles with 5000kg axle loading have also been determined using the
same model.
7.2.3 Detention basinsThe costings for these include inlet and outlet structures and maintenance. Table 7.5 illustrates the
relative breakdown of costs.
Table 7‐5 Whole life costing of detention basins
Present Value (£) 8 9 10 11
Basin Capital RegO&M
CorrO&M Waste Total
A: 55m x 15m 22,100 20,135 5,573 6,355 54,163B: 22m x 20m 17,497 17,809 4,077 6,256 45,640C: 55m x 25m 27,463 22,749 7,476 6,256 63,944
Total 163,748
7.2.4 SwalesThe costings shown in Table 7.6, from the HR Wallingford model also include sections of pipework
interconnecting these conveyance swales. The swales have side slopes of 1:4.
Table 7‐6 Whole life costing of swales
Length(m)
top w(m)
Depth(m) Capital
Present Value (£) RegO&M Total
40 7 0.6 11,996 1,507 13,53750 7 0.6 11,688 1,634 13,26610 7 0.6 3,928 1,125 4,72610 7 0.6 3,928 1,125 4,726
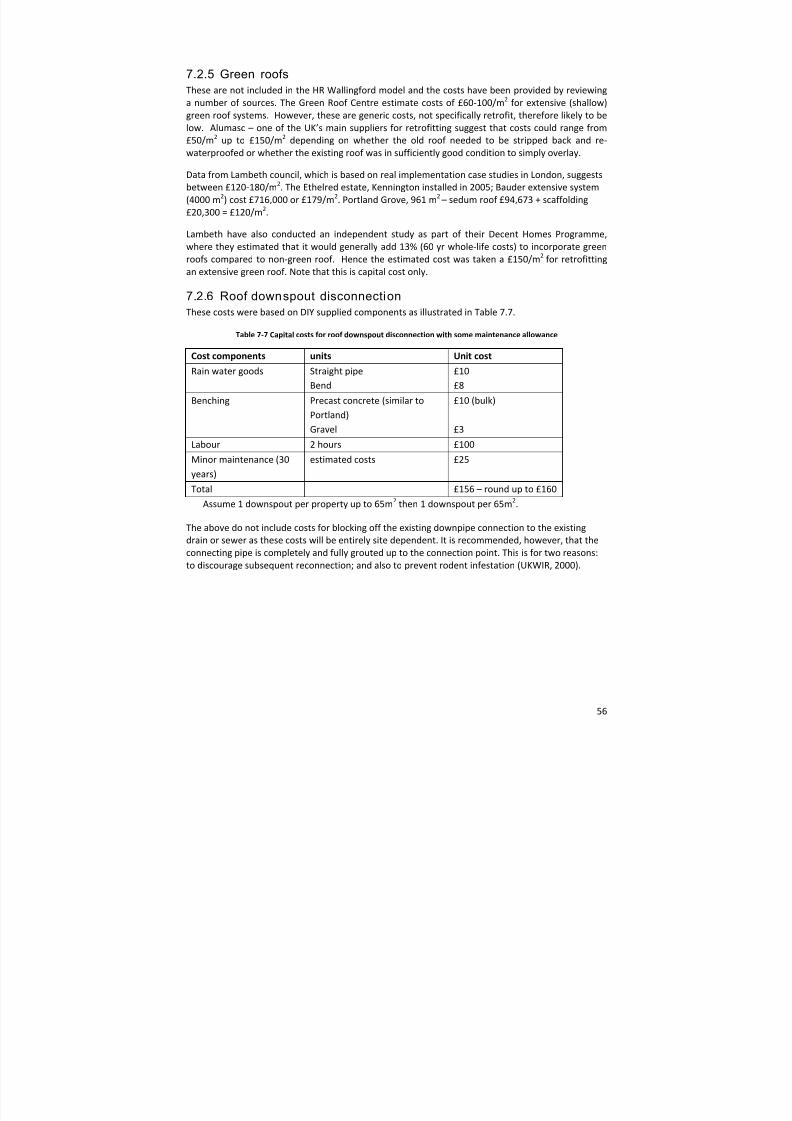
8/13/2019 Needs report: appendix E
http://slidepdf.com/reader/full/needs-report-appendix-e 67/235
56
7.2.5 Green roofsThese are not included in the HR Wallingford model and the costs have been provided by reviewing
a number of sources. The Green Roof Centre estimate costs of £60 ‐100/m 2 for extensive (shallow)
green roof systems. However, these are generic costs, not specifically retrofit, therefore likely to be
low. Alumasc – one of the UK’s main suppliers for retrofitting suggest that costs could range from
£50/m 2 up to £150/m 2 depending on whether the old roof needed to be stripped back and re ‐waterproofed or whether the existing roof was in sufficiently good condition to simply overlay.
Data from Lambeth council, which is based on real implementation case studies in London, suggests
between £120 ‐180/m 2. The Ethelred estate, Kennington installed in 2005; Bauder extensive system
(4000 m2) cost £716,000 or £179/m 2. Portland Grove, 961 m2 – sedum roof £94,673 + scaffolding
£20,300 = £120/m 2.
Lambeth have also conducted an independent study as part of their Decent Homes Programme,
where they estimated that it would generally add 13% (60 yr whole ‐life costs) to incorporate green
roofs compared to non ‐green roof. Hence the estimated cost was taken a £150/m 2 for retrofitting
an extensive green roof. Note that this is capital cost only.
7.2.6 Roof downspout disconnectionThese costs were based on DIY supplied components as illustrated in Table 7.7.
Table 7‐7 Capital costs for roof downspout disconnection with some maintenance allowance
Cost components units Unit cost
Rain water goods Straight pipe
Bend
£10
£8
Benching Precast concrete (similar to
Portland) Gravel
£10 (bulk)
£3
Labour 2 hours £100
Minor maintenance (30
years)
estimated costs £25
Total £156 – round up to £160
Assume 1 downspout per property up to 65m 2 then 1 downspout per 65m 2.
The above do not include costs for blocking off the existing downpipe connection to the existing
drain or sewer as these costs will be entirely site dependent. It is recommended, however, that the
connecting pipe is completely and fully grouted up to the connection point. This is for two reasons: to discourage subsequent reconnection; and also to prevent rodent infestation (UKWIR, 2000).
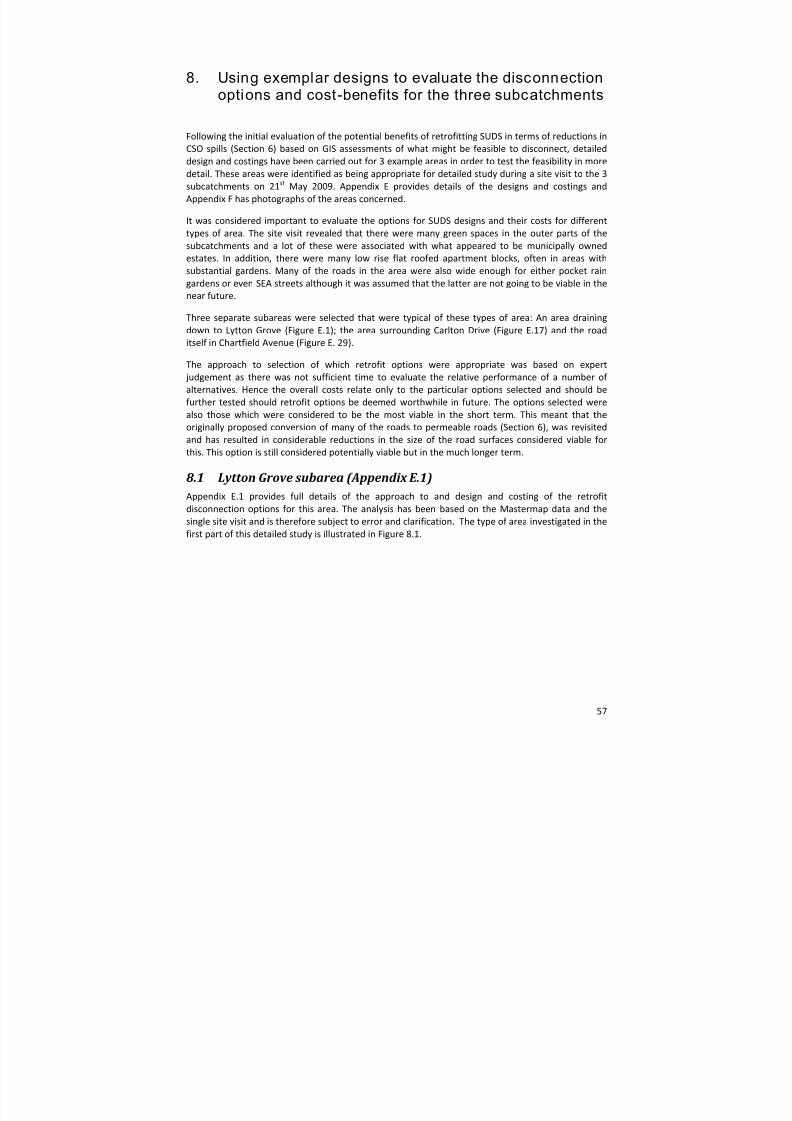
8/13/2019 Needs report: appendix E
http://slidepdf.com/reader/full/needs-report-appendix-e 68/235
57
8. Using exemplar designs to evaluate the disconnectionoptions and cost-benefits for the three subcatchments
Following the initial evaluation of the potential benefits of retrofitting SUDS in terms of reductions in CSO spills (Section 6) based on GIS assessments of what might be feasible to disconnect, detailed
design and costings have been carried out for 3 example areas in order to test the feasibility in more
detail. These areas were identified as being appropriate for detailed study during a site visit to the 3
subcatchments on 21 st May 2009. Appendix E provides details of the designs and costings and
Appendix F has photographs of the areas concerned.
It was considered important to evaluate the options for SUDS designs and their costs for different
types of area. The site visit revealed that there were many green spaces in the outer parts of the
subcatchments and a lot of these were associated with what appeared to be municipally owned
estates. In addition, there were many low rise flat roofed apartment blocks, often in areas with
substantial gardens. Many of the roads in the area were also wide enough for either pocket rain
gardens or even SEA streets although it was assumed that the latter are not going to be viable in the
near future.
Three separate subareas were selected that were typical of these types of area: An area draining
down to Lytton Grove (Figure E.1); the area surrounding Carlton Drive (Figure E.17) and the road
itself in Chartfield Avenue (Figure E. 29).
The approach to selection of which retrofit options were appropriate was based on expert
judgement as there was not sufficient time to evaluate the relative performance of a number of alternatives. Hence the overall costs relate only to the particular options selected and should be
further tested should retrofit options be deemed worthwhile in future. The options selected were
also those which were considered to be the most viable in the short term. This meant that the originally proposed conversion of many of the roads to permeable roads (Section 6), was revisited
and has resulted in considerable reductions in the size of the road surfaces considered viable for
this. This option is still considered potentially viable but in the much longer term.
8.1 Lytton Grove subarea (Appendix E.1) Appendix E.1 provides full details of the approach to and design and costing of the retrofit
disconnection options for this area. The analysis has been based on the Mastermap data and the
single site visit and is therefore subject to error and clarification. The type of area investigated in the
first part of this detailed study is illustrated in Figure 8.1.
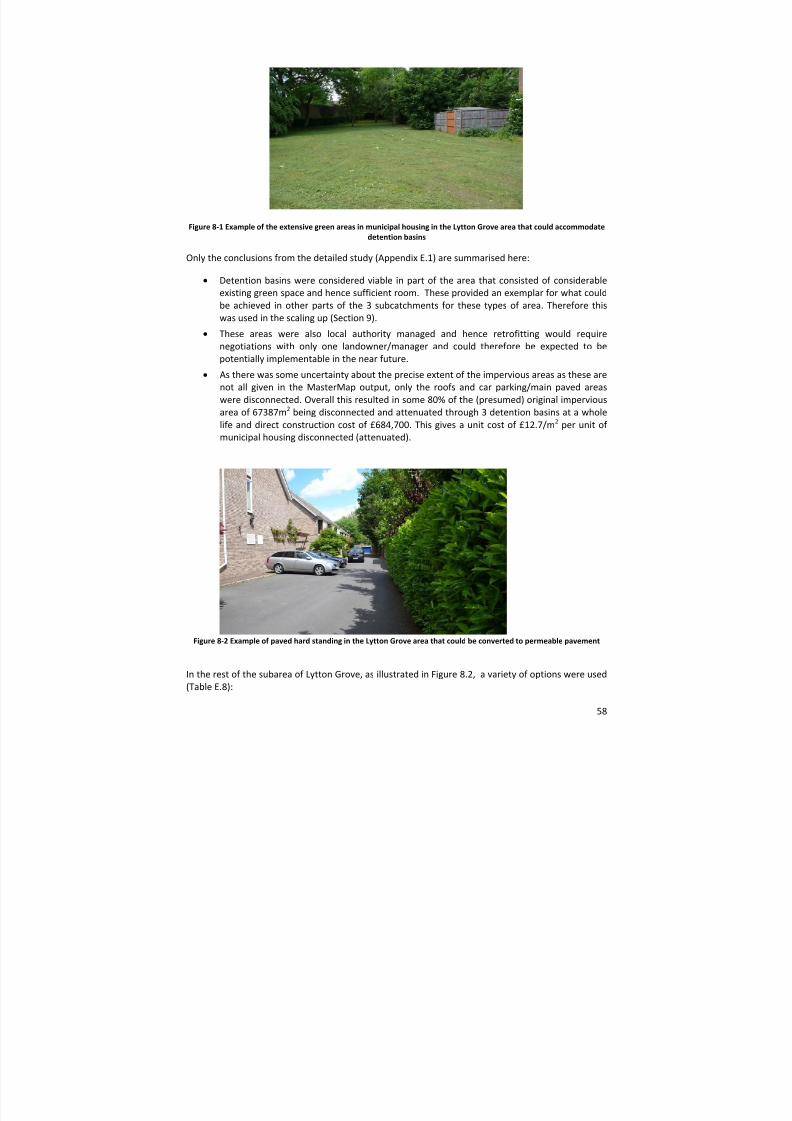
8/13/2019 Needs report: appendix E
http://slidepdf.com/reader/full/needs-report-appendix-e 69/235
58
Figure 8‐1 Example of the extensive green areas in municipal housing in the Lytton Grove area that could accommodate detention basins
Only the conclusions from the detailed study (Appendix E.1) are summarised here:
Detention basins were considered viable in part of the area that consisted of considerable
existing green space and hence sufficient room. These provided an exemplar for what could
be achieved in other parts of the 3 subcatchments for these types of area. Therefore this
was used in the scaling up (Section 9).
These areas were also local authority managed and hence retrofitting would require
negotiations with only one landowner/manager and could therefore be expected to be
potentially implementable in the near future.
As there was some uncertainty about the precise extent of the impervious areas as these are
not all given in the MasterMap output, only the roofs and car parking/main paved areas
were disconnected. Overall this resulted in some 80% of the (presumed) original impervious
area of 67387m2
being disconnected and attenuated through 3 detention basins at a whole life and direct construction cost of £684,700. This gives a unit cost of £12.7/m 2 per unit of municipal housing disconnected (attenuated).
Figure 8‐2 Example of paved hard standing in the Lytton Grove area that could be converted to permeable pavement
In the rest of the subarea of Lytton Grove, as illustrated in Figure 8.2, a variety of options were used
(Table E.8):
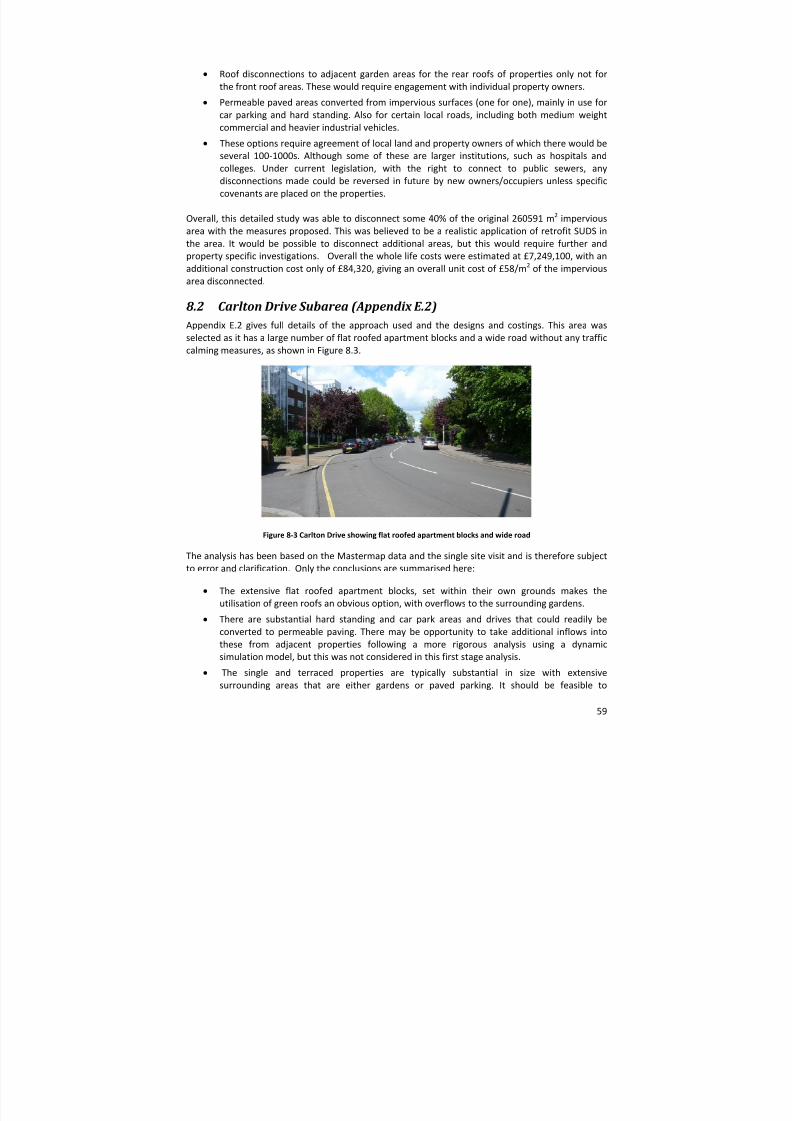
8/13/2019 Needs report: appendix E
http://slidepdf.com/reader/full/needs-report-appendix-e 70/235
59
Roof disconnections to adjacent garden areas for the rear roofs of properties only not for
the front roof areas. These would require engagement with individual property owners.
Permeable paved areas converted from impervious surfaces (one for one), mainly in use for
car parking and hard standing. Also for certain local roads, including both medium weight
commercial and heavier industrial vehicles.
These options require agreement of local land and property owners of which there would be
several 100 ‐1000s. Although some of these are larger institutions, such as hospitals and
colleges. Under current legislation, with the right to connect to public sewers, any
disconnections made could be reversed in future by new owners/occupiers unless specific
covenants are placed on the properties.
Overall, this detailed study was able to disconnect some 40% of the original 260591 m2 impervious
area with the measures proposed. This was believed to be a realistic application of retrofit SUDS in
the area. It would be possible to disconnect additional areas, but this would require further and
property specific investigations. Overall the whole life costs were estimated at £7,249,100, with an
additional construction cost only of £84,320, giving an overall unit cost of £58/m 2 of the impervious
area disconnected.
8.2 Carlton Drive Subarea (Appendix E.2) Appendix E.2 gives full details of the approach used and the designs and costings. This area was
selected as it has a large number of flat roofed apartment blocks and a wide road without any traffic
calming measures, as shown in Figure 8.3.
Figure 8‐3 Carlton Drive showing flat roofed apartment blocks and wide road
The analysis has been based on the Mastermap data and the single site visit and is therefore subject to error and clarification. Only the conclusions are summarised here:
The extensive flat roofed apartment blocks, set within their own grounds makes the
utilisation of green roofs an obvious option, with overflows to the surrounding gardens.
There are substantial hard standing and car park areas and drives that could readily be
converted to permeable paving. There may be opportunity to take additional inflows into
these from adjacent properties following a more rigorous analysis using a dynamic
simulation model, but this was not considered in this first stage analysis.
The single and terraced properties are typically substantial in size with extensive
surrounding areas that are either gardens or paved parking. It should be feasible to
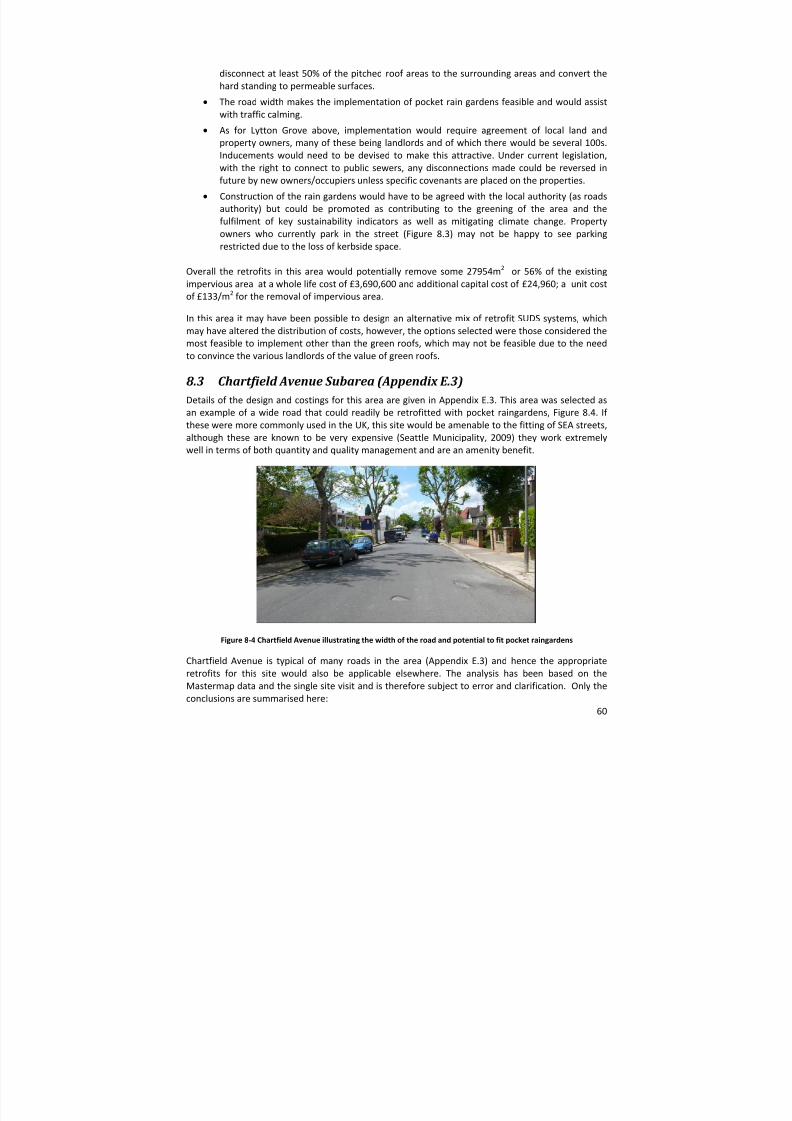
8/13/2019 Needs report: appendix E
http://slidepdf.com/reader/full/needs-report-appendix-e 71/235
60
disconnect at least 50% of the pitched roof areas to the surrounding areas and convert the
hard standing to permeable surfaces.
The road width makes the implementation of pocket rain gardens feasible and would assist
with traffic calming.
As for Lytton Grove above, implementation would require agreement of local land and
property owners, many of these being landlords and of which there would be several 100s.
Inducements would need to be devised to make this attractive. Under current legislation,
with the right to connect to public sewers, any disconnections made could be reversed in
future by new owners/occupiers unless specific covenants are placed on the properties.
Construction of the rain gardens would have to be agreed with the local authority (as roads
authority) but could be promoted as contributing to the greening of the area and the
fulfilment of key sustainability indicators as well as mitigating climate change. Property
owners who currently park in the street (Figure 8.3) may not be happy to see parking
restricted due to the loss of kerbside space.
Overall the retrofits in this area would potentially remove some 27954m 2 or 56% of the existing
impervious area at a whole life cost of £3,690,600 and additional capital cost of £24,960; a unit cost
of £133/m 2 for the removal of impervious area.
In this area it may have been possible to design an alternative mix of retrofit SUDS systems, which
may have altered the distribution of costs, however, the options selected were those considered the
most feasible to implement other than the green roofs, which may not be feasible due to the need
to convince the various landlords of the value of green roofs.
8.3 Chartfield Avenue Subarea (Appendix E.3) Details of the design and costings for this area are given in Appendix E.3. This area was selected as
an example of a wide road that could readily be retrofitted with pocket raingardens, Figure 8.4. If these were more commonly used in the UK, this site would be amenable to the fitting of SEA streets,
although these are known to be very expensive (Seattle Municipality, 2009) they work extremely
well in terms of both quantity and quality management and are an amenity benefit.
Figure 8‐4 Chartfield Avenue illustrating the width of the road and potential to fit pocket raingardens
Chartfield Avenue is typical of many roads in the area (Appendix E.3) and hence the appropriate
retrofits for this site would also be applicable elsewhere. The analysis has been based on the
Mastermap data and the single site visit and is therefore subject to error and clarification. Only the
conclusions are summarised here:
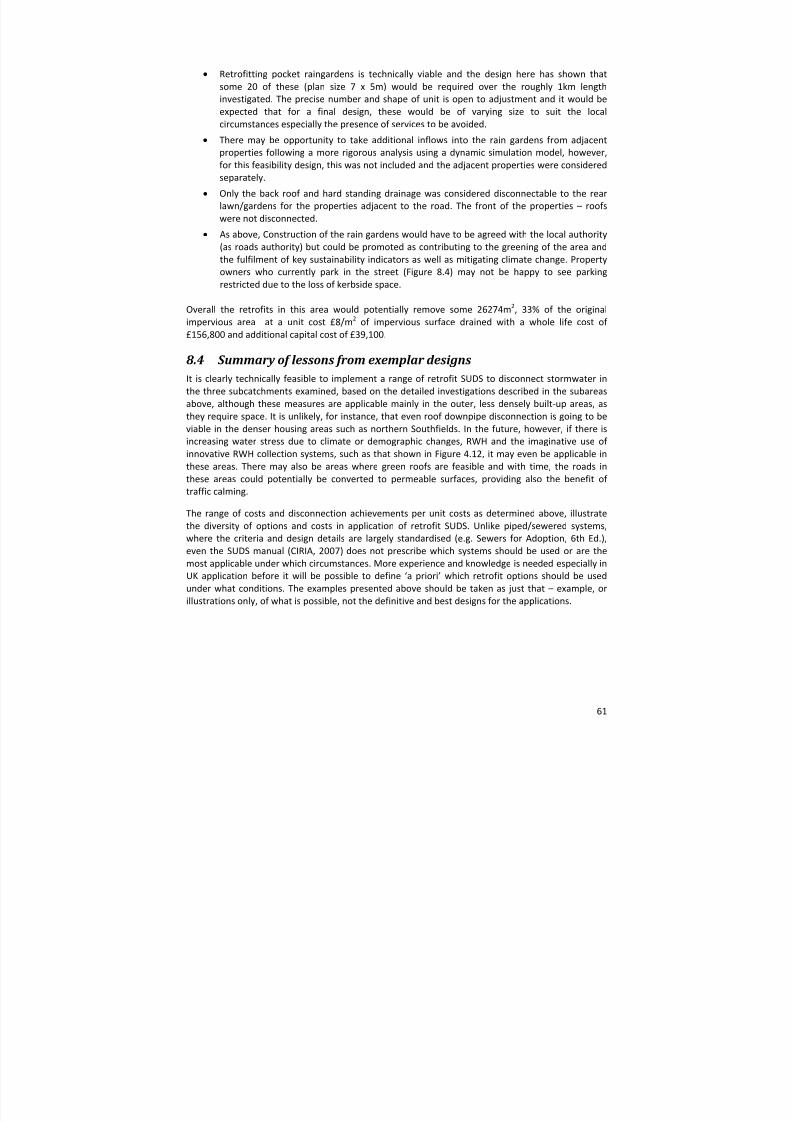
8/13/2019 Needs report: appendix E
http://slidepdf.com/reader/full/needs-report-appendix-e 72/235
61
Retrofitting pocket raingardens is technically viable and the design here has shown that
some 20 of these (plan size 7 x 5m) would be required over the roughly 1km length
investigated. The precise number and shape of unit is open to adjustment and it would be
expected that for a final design, these would be of varying size to suit the local
circumstances especially the presence of services to be avoided.
There may be opportunity to take additional inflows into the rain gardens from adjacent properties following a more rigorous analysis using a dynamic simulation model, however,
for this feasibility design, this was not included and the adjacent properties were considered
separately.
Only the back roof and hard standing drainage was considered disconnectable to the rear
lawn/gardens for the properties adjacent to the road. The front of the properties – roofs
were not disconnected.
As above, Construction of the rain gardens would have to be agreed with the local authority
(as roads authority) but could be promoted as contributing to the greening of the area and
the fulfilment of key sustainability indicators as well as mitigating climate change. Property
owners who currently park in the street (Figure 8.4) may not be happy to see parking
restricted due to the loss of kerbside space.
Overall the retrofits in this area would potentially remove some 26274m 2, 33% of the original
impervious area at a unit cost £8/m 2 of impervious surface drained with a whole life cost of £156,800 and additional capital cost of £39,100.
8.4 Summary of lessons from exemplar designs It is clearly technically feasible to implement a range of retrofit SUDS to disconnect stormwater in
the three subcatchments examined, based on the detailed investigations described in the subareas
above, although these measures are applicable mainly in the outer, less densely built ‐up areas, as
they require space. It is unlikely, for instance, that even roof downpipe disconnection is going to be viable in the denser housing areas such as northern Southfields. In the future, however, if there is
increasing water stress due to climate or demographic changes, RWH and the imaginative use of innovative RWH collection systems, such as that shown in Figure 4.12, it may even be applicable in
these areas. There may also be areas where green roofs are feasible and with time, the roads in
these areas could potentially be converted to permeable surfaces, providing also the benefit of traffic calming.
The range of costs and disconnection achievements per unit costs as determined above, illustrate
the diversity of options and costs in application of retrofit SUDS. Unlike piped/sewered systems,
where the criteria and design details are largely standardised (e.g. Sewers for Adoption, 6th Ed.),
even the SUDS manual (CIRIA, 2007) does not prescribe which systems should be used or are the most applicable under which circumstances. More experience and knowledge is needed especially in
UK application before it will be possible to define ‘a priori’ which retrofit options should be used
under what conditions. The examples presented above should be taken as just that – example, or
illustrations only, of what is possible, not the definitive and best designs for the applications.
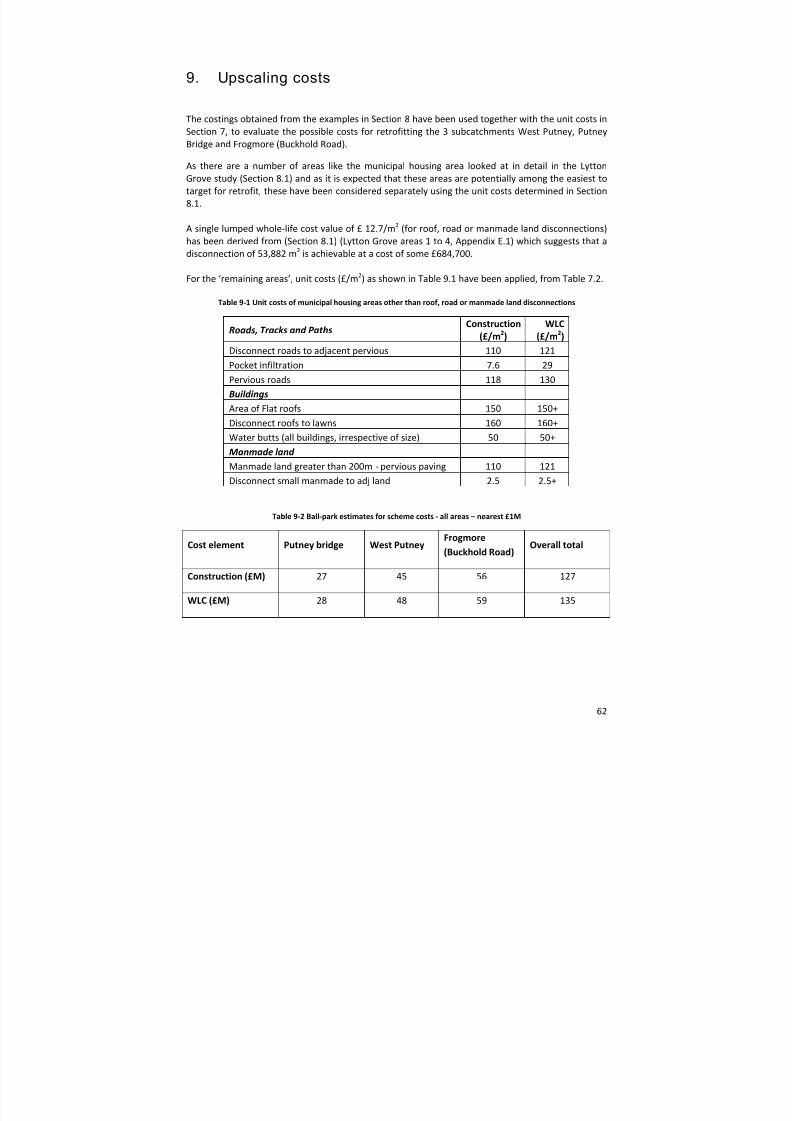
8/13/2019 Needs report: appendix E
http://slidepdf.com/reader/full/needs-report-appendix-e 73/235
62
9. Upscaling costs
The costings obtained from the examples in Section 8 have been used together with the unit costs in
Section 7, to evaluate the possible costs for retrofitting the 3 subcatchments West Putney, Putney
Bridge and Frogmore (Buckhold Road).
As there are a number of areas like the municipal housing area looked at in detail in the Lytton
Grove study (Section 8.1) and as it is expected that these areas are potentially among the easiest to
target for retrofit, these have been considered separately using the unit costs determined in Section
8.1.
A single lumped whole ‐life cost value of £ 12.7/m 2 (for roof, road or manmade land disconnections)
has been derived from (Section 8.1) (Lytton Grove areas 1 to 4, Appendix E.1) which suggests that a
disconnection of 53,882 m2 is achievable at a cost of some £684,700.
For the ‘remaining areas’, unit costs (£/m 2) as shown in Table 9.1 have been applied, from Table 7.2.
Table 9‐1 Unit costs of municipal housing areas other than roof, road or manmade land disconnections
Roads, Tracks and Paths Construction (£/m 2)
WLC (£/m 2)
Disconnect roads to adjacent pervious 110 121
Pocket infiltration 7.6 29
Pervious roads 118 130
Buildings Area of Flat roofs 150 150+
Disconnect roofs to lawns 160 160+
Water butts (all buildings, irrespective of size) 50 50+
Manmade land Manmade land greater than 200m ‐ pervious paving 110 121
Disconnect small manmade to adj land 2.5 2.5+
Table 9‐2 Ball‐park estimates for scheme costs ‐ all areas – nearest £1M
Cost element Putney bridge West Putney Frogmore
(Buckhold Road) Overall total
Construction (£M) 27 45 56 127
WLC (£M) 28 48 59 135
8/13/2019 Needs report: appendix E
http://slidepdf.com/reader/full/needs-report-appendix-e 74/235
63
10. Disconnection scenarios for modelling purposes
The InfoWorks model runs initially carried out (Section 6) were based on global amounts of disconnection of impervious areas of 25% and 50% and also initial assessments of the potential
disconnection percentages in the 3 subcatchments: West Putney, Putney Bridge and Frogmore (Buckhold Road). These results were reported in Annex 1. Following the more detailed designs and
assessment of practicalities given in Section 8, the likely percentages of disconnected impervious
area could be revisited. This section reconsiders the potential amounts of disconnection in the 3
subcatchments and proposes percentages that are believed to be more realistic of what could
possibly be achievable in the short to medium term.
10.1 Initial results from the modelling of disconnection scenarios Report (Annex 1) summarises the InfoWorks modelling work undertaken by the London Thames
Delivery Team so far to evaluate the potential improvements to CSO discharges associated with
various retrofit
SUDS
strategies.
The modelling work was divided into three phases. The initial phase considered ‘global’
disconnection scenarios. The second phase focussed on more practicable scenarios, in which
technically ‐feasible mechanisms for achieving specific levels of disconnection were recommended by
PWG. The second phase modelling corresponds to the disconnection scenarios outlined in Section
6.6. The third phase of disconnection scenarios (described in Section 10.2.4) were not specifically
modelled as performance was inferred from the initial phase modelling.
The report includes an overview of the modelled catchments, and the existing system’s hydraulicperformance, which are not reproduced here. For all scenarios, the system performance was
evaluated against two worst ‐case storm events (December typical year and October 2000) and a
typical year rainfall profile (Section 4.2.2).
10.1.1 Overview of global disconnection scenariosSection 2 of the ANNEX 1 report concerned ‘global’ disconnection scenarios, applied to the West
Putney, Putney Bridge and Frogmore (Buckhold Road) CSOs. The purpose of this preliminary
modelling exercise was to assess the extent to which the disconnection of surface water inputs could
impact on CSO discharges, and to get some idea of the level of disconnection required. Clearly there
would be no justification for undertaking detailed design of retrofit SUDS schemes if it was evident
that even high levels of disconnection would have no or limited impact on overall system
performance (Section 6). Given the highly‐interconnected nature of the sewer network, and the fact
that the system runs close to capacity even in dry weather, it would not be appropriate to assume
that widespread disconnection would achieve as much as might be hoped for.
The global disconnection scenarios considered were: 25% impermeable area transferred to
permeable area; 25% impermeable area removed; 50% impermeable area transferred to permeable
area; 50% impermeable area removed; and 5 mm of rainfall lost at the beginning of the storm. As an
example of performance improvements, 50% removal of impermeable area results in the following
improvements in performance for the October 2000 event (approx 1 in 4 yr return period) as shown
in Table 10.1.
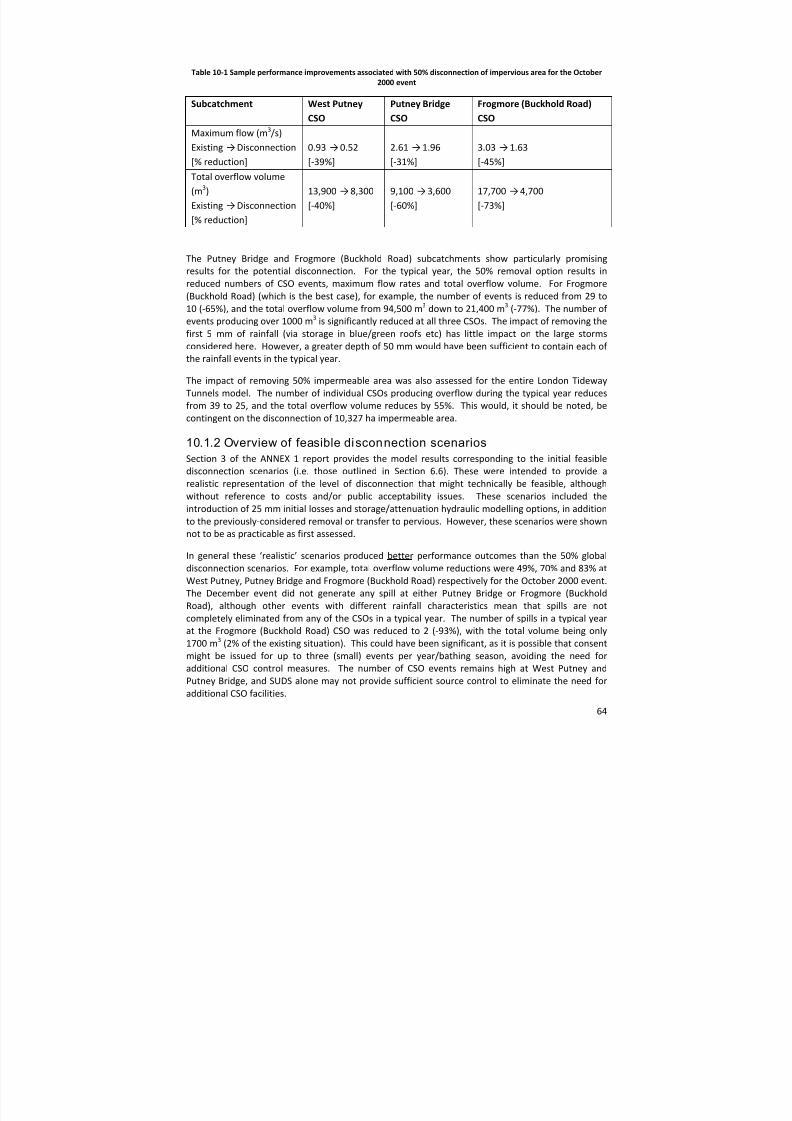
8/13/2019 Needs report: appendix E
http://slidepdf.com/reader/full/needs-report-appendix-e 75/235
64
Table 10 ‐1 Sample performance improvements associated with 50% disconnection of impervious area for the October 2000 event
Subcatchment West Putney CSO
Putney Bridge CSO
Frogmore (Buckhold Road) CSO
Maximum flow (m3/s)
Existing → Disconnection
[% reduction]
0.93 → 0.52
[‐39%]
2.61 → 1.96
[‐31%]
3.03 → 1.63
[‐45%]
Total overflow volume
(m3)
Existing → Disconnection
[% reduction]
13,900 → 8,300
[‐40%]
9,100 → 3,600
[‐60%]
17,700 → 4,700
[‐73%]
The Putney Bridge and Frogmore (Buckhold Road) subcatchments show particularly promising
results for the potential disconnection. For the typical year, the 50% removal option results in
reduced numbers of CSO events, maximum flow rates and total overflow volume. For Frogmore
(Buckhold Road) (which is the best case), for example, the number of events is reduced from 29 to
10 (‐65%), and the total overflow volume from 94,500 m3 down to 21,400 m3 (‐77%). The number of events producing over 1000 m3 is significantly reduced at all three CSOs. The impact of removing the
first 5 mm of rainfall (via storage in blue/green roofs etc) has little impact on the large storms
considered here. However, a greater depth of 50 mm would have been sufficient to contain each of the rainfall events in the typical year.
The impact of removing 50% impermeable area was also assessed for the entire London Tideway
Tunnels model. The number of individual CSOs producing overflow during the typical year reduces
from 39 to 25, and the total overflow volume reduces by 55%. This would, it should be noted, be
contingent on the disconnection of 10,327 ha impermeable area.
10.1.2 Overview of feasible di sconnection scenariosSection 3 of the ANNEX 1 report provides the model results corresponding to the initial feasible
disconnection scenarios (i.e. those outlined in Section 6.6). These were intended to provide a
realistic representation of the level of disconnection that might technically be feasible, although
without reference to costs and/or public acceptability issues. These scenarios included the
introduction of 25 mm initial losses and storage/attenuation hydraulic modelling options, in addition
to the previously ‐considered removal or transfer to pervious. However, these scenarios were shown
not to be as practicable as first assessed.
In general these ‘realistic’ scenarios produced better performance outcomes than the 50% global disconnection scenarios. For example, total overflow volume reductions were 49%, 70% and 83% at
West Putney, Putney Bridge and Frogmore (Buckhold Road) respectively for the October 2000 event.
The December event did not generate any spill at either Putney Bridge or Frogmore (Buckhold
Road), although other events with different rainfall characteristics mean that spills are not
completely eliminated from any of the CSOs in a typical year. The number of spills in a typical year
at the Frogmore (Buckhold Road) CSO was reduced to 2 (‐93%), with the total volume being only
1700 m3 (2% of the existing situation). This could have been significant, as it is possible that consent
might be issued for up to three (small) events per year/bathing season, avoiding the need for
additional CSO control measures. The number of CSO events remains high at West Putney and
Putney Bridge, and SUDS alone may not provide sufficient source control to eliminate the need for
additional CSO facilities.
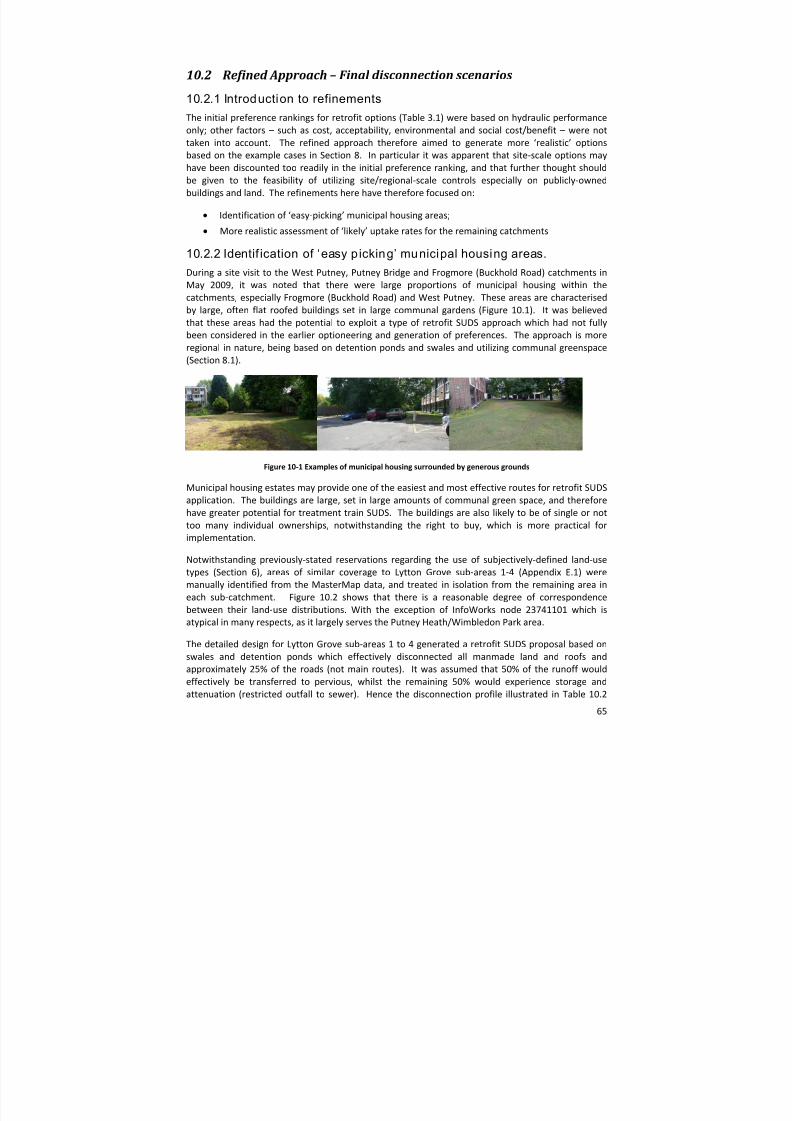
8/13/2019 Needs report: appendix E
http://slidepdf.com/reader/full/needs-report-appendix-e 76/235
65
10.2 Refined Approach – Final disconnection scenarios
10.2.1 Introduction to refinementsThe initial preference rankings for retrofit options (Table 3.1) were based on hydraulic performance
only; other factors – such as cost, acceptability, environmental and social cost/benefit – were not
taken into account. The refined approach therefore aimed to generate more ‘realistic’ options
based on the example cases in Section 8. In particular it was apparent that site ‐scale options may
have been discounted too readily in the initial preference ranking, and that further thought should
be given to the feasibility of utilizing site/regional ‐scale controls especially on publicly ‐owned
buildings and land. The refinements here have therefore focused on:
Identification of ‘easy ‐picking’ municipal housing areas;
More realistic assessment of ‘likely’ uptake rates for the remaining catchments
10.2.2 Identif ication of ‘easy p icking’ municipal housing areas.
During a
site
visit
to
the
West
Putney,
Putney
Bridge
and
Frogmore
(Buckhold
Road)
catchments
in
May 2009, it was noted that there were large proportions of municipal housing within the
catchments, especially Frogmore (Buckhold Road) and West Putney. These areas are characterised
by large, often flat roofed buildings set in large communal gardens (Figure 10.1). It was believed
that these areas had the potential to exploit a type of retrofit SUDS approach which had not fully
been considered in the earlier optioneering and generation of preferences. The approach is more
regional in nature, being based on detention ponds and swales and utilizing communal greenspace
(Section 8.1).
Figure 10 ‐1 Examples of municipal housing surrounded by generous grounds
Municipal housing estates may provide one of the easiest and most effective routes for retrofit SUDS
application. The buildings are large, set in large amounts of communal green space, and therefore
have greater potential for treatment train SUDS. The buildings are also likely to be of single or not
too many individual ownerships, notwithstanding the right to buy, which is more practical for
implementation.
Notwithstanding previously ‐stated reservations regarding the use of subjectively ‐defined land ‐use
types (Section 6), areas of similar coverage to Lytton Grove sub ‐areas 1‐4 (Appendix E.1) were
manually identified from the MasterMap data, and treated in isolation from the remaining area in
each sub ‐catchment. Figure 10.2 shows that there is a reasonable degree of correspondence
between their land ‐use distributions. With the exception of InfoWorks node 23741101 which is
atypical in many respects, as it largely serves the Putney Heath/Wimbledon Park area.
The detailed design for Lytton Grove sub ‐areas 1 to 4 generated a retrofit SUDS proposal based on
swales and detention ponds which effectively disconnected all manmade land and roofs and
approximately 25% of the roads (not main routes). It was assumed that 50% of the runoff would
effectively be transferred to pervious, whilst the remaining 50% would experience storage and
attenuation (restricted outfall to sewer). Hence the disconnection profile illustrated in Table 10.2

8/13/2019 Needs report: appendix E
http://slidepdf.com/reader/full/needs-report-appendix-e 77/235
66
was applied to the digitized ‘municipal housing’ areas within each subcatchment. The remaining
area in each sub ‐catchment was then assessed for disconnection options using a refined version of the SQL‐based area identification and preference framework outlined previously.
0.0
0.1
0.2
0.3
0.4
0.5
0.6
0.7
0.8
0.9
1.0
25740102 24749501 24743902 24736291 23749901 23741101 23732702 23731801 22749802 Lytton Grove
Other
Gardens
Natural Land
Manmade Land
Buildings
Roads Tracks and Paths
Figure 10 ‐2 Land ‐use categories within each of the Frogmore (Buckhold Road) sub ‐catchments, compared with the exemplar design case, Lytton Grove sub ‐areas 1 to 4
Table 10 ‐2 Assumed disconnection rates and InfoWorks modelling categories for 'municipal housing' areas
Land use types Percent disconnection
Disconnection strategies
1 2 3 4 5 6
Roads Tracks and Paths 26% 0% 0% 0% 0% 50% 50%
Buildings 100% 0% 0% 0% 0% 50% 50%
Manmade Land 100% 0% 0% 0% 0% 50% 50%
Natural Land 0% 0% 0% 0% 0% 50% 50%
Gardens 0% 0% 0% 0% 0% 50% 50%
Other 0% 0% 0% 0% 0% 50% 50%
Disconnection strategies 1‐6 correspond to (from Table 6.1):
1 Impervious with Initial Losses (12mm)
2 Impervious with Initial Losses (25mm)
3 Complete removal
4 Impervious area with storage/attenuation
5 Transfer to pervious
6 Initial Losses and Storage/attenuation
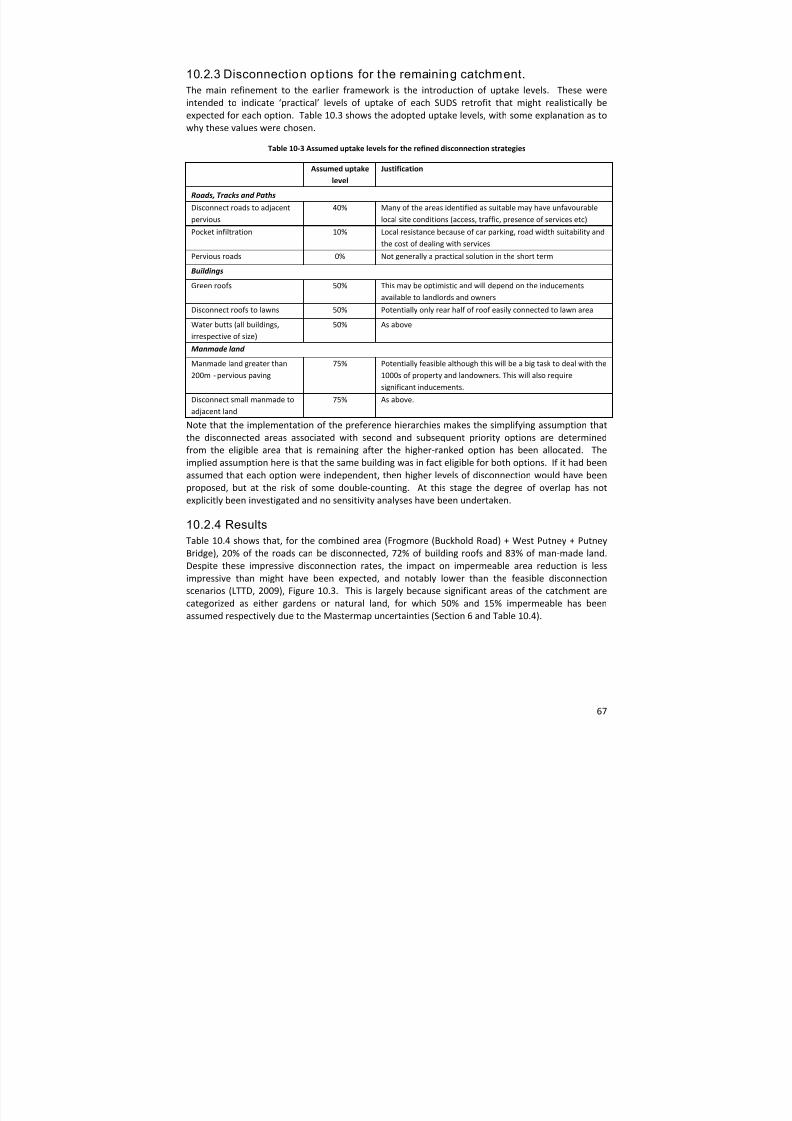
8/13/2019 Needs report: appendix E
http://slidepdf.com/reader/full/needs-report-appendix-e 78/235
67
10.2.3 Disconnection op tions for t he remaining catchment.The main refinement to the earlier framework is the introduction of uptake levels. These were
intended to indicate ‘practical’ levels of uptake of each SUDS retrofit that might realistically be
expected for each option. Table 10.3 shows the adopted uptake levels, with some explanation as to
why these values were chosen.
Table 10 ‐3 Assumed uptake levels for the refined disconnection strategies
Assumed uptake level
Justification
Roads, Tracks and Paths
Disconnect roads to adjacent
pervious
40% Many of the areas identified as suitable may have unfavourable
local site conditions (access, traffic, presence of services etc)
Pocket infiltration 10% Local resistance because of car parking, road width suitability and
the cost of dealing with services
Pervious roads 0% Not generally a practical solution in the short term
Buildings
Green roofs 50% This may be optimistic and will depend on the inducements
available to landlords and owners
Disconnect roofs to lawns 50% Potentially only rear half of roof easily connected to lawn area
Water butts (all buildings,
irrespective of size)
50% As above
Manmade land
Manmade land greater than
200m ‐ pervious paving
75% Potentially feasible although this will be a big task to deal with the
1000s of property and landowners. This will also require
significant inducements.
Disconnect small manmade to
adjacent land
75% As above.
Note that the implementation of the preference hierarchies makes the simplifying assumption that
the disconnected areas associated with second and subsequent priority options are determined
from the eligible area that is remaining after the higher ‐ranked option has been allocated. The
implied assumption here is that the same building was in fact eligible for both options. If it had been
assumed that each option were independent, then higher levels of disconnection would have been
proposed, but at the risk of some double ‐counting. At this stage the degree of overlap has not
explicitly been investigated and no sensitivity analyses have been undertaken.
10.2.4 ResultsTable 10.4 shows that, for the combined area (Frogmore (Buckhold Road) + West Putney + Putney
Bridge), 20% of the roads can be disconnected, 72% of building roofs and 83% of man ‐made land. Despite these impressive disconnection rates, the impact on impermeable area reduction is less
impressive than might have been expected, and notably lower than the feasible disconnection
scenarios (LTTD, 2009), Figure 10.3. This is largely because significant areas of the catchment are
categorized as either gardens or natural land, for which 50% and 15% impermeable has been
assumed respectively due to the Mastermap uncertainties (Section 6 and Table 10.4).
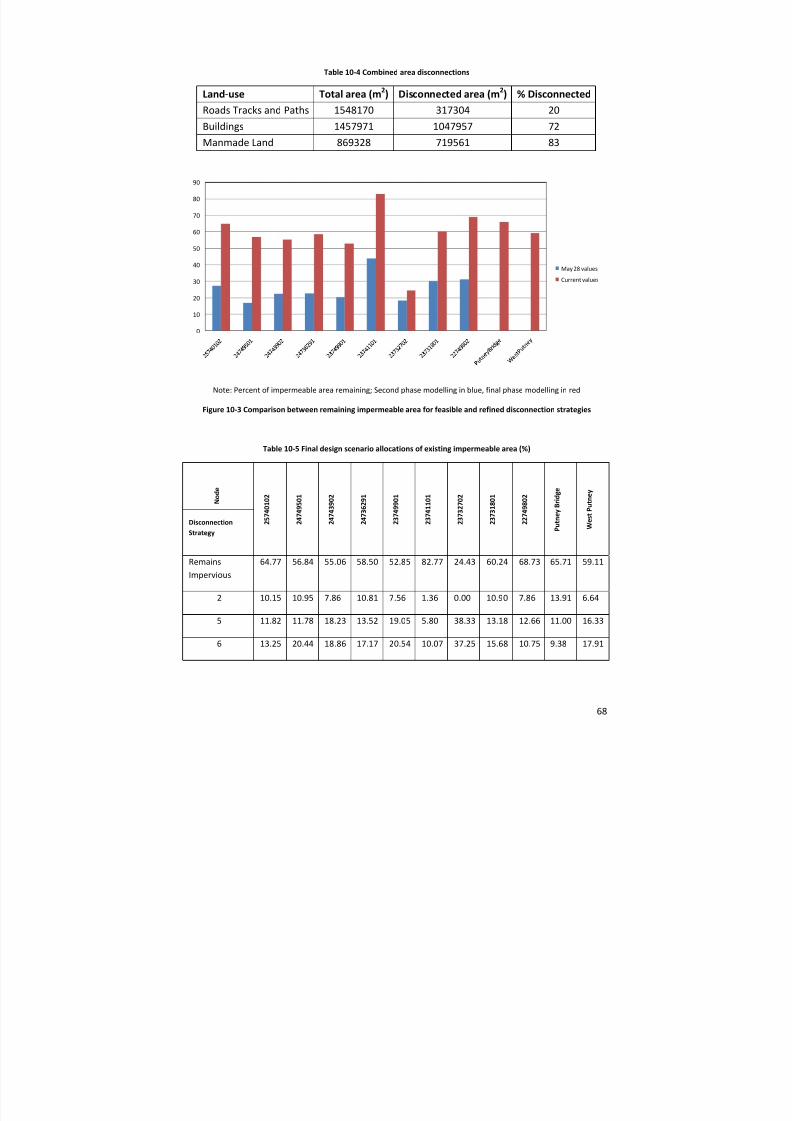
8/13/2019 Needs report: appendix E
http://slidepdf.com/reader/full/needs-report-appendix-e 79/235
68
Table 10 ‐4 Combined area disconnections
Land ‐use Total area (m 2) Disconnected area (m 2) % DisconnectedRoads Tracks and Paths 1548170 317304 20
Buildings 1457971 1047957 72
Manmade Land 869328 719561 83
0
10
20
30
40
50
60
70
80
90
May 28 values
Current values
Note: Percent of impermeable area remaining; Second phase modelling in blue, final phase modelling in red
Figure 10 ‐3 Comparison between remaining impermeable area for feasible and refined disconnection strategies
Table 10 ‐5 Final design scenario allocations of existing impermeable area (%)
N o d e
2 5 7 4 0 1 0 2
2 4 7 4 9 5 0 1
2 4 7 4 3 9 0 2
2 4 7 3 6 2 9 1
2 3 7 4 9 9 0 1
2 3 7 4 1 1 0 1
2 3 7 3 2 7 0 2
2 3 7 3 1 8 0 1
2 2 7 4 9 8 0 2
P u t n e y B r i d g e
W e s t P u t n e y
Disconnection Strategy
Remains
Impervious
64.77 56.84 55.06 58.50 52.85 82.77 24.43 60.24 68.73 65.71 59.11
2 10.15 10.95 7.86 10.81 7.56 1.36 0.00 10.90 7.86 13.91 6.64
5 11.82 11.78 18.23 13.52 19.05 5.80 38.33 13.18 12.66 11.00 16.33
6 13.25 20.44 18.86 17.17 20.54 10.07 37.25 15.68 10.75 9.38 17.91
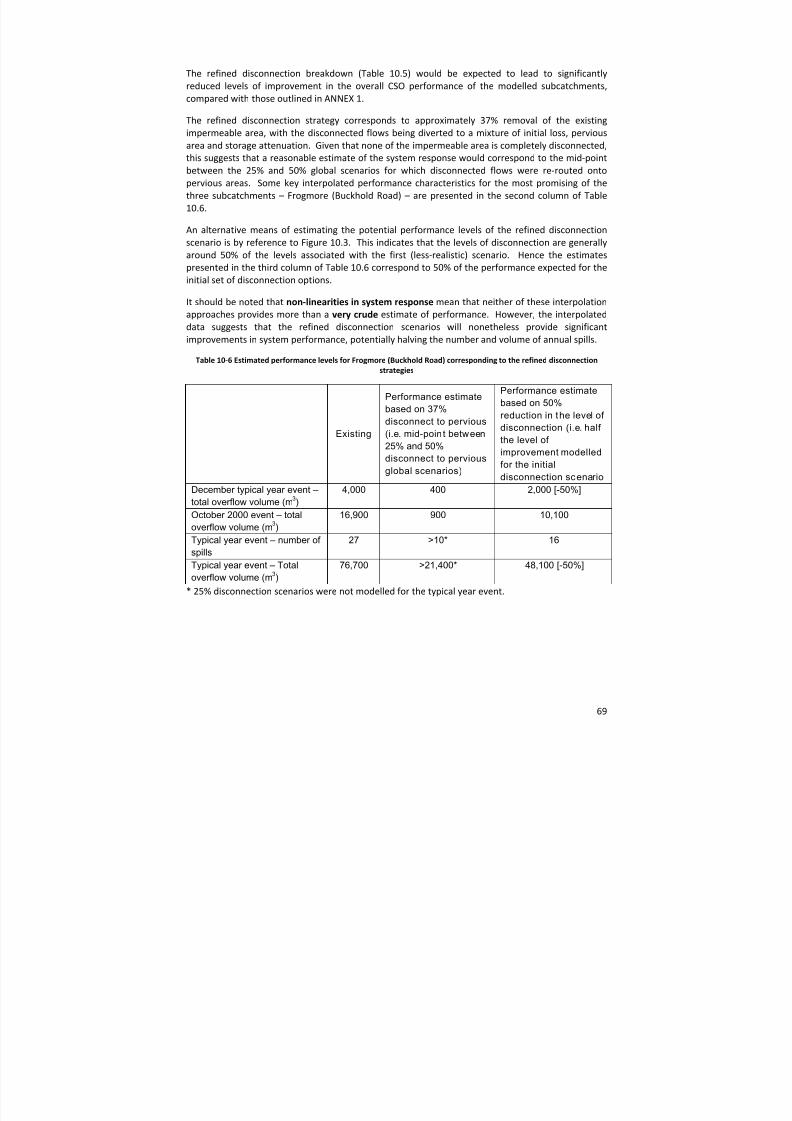
8/13/2019 Needs report: appendix E
http://slidepdf.com/reader/full/needs-report-appendix-e 80/235
69
The refined disconnection breakdown (Table 10.5) would be expected to lead to significantly
reduced levels of improvement in the overall CSO performance of the modelled subcatchments,
compared with those outlined in ANNEX 1.
The refined disconnection strategy corresponds to approximately 37% removal of the existing
impermeable area, with the disconnected flows being diverted to a mixture of initial loss, pervious
area and storage attenuation. Given that none of the impermeable area is completely disconnected,
this suggests that a reasonable estimate of the system response would correspond to the mid ‐point
between the 25% and 50% global scenarios for which disconnected flows were re ‐routed onto
pervious areas. Some key interpolated performance characteristics for the most promising of the
three subcatchments – Frogmore (Buckhold Road) – are presented in the second column of Table
10.6.
An alternative means of estimating the potential performance levels of the refined disconnection
scenario is by reference to Figure 10.3. This indicates that the levels of disconnection are generally
around 50% of the levels associated with the first (less ‐realistic) scenario. Hence the estimates
presented in the third column of Table 10.6 correspond to 50% of the performance expected for the
initial set of disconnection options.
It should be noted that non ‐linearities in system response mean that neither of these interpolation
approaches provides more than a very crude estimate of performance. However, the interpolated
data suggests that the refined disconnection scenarios will nonetheless provide significant
improvements in system performance, potentially halving the number and volume of annual spills.
Table 10 ‐6 Estimated performance levels for Frogmore (Buckhold Road) corresponding to the refined disconnection strategies
Existing
Performance estimatebased on 37%disconnect to pervious(i.e. mid-poin t between25% and 50%disconnect to perviousglobal scenarios)
Performance estimatebased on 50%
reduction in t he level ofdisconnection (i.e. halfthe level ofimprovement modelledfor the initialdisconnection sc enario
December typical year event –total overflow volume (m 3)
4,000 400 2,000 [-50%]
October 2000 event – totaloverflow volume (m 3)
16,900 900 10,100
Typical year event – number of
spills
27 >10* 16
Typical year event – Totaloverflow volume (m 3)
76,700 >21,400* 48,100 [-50%]
* 25% disconnection scenarios were not modelled for the typical year event.
8/13/2019 Needs report: appendix E
http://slidepdf.com/reader/full/needs-report-appendix-e 81/235
70
11. Summary
This report provides an overview of the potential for stormwater disconnection using SUDS with
particular emphasis on 3 subcatchments within the overall London Tideway Tunnels catchment.
The study has followed a procedure for examining the potential for retrofitting as shown in Figure
3.3. This entailed an initial assessment of the potential benefit of disconnection through retrofitting
SUDS based on global percentage reductions of 25% and 50% in impervious areas connected to the
main sewerage network. In addition, model runs were made to assess whether or not SUDS options
that worked by removing or attenuating the initial 12mm and 25mm of storm events were effective.
This was followed by specific assessments of disconnection possibilities based on a series of logical
SQL queries used in OS Mastermap to determine the selected areas of land that were suitable for
each prioritised retrofit option. At this stage, however, the practicalities of application of the various
SUDS options were not considered in detail. Nonetheless these various options for disconnection
were found to be effective at reducing many of the CSO spill event volumes and numbers of spills;
although not all CSOs benefitted.
In order to evaluate the practicalities of retrofitting SUDS as part of any future disconnection
programme a number of detailed studies were made based on site visits to the 3 subcatchment
areas and on data provided from the OS Mastermap GIS database. This resulted in a revised set of priorities as to which of the SUDS options was likely to be the most useful. This has then been
applied across the 3 test subcatchments, with the identified most likely to deliver option of detention basins, being considered separately. The result has been a significant downward revision
of the potential for disconnection of the existing impervious areas which may result in a much
poorer relative performance as regards CSO operation. This revised, but what is believed to be more
practicable, disconnection rate needs to be re ‐tested using the London Tideway Tunnels InfoWorks
model.
The unit and overall costs of the revised disconnection scenarios have been determined using a
combination of a whole life cost model originally developed jointly between UKWIR and WERF and
since updated by HR Wallingford and unit cost models for additional SUDS units not included in this
model. The overall costs estimated do not include land purchase, service and utility problems during
construction and other location specific costs. Hence the costs for retrofitting, which overall exceed
£100 million, are expected to be conservative.
There are considerable added benefits in using SUDS instead of piped/sewered drainage systems,
including improvements to water quality; amenity and ecological benefits and greater resilience to
climate change, although none of these is really relevant to TW as these benefits accrue to other
stakeholders such as property owners and communities. There are also many difficulties in
implementing these approaches. These include legal and regulatory problems in regard to transfer of ‘ownership’ of the redirected stormwater from TW to a myriad of property and land owners and
road and highway operators. Many of these stakeholders do not have the experience and hence the
capacity to take on this responsibility and would need to be assisted by TW to develop this capacity.
With the revised legislative and regulatory arrangements, any disconnected property or drained area
is expected no longer to have the automatic right to reconnect to the public sewerage system in the
future. Hence, depending on the timing of enacting this, TW may no longer run a risk that in future
an enhanced sewerage capacity is going to be needed to cope with any reconnections. However, it
appears that TW would have to undertake to accept any through or exceedance flows from any new
or retrofitted SUDS, contrary to normal practice whereby land drainage is not accepted into public
sewers.
8/13/2019 Needs report: appendix E
http://slidepdf.com/reader/full/needs-report-appendix-e 82/235
71
The legislative changes in the Flood and Water Management Act 2010, the Environmental
Regulations 2009 and the Surface Water Management Plans potentially make the utilisation of SUDS
easier and place more of the responsibility for local stormwater management on local authorities.
This could potentially make disconnection more attractive to TW and other sewerage undertakers as
the risks would no longer be as significant to themselves if local authorities were responsible for the
operation and maintenance of SUDS. Although there still would be risks that are as yet poorly quantified as TW would still be obliged to accept through and overflows from any SUDS installed.
If these systems are to be introduced in the near future it is apparent that there will be a need to
engage extensively with a wide range of stakeholders – including individual property owners,
communities, local authorities (several departments), plus the key major stakeholders Ofwat and the
Environment Agency. For successful implementation, retrofit disconnection proposals would need to
be developed in conjunction with these various actors and stakeholders, not imposed upon them.
There have been a number of limitations in the present study, the most significant of which are:
The timescale and resources available have only allowed a feasibility study to be carried out
using readily available data, models and tools; estimates of contributing areas by type and extent have been made fairly crudely using OS
Mastermap and GIS inspection;
the location and practicability of fitting retrofit options into the space available and to
appropriate line and level has only been made using digital maps and Google streetview,
following a single site visit;
the whole life cost estimates have been based on simplistic hydraulic analysis of the units
utilised and on available limited cost databases, albeit developed for the UK water industry;
no trains of units have been considered, with only single options used for the more detailed
design studies;
no attempts have been made in the detailed designs to provide for surface overflows from
the retrofitted units once the design flows (1 in 30 years) have been exceeded;
no attempts have been made to include any increases in paved surfaces within the areas
examined and there has been no attempt to include any aspects of the local development
plans;
climate change has been considered only as a simple 20% scale ‐up on rainfall intensities
used in the hydraulic design of the retrofit systems;
no future socio ‐economic scenarios have been considered in terms of changes to future
behaviour, acceptability or affordability, hence the designs cannot be considered robust in
this context;
simplified and approximate estimates have had to be made in the scaling up across the 3
catchments of the costs and applicability of the units considered in detail as examples of what could be done.
8/13/2019 Needs report: appendix E
http://slidepdf.com/reader/full/needs-report-appendix-e 83/235
72
12. Conclusions and recommendations
12.1
Conclusions
1. The range of potential retrofit options is broad and diverse. Different options exist for roofs,
roads and man ‐made land. The options differ in their hydraulic effectiveness, their costs,
and their potential to enhance water quality, to provide amenity and other benefits such as
mitigation to climate change and to prove acceptable to stakeholders. This report has
considered all of these issues – to a greater or lesser extent – when evaluating the
necessarily ‐broad range of potential options. Most external authors/case studies recognize
the need for multiple techniques and approaches to generate credible retrofit scenarios.
Indeed, many of the potential benefits associated with SUDS are maximised through the use
of treatment ‐train multiple technique ‐based approaches. In most cases it is likely that a
hybrid source control/pipe/sewer option will be the most sustainable approach. In many
other countries retrofitting non ‐piped systems to reduce CSO spills has now become the norm. This can also provide considerable multi ‐benefits via the provision of green
infrastructure which adds to the quality of urban life; for example the added ‐value monetary
benefits of such an approach being implemented now in the City of Philadelphia USA has
been estimated as some $2.8bn compared with a storage pipe solution, bringing only some
£133m in added ‐value (Wise et al, 2010). There is a need to better account for these added ‐
value benefits in alternative ways of managing surface water in England and Wales and find
ways of incentivisation.
2. Three sub ‐catchments of the whole Tideway InfoWorks model were identified for detailed
investigation: Putney Bridge; West Putney and Frogmore (Buckhold Road) CSOs. These were
selected based on discussions in the steering group and as subcatchments that may
potentially have some obvious benefits from the use of stormwater disconnection.
3. In the first phase of the assessment ‘Global’ disconnection scenarios, 50% impermeable area
removed; 50% impermeable area diverted to pervious; 25% impermeable area removed;
25% impermeable area diverted to pervious; and 5 mm initial losses were modelled in order
to get an initial idea of the potential impacts associated with impermeable area
disconnection. In this case, the ‘global’ disconnection scenarios suggested that all three
CSOs would benefit from removal of 50% impermeable area.
4. The second phase assessment focused on more ‘practical’ disconnection options, i.e. specific
mechanisms that might be utilized to achieve the required levels of impermeable area
disconnection. The project team has developed a preliminary GIS‐based framework, utilizing OS MasterMap data and SQL queries, to generate catchment ‐scale profiles of potential
retrofit SUDS options. This novel approach offers a powerful tool at the preliminary
appraisal stage. During the course of the project this has been refined to some extent, and
there is clearly potential to refine it further.
5. The initial disconnection scenarios tested in the modelling corresponded to options which
were perceived to be physically possible, but without considering cost or acceptability
issues.
6. In one case only, Frogmore (Buckhold Road CSO), the initial modelling scenario suggested
that the retrofit SUDS option might provide sufficient control that no additional CSO
8/13/2019 Needs report: appendix E
http://slidepdf.com/reader/full/needs-report-appendix-e 84/235
73
intervention would be required; in the two Putney sub ‐catchments any SUDS‐related
improvements would need to be supplemented with additional CSO control measures.
7. The final set of disconnection scenarios presented in this report attempts to include cost and
acceptability issues within the catchment ‐scale assessment framework. This profile offers
levels of disconnection that are significantly reduced when compared with the initially
assumed options. Although they have not been modelled, it is obvious that reduced levels
of CSO reduction would be predicted. Nevertheless it is likely that all three sub ‐catchments
would require additional CSO control measures to be implemented.
8. Within this specific catchment, a site visit revealed the potential advantages of focusing on
municipal housing. There were many low ‐medium rise housing blocks, often flat roofed and
set in extensive grassed grounds. Space and ownership issues would need to be resolved to
make application feasible. Specific designs and costings have been undertaken, which
suggest that this provides a relatively practical and cost ‐effective option at some £12.70 per
m2 of roof and paved surface diverted into detention basins that attenuate the flow rate.
9. Technically the disconnection of impervious areas using SUDS is feasible in the London Tideway Tunnels subcatchments studied. There would appear to be potential benefits in
terms of the performance of the subcatchment CSOs provided that significant proportions
(of the order of 50%) of the impervious areas could be disconnected.
10. The whole ‐life costs of disconnection has been evaluated and found as a minimum to be of the order of £20 ‐£59 million in each subcatchment for a design life of 50 years. In the
absence of information about the costs of implementation of the proposed sewer tunnels it
is not possible to assess whether or not this is comparably cost ‐effective. Having reviewed
the available guidance on assigning value to the benefits of using retrofits, it was concluded
that there is inadequate information to monetise the value of the options considered at this
time and
to
properly
account
for
the
wide
range
of
potential
benefits.
11. Notwithstanding the apparent potential value of retrofit stormwater disconnection, there
are considerable impediments to implementation in the short to medium term. A number of these impediments, such as arrangements for long ‐term maintenance, may be resolved in
the near future due to the passing of the Flood and Water Management Act 2010, although
how this may apply to retrofitting is as yet unclear.
12. There are considerable additional potential benefits that may arise if retrofit SUDS are used
for disconnection although these will not on the whole accrue to TW. These include water
quality improvements, which would assist with delivery of the Water Framework Directive
requirements; enhancements to green spaces in urban areas that would contribute to
ecology, add environmental benefits and help mitigate and adapt to climate change through amenity and heat island mitigation. In addition they will also provide opportunities for water
supplies in areas that become water stressed in the future.
13. Retrofitting stormwater management systems is also invariably much easier to incorporate
in regeneration of urban areas than conventional piped and sewered systems.
14. It is now inevitable with the passing of the Flood and Water Management Act 2010 that
there will be widespread use of SUDS in England as new developments are encouraged to
use them and as existing housing and property stock is renewed. Therefore over time these
systems will become ‘the norm’. The question remains, however, as to whether it is sensible
to wait for more than a century for this to come about as normal turnover of property stocks
8/13/2019 Needs report: appendix E
http://slidepdf.com/reader/full/needs-report-appendix-e 85/235
74
occurs. The construction of new sewerage is known to require considerable energy use,
emitting significant greenhouse gases and locking ‐in users for long periods and hence where
this can be avoided now there are important opportunities to contribute to the mitigation of climate change and maximise the many multi ‐benefits of using green infrastructure in urban
areas (Mayor of London, 2009).
12.2 Recommendations The following are recommendations:
15. Two phases of disconnection modelling assessment are recommended. An initial phase of ‘global’ disconnection scenario runs provides a useful preliminary indication of the expected
levels of hydraulic improvement to be expected in response to different levels of disconnection. Only if this reveals strong evidence of potential benefits should detailed
assessment based on specific design options be pursued.
16. At this stage it is not recommended that the London Tideway Tunnels model is re ‐run with
the revised disconnection scenarios modelling until there is more certainty that the options being considered are actually practical, affordable and likely to be of value.
17. In view of the crude assumptions embedded in the way that the catchment node profiles
have been generated there is a need for longer ‐term refinement of the GIS‐based design and
decision ‐support tool used in the analysis.
18. As potential quick wins have been identified for the use of detention basins in municipal
housing areas that have extensive green spaces, these could be used to undertake a trial
that would firstly redesign the systems using time series rainfall and dynamic computer
models and in parallel begin the process of stakeholder engagement to test the feasibility of implementation. Ideally a pilot should be identified and actually constructed to gain
experience of the opportunities and barriers.
19. The assumptions used in the WLC assessments should be further tested, by sensitivity
analysis and at the same time alternative retrofit options to those trialled here, should be
examined, taking into account the enhanced opportunities from a ‘stormwater management
train’ approach. The WLC model could be improved by the use of more context specific
assumptions and willingness to pay local survey data which needs to be updated and would
necessitate early and considered stakeholder engagement.
20. The limited value of the guidance so far available to monetise the benefits from non ‐
piped/sewered retrofit stormwater controls have prevented any estimate being made of this
in the present study. It is recommended that the preliminary UKWIR (2009) model be further
evaluated and if necessary, enhanced as part of the more in‐depth assessment of the costs
and benefits of retrofitting stormwater management systems in the Thames catchment.
21. As only ‘conventional’ SUDS systems have been examined in this study, alternative options
should also be considered, such as the potential for storage of stormwater runoff on streets
as is being done in Skokie in the USA, Figure 12.1. This will require computational modelling
of the potential using at least 2D modelling software. Also review of innovative gully inlet
systems that control the inflow rate. Dialogue will be required with road authorities to
assess whether or not this could be a feasible approach.

8/13/2019 Needs report: appendix E
http://slidepdf.com/reader/full/needs-report-appendix-e 86/235
75
Figure 12 ‐1 Water stored temporarily on the highway in Skokie (Carr & Walesh. 2008)
8/13/2019 Needs report: appendix E
http://slidepdf.com/reader/full/needs-report-appendix-e 87/235
76
13. References
ANNEX 1. SUDS Evaluation for Example Areas. 100 ‐RG‐MDL‐00000 ‐000002 | AF | 10 Feb 2010.
Ashley, R.M., Newman, R. and Hurley, L. (unpublished) Dŵ r Cymru Welsh Water Surface Water
Management Strategy ‐ Phase 2: Surface Water Management Strategy in Wales, recent
developments – a literature review. May, 2009. Internal report.
Ashley, R.M. and Brown, R.R. (2008) Entrapped in common sense: why water management by
current regimes is not sustainable and what we can do about it. Working Group 8: Water ‐ 9th NESS: Knowledge, learning and action for sustainability, 10th ‐12th June 2009, London
Binnie, Black and Veatch. (2002). Thames Tideway Strategy Sustainable Urban Drainage Systems
(SUDS) Study. Available from Ofwat website.
Blackmore J M., Plant R A J. (2008). Risk and resilience to enhance sustainability with application to
urban water systems. J. Water Resources Planning and Management. ASCE. Vol. 134, No. 3, May.
Brown, R., Mouritz, M. and Taylor, A. 2006. Chapter 5: Institutional capacity. T.H.F. Wong (ed.), Australia.
Runoff Quality: A Guide to Water Sensitive Urban Design, Canberra, Engineers Australia. pp. 5.1–5.22.
Brandes, O. M. & Kriwoken, L. 2006 Changing perspectives–changing paradigms: taking the “soft
path” to water sustainability in the Okanagan Basin. Can. Water Res. J. 31(2), 75–90.
Carr R W., Walesh S G. (2008). Micromanagement of Stormwater in a Combined Sewer Community
for Wet Weather Control – The Skokie Experience. Proc 11 th Int Conf on Urban Drainage. Edinburgh.
Sept.
Cascade consulting with Eftec (2009) Exploring The Cost Benefit Of Separating Direct Surface Water
Inputs From The Combined Sewerage System. UKWIR report. Draft, April. Unpublished.
Cave M. (2008). Independent review: of competition and innovation in water markets. November.
ISBN 978 ‐1‐84532 ‐524 ‐4. UK Crown copyright.
Center for Watershed Protection (2007). Urban Stormwater retrofit Practices. Version 1.0. Manual 3. August. Available from CWP wesbsite.
CIRIA (2004) Model agreements for SuDS. CIRIA, London, 2004, Report C625. Construction Industry
research and Information Association.
CIRIA (2006) Design for Exceedance. CIRIA RP699.
CIRIA (2007). The SUDS manual. CIRIA C697. ISBN 0‐86017 ‐697 ‐5.
CIRIA (2007a). Building Greener. CIRIA C644. ISBN 0‐86017 ‐644 ‐4.
CIRIA (2009). Delivering sustainable drainage – guidance for planners. RP784 March (unpublished
draft).
Defra (2008) 1 North Brent Integrated Urban Drainage Pilot Study. Final Report. June. Available from
IUD website.

8/13/2019 Needs report: appendix E
http://slidepdf.com/reader/full/needs-report-appendix-e 88/235
77
Defra (2008) 2 River Hogsmill Integrated Urban Drainage Pilot Study. Final Report – Volume 1. June.
Available from IUD website.
Defra (2009) Factsheet. Draft Flood and Water Management Bill. What it means for the water
industry. http://www.defra.gov.uk
Defra (2010) Surface Water Management Plan Technical Guidance. March.
DTI/EA (2006) The SUDS manual. Funders Report/CP/110, October. Available from CIRIA website.
EA (2007) Science Report SC060024 – A review of the cost ‐benefit of undertaking SUDS retrofit in
urban areas. Environment Agency, Bristol. ISBN: 978 ‐1‐84432 ‐888 ‐8
Engineers Australia (2006). Australian Runoff Quality: A guide to water sensitive design. Wong T H F
(Ed.) ISBN 0 85825 852 8. Engineers Australia, Canberra.
Falconer R A (2009) London Borough of Richmond upon Thames and Royal Borough of Kingston
upon Thames First Edition Surface Water Management Plan. Proc. WaPUG conference, Blackpool,
November.
France R L. (2002). Ed. Handbook of Water Sensitive Planning and Design. Lewis Publishers. CRC
Press ISBN 1‐56670 ‐562 ‐2.
Gill, E. (2008) Making Space for Water. Urban Flood Risk & Integrated Drainage (HA2). IUD Pilot
Summary Report. Defra, June. Available from IUD website.
Guillon A., Kovacs Y., Roux C., Senechal C. (2008). Rain water reusing for watering purposes: what
storage capacity is needed and what benefit for sewerage networks? Proc. 11th International
Conference on Urban Drainage, Edinburgh, Scotland, UK. ISBN 9781899796212 & 1899796215.
Hatt, B.E, Fletcher, T.D. Deletic, A (2009) Hydrologic and pollutant removal performance of biofiltration systems at the field scale. J. Hydrology (365), p310 ‐321.HM Treasury (2003) The Green
Book. Appraisal and Evaluation in Central Government. TSO, London.
Ison, R., and D. Watson. 2007. Illuminating the possibilities for social learning in the management of Scotland’s water. Ecology and Society 12(1): 21. [online] URL: http://www.ecologyandsociety.org/vol12/iss1/art21/
Jacobs (2006). Economic Review to assess whether there are economic partial solutions to problems
caused by intermittent storm discharges to the Thames Tideway – Phase 1. Final report
[incorporating TTSS November 2005 supplementary report update] Ofwat ref PROC/01/0021.
Available from Ofwat website.
Jensen M B. (2008). Stormwater management in the urban landscape. Proc 11 th Int Conf on Urban
Drainage. Edinburgh. Sept. See also: www.2BG.dk .
Kellagher R B B & Franco E M. (2005). WaND: Rainfall collection and use in developments; benefits
for yield and stormwater control. HR Wallingford report SR 677; WaND briefing note 19; WP2
briefing note 2.15. pub. HR Wallingford.
Kellagher R B B., Udale ‐Clark H. (2008). Sustainability Criteria for the Design of Stormwater Drainage
Systems for the 21st Century. Proc 11 th Int Conf on Urban Drainage. Edinburgh. Sept.

8/13/2019 Needs report: appendix E
http://slidepdf.com/reader/full/needs-report-appendix-e 89/235
78
KTN (in print). Integrated Urban Water Management ‐ Business Case. Knowledge Transfer Network/
Environmental Knowledge Transfer Network. (forthcoming)
Landcom (2009). Water Sensitive Urban Design. 4 books: Policy; Planning and Management; Case
Studies; Maintenance. http://www.landcom.com.au/whats ‐new/publications ‐reports/water ‐
sensitive ‐urban ‐design.aspx (accessed 10/07/09).
Lee, J. S., & Li, M. (2009). The impact of detention basin design on residential property value: Case
studies using GIS in the hedonic price modeling. Landscape Urban Plan, 89 (1‐2), 7‐ 19.
Marsalek, J., Q. Rochfort, and D. Savic. (2001). Urban water as a part of integrated catchment
management. Pages 37–83 in C. Maksimovic. and J. A. Tejada ‐Guilbert (eds.), Frontiers in urban
water management: Deadlock or hope. IWA Publishing, Cornwall.
Mayor of London (2009) Practical Steps: Better green and water spaces. GLA.
McEvoy D. (2006). Climate Change and Cities. Journal of Built Environment Vol 33 No 1. p5 ‐9.
Melbourne Water (2005). WSUD Engineering Procedures: Stormwater. CSIRO publishing.
Milly P C D., Betancourt J., Falkenmark M., Hirsch R M., Kundzewicz Z W., Lettenmaier D P., Stouffer
R J. (2008). Stationarity Is Dead: Whither Water Management? SCIENCE VOL 319 1 FEBRUARY [www.sciencemag.org].
Mitchell V G., Cleugh H A., Grimmond C S B., Xu J. (2008). Linking urban water balance and energy
balance models to analyse urban design options. Hydrol. Process. 22, 2891–2900 (2008). Published
online 16 November 2007 in Wiley InterScience. (www.interscience.wiley.com) DOI: 10.1002/hyp.6868.
National SUDS Working Group (2004). Interim Code of Practice for Sustainable Drainage Systems,
NSWG, http://www.ciria.co.uk/suds/icap.htm, 2004.
Natural Resources Defense Council (2006). ROOFTOPS TO RIVERS Green Strategies for Controlling
Stormwater and Combined Sewer Overflows. June. Available from NRDC website.
Page B. and Bakker K. (2005). Water governance and water users in a privatised water industry:
participation in policy making and in water service provision: a case study of England and Wales. Int.
J. Water. Vol.3, No.1. p38 ‐55.
Newman, P. (2001) Sustainable urban water systems in rich and poor cities – steps towards a new
approach. Water Science & Technology, 43, 93 ‐99.
Pahl ‐Wostl, C., J. Sendzimir, P. Jeffrey, J. Aerts, G. Berkamp, and K. Cross (2007). Managing change
toward adaptive water management through social learning. Ecology and Society 12(2): 30. [online]
URL: http://www.ecologyandsociety.org/vol12/iss2/art30/
Rouse M.J. (2007) Institutional Governance and Regulation of Water Services. IWA publishing. ISBN
1843391341.
Saal, D.S., Parker, D., Weyman ‐Jones, T. (2007) Determining the contribution of technical change,
efficiency change and scale change to productivity growth in the privatised English and Welsh water
and sewerage industry: 1985 ‐2000. Journal of Productivity Analysis. Vol 28(1 ‐2) pp 127 ‐139.

8/13/2019 Needs report: appendix E
http://slidepdf.com/reader/full/needs-report-appendix-e 90/235
79
Seattle Government (2009). Street Edge Alternatives (SEA streets) project.
http://www.seattle.gov/util/About_SPU/Drainage_&_Sewer_System/Natural_Drainage_Systems/Street_Edge_Alternatives/SPU_001805.asp [accessed 10/07/09].
Sefton, C.J. (2008). Public engagement with sustainable water managment, University of Bradford.
PhD Thesis (unpublished).
Sieker H., Helm B., Krebs P., Schlottmann P., Tränkner J. (2008). Flexibility ‐ a planning criterion for
stormwater management. Proc 11 th Int Conf on Urban Drainage. Edinburgh. Sept.
Smith, N, Allen, R, McKenzie ‐McHarg, A, Deletic, A, Fletcher, T.D, Hatt, B.E (2007). Retrofitting
Functioning Stormwater Gardens Into Existing Urban Landscapes, Cairns International Public Works
Conference, Cairns, Australia, August 2007.
Smith S., Jefferies C., Blackwood D J. (2008). Disconnection / Minimise Surface Water Entering
Public Drainage. Proc 11 th Int Conf on Urban Drainage. Edinburgh. Sept.
Smullen J.T. , Myers R D. , Reynolds S K. Maimone M. (2008). A Green Approach to Combined Sewer
Overflow Control: Source Control Implementation on a Watershed Scale. Proc 11 th Int Conf on Urban
Drainage. Edinburgh. Sept.
SNIFFER (2006) Retrofitting sustainable urban water solutions, UE3(05)UW5. Available from Scotland
and Northern Ireland Forum For Environmental Research website.
Stovin, V.S. and Swan, A.D. (2007) SuDS – cost estimates and decision ‐support tools. Proceedings of the Institution of Civil Engineers Water Management 160 December 2007 Issue WM4 Pages 207–214
doi: 10.1680/wama.2007.160.4.207
Stovin V., Swan A., Moore S. (2007) Retrofit SUDS for Urban Water Quality Enhancement. EA/BOC
Foundation May.
37pp
(unpublished)
Swan, A. D., Stovin V. R., Saul, A. J. and Walker, N. (2001) Modelling SuDS with deterministic urban
drainage models. Proceedings of the 1st National Conference on Sustainable Drainage, Coventry,
2001, 202–213.
Taylor, A.C. (2008). Leadership in Sustainable Urban Water Management: An Investigation of the
Champion Phenomenon within Australian Water Agencies. Report No. 08/01, National Urban Water
Governance Program, Monash University, August 2008, ISBN: 978 ‐0‐9804298 ‐5‐5.
Thevenot D. (2008) (Ed.). DayWater: An adaptive decision support system for urban stormwater
management. IWA publishing ISBN 1843391600.
Udale ‐Clarke H., Kellagher R B B (2008). WaND: Elvetham heath case study – Testing of Sustainability
Measures for Stormwater Drainage. HR Wallingford report SR 684, Rev. 2.0. pub. HR Wallingford.
UKWIR (2000). Rodent Control in sewers. Ashley R M., Watson N., Blackwood D J., Marr I. Report ref.
No. 00/WM/07/4. Available from UKWIR.
UKWIR (2005) Performance and Whole Life Costs of Best Management Practices and Sustainable
Urban Drainage Systems, Ref: 05/WW/03/6, ISBN: 1 94339 743 9. Available from UKWIR.
UKWIR (2006). Barriers to innovation in the UK water industry. London:
www.ukwir.org/ukwirlibrary/91297

8/13/2019 Needs report: appendix E
http://slidepdf.com/reader/full/needs-report-appendix-e 91/235
80
UKWIR (2006a) SUDS – Increased liability for the water industry – Phase 2 (06/WW/03/8) ISBN 1
8405 7 417 8. London: http://www.ukwir.org/ukwirlibrary/91153
UKWIR (2009) Exploring the Cost Benefit of Separating Direct Surface Water Inputs from the
Combined Sewerage System. Cascade consulting with Eftec. (draft) (unpublished draft)
Walker A. (2009). The Independent Review of Charging for Household Water and Sewerage Services
http://www.defra.gov.uk/environment/quality/water/industry/walkerreview/final ‐report.htm . Defra PB13336 December 2009
WATER UK and WRc (2006) Sewers for Adoption 6th edn, WRc Publications, Swindon.
Weinstein N. et al (2006). Decentralized stormwater controls for urban retrofit and combined sewer
overflow reduction. WERF. IWA publishing ISBN 1‐84339 ‐748 ‐x.
Weinstein N. et al (2009). Decentralized stormwater controls for urban retrofit and combined sewer
overflow reduction: Phase II. WERF. IWA Publishing. ISBN 978 ‐1‐84339 ‐353 ‐5
WERF/UKWIR (2005). Post ‐project Monitoring of BMPs/SuDS to Determine Performance and Whole ‐life Costs: Phase 2. WERF/UKWIR, IWA London, 2005, Report 01 ‐CTS‐21T. Available from UKWIR.
Wise S., Braden J., Ghalayini D. et al (2010) Integrating Valuation Methods to Recognize Green
Infrastructure's Multiple Benefits. Proc. Conf. Low Impact Development 2010: Redefining Water in
the City © 2010 ASCE. [http://logan.cnt.org/calculator/calculator.php]
Wong THF (2006) Introduction. In: Wong THF (ed) Australian runoff quality—a guide to water
sensitive urban design. Engineers Australia, Sydney, Australia.

8/13/2019 Needs report: appendix E
http://slidepdf.com/reader/full/needs-report-appendix-e 92/235
81
Appendix A - Types of SUDS and effectiveness at reducingstormwater inputs
The SUDS manual (CIRIA, 2007) defines SUDS as: ‘surface water drainage systems developed in line
with the ideals of sustainable development’ and it lists their attributes as:
Reducing runoff rates, thus reducing the risk of downstream flooding;
Reducing the additional runoff volumes and runoff frequencies that tend to be increased
as a result of urbanisation, and which can exacerbate flood risk and damage receiving
water quality;
Encouraging natural groundwater recharge (where appropriate) to minimise the impacts
on aquifers and river baseflows in the receiving catchment;
Reducing pollutant concentrations in stormwater, thus protecting the quality of the
receiving water body; Acting as a buffer for accidental spills by preventing direct discharge of high
concentrations of contaminants to the receiving water body;
Reducing the volume of surface water runoff discharging to combined sewer systems,
thus reducing discharges of polluted water to watercourses via CSO spills;
Contributing to the enhanced amenity and aesthetic value of developed areas; and
Providing habitats for wildlife in urban areas and opportunities for biodiversity
enhancement.
The manual states that through effective runoff control at source, the need for large flow
attenuation and control structures is minimised, and that the variety of SUDS available allows the
consideration of current and future land use and the needs of local people in design of the schemes. Examples of SUDS types available for surface water attenuation are given in Table A‐0‐1.
Table A‐0‐1 Examples of types of SUDS available for surface water attenuation
SUDS Description
Filter strips* Wide, gently sloping areas of grass or other dense vegetation that treat runoff from adjacent impermeable areas.
Swales* Broad, shallow channels covered by grass or other suitable vegetation that convey
and/or store runoff, and can infiltrate the water into the ground (if ground conditions allow).
Infiltration
basins* Depressions in the surface designed to store runoff and infiltrate water to the
ground; may also be landscaped to provide aesthetic and amenity value
Wet ponds* Basins that have a permanent pool of water for water quality treatment. They
provide temporary storage for additional storm runoff above the permanent water
level; may also provide amenity and wildlife benefits.
Extended
detention
basins*
Usually dry central basins with small permanent pools at the inlet and outlet.
Designed to detain a certain volume of runoff as well as providing water quality
treatment
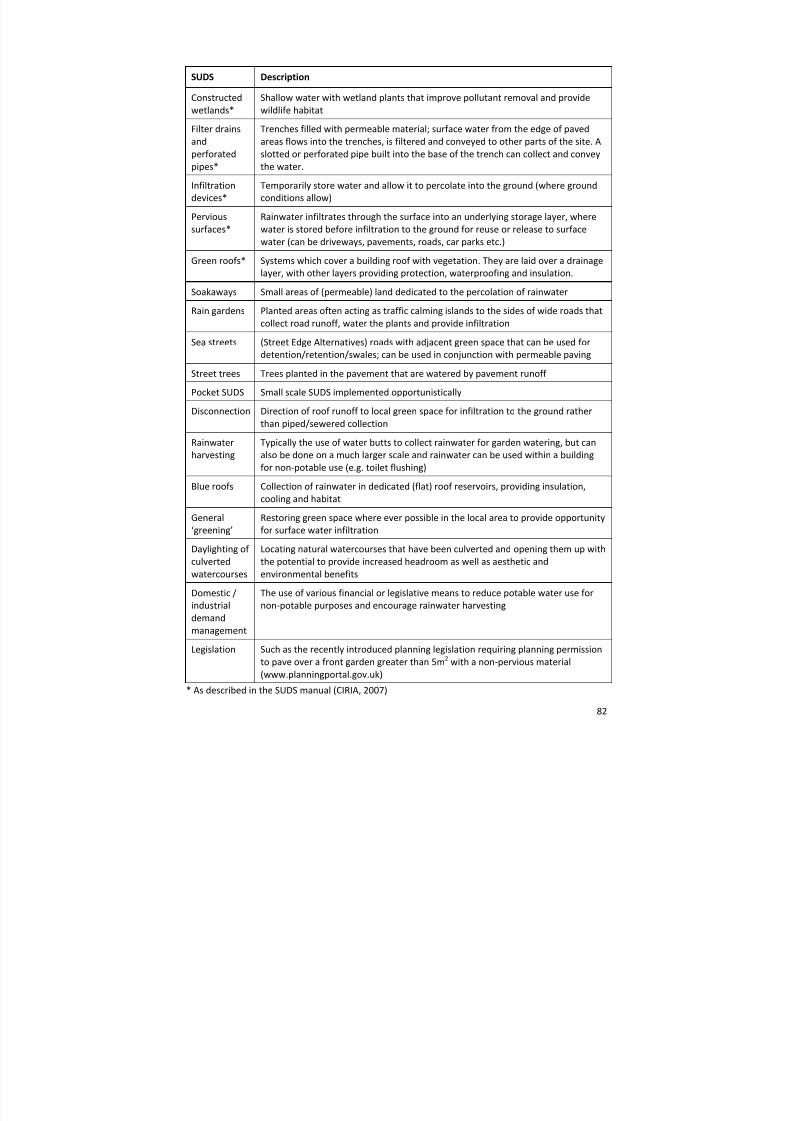
8/13/2019 Needs report: appendix E
http://slidepdf.com/reader/full/needs-report-appendix-e 93/235
82
SUDS Description
Constructed
wetlands* Shallow water with wetland plants that improve pollutant removal and provide
wildlife habitat
Filter drains
and
perforated
pipes*
Trenches filled with permeable material; surface water from the edge of paved
areas flows into the trenches, is filtered and conveyed to other parts of the site. A
slotted or perforated pipe built into the base of the trench can collect and convey
the water.
Infiltration
devices* Temporarily store water and allow it to percolate into the ground (where ground
conditions allow)
Pervious
surfaces* Rainwater infiltrates through the surface into an underlying storage layer, where
water is stored before infiltration to the ground for reuse or release to surface
water (can be driveways, pavements, roads, car parks etc.)
Green roofs* Systems which cover a building roof with vegetation. They are laid over a drainage
layer, with
other
layers
providing
protection,
waterproofing
and
insulation.
Soakaways Small areas of (permeable) land dedicated to the percolation of rainwater
Rain gardens Planted areas often acting as traffic calming islands to the sides of wide roads that
collect road runoff, water the plants and provide infiltration
Sea streets (Street Edge Alternatives) roads with adjacent green space that can be used for
detention/retention/swales; can be used in conjunction with permeable paving
Street trees Trees planted in the pavement that are watered by pavement runoff
Pocket SUDS Small scale SUDS implemented opportunistically
Disconnection
Direction of
roof
runoff
to
local
green
space
for
infiltration
to
the
ground
rather
than piped/sewered collection
Rainwater
harvesting Typically the use of water butts to collect rainwater for garden watering, but can
also be done on a much larger scale and rainwater can be used within a building
for non ‐potable use (e.g. toilet flushing)
Blue roofs Collection of rainwater in dedicated (flat) roof reservoirs, providing insulation,
cooling and habitat
General
‘greening’ Restoring green space where ever possible in the local area to provide opportunity
for surface water infiltration
Daylighting of culverted
watercourses
Locating natural watercourses that have been culverted and opening them up with
the potential to provide increased headroom as well as aesthetic and
environmental benefits
Domestic /
industrial
demand
management
The use of various financial or legislative means to reduce potable water use for
non ‐potable purposes and encourage rainwater harvesting
Legislation Such as the recently introduced planning legislation requiring planning permission
to pave over a front garden greater than 5m 2 with a non ‐pervious material
(www.planningportal.gov.uk)
* As described in the SUDS manual (CIRIA, 2007)

8/13/2019 Needs report: appendix E
http://slidepdf.com/reader/full/needs-report-appendix-e 94/235
83
The precise forms of SUDS, the terminology and the way they are defined varies internationally and
Table A‐0‐1 is not inclusive of all the types of systems classified as ‘SUDS’, ‘BMPs’, ‘LIDs’. In this study
the application of alternative systems has been considered as well as those listed in Table A‐0‐1.
The SUDS manual (CIRIA, 2007) also gives an indication of likely performance of the different types
of SUDS with respect to quality of treatment potential and hydraulic control (Table A‐0‐2).
Table A‐0‐2 Quantity performance of selected SUDS (source: SUDS manual, CIRIA, 2007, Table 5.7)
SUDS group Technique
T o t a l s u s p e n d e d
s o l i d s r e m o v a l
H e a v y m e t a l s
r e m o v a l
N u t r i e n t
( p h o s p h o r u s ,
n i t r o g e n r e m o v a l )
B a c t e r i a r e m o v a l *
C a p a c i t y t o t r e a t f i n e
s u s p e n d e d s o l i d s a n d
d i s s o l v e d p o l l u t a n t s
R u n o f f v o l u m e
r e d u c t i o n
Hydraulic control Suitability for flow
rate control (probability)
0.5 (1/2 yr)
0.1 ‐0.3
(10/30 yr)
0.01 (100 yr)
Retention
Retention
pond H M M M H L H H H
Subsurface
storage L L L L L L H H H
Wetland
Shallow
wetland H M H M H L H M L
Extended
detention
wetland H M H M H L H M L
Pond /
wetland H M H M H L H M L
wetland H M H M H L H M L
Submerged
gravel
wetland H M H M H L H M L
Wetland
channel H M H M H L H M L
Infiltration
Infiltration
trench H H M H H H H L
Infiltration
basin H H H M H H H H H
Soakaway H H H M H H H H L
Filtration
Surface
sand filter H H H M H L H M L
Sub ‐surface
sand filter H H H M H L H M L
Perimeter
sand filter H H H M H L H M L
Bioretention
/ filter strips H H H M H L H M L
Filter trench H H H M H L H H L
Detention Detention
basin M M L L L L H H H
Open
channels
Conveyance
swale H M M M H M H H H
Enhanced
dry swale H H H M H M H H H
Enhanced
wet swale H
H
M
H
H
L
H
H
H
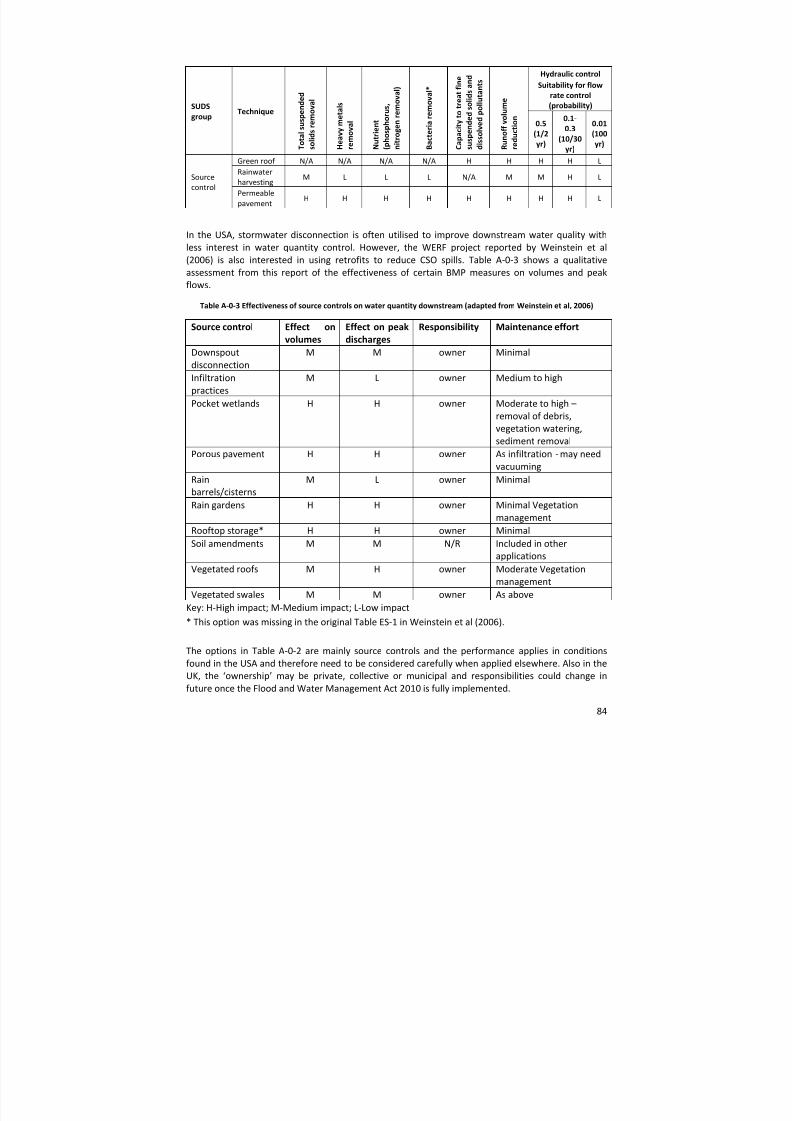
8/13/2019 Needs report: appendix E
http://slidepdf.com/reader/full/needs-report-appendix-e 95/235
84
SUDS group Technique
T o t a l s u s p e n d e d
s o l i d s r e m o v a l
H e a v y m e t a l s
r e m o v a l
N u t r i e n t
( p h o s p h o r u s ,
n i t r o g e n r e m o v a l )
B a c t e r i a r e m o v a l *
C a p a c i t y t o t r e a t f i n e
s u s p e n d e d s o l i d s a n d
d i s s o l v e d p o l l u t a n t s
R u n o f f v o l u m e
r e d u c t i o n
Hydraulic control Suitability for flow
rate control (probability)
0.5 (1/2 yr)
0.1 ‐0.3
(10/30 yr)
0.01 (100 yr)
Source
control
Green roof N/A N/A N/A N/A H H H H L
Rainwater
harvesting M L L L N/A M M H L
Permeable
pavement H H H H H H H H L
In the USA, stormwater disconnection is often utilised to improve downstream water quality with
less interest in water quantity control. However, the WERF project reported by Weinstein et al
(2006) is also interested in using retrofits to reduce CSO spills. Table A‐0‐3 shows a qualitative
assessment from
this
report
of
the
effectiveness
of
certain
BMP
measures
on
volumes
and
peak
flows.
Table A‐0‐3 Effectiveness of source controls on water quantity downstream (adapted from Weinstein et al, 2006)
Source control Effect on volumes
Effect on peak discharges
Responsibility Maintenance effort
Downspout
disconnection M M owner Minimal
Infiltration
practices M L owner Medium to high
Pocket wetlands H H owner Moderate to high –
removal of debris, vegetation watering,
sediment removal
Porous pavement H H owner As infiltration ‐ may need
vacuuming
Rain
barrels/cisterns M L owner Minimal
Rain gardens H H owner Minimal Vegetation
management
Rooftop storage* H H owner Minimal
Soil amendments M M N/R Included in other
applications Vegetated roofs M H owner Moderate Vegetation
management
Vegetated swales M M owner As above
Key: H‐High impact; M‐Medium impact; L‐Low impact
* This option was missing in the original Table ES‐1 in Weinstein et al (2006).
The options in Table A‐0‐2 are mainly source controls and the performance applies in conditions
found in the USA and therefore need to be considered carefully when applied elsewhere. Also in the
UK, the ‘ownership’ may be private, collective or municipal and responsibilities could change in
future once
the
Flood
and
Water
Management
Act
2010
is
fully
implemented.
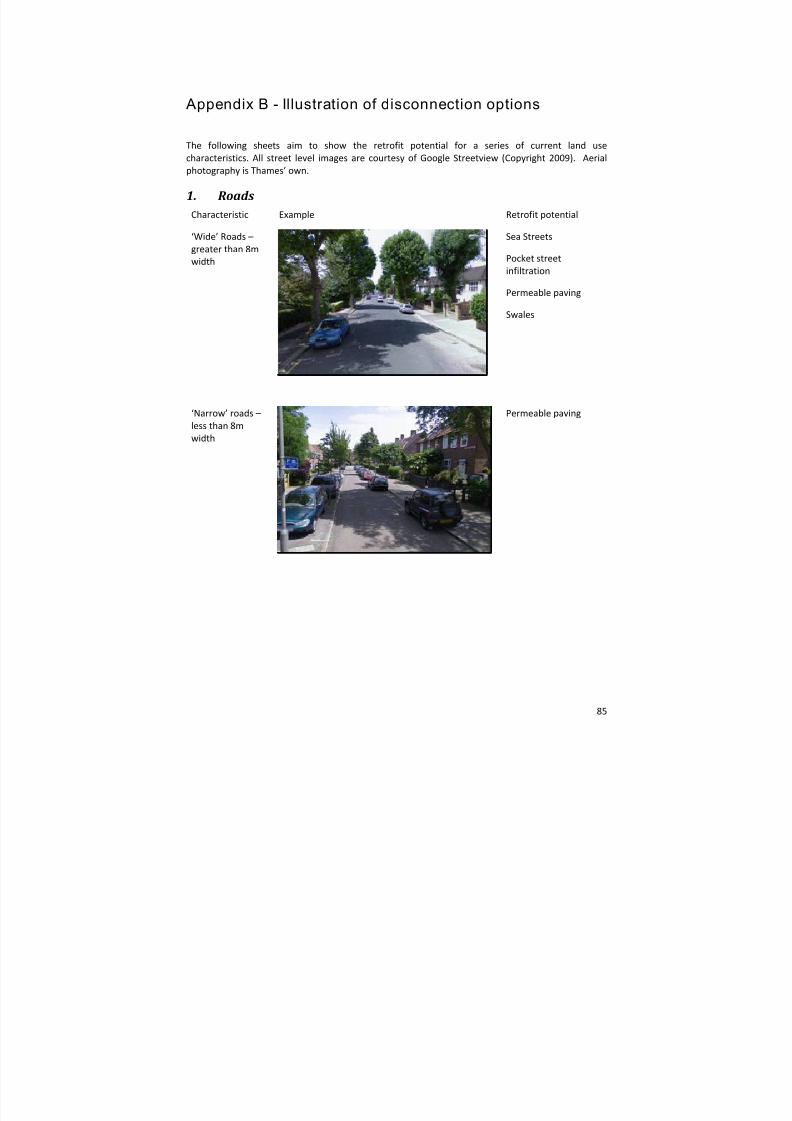
8/13/2019 Needs report: appendix E
http://slidepdf.com/reader/full/needs-report-appendix-e 96/235
85
Appendix B - Illustration of disconnection options
The following sheets aim to show the retrofit potential for a series of current land use
characteristics. All street level images are courtesy of Google Streetview (Copyright 2009). Aerial
photography is Thames’ own.
1. Roads Characteristic Example Retrofit potential
‘Wide’ Roads –
greater than 8m
width
Sea Streets
Pocket street
infiltration
Permeable paving
Swales
‘Narrow’ roads – less than 8m
width
Permeable paving
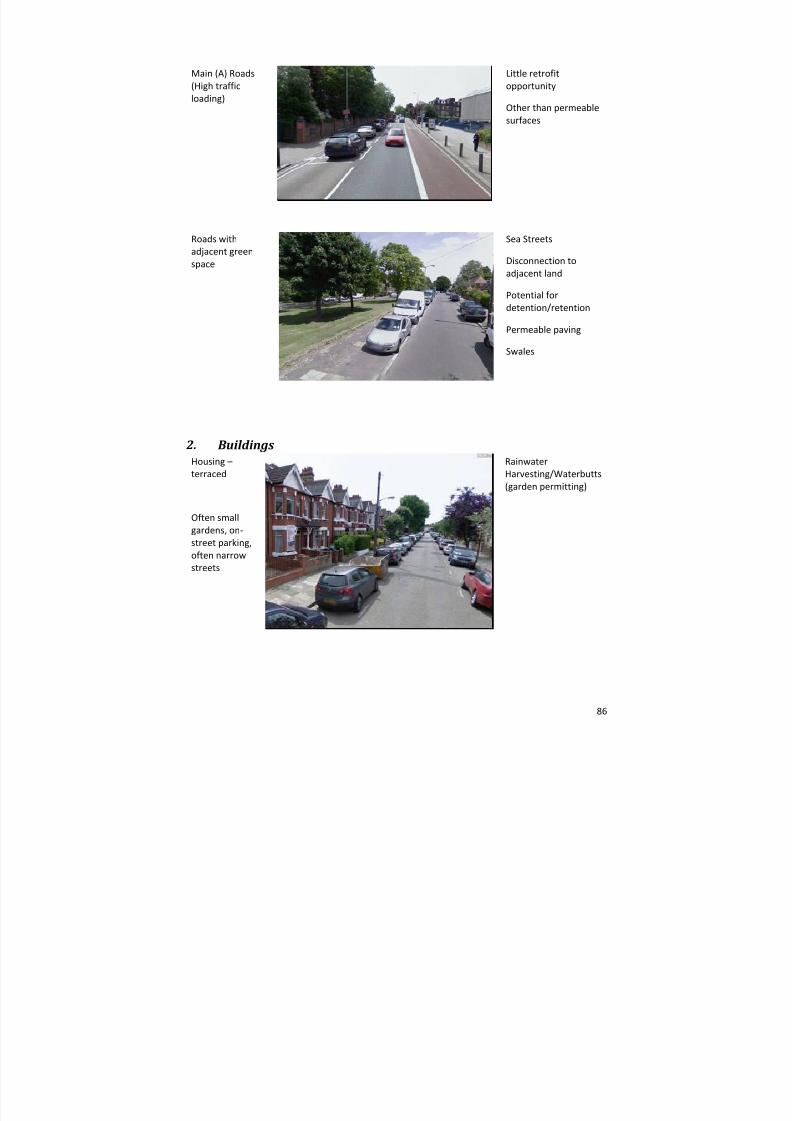
8/13/2019 Needs report: appendix E
http://slidepdf.com/reader/full/needs-report-appendix-e 97/235
86
Main (A) Roads
(High traffic
loading)
Little retrofit
opportunity
Other than permeable
surfaces
Roads with
adjacent green
space
Sea Streets
Disconnection to
adjacent land
Potential for
detention/retention
Permeable paving
Swales
2. Buildings Housing –
terraced
Often small
gardens, on ‐
street parking,
often narrow streets
Rainwater
Harvesting/Waterbutts
(garden permitting)
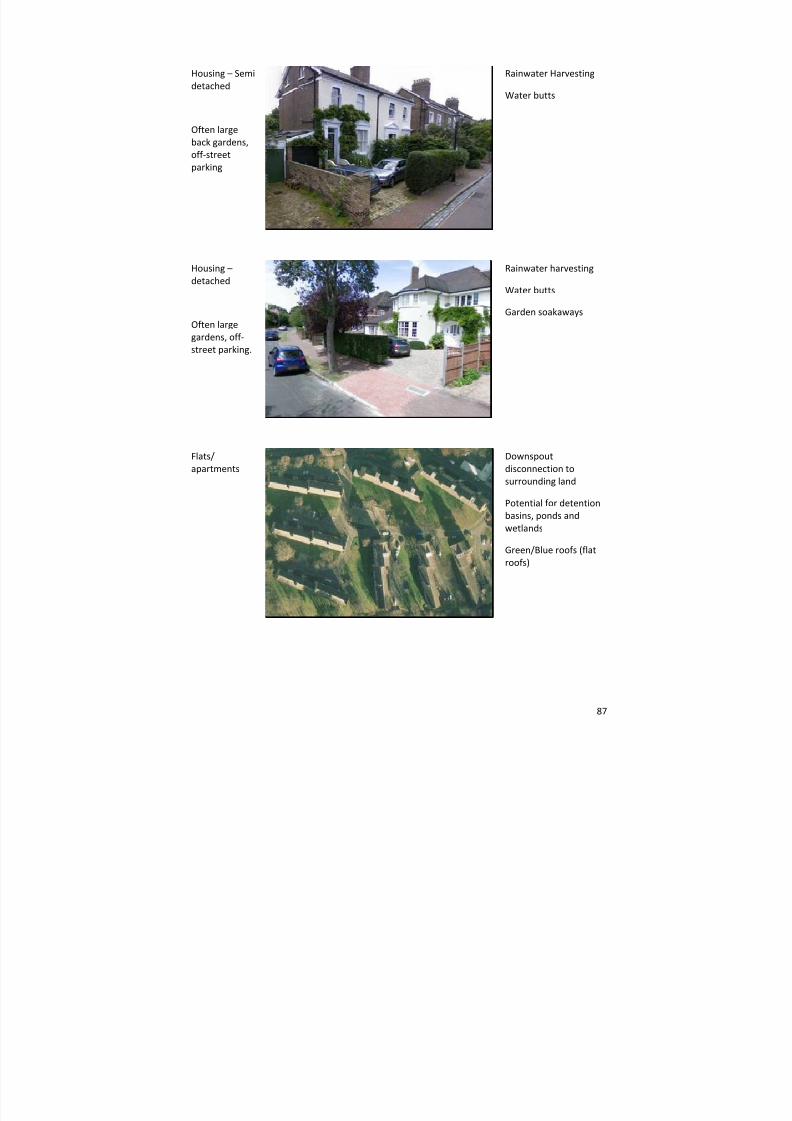
8/13/2019 Needs report: appendix E
http://slidepdf.com/reader/full/needs-report-appendix-e 98/235
87
Housing – Semi
detached
Often large
back gardens,
off ‐street
parking
Rainwater Harvesting
Water butts
Housing –
detached
Often large
gardens, off ‐street parking.
Rainwater harvesting
Water butts
Garden soakaways
Flats/
apartments Downspout
disconnection to
surrounding land
Potential for detention
basins, ponds and
wetlands
Green/Blue roofs
(flat
roofs)
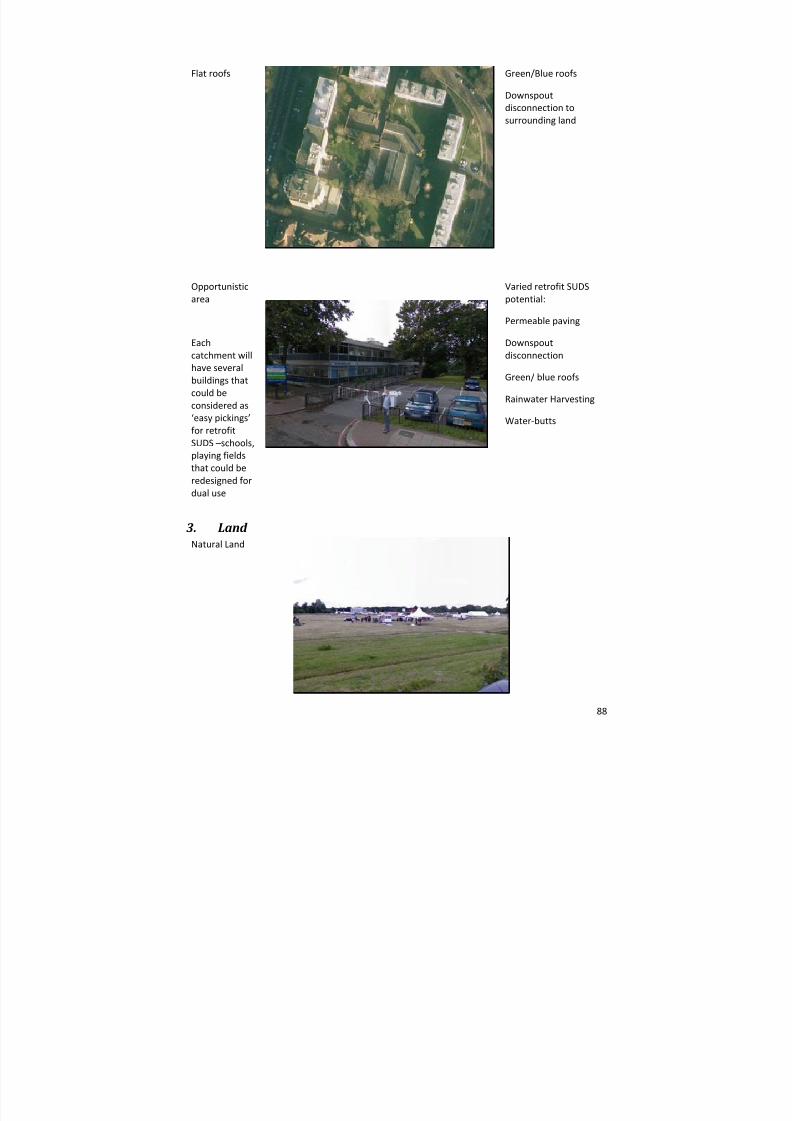
8/13/2019 Needs report: appendix E
http://slidepdf.com/reader/full/needs-report-appendix-e 99/235
88
Flat roofs Green/Blue roofs
Downspout
disconnection to
surrounding land
Opportunistic
area
Each
catchment will have several
buildings that
could be
considered as
‘easy pickings’ for retrofit
SUDS –schools,
playing fields
that could be
redesigned for
dual use
Varied retrofit SUDS
potential:
Permeable paving
Downspout
disconnection
Green/ blue roofs
Rainwater Harvesting
Water ‐butts
3. Land Natural Land
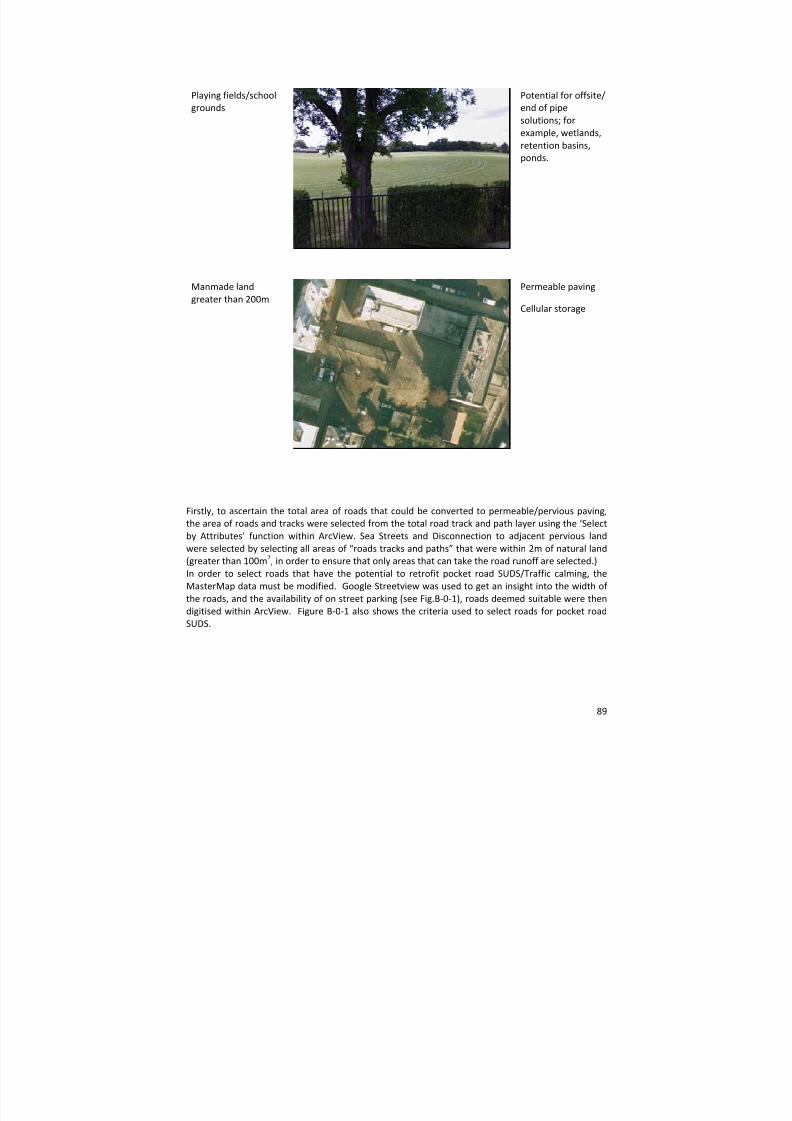
8/13/2019 Needs report: appendix E
http://slidepdf.com/reader/full/needs-report-appendix-e 100/235
89
Playing fields/school
grounds Potential for offsite/
end of pipe
solutions; for
example, wetlands,
retention basins,
ponds.
Manmade land
greater than 200m Permeable paving
Cellular storage
Firstly, to ascertain the total area of roads that could be converted to permeable/pervious paving,
the area of roads and tracks were selected from the total road track and path layer using the ‘Select
by Attributes’ function within ArcView. Sea Streets and Disconnection to adjacent pervious land
were selected by selecting all areas of “roads tracks and paths” that were within 2m of natural land
(greater than 100m 2, in order to ensure that only areas that can take the road runoff are selected.)
In order to select roads that have the potential to retrofit pocket road SUDS/Traffic calming, the
MasterMap data must be modified. Google Streetview was used to get an insight into the width of the roads, and the availability of on street parking (see Fig.B‐0‐1), roads deemed suitable were then
digitised within ArcView. Figure B‐0‐1 also shows the criteria used to select roads for pocket road
SUDS.
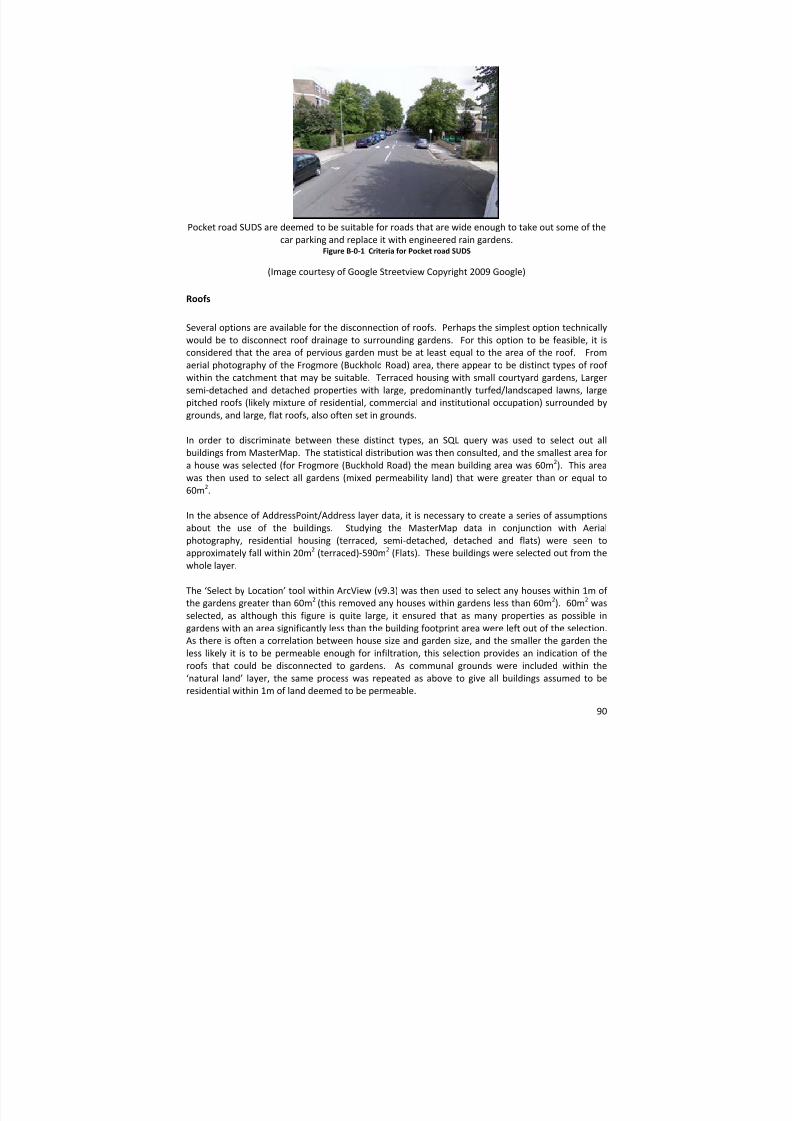
8/13/2019 Needs report: appendix E
http://slidepdf.com/reader/full/needs-report-appendix-e 101/235
90
Pocket road SUDS are deemed to be suitable for roads that are wide enough to take out some of the
car parking and replace it with engineered rain gardens. Figure B‐0‐1 Criteria for Pocket road SUDS
(Image courtesy of Google Streetview Copyright 2009 Google)
Roofs
Several options are available for the disconnection of roofs. Perhaps the simplest option technically
would be to disconnect roof drainage to surrounding gardens. For this option to be feasible, it is
considered that the area of pervious garden must be at least equal to the area of the roof. From
aerial photography of the Frogmore (Buckhold Road) area, there appear to be distinct types of roof within the catchment that may be suitable. Terraced housing with small courtyard gardens, Larger
semi ‐detached and detached properties with large, predominantly turfed/landscaped lawns, large
pitched roofs (likely mixture of residential, commercial and institutional occupation) surrounded by
grounds, and large, flat roofs, also often set in grounds.
In order to discriminate between these distinct types, an SQL query was used to select out all
buildings from MasterMap. The statistical distribution was then consulted, and the smallest area for
a house was selected (for Frogmore (Buckhold Road) the mean building area was 60m 2). This area
was then used to select all gardens (mixed permeability land) that were greater than or equal to
60m 2.
In the absence of AddressPoint/Address layer data, it is necessary to create a series of assumptions
about the use of the buildings. Studying the MasterMap data in conjunction with Aerial
photography, residential housing (terraced, semi ‐detached, detached and flats) were seen to
approximately fall within 20m2 (terraced) ‐590m
2 (Flats). These buildings were selected out from the
whole layer.
The ‘Select by Location’ tool within ArcView (v9.3) was then used to select any houses within 1m of the gardens greater than 60m 2 (this removed any houses within gardens less than 60m 2). 60m 2 was
selected, as although this figure is quite large, it ensured that as many properties as possible in
gardens with an area significantly less than the building footprint area were left out of the selection.
As there is often a correlation between house size and garden size, and the smaller the garden the
less likely it is to be permeable enough for infiltration, this selection provides an indication of the
roofs that could be disconnected to gardens. As communal grounds were included within the
‘natural land’ layer, the same process was repeated as above to give all buildings assumed to be
residential within 1m of land deemed to be permeable.
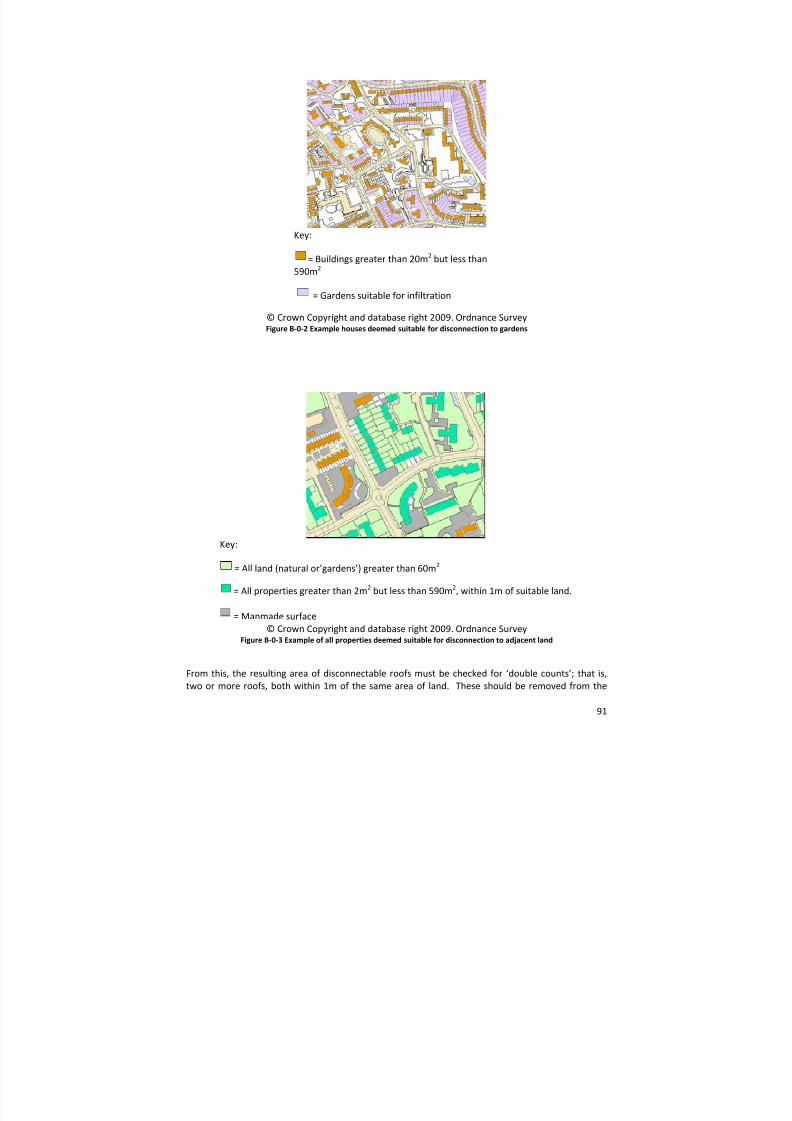
8/13/2019 Needs report: appendix E
http://slidepdf.com/reader/full/needs-report-appendix-e 102/235
91
Key:
= Buildings greater than 20m 2 but less than
590m 2
= Gardens suitable for infiltration
© Crown Copyright and database right 2009. Ordnance Survey Figure B‐0‐2 Example houses deemed suitable for disconnection to gardens
Key:
= All land (natural or’gardens’) greater than 60m 2
= All properties greater than 2m 2 but less than 590m 2, within 1m of suitable land.
= Manmade surface
© Crown Copyright and database right 2009. Ordnance Survey Figure B‐0‐3 Example of all properties deemed suitable for disconnection to adjacent land
From this, the resulting area of disconnectable roofs must be checked for ‘double counts’; that is, two or more roofs, both within 1m of the same area of land. These should be removed from the

8/13/2019 Needs report: appendix E
http://slidepdf.com/reader/full/needs-report-appendix-e 103/235
92
total area to give a more representative area. A further option for retrofitting roofs, is also the
installation of green roofs to suitably pitched roofs.
To get an estimate of the likely number of green roofs possible in the catchment requires
modification of the existing MasterMap data. Unfortunately, data on the pitch of the roof is not
available within MasterMap, therefore, by using aerial photography, buildings appearing to be flat were digitised within ArcView to create a layer of flat ‐roofed buildings. This ignores any
practicalities of application.
Land
MasterMap separates land into 3 groups; manmade (comprising; hardstanding, carparks); natural
(parks, open space, golf courses, fields) and Mixed Permeability (gardens, accounting for
homeowner’s individual landscape choices).
Natural and Mixed permeability land surfaces have been discussed in roads and roofs above. The
retrofit SUDS options for manmade surfaces are the following; replace impervious surfaces with permeable surfaces, with or without additional cellular storage. For smaller areas of hardstanding it
may be possible to disconnect the drainage to adjacent land, where appropriate.
For this study, areas of contiguous manmade surface greater than 200m 2 were selected from
MasterMap. 200m 2 was deemed the minimum area of hardstanding/carparking that would be
worth the cost and disruption of resurfacing to permeable paving.
The areas of manmade surface smaller than 200m 2, but close to adjacent natural land were
subsequently selected. These areas are deemed suitable for disconnection to adjacent pervious
land.
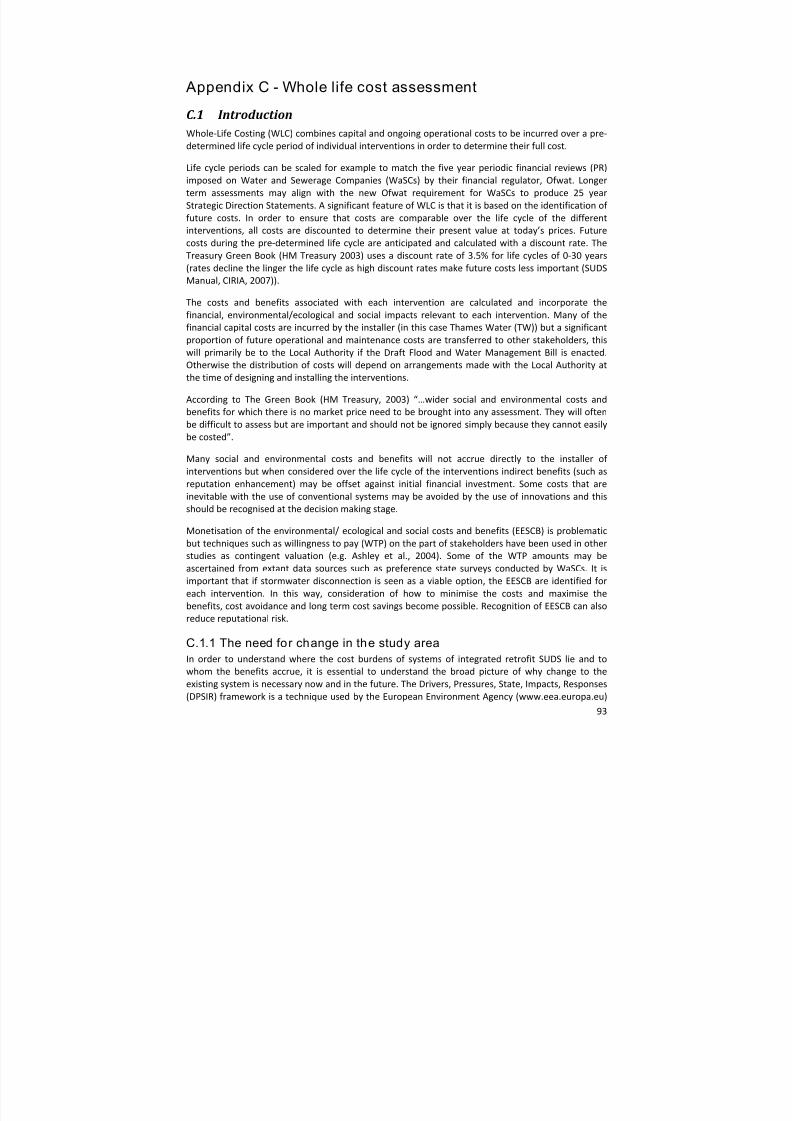
8/13/2019 Needs report: appendix E
http://slidepdf.com/reader/full/needs-report-appendix-e 104/235
93
Appendix C - Whole life cost assessment
C.1 Introduction Whole ‐Life Costing (WLC) combines capital and ongoing operational costs to be incurred over a pre ‐
determined life cycle period of individual interventions in order to determine their full cost.
Life cycle periods can be scaled for example to match the five year periodic financial reviews (PR) imposed on Water and Sewerage Companies (WaSCs) by their financial regulator, Ofwat. Longer
term assessments may align with the new Ofwat requirement for WaSCs to produce 25 year
Strategic Direction Statements. A significant feature of WLC is that it is based on the identification of future costs. In order to ensure that costs are comparable over the life cycle of the different
interventions, all costs are discounted to determine their present value at today’s prices. Future
costs during the pre ‐determined life cycle are anticipated and calculated with a discount rate. The
Treasury Green Book (HM Treasury 2003) uses a discount rate of 3.5% for life cycles of 0‐30 years
(rates decline the linger the life cycle as high discount rates make future costs less important (SUDS
Manual, CIRIA, 2007)).
The costs and benefits associated with each intervention are calculated and incorporate the
financial, environmental/ecological and social impacts relevant to each intervention. Many of the
financial capital costs are incurred by the installer (in this case Thames Water (TW)) but a significant
proportion of future operational and maintenance costs are transferred to other stakeholders, this
will primarily be to the Local Authority if the Draft Flood and Water Management Bill is enacted.
Otherwise the distribution of costs will depend on arrangements made with the Local Authority at
the time of designing and installing the interventions.
According to The Green Book (HM Treasury, 2003) “…wider social and environmental costs and
benefits for
which
there
is
no
market
price
need
to
be
brought
into
any
assessment.
They
will
often
be difficult to assess but are important and should not be ignored simply because they cannot easily
be costed”.
Many social and environmental costs and benefits will not accrue directly to the installer of interventions but when considered over the life cycle of the interventions indirect benefits (such as
reputation enhancement) may be offset against initial financial investment. Some costs that are
inevitable with the use of conventional systems may be avoided by the use of innovations and this
should be recognised at the decision making stage.
Monetisation of the environmental/ ecological and social costs and benefits (EESCB) is problematic
but techniques such as willingness to pay (WTP) on the part of stakeholders have been used in other
studies as contingent valuation (e.g. Ashley et al., 2004). Some of the WTP amounts may be ascertained from extant data sources such as preference state surveys conducted by WaSCs. It is
important that if stormwater disconnection is seen as a viable option, the EESCB are identified for
each intervention. In this way, consideration of how to minimise the costs and maximise the
benefits, cost avoidance and long term cost savings become possible. Recognition of EESCB can also
reduce reputational risk.
C.1.1 The need for change in the study areaIn order to understand where the cost burdens of systems of integrated retrofit SUDS lie and to
whom the benefits accrue, it is essential to understand the broad picture of why change to the
existing system is necessary now and in the future. The Drivers, Pressures, State, Impacts, Responses
(DPSIR) framework is a technique used by the European Environment Agency (www.eea.europa.eu)

8/13/2019 Needs report: appendix E
http://slidepdf.com/reader/full/needs-report-appendix-e 105/235
94
and enables insight into complex environmental problems. Table C‐0‐1 sets out some of the issues
related to the implementation of retrofit SUDS in Frogmore (Buckhold Road), Putney and West
Putney.
Table C‐0‐1 Drivers, Pressures, State, Impact, Responses analysis of the need to upgrade surface water drainage in Frogmore (Buckhold Road), Putney and West Putney
Drivers ‐Need to comply
with EU Directives –
specifically the
urban wastewater
treatment directive
‐Need to justify
pricing to Ofwat
‐Need to provide
high level of service
Increased
population in the
capital
Increased use of the car
Climate change
Pressures ‐ Increased surface
water pollution
‐Customers
demand more and
high quality
drinking water,
reduced leakage &
affordability
‐ Current systems
not equipped to
manage high
intensity rainfall
events or to comply
fully with
environmental
directives
‐Financial climate
reducing credit
availability.
‐High density
housing
‐Reduced green
space
‐Infill development
and building of extensions,
conservatories etc.
‐Existing sewer
system and storm
drainage not
designed for
current population
density
‐Paving over
gardens to enable
car parking
‐Increased
impermeable road
surface area
Increased levels of pollutants in
surface runoff
‐Increased number
of high intensity
rainfall events and
uncertainty
regarding future
extreme weather
events, including
periods of water
stress.
‐ Existing low
rainfall in the area.
Impacts ‐Planning for the future has become
heavily dependent on compliance with
directives and financial constraints
‐Need for balanced planning decisions
Greatly reduced stormwater infiltration
and increased surface water runoff leading to:
‐River pollution; reduced
aesthetic/amenity/environmental quality
‐Increased basement flooding (DG5
registered properties)
‐Potentially greater impacts of all the
above in the future due to further changes
in demographics and climate
Responses ‐2010 to 2015 Business Plan
‐Strategic Direction Statement for 2010 to
2035
Responses available to the Sewerage
Undertaker are limited to: containing and
redirecting surface water flows (the
conventional response); and reducing
surface water runoff at source,
attenuating its flow and reducing its
pollution burden (the SUDS response)
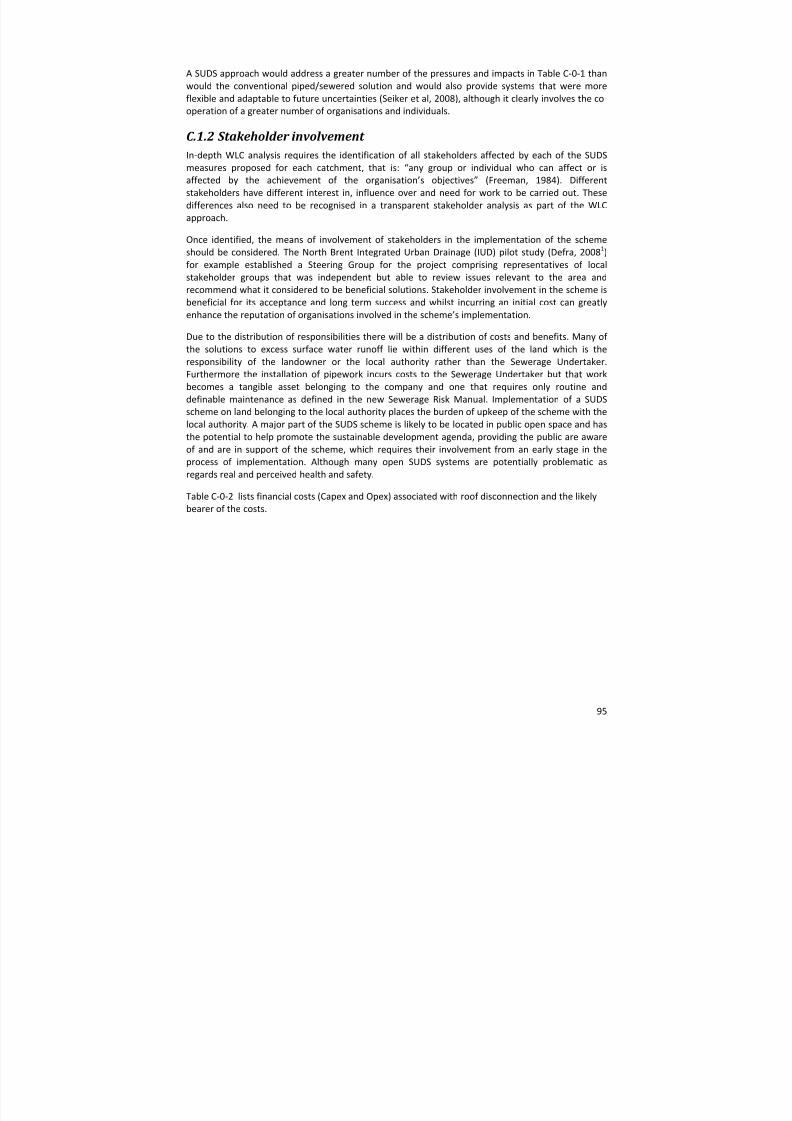
8/13/2019 Needs report: appendix E
http://slidepdf.com/reader/full/needs-report-appendix-e 106/235
95
A SUDS approach would address a greater number of the pressures and impacts in Table C‐0‐1 than
would the conventional piped/sewered solution and would also provide systems that were more
flexible and adaptable to future uncertainties (Seiker et al, 2008), although it clearly involves the co ‐
operation of a greater number of organisations and individuals.
C.1.2 Stakeholder involvement In‐depth WLC analysis requires the identification of all stakeholders affected by each of the SUDS
measures proposed for each catchment, that is: “any group or individual who can affect or is
affected by the achievement of the organisation’s objectives” (Freeman, 1984). Different
stakeholders have different interest in, influence over and need for work to be carried out. These
differences also need to be recognised in a transparent stakeholder analysis as part of the WLC
approach.
Once identified, the means of involvement of stakeholders in the implementation of the scheme
should be considered. The North Brent Integrated Urban Drainage (IUD) pilot study (Defra, 2008 1)
for example established a Steering Group for the project comprising representatives of local
stakeholder groups that was independent but able to review issues relevant to the area and recommend what it considered to be beneficial solutions. Stakeholder involvement in the scheme is
beneficial for its acceptance and long term success and whilst incurring an initial cost can greatly
enhance the reputation of organisations involved in the scheme’s implementation.
Due to the distribution of responsibilities there will be a distribution of costs and benefits. Many of the solutions to excess surface water runoff lie within different uses of the land which is the
responsibility of the landowner or the local authority rather than the Sewerage Undertaker.
Furthermore the installation of pipework incurs costs to the Sewerage Undertaker but that work
becomes a tangible asset belonging to the company and one that requires only routine and
definable maintenance as defined in the new Sewerage Risk Manual. Implementation of a SUDS
scheme on
land
belonging
to
the
local
authority
places
the
burden
of
upkeep
of
the
scheme
with
the
local authority. A major part of the SUDS scheme is likely to be located in public open space and has
the potential to help promote the sustainable development agenda, providing the public are aware
of and are in support of the scheme, which requires their involvement from an early stage in the
process of implementation. Although many open SUDS systems are potentially problematic as
regards real and perceived health and safety.
Table C‐0‐2 lists financial costs (Capex and Opex) associated with roof disconnection and the likely
bearer of the costs.

8/13/2019 Needs report: appendix E
http://slidepdf.com/reader/full/needs-report-appendix-e 107/235
96
Table C‐0‐2 Generalised financial costs and their distribution due to roof disconnection and infiltration via detention basin
Action Cost bearer Costs Study of area Thames Water ‐Data gathering
‐Land use analysis
‐Hydraulic modelling ‐Plans and permissions
‐Stakeholder identification and analysis
Involvement of stakeholders Thames Water ‐Hire of communication specialists
‐Hire of SUDS experts
‐Stakeholder consultation (e.g.
householders, conservation groups,
local authority)
‐Compliance costs (health & safety)
‐Compensation costs (disruption to
residents)
Redirection of downspout
water via pipe to detention
basin
Thames Water ‐Design of system ‐Land excavation (labour)
‐Materials: pipes, connections
‐Potential increased sewer
maintenance due to reduced flow
Creation of detention basin Thames Water ‐Land allocation
‐Land excavation (labour)
‐Soil and seeding
Maintenance of guttering and
downspouts Wandsworth Borough
Council Maintenance programme
Maintenance of connection
pipes Thames Water Maintenance programme
Maintenance of detention
basin Wandsworth Borough
Council Mowing, litter gathering, notices of danger when full
Monitoring of SUDS scheme Thames Water,
Wandsworth Borough
Council
Water quantity and quality monitoring
Ongoing communication with
stakeholders Thames Water,
Wandsworth Borough
Council,
Dedicated helpline/website
Non ‐monetary costs of this part of the scheme would be borne by the local population and
environment and may include:
Social:
Temporary disruption and noise
Perceived threats to health and safety
Change in use of public area
Environmental:
Short term habitat disturbance

8/13/2019 Needs report: appendix E
http://slidepdf.com/reader/full/needs-report-appendix-e 108/235
97
The benefits, both financial and non ‐financial of this part of the SUDS scheme are outlined below:
Table C‐0‐3: Generalised benefits and their distribution due to roof disconnection and infiltration via detention basin
Action Benefitted stakeholder
Benefits
Study of area Thames Water ‐Increased local knowledge ‐Data capture, of enormous benefit for future
schemes
‐Informed decision making
Involvement of stakeholders Thames Water ‐Enhanced reputation as an organisation
involved in the local community
‐Working in line with principles of sustainable
development
Redirection of downspout
water via pipe to detention
basin
Thames Water ‐Small amount of piped assets
‐Reduced sewer inflow thereby reducing
carbon footprint (assuming flow would be
treated if piped)
Creation of detention basin Wandsworth Borough Council
‐Involvement in SUDS scheme to help with local sustainability targets
‐Preparedness for extreme weather events
Local residents ‐Reduced basement flooding
‐Reduced overland flow of stormwater
‐Potential positive educational impact
‐Reduced river pollution
Maintenance of guttering and
downspouts Wandsworth Borough
Council Opportunity to communicate with residents
regarding SUDS scheme
Maintenance of detention basin Wandsworth Borough
Council Opportunity to communicate with public
regarding SUDS scheme
Monitoring of SUDS scheme Thames Water,
Wandsworth Borough
Council
Feedback and data collection regarding an
implemented scheme, valuable for future
schemes
Ongoing communication with
stakeholders Thames Water,
Wandsworth Borough
Council,
Reputation enhancement and channel for
feedback
All stakeholders including
local residents
‐Increased knowledge about SUDS and the
local collective response to flooding and
pollution
‐Ongoing work in line with more sustainable
development
C.2 Evaluation of Costs Costs are applied to each technology individually before the consideration of any cross ‐subsidisation
when more than one technology is adopted. An assumption is that most, but not all (see
maintenance costs) financial costs are incurred by Thames Water (TW).
Financial Costs:
Assumption: installation costs for each technology are incurred exclusively by TW including any
construction costs necessary for each intervention.

8/13/2019 Needs report: appendix E
http://slidepdf.com/reader/full/needs-report-appendix-e 109/235
98
Some of the tangible costs will be offset not only by the financial benefits associated with cost
savings as a result of surface water management but by the avoidance costs that will arise in
relation to some of the environmental and social benefits.
Capex: Direct costs include:
materials,
labour and
disconnection from existing pipes underground.
Indirect costs include:
gaining planning permission,
access/acceptance costs of any kind which may require negotiation/ consultation
(engagement) with stakeholders (eg. householders, conservation groups, local authority);
communication costs, compliance costs (health & safety);
compensation costs (disruption to residents),
inspection costs during installation;
development of a monitoring system as the technologies are installed;
setting up a customer information / help line during construction;
financing costs and
landfill costs for waste disposal if digging up concrete (rain gardens/ sea streets) where
waste materials cannot be reused/ recycled (this will include transport to landfill and costs
per ton of waste).
Many of these costs will be offset by the financial benefits identified below.
Opex: Dependent on arrangements made, the installed interventions may become the property of the local
authority. However, maintenance and monitoring costs may be borne in the short term at least by
TW, particularly if there is a desire to minimise reputational risk by ensuring that the interventions
become established and work as intended. Longer term costs to the local authorities may influence
the nature of the agreement made between the organisations and the size of any commuted sums.
Such sums must reflect the cost of expertise in different types of SUDS as well as future maintenance
costs to be borne by the local authority.
Other relevant costs: Thames Water may pay commuted sums to the local authority for the responsibility of future
maintenance of the interventions.
Thames Water may suffer a loss of assets due to disconnection from existing pipe and sewer
networks. This has implications for the asset base of the company and could affect the future
funding of TW and its ability to raise finance as well as to its future revenue generation via the five
year price review.
8/13/2019 Needs report: appendix E
http://slidepdf.com/reader/full/needs-report-appendix-e 110/235
99
Environmental/ ecological and Social Costs In most cases environmental/ecological and social costs (EESC) will be incurred by stakeholders
within (or immediately outside) the catchment area and include disruption and inconvenience
during installation as well as potential future malfunction or inundation. These costs are difficult to
monetise from the point of view of the affected stakeholders, but they are significant for TW and
should not be ignored. Whilst these costs may appear intangible, they could lead to tangible
‘damage limitation’ costs in order to minimise reputational risk.
Some EESC will impact directly on TW, for example in the form of potential fines for non ‐compliance
of pollution consents (where untreated water enters the Thames from surface water runoff due to
the disconnections undertaken).
Other environmental factors to consider are noise pollution during installation, including the traffic
impacts on both noise and carbon footprint in the area; the potential impact on flora and
fauna/habitat given certain technologies involve change to existing green areas (though over the
longer term positive impacts could outweigh initial negative impacts on habitats).
During installation, disruption that could lead to negative perceptions of changes to the area
particularly when residents do not perceive there to be problems with surface water management
or fail to appreciate the benefit and significance of the interventions.
Health and safety impacts could include midges or mosquitoes around standing water and the risk of drowning in ponds and swales for example. To minimise the actual safety risk and at the same time
to reduce stakeholder perceptions of such risks, TW could incur fencing costs around ponds at the
time of installation and any other costs to comply with health and safety regulations in agreement
with the LA.
The reduction in certain types of recreational green areas or the perceived change of use may lead
to resistance from residents and lead to reputational damage.
Complaints to TW that arise in relation to the negative perceptions of residents has financial
implications if ‘customers’ express these in the form or written complaints. To avoid the negative
reactions by stakeholders, communication/ engagement and awareness campaigns should be
undertaken, the costs of which should be considered as part of the interventions. Consultation with
the Consumer Council for Water (CCW) should also be accounted for. The Draft Flood and Water
Management Bill has for example already given this body cause for complaint by proposing that
council tax payers cover the costs of transfer of asset ownership and responsibility from WaSCs to
local authorities. Thames Water has conducted ‘willingness to pay’ surveys which can provide some
data for analyses of EESC and is likely to have a database of costs for awareness campaigns etc.
C.3 Evaluation of benefits There are benefits to TW, in the form of cost savings once the installation is complete and more
intangible ones in the form of enhancing reputation if stakeholder perceptions are managed
effectively and the benefits of the interventions are communicated and experienced by the
stakeholders.
There are also environmental/ ecological and social benefits (EESB) which will accrue more to the
stakeholders in the catchment and may counterbalance any negative perceptions on their part. This
could lead to a reduction in the engagement and negotiation costs identified above.

8/13/2019 Needs report: appendix E
http://slidepdf.com/reader/full/needs-report-appendix-e 111/235
100
Identification and promotion of the financial benefits to stakeholders will minimise the potential for
resistance from the residents, the LA and to groups such as the CCW.
Financial benefits to TW: The potential asset management benefits as a result of the reduction in surface water runoff to TW
are contained in the UKWIR (2009) report.
A significant financial benefit will be achieved if attenuated flows to the Thames are reduced such
that fewer connections to the Thames Tideway Tunnel (TTT) will be required.
There will be a reduction in sewer flooding risk (internal and external) which will reduce repair and
clean ‐up costs.
Attenuating flows into the Thames will also lead to environmental river quality improvements
resulting in cost savings for TW which is currently under criticism for the condition of parts of the
river and has incurred prosecution costs in the form of legal fees and fines.
There will be benefits in increased headroom and a reduction in CSOs which will reduce the risk of flooding and untreated water overflows into the Thames, leading to further costs savings as a result
of the suspension of prosecution if pollution to the Thames is reduced.
The interventions will lead to WaSC efficiency savings in the form of reduced energy (therefore
carbon) and chemical costs in treatment works.
The interventions have the qualities of flexibility and adaptability. By their nature, the retrofit
interventions offer ‘no regret’ solutions which are easy to reverse and which will not involve
significant costs in the future. Long‐term resilience will reduce costs of opex in short, medium ‐ and
long ‐term.
The environmental/ecological and social benefits (EESB) identified below may lead to cost savings to
TW in the amount of engagement activity and initiatives it will need to undertake.
The interventions also reduce the risk of drought orders and hosepipe bans which has financial
consequences for TW when scrutinised by Ofwat e.g. for leakage rates.
There will also be cost savings by not incurring DG5s.
Financial benefits to residents: The long ‐term cost savings generated to TW by the interventions and cost efficiencies through the
positive impact downstream could result in lower water prices.
The impact of lower prices for water would be offset, potentially, by increased council tax charges
from the LA when the future maintenance of assets such as ponds and swales become its
responsibility. However, there should still be a net financial benefit to property owners as a result of enhanced property values resulting from improvements in amenity value of the area. For residents
who have experienced problems with surface water runoff, there will be a reduction in basement
flooding incidents resulting in savings in clean ‐up costs and insurance charges. The reduction in
flooding incidents will further enhance property values.
Environmental/ecological benefits: As well as the financial efficiency savings there will be reductions in chemical usage (conserving
resources) and TW’s carbon footprint.
8/13/2019 Needs report: appendix E
http://slidepdf.com/reader/full/needs-report-appendix-e 112/235
101
A number of the interventions, particularly the ponds and swales, will have a positive impact on flora
and fauna in the long ‐term and have the potential to enhance the amenity value of the area.
The reduction in CSOs means there will be a reduced negative impact on river water quality
downstream.
Savings in water usage through rainwater harvesting can reduce the risk of hose pipe bans and avoid
the potential negative impact on TW’s reputation and written complaints which are recorded in June
returns to Ofwat. Conservation of water also increases groundwater replenishment which has
implications for water availability in the longer term and will lead to cost savings in water
abstraction.
In addition, the nature of certain interventions will lead to traffic calming which will reduce carbon
emissions in the area.
Social: The reduced risk of basement flooding in some properties (see above) reduces health and safety
risks to residents. Health and safety is further enhanced by a reduction in the potential for accidents
as a result of reduced ponding on roads.
The increased amenity value of the area is a social benefit as it impacts on the health and well being
of the community. The nature of the interventions will enhance community and social cohesion
(around ponds for example) and lead to enhanced stakeholder relationships.
A focus on the environmental/ecological attributes of the interventions has educational benefits as
they could become the focus of school projects on ecology, water cycle, drought and flood risk
management as well as an area of interest for a variety of other local groups and societies.
The EESB to the area is likely to be perceived favourably as it will enable the LA to demonstrate it is
meeting Agenda 21 commitments. At the same time, such benefits will also enhance the reputation
of TW.
A more direct social benefit as a result of installing and maintaining the interventions is the
development of transferable skills in the area, particularly in relation to future maintenance which
has the potential to create long ‐term business and employment opportunities.
The distribution of many of the costs and benefits will depend on the means by which the SUDS
schemes are implemented and agreements made between the Sewerage Undertaker and the local
authority. There is great opportunity for enhanced communication and co ‐operation between
organisations and the local community in line with the principles of sustainable development. The
benefits of this are not made clear by calculations of financial costs alone. The organisations responsible have choices regarding cost and benefit distribution over the short and long term and
these choices must be weighed against reputational risk.
C.4 Data sources for HR Wallingford’s WLC spreadsheets Site specific data are used which include: agreed design criteria, pre ‐calculated system dimensions,
agreed system characteristics, known unit costs and agreed operation and maintenance frequencies.
(A generic application is also possible for which minimal information is required from the model user
and crude estimates of generic system types are made and entered in the model including default

8/13/2019 Needs report: appendix E
http://slidepdf.com/reader/full/needs-report-appendix-e 113/235
102
entries for: dimensioning, system characteristics, ‘best practice’ design, construction and
maintenance activities, and unit costs that reflect average values of the costs collated in Phase 1 of the project and presented in the cost database.)
The costing model allows costs for different SUDS components to be built as it highlights all the
important materials and processes and allows the user to incorporate costs where and when
required. Site specific costs and characteristics should be entered wherever possible. As a minimum,
the assumptions and costs components should be reviewed for appropriateness prior to the generic
model application. Cells that are essential for user entry to achieve a model result are:
‐ Essential user entry (no model default value available)
‐ User entry (data in these cells will over ‐ride model default values)
‐ Selected option (data to be taken forward in the calculations (i.e. either user or model
default value)
Default values are given where user (specific) values are unavailable and these have been used in
the spreadsheets.
Separate models are available for components:
Retention pond
Detention basin (can be adapted to represent an infiltration basin model)
Swale (can be used to form an appropriate bioretention model)
Filter/drainage
Permeable pavement
The spreadsheet for each model consists of 11 sheets included in the WLC model user guide
(WERF/UKWIR, 2005)
with
an
additional
sheet
(8)
for
Waste
Management
Options
included
which
is
not referred to in the WLC user guide (Table C‐0‐4).
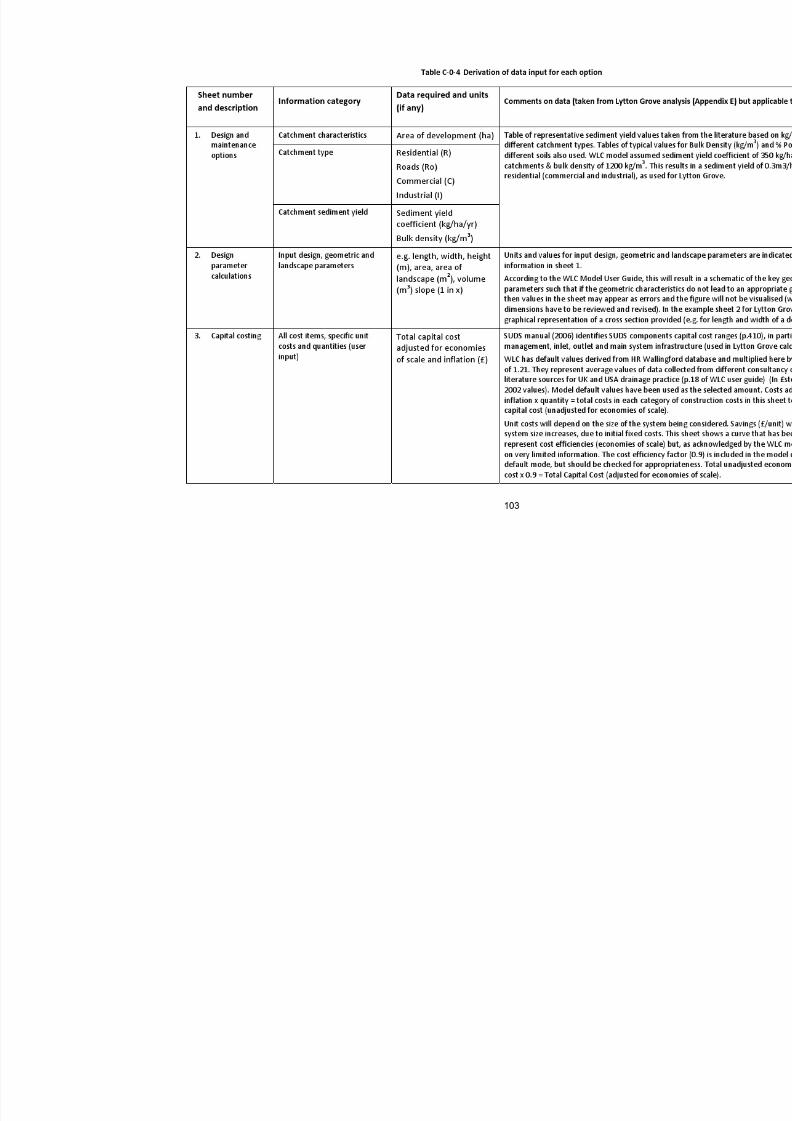
8/13/2019 Needs report: appendix E
http://slidepdf.com/reader/full/needs-report-appendix-e 114/235

8/13/2019 Needs report: appendix E
http://slidepdf.com/reader/full/needs-report-appendix-e 115/235
Sheet number and description Information category Data required and units
(if any) Comments on data (taken from Lytton Grove anal
4. Associated
capital costs Planning and design costs,
construction, overheads ,
(plus initial site investigation costs if significant)
30% of total construction
costs (£)
The SUDS manual (p.411) suggests that design, cona percentage of total construction costs and that 3
suggested that if initial site investigation costs areModel default values are 15% of total capital costsand design and construction (so 30% in total as pe
For the detention basin component on which this
relevant/identified though they might be relevant
land costs Land costs will vary between sites. Whilst in some
the site has dual use or where the scheme forms psettings the land value may outweigh the constructtype of drainage option. Inclusion of the cost of lanstakeholders involved and the purpose of the asse
risk management costs Risk management costs (p. 23 of WLC model user
liability for risks associated with the drainage syste
costs indirectly associated with implementation ofdownstream sewerage infrastructure to accommodinfrastructure.

8/13/2019 Needs report: appendix E
http://slidepdf.com/reader/full/needs-report-appendix-e 116/235

8/13/2019 Needs report: appendix E
http://slidepdf.com/reader/full/needs-report-appendix-e 117/235

8/13/2019 Needs report: appendix E
http://slidepdf.com/reader/full/needs-report-appendix-e 118/235
Sheet number and description Information category Data required and units
(if any) Comments on data (taken from Lytton Grove anal
8. Additional Waste
management
options
Waste accumulation and
removal frequency Excavation
Hazardous waste
treatment
Pre ‐treatment to
non ‐hazardous waste
Non ‐hazardous waste
management under
exemption
Non ‐hazardous waste
management
Supersedes material in sheet 7 (which is the origin
9. Cost and benefit
summary sheet Full summary of costs and
benefits entered in the model Allows the user to flag which of the costs/ benefits9. This facilitates any sensitivity analyses or scenar
As indicated
above,
in
this
component
(which
is
cothis model) though environmental benefits are ide
determines the present values of annual costs incui.e. the present value of total costs.
10. Whole Life Costs Time series of costs likely to be
required for the system and
Net Present Value (NPV) of these costs
Identifies annual costs incurred in every category (over a 50 year period to determine the cumulative
11. NPV Charting the NPV of cost with
time plus cumulative cost curve
12. Hydraulic
calculation tables
(UK only)
A very simple hydraulic appraisal routine that allowRequired as part of the calculation tool for this pro
8/13/2019 Needs report: appendix E
http://slidepdf.com/reader/full/needs-report-appendix-e 119/235
108
C.5 Summary of differences between the two WLC models used The following is a list of the major differences between the UKWIR (2009) approach to WLC, devised
by Cascade consulting (C) and HR Wallingford’s model (HRW)
C refers to environmental and social benefits, HRW to only environmental benefits. C indicates that it produces a CBA for all stakeholders; HRW is from the perspective of the
owner/operator. This difference explains some of the other variations between the two.
C uses a literature review to identify more case specific values to overwrite default values in
spreadsheet tool, HRW has more databases from actual case studies to do this, so arguably,
could be more robust.
C recommends a partnership approach to scheme developments, as many intervention
measures may be better applied either through partnership with others (e.g. local
authorities) or through an integrated framework.
C explores adverse environmental and social impacts. The HRW spreadsheet model only
refers to benefits in the context of improvements (in amenity and ecological values + hydraulic and water quality). As a result in the pilot studies conducted it has been possible to
incorporate environmental and social costs to arrive at NPV of total costs.
C includes broader consideration of sustainability, in that it explores the change in carbon
emissions – stated in terms of CO2 and included in monetised impacts (though there may not
be a difference, given the nature of the disconnection components used by HRW). HRW has
a restricted view of environmental benefits.
C refers to financial benefits and generally all benefits are more easily identifiable being
based on: reduction on sewer flooding risk, water quality benefits (direct economic, public
health, recreational, aquatic ecology), other environmental benefits, operational cost
savings, carbon footprint reduction.
C also refers to financial costs avoided. HRW recognises only actual costs incurred by the
owner/operator. In the Cascade approach this would be because it considers all stakeholders. As a result, C acknowledges that there may be a wide range of non ‐
monetisable benefits of interest to WaSCs and to stakeholders.
C also considers adverse monetisable environment and social impacts avoided.
C suggests that its approach is based on both conventional upgrades to the sewerage
network and disconnections. HRW is based on new build solutions..
HRW is based on new build solutions. C maintains that its pilot studies are based on both
retrofit and those for new developments. C’s report then acknowledges that no suitable site
for retrofit could be found so it undertook two pilot studies based on new developments
because the two had site differences. C then went on to conduct a third study based on a
theoretical pilot site – which was again focused on a ‘new developments’.
C constructs the spreadsheet model to separate and identify the disconnection measures
into ‘realignment of surface water connection’ and ‘run ‐off attenuation measures’. HRW
covers this separation in its design and maintenance options as additional pipework costs
but no realignment costs are included.
C purports that its decision support tool (DST) allows an integrated set of interventions to be
evaluated in one spreadsheet. This allows a range of interventions to be identified on a
spreadsheet. HRW requires a spreadsheet model for each component (intervention).
C provides a template of what can be included to derive a total costs which can then be
discounted over 25 years. However, the data used is not robust (which is acknowledged). It

8/13/2019 Needs report: appendix E
http://slidepdf.com/reader/full/needs-report-appendix-e 120/235
109
also does not convincingly include costs incurred beyond initial construction and it is
therefore less convincing as a WLC approach.
C 5.1 Similarities between the two modelling approaches1. Both undertake a CBA.
2. Both use reported methodologies, datasets, guidance and default values for derivation of the construction and operating costs.
3. C considers monetisable benefits of improvement drivers. HRW does the same where
possible within environmental benefits included within the four categories of amenity,
ecology, hydraulic and water quality. Both exclude non ‐monetisable benefits/ impacts from
the CBA.
4. Both identify non ‐monetisable benefits to allow them to be considered in decision making
even if not included in the CBA. The user is left to decide how relevant these factors are to
their decisions.
5. Neither provides guidance on the selection of intervention measures appropriate to a
particular study area. They provide the CBA methodology and allow either experienced engineers (C) or operators to select among alternatives.
6. Neither addresses issues of ownership and adoption.
7. Both explore financial construction and operating costs.
8. Both have a form of advanced user input to allow overwriting of default values – including
the addition of new measures and changing parameters (e.g. the assessment period and
discount rate) or when more specific data becomes available (rather than default mode).
C 5.2 SummaryThe Cascade approach goes further than HRW in relation to an integrated approach to WLC with
a much broader range of environmental and social impacts (benefits and costs avoided), but it is not obvious from the report that this has actually been delivered. The HRW model was
developed as a costing tool, to try to build up generic costs for individual systems. The
quantification of benefits was not an aim of the original model. The Cascade report does deliver
DST guidance and a data capture proforma which is acknowledged as only tested with small ‐
scale intervention measures and readily identified benefits (see p.17) – and these are not
interventions based on retrofit but for new development sites.
The UKWIR (2009) Cascade report also acknowledges the limitations of being reliant on default
unit values used in the intervention measures and for willingness to pay study values in the
simple benefits tool.
Overall the Cascade approach provides a decision tool that has not been sufficiently tested and
is described as “providing the mechanism for identifying the criteria that produce a positive cost
benefit for all stakeholders”.
Generic, simple models indicative of pilot conditions should be developed for more robust cost
estimates or to reduce uncertainties.

8/13/2019 Needs report: appendix E
http://slidepdf.com/reader/full/needs-report-appendix-e 121/235
110
Appendix D - Practicalities of retrofitting SUDS
D.1 Ownership and maintenance The implementation of comprehensive SUDS schemes is still relatively new in the UK even for new
developments, although it is an important component of planning for the management of flood risk in new developments, described in Planning Policy Statement 25 (CLG, 2006). In practice the
approach has faced barriers, particularly the issue of who is to take responsibility for ownership and
maintenance (EA, 2007). The Construction Industry Research and Innovation Association (CIRIA) website summarises the situation as follows:
“The ownership and maintenance of conventional piped drainage systems is clearly defined in Sewers for Adoption (Water Services Association, 1994). However, by their nature, many SUDS can be considered either drainage or landscape features, and there is no clear guidance on who is responsible for the operation and maintenance of such facilities. A trial framework agreement has been drawn up in Scotland to remove this barrier to the greater use of SUDS. Due to the different
legal duties, a country ‐wide agreement of this kind will take time to evolve in England and Wales. However there is scope for individual maintenance agreements to be negotiated on a site ‐by ‐site basis. ” (http://www.ciria.org.uk/suds/planning_england_and_wales.htm )
Furthermore, SUDS are not legally described as ‘sewers’ in ‘Sewers for Adoption’ (6th Edition) (Water
UK and WRc, 2006), therefore water utilities have been unable to build or adopt them. Because of this, the national SUDS working group in England and Wales produced an Interim Code of Practice
for Sustainable Drainage Systems (NSWG, 2004) as well as model maintenance agreements (CIRIA, 2004) in order to help overcome these issues (Stovin and Swan, 2007).
The Flood and Water Management Act 2010 was passed in April 2010. The Act will end the
automatic right to connect to sewers for surface water drainage and require developers to put SUDS in place in new developments wherever practicable in accordance with new ‘National SUDS
Standards’. Connection will be conditional on meeting these new national standards on SUDS and
drainage to the satisfaction of the ‘SUDS Approval Body’. The water industry is currently involved in
developing these standards and it is expected that new SUDS will be adopted and maintained by
local authorities (Defra, 2009). Although there are concerns about how this will work with multiply ‐
owned SUDS trains and critical drainage systems and also about how existing systems will be
managed retrospectively. The advent of a new Government has, however, delayed the rolling ‐out of the new legislation and the precise details of how the responsibilities will be delivered.
D.2 Retrofitting
New developments only account for around one percent per year of housing stock and SUDS implemented there will make only a limited contribution overall to reducing flood risk and improving
water quality, although there are also opportunities in regenerating areas. There is an obvious need
for a combined strategy to install SUDS in new developments as well as to retrofit them into existing
ones (EA, 2007).
The philosophy of SUDS is to replicate as closely as possible the natural drainage from a site before
development (CIRIA, 2007), and SUDS should be considered as part of the whole water cycle within a
catchment area. This is an easier task for a new development than retrofitting into an area where
the drainage may already be far removed from its natural state. However, SUDS can be used to
augment (or replace) existing drainage systems in a developed catchment and studies have
8/13/2019 Needs report: appendix E
http://slidepdf.com/reader/full/needs-report-appendix-e 122/235
111
suggested (Swan et al., 2001) that SUDS could provide cost ‐effective hydraulic improvement, either
as fully SUDS‐based or partially SUDS‐based rehabilitation strategies (Stovin and Swan, 2007).
Arrangements for adoption and maintenance can be more complex for retrofit SUDS. The
Environment Agency summarise issues for some of the stakeholders involved in retrofit SUDS as
follows: “Many of the decisions on SUDS retrofits are the responsibility of property owners. This includes private domestic and commercial properties, and public properties such as schools, leisure centres, hospitals and the associated hard ‐surfaced areas and roads. For instance, the responsibility to retrofit permeable paving resides in organisations that sit outside the formal regulatory process of water management; these include local authorities in a variety of roles as highway authorities, as planning authorities and as property managers in their own right, but also property developers and property owners and managers. A consequence of this is that incentives for change will need to be directed at changing the behaviour of property owners .” (EA, 2007).
D.3 Costs Whilst there is little practical experience of the implementation of wholesale SUDS schemes in
England and each is very context specific, it is possible to cost the schemes. The SUDS manual (CIRIA, 2007) recommends the use of Whole Life Costs (WLC) because many of the benefits of SUDS will accrue over the long term and to a broader range of stakeholders than those of the alternative
piped/sewered drainage. This necessarily includes some evaluation of intangible benefits making
comparison of costs less direct. It does, however, highlight and allow for the inclusion of the multiple
benefits of SUDS in terms of the social and environmental as well as the economic; thus emphasising
their potential sustainability value. A methodology for the calculation of WLC of the retrofit case
study examples in this report is given in section 7.
D.4 Institutional/individual ‘Lock -in’; a resistance to change to a more
resilient approach
D.4.1 Regulation / governanceThe move towards more sustainable management of water resources in the UK and particularly in
England is slow for a number of reasons. This can be attributed in part to the complex way in which
the interconnected parts of the water cycle are managed, with separate and diverse organisations
involved at each stage, often with unclear responsibilities (Rouse, 2007). Public drainage
responsibilities are divided between local authorities and internal drainage boards, highways
authorities, sewerage undertakers and the Environment Agency. Regulatory bodies and other
interest groups such as Ofwat, the Consumer Council for Water, Natural England and the Royal Society for the Protection of Birds also have an influence on water management, mainly by direct
contact with Government departments (Ashley and Brown, 2008). There is a reluctance to innovate due to lack of incentives and barriers (UKWIR, 2006; Cave, 2008) and major difficulties in working
across organisations to deliver the best response to extreme events; especially as the private
Sewerage Undertakers do not have to share vital information about both water resources and flood
risk from sewers. European Directives also provide challenges to planning for security of water
supplies in England (Rouse, 2007) in that they are apt to constrain best practice and compel
investment into areas that may not be a priority when considered in the perspective of society’s
overall needs.
Differences in arrangements in Scotland appear more conducive to the ‘social learning’ required to
deliver transitions, regime change and total water quality management (Ison & Watson, 2007).
Similarly, Dŵ r Cymru Welsh Water can take a wider and more holistic view of the way in which it
8/13/2019 Needs report: appendix E
http://slidepdf.com/reader/full/needs-report-appendix-e 123/235
112
manages the water cycle, supported closely by the Welsh Assembly Government. This is because
although technically private, Welsh Water has been handed back to the people of Wales and is a
not ‐for ‐profit organisation that has less incentive to increase the value of its’ assets for capitalisation
purposes than privatised Sewerage Undertakers. Welsh Water is showing signs of transition in its
aspirations, including: motive (people not capitalisation); Governance (support and national
identity); vision (champions at the heart of the organisation) (Blackmore, 2004; Page & Bakker, 2005; Saal et al, 2007).
D.4.2 Cognit ion; sticking to the traditional approach in the face of newproblems
The conventional regime, very often seen as the ‘common sense’ approach (Ashley and Brown,
2008), essentially delivers a ‘one ‐size ‐fits ‐all’ design concept ‐ or ‘big‐pipes ‐in’ and ‘big‐pipes ‐out’
(Newman, 2001), which is largely independent of contexts and tends to optimise control of the most
likely future condition (for example ‐ water supply scarcity or excess runoff) without consideration of the rest of the total water cycle; leaving systems vulnerable to future changes (Pahl ‐Wostl et al,
2007). This approach is grounded in the tradition of rational planning, which formulates design
problems as trade ‐offs of costs, risks, and benefits that are dependent on variables such as climatic conditions that change only slowly over time. Trade ‐offs are then evaluated by optimisations or
simulations based on historical data such as rainfall records, which are no longer reliable (sometimes
called stationarity philosophy (Milly et al, 2008)). This minimises the opportunity to create city
specific urban water services and systems that could be integrated into the urban landscape in
alternative and relatively radical ways that allow for substantially higher resilience and other
benefits such as greener landscapes and heat ‐island sinks (McEvoy, 2007). Ashley and Brown (2008)
suggest a critical and highly explicit reflection on these fundamental stationarity design and
operational philosophy, assumptions and design as a starting point for transformation in the
conventional urban water management approach.
D.4.3 Normative lock-in; how to transform systemsThere have been many advances towards alternative options and processes for designing adaptation
opportunities to uncertain future conditions in recent years. These can be integrated within,
superimposed upon and/or able to replace the existing urban water infrastructure. Yet despite this
substantial investment in developing technological and assessment alternatives, there is an
increasing and overwhelming despondence within the urban water research community with the
lack of change in conventional practice (Ashley and Brown, 2008). Many observers highlight how the
compartmentalisation of infrastructure and service provision is being reinforced and leaving the
sector ill‐equipped to respond and adapt to complex sustainability challenges (Marsalek et al. 2001;
Newman, 2001; Brandes and Kriwoken, 2006; Wong, 2006). Emerging research in areas such as
institutional capacity building (Brown et al, 2006), organisational development (Brown, 2008), public
engagement (Sefton, 2008) and, urban water professional receptivity and leadership (Taylor, 2008) has not been drawn upon to help bridge system boundaries. A vision to reverse this situation is now
being implemented in a number of EU projects: SWITCH3 ; MARE4 ; SKINT and FloodResileinCity 5, where as wide a range of stakeholders as needed in order to facilitate change and to engage in the
active learning form a Learning (and action) Alliance. The core alliance can act to engage in both
policy processes and on the ground delivery of responses needed to cope with future challenges. It also forms a vehicle for providing knowledge, information, techniques and consensual learning.
3 SWITCH ‐ Managing Water for the City of the Future, http://www.switchurbanwater.eu/la_switch.php 4 http://www.mare ‐project.eu/ 5 http://www.floodresiliencity.eu/en/about/
8/13/2019 Needs report: appendix E
http://slidepdf.com/reader/full/needs-report-appendix-e 124/235
113
D.5 Implementation of non - piped/sewered systems
Pilot projects (e.g. those conducted under Defra’s auspices) have shown that alternatives to
piped/sewer drainage are a feasible option, although the difficulties of delivering these given
the complex relationships between stakeholders involved in implementation, should not be
underestimated.
The best mechanisms of effecting a paradigm shift to the use of non ‐piped/sewer drainage
systems is still under debate. Local authorities have a key role; in particular the planning
authority is central in the promotion and specification of non ‐piped/sewer systems for new
developments. However, the place of WaSCs is still also crucial due to the need for excess
flows from non ‐piped/sewer systems to be directed into their piped assets; therefore WaSCs
need to become statutory consultees in the planning process as is proposed in the F&W Bill and in the Ofwat recommendations for amendments to the regulatory and legal options for
reducing surface water in sewers.
In the UK, typically drainage considerations are a long way down the priority list for
developments and developers. This needs to change. In the USA, responsibilities are usually at municipal level, or shared with a stormwater utility; hence this approach is easier to
implement there than in England and Wales.
Each individual situation (catchment) needs to be looked at specifically where disconnection
of non ‐foul flows from foul or combined flows is being considered. There is no ‘magic ‐bullet’
approach.
In order for stormwater disconnection measures to offer an effective solution, change is
required to facilitate the uptake; such as the refinement of separate stormwater charging to
provide increased financial incentive. Furthermore, the requirement for public and
stakeholder engagement is critical to the establishment of novel water supply and sanitation
systems.
D.6 Non - piped/sewer systems and water quality
In general planning and implementing the technical aspects of planning, design, adoption
and operation of non ‐piped/sewered systems is now quite clear but their
quantity/quality/amenity performance is still not properly understood.
There is proportionate variability, but generally urban diffuse runoff pollution is potentially
significant. Stormwater can be more polluting than foul flows discharging from combined
sewer overflows.
Interest in the quality performance of non ‐piped/sewered non ‐foul flow systems in England
and Wales is not as prevalent as in Scotland. This represents a failure to provide the
complete nexus of quantity ‐quality and amenity that makes alternative drainage systems
potentially more valuable (in both a tangible and intangible sense) than conventional
systems. However, there is concern that implementation of the WFD will potentially add to
other environmental impacts as illustrated by carbon footprint studies showing the potential
transfer of polluting burdens from the water sector to the energy and waste sectors.
D.7 Non - piped/sewered systems and water quantity
Predicting even the likely changes in non ‐foul flow rates and volumes in the future is
increasingly uncertain, which supports the essential need to take an adaptive and flexible

8/13/2019 Needs report: appendix E
http://slidepdf.com/reader/full/needs-report-appendix-e 125/235
114
approach. Emerging studies are now showing objectively that non ‐piped/sewered drainage
systems are inherently more flexible and adaptable.
Urban area form and layout need to be better managed to ensure that there are clear
exceedence flow pathways as part of the synergy of the management of water with a multi ‐
functional benefit
for
urban
areas.
Retrofitting rainwater harvesting systems could potentially significantly reduce flood
frequencies and volumes in areas that suffer from frequent flooding provided the RWH tanks
are larger than is required simply to satisfy water demand.
D.8 Perceptions of non - piped/sewered systems
The likely impacts of climate change are still not being considered by most stakeholders.
Stakeholders have expressed concern about the performance of SUDS systems in the flood
plain when they become inundated and new guidance is needed to deal with this.
Utilisation of non ‐piped/sewered non ‐foul flow systems is still seen by many as a greater risk
than piped/sewer systems. There is greater confidence in their performance regarding water
quantity than water quality.
There is confusion amongst stakeholders at all levels regarding the effectiveness of SUDS; the draft Flood and Water Management Bill appears to promote the use of non ‐
piped/sewered drainage systems in preference to piped/sewered, with often an unrealistic
expectation of the likely success.
Misdirected funding based on preconceptions about the best return for investments can be
inefficient when retrofitting to alleviate stormwater pollution problems.
D.9 Current surface water management initiatives
The current initiatives in England regarding surface water management show a lack of appreciation of the need to allow properly for adaptation to changing circumstances.
The lack of provision for more flexible types of regulatory, technical and economic
approaches for the future may compromise future resilience to flooding.
There is still a degree of incompatibility across the various non ‐piped/sewered drainage
approaches to performance standards, although most now advocate a risk‐based approach,
this is still often only qualitative.
There is little indication that joining up the water cycle is seen as the best way to manage
surface water and flooding despite the emergence of Water Cycle Studies.
There is an apparent inability of surface water management deliverers to take a catchment
wide perspective rather than adopting (many) localised measures
Reducing the quantity of stormwater at source through strategies to reduce imperviousness
and maximize infiltration and filtration can be more cost effective than capturing and
improving the quality of vast quantities of urban stormwater runoff.
At municipal level, costs can be decreased when such techniques are incorporated into
redevelopment and ongoing replacement efforts.
8/13/2019 Needs report: appendix E
http://slidepdf.com/reader/full/needs-report-appendix-e 126/235
115
D.10 Use and adoption of SUDS by Sewerage Undertakers
SUDS do not comply with the definition of a sewer (i.e. having a proper outfall) as stated in
Sewers for Adoption (6th edition) therefore they cannot be included as part of a Sewerage
Undertaker’s asset base. This will be perceived negatively by shareholders and Ofwat.
However, it does not preclude a sewerage undertaker from deciding to ‘take care’ of the
‘structure’ nonetheless.
The absence of formal mechanisms to enable Sewerage Undertakers to adopt SUDS (as
assets recognised by OFWAT) is probably the most significant deterrent to the proper
consideration of SUDS in new developments by developers and in retrofit applications to
solve problems such as sewer flooding under DG5. Although SUDS could be adopted by
parties other than the Sewerage Undertakers (e.g. local authorities) there is no obvious
incentive for others to take on this responsibility unless for example a management
company can charge fees to beneficiaries.
The debate surrounding which organisation might be best placed to manage stormwater is
ongoing, and is one of the key issues being tackled as part of the DEFRA IUD Pilot programme (Gill, 2008), but has come out in favour of local authorities having the
responsibility under the Flood and Water Management Act 2010, although there is strong
pressure by a number of sewerage undertakers for them to be given the operation and
maintenance role in the enabling legislation for the new Act. In any case, the new Act makes
provision for the taking of previously excluded land drainage into sewers inevitable.
Sewerage Undertakers are reluctant to implement SUDS structures because their
maintenance requirements are not something they consider to fall within their normal line
of business. Also, there is a perception that the lack of knowledge about the long term
performance of SUDS makes their adoption very risky (WERF/UKWIR, 2005). However, the
option of brokering agreements with third parties (e.g. local authorities, independent contractors) to undertake maintenance is being considered by several Sewerage
Undertakers.
Sewerage Undertakers might be wary of using SUDS (especially above ‐ground components)
in retrofit applications because this may then establish a precedent for future adoptions
associated with new developments.
There is nothing to prevent a Sewerage Undertaker from retrofitting either surface or
subsurface SUDS on land that they own. However, both the SNIFFER (2006) project and
Stovin et al (2007) showed that constraining options to publicly ‐owned land would lead to
only marginal improvement in the catchment as a whole. Mechanisms/incentives to include
privately owned land within SUDS retrofit schemes are needed.
Where SUDS options are proposed on privately ‐owned land, a distinction needs to be made
between surface and sub ‐surface SUDS. In some cases it might be feasible to consider
purchase of land deemed suitable for the retrofitting of surface SUDS, such as ponds, which
make the land unsuitable for further development. Alternatively, a local authority may agree
to designate land for dual use, such as playing fields which are also designed as detention
basins for low frequency events. In the case of sub ‐surface SUDS, one ‐off ‘deals’ to
compensate landowners for disruption could be brokered to enable a Sewerage Undertaker
to retrofit a SUDS structure on private land. However, the uncertainties surrounding the
responsibilities for long ‐term maintenance of such structures would still need to be
addressed.

8/13/2019 Needs report: appendix E
http://slidepdf.com/reader/full/needs-report-appendix-e 127/235
116
At the present time there appear to be inconsistencies in the way private land ‐owners are
encouraged to implement source controls. Some Sewerage Undertakers offer to waive the
stormwater management component of customers’ water bills if they disconnect their
stormwater from the sewer system. However, this is usually a yes/no condition, with no
scope to recognise partial disconnection. The waived charges are also very small (circa £30
p.a.). Banded charging schemes reflecting the actual level of connected impermeable area would be welcomed. The definition of disconnection is unclear, and it is understood that
present charging schemes may imply that in situations where flow may enter the sewer
under extreme events (exceedance flows) then strictly the landowner should be charged for
connection. Legislation to support disconnection up to ‘reasonable’ design events would be
welcomed, although it is clear that strategies for dealing with the exceedance flows would
need to be formulated and funded in parallel.
The system is complex, and there are conflicts within current advice. For example, PPS25
suggests design to 100 year return periods, whereas Sewers for Adoption uses 30 year
return period criteria. The forthcoming take over of (communal) private sewers by Sewerage
Undertakers may help to integrate certain aspects of sewer network management, but it
may also act as a disincentive to developers who are considering the use of SUDS techniques
as they would preferentially wish to install piped/sewered drainage systems – as has
happened in Scotland.
Stovin et al (2007) proposed a solution to a DG5 flooding problem in Anglian Water’s region.
This was achievable using a realistic budget and also appropriate timescale. However, it also
resulted in a conflict between the ‘normal’ engineering process (and time constraints) and
the practical need to address the many novel issues associated with the use of SUDS.
The case study above also highlighted problems associated with integrating teams within the
sewerage undertaker. This showed that implementation and detailed design could not be
managed effectively by people remote to the site nor the organisations that will ultimately be responsible for implementing and managing the new SUDS facilities. Scheme success is
contingent on local champions, particularly where new approaches, such as SUDS retrofit
are being trialled.
D.11 Added benefits of ‘joined -up’ surface water management
The introduction of multiple ‐use basins for stormwater management and the use of ‘greening’ approaches have had a positive effect on property prices because of the premium
that buyers place on vegetation and conservation development.
Studies have shown that the restoration of river corridors can actually lead to a reduction in
local crime although badly thought out FRM measures can create spaces that can be
conducive to criminal activity.
There are a number of other benefits accruing to society as a whole that are increasingly
being recognised, especially in the USA, where a major project is enhancing the scope of assessment of the monetary value of green infrastructure (GI), implemented by retrofitting
stormwater management measures to relieve CSO pollution in major cities, such as
Philadelphia (Wise et al, 2010). This has shown that GI delivered from disconnecting
stormwater from the combined sewers can have multiple US$ billion benefits to urban areas
as a whole. This is important in the US context as there the sewerage systems are managed
by the local authorities, who can therefore promote multi ‐beneficial outcomes for the good
of their cities.
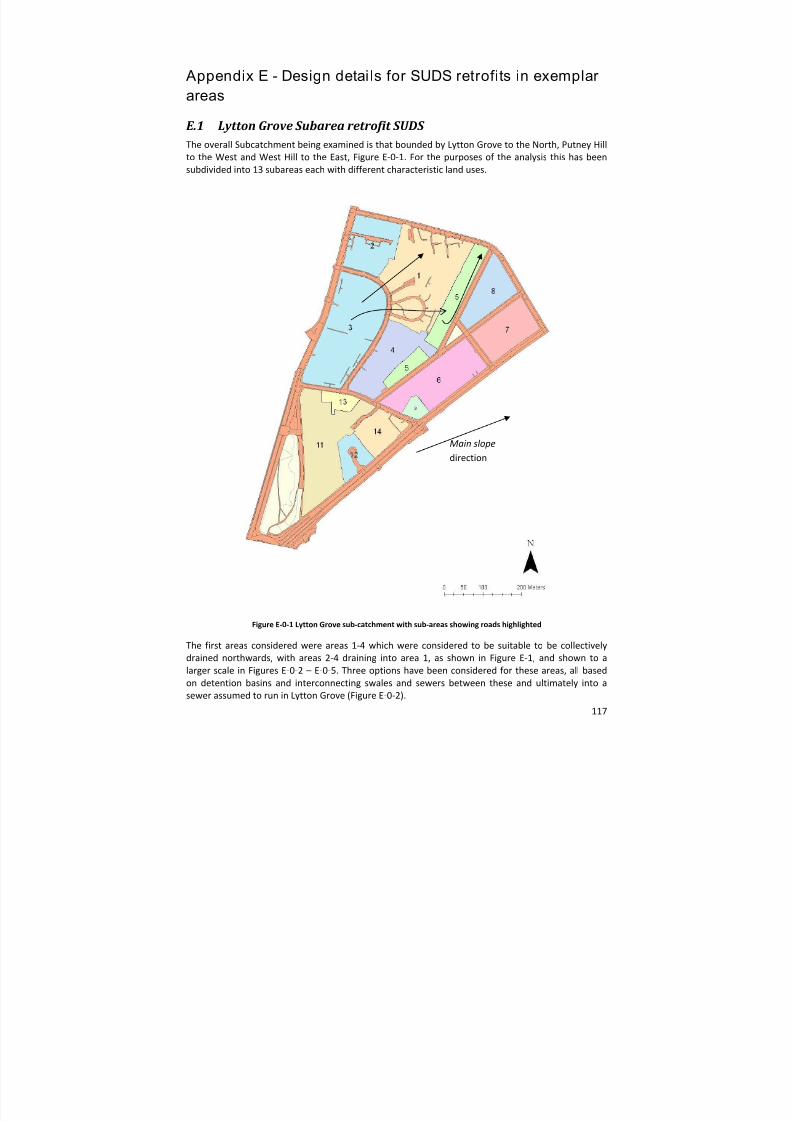
8/13/2019 Needs report: appendix E
http://slidepdf.com/reader/full/needs-report-appendix-e 128/235
117
Appendix E - Design detai ls for SUDS retrofits in exemplarareas
E.1 Lytton Grove Subarea retrofit SUDS The overall Subcatchment being examined is that bounded by Lytton Grove to the North, Putney Hill to the West and West Hill to the East, Figure E‐0‐1. For the purposes of the analysis this has been
subdivided into 13 subareas each with different characteristic land uses.
Figure E‐0‐1 Lytton Grove sub ‐catchment with sub ‐areas showing roads highlighted
The first areas considered were areas 1‐4 which were considered to be suitable to be collectively
drained northwards, with areas 2‐4 draining into area 1, as shown in Figure E‐1, and shown to a
larger scale in Figures E‐0‐2 – E‐0‐5. Three options have been considered for these areas, all based
on detention basins and interconnecting swales and sewers between these and ultimately into a
sewer assumed to run in Lytton Grove (Figure E‐0‐2).
Main slope
direction

8/13/2019 Needs report: appendix E
http://slidepdf.com/reader/full/needs-report-appendix-e 129/235
118
Lytton Grove Option 1: drain disconnected impervious areas from areas 1‐4 to detention basins situated in the lowest part of the Subcatchment in area 1.
Subarea 1 is the lowest area of the overall Subcatchment, which drops some 20m over the 1km
length from the southern end (Tibbet’s Corner) to Lytton Grove. Shown in Figure E.2 are the
maximum potential areas for locating detention basins. This is Option 1 and has been used initially
to assess whether or not these would be adequate to drain all the impervious surfaces for areas 1‐4.
The potential areas for surface storage are shown as A‐D for option 1. These are linked by swales
and pipes. The outflow from the system is controlled to a maximum of 5 l/s from each of the two
connections to the main sewer in Lytton Grove for a 1 in 30 year storm. The initial design considers
the potential for this area to also drain the runoff from the disconnected impervious areas from the
surrounding areas 2 – 4 (Figures E‐0‐3 – E‐0‐5).
The sizes of the units in Figure E‐0‐2 are given in Table E‐0‐1.
Legend for all following OS Mastermap Figures:
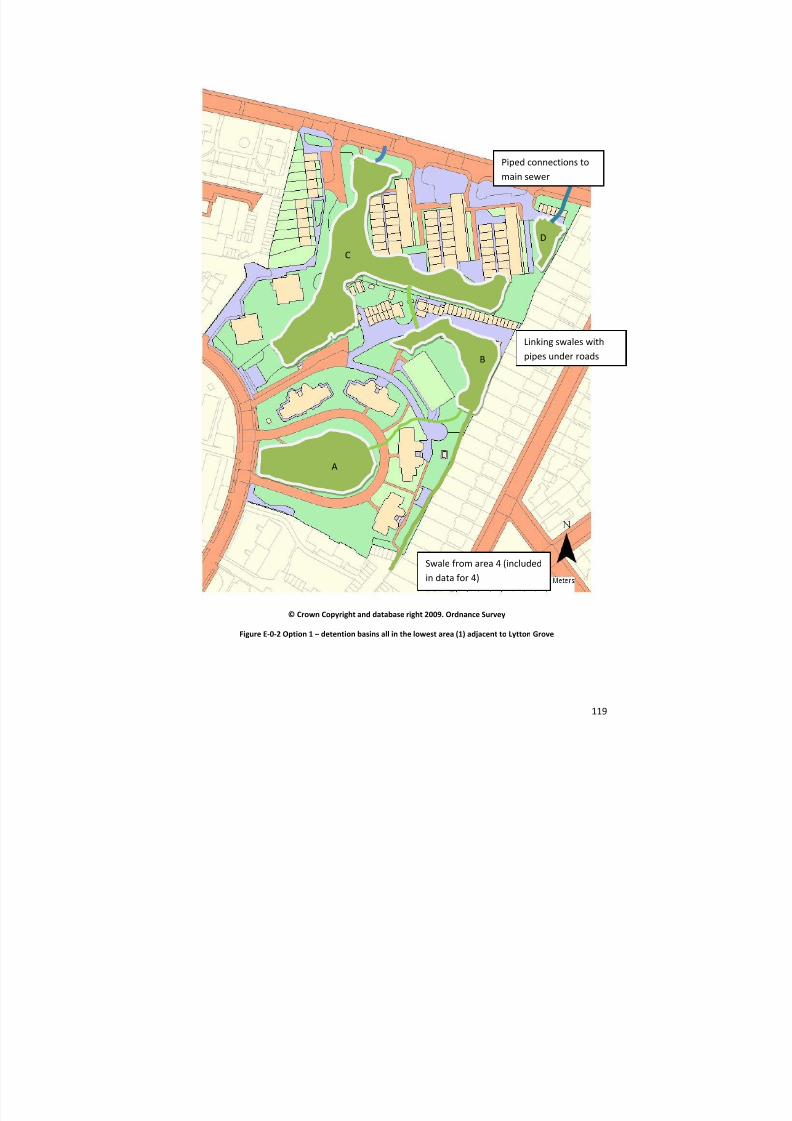
8/13/2019 Needs report: appendix E
http://slidepdf.com/reader/full/needs-report-appendix-e 130/235
119
© Crown Copyright and database right 2009. Ordnance Survey
Figure E‐0‐2 Option 1 – detention basins all in the lowest area (1) adjacent to Lytton Grove
A
B
C
D
Piped connections to
main sewer
Linking swales with
pipes under roads
Swale from area 4 (included
in data for 4)
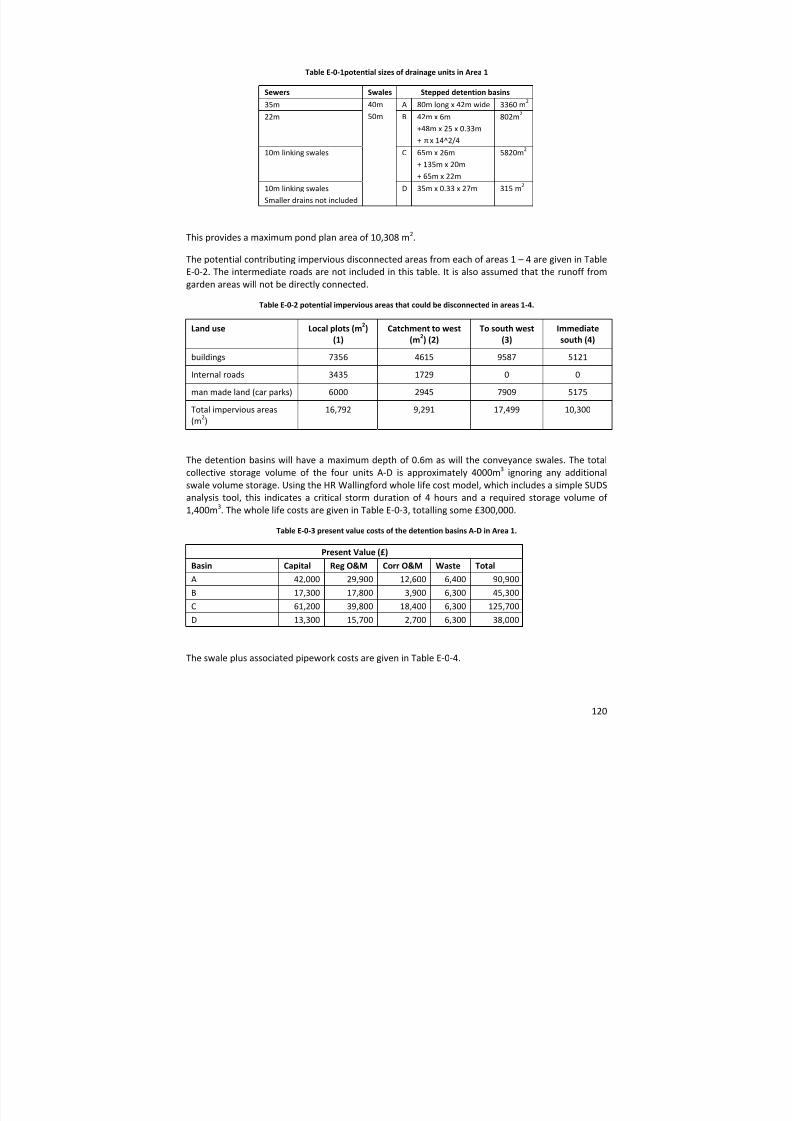
8/13/2019 Needs report: appendix E
http://slidepdf.com/reader/full/needs-report-appendix-e 131/235
120
Table E‐0‐1potential sizes of drainage units in Area 1
Sewers Swales Stepped detention basins
35m 40m
50m
A 80m long x 42m wide 3360 m2
22m B 42m x 6m
+48m x 25 x 0.33m
+ π x 14^2/4
802m 2
10m linking swales C 65m x 26m
+ 135m x 20m
+ 65m x 22m
5820m 2
10m linking swales
Smaller drains not included
D 35m x 0.33 x 27m 315 m2
This provides a maximum pond plan area of 10,308 m2.
The potential contributing impervious disconnected areas from each of areas 1 – 4 are given in Table
E‐0‐2. The intermediate roads are not included in this table. It is also assumed that the runoff from
garden areas will not be directly connected.
Table E‐0‐2 potential impervious areas that could be disconnected in areas 1‐4.
Land use Local plots (m 2) (1)
Catchment to west (m 2) (2)
To south west (3)
Immediate south (4)
buildings 7356 4615 9587 5121
Internal roads 3435 1729 0 0
man made land (car parks) 6000 2945 7909 5175
Total impervious areas
(m2) 16,792 9,291 17,499 10,300
The detention basins will have a maximum depth of 0.6m as will the conveyance swales. The total
collective storage volume of the four units A‐D is approximately 4000m 3 ignoring any additional
swale volume storage. Using the HR Wallingford whole life cost model, which includes a simple SUDS
analysis tool, this indicates a critical storm duration of 4 hours and a required storage volume of 1,400m 3. The whole life costs are given in Table E‐0‐3, totalling some £300,000.
Table E‐0‐3 present value costs of the detention basins A‐D in Area 1.
Present Value (£) Basin Capital Reg O&M Corr O&M Waste TotalA 42,000 29,900 12,600 6,400 90,900
B 17,300 17,800 3,900 6,300 45,300
C 61,200 39,800 18,400 6,300 125,700
D 13,300 15,700 2,700 6,300 38,000
The swale plus associated pipework costs are given in Table E‐0‐4.

8/13/2019 Needs report: appendix E
http://slidepdf.com/reader/full/needs-report-appendix-e 132/235
121
Table E‐0‐4 present value costs for swales and associated pipework in Area 1.
Present Value (£)
Swale (m) Capital
Reg O&M £ Total
50 12,400 1,600 14,00040 12,000 1,700 13,70010 4,000 1,200 4,90010 4,000 1,200 4,900
These costs allow only for standard piped connections where crossing roads within the catchments
and do not allow for smaller interconnections or complications with services. The costs also do not
include any land purchase. The connecting swales for the other areas, 2‐4, are not included in these
costs.
In Option 2 below, it can be seen that the total length of swales and local sewers is some 1500m and
100m (Table E‐0‐5) respectively. Using the proportionate costs as for the swales and sewers above,
this gives additional whole life costs of £423,000. Therefore the total costs of disconnecting the
impervious parts of the four areas, 1‐4, draining through area 1, as shown in Figure E‐2 is some
£723,000. This will drain these areas comfortably and the sizes of the storage units could actually be
reduced as described below.
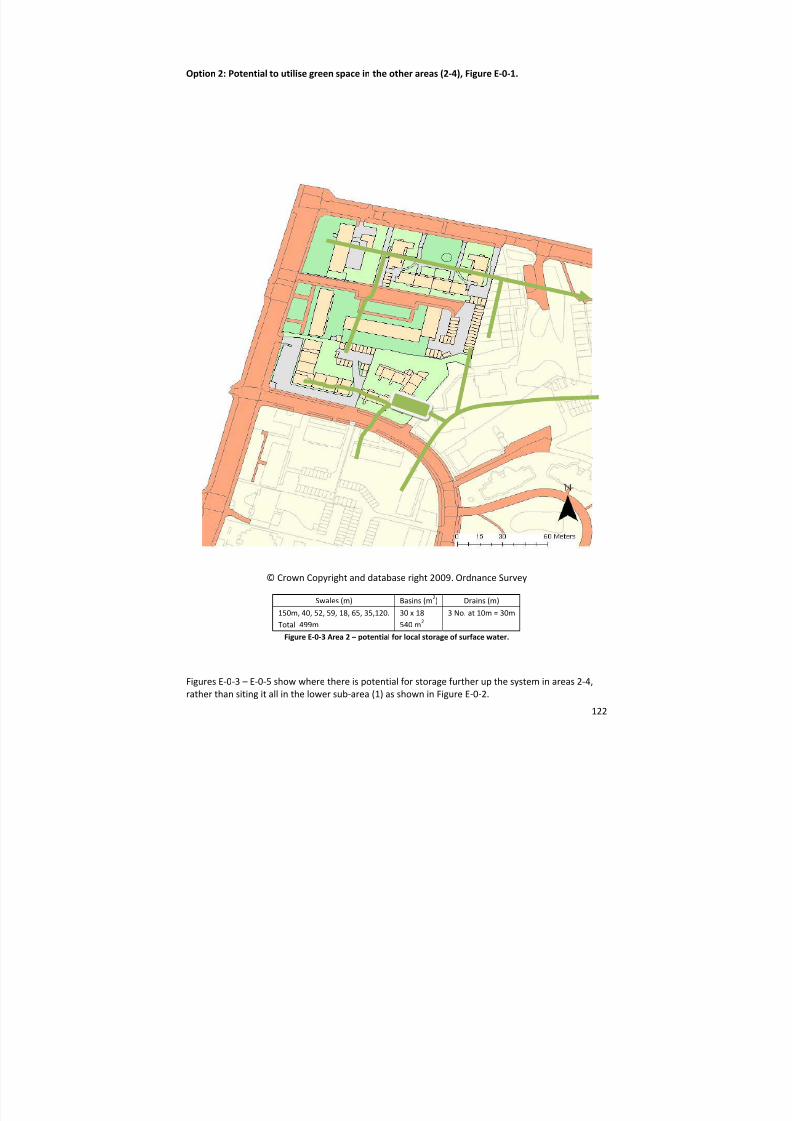
8/13/2019 Needs report: appendix E
http://slidepdf.com/reader/full/needs-report-appendix-e 133/235
122
Option 2: Potential to utilise green space in the other areas (2‐4), Figure E‐0‐1.
© Crown Copyright and database right 2009. Ordnance Survey
Swales (m) Basins (m2) Drains (m)
150m, 40, 52, 59, 18, 65, 35,120.Total 499m
30 x 18
540 m2
3 No. at 10m = 30m
Figure E‐0‐3 Area 2 – potential for local storage of surface water.
Figures E‐0‐3 – E‐0‐5 show where there is potential for storage further up the system in areas 2‐4,
rather than siting it all in the lower sub ‐area (1) as shown in Figure E‐0‐2.
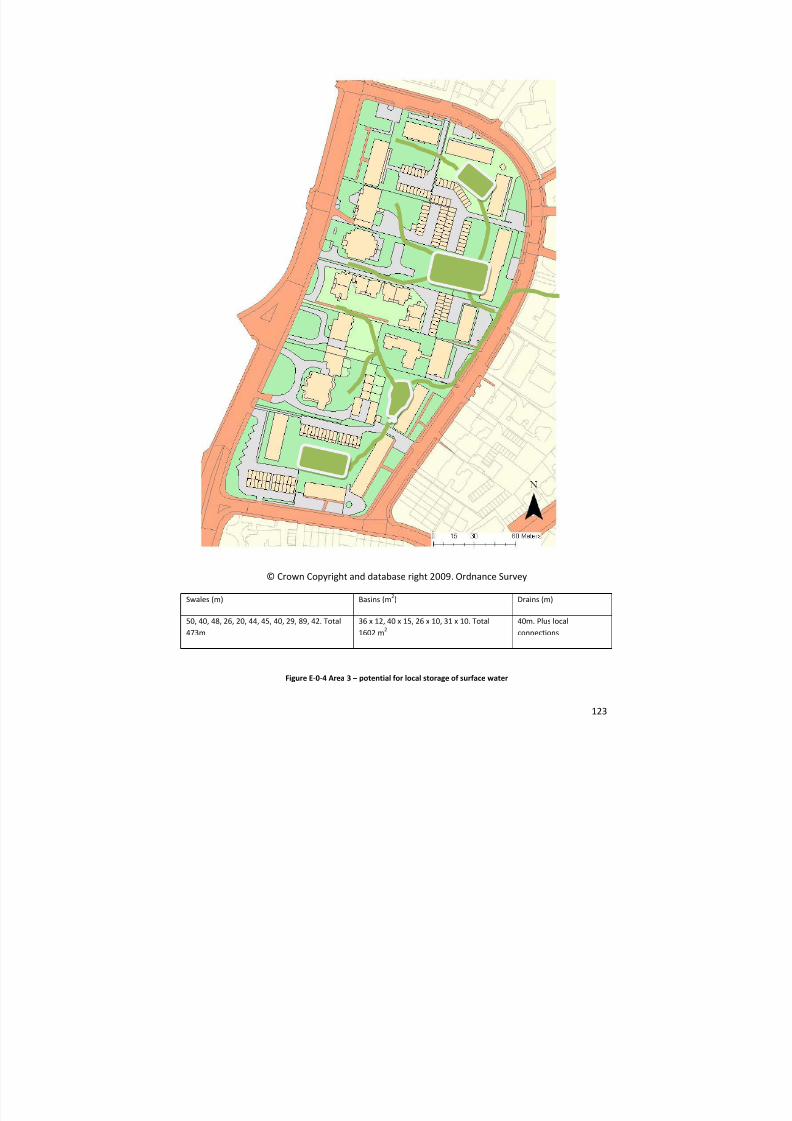
8/13/2019 Needs report: appendix E
http://slidepdf.com/reader/full/needs-report-appendix-e 134/235
123
© Crown Copyright and database right 2009. Ordnance Survey
Swales (m) Basins (m2) Drains (m)
50, 40, 48, 26, 20, 44, 45, 40, 29, 89, 42. Total
473m
36 x 12, 40 x 15, 26 x 10, 31 x 10. Total
1602 m2
40m. Plus local
connections
Figure E‐0‐4 Area 3 – potential for local storage of surface water
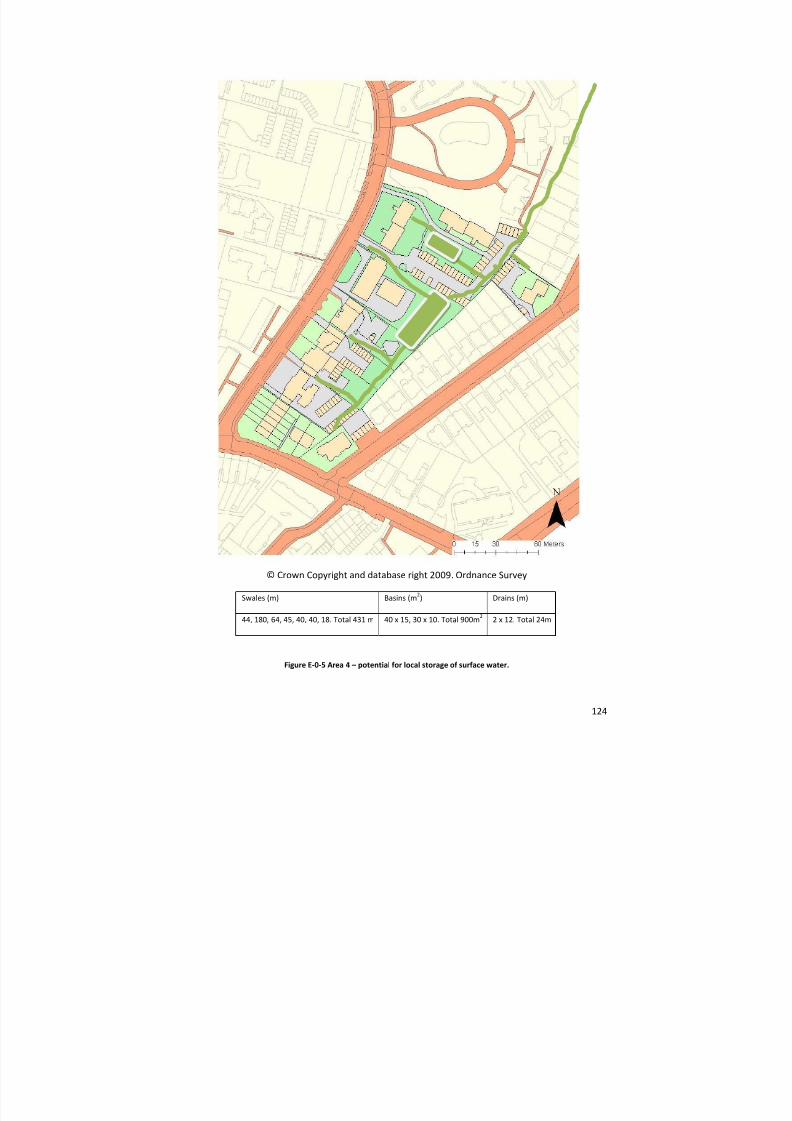
8/13/2019 Needs report: appendix E
http://slidepdf.com/reader/full/needs-report-appendix-e 135/235
124
© Crown Copyright and database right 2009. Ordnance Survey
Swales (m) Basins (m2) Drains (m)
44, 180, 64, 45, 40, 40, 18. Total 431 m 40 x 15, 30 x 10. Total 900m 2 2 x 12. Total 24m
Figure E‐0‐5 Area 4 – potential for local storage of surface water.
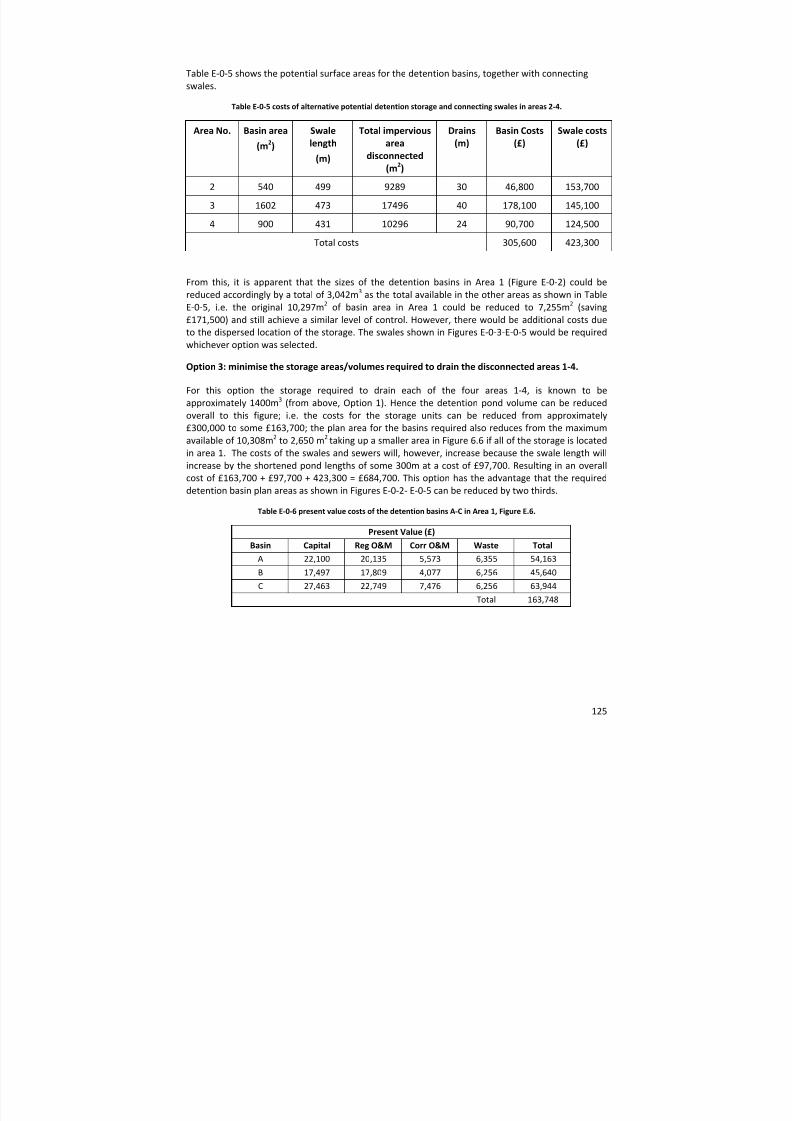
8/13/2019 Needs report: appendix E
http://slidepdf.com/reader/full/needs-report-appendix-e 136/235
125
Table E‐0‐5 shows the potential surface areas for the detention basins, together with connecting
swales.
Table E‐0‐5 costs of alternative potential detention storage and connecting swales in areas 2‐4.
Area No. Basin area
(m 2) Swale length
(m)
Total impervious area
disconnected (m 2)
Drains (m)
Basin Costs (£)
Swale costs (£)
2 540 499 9289 30 46,800 153,700
3 1602 473 17496 40 178,100 145,100
4 900 431 10296 24 90,700 124,500
Total costs 305,600 423,300
From this, it is apparent that the sizes of the detention basins in Area 1 (Figure E‐0‐2) could be
reduced accordingly by a total of 3,042m 3 as the total available in the other areas as shown in Table
E‐0‐5, i.e. the original 10,297m 2 of basin area in Area 1 could be reduced to 7,255m 2 (saving
£171,500) and still achieve a similar level of control. However, there would be additional costs due
to the dispersed location of the storage. The swales shown in Figures E‐0‐3‐E‐0‐5 would be required
whichever option was selected.
Option 3: minimise the storage areas/volumes required to drain the disconnected areas 1‐4.
For this option the storage required to drain each of the four areas 1‐4, is known to be
approximately 1400m 3 (from above, Option 1). Hence the detention pond volume can be reduced
overall to this figure; i.e. the costs for the storage units can be reduced from approximately £300,000 to some £163,700; the plan area for the basins required also reduces from the maximum
available of 10,308m 2 to 2,650 m2 taking up a smaller area in Figure 6.6 if all of the storage is located
in area 1. The costs of the swales and sewers will, however, increase because the swale length will increase by the shortened pond lengths of some 300m at a cost of £97,700. Resulting in an overall
cost of £163,700 + £97,700 + 423,300 = £684,700. This option has the advantage that the required
detention basin plan areas as shown in Figures E‐0‐2‐ E‐0‐5 can be reduced by two thirds.
Table E‐0‐6 present value costs of the detention basins A‐C in Area 1, Figure E.6.
Present Value (£)Basin Capital Reg O&M Corr O&M Waste Total
A 22,100 20,135 5,573 6,355 54,163
B 17,497 17,809 4,077 6,256 45,640
C 27,463 22,749 7,476 6,256 63,944
Total 163,748
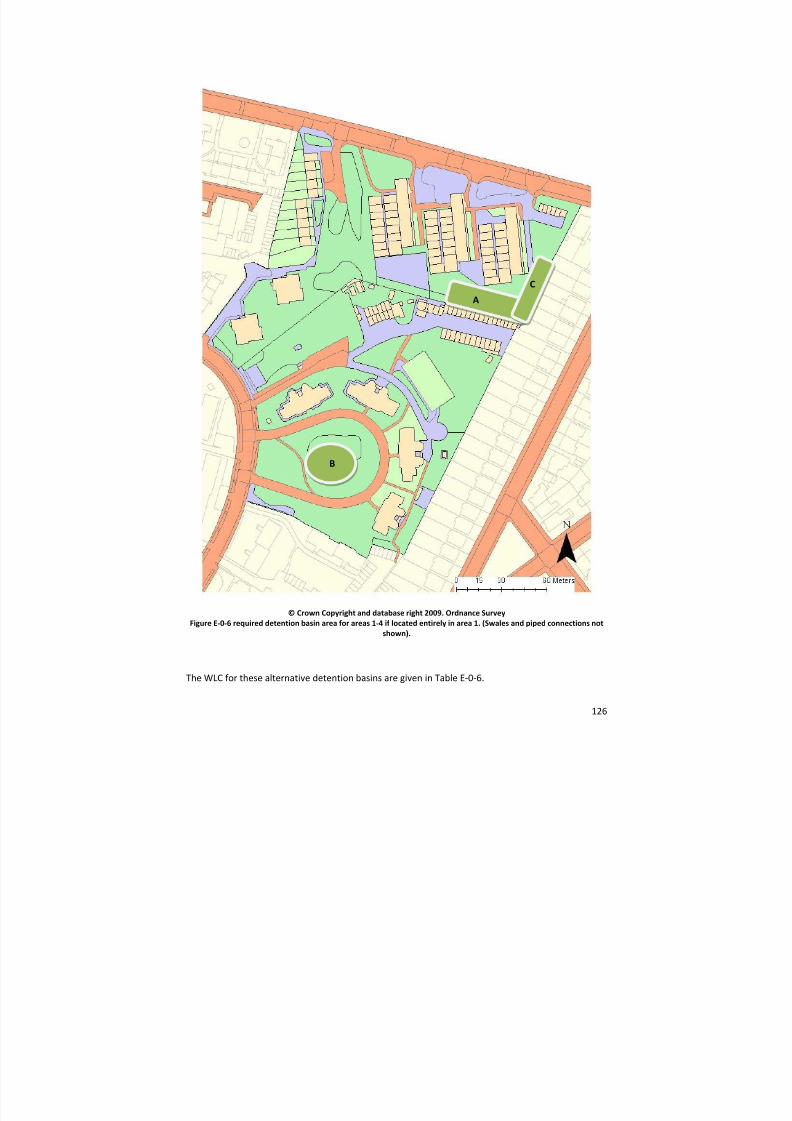
8/13/2019 Needs report: appendix E
http://slidepdf.com/reader/full/needs-report-appendix-e 137/235
126
© Crown Copyright and database right 2009. Ordnance Survey Figure E‐0‐6 required detention basin area for areas 1‐4 if located entirely in area 1. (Swales and piped connections not
shown).
The WLC for these alternative detention basins are given in Table E‐0‐6.
B
A
C
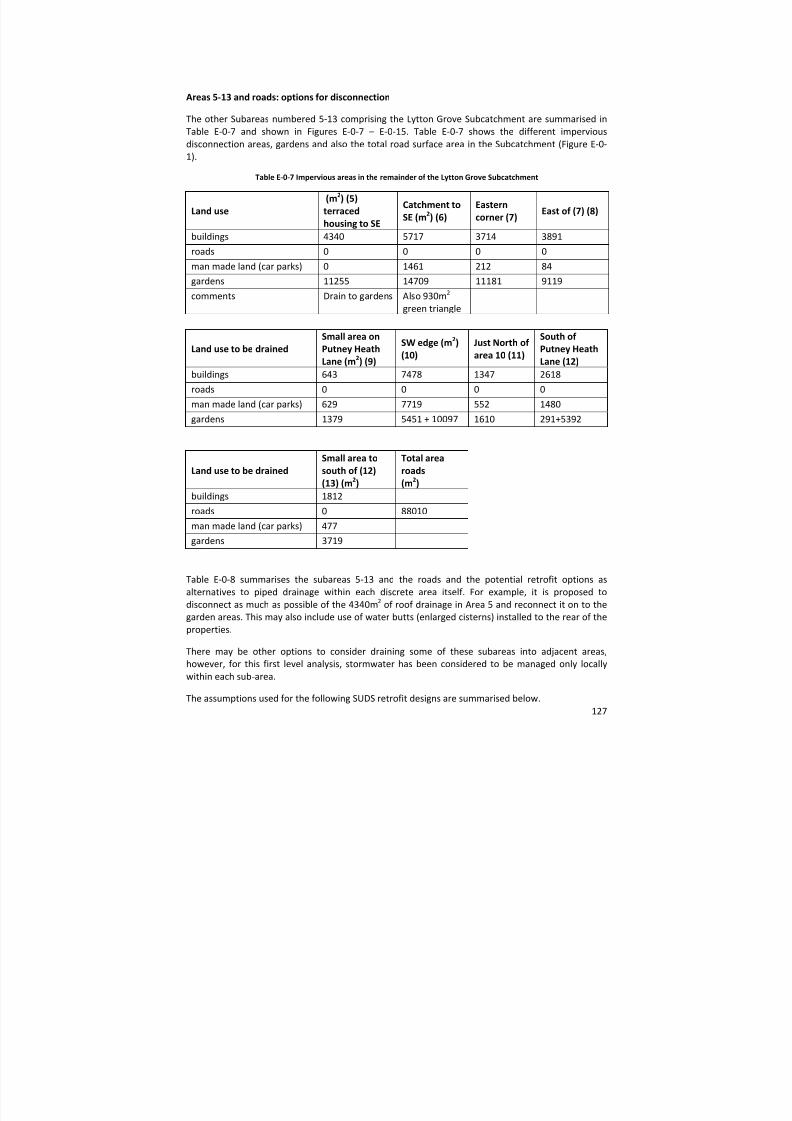
8/13/2019 Needs report: appendix E
http://slidepdf.com/reader/full/needs-report-appendix-e 138/235
127
Areas 5‐13 and roads: options for disconnection
The other Subareas numbered 5‐13 comprising the Lytton Grove Subcatchment are summarised in
Table E‐0‐7 and shown in Figures E‐0‐7 – E‐0‐15. Table E‐0‐7 shows the different impervious
disconnection areas, gardens and also the total road surface area in the Subcatchment (Figure E‐0‐
1).
Table E‐0‐7 Impervious areas in the remainder of the Lytton Grove Subcatchment
Land use (m 2) (5) terraced housing to SE
Catchment to SE (m 2) (6)
Eastern corner (7) East of (7) (8)
buildings 4340 5717 3714 3891
roads 0 0 0 0
man made land (car parks) 0 1461 212 84
gardens 11255 14709 11181 9119
comments Drain to gardens Also 930m 2
green triangle
Land use to be drained Small area on Putney Heath Lane (m 2) (9)
SW edge (m 2) (10)
Just North of area 10 (11)
South of Putney Heath Lane (12)
buildings 643 7478 1347 2618
roads 0 0 0 0
man made land (car parks) 629 7719 552 1480
gardens 1379 5451 + 10097 1610 291+5392
Land use to be drained Small area to south of (12) (13) (m 2)
Total area roads (m 2)
buildings 1812
roads 0 88010
man made land (car parks) 477
gardens 3719
Table E‐0‐8 summarises the subareas 5‐13 and the roads and the potential retrofit options as
alternatives to piped drainage within each discrete area itself. For example, it is proposed to
disconnect as much as possible of the 4340m 2 of roof drainage in Area 5 and reconnect it on to the
garden areas. This may also include use of water butts (enlarged cisterns) installed to the rear of the
properties.
There may be other options to consider draining some of these subareas into adjacent areas,
however, for this first level analysis, stormwater has been considered to be managed only locally
within each sub ‐area.
The assumptions used for the following SUDS retrofit designs are summarised below.

8/13/2019 Needs report: appendix E
http://slidepdf.com/reader/full/needs-report-appendix-e 139/235
128
1. New pervious paved areas to replace existing impervious areas:
a. Only a maximum of 75% of the paved area can be converted to pervious pavements
– to allow for the practicality of fitting the pervious area not too close to buildings
b. Not all paved surfaces are shown in OS Mastermap and google. Hence areas
connected to the pervious pavements also include an additional 5% assumed for
minor impervious areas such as property drives etc.
2. Disconnecting the property downpipes from roof areas and reconnecting these to adjacent
pervious areas:
a. Most disconnected roof areas to gardens are assumed only from the back (pitched)
roof areas
b. No water butts/cisterns have been included for cost reasons, however, unit costs for
installing these are provided as they may be added later or at a property owners’
wish.
A summary of costs and areas disconnected for Lytton Grove subcatchment is given in Table E‐0‐9.
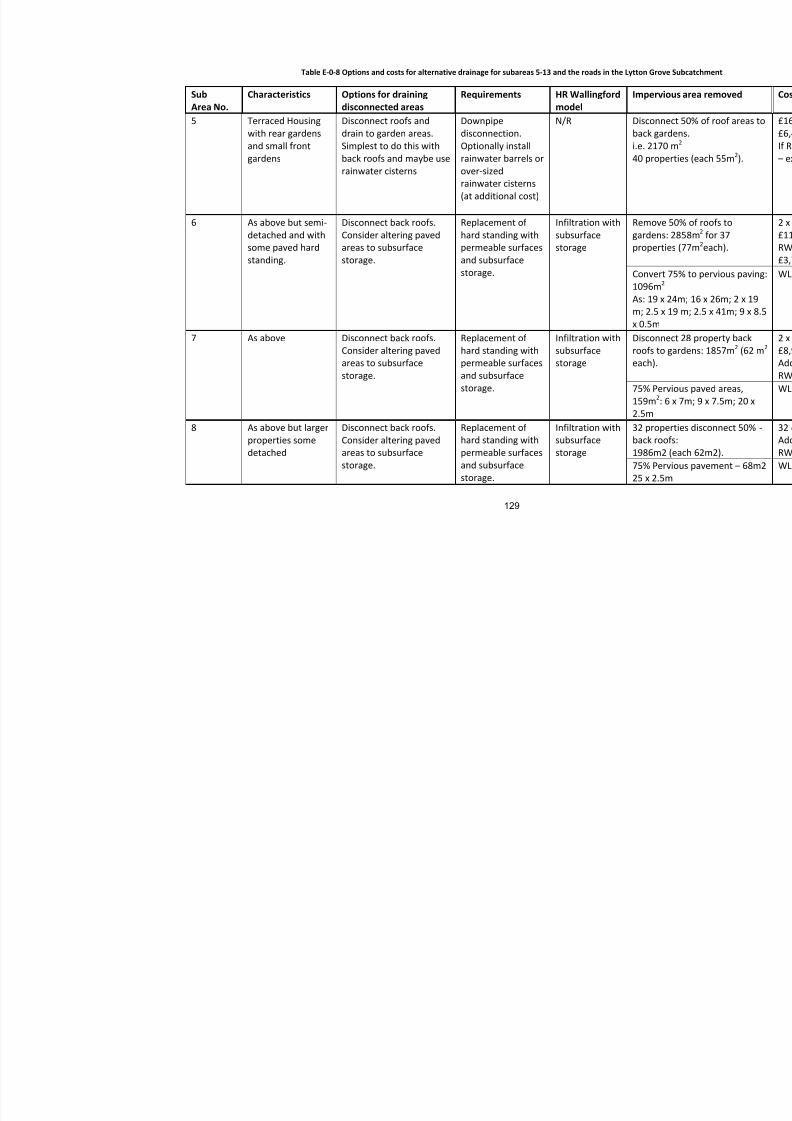
8/13/2019 Needs report: appendix E
http://slidepdf.com/reader/full/needs-report-appendix-e 140/235
129
Table E‐0‐8 Options and costs for alternative drainage for subareas 5‐13 and the roads in the Lytton Grove S
Sub Area No.
Characteristics Options for draining disconnected areas
Requirements HR Wallingford model
Impervious
5 Terraced Housing
with rear
gardens
and small front
gardens
Disconnect roofs and
drain to
garden
areas.
Simplest to do this with
back roofs and maybe use
rainwater cisterns
Downpipe
disconnection.
Optionally install
rainwater barrels or
over ‐sized
rainwater cisterns
(at additional cost)
N/R Disconnect
back gardei.e. 2170 m
40 properti
6 As above but semi ‐
detached and with
some paved hard
standing.
Disconnect back roofs.
Consider altering paved
areas to subsurface
storage.
Replacement of hard standing with
permeable surfaces
and subsurface
storage.
Infiltration with
subsurface
storage
Remove 50gardens: 2properties
Convert 751096m 2
As: 19 x 24m; 2.5 x 19x 0.5m
7 As above Disconnect back roofs.
Consider altering paved
areas to subsurface
storage.
Replacement of hard standing with
permeable surfaces
and subsurface
storage.
Infiltration with
subsurface
storage
Disconnectroofs to gaeach).
75% Pervio159m 2: 6 x
2.5m 8 As above but larger
properties some
detached
Disconnect back roofs.
Consider altering paved
areas to subsurface
storage.
Replacement of hard standing with
permeable surfaces
and subsurface
storage.
Infiltration with
subsurface
storage
32 propertiback roofs1986m2 (e75% Pervio25 x 2.5m

8/13/2019 Needs report: appendix E
http://slidepdf.com/reader/full/needs-report-appendix-e 141/235
Sub Area No.
Characteristics Options for draining disconnected areas
Requirements HR Wallingford model
Impervious
9 Separate property
with limited land to
disconnect to.
Disconnect back roofs.
Consider altering paved
areas to subsurface
storage. Partial disconnection only
for this one property.
Replacement of hard standing with
permeable surfaces
and subsurface storage.
Infiltration with
subsurface
storage
50% of one321m 2.
50% of roostanding. 375% Permeplus the abarea into:
x 4m; 15 x10 Mixed large
residential
properties and
institutional.
Institutional properties
replace hard standing
with permeable
pavement draining to
subsurface storage.
Connect roof drainage
also.
Permeable paving
and subsurface
storage for
institutional
properties.
Disconnect roofs of private houses to
gardens.
Infiltration with
subsurface
storage
16 buildingwhole of r7478m 2.
Convert 75pervious: 515m; 45 x
52 x 38m;
x 11m; 80
2m
11 Terraced Housing
with rear gardens
and small front
gardens
Disconnect to rear
gardens only and
consider cisterns
Downpipe
disconnection.
Consider Installing
over ‐sized
rainwater barrels
(cisterns)
Permeable paved
areas
Infiltration with
subsurface
storage
Disconnectgardens. 5
Make 75%permeable:37 x 3m; 23m; 6 x 6m
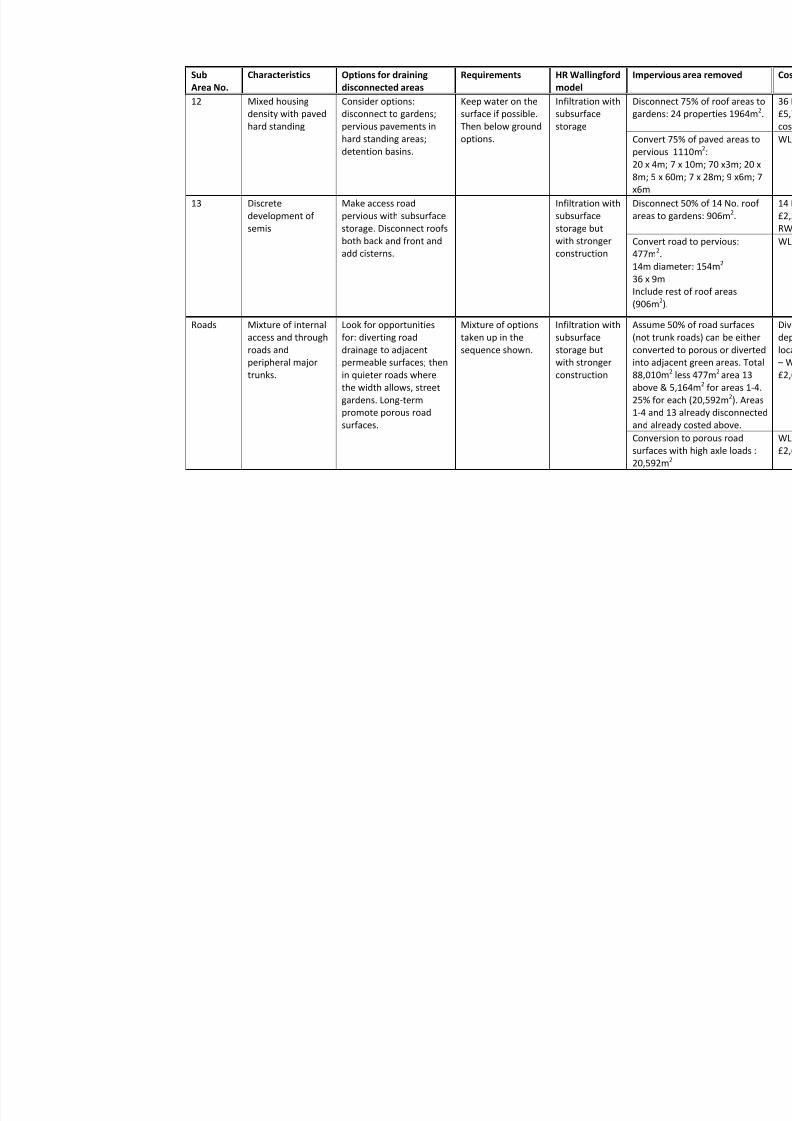
8/13/2019 Needs report: appendix E
http://slidepdf.com/reader/full/needs-report-appendix-e 142/235
Sub Area No.
Characteristics Options for draining disconnected areas
Requirements HR Wallingford model
Impervious
12 Mixed housing
density with paved
hard standing
Consider options:
disconnect to gardens;
pervious pavements in
hard standing areas; detention basins.
Keep water on the
surface if possible.
Then below ground
options.
Infiltration with
subsurface
storage
Disconnectgardens: 2
Convert 75pervious 120 x 4m; 78m; 5 x 60x6m
13 Discrete
development of semis
Make access road
pervious with subsurface
storage. Disconnect roofs
both back and front and
add cisterns.
Infiltration with
subsurface
storage but
with stronger
construction
Disconnectareas to ga
Convert ro477m 2. 14m diame36 x 9m
Include res(906m 2).
Roads Mixture of internal
access and through
roads and
peripheral major
trunks.
Look for opportunities
for: diverting road
drainage to adjacent
permeable surfaces; then
in quieter roads where
the width allows, street
gardens. Long‐term
promote porous road surfaces.
Mixture of options
taken up in the
sequence shown.
Infiltration with
subsurface
storage but
with stronger
construction
Assume 50(not trunkconvertedinto adjace88,010m 2
above & 525% for ea
1‐4 and 13and alreadyConversionsurfaces w20,592m 2
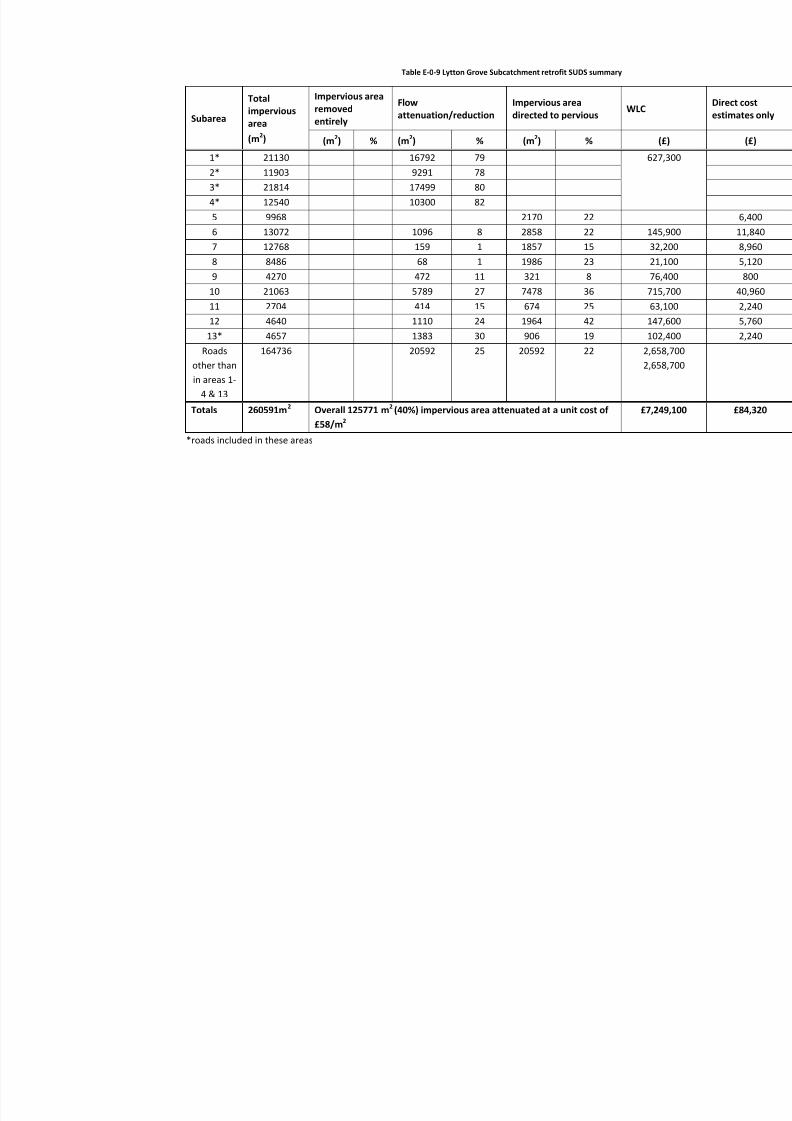
8/13/2019 Needs report: appendix E
http://slidepdf.com/reader/full/needs-report-appendix-e 143/235
Table E‐0‐9 Lytton Grove Subcatchment retrofit SUDS summary
Subarea
Total impervious area
(m 2)
Impervious area removed entirely
Flow attenuation/reduction
Impervious area directed to pervious WLC
(m 2) % (m 2) % (m 2) % (£) 1* 21130 16792 79 627,3002* 11903 9291 78
3* 21814 17499 80
4* 12540 10300 82
5 9968 2170 22
6 13072 1096 8 2858 22 145,9007 12768 159 1 1857 15 32,2008 8486 68 1 1986 23 21,100
9 4270 472 11 321 8 76,40010 21063 5789 27 7478 36 715,70011 2704 414 15 674 25 63,10012 4640 1110 24 1964 42 147,600
13* 4657 1383 30 906 19 102,400Roads
other than
in areas 1‐
4 & 13
164736 20592 25 20592 22 2,658,702,658,70
Totals
260591m2
Overall 125771
m
2
(40%) impervious
area
attenuated
at
a unit
cost
of
£58/m 2 £7,249,10
*roads included in these areas
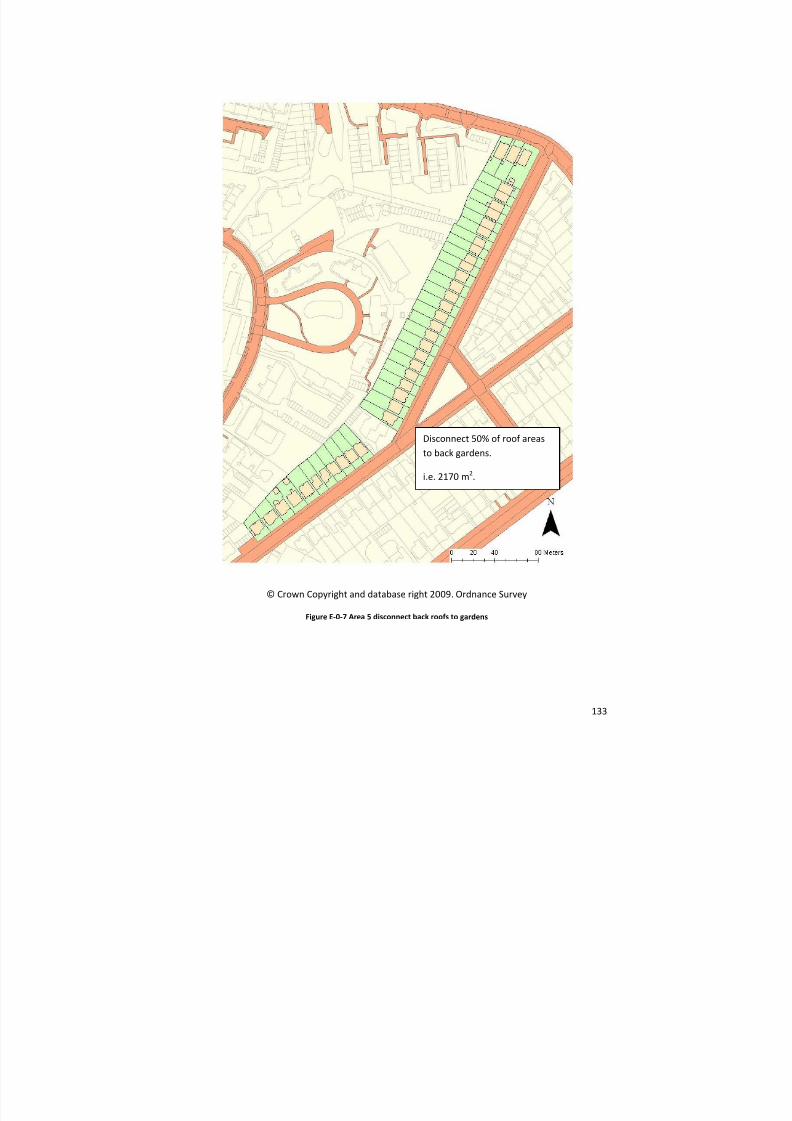
8/13/2019 Needs report: appendix E
http://slidepdf.com/reader/full/needs-report-appendix-e 144/235
133
© Crown Copyright and database right 2009. Ordnance Survey
Figure E‐0‐7 Area 5 disconnect back roofs to gardens
Disconnect 50% of roof areas
to back gardens.
i.e. 2170 m2.
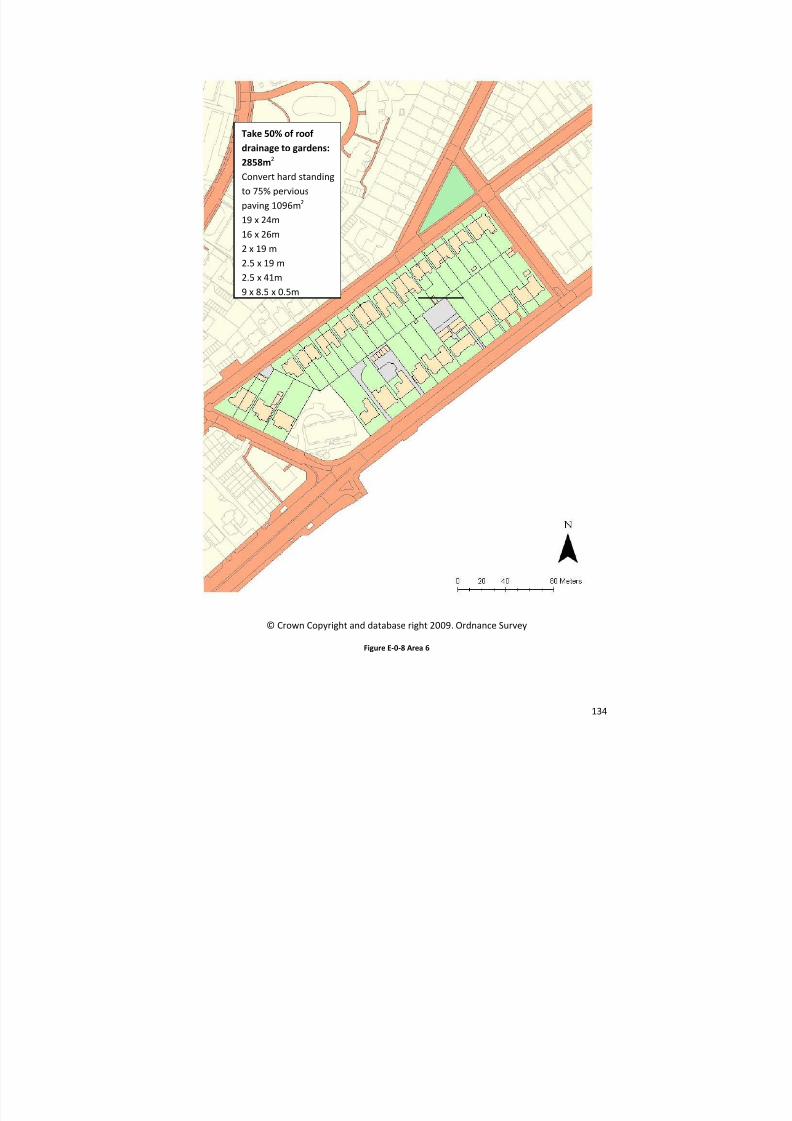
8/13/2019 Needs report: appendix E
http://slidepdf.com/reader/full/needs-report-appendix-e 145/235
134
© Crown Copyright and database right 2009. Ordnance Survey
Figure E‐0‐8 Area 6
Take 50%
of
roof
drainage to gardens: 2858m 2
Convert hard standing
to 75% pervious
paving 1096m 2
19 x 24m
16 x 26m
2 x 19 m
2.5 x 19 m
2.5 x 41m 9 x 8.5 x 0.5m
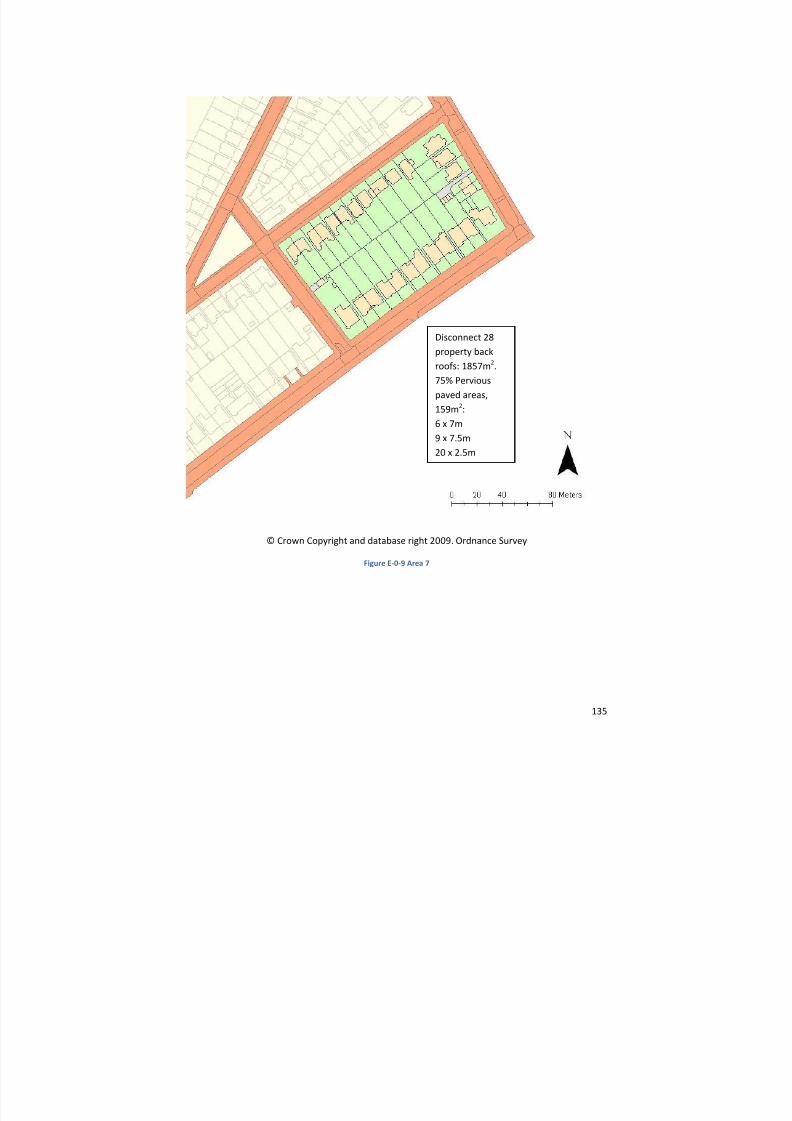
8/13/2019 Needs report: appendix E
http://slidepdf.com/reader/full/needs-report-appendix-e 146/235
135
© Crown Copyright and database right 2009. Ordnance Survey
Figure E‐0‐9 Area 7
Disconnect 28
property back
roofs: 1857m 2.
75% Pervious
paved areas,
159m 2:
6 x 7m
9 x 7.5m
20 x 2.5m
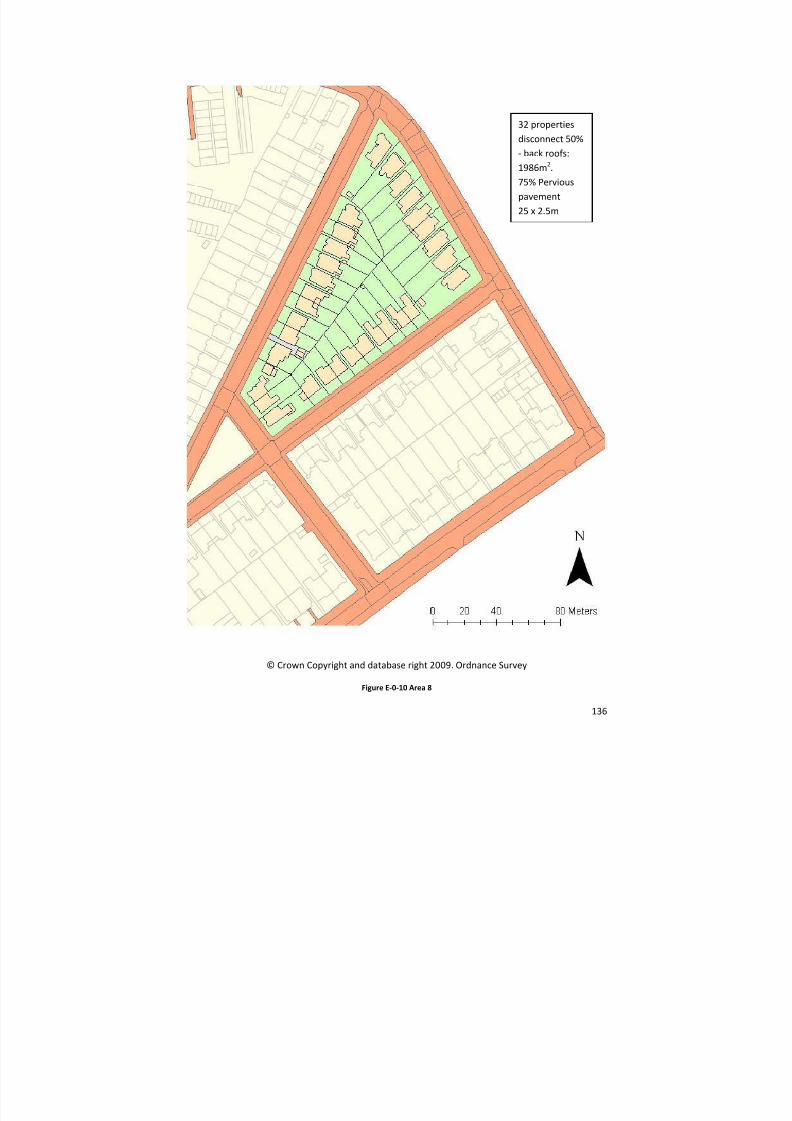
8/13/2019 Needs report: appendix E
http://slidepdf.com/reader/full/needs-report-appendix-e 147/235
136
© Crown Copyright and database right 2009. Ordnance Survey
Figure E‐0‐10 Area 8
32 properties
disconnect 50% ‐ back roofs:
1986m 2.
75% Pervious
pavement
25 x 2.5m
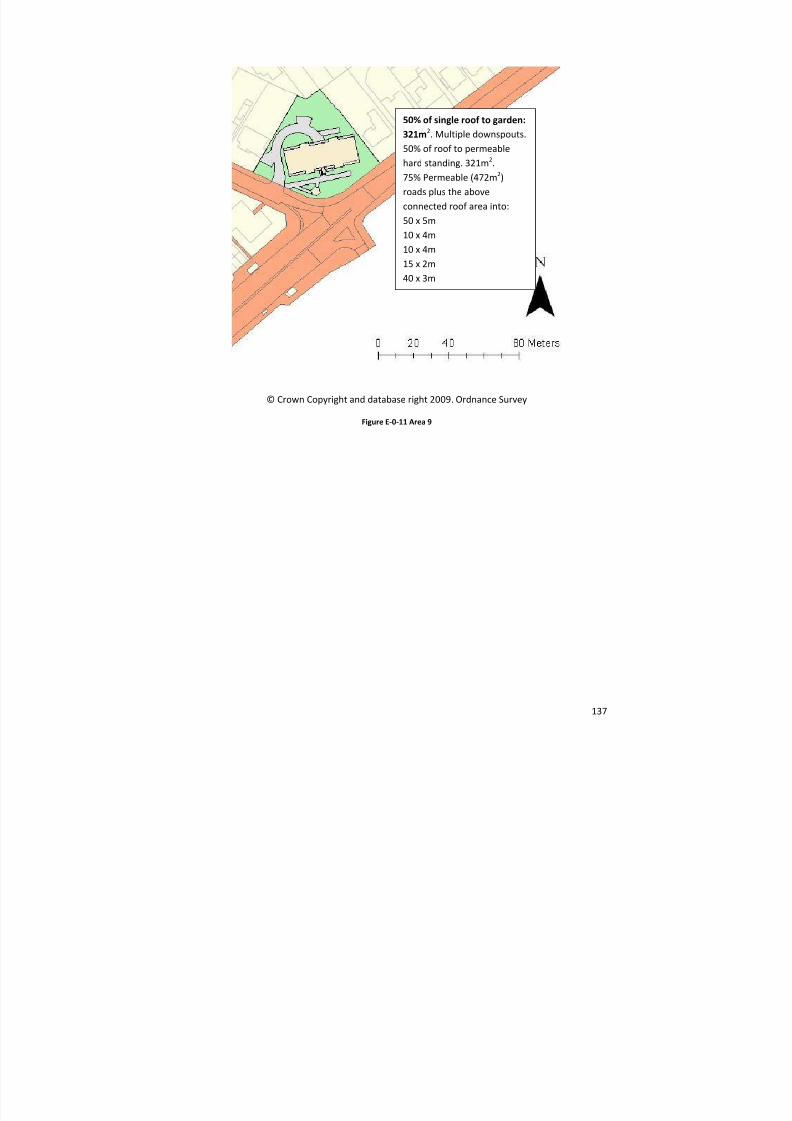
8/13/2019 Needs report: appendix E
http://slidepdf.com/reader/full/needs-report-appendix-e 148/235
137
© Crown Copyright and database right 2009. Ordnance Survey
Figure E‐0‐11 Area 9
50% of single roof to garden:
321m2
. Multiple
downspouts.
50% of roof to permeable
hard standing. 321m 2.
75% Permeable (472m 2)
roads plus the above
connected roof area into:
50 x 5m
10 x 4m
10 x 4m
15 x 2m
40 x 3m
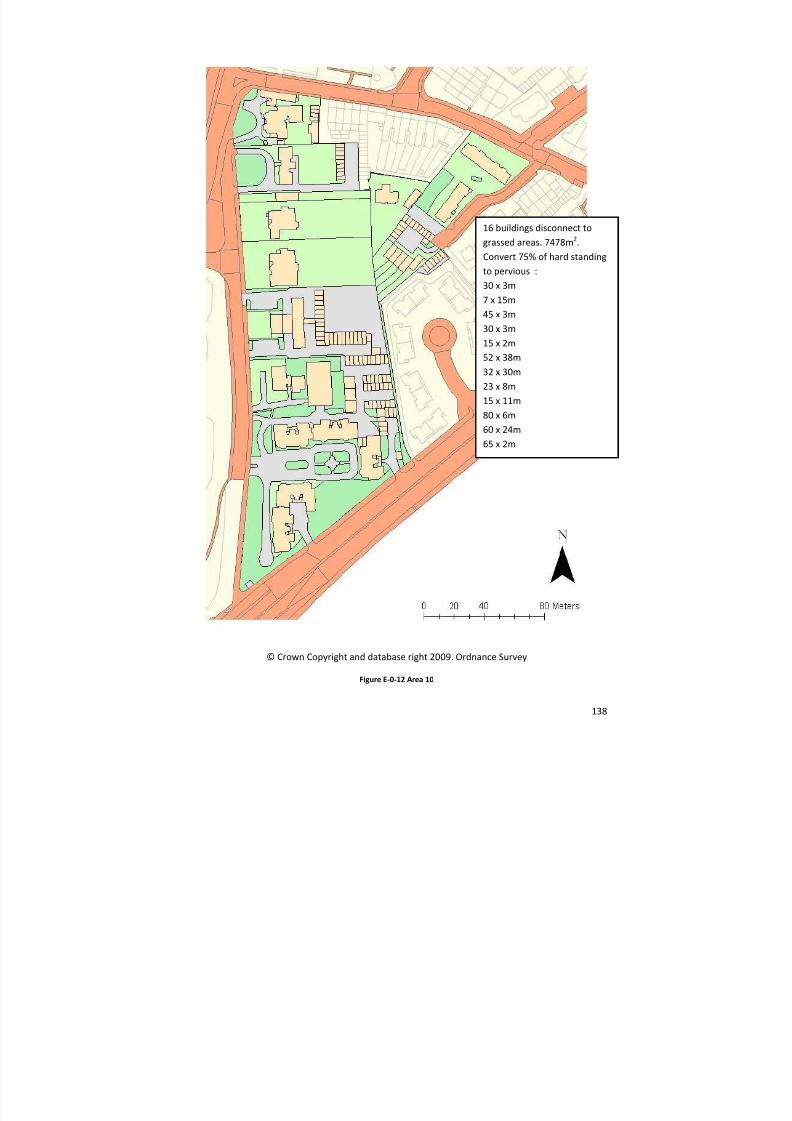
8/13/2019 Needs report: appendix E
http://slidepdf.com/reader/full/needs-report-appendix-e 149/235
138
© Crown Copyright and database right 2009. Ordnance Survey
Figure E‐0‐12 Area 10
16 buildings disconnect to
grassed areas. 7478m 2.
Convert 75% of hard standing
to pervious :
30 x 3m
7 x 15m
45 x 3m
30 x 3m
15 x 2m
52 x 38m
32 x 30m
23 x 8m
15 x 11m
80 x 6m 60 x 24m
65 x 2m
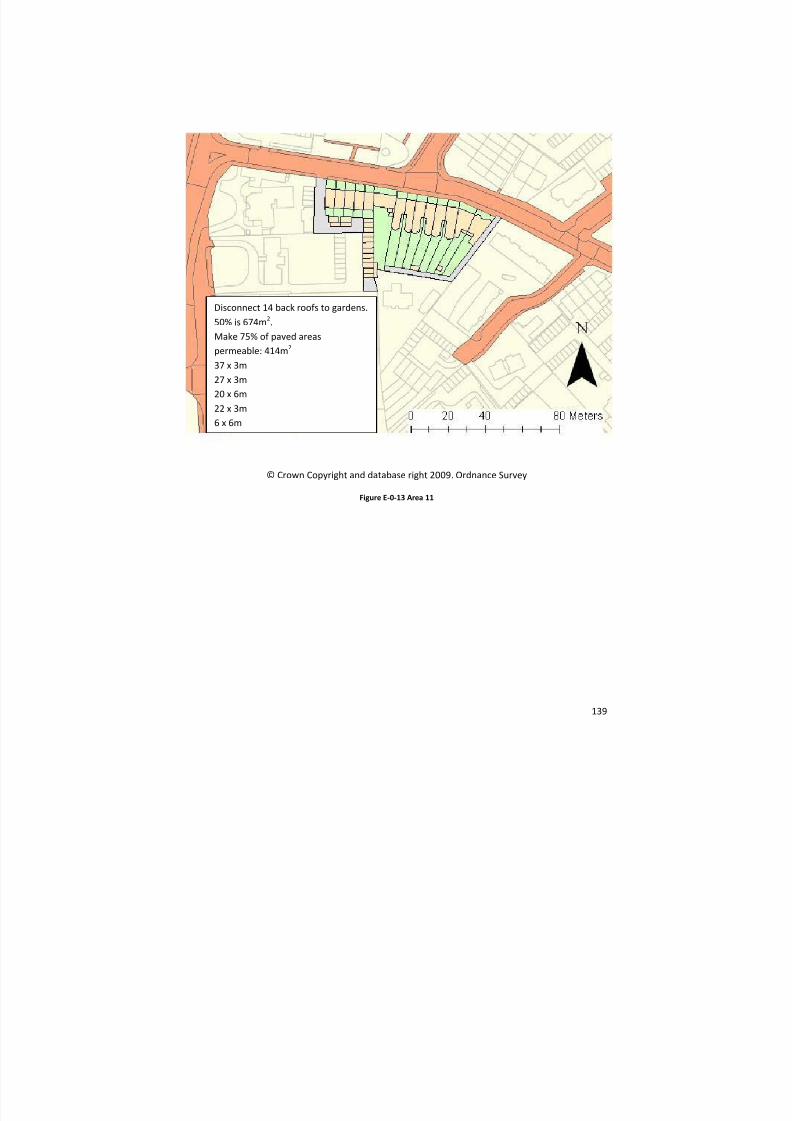
8/13/2019 Needs report: appendix E
http://slidepdf.com/reader/full/needs-report-appendix-e 150/235
139
© Crown Copyright and database right 2009. Ordnance Survey
Figure E‐0‐13 Area 11
Disconnect 14 back roofs to gardens.
50% is 674m 2.
Make 75% of paved areas
permeable: 414m 2
37 x 3m
27 x 3m
20 x 6m
22 x 3m
6 x 6m
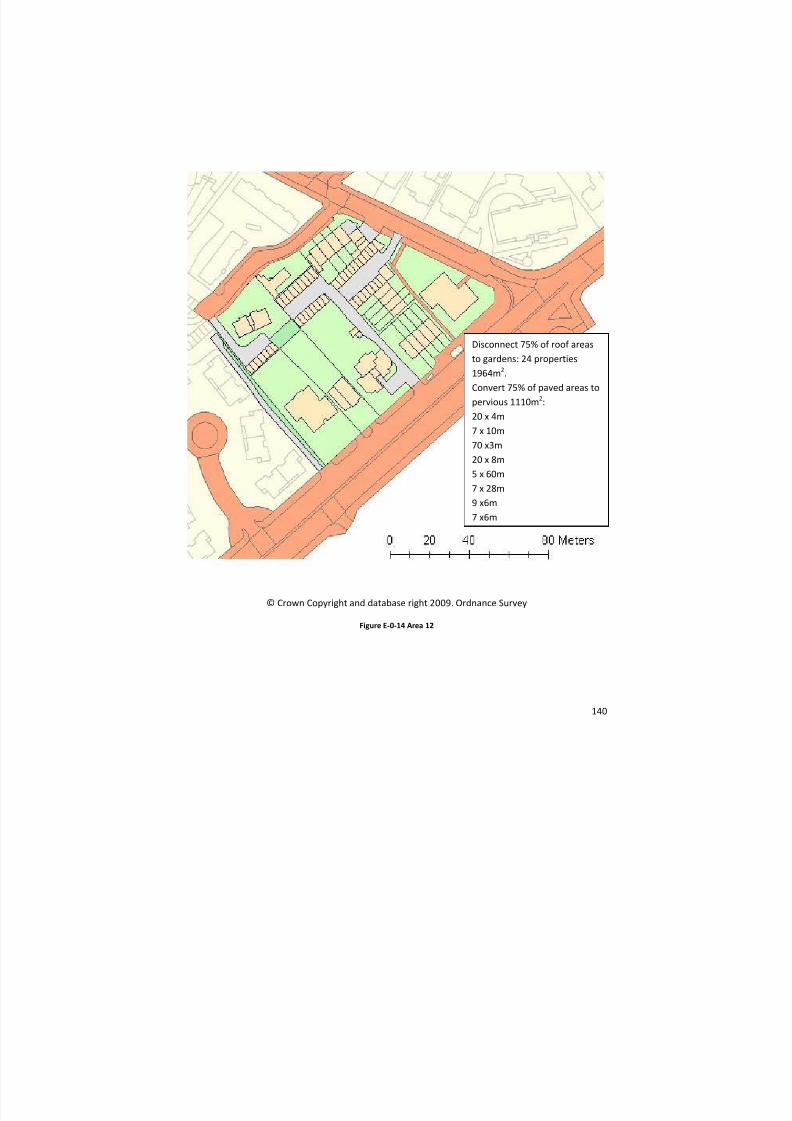
8/13/2019 Needs report: appendix E
http://slidepdf.com/reader/full/needs-report-appendix-e 151/235
140
© Crown Copyright and database right 2009. Ordnance Survey
Figure E‐0‐14 Area 12
Disconnect 75% of roof areas
to gardens: 24 properties
1964m 2.
Convert 75% of paved areas to
pervious 1110m 2:
20 x 4m 7 x 10m
70 x3m
20 x 8m
5 x 60m
7 x 28m
9 x6m
7 x6m
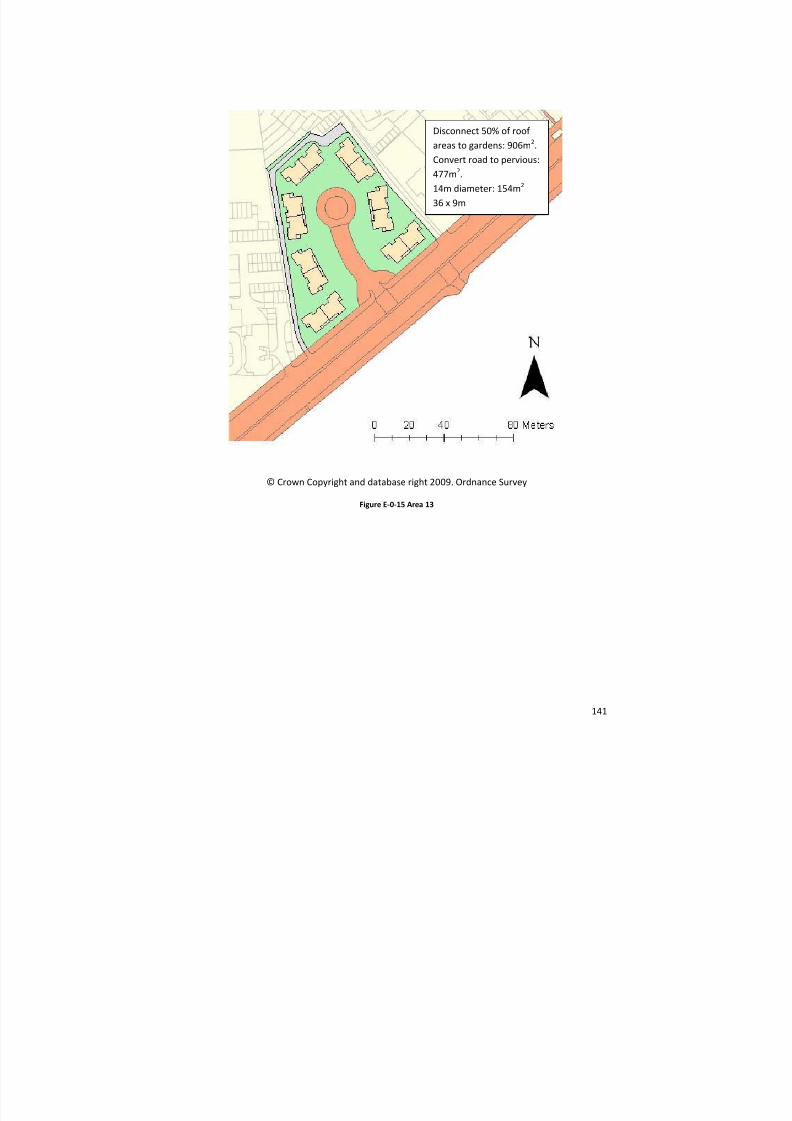
8/13/2019 Needs report: appendix E
http://slidepdf.com/reader/full/needs-report-appendix-e 152/235
141
© Crown Copyright and database right 2009. Ordnance Survey
Figure E‐0‐15 Area 13
Disconnect 50% of roof
areas to gardens: 906m 2.
Convert road to pervious:
477m 2.
14m diameter: 154m 2
36 x 9m
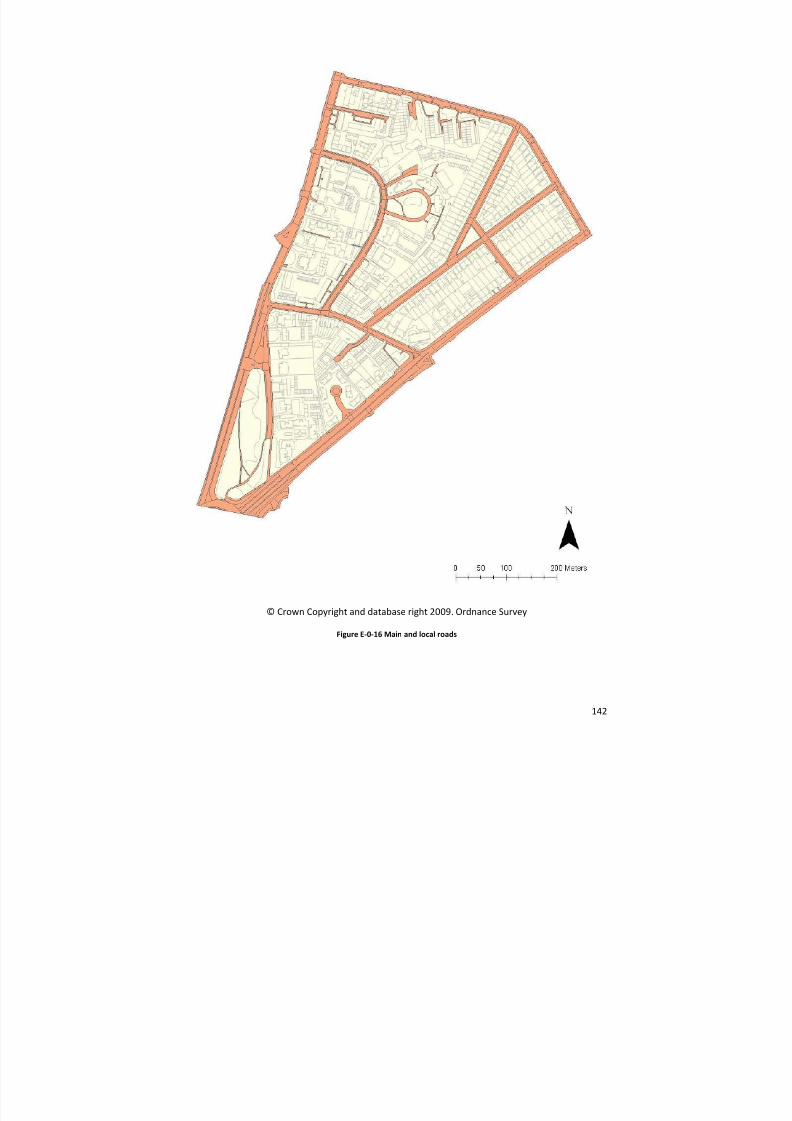
8/13/2019 Needs report: appendix E
http://slidepdf.com/reader/full/needs-report-appendix-e 153/235
142
© Crown Copyright and database right 2009. Ordnance Survey
Figure E‐0‐16 Main and local roads
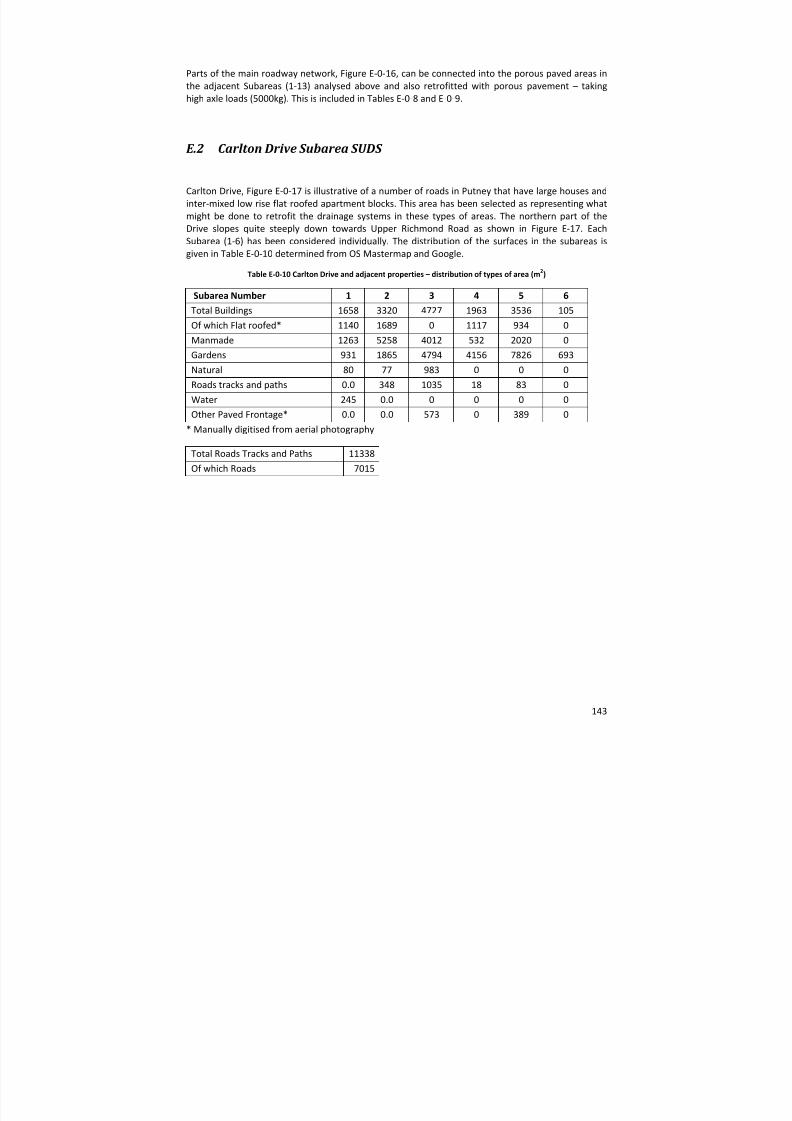
8/13/2019 Needs report: appendix E
http://slidepdf.com/reader/full/needs-report-appendix-e 154/235
143
Parts of the main roadway network, Figure E‐0‐16, can be connected into the porous paved areas in
the adjacent Subareas (1‐13) analysed above and also retrofitted with porous pavement – taking
high axle loads (5000kg). This is included in Tables E‐0‐8 and E‐0‐9.
E.2 Carlton Drive Subarea SUDS
Carlton Drive, Figure E‐0‐17 is illustrative of a number of roads in Putney that have large houses and
inter ‐mixed low rise flat ‐roofed apartment blocks. This area has been selected as representing what
might be done to retrofit the drainage systems in these types of areas. The northern part of the
Drive slopes quite steeply down towards Upper Richmond Road as shown in Figure E‐17. Each
Subarea (1‐6) has been considered individually. The distribution of the surfaces in the subareas is
given in Table E‐0‐10 determined from OS Mastermap and Google.
Table E‐0‐10
Carlton
Drive
and
adjacent
properties
–
distribution
of
types
of
area
(m
2
)
Subarea Number 1 2 3 4 5 6
Total Buildings 1658 3320 4727 1963 3536 105
Of which Flat roofed* 1140 1689 0 1117 934 0
Manmade 1263 5258 4012 532 2020 0
Gardens 931 1865 4794 4156 7826 693
Natural 80 77 983 0 0 0
Roads tracks and paths 0.0 348 1035 18 83 0
Water 245 0.0 0 0 0 0
Other Paved Frontage* 0.0 0.0 573 0 389 0 * Manually digitised from aerial photography
Total Roads Tracks and Paths 11338Of which Roads 7015
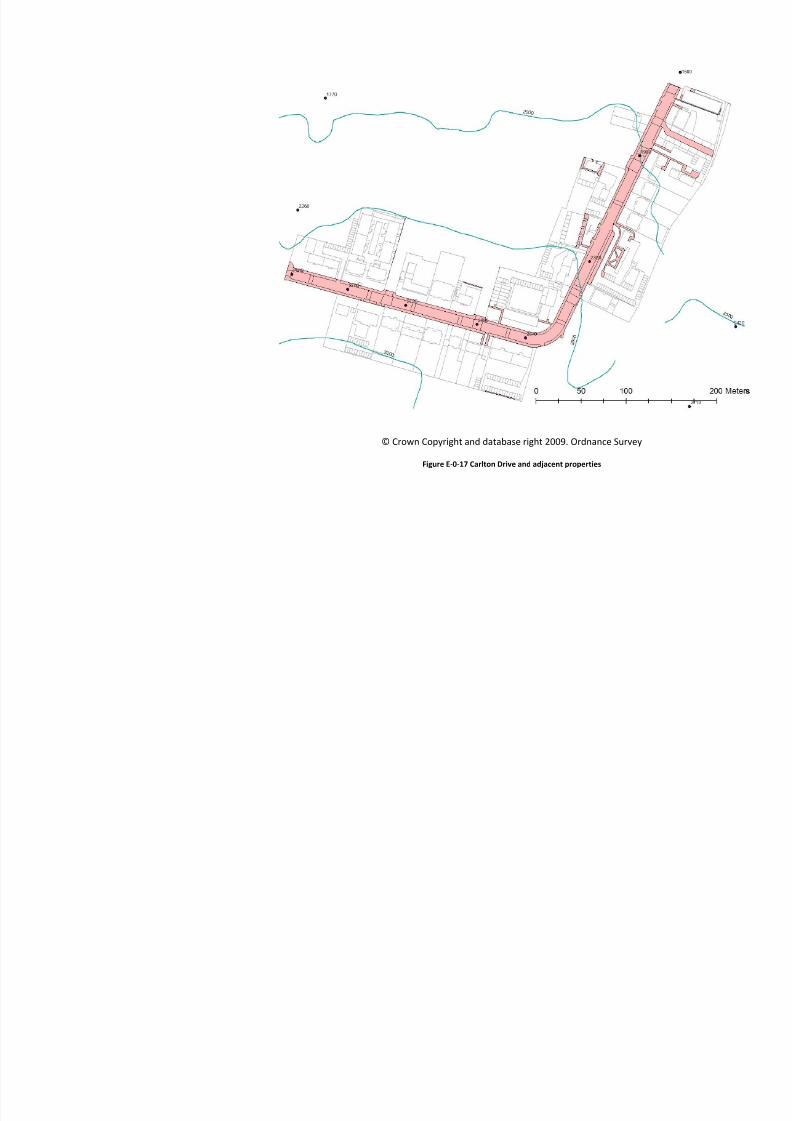
8/13/2019 Needs report: appendix E
http://slidepdf.com/reader/full/needs-report-appendix-e 155/235
© Crown Copyright and database right 2009. Ordnance Survey
Figure E‐0‐17 Carlton Drive and adjacent properties
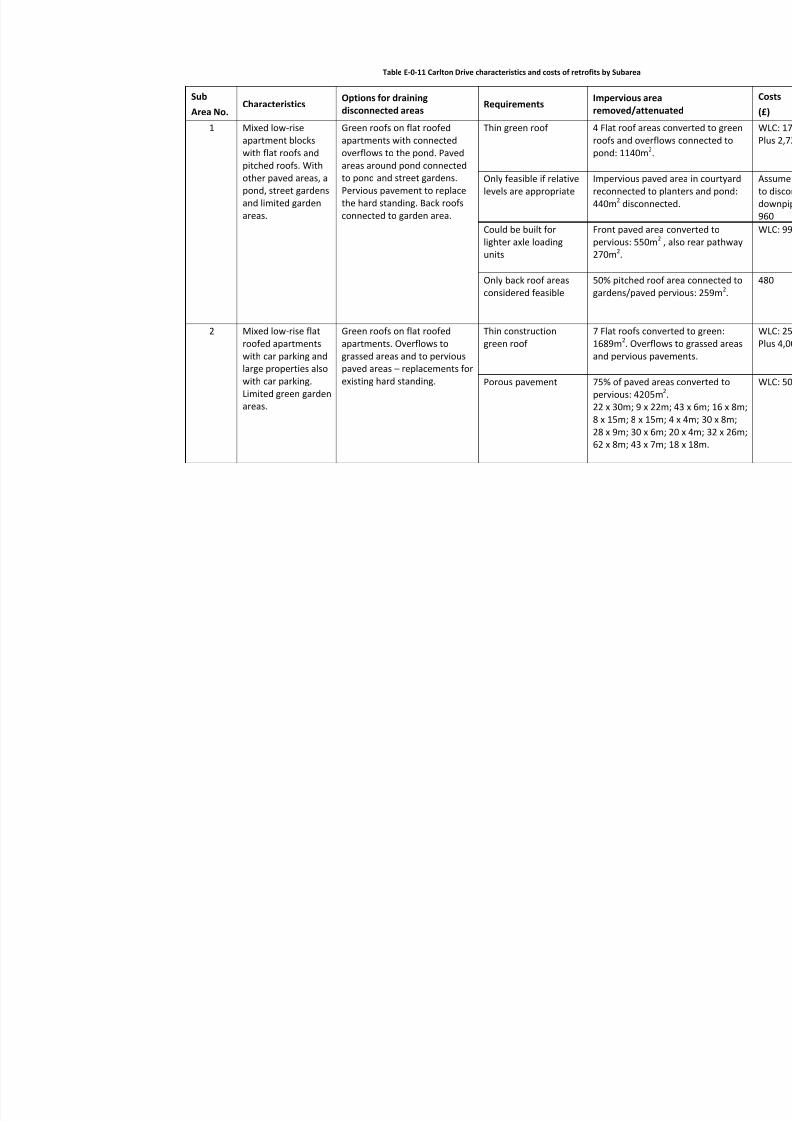
8/13/2019 Needs report: appendix E
http://slidepdf.com/reader/full/needs-report-appendix-e 156/235
Table E‐0‐11 Carlton Drive characteristics and costs of retrofits by Subarea
Sub
Area No. Characteristics Options for draining
disconnected areas Requirements Impervious area removed/attenuated
1 Mixed low ‐rise
apartment blocks with flat roofs and
pitched roofs. With
other paved areas, a
pond, street gardens
and limited garden
areas.
Green roofs on flat roofed
apartments with connected overflows to the pond. Paved
areas around pond connected
to pond and street gardens.
Pervious pavement to replace
the hard standing. Back roofs
connected to garden area.
Thin green roof 4 Flat roof areas conroofs and overflowspond: 1140m 2.
Only feasible if relative
levels are appropriate Impervious paved areconnected to plan440m 2 disconnected.
Could be built for
lighter axle loading
units
Front paved area copervious: 550m 2 , al270m 2.
Only back roof areas
considered feasible 50% pitched roof argardens/paved perv
2 Mixed low ‐rise flat
roofed apartments
with car parking and
large properties also
with car parking.
Limited green garden
areas.
Green roofs on flat roofed
apartments. Overflows to
grassed areas and to pervious
paved areas – replacements for
existing hard standing.
Thin construction
green roof 7 Flat roofs converte1689m 2. Overflows
and pervious pavem
Porous pavement 75% of paved areaspervious: 4205m 2. 22 x 30m; 9 x 22m;
8 x 15m; 8 x 15m; 4
28 x 9m; 30 x 6m; 2062 x 8m; 43 x 7m; 18

8/13/2019 Needs report: appendix E
http://slidepdf.com/reader/full/needs-report-appendix-e 157/235
Sub
Area No. Characteristics Options for draining
disconnected areas Requirements Impervious area removed/attenuated
3 Mixed properties
including residential
and institutional.
Significant
proportion of paved
surfaces for the
latter and drives for
some of the former
Disconnect half of the pitched
roofs to garden areas. Convert
hard standing
to
pervious.
36 individual
downpipes 50% of pitched roof drained to gardens
paved areas:
2364m
Porous pavement 75% of paved areaspervious: 4215m 2: 228m; 55 x 5m; 35 x
8m; 45 x 8m; 66 x 27m.
4 Several flat roofed
apartment blocks. Significant green
spaces surrounding.
One large property.
Some hard standing.
Use green roofs on
apartments, with overflows to grassed areas. Replace hard
standing with pervious
pavement. Additional paved
areas drained to adjacent
grass.
Thin construction Convert 6 flat roofs
1117m2
with overflo
14 downpipes 50% of 1 pitched roo423m 2.
Porous pavement 75% of paved area cpervious 298m 2: 2 x5m; 19 x 3m; 9 x 6m
Direct connection assuming ground levels
are appropriate
25% of paved area dadjacent gardens: 1

8/13/2019 Needs report: appendix E
http://slidepdf.com/reader/full/needs-report-appendix-e 158/235
Sub
Area No. Characteristics Options for draining
disconnected areas Requirements Impervious area removed/attenuated
5 Flat roofed
apartments, several
pitched roof
properties. Some
driveways and
significant green
space.
Use green roofs on
apartments, with overflows to
grassed areas.
Replace
hard
standing with pervious
pavement. Additional paved
areas drained to adjacent
grass.
Thin construction 3 flat roofs made groverflows to gardens
20 downpipes 50% of 7 pitched roogardens: 1301 m2.
Porous pavement 75% of paved areas1869m 2: 22 x 6m; 8
4 x 9m; 15 x 6m; 12
x 10m; 18 x 38m; 359 downpipes 25% of paved areas
adjacent gardens: 6
6 Two pitched roof properties. With
large grassed areas
to rear.
Disconnect rear half of the roof drainage. Any paved areas not
seen in Mastermap can drain
to green areas.
1 downpipe Disconnect 50% of 2gardens: 53 m2.
Roads Flat west ‐east but
with a gradient for
south ‐north leg
running down to
main road
Pocket rain gardens also useful
for traffic calming. Road wide enough and
has no speed bumps at
present
Disconnect 7015 m2
drainage and replacebumps with a minim12m 2 pocket rain ga

8/13/2019 Needs report: appendix E
http://slidepdf.com/reader/full/needs-report-appendix-e 159/235
Table E‐0‐12 Summary of Carlton Drive costs of retrofits by Subarea
Subarea
Total impervious area
(m2
)
Impervious area removed entirely
Flow attenuation/reduction
Impervious area directed to pervious WLC
(m2
) % (m2
) % (m2
) % (£) 1 3399 1580 46 830 24 259 8 270,200
2 9522 1689 18 4205 44 762,200
3 11283 4215 37 2364 21 510,000
4 4573 1117 24 298 7 561 12 203,600
5 9469 934 10 1869 20 623 7 366,200
6 452 395 87
Roads and
tracks
11138 7015 63 1,578,400
Overall impervious
area
attenuated
27954
(56%)
–
unit
cost
£133/m
2
3,690,600

8/13/2019 Needs report: appendix E
http://slidepdf.com/reader/full/needs-report-appendix-e 160/235
149
© Crown Copyright and database right 2009. Ordnance Survey
Figure E‐ 0‐18 Carlton Drive Area 1
4 Flat roof areas converted to
green roofs and overflows
connected to pond: 1140m 2.
Paved area
in
courtyard
connected to planters and pond:
440m 2 disconnected.
Front paved area to pervious:
550m 2 also rear pathway 270m 2.
50% pitched roof area
connected to gardens: 259m 2.
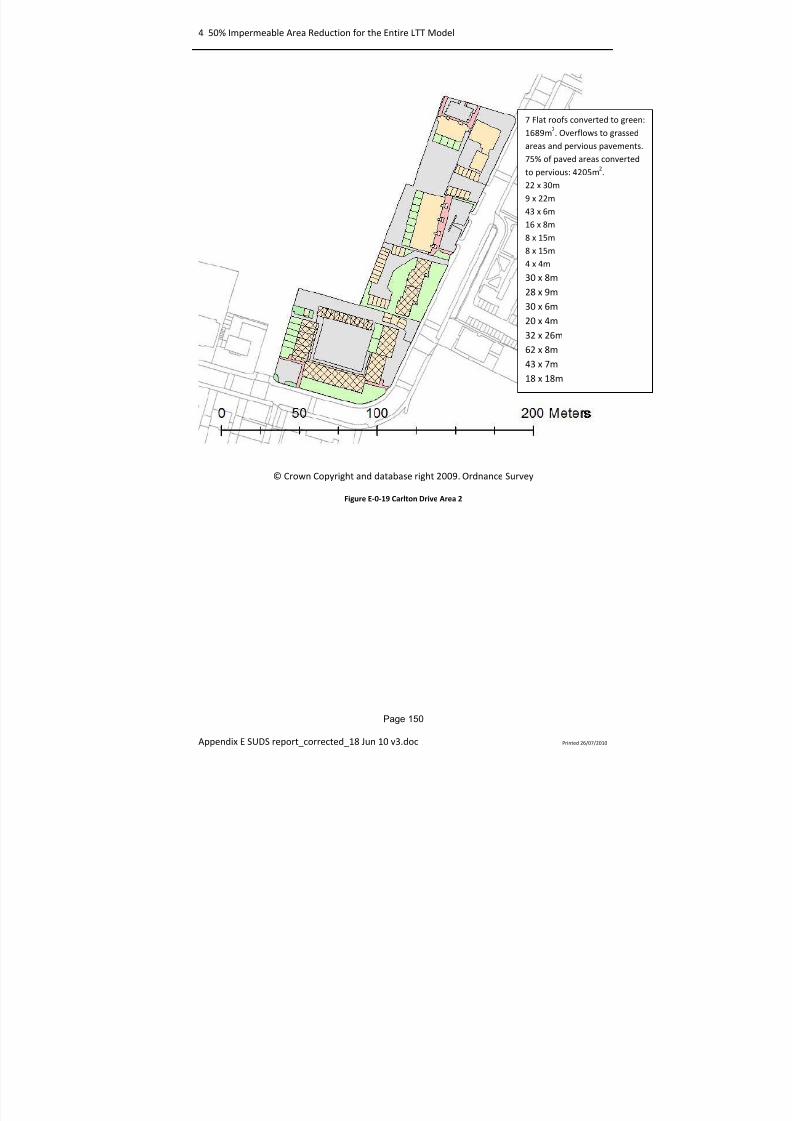
8/13/2019 Needs report: appendix E
http://slidepdf.com/reader/full/needs-report-appendix-e 161/235
4 50% Impermeable Area Reduction for the Entire LTT Model
Page 150
Appendix E SUDS report_corrected_18 Jun 10 v3.doc Printed 26/07/2010
© Crown Copyright and database right 2009. Ordnance Survey
Figure E‐0‐19 Carlton Drive Area 2
7 Flat roofs converted to green:
1689m 2. Overflows to grassed
areas and pervious pavements.
75% of paved areas converted
to pervious: 4205m 2. 22 x 30m
9 x 22m
43 x 6m
16 x 8m
8 x 15m
8 x 15m
4 x 4m
30 x 8m 28 x 9m
30 x 6m
20 x 4m
32 x 26m
62 x 8m
43 x 7m
18 x 18m
8/13/2019 Needs report: appendix E
http://slidepdf.com/reader/full/needs-report-appendix-e 162/235
4 50% Impermeable Area Reduction for the Entire LTT Model
Page 151
Appendix E SUDS report_corrected_18 Jun 10 v3.doc Printed 26/07/2010
© Crown Copyright and database right 2009. Ordnance Survey
Figure E‐0‐20 Carlton Drive Area 3
50% of pitched roof buildings drained to
gardens or pervious paved
areas: 2364m 2. 75% of paved areas
converted to pervious:
4215m 2: 26 x 5m
33 x
28m
55 x 5m
35 x 9m
15 x 4m
27x 8m
45 x 8m
66 x 22m
62 x 5m
25 x 7m
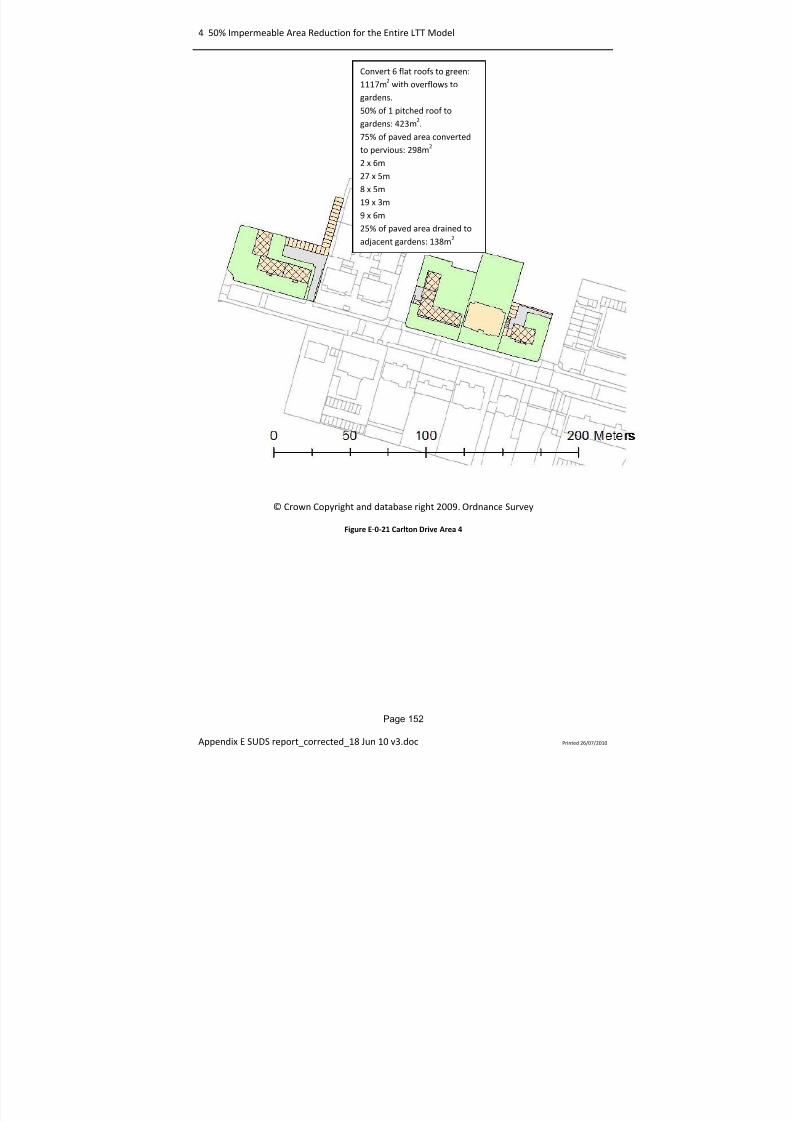
8/13/2019 Needs report: appendix E
http://slidepdf.com/reader/full/needs-report-appendix-e 163/235
4 50% Impermeable Area Reduction for the Entire LTT Model
Page 152
Appendix E SUDS report_corrected_18 Jun 10 v3.doc Printed 26/07/2010
© Crown Copyright and database right 2009. Ordnance Survey
Figure E‐0‐21 Carlton Drive Area 4
Convert 6 flat roofs to green:
1117m 2 with overflows to
gardens.
50% of 1 pitched roof to
gardens: 423m 2.
75% of paved area converted to pervious: 298m 2
2 x 6m
27 x 5m
8 x 5m
19 x 3m
9 x 6m
25% of paved area drained to
adjacent gardens: 138m 2
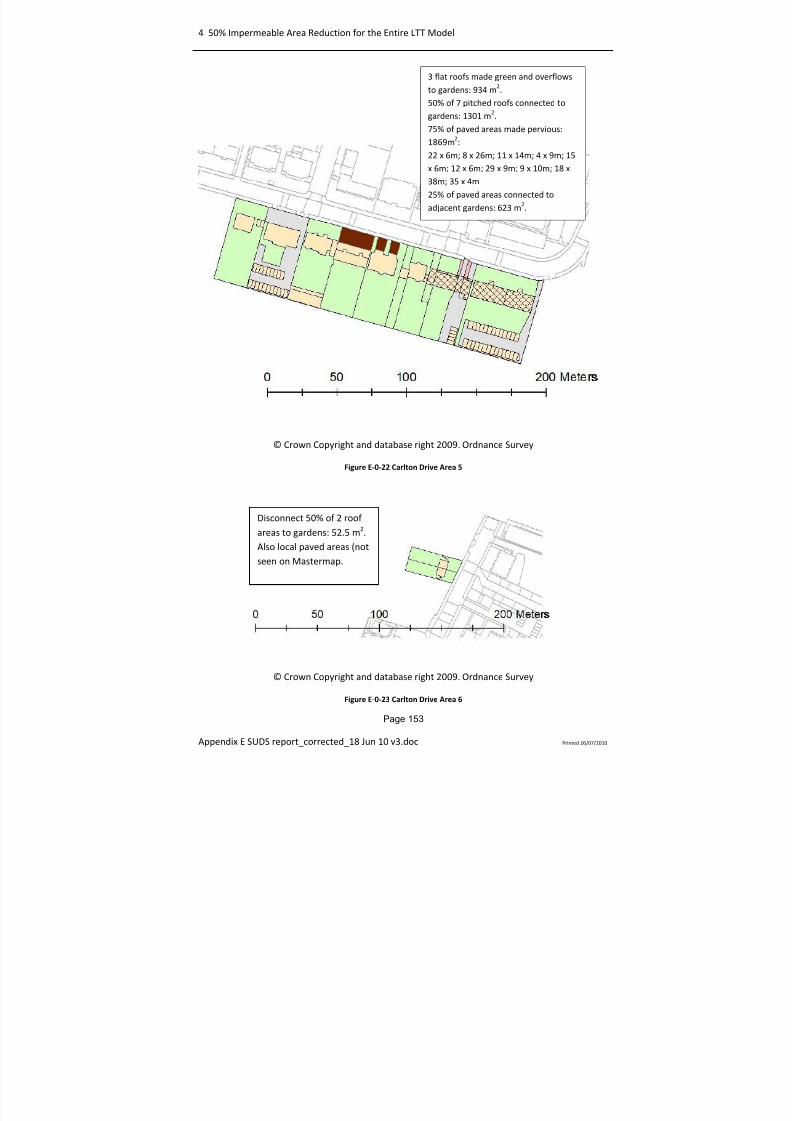
8/13/2019 Needs report: appendix E
http://slidepdf.com/reader/full/needs-report-appendix-e 164/235
4 50% Impermeable Area Reduction for the Entire LTT Model
Page 153
Appendix E SUDS report_corrected_18 Jun 10 v3.doc Printed 26/07/2010
© Crown Copyright and database right 2009. Ordnance Survey
Figure E‐0‐22 Carlton Drive Area 5
© Crown Copyright and database right 2009. Ordnance Survey
Figure E‐0‐23 Carlton Drive Area 6
3 flat roofs made green and overflows
to gardens: 934 m2. 50% of 7 pitched roofs connected to
gardens: 1301 m2. 75% of paved areas made pervious:
1869m 2: 22 x 6m; 8 x 26m; 11 x 14m; 4 x 9m; 15
x 6m; 12 x 6m; 29 x 9m; 9 x 10m; 18 x
38m; 35 x 4m
25% of paved areas connected to
adjacent gardens: 623 m2.
Disconnect 50% of 2 roof
areas to gardens: 52.5 m2. Also local paved areas (not
seen on Mastermap.
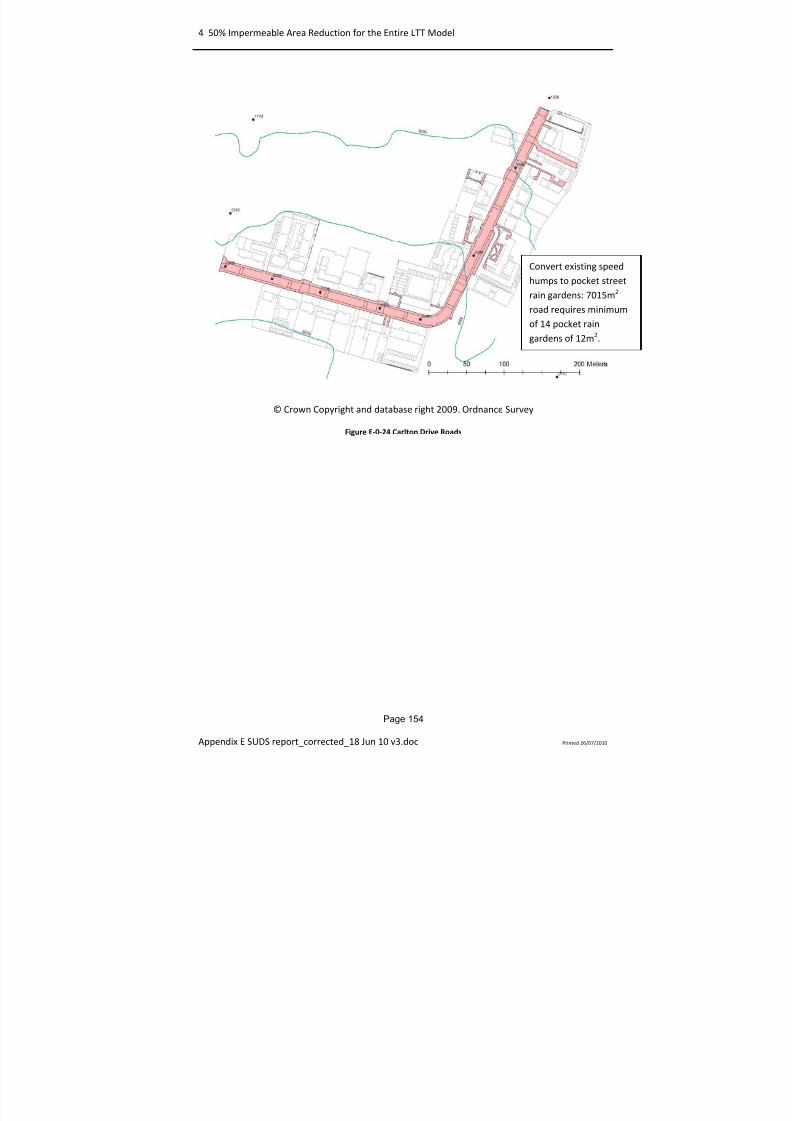
8/13/2019 Needs report: appendix E
http://slidepdf.com/reader/full/needs-report-appendix-e 165/235
4 50% Impermeable Area Reduction for the Entire LTT Model
Page 154
Appendix E SUDS report_corrected_18 Jun 10 v3.doc Printed 26/07/2010
© Crown Copyright and database right 2009. Ordnance Survey
Figure E‐0‐24 Carlton Drive Roads
Convert existing speed
humps to pocket street
rain gardens: 7015m 2
road requires minimum
of 14 pocket rain
gardens of 12m 2.
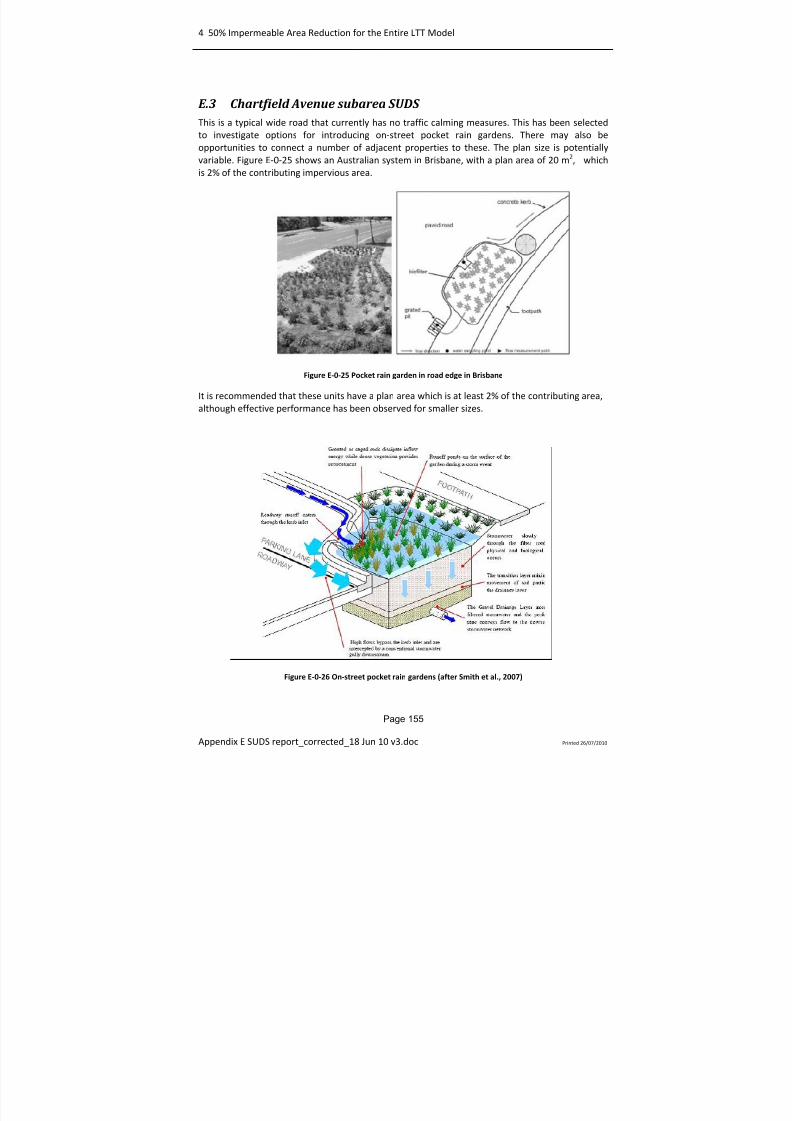
8/13/2019 Needs report: appendix E
http://slidepdf.com/reader/full/needs-report-appendix-e 166/235
4 50% Impermeable Area Reduction for the Entire LTT Model
Page 155
Appendix E SUDS report_corrected_18 Jun 10 v3.doc Printed 26/07/2010
E.3 Chartfield Avenue subarea SUDS This is a typical wide road that currently has no traffic calming measures. This has been selected
to investigate options for introducing on ‐street pocket rain gardens. There may also be opportunities to connect a number of adjacent properties to these. The plan size is potentially
variable. Figure E‐0‐25 shows an Australian system in Brisbane, with a plan area of 20 m2, which
is 2% of the contributing impervious area.
Figure E‐0‐25 Pocket rain garden in road edge in Brisbane
It is recommended that these units have a plan area which is at least 2% of the contributing area,
although effective performance has been observed for smaller sizes.
Figure E‐0‐26 On‐street pocket rain gardens (after Smith et al., 2007)
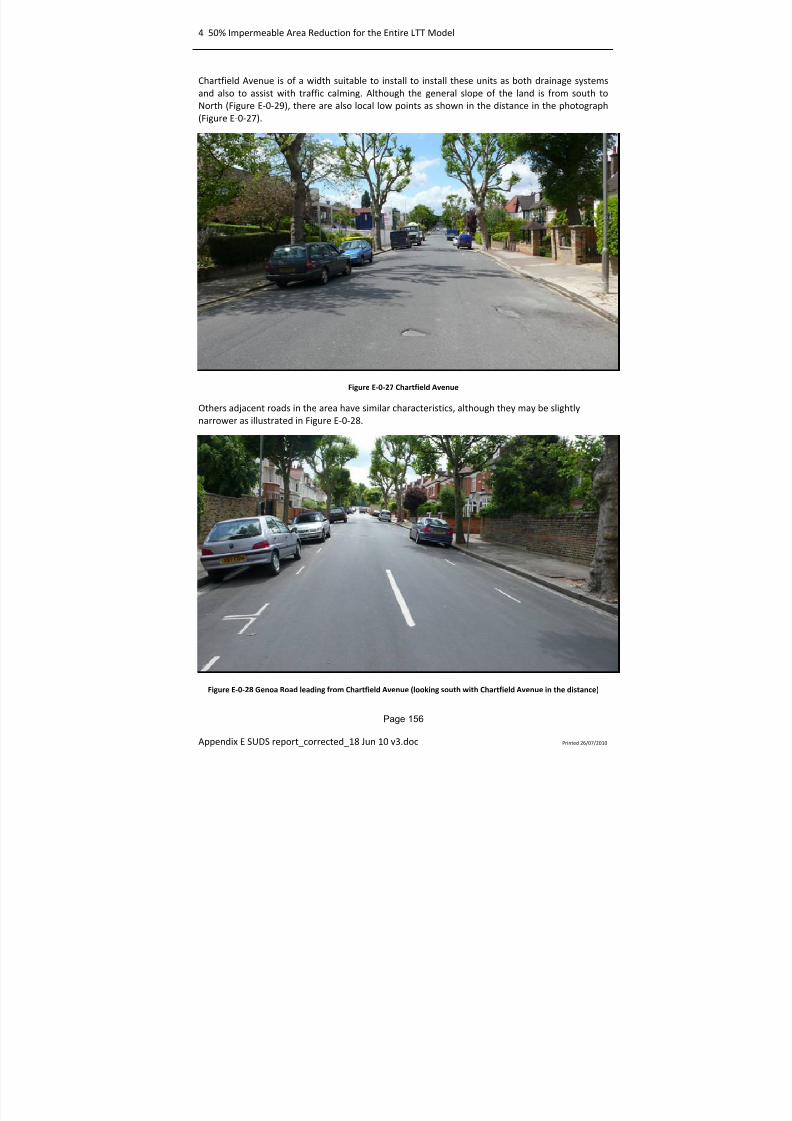
8/13/2019 Needs report: appendix E
http://slidepdf.com/reader/full/needs-report-appendix-e 167/235
4 50% Impermeable Area Reduction for the Entire LTT Model
Page 156
Appendix E SUDS report_corrected_18 Jun 10 v3.doc Printed 26/07/2010
Chartfield Avenue is of a width suitable to install to install these units as both drainage systems
and also to assist with traffic calming. Although the general slope of the land is from south to
North (Figure E‐0‐29), there are also local low points as shown in the distance in the photograph
(Figure E‐0‐27).
Figure E‐0‐27 Chartfield Avenue
Others adjacent roads in the area have similar characteristics, although they may be slightly
narrower as illustrated in Figure E‐0‐28.
Figure E‐0
‐28
Genoa
Road
leading
from
Chartfield
Avenue
(looking
south
with
Chartfield
Avenue
in
the
distance)

8/13/2019 Needs report: appendix E
http://slidepdf.com/reader/full/needs-report-appendix-e 168/235
4 50% Impermeable Area Reduction for the Entire LTT Model
Page 157
Appendix E SUDS report_corrected_18 Jun 10 v3.doc Printed 26/07/2010
Chartfield Avenue is approximately 9.6m wide and 1030m long. The total road area is 10375m 2. 2% of this is some 208m 2. For the rainfall in London, the HR Wallingford model shows that a 12m 3
unit volume is required. A stepped unit (7m long x 5m wide at the surface), gives the required
storage volume of total depth 0.9m, requires a minimum of 20 individual units located along the
length of the Avenue.
If more than this minimum number is installed, then some of the adjacent properties could also
be partly drained into them. For drainage purposes each of the units could be installed on the
northern (lowest) side of the Avenue, however, if they are considered as traffic calming measures,
then they would need to be on either, possibly opposite, sides. It may also be necessary to install
2 units at low points in the road, such as adjacent to the junction with Genoa Road. The SUDS
units and costs are given in table E‐0‐13.
Table E‐0‐13 Chartfield Avenue SUDS units and costs
Subarea Characteristics Options for draining disconnected areas
Requirements Impervious area removed
Costs (£)
Road
North side The land has a
fall from South
to North.
Pocket rain
gardens Designed as an
infiltration system
without an
impervious
membrane with
flow through of 5 l/s
drains 10375m 2
20 No. 12m 2
raingardens.
WLC: 78,400
Road
South side WLC: 78,400
Adjacent
properties
– houses
75 individual
properties in
own gardens
Disconnect
roofs to
garden areas
Disconnect back
roof drainage (50%)
to gardens
9448m 2 plus
6451 m2
Potential to
also connect
adjacent
property front
roof and drive
drainage to
rain gardens
in some
locations
39,100
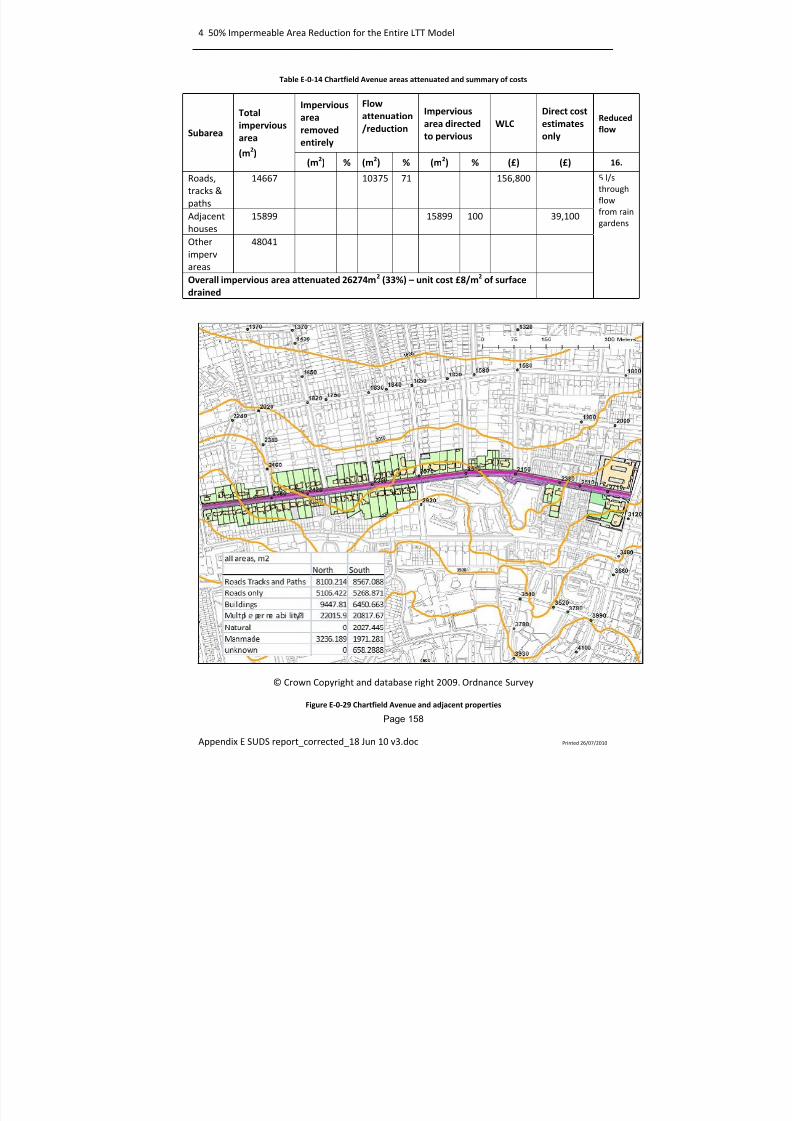
8/13/2019 Needs report: appendix E
http://slidepdf.com/reader/full/needs-report-appendix-e 169/235
4 50% Impermeable Area Reduction for the Entire LTT Model
Page 158
Appendix E SUDS report_corrected_18 Jun 10 v3.doc Printed 26/07/2010
Table E‐0‐14 Chartfield Avenue areas attenuated and summary of costs
Subarea
Total impervious
area (m 2)
Impervious area removed entirely
Flow attenuation/reduction
Impervious area directed
to pervious
WLC Direct cost estimates
only
Reduced flow
(m 2) % (m 2) % (m 2) % (£) (£) 16.
Roads,
tracks &
paths
14667 10375 71 156,800 5 l/s
through
flow
from rain
gardens Adjacent
houses 15899 15899 100 39,100
Other
imperv
areas
48041
Overall impervious area attenuated 26274m 2 (33%) – unit cost £8/m 2 of surface drained
© Crown Copyright and database right 2009. Ordnance Survey
Figure E‐0‐29 Chartfield Avenue and adjacent properties
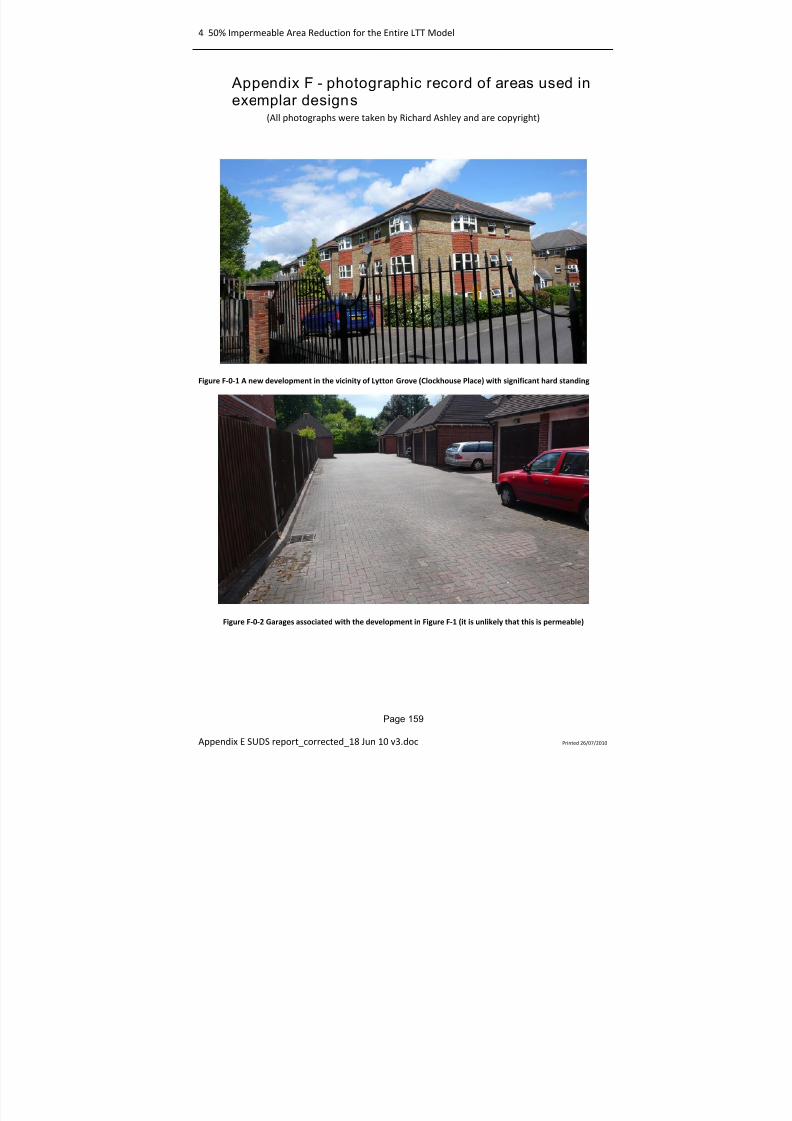
8/13/2019 Needs report: appendix E
http://slidepdf.com/reader/full/needs-report-appendix-e 170/235
4 50% Impermeable Area Reduction for the Entire LTT Model
Page 159
Appendix E SUDS report_corrected_18 Jun 10 v3.doc Printed 26/07/2010
Appendix F - photographic record of areas used inexemplar designs
(All photographs were taken by Richard Ashley and are copyright)
Figure F‐0‐1 A new development in the vicinity of Lytton Grove (Clockhouse Place) with significant hard standing
Figure F‐0‐2 Garages associated with the development in Figure F‐1 (it is unlikely that this is permeable)
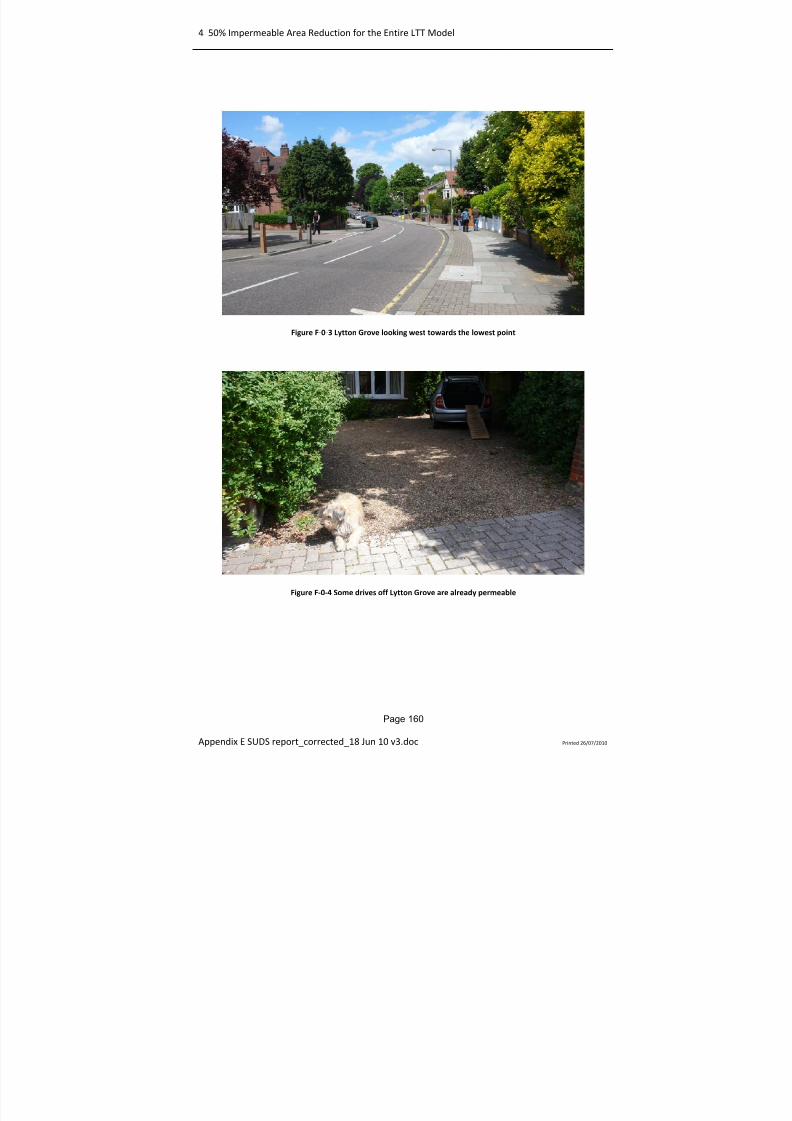
8/13/2019 Needs report: appendix E
http://slidepdf.com/reader/full/needs-report-appendix-e 171/235
4 50% Impermeable Area Reduction for the Entire LTT Model
Page 160
Appendix E SUDS report_corrected_18 Jun 10 v3.doc Printed 26/07/2010
Figure F‐0‐3 Lytton Grove looking west towards the lowest point
Figure F‐0‐4 Some drives off Lytton Grove are already permeable
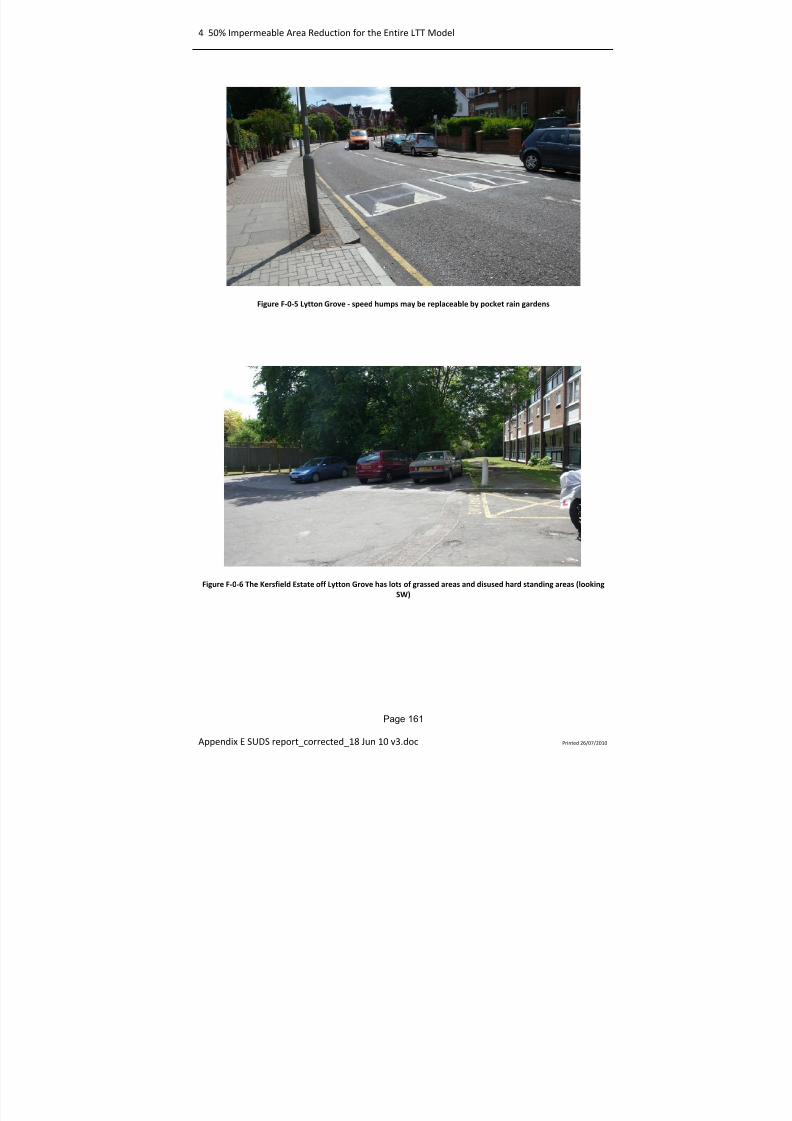
8/13/2019 Needs report: appendix E
http://slidepdf.com/reader/full/needs-report-appendix-e 172/235
4 50% Impermeable Area Reduction for the Entire LTT Model
Page 161
Appendix E SUDS report_corrected_18 Jun 10 v3.doc Printed 26/07/2010
Figure F‐0‐5 Lytton Grove ‐ speed humps may be replaceable by pocket rain gardens
Figure F‐0‐6 The Kersfield Estate off Lytton Grove has lots of grassed areas and disused hard standing areas (looking SW)
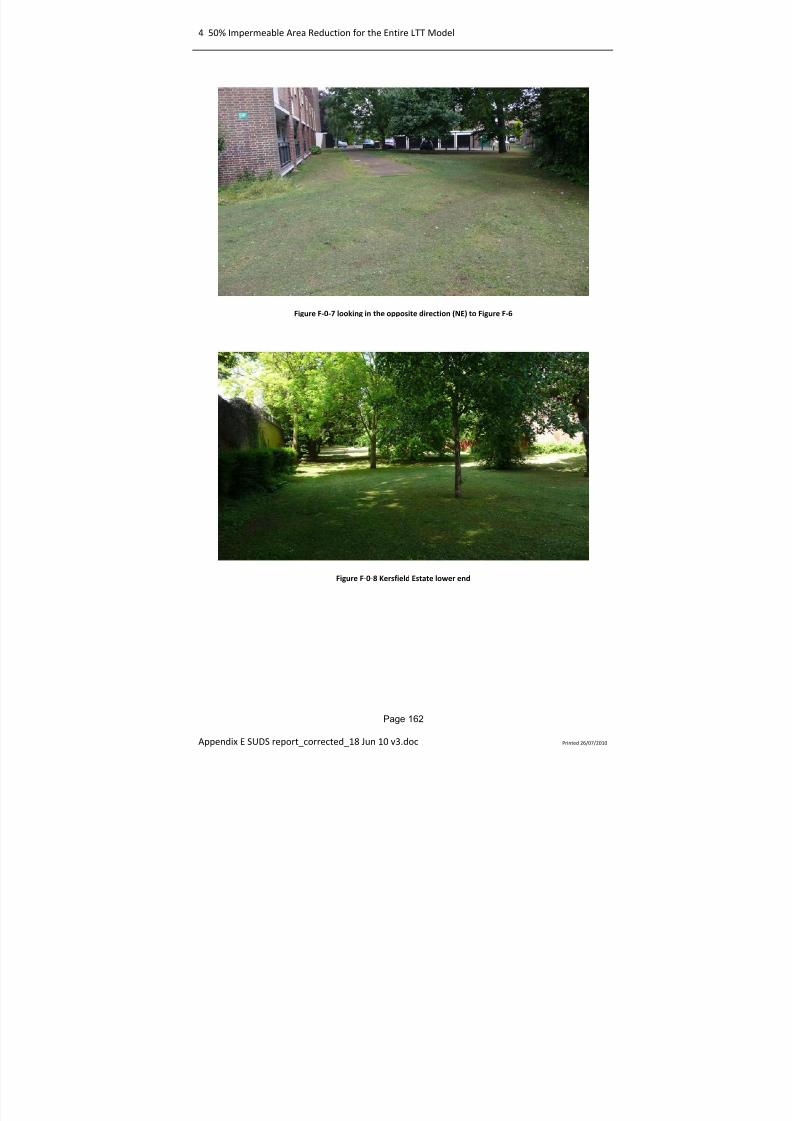
8/13/2019 Needs report: appendix E
http://slidepdf.com/reader/full/needs-report-appendix-e 173/235
4 50% Impermeable Area Reduction for the Entire LTT Model
Page 162
Appendix E SUDS report_corrected_18 Jun 10 v3.doc Printed 26/07/2010
Figure F‐0‐7 looking in the opposite direction (NE) to Figure F‐6
Figure F‐0‐8 Kersfield Estate lower end
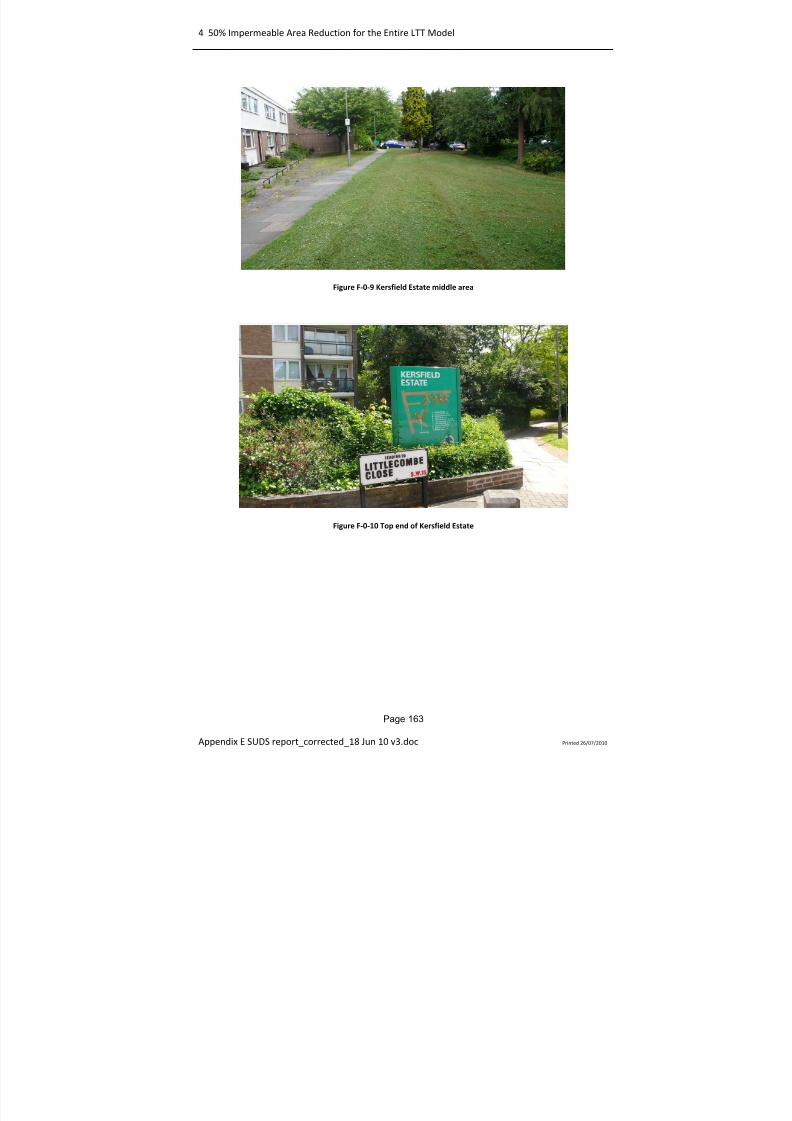
8/13/2019 Needs report: appendix E
http://slidepdf.com/reader/full/needs-report-appendix-e 174/235
4 50% Impermeable Area Reduction for the Entire LTT Model
Page 163
Appendix E SUDS report_corrected_18 Jun 10 v3.doc Printed 26/07/2010
Figure F‐0‐9 Kersfield Estate middle area
Figure F‐0‐10 Top end of Kersfield Estate
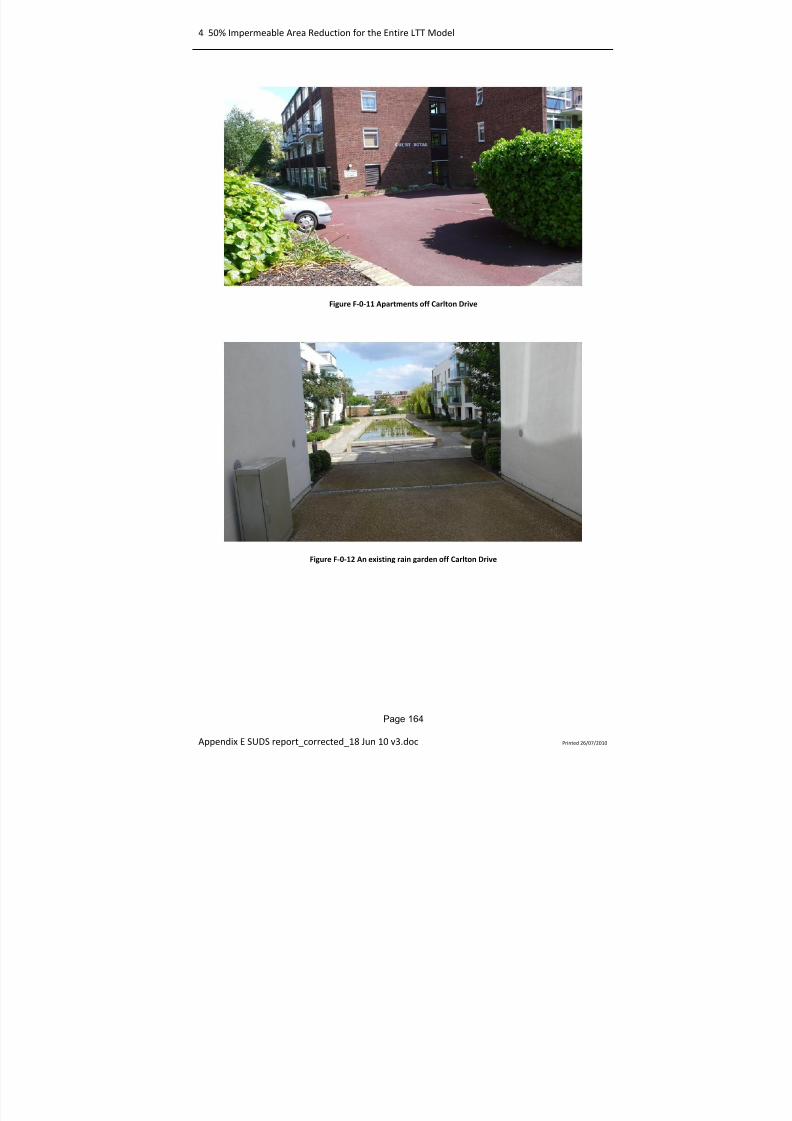
8/13/2019 Needs report: appendix E
http://slidepdf.com/reader/full/needs-report-appendix-e 175/235
4 50% Impermeable Area Reduction for the Entire LTT Model
Page 164
Appendix E SUDS report_corrected_18 Jun 10 v3.doc Printed 26/07/2010
Figure F‐0‐11 Apartments off Carlton Drive
Figure F‐0‐12 An existing rain garden off Carlton Drive
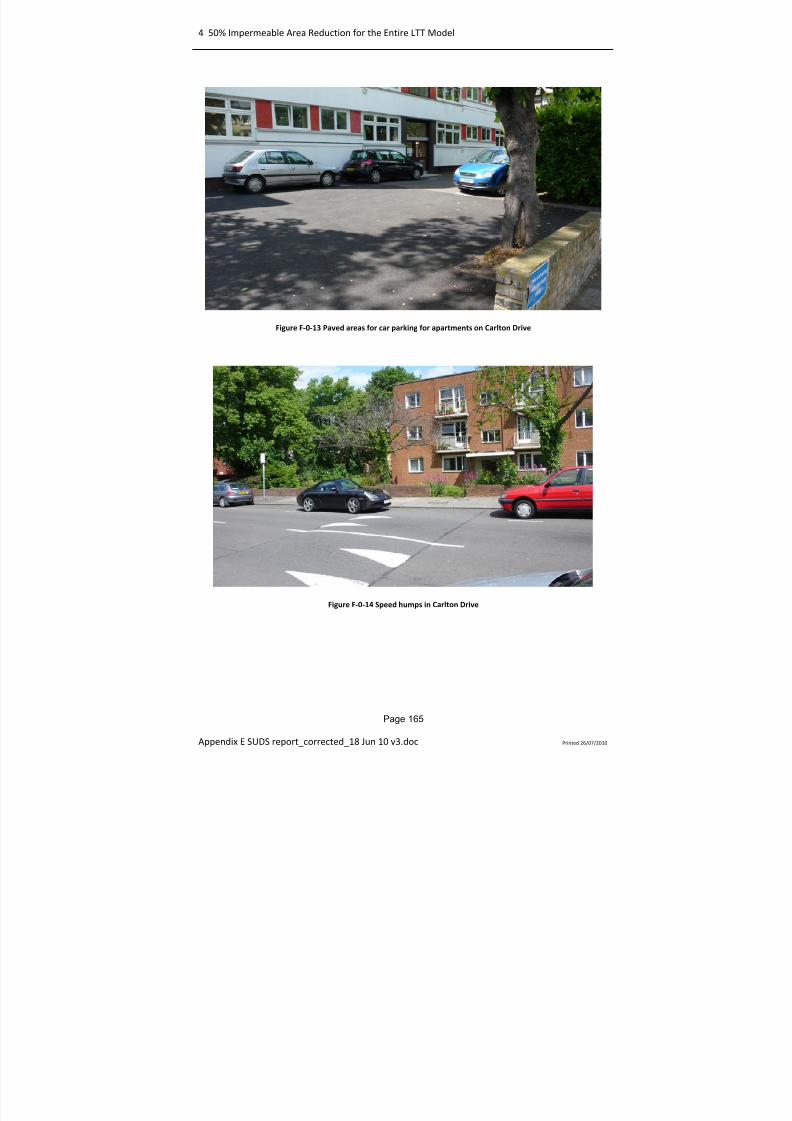
8/13/2019 Needs report: appendix E
http://slidepdf.com/reader/full/needs-report-appendix-e 176/235
4 50% Impermeable Area Reduction for the Entire LTT Model
Page 165
Appendix E SUDS report_corrected_18 Jun 10 v3.doc Printed 26/07/2010
Figure F‐0‐13 Paved areas for car parking for apartments on Carlton Drive
Figure F‐0‐14 Speed humps in Carlton Drive
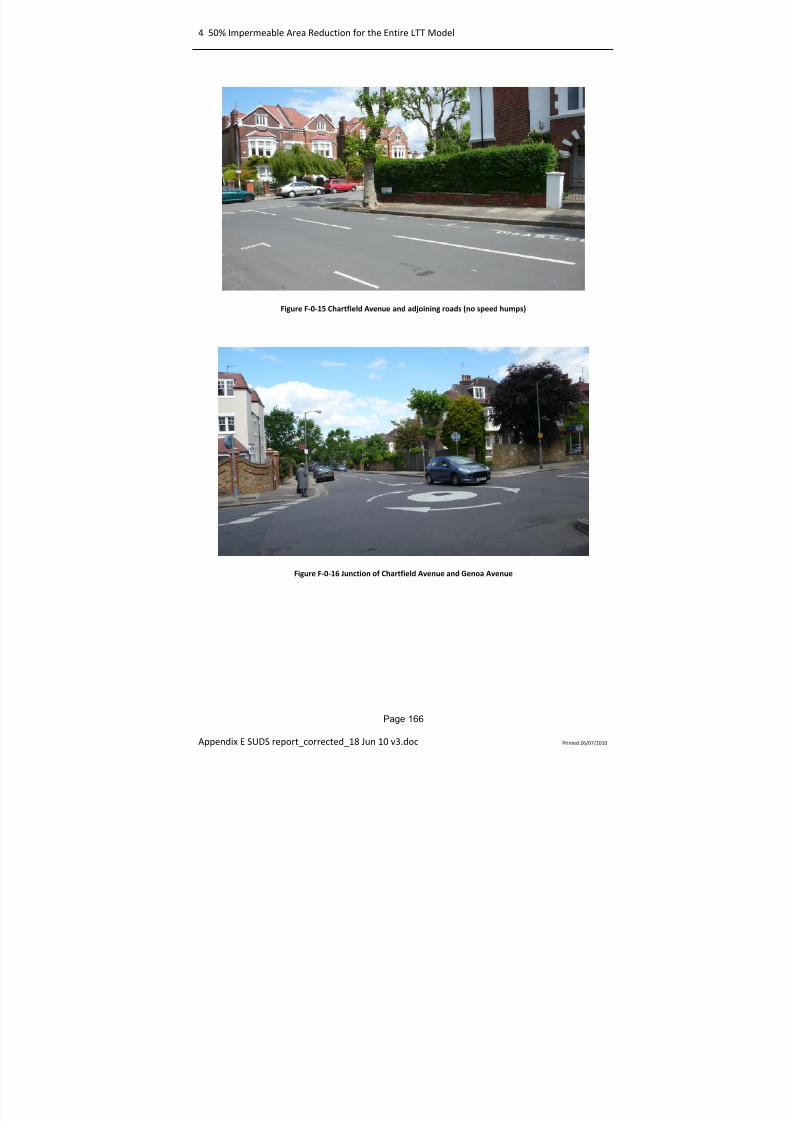
8/13/2019 Needs report: appendix E
http://slidepdf.com/reader/full/needs-report-appendix-e 177/235
4 50% Impermeable Area Reduction for the Entire LTT Model
Page 166
Appendix E SUDS report_corrected_18 Jun 10 v3.doc Printed 26/07/2010
Figure F‐0‐15 Chartfield Avenue and adjoining roads (no speed humps)
Figure F‐0‐16 Junction of Chartfield Avenue and Genoa Avenue
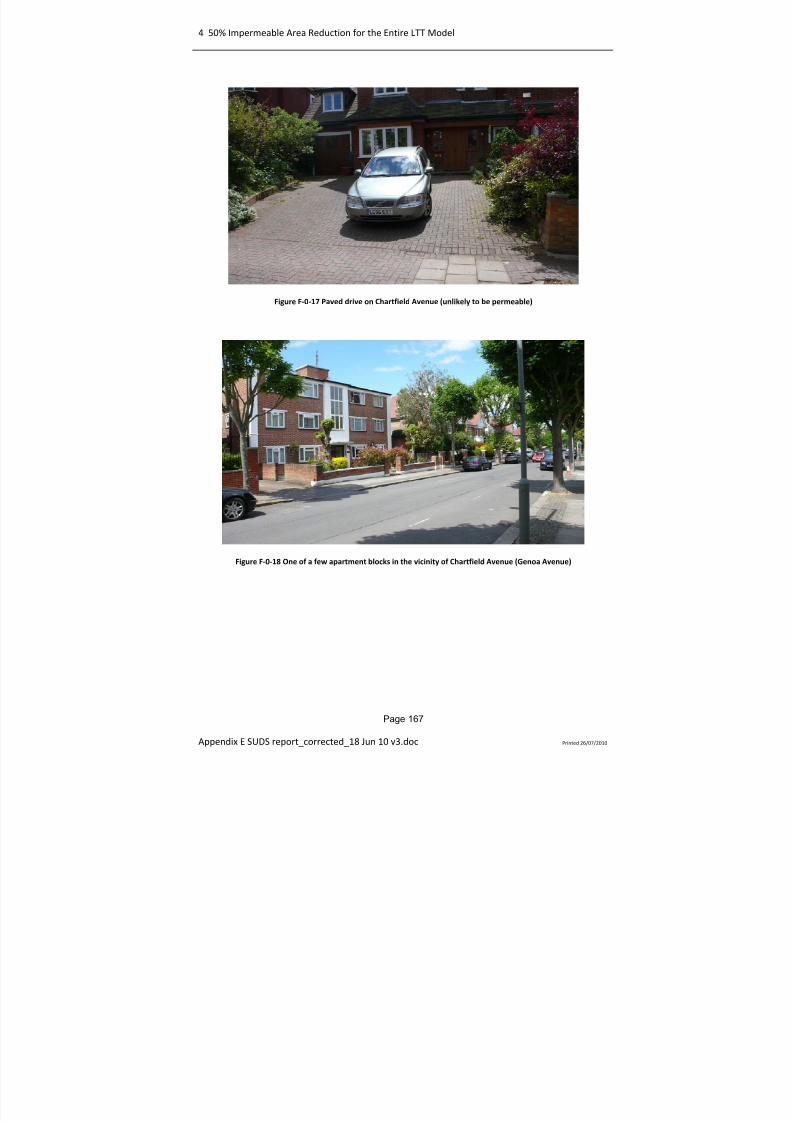
8/13/2019 Needs report: appendix E
http://slidepdf.com/reader/full/needs-report-appendix-e 178/235
4 50% Impermeable Area Reduction for the Entire LTT Model
Page 167
Appendix E SUDS report_corrected_18 Jun 10 v3.doc Printed 26/07/2010
Figure F‐0‐17 Paved drive on Chartfield Avenue (unlikely to be permeable)
Figure F‐0‐18 One of a few apartment blocks in the vicinity of Chartfield Avenue (Genoa Avenue)
8/13/2019 Needs report: appendix E
http://slidepdf.com/reader/full/needs-report-appendix-e 179/235
100-RG-MDL-00000-000002 | AF | 28 April 2010
ANNEX 1
SUDS Evaluation forExample Areas
8/13/2019 Needs report: appendix E
http://slidepdf.com/reader/full/needs-report-appendix-e 180/235
SUDS ANNEX 1_100-RG-MDL-00000-000002-AF-SUDS-Evaluation-for-Example-Areas-Report.doc Printed 28/07/2010
THAMES TUNNEL
SUDS EVALUATION FOR EXAMPLE AREAS
LIST OF CONTENTS
Page Number
1 INTRODUCTION 1
2 SUDS IMPERMEABLE AREA MODELLING 2
2.1 Introduction 2 2.2 Method 2 2.3 Results 2 2.4 Conclusion 10
3 PWG DISCONNECTION STRATEGY MODELLING 23
3.1 Introduction 23 3.2 Method 23 3.3 West Putney 23 3.4 Putney Bridge 28 3.5 Frogmore (Buckhold Road) 32 3.6 Typical Year Rainfall Analysis 37 3.7 Design Storm Storage 38 3.8 Conclusion 42
4 50% IMPERMEABL E AREA REDUCTION FOR THE ENTIRE LTT MODEL 48
4.1 Introduction 48 4.2 Method 48 4.3 Results 48 4.4 Conclusion 51
5 CONCLUSION 52
8/13/2019 Needs report: appendix E
http://slidepdf.com/reader/full/needs-report-appendix-e 181/235
SUDS ANNEX 1_100-RG-MDL-00000-000002-AF-SUDS-Evaluation-for-Example-Areas-Report.doc Printed 28/07/2010
LIST OF FIGURES
Page Number
Figure 2.1 CSO flow during the December typical year event for the existing system and 25%alteration to impermeable area in the contributing subcatchments ................................................. 11
Figure 2.2 CSO flow during the October 2000 – 154 event for the existing system and 25%alteration to impermeable area in the contributing subcatchments ................................................. 12
Figure 2.3 CSO flow during the December typical year event for the existing system and 50%alteration to impermeable area in the contributing subcatchments ................................................. 14
Figure 2.4 CSO flow during the October 2000 – 154 event for the existing system and 50%alteration to impermeable area in the contributing subcatchments ................................................. 15
Figure 2.5 CSO flow during the December typical year event for the existing system and with 5mminitial rainfall lost in the contributing subcatchments ........................................................................ 17
Figure 2.6 CSO flow during the October 2000 – 154 event for the existing system and with 5mminitial rainfall lost in the contributing subcatchments ........................................................................ 18
Figure 2.7 CSO volume during the typical year for the existing system and with 50% impermeablearea disconnected in the contributing subcatchments ..................................................................... 20
Figure 2.8 CSO event flow during the typical year for the existing system and with 50%impermeable area disconnected in the contributing subcatchments ............................................... 21
Figure 3.1 West Putney Mastermap subcatchment characterisation ............................................. 25
Figure 3.2 CSO event flow during the typical year for the existing system and West Putney PWGdisconnection strategy ...................................................................................................................... 28
Figure 3.3 Putney Bridge Mastermap subcatchment characterisation ........................................... 29
Figure 3.4 CSO event flow during the typical year for the existing system and Putney Bridge PWGdisconnection strategy ...................................................................................................................... 31
Figure 3.5 Frogmore (Buckhold Road) Mastermap subcatchment characterisation ...................... 34
Figure 3.6 CSO event flow during the typical year for the existing system and Frogmore (BuckholdRoad) PWG disconnection strategy ................................................................................................. 37
Figure 3.7 Putney Bridge event storage volume comparison for each subcatchment ................... 40
Figure 3.8 West Putney PWG disconnection strategy – December typical year and October 2000event results with existing system results for comparison ............................................................... 43
Figure 3.9 Putney Bridge PWG disconnection strategy – December typical year and October 2000event results with existing system results for comparison ............................................................... 44
Figure 3.10 Frogmore (Buckhold Road) PWG disconnection strategy – December typical year andOctober 2000 event results with existing system results for comparison ........................................ 45
Figure 3.11 Total typical year overflow volume comparison for the existing system and PWGdisconnection strategy system ......................................................................................................... 46
Figure 3.12 Number of typical year overflow events for the existing system and PWGdisconnection strategy system ......................................................................................................... 47
8/13/2019 Needs report: appendix E
http://slidepdf.com/reader/full/needs-report-appendix-e 182/235
SUDS ANNEX 1_100-RG-MDL-00000-000002-AF-SUDS-Evaluation-for-Example-Areas-Report.doc Printed 28/07/2010
LIST OF TABLES
Page Number
Table 2.1 Existing system model results – December typical year event ......................................... 3
Table 2.2 Existing system model results – October 2000 event ....................................................... 3
Table 2.3 Existing system model results – typical year .................................................................... 3
Table 2.4 West Putney CSO - December typical year event – 25% area change ........................... 4
Table 2.5 Putney Bridge CSO – December typical year event – 25% area change ........................ 4
Table 2.6 Frogmore (Buckhold Road) CSO – December typical year event – 25% area change ... 4
Table 2.7 West Putney CSO – October 2000 event – 25% area change ......................................... 5
Table 2.8 Putney Bridge CSO – October 2000 event – 25% area change ...................................... 5
Table 2.9 Frogmore (Buckhold Road) CSO – October 2000 event – 25% area change ................. 5
Table 2.10 West Putney CSO - December typical year event – 50% area change ......................... 6
Table 2.11 Putney Bridge CSO – December typical year event – 50% area change ...................... 6
Table 2.12 Frogmore (Buckhold Road) CSO – December typical year event – 50% area change . 6
Table 2.13 West Putney CSO – October 2000 event – 50% area change ....................................... 7
Table 2.14 Putney Bridge CSO – October 2000 event – 50% area change .................................... 7
Table 2.15 Frogmore (Buckhold Road) CSO – October 2000 event – 50% area change ............... 7
Table 2.16 West Putney CSO - December typical year event – initial 5mm abstraction .................. 8
Table 2.17 Putney Bridge CSO – December typical year event – initial 5mm abstraction ............... 8
Table 2.18 Frogmore (Buckhold Road) CSO – December typical year event – initial 5mmabstraction .......................................................................................................................................... 8
Table 2.19 West Putney CSO - October 2000 event – initial 5mm abstraction ................................ 8
Table 2.20 Putney Bridge CSO – October 2000 event – initial 5mm abstraction ............................. 9
Table 2.21 Frogmore (Buckhold Road) CSO – October 2000 event – initial 5mm abstraction ........ 9
Table 2.22 West Putney CSO – typical year – 50% impermeable area removed ............................ 9
Table 2.23 Putney Bridge CSO – typical year – 50% impermeable area removed .......................... 9
Table 2.24 Frogmore (Buckhold Road) CSO – typical year – 50% impermeable area removed ..... 9
Table 3.1 InfoWorks existing model subcatchment areas contributing to the West Putney CSO .. 24
Table 3.2 PWG West Putney disconnection strategies .................................................................. 26
Table 3.3 Comparison of CSO overflow results for the existing system and West Putney PWGdisconnection strategy ...................................................................................................................... 26
8/13/2019 Needs report: appendix E
http://slidepdf.com/reader/full/needs-report-appendix-e 183/235
SUDS ANNEX 1_100-RG-MDL-00000-000002-AF-SUDS-Evaluation-for-Example-Areas-Report.doc Printed 28/07/2010
Table 3.4 Comparison of CSO overflow results during the typical year for the existing system andWest Putney PWG disconnection strategy ...................................................................................... 27
Table 3.5 InfoWorks existing model subcatchment areas contributing to the Putney Bridge CSO 28
Table 3.6 PWG Putney Bridge disconnection strategies ................................................................ 30
Table 3.7 Comparison of CSO overflow results for the existing system and Putney Bridge PWGdisconnection strategy ...................................................................................................................... 30
Table 3.8 Comparison of CSO overflow results during the typical year for the existing system andPutney Bridge PWG disconnection strategy .................................................................................... 31
Table 3.9 InfoWorks existing model subcatchment areas contributing to the Frogmore (BuckholdRoad) CSO ....................................................................................................................................... 33
Table 3.10 PWG Frogmore (Buckhold Road) disconnection strategies (% area allocated to eachsurface type) ..................................................................................................................................... 35
Table 3.11 Comparison of CSO overflow results for the existing system and Frogmore (BuckholdRoad) PWG disconnection strategy ................................................................................................. 36
Table 3.12 Comparison of CSO overflow results during the typical year for the existing system andFrogmore (Buckhold Road) PWG disconnection strategy ............................................................... 36
Table 3.13 SUDS subcatchment typical year and October 2000 event rainfall analysis ................ 38
Table 3.14 West Putney SUDS storage requirements based on the PWG disconnection strategyareas ................................................................................................................................................. 39
Table 3.15 Putney Bridge SUDS storage requirements based on the PWG disconnection strategyareas ................................................................................................................................................. 40
Table 3.16 Frogmore (Buckhold Road) SUDS storage requirements based on the PWGdisconnection strategy areas ........................................................................................................... 41
Table 4.1 CSO Results during the typical year for the existing system and 50% impermeable arearemoved ............................................................................................................................................ 48
LIST OF ABBREVIATIONS
CSO Combined sewer overflows
FEH Flood Estimation Handbook
LTT London Tideway Tunnels
PWG Pennine Water Group
SUDS Sustainable drainage systems
STW Sewage treatment works

8/13/2019 Needs report: appendix E
http://slidepdf.com/reader/full/needs-report-appendix-e 184/235
1 Introduction
Page 1SUDS ANNEX 1_100-RG-MDL-00000-000002-AF-SUDS-Evaluation-for-Example-Areas-Report.doc Printed 28/07/2010
1 INTRODUCTION
This report evaluates the implementation of Sustainable Drainage Systems (SUDS) on threesubcatchments in the London Tideway Tunnels (LTT) catchment. The three example areas arelocated in the west of the LTT catchment, south of the River Thames and represent thesubcatchments contributing to the West Putney, Putney Bridge and Frogmore (Buckhold Road)Combined Sewer Overflows (CSO). These CSOs are thought the most suitable in the LTTcatchment for SUDS selection.
The December typical year and October 2000 events represent the most severe recorded rainfallevents for the typical year and 154 event rainfall series respectively. The LTT catchment modelsimulations uses these with each of the SUDS options to produce the most extreme overflows atthe CSOs. The complete typical year rainfall was also simulated to provide a representation of thenumber of spills and total overflow that could be expected at CSOs during the annual series.
The LTT model was amended to represent the change in contributing areas produced by thevarious SUDS options. General disconnection options were modelled as reductions inimpermeable contributing area which was modelled as both lost and transferred to permeableareas. Initial losses through rainfall capture techniques were also modelled before a site specificoption (produced by PWG) was investigated for the Frogmore (Buckhold Road) CSO catchment.
Model flow results less than 0.001m 3/s are treated as zero flow.
The population contributing foul flow to the system was unaltered throughout the SUDS modellingas were all other model parameters.

8/13/2019 Needs report: appendix E
http://slidepdf.com/reader/full/needs-report-appendix-e 185/235
2 SUDS Impermeable Area Modelling
Page 2SUDS ANNEX 1_100-RG-MDL-00000-000002-AF-SUDS-Evaluation-for-Example-Areas-Report.doc Printed 28/07/2010
2 SUDS IMPERMEABLE AREA MODELLING
2.1 Introduction
The LTT Model of the existing system was used to represent the impact of SUDS on three CSOs in
the west of the LTT catchment (an area contributing to the Crossness Sewage Treatment Works(STW)). The three CSOs are West Putney (CSO5X), Putney Bridge (CSO6X) and Frogmore(Buckhold Road) (CSO7B) and they are, based on review of LTT catchment and local area landuse, the most suitable for SUDS selection in the entire LTT catchment.
2.2 Method
The system model splits the LTT catchment into individual subcatchments which are connected tomodel nodes. Each subcatchment produces flow estimates based on rainfall, subcatchmentcharacteristics and baseflow values. Subcatchment characteristics include the total area of thesubcatchment that is connected to the modelled sewer network and the percentage of connectedarea which is impermeable and permeable.
The existing LTT model was refined by splitting a large subcatchment to better represent thesystem and to allow the impact of SUDS related changes to be calculated.
The basins were simulated with the December typical year event and the October 2000 eventwhich relate to a one in two year return period and a one in four year return period respectively andrepresent the most severe events (in term of CSO volume) of the typical year and 154 eventrainfall series. The typical year is rainfall from October 1979 to September 1980.
The model subcatchments upstream of the three CSOs were adjusted as follows to provide aninitial evaluation of global SUDS impacts on peak flow and CSO volume for the two selectedevents:
25% impermeable area transferred to permeable area
25% impermeable area removed
50% impermeable area transferred to permeable area
50% impermeable area removed
5mm of rainfall lost at the beginning of the storm events
The typical year was also simulated for the existing system and with 50% impermeable arearemoved from the subcatchments upstream of the three CSOs. This provides a comparison ofoverflow volumes, flow rates and number of spills for each of the three CSO during the typical year.
The transfer of impermeable area to permeable area changes the magnitude and how simulatedflows reach the sewer system. With this change more of the rainfall over the subcatchments willfall onto a permeable area. The permeable area is still connected to the sewer network andtherefore will, depending primarily on rainfall intensity, provide some inflow to the sewer during
rainfall events.The removal of impermeable area represents a change where the removed area is no longerconnected to the sewer network and no inflow is generated during rainfall events.
The 5mm rainfall initial abstraction is representative of a local storage system (such as a blue-roof)which stores the first 5mm of rainfall and only when full does the flow contribute to the sewernetwork.
2.3 Results
The existing system model runs produced the following result for the two selected events.
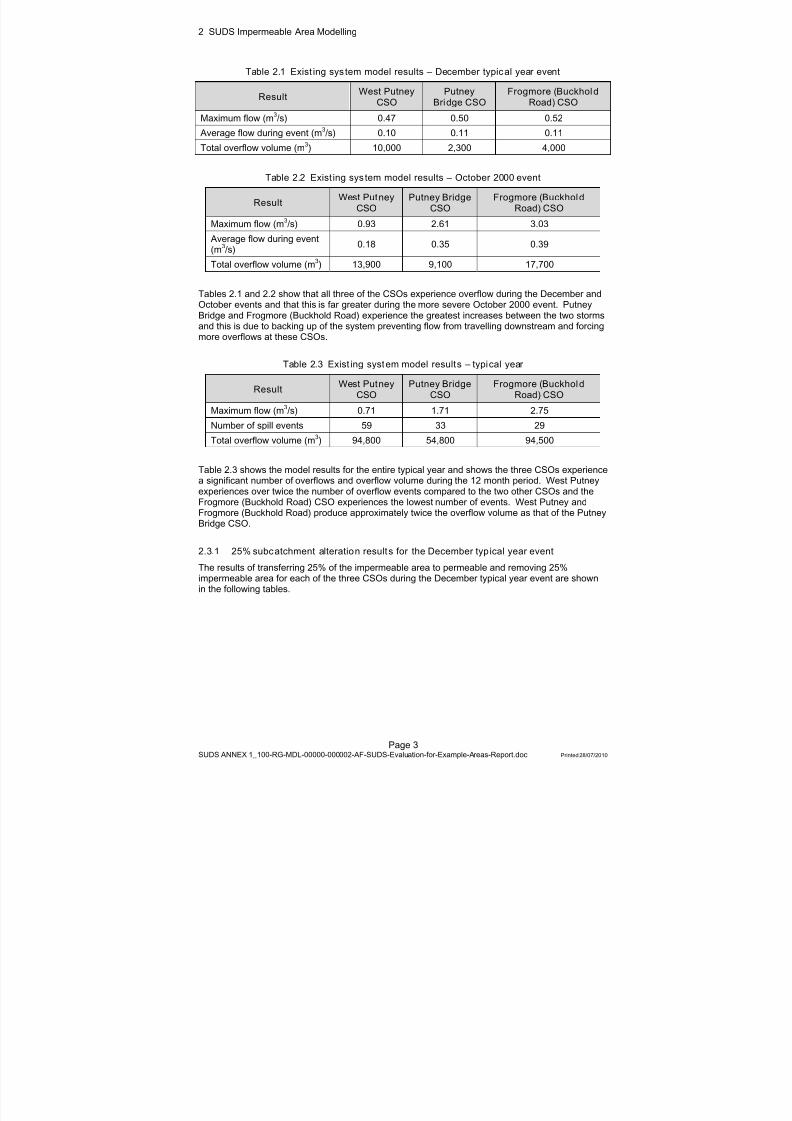
8/13/2019 Needs report: appendix E
http://slidepdf.com/reader/full/needs-report-appendix-e 186/235
2 SUDS Impermeable Area Modelling
Page 3SUDS ANNEX 1_100-RG-MDL-00000-000002-AF-SUDS-Evaluation-for-Example-Areas-Report.doc Printed 28/07/2010
Table 2.1 Exist ing sys tem model results – December typic al year event
Result West PutneyCSO
PutneyBridge CSO
Frogmore (BuckholdRoad) CSO
Maximum flow (m 3/s) 0.47 0.50 0.52 Average flow during event (m 3/s) 0.10 0.11 0.11Total overflow volume (m 3) 10,000 2,300 4,000
Table 2.2 Exist ing sys tem model results – October 2000 event
Result West PutneyCSO
Putney BridgeCSO
Frogmore (BuckholdRoad) CSO
Maximum flow (m 3/s) 0.93 2.61 3.03 Average flow during event(m3/s) 0.18 0.35 0.39
Total overflow volume (m 3) 13,900 9,100 17,700
Tables 2.1 and 2.2 show that all three of the CSOs experience overflow during the December andOctober events and that this is far greater during the more severe October 2000 event. PutneyBridge and Frogmore (Buckhold Road) experience the greatest increases between the two stormsand this is due to backing up of the system preventing flow from travelling downstream and forcingmore overflows at these CSOs.
Table 2.3 Exist ing syst em model result s – typical year
Result West PutneyCSO
Putney BridgeCSO
Frogmore (BuckholdRoad) CSO
Maximum flow (m3
/s) 0.71 1.71 2.75Number of spill events 59 33 29Total overflow volume (m 3) 94,800 54,800 94,500
Table 2.3 shows the model results for the entire typical year and shows the three CSOs experiencea significant number of overflows and overflow volume during the 12 month period. West Putneyexperiences over twice the number of overflow events compared to the two other CSOs and theFrogmore (Buckhold Road) CSO experiences the lowest number of events. West Putney andFrogmore (Buckhold Road) produce approximately twice the overflow volume as that of the PutneyBridge CSO.
2.3.1 25% subc atchment alteration result s for the December typ ical year eventThe results of transferring 25% of the impermeable area to permeable and removing 25%impermeable area for each of the three CSOs during the December typical year event are shownin the following tables.
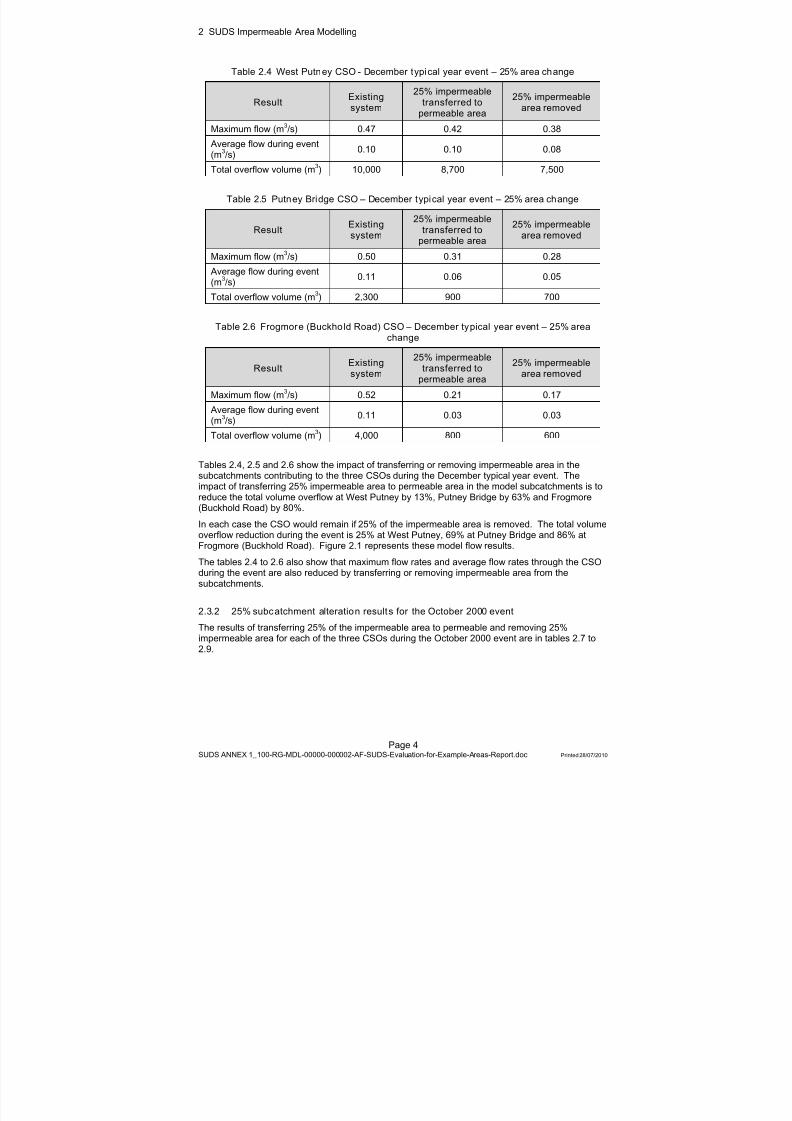
8/13/2019 Needs report: appendix E
http://slidepdf.com/reader/full/needs-report-appendix-e 187/235
2 SUDS Impermeable Area Modelling
Page 4SUDS ANNEX 1_100-RG-MDL-00000-000002-AF-SUDS-Evaluation-for-Example-Areas-Report.doc Printed 28/07/2010
Table 2.4 West Putney CSO - December typical year event – 25% area change
Result Existingsystem
25% impermeabletransferred to
permeable area
25% impermeablearea removed
Maximum flow (m 3/s) 0.47 0.42 0.38 Average flow during event(m3/s) 0.10 0.10 0.08
Total overflow volume (m 3) 10,000 8,700 7,500
Table 2.5 Putney Bridge CSO – December typical year event – 25% area change
Result Existingsystem
25% impermeabletransferred to
permeable area
25% impermeablearea removed
Maximum flow (m 3/s) 0.50 0.31 0.28 Average flow during event(m3/s) 0.11 0.06 0.05
Total overflow volume (m 3) 2,300 900 700
Table 2.6 Frogmore (Buckhold Road) CSO – December typical year event – 25% areachange
Result Existingsystem
25% impermeabletransferred to
permeable area
25% impermeablearea removed
Maximum flow (m 3/s) 0.52 0.21 0.17 Average flow during event(m3/s) 0.11 0.03 0.03
Total overflow volume (m 3) 4,000 800 600
Tables 2.4, 2.5 and 2.6 show the impact of transferring or removing impermeable area in thesubcatchments contributing to the three CSOs during the December typical year event. Theimpact of transferring 25% impermeable area to permeable area in the model subcatchments is toreduce the total volume overflow at West Putney by 13%, Putney Bridge by 63% and Frogmore(Buckhold Road) by 80%.
In each case the CSO would remain if 25% of the impermeable area is removed. The total volumeoverflow reduction during the event is 25% at West Putney, 69% at Putney Bridge and 86% atFrogmore (Buckhold Road). Figure 2.1 represents these model flow results.
The tables 2.4 to 2.6 also show that maximum flow rates and average flow rates through the CSOduring the event are also reduced by transferring or removing impermeable area from thesubcatchments.
2.3.2 25% subc atchment alteration result s for the October 2000 event
The results of transferring 25% of the impermeable area to permeable and removing 25%impermeable area for each of the three CSOs during the October 2000 event are in tables 2.7 to2.9.
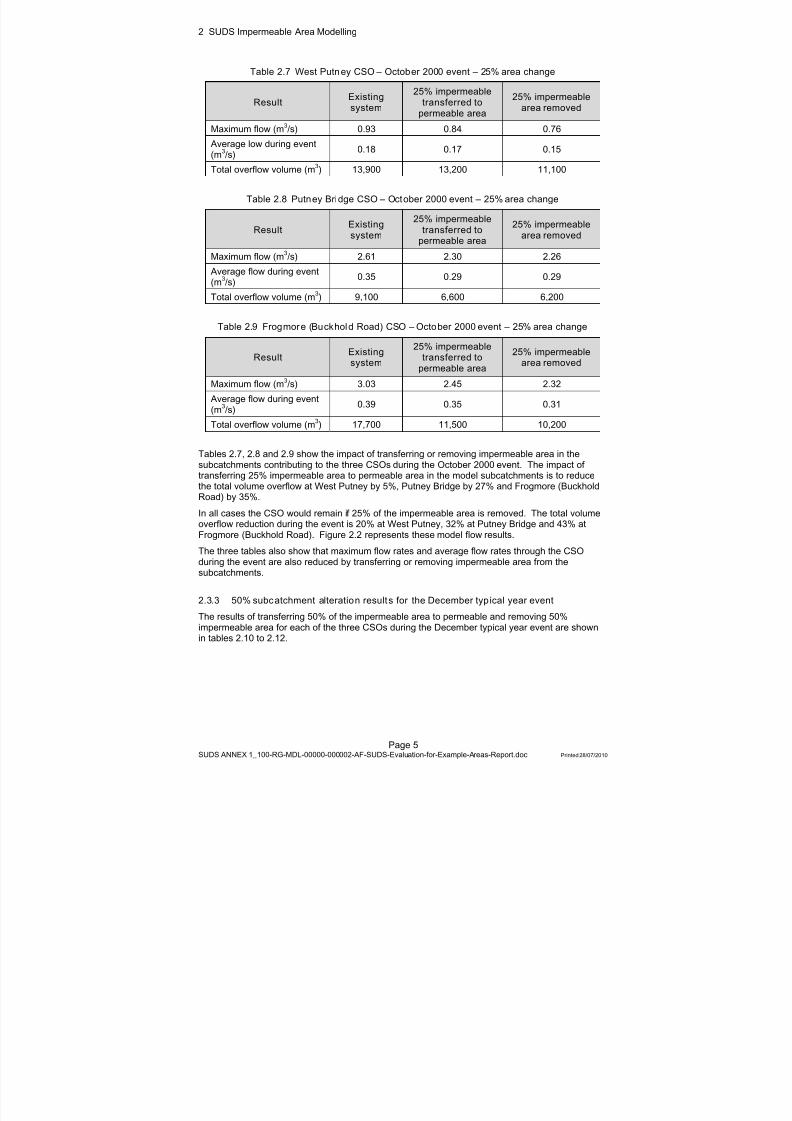
8/13/2019 Needs report: appendix E
http://slidepdf.com/reader/full/needs-report-appendix-e 188/235
2 SUDS Impermeable Area Modelling
Page 5SUDS ANNEX 1_100-RG-MDL-00000-000002-AF-SUDS-Evaluation-for-Example-Areas-Report.doc Printed 28/07/2010
Table 2.7 West Putney CSO – October 2000 event – 25% area change
Result Existingsystem
25% impermeabletransferred to
permeable area
25% impermeablearea removed
Maximum flow (m 3/s) 0.93 0.84 0.76 Average low during event(m3/s) 0.18 0.17 0.15
Total overflow volume (m 3) 13,900 13,200 11,100
Table 2.8 Putney Bridge CSO – October 2000 event – 25% area change
Result Existingsystem
25% impermeabletransferred to
permeable area
25% impermeablearea removed
Maximum flow (m 3/s) 2.61 2.30 2.26 Average flow during event(m3/s) 0.35 0.29 0.29
Total overflow volume (m 3) 9,100 6,600 6,200
Table 2.9 Frogmor e (Buckhold Road) CSO – October 2000 event – 25% area change
Result Existingsystem
25% impermeabletransferred to
permeable area
25% impermeablearea removed
Maximum flow (m 3/s) 3.03 2.45 2.32 Average flow during event(m3/s) 0.39 0.35 0.31
Total overflow volume (m 3) 17,700 11,500 10,200
Tables 2.7, 2.8 and 2.9 show the impact of transferring or removing impermeable area in thesubcatchments contributing to the three CSOs during the October 2000 event. The impact oftransferring 25% impermeable area to permeable area in the model subcatchments is to reducethe total volume overflow at West Putney by 5%, Putney Bridge by 27% and Frogmore (BuckholdRoad) by 35%.
In all cases the CSO would remain if 25% of the impermeable area is removed. The total volumeoverflow reduction during the event is 20% at West Putney, 32% at Putney Bridge and 43% atFrogmore (Buckhold Road). Figure 2.2 represents these model flow results.
The three tables also show that maximum flow rates and average flow rates through the CSOduring the event are also reduced by transferring or removing impermeable area from thesubcatchments.
2.3.3 50% subc atchment alteration result s for the December typ ical year event
The results of transferring 50% of the impermeable area to permeable and removing 50%impermeable area for each of the three CSOs during the December typical year event are shownin tables 2.10 to 2.12.
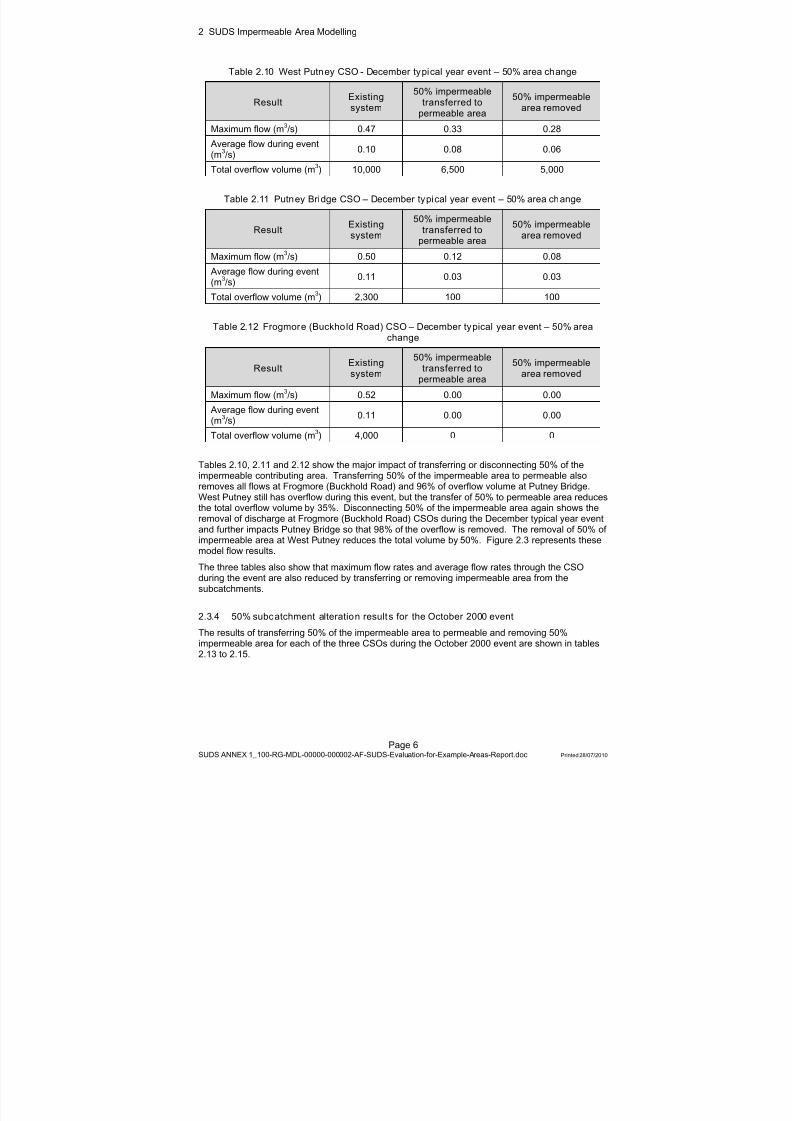
8/13/2019 Needs report: appendix E
http://slidepdf.com/reader/full/needs-report-appendix-e 189/235
2 SUDS Impermeable Area Modelling
Page 6SUDS ANNEX 1_100-RG-MDL-00000-000002-AF-SUDS-Evaluation-for-Example-Areas-Report.doc Printed 28/07/2010
Table 2.10 West Putney CSO - December typical year event – 50% area change
Result Existingsystem
50% impermeabletransferred to
permeable area
50% impermeablearea removed
Maximum flow (m 3/s) 0.47 0.33 0.28 Average flow during event(m3/s) 0.10 0.08 0.06
Total overflow volume (m 3) 10,000 6,500 5,000
Table 2.11 Putney Bridge CSO – December typical year event – 50% area change
Result Existingsystem
50% impermeabletransferred to
permeable area
50% impermeablearea removed
Maximum flow (m 3/s) 0.50 0.12 0.08 Average flow during event(m3/s) 0.11 0.03 0.03
Total overflow volume (m 3) 2,300 100 100
Table 2.12 Frogmore (Buckhold Road) CSO – December typical year event – 50% areachange
Result Existingsystem
50% impermeabletransferred to
permeable area
50% impermeablearea removed
Maximum flow (m 3/s) 0.52 0.00 0.00 Average flow during event(m3/s) 0.11 0.00 0.00
Total overflow volume (m 3) 4,000 0 0
Tables 2.10, 2.11 and 2.12 show the major impact of transferring or disconnecting 50% of theimpermeable contributing area. Transferring 50% of the impermeable area to permeable alsoremoves all flows at Frogmore (Buckhold Road) and 96% of overflow volume at Putney Bridge.West Putney still has overflow during this event, but the transfer of 50% to permeable area reducesthe total overflow volume by 35%. Disconnecting 50% of the impermeable area again shows theremoval of discharge at Frogmore (Buckhold Road) CSOs during the December typical year eventand further impacts Putney Bridge so that 98% of the overflow is removed. The removal of 50% ofimpermeable area at West Putney reduces the total volume by 50%. Figure 2.3 represents these
model flow results.The three tables also show that maximum flow rates and average flow rates through the CSOduring the event are also reduced by transferring or removing impermeable area from thesubcatchments.
2.3.4 50% subc atchment alteration result s for the October 2000 event
The results of transferring 50% of the impermeable area to permeable and removing 50%impermeable area for each of the three CSOs during the October 2000 event are shown in tables2.13 to 2.15.
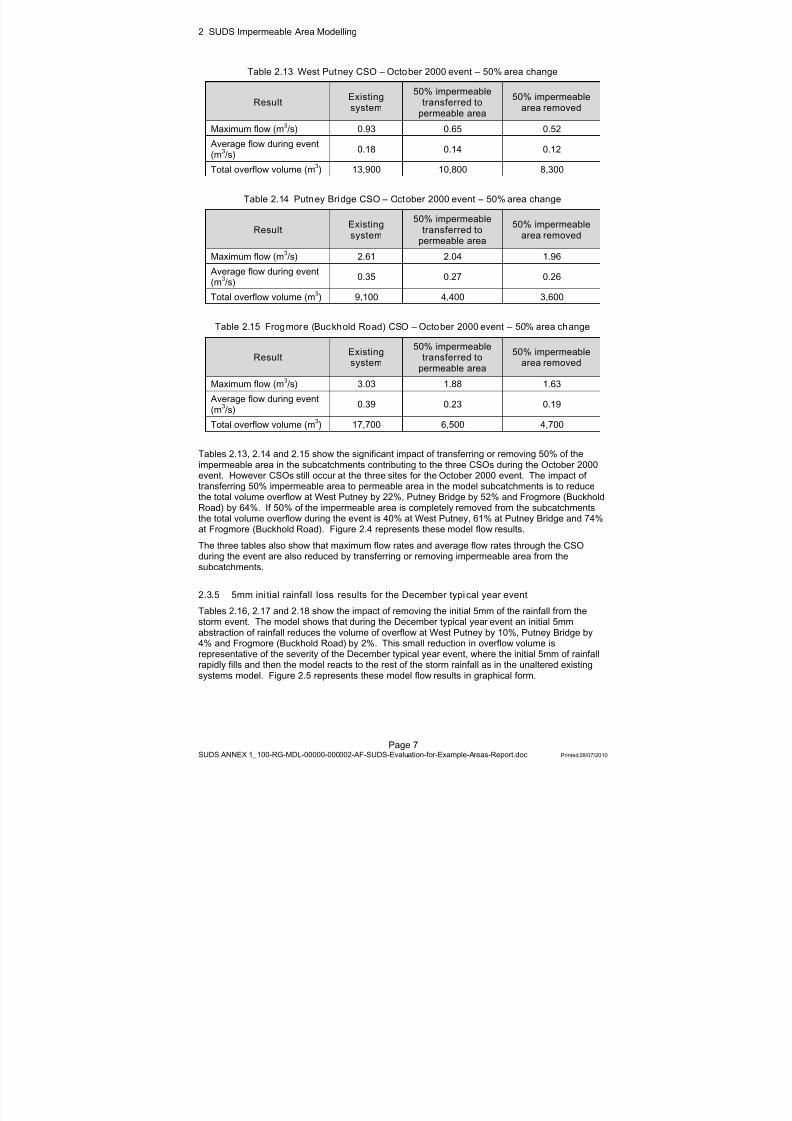
8/13/2019 Needs report: appendix E
http://slidepdf.com/reader/full/needs-report-appendix-e 190/235
2 SUDS Impermeable Area Modelling
Page 7SUDS ANNEX 1_100-RG-MDL-00000-000002-AF-SUDS-Evaluation-for-Example-Areas-Report.doc Printed 28/07/2010
Table 2.13 West Putney CSO – October 2000 event – 50% area change
Result Existingsystem
50% impermeabletransferred to
permeable area
50% impermeablearea removed
Maximum flow (m 3/s) 0.93 0.65 0.52 Average flow during event(m3/s) 0.18 0.14 0.12
Total overflow volume (m 3) 13,900 10,800 8,300
Table 2.14 Putney Bridge CSO – October 2000 event – 50% area change
Result Existingsystem
50% impermeabletransferred to
permeable area
50% impermeablearea removed
Maximum flow (m 3/s) 2.61 2.04 1.96 Average flow during event(m3/s) 0.35 0.27 0.26
Total overflow volume (m 3) 9,100 4,400 3,600
Table 2.15 Frogmore (Buc khold Road) CSO – October 2000 event – 50% area change
Result Existingsystem
50% impermeabletransferred to
permeable area
50% impermeablearea removed
Maximum flow (m 3/s) 3.03 1.88 1.63 Average flow during event(m3/s) 0.39 0.23 0.19
Total overflow volume (m 3) 17,700 6,500 4,700
Tables 2.13, 2.14 and 2.15 show the significant impact of transferring or removing 50% of theimpermeable area in the subcatchments contributing to the three CSOs during the October 2000event. However CSOs still occur at the three sites for the October 2000 event. The impact oftransferring 50% impermeable area to permeable area in the model subcatchments is to reducethe total volume overflow at West Putney by 22%, Putney Bridge by 52% and Frogmore (BuckholdRoad) by 64%. If 50% of the impermeable area is completely removed from the subcatchmentsthe total volume overflow during the event is 40% at West Putney, 61% at Putney Bridge and 74%at Frogmore (Buckhold Road). Figure 2.4 represents these model flow results.
The three tables also show that maximum flow rates and average flow rates through the CSOduring the event are also reduced by transferring or removing impermeable area from thesubcatchments.
2.3.5 5mm ini tial rainfall loss results for the December typi cal year event
Tables 2.16, 2.17 and 2.18 show the impact of removing the initial 5mm of the rainfall from thestorm event. The model shows that during the December typical year event an initial 5mmabstraction of rainfall reduces the volume of overflow at West Putney by 10%, Putney Bridge by4% and Frogmore (Buckhold Road) by 2%. This small reduction in overflow volume isrepresentative of the severity of the December typical year event, where the initial 5mm of rainfallrapidly fills and then the model reacts to the rest of the storm rainfall as in the unaltered existingsystems model. Figure 2.5 represents these model flow results in graphical form.
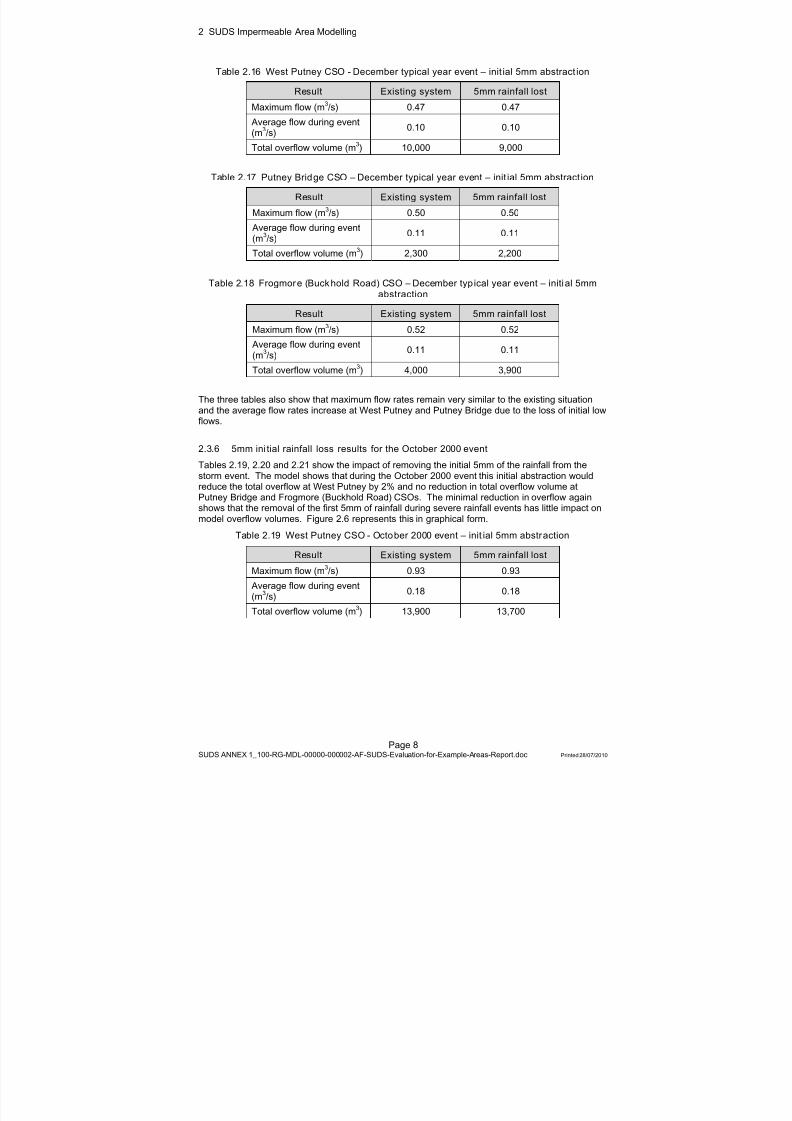
8/13/2019 Needs report: appendix E
http://slidepdf.com/reader/full/needs-report-appendix-e 191/235
2 SUDS Impermeable Area Modelling
Page 8SUDS ANNEX 1_100-RG-MDL-00000-000002-AF-SUDS-Evaluation-for-Example-Areas-Report.doc Printed 28/07/2010
Table 2.16 West Putney CSO - December typical year event – init ial 5mm abstract ion
Result Existing system 5mm rainfall lost
Maximum flow (m 3/s) 0.47 0.47 Average flow during event(m3/s) 0.10 0.10
Total overflow volume (m 3) 10,000 9,000
Table 2.17 Putney Bridge CSO – December typical year event – init ial 5mm abstract ion
Result Existing system 5mm rainfall lost
Maximum flow (m 3/s) 0.50 0.50 Average flow during event(m3/s) 0.11 0.11
Total overflow volume (m 3) 2,300 2,200
Table 2.18 Frogmor e (Buck hold Road) CSO – December typ ical year event – initi al 5mmabstraction
Result Existing system 5mm rainfall lost
Maximum flow (m 3/s) 0.52 0.52 Average flow during event(m3/s) 0.11 0.11
Total overflow volume (m 3) 4,000 3,900
The three tables also show that maximum flow rates remain very similar to the existing situation
and the average flow rates increase at West Putney and Putney Bridge due to the loss of initial lowflows.
2.3.6 5mm ini tial rainfall loss results for the October 2000 event
Tables 2.19, 2.20 and 2.21 show the impact of removing the initial 5mm of the rainfall from thestorm event. The model shows that during the October 2000 event this initial abstraction wouldreduce the total overflow at West Putney by 2% and no reduction in total overflow volume atPutney Bridge and Frogmore (Buckhold Road) CSOs. The minimal reduction in overflow againshows that the removal of the first 5mm of rainfall during severe rainfall events has little impact onmodel overflow volumes. Figure 2.6 represents this in graphical form.
Table 2.19 West Putney CSO - October 2000 event – init ial 5mm abstraction
Result Existing system 5mm rainfall lostMaximum flow (m 3/s) 0.93 0.93
Average flow during event(m3/s) 0.18 0.18
Total overflow volume (m 3) 13,900 13,700
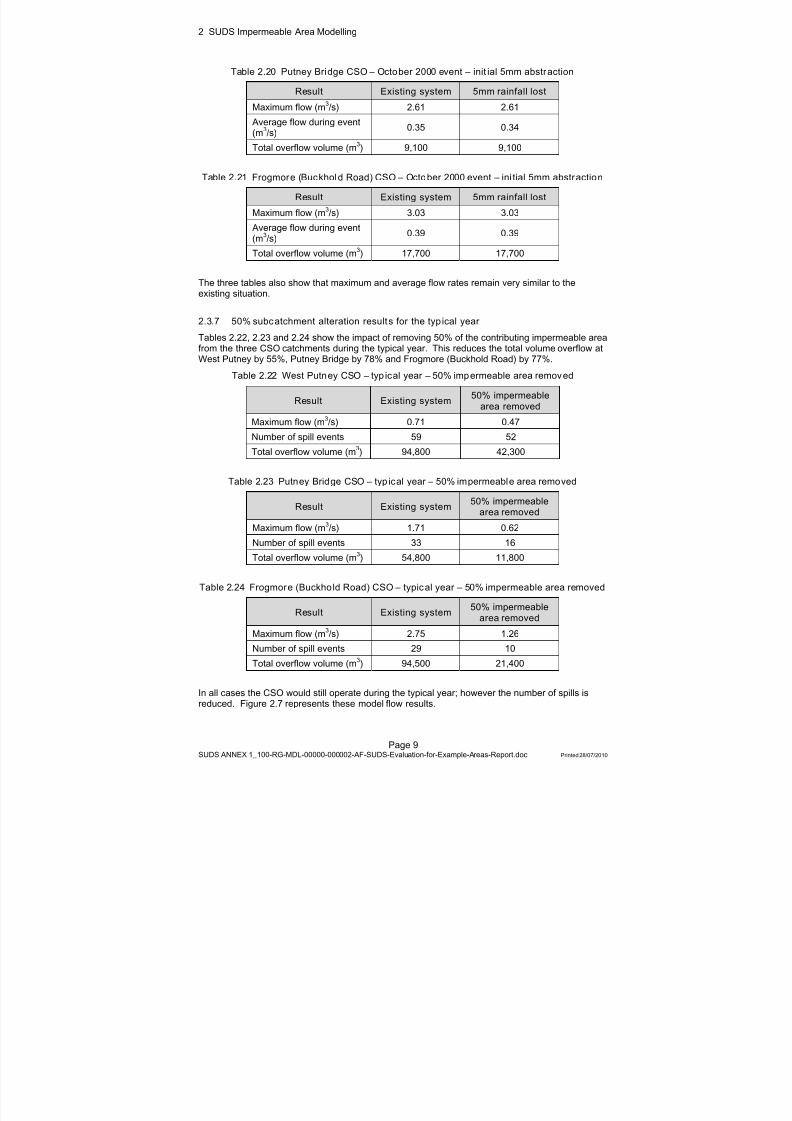
8/13/2019 Needs report: appendix E
http://slidepdf.com/reader/full/needs-report-appendix-e 192/235
2 SUDS Impermeable Area Modelling
Page 9SUDS ANNEX 1_100-RG-MDL-00000-000002-AF-SUDS-Evaluation-for-Example-Areas-Report.doc Printed 28/07/2010
Table 2.20 Putney Bridge CSO – October 2000 event – init ial 5mm abstraction
Result Existing system 5mm rainfall lost
Maximum flow (m 3/s) 2.61 2.61 Average flow during event(m3/s) 0.35 0.34
Total overflow volume (m 3) 9,100 9,100
Table 2.21 Frogmore (Buckhold Road) CSO – October 2000 event – ini tial 5mm abstraction
Result Existing system 5mm rainfall lost
Maximum flow (m 3/s) 3.03 3.03 Average flow during event(m3/s) 0.39 0.39
Total overflow volume (m 3) 17,700 17,700
The three tables also show that maximum and average flow rates remain very similar to theexisting situation.
2.3.7 50% subc atchment alteration result s for the typ ical year
Tables 2.22, 2.23 and 2.24 show the impact of removing 50% of the contributing impermeable areafrom the three CSO catchments during the typical year. This reduces the total volume overflow atWest Putney by 55%, Putney Bridge by 78% and Frogmore (Buckhold Road) by 77%.
Table 2.22 West Putney CSO – typ ical year – 50% impermeable area removed
Result Existing system 50% impermeablearea removed
Maximum flow (m 3/s) 0.71 0.47Number of spill events 59 52Total overflow volume (m 3) 94,800 42,300
Table 2.23 Putney Bridge CSO – typ ical year – 50% impermeable area removed
Result Existing system 50% impermeablearea removed
Maximum flow (m 3/s) 1.71 0.62Number of spill events 33 16
Total overflow volume (m 3) 54,800 11,800
Table 2.24 Frogmore (Buckhold Road) CSO – typic al year – 50% impermeable area removed
Result Existing system 50% impermeablearea removed
Maximum flow (m 3/s) 2.75 1.26Number of spill events 29 10Total overflow volume (m 3) 94,500 21,400
In all cases the CSO would still operate during the typical year; however the number of spills isreduced. Figure 2.7 represents these model flow results.

8/13/2019 Needs report: appendix E
http://slidepdf.com/reader/full/needs-report-appendix-e 193/235
2 SUDS Impermeable Area Modelling
Page 10SUDS ANNEX 1_100-RG-MDL-00000-000002-AF-SUDS-Evaluation-for-Example-Areas-Report.doc Printed 28/07/2010
Tables 1.22, 1.23 and 1.24 also show that maximum flow rates through the CSO during the typicalyear are also reduced by disconnecting impermeable area in the subcatchments.
Figure 2.8 compares each CSO event overflow volume based on volume range, during the typicalyear for the existing system and the 50% impermeable area removed system. The impact ofremoving 50% impermeable area in the West Putney CSO catchment is to significantly reduce thenumber of events which produce overflows greater than 1,000m 3 and increase the number ofevents with lower overflow volume. The Putney Bridge CSO results show all ranges of overflowvolume are reduced and overflows greater than 5,000m 3 are removed. The Frogmore (BuckholdRoad) CSO results show that all ranges of event overflow volumes are reduced, only one eventproduces an overflow volume greater than 5,000m 3 and all events with less than 100m 3 areremoved.
2.4 Conclusion
The December typical year event and October 2000 event represent the most severe recordedrainfall events for the typical year and 154 event rainfall series respectively. The LTT catchmentmodel simulations of these events therefore produce the most extreme overflows at the CSOs.
The complete typical year rainfall was also simulated to provide a representation of the number ofspills and total overflow that could be expected at CSOs during the annual series and with variousSUDS assumptions.
The December event has a return period of approximately one in two years and the results showthat the disconnection of impermeable area has a far greater impact than the transfer ofimpermeable to permeable area. When 25% of the impermeable area is removed or transferredduring the December event the volume and duration of spills is reduced at all three of the CSOs,but overflow is still observed. When 50% impermeable area is transferred to permeable there is nooverflow recorded at Frogmore (Buckhold Road) for this event but there is still a small overflow atPutney Bridge and a significant overflow remains at West Putney. When the impermeable area isdisconnected the impact is greater with overflow from Putney Bridge reduced by 98% and the WestPutney overflow reduced by 50%.
The October event has a return period of approximately one in four years and again shows theoverflows reducing the most significantly when the impermeable area is disconnected rather thantransferred to permeable area. The removal or transfer of 25% of impermeable area has an impacton overflow volume, with the greatest reduction of 43% seen at Frogmore (Buckhold Road), but allthe CSOs produce overflow during the event. When 50% of the impermeable area is disconnectedthe reduction in overflow is far greater, however; all three CSOs still produce during the October2000 event.
The impact of removing the first 5mm of rainfall (via storage in blue-roofs etc) has little effect onsevere storm overflows at the three selected CSO sites in the model. The rainfall quickly fills the5mm depth of storage and the catchment then reacts in the same way as the existing system. It islikely that a far greater impact would be observed on lower intensity or intermittent storms wherethe 5mm rainfall removal represents a more significant proportion of the total rainfall event.
The typical year series contains the December event and over 50 other rainfall events that aretypical to the LTT catchment. The typical year results show the impact of disconnecting 50% ofimpermeable area is to reduce maximum flow rates, total overflow volume and the number of spillevents recorded in the annual series. West Putney shows a small reduction in spill events but asignificant reduction in total overflow volume, while Putney Bridge and Frogmore (Buckhold Road)show a significant reduction in both volume and number of overflow events.
The individual event overflow volumes during the typical year are also greatly affected by theremoval of 50% impermeable area, with the number of events producing over 1,000m 3 reduced atall three CSOs. The overflow volume shifts in West Putney from larger to smaller overflows with aslight reduction in total overflow events, while the volume and number of events significantlyreduces at both Putney Bridge and Frogmore (Buckhold Road) CSOs.
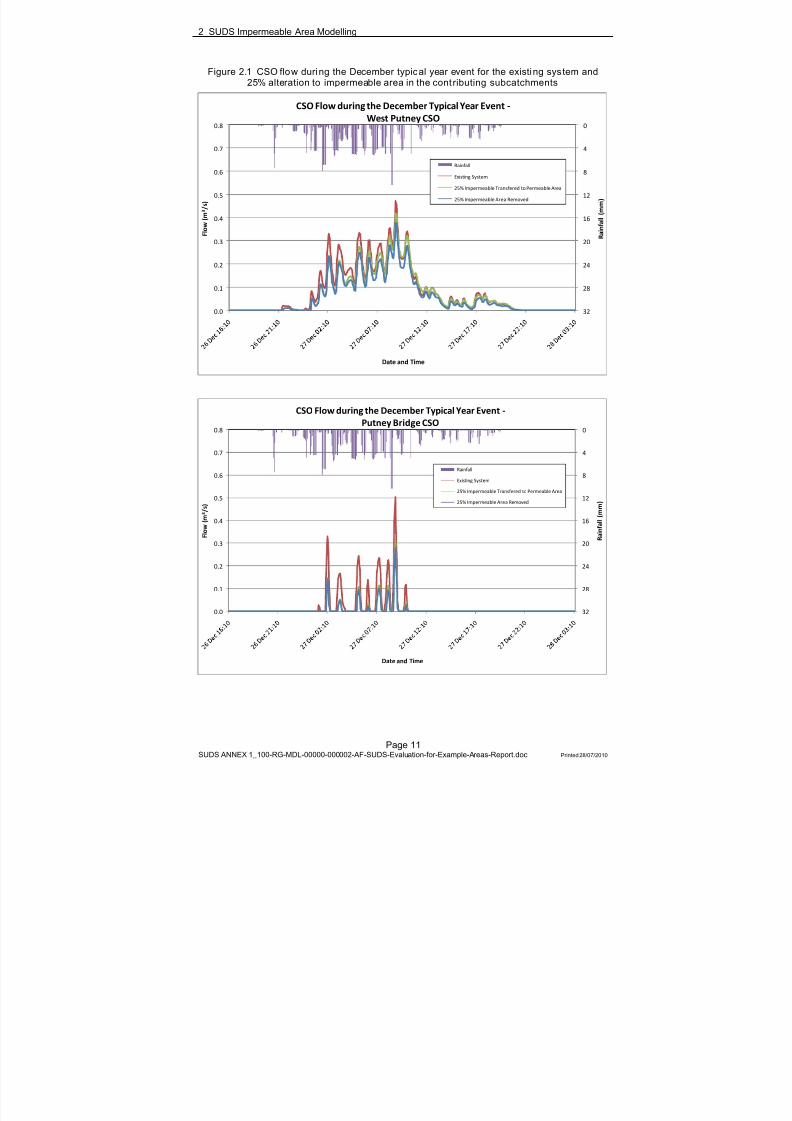
8/13/2019 Needs report: appendix E
http://slidepdf.com/reader/full/needs-report-appendix-e 194/235
2 SUDS Impermeable Area Modelling
Page 11SUDS ANNEX 1_100-RG-MDL-00000-000002-AF-SUDS-Evaluation-for-Example-Areas-Report.doc Printed 28/07/2010
Figure 2.1 CSO flow during the December typic al year event for the existi ng sys tem and25% alteration to impermeable area in the cont ributing subcatchments
0
4
8
12
16
20
24
28
320.0
0.1
0.2
0.3
0.4
0.5
0.6
0.7
0.8
R a i n f a l l ( m m )
F l o w
( m 3 / s )
Date and Time
CSO Flow during the December Typical Year Event ‐West Putney CSO
Rainfall
Existing System
25% Impermeable Transfered to Permeable Area
25% Impermeable Area Removed
0
4
8
12
16
20
24
28
320.0
0.1
0.2
0.3
0.4
0.5
0.6
0.7
0.8
R a i n f a l l ( m m )
F l o w
( m 3 / s )
Date and Time
CSO Flow during the December Typical Year Event ‐Putney Bridge CSO
Rainfall
Existing System
25% Impermeable Transfered to Permeable Area
25% Impermeable Area Removed
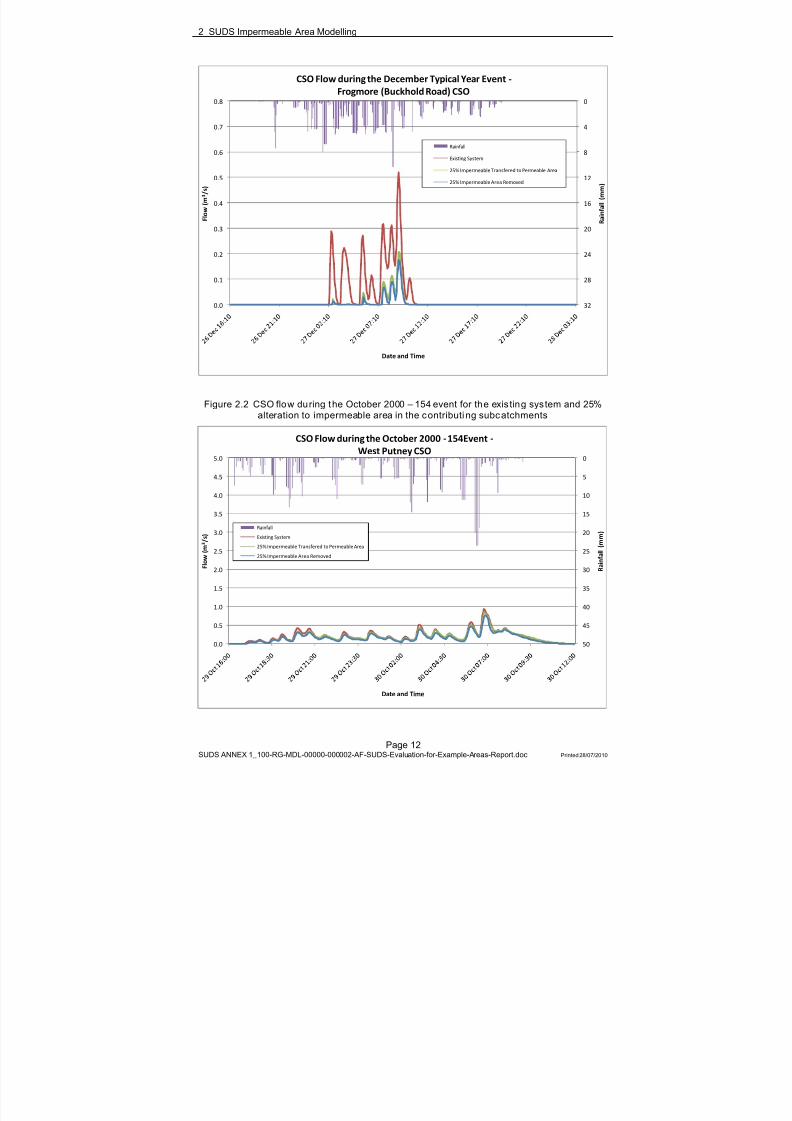
8/13/2019 Needs report: appendix E
http://slidepdf.com/reader/full/needs-report-appendix-e 195/235
2 SUDS Impermeable Area Modelling
Page 12SUDS ANNEX 1_100-RG-MDL-00000-000002-AF-SUDS-Evaluation-for-Example-Areas-Report.doc Printed 28/07/2010
0
4
8
12
16
20
24
28
320.0
0.1
0.2
0.3
0.4
0.5
0.6
0.7
0.8
R a i n f a l l ( m m )
F l o w
( m 3 / s )
Date and Time
CSO Flow during the December Typical Year Event ‐Frogmore (Buckhold Road) CSO
Rainfall
Existing System
25% Impermeable Transfered to Permeable Area
25% Impermeable Area Removed
Figure 2.2 CSO flow during t he October 2000 – 154 event for the exis ting sys tem and 25%
alteration to impermeable area in the c ontributi ng subc atchments
0
5
10
15
20
25
30
35
40
45
500.0
0.5
1.0
1.5
2.0
2.5
3.0
3.5
4.0
4.5
5.0
R a i n f a l l ( m m )
F l o w ( m 3 / s )
Date and Time
CSO Flow during the October 2000 ‐154Event ‐West Putney CSO
Rainfall
Existing System
25% Impermeable Transfered to Permeable Area
25% Impermeable Area Removed
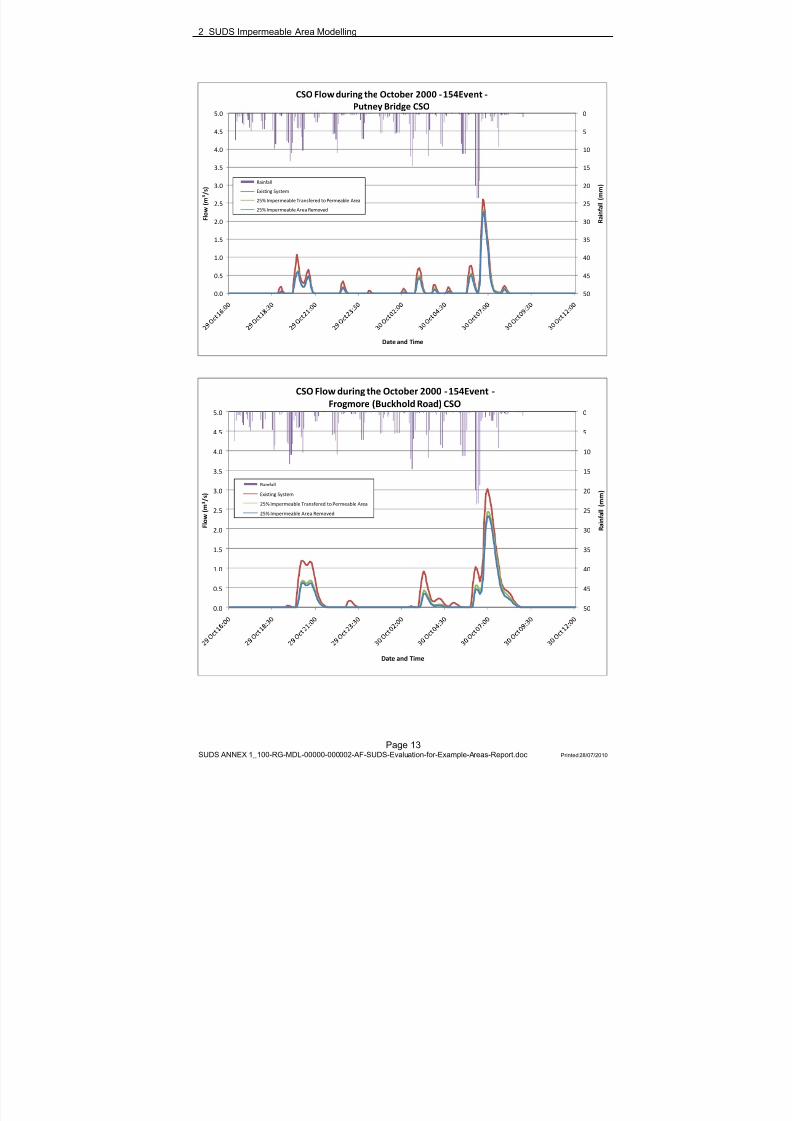
8/13/2019 Needs report: appendix E
http://slidepdf.com/reader/full/needs-report-appendix-e 196/235
2 SUDS Impermeable Area Modelling
Page 13SUDS ANNEX 1_100-RG-MDL-00000-000002-AF-SUDS-Evaluation-for-Example-Areas-Report.doc Printed 28/07/2010
0
5
10
15
20
25
30
35
40
45
500.0
0.5
1.0
1.5
2.0
2.5
3.0
3.5
4.0
4.5
5.0
R a i n f a l l ( m m )
F l o w
( m 3 / s )
Date and Time
CSO Flow during the October 2000 ‐154Event ‐Putney Bridge CSO
Rainfall
Existing System
25% Impermeable Transfered to Permeable Area
25% Impermeable Area Removed
0
5
10
15
20
25
30
35
40
45
500.0
0.5
1.0
1.5
2.0
2.5
3.0
3.5
4.0
4.5
5.0
R a i n f a l l ( m m )
F l o w
( m 3 / s )
Date and Time
CSO Flow during the October 2000 ‐154Event ‐Frogmore (Buckhold Road) CSO
Rainfall
Existing System
25% Impermeable Transfered to Permeable Area
25% Impermeable Area Removed
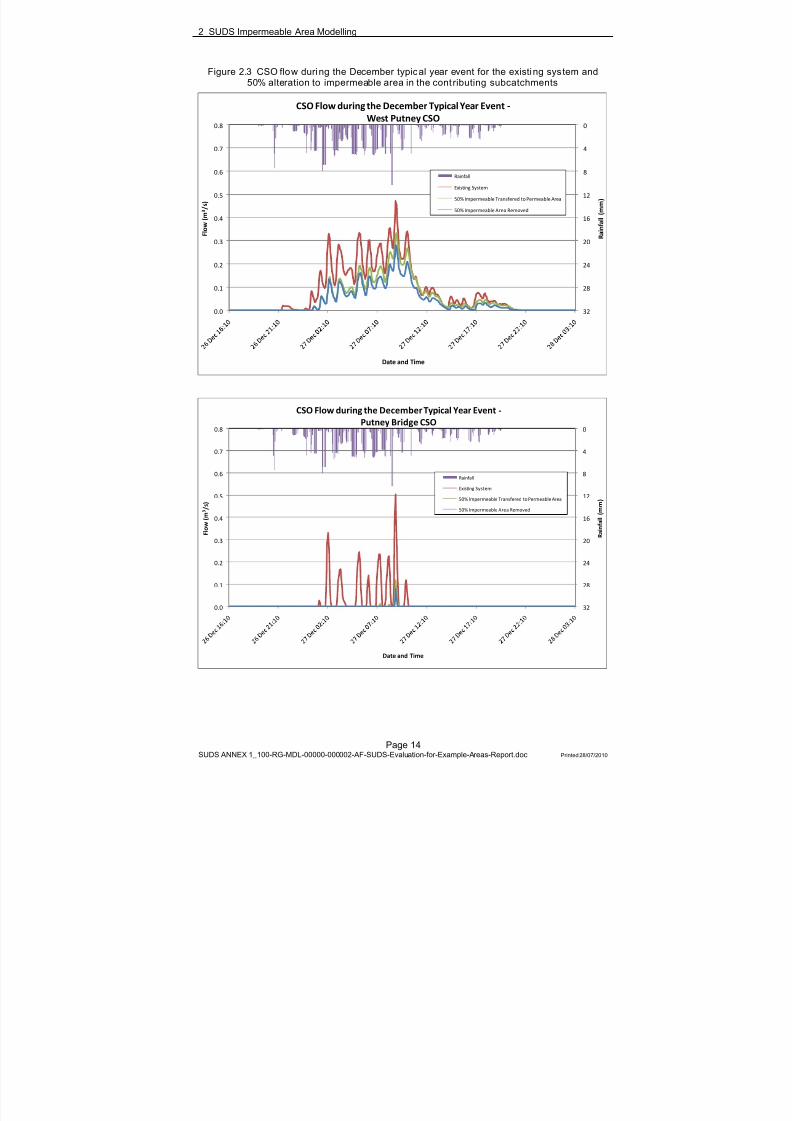
8/13/2019 Needs report: appendix E
http://slidepdf.com/reader/full/needs-report-appendix-e 197/235
2 SUDS Impermeable Area Modelling
Page 14SUDS ANNEX 1_100-RG-MDL-00000-000002-AF-SUDS-Evaluation-for-Example-Areas-Report.doc Printed 28/07/2010
Figure 2.3 CSO flow during the December typic al year event for the existi ng sys tem and50% alteration to impermeable area in the cont ributing subcatchments
0
4
8
12
16
20
24
28
320.0
0.1
0.2
0.3
0.4
0.5
0.6
0.7
0.8
R a i n f a l l ( m m )
F l o w
( m 3 / s )
Date and Time
CSO Flow during the December Typical Year Event ‐West Putney CSO
Rainfall
Existing System
50% Impermeable Transfered to Permeable Area
50% Impermeable Area Removed
0
4
8
12
16
20
24
28
320.0
0.1
0.2
0.3
0.4
0.5
0.6
0.7
0.8
R a i n f a l l ( m m )
F l o w
( m 3 / s )
Date and Time
CSO Flow during the December Typical Year Event ‐Putney Bridge CSO
Rainfall
Existing System
50% Impermeable Transfered to Permeable Area
50% Impermeable Area Removed
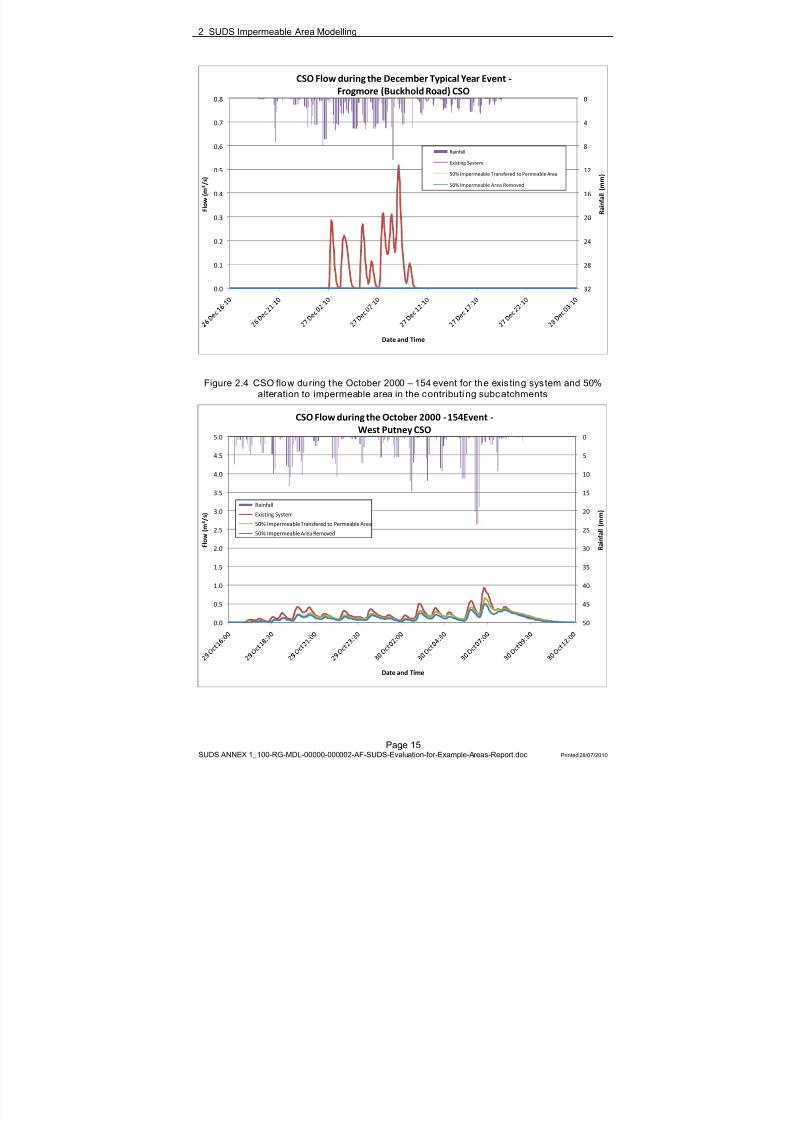
8/13/2019 Needs report: appendix E
http://slidepdf.com/reader/full/needs-report-appendix-e 198/235
2 SUDS Impermeable Area Modelling
Page 15SUDS ANNEX 1_100-RG-MDL-00000-000002-AF-SUDS-Evaluation-for-Example-Areas-Report.doc Printed 28/07/2010
0
4
8
12
16
20
24
28
320.0
0.1
0.2
0.3
0.4
0.5
0.6
0.7
0.8
R a i n f a l l ( m m )
F l o w
( m 3 / s )
Date and Time
CSO Flow during the December Typical Year Event ‐Frogmore (Buckhold Road) CSO
Rainfall
Existing System
50% Impermeable Transfered to Permeable Area
50% Impermeable Area Removed
Figure 2.4 CSO flow during t he October 2000 – 154 event for the exis ting sys tem and 50%alteration to impermeable area in the c ontributi ng subc atchments
0
5
10
15
20
25
30
35
40
45
500.0
0.5
1.0
1.5
2.0
2.5
3.0
3.5
4.0
4.5
5.0
R a i n f a l l ( m m )
F l o w
( m 3 / s )
Date and Time
CSO Flow during the October 2000 ‐154Event ‐West Putney CSO
Rainfall
Existing System
50% Impermeable Transfered to Permeable Area
50% Impermeable Area Removed
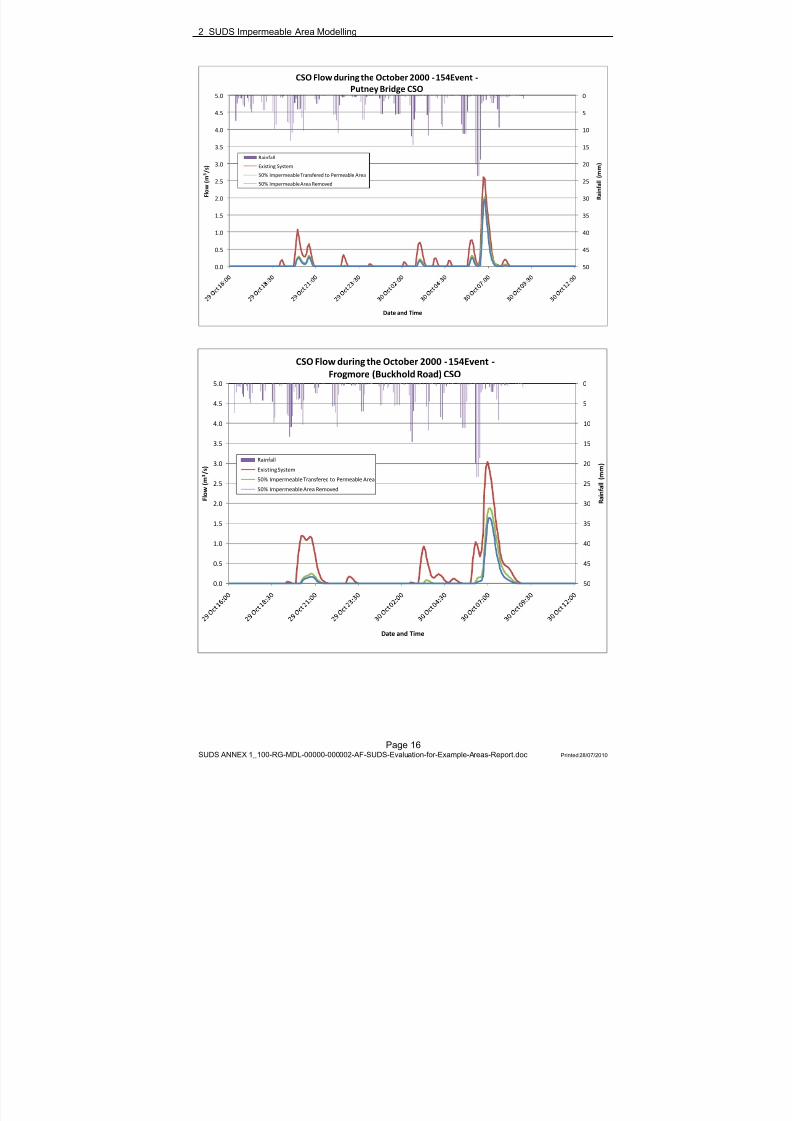
8/13/2019 Needs report: appendix E
http://slidepdf.com/reader/full/needs-report-appendix-e 199/235
2 SUDS Impermeable Area Modelling
Page 16SUDS ANNEX 1_100-RG-MDL-00000-000002-AF-SUDS-Evaluation-for-Example-Areas-Report.doc Printed 28/07/2010
0
5
10
15
20
25
30
35
40
45
500.0
0.5
1.0
1.5
2.0
2.5
3.0
3.5
4.0
4.5
5.0
R a i n f a l l ( m m )
F l o w
( m 3 / s )
Date and Time
CSO Flow during the October 2000 ‐154Event ‐Putney Bridge CSO
Rainfall
Existing System
50% Impermeable Transfered to Permeable Area
50% Impermeable Area Removed
0
5
10
15
20
25
30
35
40
45
500.0
0.5
1.0
1.5
2.0
2.5
3.0
3.5
4.0
4.5
5.0
R a i n f a l l ( m m )
F l o w
( m 3 / s )
Date and Time
CSO Flow during the October 2000 ‐154Event ‐Frogmore (Buckhold Road) CSO
Rainfall
Existing System
50% Impermeable Transfered to Permeable Area
50% Impermeable Area Removed
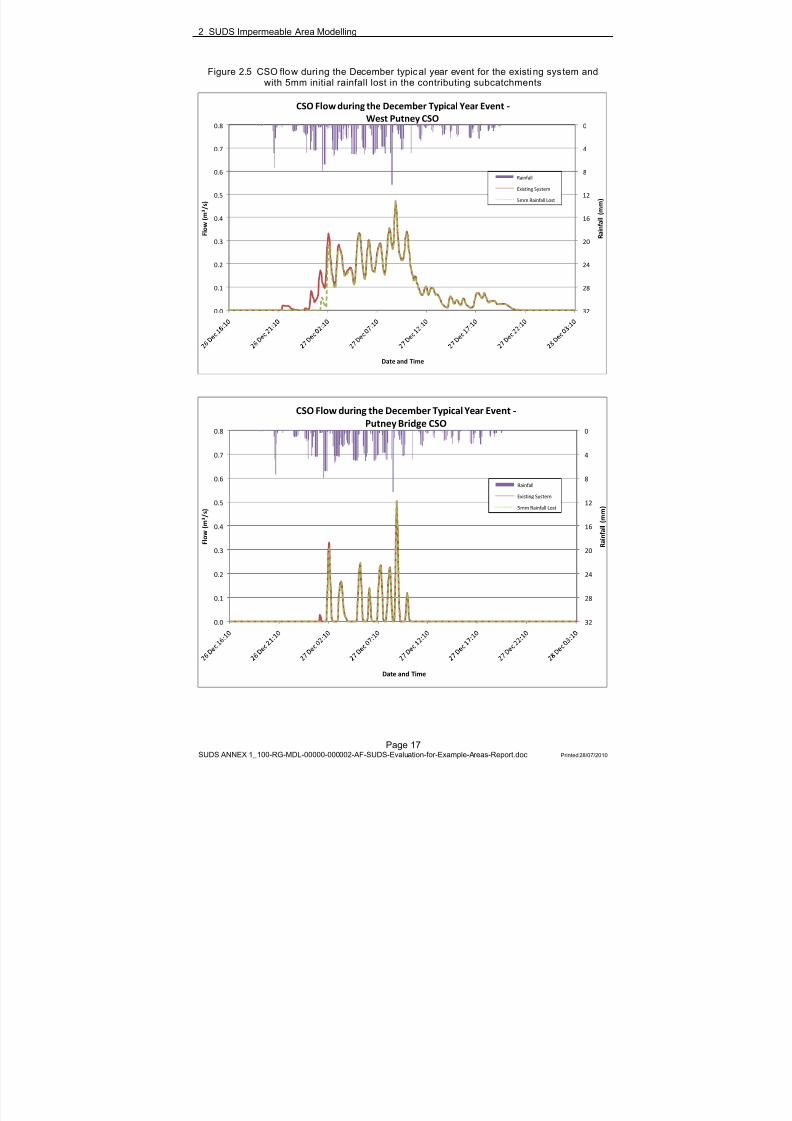
8/13/2019 Needs report: appendix E
http://slidepdf.com/reader/full/needs-report-appendix-e 200/235
2 SUDS Impermeable Area Modelling
Page 17SUDS ANNEX 1_100-RG-MDL-00000-000002-AF-SUDS-Evaluation-for-Example-Areas-Report.doc Printed 28/07/2010
Figure 2.5 CSO flow during the December typic al year event for the existi ng sys tem andwith 5mm initial rainfall lost in the contributing subcatchments
0
4
8
12
16
20
24
28
320.0
0.1
0.2
0.3
0.4
0.5
0.6
0.7
0.8
R a i n f a l l ( m m )
F l o w
( m 3 / s )
Date and Time
CSO Flow during the December Typical Year Event ‐West Putney CSO
Rainfall
Existing System
5mm Rainfall Lost
0
4
8
12
16
20
24
28
320.0
0.1
0.2
0.3
0.4
0.5
0.6
0.7
0.8
R a i n f a l l ( m m )
F l o w
( m 3 / s )
Date and Time
CSO Flow
during
the
December
Typical
Year
Event
‐Putney Bridge CSO
Rainfall
Existing System
5mm Rainfall Lost
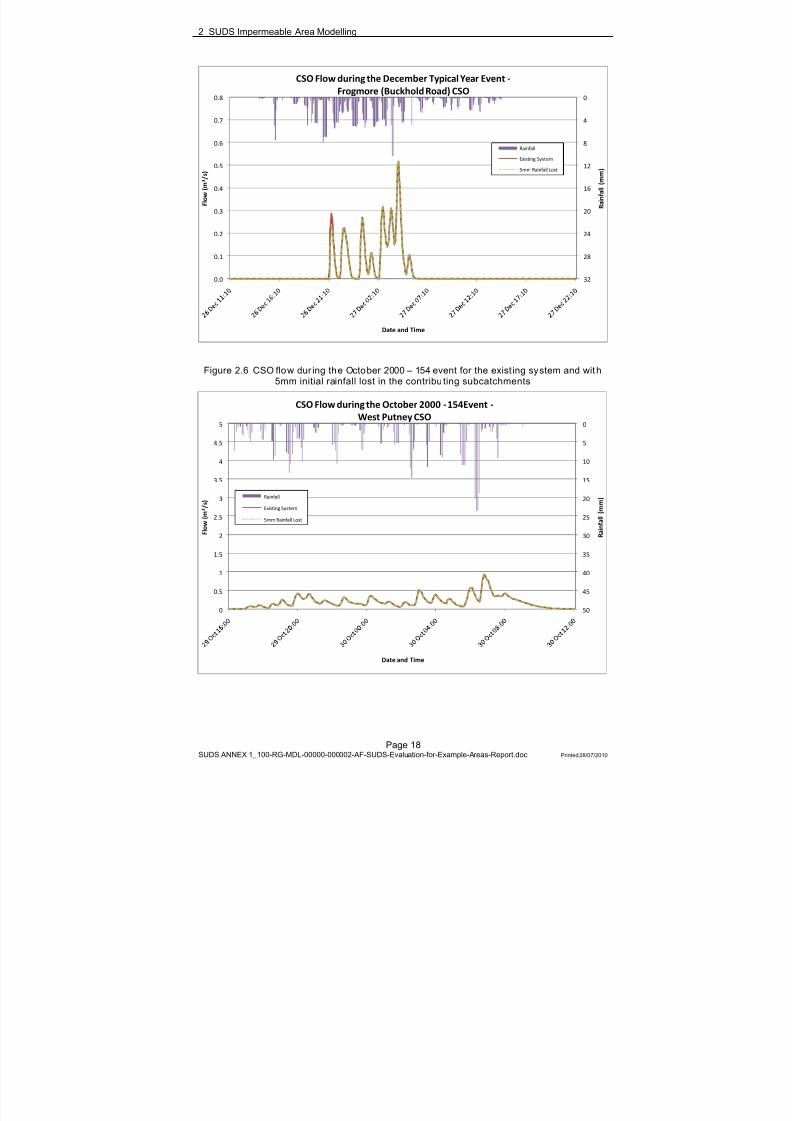
8/13/2019 Needs report: appendix E
http://slidepdf.com/reader/full/needs-report-appendix-e 201/235
2 SUDS Impermeable Area Modelling
Page 18SUDS ANNEX 1_100-RG-MDL-00000-000002-AF-SUDS-Evaluation-for-Example-Areas-Report.doc Printed 28/07/2010
0
4
8
12
16
20
24
28
320.0
0.1
0.2
0.3
0.4
0.5
0.6
0.7
0.8
R a i n f a l l ( m m )
F l o w
( m 3 / s )
Date and Time
CSO Flow during the December Typical Year Event ‐Frogmore (Buckhold Road) CSO
Rainfall
Existing System
5mm Rainfall Lost
Figure 2.6 CSO flow dur ing the October 2000 – 154 event for the exist ing system and wit h5mm initial rainfall lost in the contribu ting subcatchments
0
5
10
15
20
25
30
35
40
45
500
0.5
1
1.5
2
2.5
3
3.5
4
4.5
5
R a i n f a l l ( m m )
F l o w
( m 3 / s )
Date and Time
CSO Flow during the October 2000 ‐154Event ‐
West Putney CSO
Rainfall
Existing System
5mm Rainfall Lost
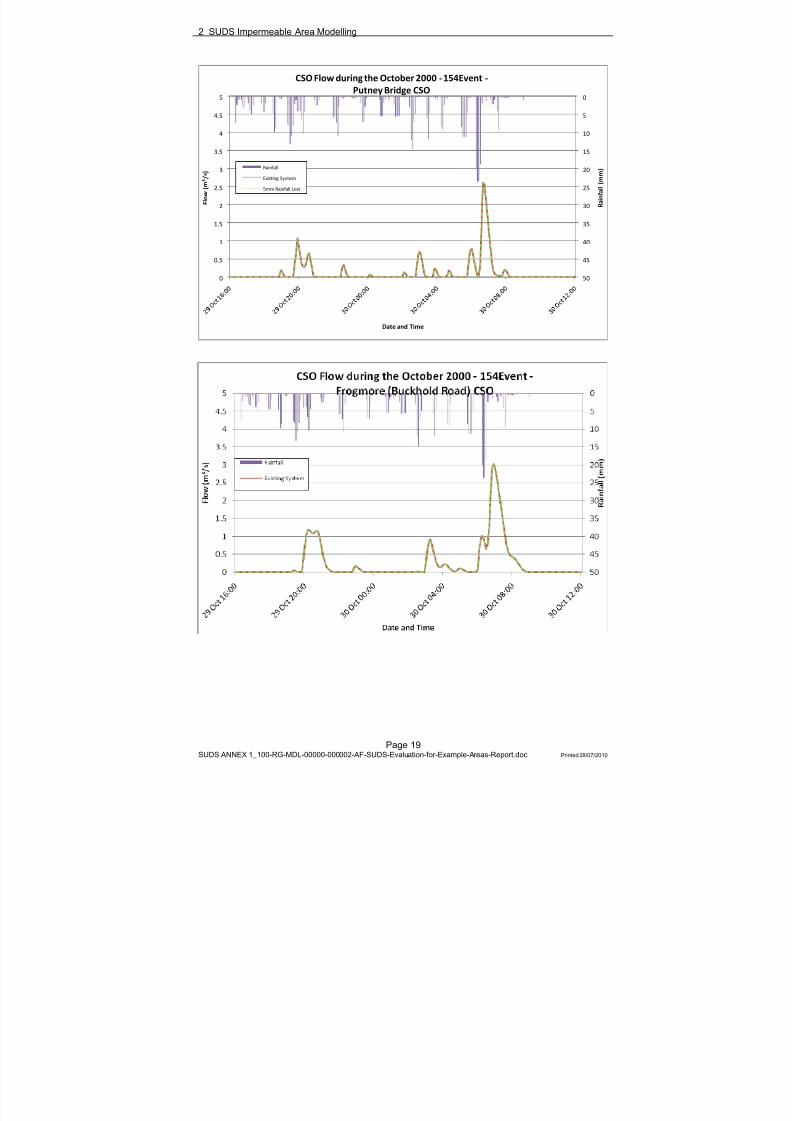
8/13/2019 Needs report: appendix E
http://slidepdf.com/reader/full/needs-report-appendix-e 202/235
2 SUDS Impermeable Area Modelling
Page 19SUDS ANNEX 1_100-RG-MDL-00000-000002-AF-SUDS-Evaluation-for-Example-Areas-Report.doc Printed 28/07/2010
0
5
10
15
20
25
30
35
40
45
500
0.5
1
1.5
2
2.5
3
3.5
4
4.5
5
R a i n f a l l ( m m )
F l o w
( m 3 / s )
Date and Time
CSO Flow during the October 2000 ‐154Event ‐Putney Bridge CSO
Rainfall
Existing System
5mm Rainfall Lost
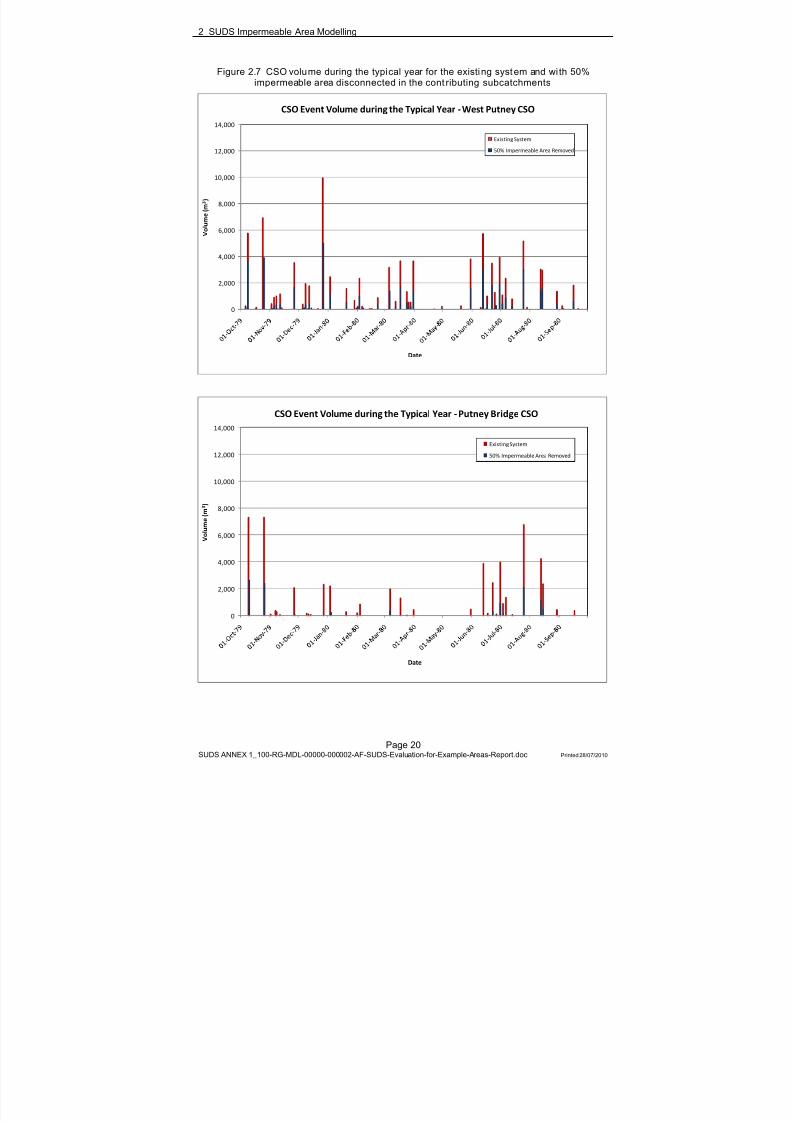
8/13/2019 Needs report: appendix E
http://slidepdf.com/reader/full/needs-report-appendix-e 203/235
2 SUDS Impermeable Area Modelling
Page 20SUDS ANNEX 1_100-RG-MDL-00000-000002-AF-SUDS-Evaluation-for-Example-Areas-Report.doc Printed 28/07/2010
Figure 2.7 CSO volume during the typical year for the existi ng syst em and wi th 50%impermeable area disconnected in the cont ributing subcatchments
0
2,000
4,000
6,000
8,000
10,000
12,000
14,000
V o l u m e ( m 3 )
Date
CSO Event Volume during the Typical Year ‐West Putney CSO
Existing System
50% Impermeable Area Removed
0
2,000
4,000
6,000
8,000
10,000
12,000
14,000
V o l u m e ( m 3 )
Date
CSO Event Volume during the Typical Year ‐Putney Bridge CSO
Existing System
50% Impermeable Area Removed
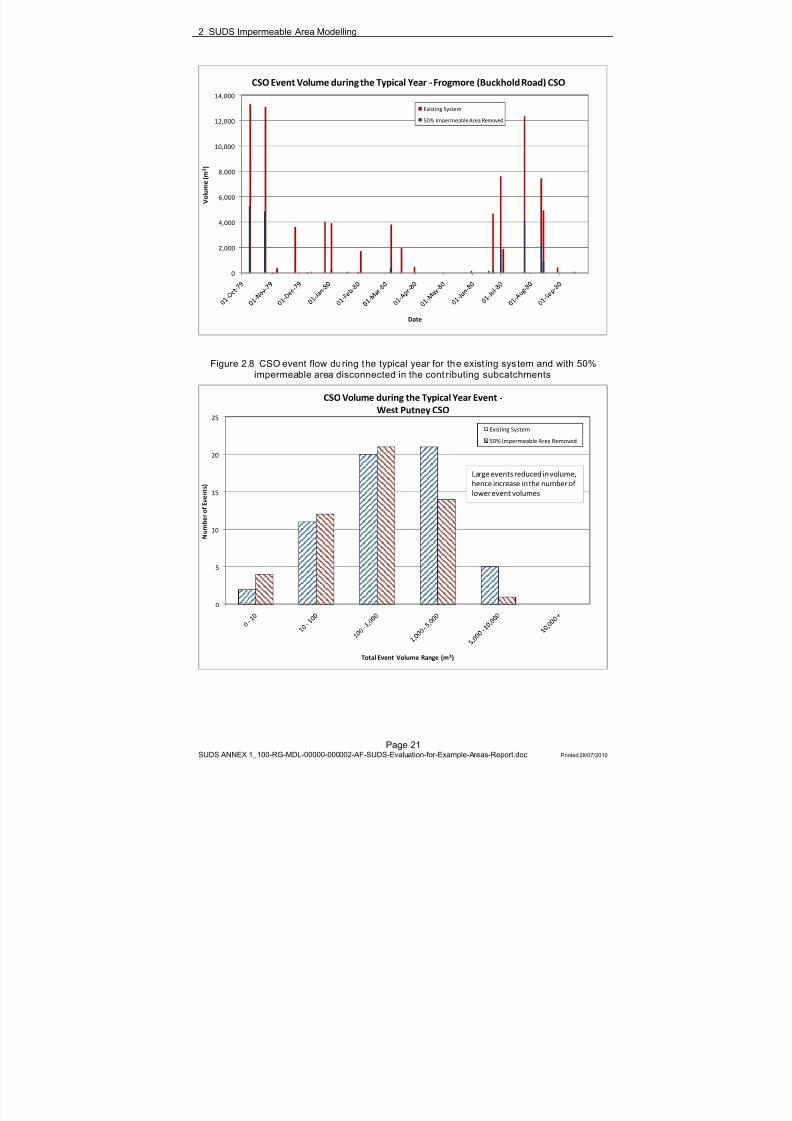
8/13/2019 Needs report: appendix E
http://slidepdf.com/reader/full/needs-report-appendix-e 204/235
2 SUDS Impermeable Area Modelling
Page 21SUDS ANNEX 1_100-RG-MDL-00000-000002-AF-SUDS-Evaluation-for-Example-Areas-Report.doc Printed 28/07/2010
0
2,000
4,000
6,000
8,000
10,000
12,000
14,000
V o l u m e ( m 3 )
Date
CSO Event Volume during the Typical Year ‐Frogmore (Buckhold Road) CSO
Existing System
50% Impermeable Area Removed
Figure 2.8 CSO event flow during the typical year for the exist ing sys tem and with 50%impermeable area disconnected in the cont ributing subcatchments
0
5
10
15
20
25
N u m b e r o f E v e n t s )
Total Event Volume Range (m 3)
CSO Volume during the Typical Year Event ‐West Putney CSO
Existing System
50% Impermeable Area Removed
Large events reduced in volume, hence increase in the number of lower event volumes
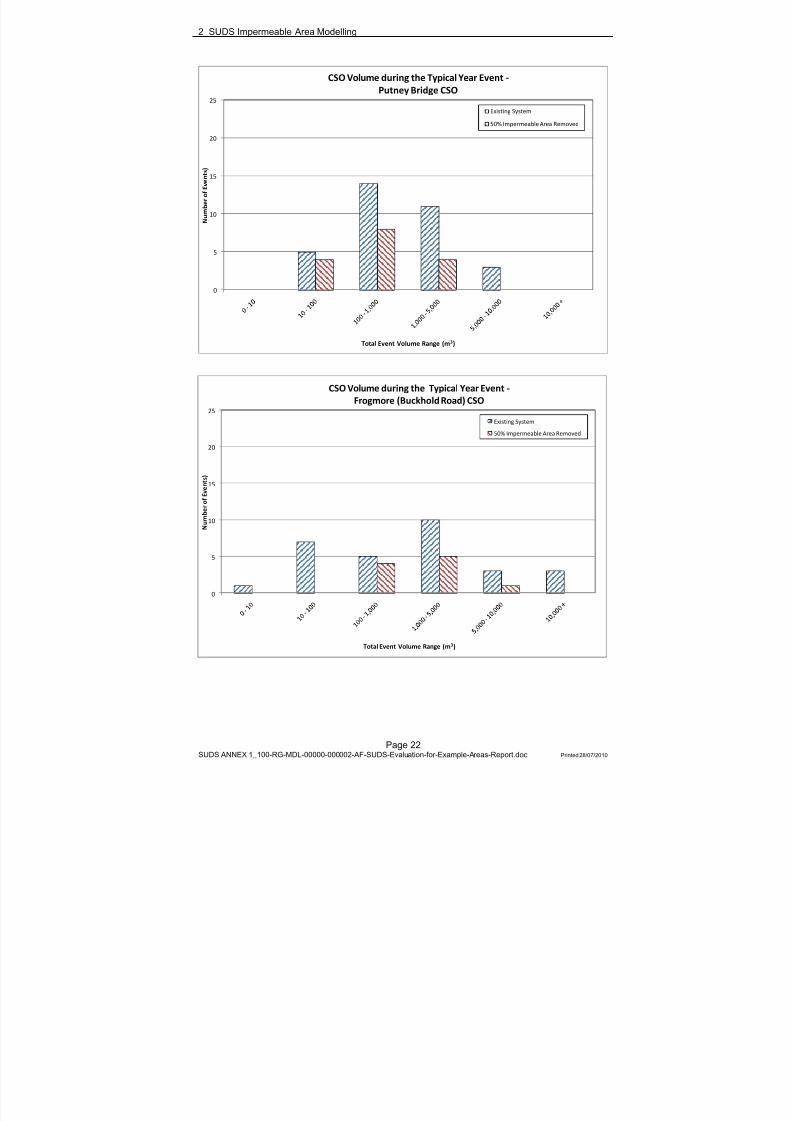
8/13/2019 Needs report: appendix E
http://slidepdf.com/reader/full/needs-report-appendix-e 205/235
2 SUDS Impermeable Area Modelling
Page 22SUDS ANNEX 1_100-RG-MDL-00000-000002-AF-SUDS-Evaluation-for-Example-Areas-Report.doc Printed 28/07/2010
0
5
10
15
20
25
N u m b e r o f E v e n t s )
Total Event Volume Range (m 3)
CSO Volume during the Typical Year Event ‐Putney Bridge CSO
Existing System
50% Impermeable Area Removed
0
5
10
15
20
25
N u m b e r o f E v e n t s )
Total Event Volume Range (m 3)
CSO Volume during the Typical Year Event ‐Frogmore (Buckhold Road) CSO
Existing System
50% Impermeable Area Removed
8/13/2019 Needs report: appendix E
http://slidepdf.com/reader/full/needs-report-appendix-e 206/235
3 PWG Disconnection Strategy Modelling
Page 23SUDS ANNEX 1_100-RG-MDL-00000-000002-AF-SUDS-Evaluation-for-Example-Areas-Report.doc Printed 28/07/2010
3 PWG DISCONNECTION STRATEGY MODELLING
3.1 Introduction
The London Tideway Tunnels (LTT) Model of the existing system was used to represent the impact
of the disconnection strategy options (supplied by PWG in May 2009) for the West Putney, PutneyBridge and Frogmore (Buckhold Road) Combined Sewer Overflow (CSO) catchments. Thedisconnection options are defined in the PWG Report ‘Potential source control and SUDSapplications: Land use and retrofit options’.
Although the results of the modelling of these options are included here, PWG subsequentlydeveloped a refined approach and identified ‘final disconnection scenarios’ which had a reducedimpact on impermeable area reduction. The refined disconnection strategy corresponds toapproximately 37% removal of the existing impermeable area rather than the 70 to 80% reported inthis section. However the methodology described would apply to the lower figures which as yethave not been modelled.
3.2 MethodThe disconnection strategy for the three CSO catchments used the “MasterMap” mapping layer tosplit the contributing subcatchments into areas of permeable and impermeable. The impermeablearea is then further spilt into areas where initial loss of rainwater (eg, with the use of blue-roofs)can be applied, areas where storage attenuation can be implemented, areas of impermeablesurfaces which can be transferred to permeable and areas which will remain impermeable. Noareas were identified by PWG for complete removal (through storm water separation).
The contributing area with initial losses is representative of a SUDS retention device that provides25mm of storage across its associated area. This was modelled as having 25mm depth of initialstorage which when exceeded would then contribute to the sewer network in the same way as theimpermeable area.
The disconnection strategy was applied to each of the InfoWorks Model subcatchments whichcontribute to the three CSOs by modifying the subcatchment parameters (areas). The followingsection outlines the specific changes made to each of the three CSO areas. The typical yearresults for each of the three CSOs are shown alongside the “Mastermap” subcatchments in figures3.11 and 3.12 at the end of this section.
3.3 West Putney
3.3.1 Catchment Analys is
The InfoWorks Model has seven subcatchments upstream of the West Putney CSO with theproperties shown in Table 3.1. The “MasterMap” characterisation of the West Putneysubcatchment is shown in Figure 3.1.
This exercise was undertaken for all of the seven subcatchments contributing to the West PutneyCSO and the PWG disconnection strategy results are shown in Table 3.2.

8/13/2019 Needs report: appendix E
http://slidepdf.com/reader/full/needs-report-appendix-e 207/235
3 PWG Disconnection Strategy Modelling
Page 24SUDS ANNEX 1_100-RG-MDL-00000-000002-AF-SUDS-Evaluation-for-Example-Areas-Report.doc Printed 28/07/2010
Table 3.1 InfoWorks existing model subcatchment areas contribut ing to t he West PutneyCSO
Subcatchment InfoWorks node ID
24751451a 21729601 21757452 21745701 24751451b 21743201 21743001 Totals
Total area (ha) 19.9 95.2 87.2 24.6 28.4 84.0 86.0 425ha
Impermeable
% 48.0 2.7 22.0 1.7 48.0 4.3 2.0 12%
ha 9.6 2.6 19.2 0.4 13.6 3.6 1.7 51ha
Permeable % 52.0 0.0 78.0 0.0 52.0 0.0 98.0 42%
ha 10.3 0.0 68.0 0.0 14.8 0.0 84.3 177ha
Areas may not add to totals due to rounding and permeable area not connected to the system.

8/13/2019 Needs report: appendix E
http://slidepdf.com/reader/full/needs-report-appendix-e 208/235
3 PWG Disconnection Strategy Modelling
Page 25SUDS ANNEX 1_100-RG-MDL-00000-000002-AF-SUDS-Evaluation-for-Example-Areas-Report.doc Printed 28/07/2010
Figure 3.1 West Putney Mastermap subcatchment characterisation
Mapping reproduced by permission of Ordnance Survey on behalf of HMSO. © CrownCopyright and database right 2009. All rights reserved. Ordnance Survey Licence number100019345

8/13/2019 Needs report: appendix E
http://slidepdf.com/reader/full/needs-report-appendix-e 209/235
3 PWG Disconnection Strategy Modelling
Page 26SUDS ANNEX 1_100-RG-MDL-00000-000002-AF-SUDS-Evaluation-for-Example-Areas-Report.doc Printed 28/07/2010
Table 3.2 PWG West Putney disc onnect ion st rategies
(% area allocated to each surface type)
Subcatchment InfoWorks node ID
24751451
a
2172960
1
2175745
2
2174570
1
24751451
b
2174320
1
2174300
1
Totals
Total area (ha) 19.9 95.2 87.2 24.6 28.4 84.0 86.0 425ha
Impermeable
% 12.68 0.58 5.61 0.83 14.19 0.59 1.65 3%
ha 2.5 0.6 4.9 0.2 4.0 0.5 1.4 14ha
Permeable % 65.26 0.25 78.96 0.24 64.86 0.62 98.02 44%
ha 13.0 0.2 68.9 0.1 18.4 0.5 84.3 185ha
Impermeable with initial
losses
% 2.17 0.40 4.81 0.02 1.81 0.77 0.02 1%
ha 0.4 0.4 4.2 0.0 0.5 0.7 0.0 6ha
Impermeable with
storage
% 19.90 1.47 10.62 0.58 19.13 2.30 0.32 5%ha 4.0 1.4 9.3 0.1 5.4 1.9 0.3 22
Areas may not add to totals due to rounding and permeable area not connected to the system.
The model was first amended so that the areas for each source control option matched the areasprovided by PWG. In InfoWorks this is done by adjusting area percentage in the ninesubcatchments. For example in subcatchment 21757452 the impermeable area was reduced from22.0% (19.2ha) to 5.61% (4.9ha) based on detailed analysis of surfaces and source controloptions.
Areas with initial losses were also added to the model subcatchments. For example subcatchment21757452 was estimated to have potential for 4.81% area subject to initial losses or an area of 4.2hectares.
The contributing area with storage was represented as lost in the subcatchment as the flow wouldbe captured by the SUDS storage volume and returned to the system after the CSO event.
All other current model parameters were left unchanged.
3.3.2 Results
The West Putney disconnection strategy model results are shown in Table 3.3 and graphicalrepresentation is shown in Figure 3.8.
Table 3.3 Comparison of CSO overflow results fo r the existing system and West PutneyPWG disconnection strategy
West Putney CSO –existing system
West Putney CSO – PWGdisconnection str ategy
Percentage(PWG vs existi ng)
December typ ical yearevent – volum e (m 3) 10,000 3,300 33%
October 2000 event –volume (m 3) 13,900 6,000 43%

8/13/2019 Needs report: appendix E
http://slidepdf.com/reader/full/needs-report-appendix-e 210/235
3 PWG Disconnection Strategy Modelling
Page 27SUDS ANNEX 1_100-RG-MDL-00000-000002-AF-SUDS-Evaluation-for-Example-Areas-Report.doc Printed 28/07/2010
Table 3.3 shows the reduction in CSO volume caused by implementing the PWG disconnectionstrategy in the West Putney catchment. During both the December typical year and October 2000event the overflow from the CSO is significantly reduced. This is expected given the reduction inimpermeable area contributing runoff directly to the sewer network.
When compared to the 50% removal of impermeable area (sections 2.3.3 and 2.3.4) the PWGdisconnection strategy produces approximately 2,000m 3 less overflow during both events.
Table 3.4 Comparison of CSO overflow results during the typical year for the existi ngsystem and West Putney PWG disconnection strategy
West Putney CSO –existing system
West Putney CSO –disconnection str ategy
Percentage(PWG vs existing )
Typical year event –total volume (m 3) 94,800 21,900 23%
Typical year event –number of overflowevents (m 3)
59 39 66%
Table 3.4 shows the effect of the disconnection strategy on West Putney overflows during themodelled typical year. The total overflow volume is reduced by 77%, while the number ofoverflows is reduced by 34%. Figure 3.2 shows the range of overflow volumes during the typicalyear and compares these to the existing system in West Putney. It shows a reduction in thenumber of event overflows that produce more than 1000m 3 and the same number of events whichproduce less than 1000m 3. This is representative of events which originally experienced greateroverflow but which have fallen 1000m 3 due to the PWG disconnection strategy reducing eventoverflows.
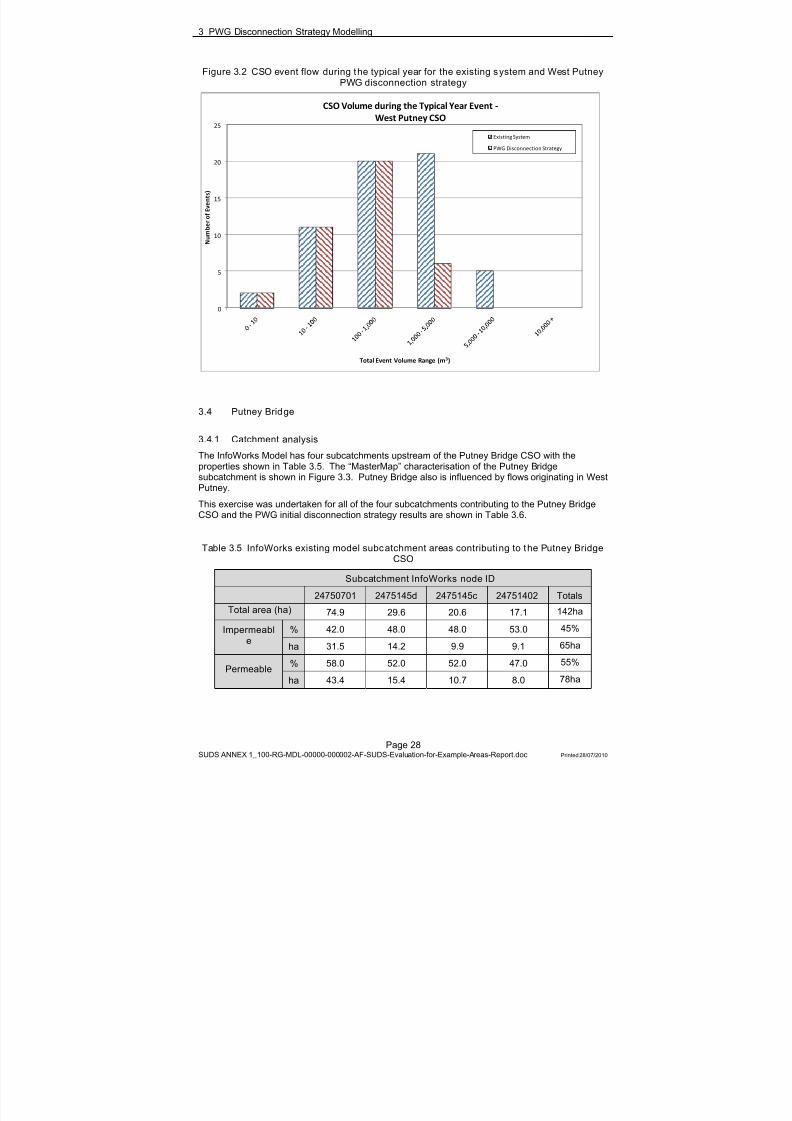
8/13/2019 Needs report: appendix E
http://slidepdf.com/reader/full/needs-report-appendix-e 211/235
3 PWG Disconnection Strategy Modelling
Page 28SUDS ANNEX 1_100-RG-MDL-00000-000002-AF-SUDS-Evaluation-for-Example-Areas-Report.doc Printed 28/07/2010
Figure 3.2 CSO event flow during t he typical year for the existing system and West PutneyPWG disconnection strategy
0
5
10
15
20
25
N u m b e r o f E v e n t s )
Total Event Volume Range (m 3)
CSO Volume during the Typical Year Event ‐West Putney CSO
Existing SystemPWG Disconnection Strategy
3.4 Putney Bridge
3.4.1 Catchment analysis
The InfoWorks Model has four subcatchments upstream of the Putney Bridge CSO with theproperties shown in Table 3.5. The “MasterMap” characterisation of the Putney Bridgesubcatchment is shown in Figure 3.3. Putney Bridge also is influenced by flows originating in WestPutney.
This exercise was undertaken for all of the four subcatchments contributing to the Putney BridgeCSO and the PWG initial disconnection strategy results are shown in Table 3.6.
Table 3.5 InfoWorks existing model subc atchment areas contributi ng to t he Putney BridgeCSO
Subcatchment InfoWorks node ID
24750701 2475145d 2475145c 24751402 TotalsTotal area (ha) 74.9 29.6 20.6 17.1 142ha
Impermeable
% 42.0 48.0 48.0 53.0 45%
ha 31.5 14.2 9.9 9.1 65ha
Permeable % 58.0 52.0 52.0 47.0 55%
ha 43.4 15.4 10.7 8.0 78ha
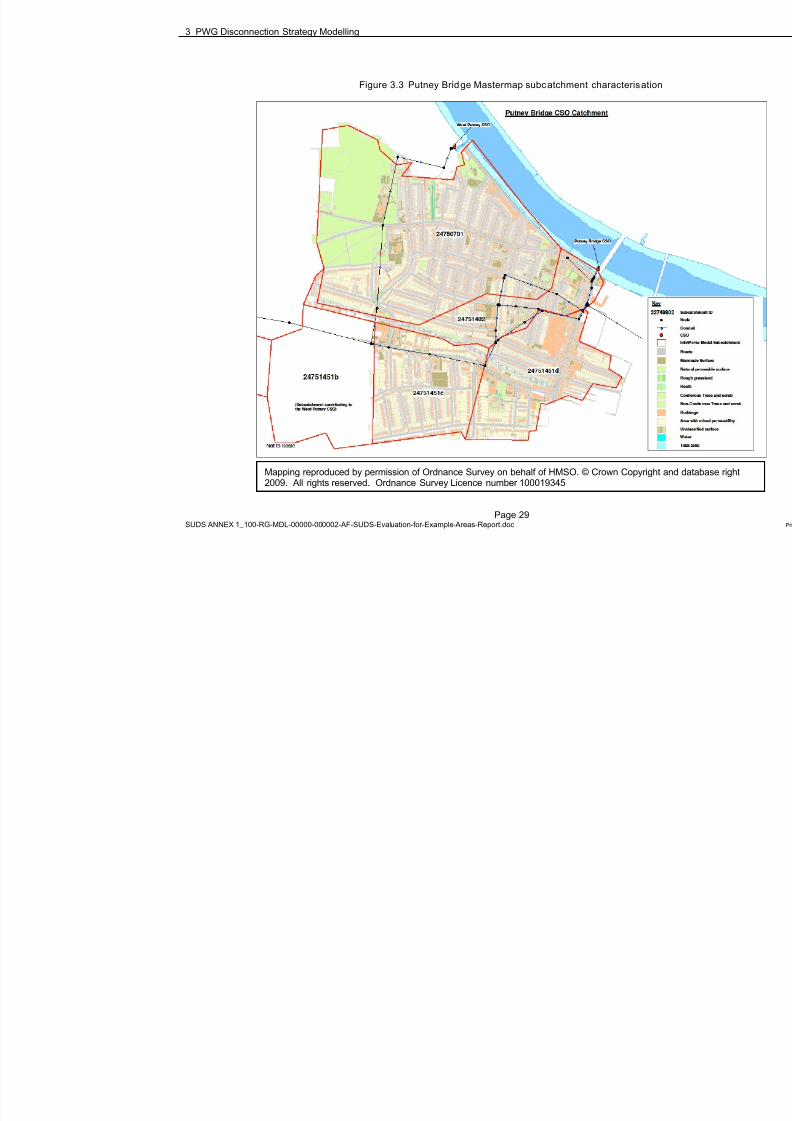
8/13/2019 Needs report: appendix E
http://slidepdf.com/reader/full/needs-report-appendix-e 212/235
3 PWG Disconnection Strategy Modelling
Page 29SUDS ANNEX 1_100-RG-MDL-00000-000002-AF-SUDS-Evaluation-for-Example-Areas-Report.doc
Figure 3.3 Putney Bridge Mastermap subc atchment characterisation
Mapping reproduced by permission of Ordnance Survey on behalf of HMSO. © Crown Copyright and database right2009. All rights reserved. Ordnance Survey Licence number 100019345

8/13/2019 Needs report: appendix E
http://slidepdf.com/reader/full/needs-report-appendix-e 213/235
3 PWG Disconnection Strategy Modelling
Page 30SUDS ANNEX 1_100-RG-MDL-00000-000002-AF-SUDS-Evaluation-for-Example-Areas-Report.doc Printed 28/07/2010
Table 3.6 PWG Putney Bridge disconnection strategies
(% area allocated to each surface type)
Subcatchment InfoWorks node ID
24750701 2475145d 2475145c 24751402 Totals
Total area (ha) 74.9 29.6 20.6 17.1 142ha
Impermeable
% 9.66 7.44 12.61 6.20 9%
ha 7.2 2.2 2.6 1.1 13ha
Permeable % 65.58 63.76 68.37 58.41 65%
ha 49.1 18.9 14.1 10.0 92ha
Impermeable with initial
losses
% 7.94 12.20 1.29 10.52 8%
ha 5.9 3.6 0.3 1.8 12
Impermeabl
e withstorage
% 16.82 16.59 17.73 24.87 18%
ha 12.6 4.9 3.7 4.3 26
Areas may not add to totals due to rounding.
The model was first amended so that the areas for each source control option matched the areasprovided by PWG. In InfoWorks this is done by adjusting area percentage in the ninesubcatchments. For example in subcatchment 24751402 the impermeable area was reduced from53.0% (9.1ha) to 6.20% (1.1ha) based on detailed analysis of surfaces and source control options.
Areas with initial losses were also added to the model subcatchments. For example subcatchment24751402 was estimated to have potential for 10.52% area subject to initial losses or an area of1.8 hectares.
The contributing area with storage was represented as lost in the subcatchment as the flow wouldbe captured by the SUDS storage volume and returned to the system after the CSO event.
All other current model parameters were left unchanged.
3.4.2 Results
The Putney Bridge disconnection strategy model results are shown in Table 3.7 and graphicalrepresentation is shown in Figure 3.9.
Table 3.7 Comparison of CSO overflow results for the existing syst em and Putney BridgePWG disconnection strategy
Putney Bri dge CSO –existing system
Putney Bridge CSO – PWGdisconnection str ategy
Percentage
(PWG vs existi ng)
December typ ical yearevent – volume (m 3) 2,300 0 0%
October 2000 event –volume (m 3) 9,100 2,300 25%
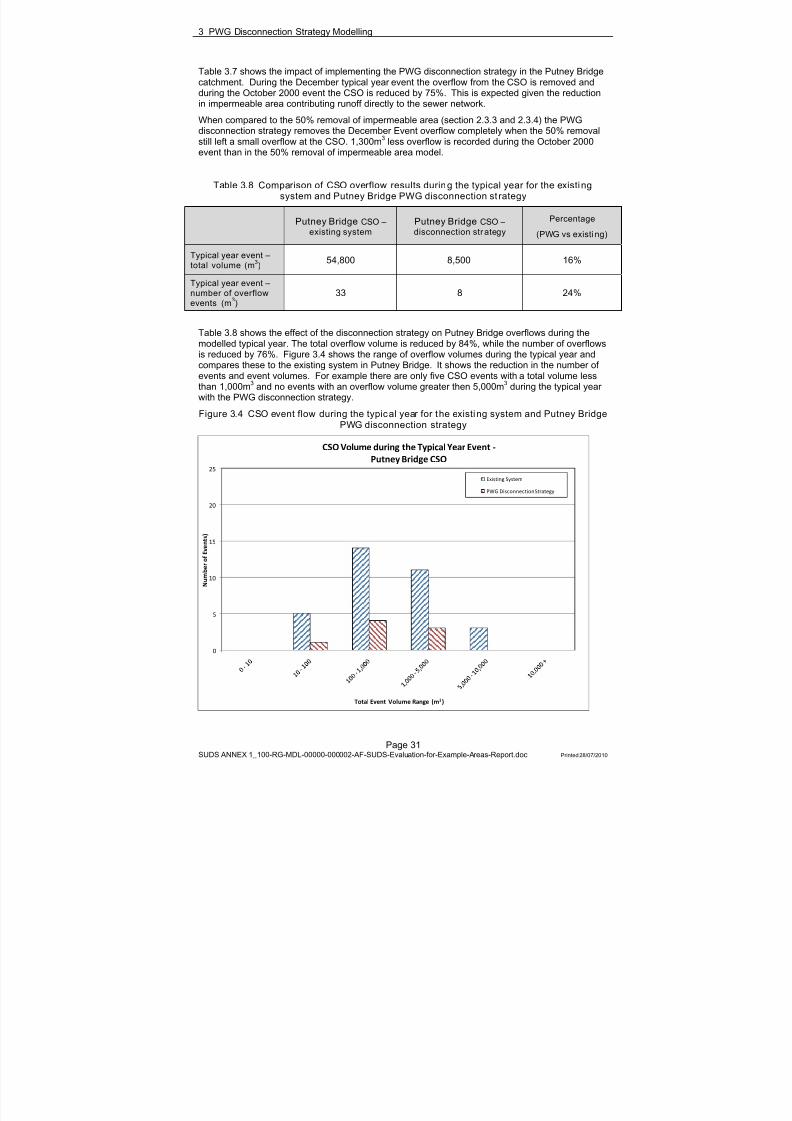
8/13/2019 Needs report: appendix E
http://slidepdf.com/reader/full/needs-report-appendix-e 214/235
3 PWG Disconnection Strategy Modelling
Page 31SUDS ANNEX 1_100-RG-MDL-00000-000002-AF-SUDS-Evaluation-for-Example-Areas-Report.doc Printed 28/07/2010
Table 3.7 shows the impact of implementing the PWG disconnection strategy in the Putney Bridgecatchment. During the December typical year event the overflow from the CSO is removed andduring the October 2000 event the CSO is reduced by 75%. This is expected given the reductionin impermeable area contributing runoff directly to the sewer network.
When compared to the 50% removal of impermeable area (section 2.3.3 and 2.3.4) the PWGdisconnection strategy removes the December Event overflow completely when the 50% removalstill left a small overflow at the CSO. 1,300m 3 less overflow is recorded during the October 2000event than in the 50% removal of impermeable area model.
Table 3.8 Comparison of CSO overflow results during the typical year for the existi ngsystem and Putney Bridge PWG disconnection st rategy
Putney Bridge CSO –existing system
Putney Bridge CSO –disconnection str ategy
Percentage
(PWG vs existi ng)
Typical year event –total volume (m 3) 54,800 8,500 16%
Typical year event –number of overflowevents (m 3)
33 8 24%
Table 3.8 shows the effect of the disconnection strategy on Putney Bridge overflows during themodelled typical year. The total overflow volume is reduced by 84%, while the number of overflowsis reduced by 76%. Figure 3.4 shows the range of overflow volumes during the typical year andcompares these to the existing system in Putney Bridge. It shows the reduction in the number ofevents and event volumes. For example there are only five CSO events with a total volume lessthan 1,000m 3 and no events with an overflow volume greater then 5,000m 3 during the typical yearwith the PWG disconnection strategy.
Figure 3.4 CSO event flow during the typic al year for t he existi ng system and Putney BridgePWG disconnection strategy
0
5
10
15
20
25
N u m b e r o f E v e n t s )
Total Event Volume Range (m 3)
CSO Volume during the Typical Year Event ‐Putney Bridge CSO
Existing System
PWG Disconnection Strategy

8/13/2019 Needs report: appendix E
http://slidepdf.com/reader/full/needs-report-appendix-e 215/235
3 PWG Disconnection Strategy Modelling
Page 32SUDS ANNEX 1_100-RG-MDL-00000-000002-AF-SUDS-Evaluation-for-Example-Areas-Report.doc Printed 28/07/2010
3.5 Frogmore (Buckhold Road)
3.5.1 Catchment analysis
The InfoWorks Model has nine subcatchments upstream of the Frogmore (Buckhold Road) CSOwith the properties shown in Table 3.9. The “MasterMap” characterisation of the Frogmore
(Buckhold Road) subcatchment is shown in Figure 3.5.This exercise was undertaken for all of the nine subcatchments contributing to the Frogmore(Buckhold Road) CSO and the PWG initial disconnection strategy results are shown in Table 3.10.

8/13/2019 Needs report: appendix E
http://slidepdf.com/reader/full/needs-report-appendix-e 216/235
3 PWG Disconnection Strategy Modelling
Page 33SUDS ANNEX 1_100-RG-MDL-00000-000002-AF-SUDS-Evaluation-for-Example-Areas-Report.doc
Table 3.9 InfoWorks existing model subcatchment areas cont ributing to the Frogmore (Buckhold Road) C
Subcatchment InfoWorks node ID
25740102 24749501 24743902 24736291 23749901 23741101
2373
a2373
Total area (ha) 69.2 38.5 21.8 95.3 88.7 72.9 10.4
Impermeable % 40.0 53.0 46.0 43.0 44.0 1.1 39.5
ha 27.7 20.4 10.0 41.0 39.0 0.8 4.1
Permeable % 60.0 47.0 54.0 57.0 56.0
88% in parks(permeable)
but area is notconnected to
system
6
ha 41.5 18.1 11.8 54.3 49.7 6.3
Areas may not add to totals due to rounding. Subcatchment 23741101 has a large proportion of permeable area which is not connected to the
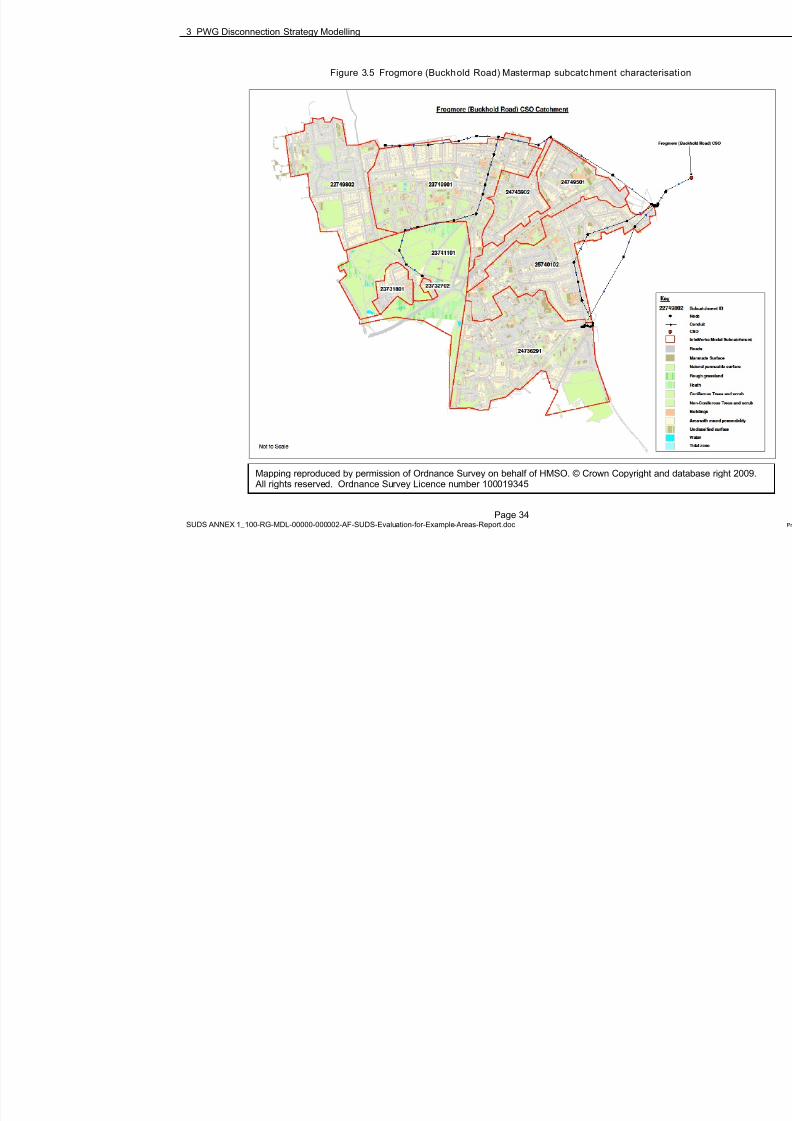
8/13/2019 Needs report: appendix E
http://slidepdf.com/reader/full/needs-report-appendix-e 217/235
3 PWG Disconnection Strategy Modelling
Page 34SUDS ANNEX 1_100-RG-MDL-00000-000002-AF-SUDS-Evaluation-for-Example-Areas-Report.doc
Figure 3.5 Frogmore (Buckhold Road) Mastermap subcatc hment characterisation
Mapping reproduced by permission of Ordnance Survey on behalf of HMSO. © Crown Copyright and database right 20 All rights reserved. Ordnance Survey Licence number 100019345

8/13/2019 Needs report: appendix E
http://slidepdf.com/reader/full/needs-report-appendix-e 218/235
3 PWG Disconnection Strategy Modelling
Page 35SUDS ANNEX 1_100-RG-MDL-00000-000002-AF-SUDS-Evaluation-for-Example-Areas-Report.doc
Table 3.10 PWG Frogmore (Buckhold Road) disconnection s trategies (% area alloc ated to each surface typ
Subcatchment InfoWorks node ID
25740102 24749501 24743902 24736291 23749901 23741101 23732702 23731801
Total area (ha) 69.2 38.5 21.8 95.3 88.7 72.9 1.4 9.
Impermeable% 10.98 9.08 10.32 9.77 8.97 0.49 7.24 11.9
ha 7.6 3.5 2.2 9.3 8.0 0.4 0.1 1
Permeable% 68.37 56.39 65.10 66.20 65.63 0.03 75.10 70.6
ha 47.3 21.7 14.2 63.1 58.2 0.0 1.1 6
Impermeablewith initial
losses
% 3.82 7.26 3.91 4.02 5.24 0.01 1.47 3.3
ha 2.6 2.8 0.9 3.8 4.6 0.0 0.0 0
Impermeablewith storage
% 16.83 27.27 20.67 20.01 20.16 0.59 16.19 14.1
ha 11.6 10.5 4.5 19.1 17.9 0.4 0.2 1
Areas may not add to totals due to rounding. Subcatchment 23741101 has a large proportion of permeable area which is not connected to the

8/13/2019 Needs report: appendix E
http://slidepdf.com/reader/full/needs-report-appendix-e 219/235
3 PWG Disconnection Strategy Modelling
Page 36SUDS ANNEX 1_100-RG-MDL-00000-000002-AF-SUDS-Evaluation-for-Example-Areas-Report.doc Printed 28/07/2010
The model was first amended so that the areas for each source control option matched the areasprovided by PWG. In InfoWorks this is done by adjusting area percentage in the ninesubcatchments. For example in subcatchment 25740102 the impermeable area was reduced from40.0% (69.2ha) to 10.98% (7.6ha) based on detailed analysis of surfaces and source controloptions.
Areas with initial losses were also added to the model subcatchments. For example subcatchment25740102 was estimated to have potential for 3.82% area subject to initial losses or an area of 2.6hectares.
The contributing area with storage was represented as lost in the subcatchment as the flow wouldbe captured by the SUDS storage volume and returned to the system after the CSO event.
All other current model parameters were left unchanged.
3.5.2 Results
The Frogmore disconnection strategy model results are shown in Table 3.11 and graphicalrepresentation is shown in Figure 3.10.
Table 3.11 Comparison of CSO overflow results fo r the existing system and Frogmore(Buckhold Road) PWG disconnection strategy
Frogmore (BuckholdRoad) CSO – existing
system
Frogmore (Buckhold Road)CSO – PWG discon nectio n
strategy
Percentage
(PWG vs existi ng)
December typ ical yearevent – volume (m 3) 4,000 0 0%
October 2000 event –volume (m 3) 17,700 2,500 14%
Table 3.11 shows the impact of implementing the PWG disconnection strategy in the Frogmore(Buckhold Road) catchment. During the December typical year event the overflow from the CSOis totally removed and during the October 2000 event the CSO volume is reduced by 86%. This isexpected given the reduction in impermeable area contributing runoff directly to the sewer network.
When compared to the 50% removal of impermeable area (section 2.3.3 and 2.3.4) the PWGdisconnection strategy controls the December typical year event and results in 2,200m 3 lessoverflow during the October 2000 event.
Table 3.12 Comparison of CSO overflow results during the typical year for the existi ngsystem and Frogmore (Buckhol d Road) PWG disconnection s trategy
Frogmore (BuckholdRoad) CSO – existin g
system
Frogmore (Buckhold Road)CSO – disconnection
strategy
Percentage
(PWG vs existi ng)
Typical year event –total volume (m 3) 94,500 1,700 2%
Typical year event –number of overflowevents (m 3)
29 2 7%
Table 3.12 shows the effect of the disconnection strategy on Frogmore (Buckhold Road) overflows
during the modelled typical year. The total overflow volume is reduced by 98%, while the numberof overflows is reduced from 29 to two for the existing and PWG models respectively. Figure 3.6shows the range of overflow volumes during the typical year and compares these to the existing
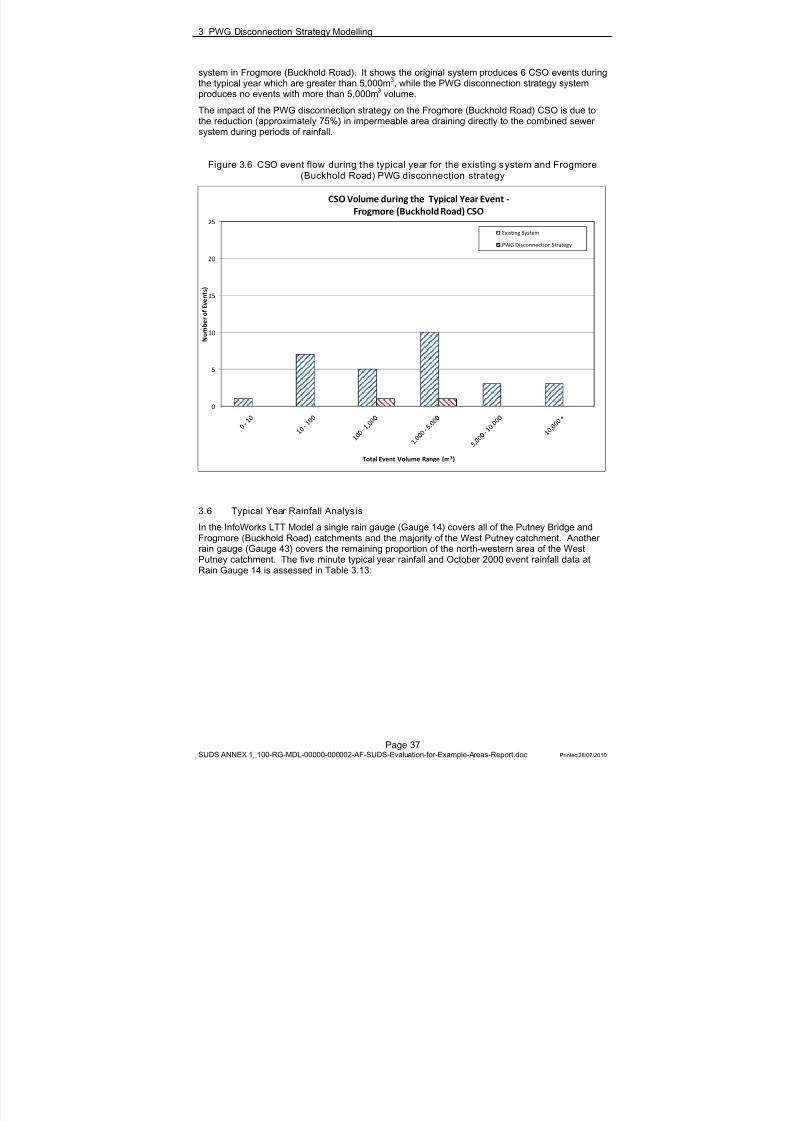
8/13/2019 Needs report: appendix E
http://slidepdf.com/reader/full/needs-report-appendix-e 220/235
3 PWG Disconnection Strategy Modelling
Page 37SUDS ANNEX 1_100-RG-MDL-00000-000002-AF-SUDS-Evaluation-for-Example-Areas-Report.doc Printed 28/07/2010
system in Frogmore (Buckhold Road). It shows the original system produces 6 CSO events duringthe typical year which are greater than 5,000m 3, while the PWG disconnection strategy systemproduces no events with more than 5,000m 3 volume.
The impact of the PWG disconnection strategy on the Frogmore (Buckhold Road) CSO is due tothe reduction (approximately 75%) in impermeable area draining directly to the combined sewersystem during periods of rainfall.
Figure 3.6 CSO event flow during t he typical year for the existing system and Frogmore(Buckhold Road) PWG disconnection strategy
0
5
10
15
20
25
N u m b e r o f E v e n t s )
Total Event Volume Range (m 3)
CSO Volume during the Typical Year Event ‐Frogmore (Buckhold Road) CSO
Existing System
PWG Disconnection Strategy
3.6 Typical Year Rainfall Analys is
In the InfoWorks LTT Model a single rain gauge (Gauge 14) covers all of the Putney Bridge andFrogmore (Buckhold Road) catchments and the majority of the West Putney catchment. Anotherrain gauge (Gauge 43) covers the remaining proportion of the north-western area of the WestPutney catchment. The five minute typical year rainfall and October 2000 event rainfall data atRain Gauge 14 is assessed in Table 3.13:
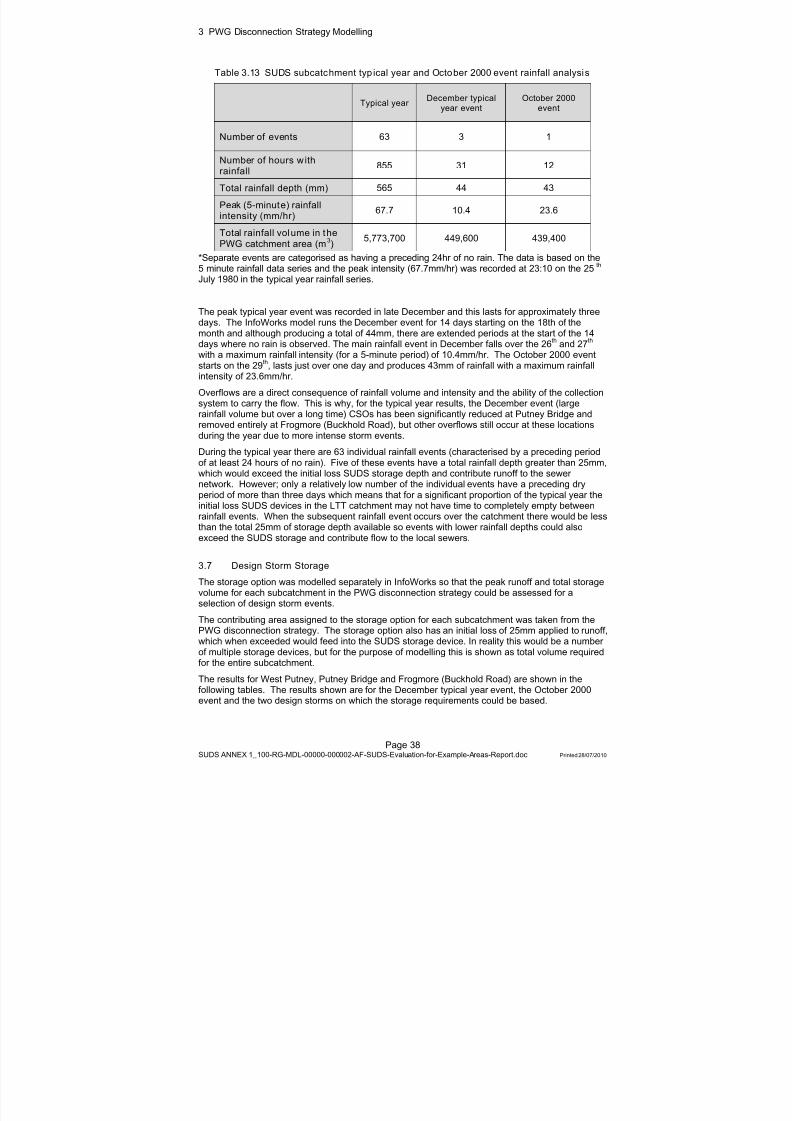
8/13/2019 Needs report: appendix E
http://slidepdf.com/reader/full/needs-report-appendix-e 221/235
3 PWG Disconnection Strategy Modelling
Page 38SUDS ANNEX 1_100-RG-MDL-00000-000002-AF-SUDS-Evaluation-for-Example-Areas-Report.doc Printed 28/07/2010
Table 3.13 SUDS subcatchment typ ical year and October 2000 event rainfall analysi s
Typical year December typicalyear event
October 2000event
Number of events 63 3 1
Number of hours w ithrainfall
855 31 12
Total rainfall depth (mm) 565 44 43
Peak (5-minute) rainfallintensity (mm/hr)
67.7 10.4 23.6
Total rainfall volume in t hePWG catchment area (m 3)
5,773,700 449,600 439,400
*Separate events are categorised as having a preceding 24hr of no rain. The data is based on the5 minute rainfall data series and the peak intensity (67.7mm/hr) was recorded at 23:10 on the 25 th July 1980 in the typical year rainfall series.
The peak typical year event was recorded in late December and this lasts for approximately threedays. The InfoWorks model runs the December event for 14 days starting on the 18th of themonth and although producing a total of 44mm, there are extended periods at the start of the 14days where no rain is observed. The main rainfall event in December falls over the 26 th and 27 th with a maximum rainfall intensity (for a 5-minute period) of 10.4mm/hr. The October 2000 eventstarts on the 29 th, lasts just over one day and produces 43mm of rainfall with a maximum rainfallintensity of 23.6mm/hr.
Overflows are a direct consequence of rainfall volume and intensity and the ability of the collectionsystem to carry the flow. This is why, for the typical year results, the December event (large
rainfall volume but over a long time) CSOs has been significantly reduced at Putney Bridge andremoved entirely at Frogmore (Buckhold Road), but other overflows still occur at these locationsduring the year due to more intense storm events.
During the typical year there are 63 individual rainfall events (characterised by a preceding periodof at least 24 hours of no rain). Five of these events have a total rainfall depth greater than 25mm,which would exceed the initial loss SUDS storage depth and contribute runoff to the sewernetwork. However; only a relatively low number of the individual events have a preceding dryperiod of more than three days which means that for a significant proportion of the typical year theinitial loss SUDS devices in the LTT catchment may not have time to completely empty betweenrainfall events. When the subsequent rainfall event occurs over the catchment there would be lessthan the total 25mm of storage depth available so events with lower rainfall depths could alsoexceed the SUDS storage and contribute flow to the local sewers.
3.7 Design Storm Storage
The storage option was modelled separately in InfoWorks so that the peak runoff and total storagevolume for each subcatchment in the PWG disconnection strategy could be assessed for aselection of design storm events.
The contributing area assigned to the storage option for each subcatchment was taken from thePWG disconnection strategy. The storage option also has an initial loss of 25mm applied to runoff,which when exceeded would feed into the SUDS storage device. In reality this would be a numberof multiple storage devices, but for the purpose of modelling this is shown as total volume requiredfor the entire subcatchment.
The results for West Putney, Putney Bridge and Frogmore (Buckhold Road) are shown in the
following tables. The results shown are for the December typical year event, the October 2000event and the two design storms on which the storage requirements could be based.

8/13/2019 Needs report: appendix E
http://slidepdf.com/reader/full/needs-report-appendix-e 222/235
3 PWG Disconnection Strategy Modelling
Page 39SUDS ANNEX 1_100-RG-MDL-00000-000002-AF-SUDS-Evaluation-for-Example-Areas-Report.doc
Table 3.14 West Putney SUDS storage requirements based on the PWG disconnection str ategy areas
PWG SUDS subcatchment st orage volume requirements
24751451a 21729601 21757452 21745701 24751451b 2Total impermeable areawith 25mm initial loss
and storage4.0ha 1.4ha 9.3ha 0.1ha 5.4ha
Decembertypical year
event
Volume(m3) 210 90 770 10 290
October 2000event
Volume(m3)
470 150 350 10 640
15yr designstorm
Volume(m3) 340 140 900 10 490
30yr designstorm
Volume(m3) 490 220 1,350 20 710
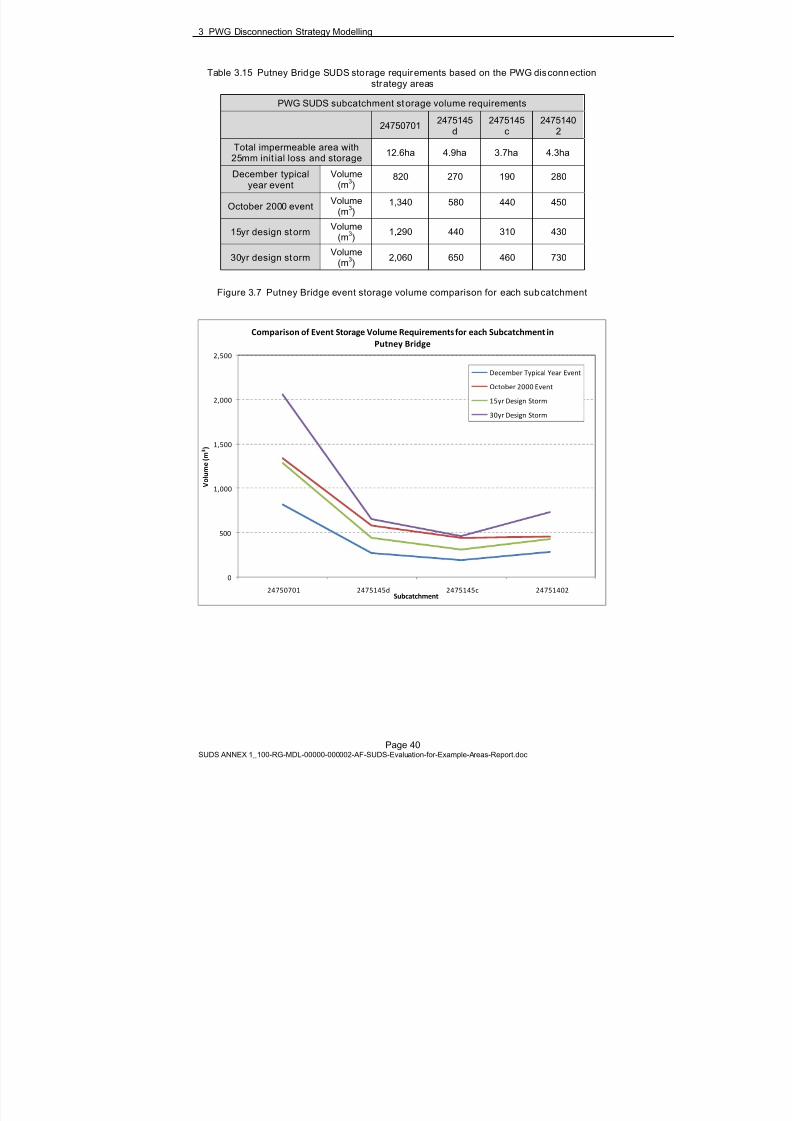
8/13/2019 Needs report: appendix E
http://slidepdf.com/reader/full/needs-report-appendix-e 223/235
3 PWG Disconnection Strategy Modelling
Page 40SUDS ANNEX 1_100-RG-MDL-00000-000002-AF-SUDS-Evaluation-for-Example-Areas-Report.doc
Table 3.15 Putney Bridge SUDS storage requir ements based on the PWG disconnectionstrategy areas
PWG SUDS subcatchment st orage volume requirements
24750701 2475145d
2475145c
24751402
Total impermeable area with25mm init ial loss and storage 12.6ha 4.9ha 3.7ha 4.3ha
December typicalyear event
Volume(m3)
820 270 190 280
October 2000 event Volume(m3)
1,340 580 440 450
15yr design st orm Volume(m3) 1,290 440 310 430
30yr design st orm Volume(m3) 2,060 650 460 730
Figure 3.7 Putney Bridge event storage volume comparison for each subcatchment
0
500
1,000
1,500
2,000
2,500
24750701 2475145d 2475145c 24751402
V o l u m e ( m
3 )
Subcatchment
Comparison of Event Storage Volume Requirements for each Subcatchment in Putney Bridge
December Typical Year Event
October 2000 Event
15yr Design Storm
30yr Design Storm

8/13/2019 Needs report: appendix E
http://slidepdf.com/reader/full/needs-report-appendix-e 224/235
3 PWG Disconnection Strategy Modelling
Page 41SUDS ANNEX 1_100-RG-MDL-00000-000002-AF-SUDS-Evaluation-for-Example-Areas-Report.doc
Table 3.16 Frogmore (Buckhold Road) SUDS storage requirements based on the PWG disconnectio n strategy a
PWG SUDS subcatchment s torage volume requirements
25740102 24749501 24743902 24736291 23749901 23741101 23732702 23
Total impermeable areawith 25mm initi al loss and
storage11.6ha 10.5ha 4.5ha 19.1ha 17.9ha 0.4ha 0.2ha
December typicalyear event
Volume(m3)
740 700 280 1,110 1,020 30 10
October 2000event
Volume(m3)
1,270 1,110 500 2,190 2,070 50 30
15yr design st orm Volume(m3) 1,190 1,060 450 1,840 1,710 40 20
30yr design st orm Volume(m3) 1,830 1,770 700 2,740 2,530 60 30

8/13/2019 Needs report: appendix E
http://slidepdf.com/reader/full/needs-report-appendix-e 225/235
3 PWG Disconnection Strategy Modelling
Page 42SUDS ANNEX 1_100-RG-MDL-00000-000002-AF-SUDS-Evaluation-for-Example-Areas-Report.doc Printed 28/07/2010
Tables 3.14 to 3.16 show the required storage is proportional to the contributing area. The initial25mm loss during the event reduces the required storage but depending on the design storm usedto size the SUDS storage device the required volume could be several thousand cubic meters.This could be split between a number of sites and provides a significant reduction in peak flowvolume entering the sewer network and contributing to the CSO events.
3.8 Conclusion
The PWG disconnection strategy has a positive impact on all three CSOs and reduces the volumeoverflowing for all modelled events and reduces the volume and number of overflow events duringthe typical year. The reduction in overflow is greater than the 50% impermeable area removal inSection 2 of this report, which is due to the disconnection of approximately 75% of thesubcatchments impermeable area into permeable, initial loss and storage areas. However, asshown by the development of the final disconnection scenarios, this level of disconnection isunlikely to be achievable in practice.
The number of CSO events remains high at West Putney and Putney Bridge and SUDS alone maynot provide sufficient source control to eliminate the need for additional CSO facilities.
Source controls in the Frogmore catchment has the most significant impact at the CSO with thenumber of events reducing to two in the typical year. This potentially has a significant effect on theCSO control options for Frogmore (Buckhold Road). Source controls assessed for Frogmore(Buckhold Road) would appear to be sufficient to avoid additional CSO control facilities. PWG’srefined approach concluded that the disconnection strategies reported in this section were notfeasible in practice. Their refined disconnection strategy corresponds to approximately 37%removal of the existing impermeable area. This scenario was not modelled specifically butperformance was estimated by PWG using the results for 25% and 50% area reduction asreported in Sections 2 and 4.
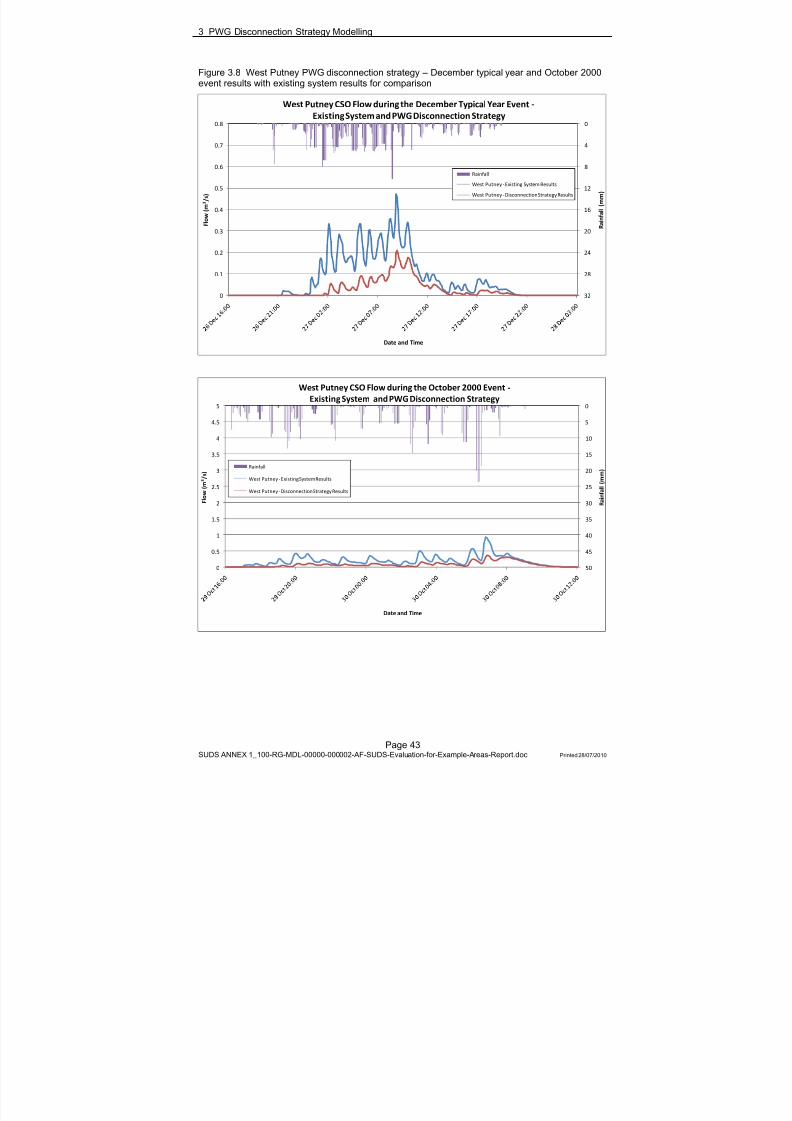
8/13/2019 Needs report: appendix E
http://slidepdf.com/reader/full/needs-report-appendix-e 226/235
3 PWG Disconnection Strategy Modelling
Page 43SUDS ANNEX 1_100-RG-MDL-00000-000002-AF-SUDS-Evaluation-for-Example-Areas-Report.doc Printed 28/07/2010
Figure 3.8 West Putney PWG disconnection strategy – December typical year and October 2000event results with existing system results for comparison
0
4
8
12
16
20
24
28
320
0.1
0.2
0.3
0.4
0.5
0.6
0.7
0.8
R a i n f a l l ( m m )
F l o w
( m 3 / s )
Date and Time
West Putney CSO Flow during the December Typical Year Event ‐Existing System and PWG Disconnection Strategy
Rainfall
West Putney ‐Existing System Results
West Putney ‐Disconnection Strategy Results
0
5
10
15
20
25
30
35
40
45
500
0.5
1
1.5
2
2.5
3
3.5
4
4.5
5
R a i n f a l l ( m m )
F l o w
( m 3 / s )
Date and Time
West Putney CSO Flow during the October 2000 Event ‐Existing System and PWG Disconnection Strategy
Rainfall
West Putney ‐Existing System Results
West Putney ‐Disconnection Strategy Results
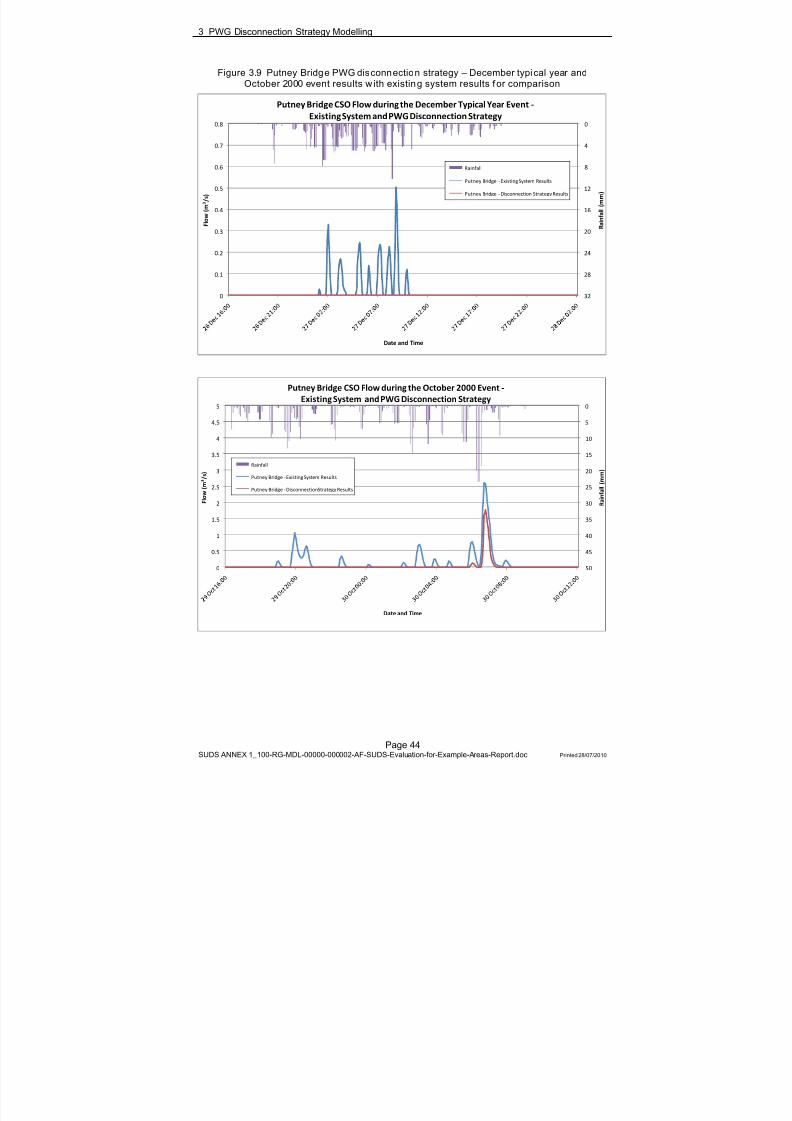
8/13/2019 Needs report: appendix E
http://slidepdf.com/reader/full/needs-report-appendix-e 227/235
3 PWG Disconnection Strategy Modelling
Page 44SUDS ANNEX 1_100-RG-MDL-00000-000002-AF-SUDS-Evaluation-for-Example-Areas-Report.doc Printed 28/07/2010
Figure 3.9 Putney Bridge PWG disconnection strategy – December typi cal year andOctober 2000 event results w ith existing system results f or comparison
0
4
8
12
16
20
24
28
320
0.1
0.2
0.3
0.4
0.5
0.6
0.7
0.8
R a i n f a l l ( m m )
F l o w
( m 3 / s )
Date and Time
Putney Bridge CSO Flow during the December Typical Year Event ‐Existing System and PWG Disconnection Strategy
Rainfall
Putney Bridge ‐Existing System Results
Putney Bridge ‐Disconnection Strategy Results
0
5
10
15
20
25
30
35
40
45
500
0.5
1
1.5
2
2.5
3
3.5
4
4.5
5
R a i n f a l l ( m m )
F l o w
( m 3 / s )
Date and Time
Putney Bridge CSO Flow during the October 2000 Event ‐Existing System and PWG Disconnection Strategy
Rainfall
Putney Bridge ‐Existing System Results
Putney Bridge ‐Disconnection Strategy Results
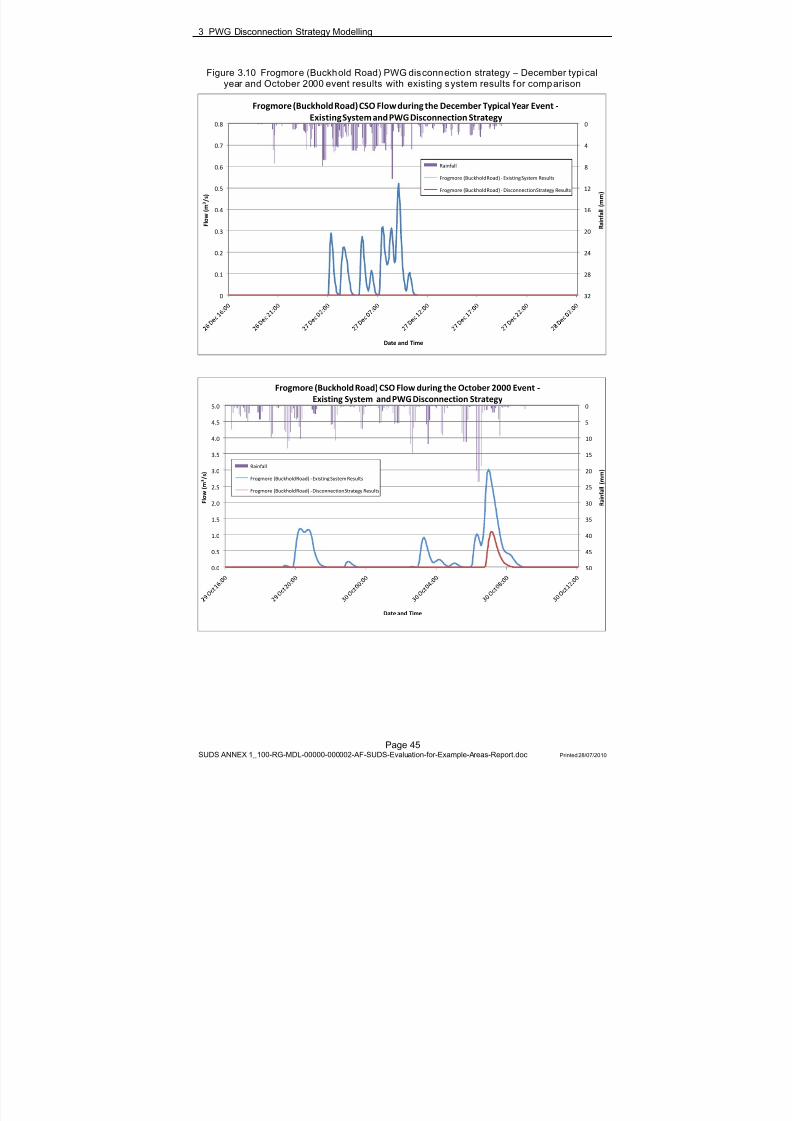
8/13/2019 Needs report: appendix E
http://slidepdf.com/reader/full/needs-report-appendix-e 228/235
3 PWG Disconnection Strategy Modelling
Page 45SUDS ANNEX 1_100-RG-MDL-00000-000002-AF-SUDS-Evaluation-for-Example-Areas-Report.doc Printed 28/07/2010
Figure 3.10 Frogmor e (Buckhold Road) PWG disconnection strategy – December typi calyear and October 2000 event results with existing system results f or comparison
0
4
8
12
16
20
24
28
320
0.1
0.2
0.3
0.4
0.5
0.6
0.7
0.8
R a i n f a l l ( m m )
F l o w
( m 3 / s )
Date and Time
Frogmore (Buckhold Road) CSO Flow during the December Typical Year Event ‐Existing System and PWG Disconnection Strategy
Rainfall
Frogmore (Buckhold Road) ‐Existing System Results
Frogmore (Buckhold Road) ‐Disconnection Strategy Results
0
5
10
15
20
25
30
35
40
45
500.0
0.5
1.0
1.5
2.0
2.5
3.0
3.5
4.0
4.5
5.0
R a i n f a l l ( m m )
F l o w
( m 3 / s )
Date and Time
Frogmore (Buckhold Road) CSO Flow during the October 2000 Event ‐Existing System and PWG Disconnection Strategy
Rainfall
Frogmore (Buckhold Road) ‐Existing System Results
Frogmore (Buckhold Road) ‐Disconnection Strategy Results
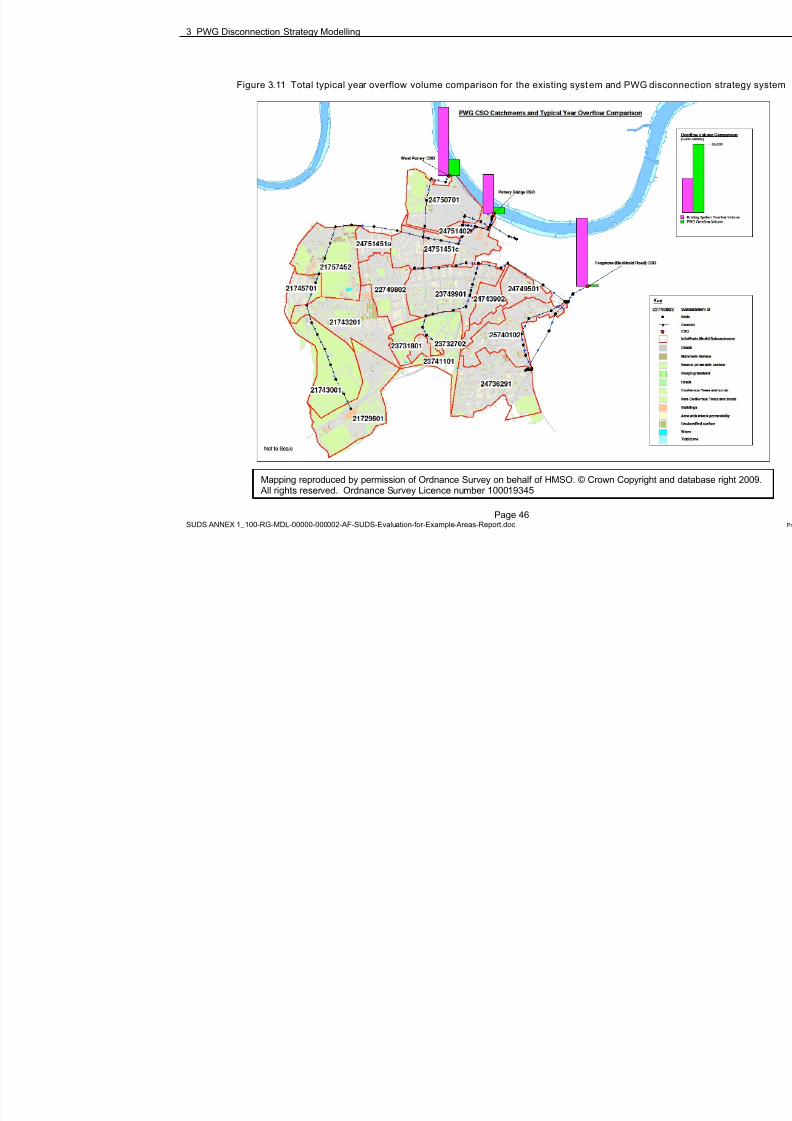
8/13/2019 Needs report: appendix E
http://slidepdf.com/reader/full/needs-report-appendix-e 229/235
3 PWG Disconnection Strategy Modelling
Page 46SUDS ANNEX 1_100-RG-MDL-00000-000002-AF-SUDS-Evaluation-for-Example-Areas-Report.doc
Figure 3.11 Total typical year overflow volume comparison for the existing syst em and PWG disconnection strate
Mapping reproduced by permission of Ordnance Survey on behalf of HMSO. © Crown Copyright and database right 2 All rights reserved. Ordnance Survey Licence number 100019345
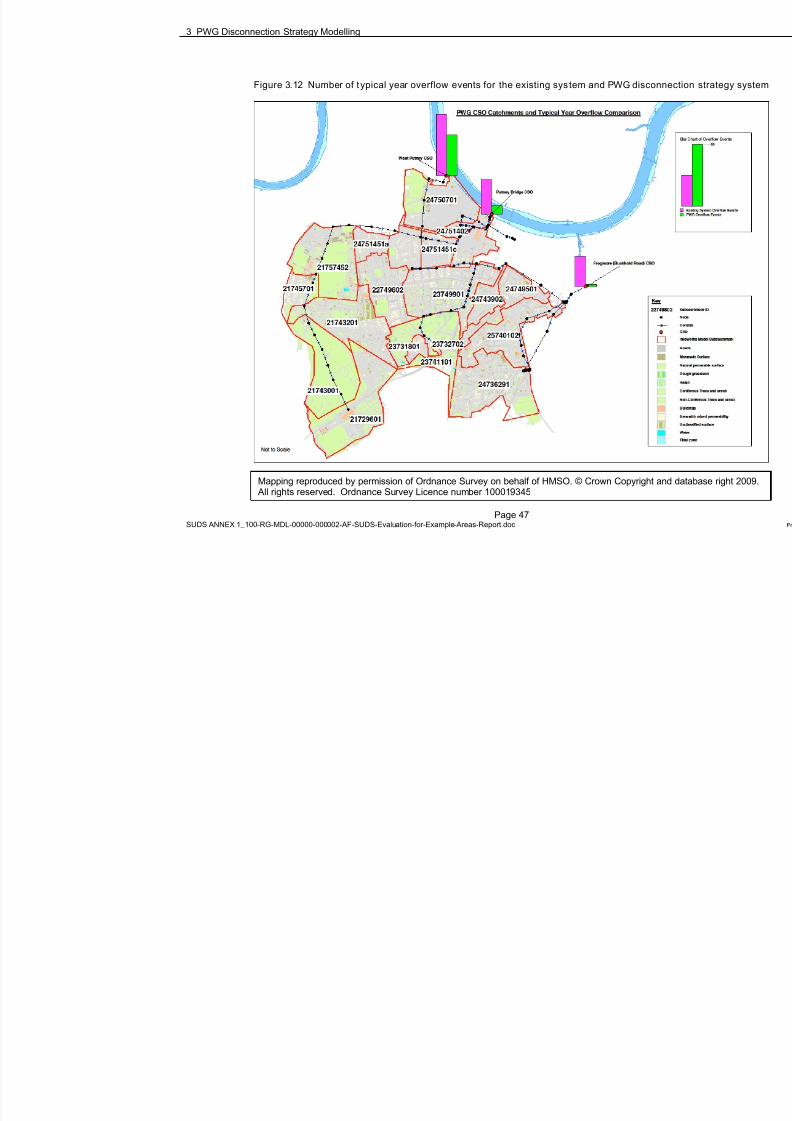
8/13/2019 Needs report: appendix E
http://slidepdf.com/reader/full/needs-report-appendix-e 230/235
3 PWG Disconnection Strategy Modelling
Page 47SUDS ANNEX 1_100-RG-MDL-00000-000002-AF-SUDS-Evaluation-for-Example-Areas-Report.doc
Figure 3.12 Number of t ypical year overflow events for the existing sys tem and PWG disconnection strategy s
Mapping reproduced by permission of Ordnance Survey on behalf of HMSO. © Crown Copyright and database right 20 All rights reserved. Ordnance Survey Licence number 100019345
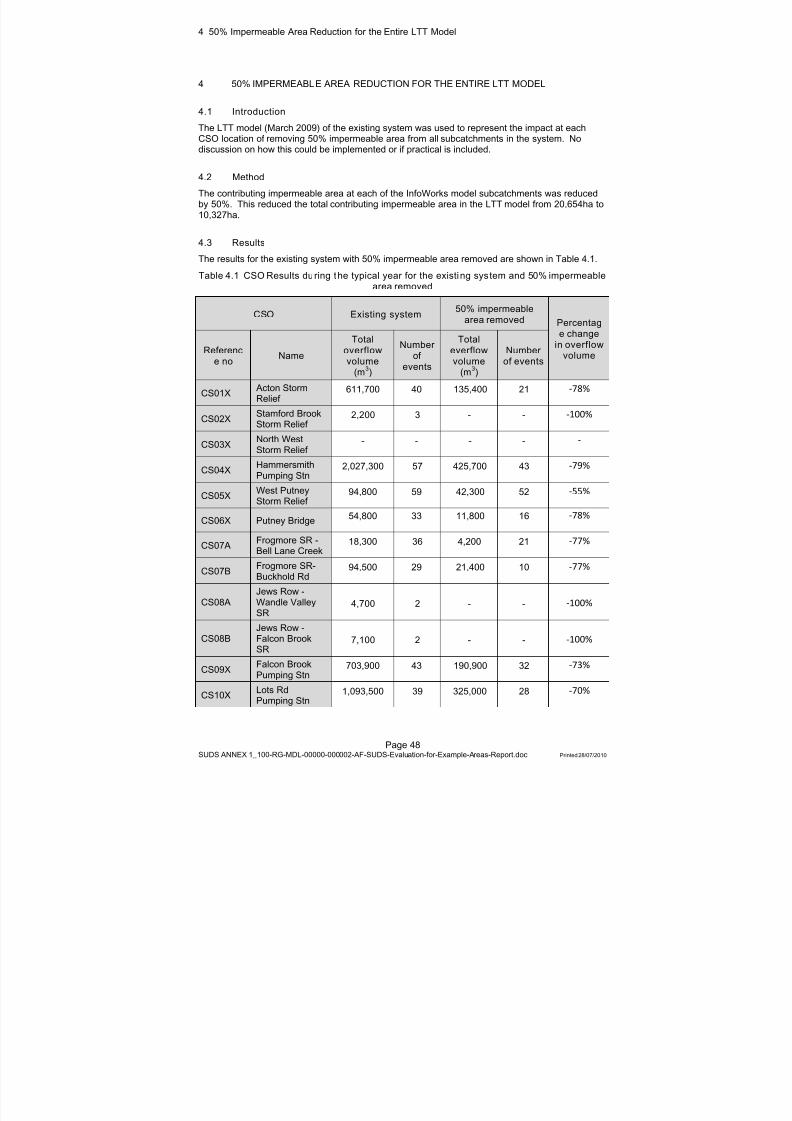
8/13/2019 Needs report: appendix E
http://slidepdf.com/reader/full/needs-report-appendix-e 231/235
4 50% Impermeable Area Reduction for the Entire LTT Model
Page 48SUDS ANNEX 1_100-RG-MDL-00000-000002-AF-SUDS-Evaluation-for-Example-Areas-Report.doc Printed 28/07/2010
4 50% IMPERMEABLE AREA REDUCTION FOR THE ENTIRE LTT MODEL
4.1 Introduction
The LTT model (March 2009) of the existing system was used to represent the impact at eachCSO location of removing 50% impermeable area from all subcatchments in the system. Nodiscussion on how this could be implemented or if practical is included.
4.2 Method
The contributing impermeable area at each of the InfoWorks model subcatchments was reducedby 50%. This reduced the total contributing impermeable area in the LTT model from 20,654ha to10,327ha.
4.3 Results
The results for the existing system with 50% impermeable area removed are shown in Table 4.1.
Table 4.1 CSO Results during t he typical year for the existi ng sys tem and 50% impermeablearea removed
CSO Existing system 50% impermeablearea removed Percentag
e changein overflow
volumeReference no Name
Totaloverflowvolume
(m 3)
Numberof
events
Totaleverflowvolume
(m 3)
Numberof events
CS01X Acton StormRelief
611,700 40 135,400 21 ‐78%
CS02X Stamford BrookStorm Relief 2,200 3 - - ‐100%
CS03X North WestStorm Relief
- - - - ‐
CS04X HammersmithPumping Stn
2,027,300 57 425,700 43 ‐79%
CS05X West PutneyStorm Relief
94,800 59 42,300 52 ‐55%
CS06X Putney Bridge 54,800 33 11,800 16 ‐78%
CS07A Frogmore SR -
Bell Lane Creek
18,300 36 4,200 21 ‐77%
CS07B Frogmore SR-Buckhold Rd
94,500 29 21,400 10 ‐77%
CS08AJews Row -Wandle ValleySR
4,700 2 - - ‐100%
CS08BJews Row -Falcon BrookSR
7,100 2 - - ‐100%
CS09X Falcon BrookPumping Stn
703,900 43 190,900 32 ‐73%
CS10X Lots RdPumping Stn 1,093,500 39 325,000 28 ‐70%
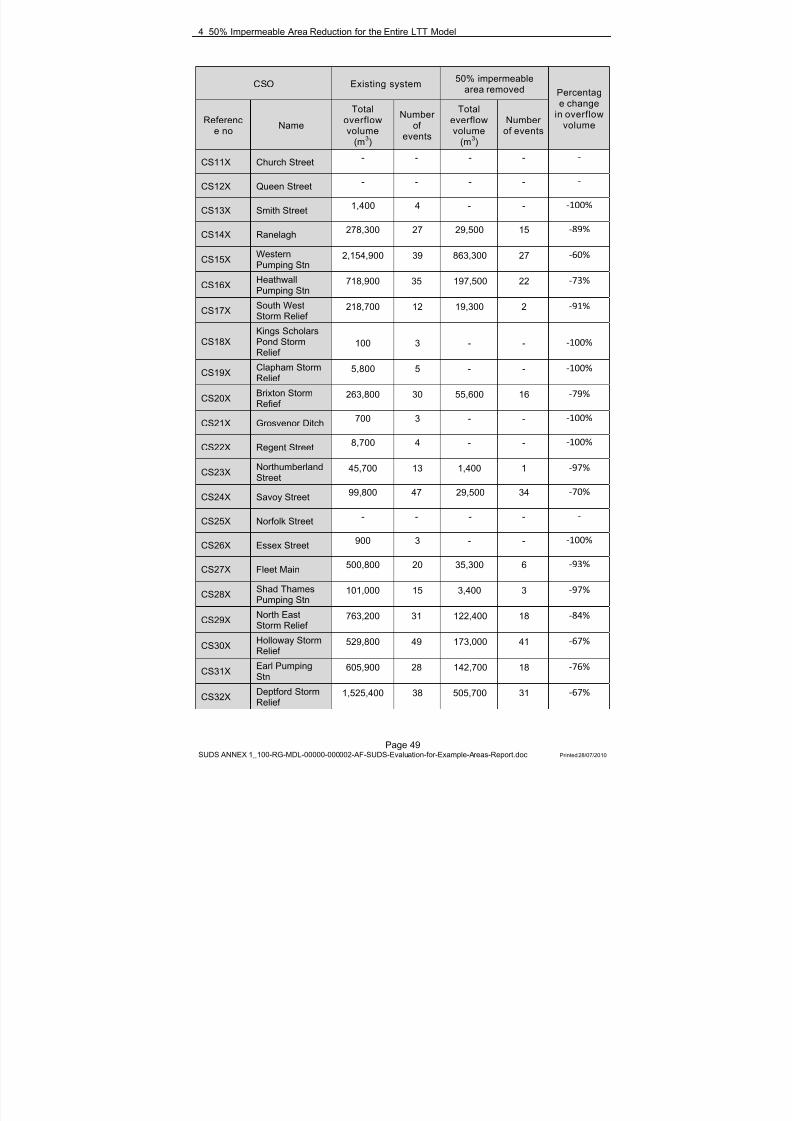
8/13/2019 Needs report: appendix E
http://slidepdf.com/reader/full/needs-report-appendix-e 232/235
4 50% Impermeable Area Reduction for the Entire LTT Model
Page 49SUDS ANNEX 1_100-RG-MDL-00000-000002-AF-SUDS-Evaluation-for-Example-Areas-Report.doc Printed 28/07/2010
CSO Existing system 50% impermeablearea removed Percentag
e changein overflow
volumeReference no Name
Totaloverflowvolume
(m 3)
Numberof
events
Totaleverflowvolume
(m 3)
Numberof events
CS11X Church Street - - - - ‐
CS12X Queen Street - - - - ‐
CS13X Smith Street 1,400 4 - - ‐100%
CS14X Ranelagh 278,300 27 29,500 15 ‐89%
CS15X WesternPumping Stn
2,154,900 39 863,300 27 ‐60%
CS16X HeathwallPumping Stn
718,900 35 197,500 22 ‐73%
CS17X South WestStorm Relief
218,700 12 19,300 2 ‐91%
CS18XKings ScholarsPond StormRelief
100 3 - - ‐100%
CS19X Clapham StormRelief
5,800 5 - - ‐100%
CS20X Brixton StormRefief
263,800 30 55,600 16 ‐79%
CS21X Grosvenor Ditch 700 3 - - ‐100%
CS22X Regent Street 8,700 4 - - ‐100%
CS23X NorthumberlandStreet
45,700 13 1,400 1 ‐97%
CS24X Savoy Street 99,800 47 29,500 34 ‐70%
CS25X Norfolk Street - - - - ‐
CS26X Essex Street 900 3 - - ‐100%
CS27X Fleet Main 500,800 20 35,300 6 ‐93%
CS28X Shad ThamesPumping Stn
101,000 15 3,400 3 ‐97%
CS29X North EastStorm Relief
763,200 31 122,400 18 ‐84%
CS30X Holloway StormRelief
529,800 49 173,000 41 ‐67%
CS31X Earl PumpingStn
605,900 28 142,700 18 ‐76%
CS32X Deptford StormRelief 1,525,400 38 505,700 31 ‐67%
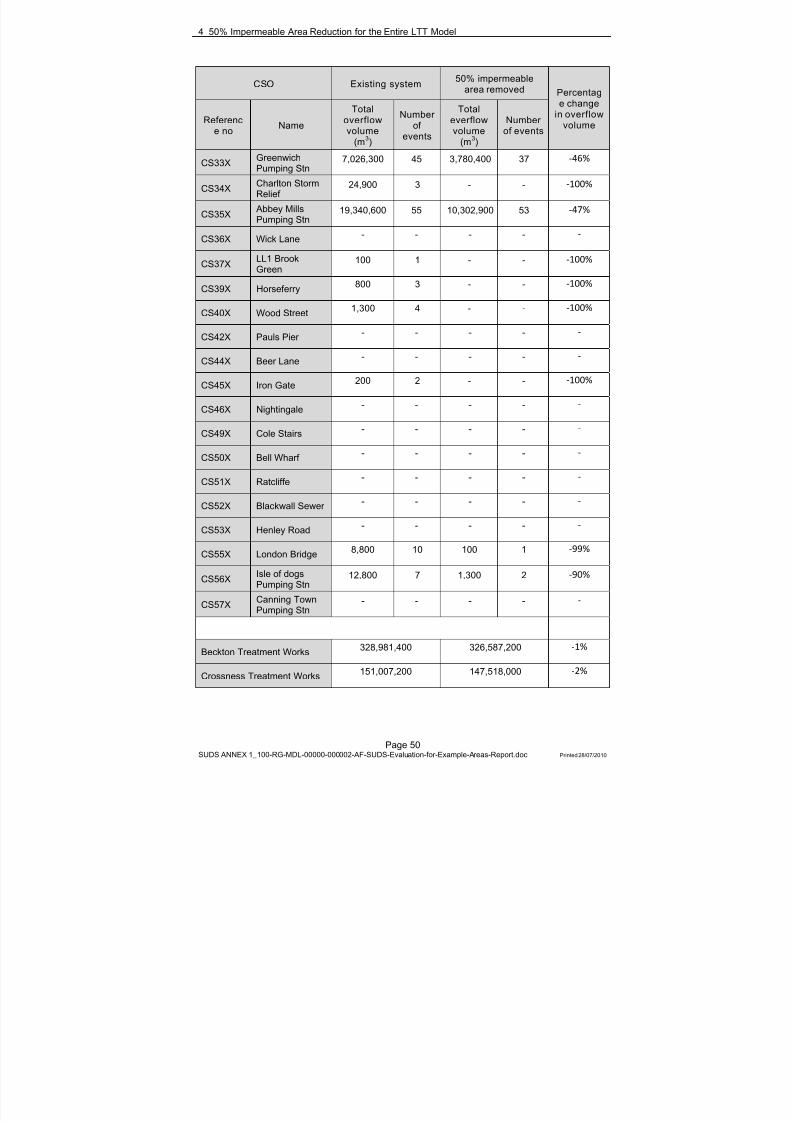
8/13/2019 Needs report: appendix E
http://slidepdf.com/reader/full/needs-report-appendix-e 233/235
4 50% Impermeable Area Reduction for the Entire LTT Model
Page 50SUDS ANNEX 1_100-RG-MDL-00000-000002-AF-SUDS-Evaluation-for-Example-Areas-Report.doc Printed 28/07/2010
CSO Existing system 50% impermeablearea removed Percentag
e changein overflow
volumeReference no Name
Totaloverflowvolume
(m 3)
Numberof
events
Totaleverflowvolume
(m 3)
Numberof events
CS33X GreenwichPumping Stn
7,026,300 45 3,780,400 37 ‐46%
CS34X Charlton StormRelief
24,900 3 - - ‐100%
CS35X Abbey MillsPumping Stn
19,340,600 55 10,302,900 53 ‐47%
CS36X Wick Lane - - - - ‐
CS37X LL1 BrookGreen
100 1 - - ‐100%
CS39X Horseferry 800 3 - - ‐100%
CS40X Wood Street 1,300 4 - - ‐100%
CS42X Pauls Pier - - - - ‐
CS44X Beer Lane - - - - ‐
CS45X Iron Gate 200 2 - - ‐100%
CS46X Nightingale - - - - ‐
CS49X Cole Stairs - - - - ‐
CS50X Bell Wharf - - - - ‐
CS51X Ratcliffe - - - - ‐
CS52X Blackwall Sewer - - - - ‐
CS53X Henley Road - - - - ‐
CS55X London Bridge 8,800 10 100 1‐99%
CS56X Isle of dogsPumping Stn
12,800 7 1,300 2 ‐90%
CS57X Canning TownPumping Stn
- - - - ‐
Beckton Treatment Works 328,981,400 326,587,200 ‐1%
Crossness Treatment Works 151,007,200 147,518,000 ‐2%

8/13/2019 Needs report: appendix E
http://slidepdf.com/reader/full/needs-report-appendix-e 234/235
4 50% Impermeable Area Reduction for the Entire LTT Model
Page 51SUDS ANNEX 1_100-RG-MDL-00000-000002-AF-SUDS-Evaluation-for-Example-Areas-Report.doc Printed 28/07/2010
Table 4.1 shows the impact of removing 50% of the impermeable area from all subcatchments inthe LTT model. The number of individual CSOs producing overflow during the typical year reducesfrom 39 to 25 and the total overflow volume reduces from 38,952,000m 3 to 17,420,000m 3, areduction of 55%. All CSOs experience less overflow volume, however the flow into bothtreatment works is only slightly affected as the primary influence on both STWs is dry weather flow.
The original model showed the greatest number of overflow events at West Putney Storm Relief(59 events), Hammersmith Pumping Station (57 events) and Abbey Mills Pumping Station (55events). After the removal of 50% impermeable area the CSOs with the most overflow events arethe same but the number of overflows has reduced: West Putney Storm Relief (52 events),Hammersmith Pumping Station (43 events) and Abbey Mills Pumping Station (53 events).
4.4 Conclusion
Reducing the contributing impermeable area by 50% for the entire LTT model removes 55% of theCSO overflow volume during the typical year. The number of CSOs producing overflow reducesby approximately 36% and the CSO record less overflow events during the typical year.
Removing 50% of the LTT catchment’s impermeable area runoff from the system would have avery positive impact on the CSOs, however this requires the disconnection of 10,327ha. Theinstitutional requirements needed to disconnect this scale of area and how such a program couldbe implemented and accomplished will need evaluation.

8/13/2019 Needs report: appendix E
http://slidepdf.com/reader/full/needs-report-appendix-e 235/235
5 Conclusion
5 CONCLUSION
The three subcatchments of West Putney, Putney Bridge and Frogmore (Buckhold Road) are themost suitable for SUDS selection in the LTT catchment and were modelled to show the impact ofSUDS on CSO.
The impermeable contributing area in each of the three subcatchments was first amended torepresent a proportion both completely disconnected from the system and transferred intopermeable area. This was done for both 25% and 50% of the impermeable areas. While thetransfer of impermeable to permeable area reduces the overflow seen at the CSO, a far greaterreduction was seen when the impermeable area was totally disconnected.
The greatest reduction in overflow was seen when 50% of impermeable area is removed and thisresulted in the reduction of overflow volume at West Putney by 55%, Putney Bridge by 78% and