Embed Size (px)
Citation preview

Division of Vocational Rehabilitation and State Rehabilitation Council Needs Assessment for the Vocational Rehabilitation Program March 2, 2011

i
Table of Contents OVERVIEW ..................................................................................................................... 1 METHODOLOGY ............................................................................................................ 1 FINDINGS ....................................................................................................................... 4
I. Consumer Satisfaction Survey ................................................................................ 4 Overview, Data Collection and Sampling Error .................................................. 4 Summary of Major Findings for 2008 Survey: .................................................... 5 Services Received by Clients ....................................................................... 5 Measures of Overall Satisfaction .................................................................. 5 Evaluation of Specific Aspects of the Agency and the Services Provided ....6 Problems and Areas for Improvement .......................................................... 6 Conclusions and Areas of Focus .................................................................. 7 Job Goals.................................................................................................... 10 The 2011 Consumer Satisfaction Survey Results ............................................ 11 II. Rehabilitation Services Administration (RSA) Performance Indicators.................. 11 III. DVR and VABIR Employee Satisfaction Survey.................................................... 14 IV. Employer Satisfaction Survey................................................................................ 15 The Survey Questionnaire ............................................................................... 16 Sampling ..........................................................................................................16 Current Clients ................................................................................................. 16 General Business Community.......................................................................... 16 Survey Results ................................................................................................. 16 Summary by Respondent Group: Current Clients............................................................................................ 17 DVR Non-Clients ........................................................................................ 19 General Business Non-Clients.................................................................... 22 V. DVR Program Evaluation Unit Findings.................................................................24 Access to Services........................................................................................... 24 Outcomes for Minority Groups .........................................................................25 Access to Services and Outcomes for Veterans .............................................. 26 Outcomes by Disability Type............................................................................ 27 Access to Services and Outcomes for Individuals with Alcohol/Substance Abuse/Dependence Disorders .................................................................... 28 Program Participation and Outcomes for Individuals with Post-Secondary Education.................................................................................................... 29 Supported Employment Services .....................................................................32 Overview.....................................................................................................32 Developmental Services Supported Employment....................................... 33 Community Rehabilitation and Treatment Supported Employment ............ 33

ii
Unmet Need for Supported Employment Services for Individuals who Do Not meet CRT and DDAS Eligibility Criteria for Services................. 35 Overall Impact of the DVR Program on the Total Estimated Population of Eligible Vermonters ........................................................................... 36 VI. The Not-So-Secret Shopper Project ...................................................................... 41 SUMMARY OF MAJOR FINDINGS .............................................................................. 44
1) The Need to Improve Employment Outcomes for Individuals with Mental Illness ... 45 2) The Need to Evaluate “Unsuccessful” (Status 28) Closures.................................... 45 3) The Need to Engage Veterans with Disabilities, Especially Those Not Eligible for the VA VR Program ....................................................................................... 45 4) The Need to Expand Employer Outreach and Marketing Efforts............................. 46 5) The Need to Improve Outcomes for DVR Consumers with Alcohol/Substance Abuse Dependence/Abuse Disorders................................................................. 46 6) The Need to Assess the Impact of DVR Support of Post-Secondary Education Services .............................................................................................................. 47 7) The Need to Communicate Clearly to VR Applicants Regarding their Expectations of DR Services and Continue to Work on Improving Communication Between VR and DVR Consumers ........................................... 47 8) The Need to Establish Case Management Supports for DVR Consumers Who Are Not Eligible for Community Mental Health or Developmental Services ........ 47 9) The Need to Increase Consumer Earnings ............................................................. 48 10) The Need for Outreach to Eligible Non-English Speaking Individuals ..................... 48 11) The Need to Streamline and Automate Case Work and Financial Processes for DVR Staff and Consumers.................................................................................. 48
DVR & SRC Needs Assessment 1
Vermont Division of Vocational Rehabilitation (DVR) and State Rehabilitation Council (SRC)
Needs Assessment for the Vocational Rehabilitation Program
OVERVIEW The Rehabilitation Act requires the DVR and the Vermont State Rehabilitation Council (SRC) to jointly conduct a needs assessment every three years. The Needs Assessment is intended to form the basis for the VR annual state plan and the Division’s strategic planning activities. The development of the Needs Assessment in partnership with DVR is one of the primary responsibilities of the SRC. Historically DVR and the SRC worked with an external contractor to conduct the Needs Assessment. The advantage of this approach was that DVR and the SRC got an external view of the organization. However, this approach had two primary disadvantages. First, available contractors often lacked a deep understanding of the DVR program. As a result, the findings tended to be superficial and general. The second disadvantage of this approach was that SRC members lacked involvement in the process. SRC members wanted the opportunity to review data directly and ask deeper questions. For the 2011 Needs Assessment, DVR and the SRC decided to take on a more “hands on” approach to the process. DVR collects data from a variety of sources on an ongoing basis and it was determined that DVR and the SRC could conduct a deeper assessment over time using these multiple sources. Rather than conducting a one-time assessment, DVR and the SRC used the data sources it routinely reviews as the basis for the Needs Assessment. This has allowed for a more comprehensive review of need in the state.
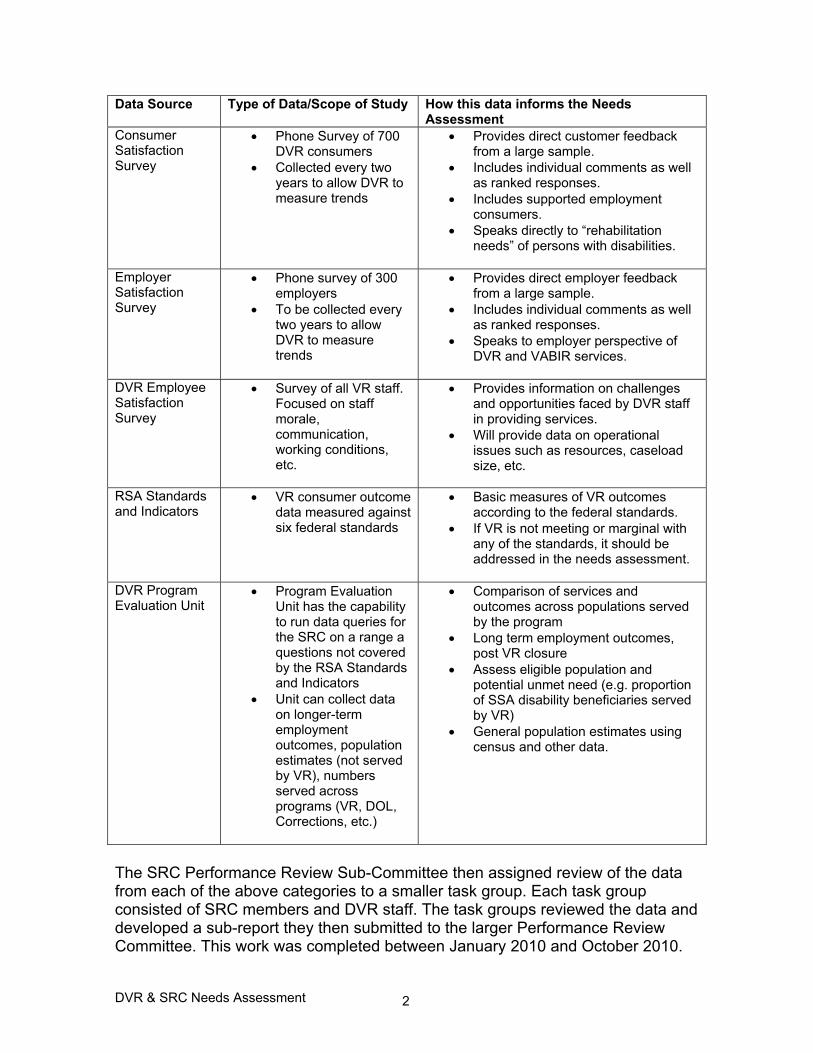
METHODOLOGY In late fall 2009 the SRC Performance Review Committee in partnership with James Smith, the DVR Budget and Policy Manager, developed a work plan for the Needs Assessment. As a first step the group identified the available sources of process and outcome data they wanted to review over a year period. The following table outlines the data sources reviewed:
DVR & SRC Needs Assessment 2
Data Source Type of Data/Scope of Study How this data informs the Needs Assessment
Consumer Satisfaction Survey
• Phone Survey of 700 DVR consumers
• Collected every two years to allow DVR to measure trends
• Provides direct customer feedback from a large sample.
• Includes individual comments as well as ranked responses.
• Includes supported employment consumers.
• Speaks directly to “rehabilitation needs” of persons with disabilities.
Employer Satisfaction Survey
• Phone survey of 300 employers
• To be collected every two years to allow DVR to measure trends
• Provides direct employer feedback from a large sample.
• Includes individual comments as well as ranked responses.
• Speaks to employer perspective of DVR and VABIR services.
DVR Employee Satisfaction Survey
• Survey of all VR staff. Focused on staff morale, communication, working conditions, etc.
• Provides information on challenges and opportunities faced by DVR staff in providing services.
• Will provide data on operational issues such as resources, caseload size, etc.
RSA Standards and Indicators
• VR consumer outcome data measured against six federal standards
• Basic measures of VR outcomes according to the federal standards.
• If VR is not meeting or marginal with any of the standards, it should be addressed in the needs assessment.
DVR Program Evaluation Unit
• Program Evaluation Unit has the capability to run data queries for the SRC on a range a questions not covered by the RSA Standards and Indicators
• Unit can collect data on longer-term employment outcomes, population estimates (not served by VR), numbers served across programs (VR, DOL, Corrections, etc.)
• Comparison of services and outcomes across populations served by the program
• Long term employment outcomes, post VR closure
• Assess eligible population and potential unmet need (e.g. proportion of SSA disability beneficiaries served by VR)
• General population estimates using census and other data.
The SRC Performance Review Sub-Committee then assigned review of the data from each of the above categories to a smaller task group. Each task group consisted of SRC members and DVR staff. The task groups reviewed the data and developed a sub-report they then submitted to the larger Performance Review Committee. This work was completed between January 2010 and October 2010.

DVR & SRC Needs Assessment 3
In June 2010 the Performance Review Committee developed a list of additional research questions and areas of interest to be submitted to the DVR Program Evaluation Unit. The Program Evaluation Unit researched these areas of interest through the summer and fall of 2010. These questions/areas of interest included the following:
• DVR services for individuals who are minorities including: o Access to the program o Outcomes
• DVR services for veterans: o Access to the program o Outcomes
• Outcome comparisons across different disability groups: o Individuals with psychiatric disabilities o Individuals with developmental disabilities o Individuals with physical disabilities o Individuals with traumatic brain injuries.
• Access to services and outcomes for individuals with Alcohol/Substance Abuse/Dependence disorders.
• Employment outcomes for DVR consumers with post-secondary degrees.
• Supported Employment Services: o Supported Employment Services for Adults with Mental Illness o Supported Employment Services for Adults with Developmental
Disabilities o Unmet need for supported employment services for individuals who
do not meet MH and DD eligibility criteria for services.
• Overall impact of the DVR program on the total estimated population of eligible Vermonters:
o Access to services o Outcomes
• Current and projected needs for services given the aging population in Vermont:
o Will DVR have more or fewer applicants? o What will the impact be on the order of selection?
In addition to the above research, the SRC conducted “Not-so-secret shopper” visits to each of the twelve DVR District Offices. SRC members came as VR customers to experience the process a new customer would go through applying for services. The process data from those visits is also included in the findings.

DVR & SRC Needs Assessment 4
FINDINGS I. Consumer Satisfaction Survey1 Overview An independent contractor, Market Decisions, conducted this project on behalf of the Vermont Division of Vocational Rehabilitation. The Vocational Rehabilitation Agencies Quality Assurance Survey is designed to allow vocational rehabilitation clients the opportunity to provide feedback about the agencies through which they are currently receiving services or had received services in the past. The survey instrument used during the course of this research was developed for use during the New England Vocational Rehabilitation Agencies Quality Assurance Survey that was conducted in 2003. The same survey instrument was used during the administration of the 2006 Quality Assurance Survey. The current survey instrument used the same core set of survey questions. Each of the agencies participating in this 2008 research study was also allowed to include a set of agency-specific questions. The main research methodology for data collection was the use of a telephone survey. However, given that it was not possible to reach a percentage of the target population by telephone, a mail version of the survey was also developed to supplement the telephone survey. At the time of writing of this Needs Assessment a contract is in process for Market Decisions to conduct a 2010 consumer satisfaction survey. The results from the 2010 survey are expected to be available in early 2011. Data Collection All telephone interviews were conducted in a central interviewing facility using Computer Assisted Telephone Interviewing (CATI) software. All interviewers were supervised and monitored continuously. The telephone data collection phase was begun on May 13, 2008 and data collection was completed by June 23, 2008 (including all telephone interviews and returned mail surveys). A total of 707 clients of the Vermont Division of Vocational Rehabilitation were interviewed by telephone or returned completed mail surveys. Among clients of the Vermont Division of Vocational Rehabilitation, the survey response rate was 63%. Sampling Error The percentages reported for the Vermont DVR sample are within plus or minus 3.3% that would be found if all clients of the Vermont Division of Vocational
1 The findings included here are the summary conclusions submitted by Market Decisions in 2008. The full report is available upon request.
DVR & SRC Needs Assessment 5
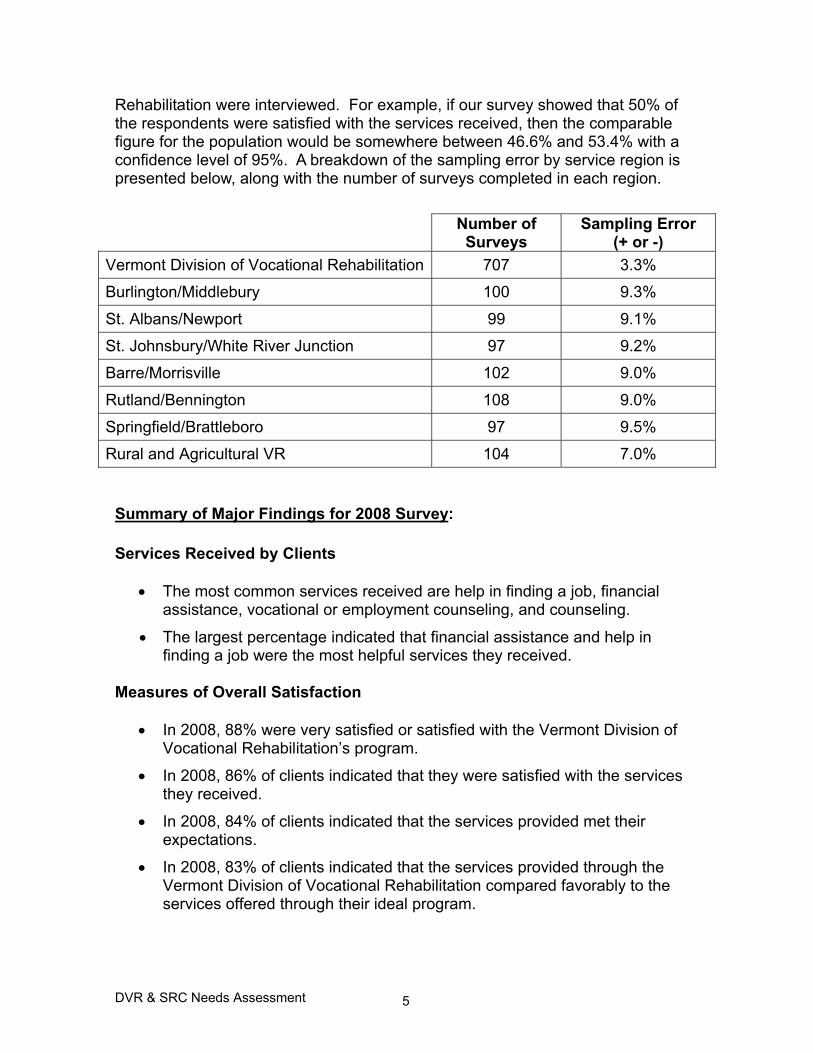
Rehabilitation were interviewed. For example, if our survey showed that 50% of the respondents were satisfied with the services received, then the comparable figure for the population would be somewhere between 46.6% and 53.4% with a confidence level of 95%. A breakdown of the sampling error by service region is presented below, along with the number of surveys completed in each region.
Number of Surveys
Sampling Error (+ or -)
Vermont Division of Vocational Rehabilitation 707 3.3%
Burlington/Middlebury 100 9.3%
St. Albans/Newport 99 9.1%
St. Johnsbury/White River Junction 97 9.2%
Barre/Morrisville 102 9.0%
Rutland/Bennington 108 9.0%
Springfield/Brattleboro 97 9.5%
Rural and Agricultural VR 104 7.0% Summary of Major Findings for 2008 Survey: Services Received by Clients
• The most common services received are help in finding a job, financial assistance, vocational or employment counseling, and counseling.
• The largest percentage indicated that financial assistance and help in finding a job were the most helpful services they received.
Measures of Overall Satisfaction
• In 2008, 88% were very satisfied or satisfied with the Vermont Division of Vocational Rehabilitation’s program.
• In 2008, 86% of clients indicated that they were satisfied with the services they received.
• In 2008, 84% of clients indicated that the services provided met their expectations.
• In 2008, 83% of clients indicated that the services provided through the Vermont Division of Vocational Rehabilitation compared favorably to the services offered through their ideal program.

DVR & SRC Needs Assessment 6
• In 2008, 95% percent of clients would tell their friends with similar disabilities to go to the Vermont Division of Vocational Rehabilitation for help.
Evaluation of Specific Aspects of the Agency and the Services Provided
• In 2008, 89% of clients were very satisfied or satisfied with their control and involvement in the vocational rehabilitation experience.
• In 2008, 89% of clients were very satisfied or satisfied with their choice of a vocational goal.
• In 2008, 88% of clients were very satisfied or satisfied with the choice of services available.
• In 2008, 90% of clients were very satisfied or satisfied with the choice of service providers.
• In 2008, 88% of clients were very satisfied or satisfied with the information they were given about the choices they had.
• In 2008, 87% of clients were very satisfied or satisfied with the time it took counselors to answer their questions or address their concerns.
• In 2008, 90%, of clients found completing the application for vocational rehabilitation services very or somewhat easy.
• In 2008, 92% of clients indicated that the staff were very or somewhat helpful in helping them to achieve their vocational rehabilitation goals.
• In 2008, 90% of clients indicated that it was very or somewhat easy to contact their vocational rehabilitation counselor.
• In 2006, nearly all clients (98%) found the agency office very or somewhat accessible to someone with their type of disability.
• In 2008, 71% of clients indicated that the services they received helped them become more financially independent.
• In 2008, 97% of clients indicated that the Vermont Division of Vocational Rehabilitation staff treated them with dignity and respect.
• In 2008, 73% of clients indicated that the agency helped them reach their job goals.
Problems and Areas for Improvement
• In 2008, 13% of clients indicated they had experienced problems with the agency or the services provided by the Vermont Division of Vocational Rehabilitation.

DVR & SRC Needs Assessment 7
• Among those experiencing problems, 41% indicated that the agency worked to resolve the problem.
• In 2008, approximately one half of clients offered suggestions for service improvement.
Conclusions and Areas of Focus As noted, there is, in general, a high level of satisfaction among the clients of the Division. In addition, the overall level of satisfaction has slightly increased from what was observed in 2006. Both the Consumer Satisfaction Index and the Overall Satisfaction measure have experienced upward trends since 2003. In 2008, they sit at 78% and 88% satisfied, respectively. The results suggest that many of the same issues brought up by clients during the prior studies in 2003 and 2006 are still present from the client perspective. This does not imply that client satisfaction has declined or that these issues have become more problematic, rather they represent the areas of concern that were also most frequently mentioned in 2006. The results do identify areas where the Division can focus efforts to improve an already high level of satisfaction. First, some of the key positive highlights:
• The level of overall satisfaction among all clients did show a statistically significant increase.
• This increase in overall satisfaction has trended upward since 2003.
• Satisfaction with the Vermont Division of Vocational Rehabilitation was equally high in all regions, meaning that the Division provides consistent service across the entire state.
• More specifically, clients in the Barre/Morrisville, Rutland/Bennington and Rural and Agricultural VR regions exhibited a very high level of satisfaction; over 90% of clients in these regions were satisfied overall with the Vermont Division of Vocational Rehabilitation.
• The percentage of clients reporting problems has been steadily declining since 2003. Further, among those indicating they experienced problems, the percentage reporting the Division did work to resolve the problem has increased since 2006.
• Communication between clients and the Division has improved. Clients are reporting fewer problems getting information about the services and employment options available when compared to 2003 and 2006. Satisfaction with the length of time it took counselors to answer questions or concerns has also increased.

DVR & SRC Needs Assessment 8
• While the results suggest that some clients experience difficulties in getting employment, the general level of satisfaction among employed clients with their job has increased.
• While clients raised a number of concerns or issues, for the most part they were minor issues that had to do with the need for additional help finding employment, more assistance and support, help filling out paperwork, communication with counselors, and getting more support in general.
The results do suggest that there are some areas on which the Division can focus to improve client satisfaction: For the Division as a whole and for all regions, most client issues, concerns or problems focus on the need for additional support, their difficulties in finding employment, communication, and the desire for more information. While the large majority of clients were satisfied with the Division, there are some specific concerns mentioned by clients. None of these were mentioned by a majority of clients, though they represent the specific targets that the Division can focus on to improve client satisfaction. In general terms, they concern issues of communication (the ability to reach counselors and other Division staff), employment issues (the ability to find a job), concerns with the effectiveness of the Division in providing services and meeting expectations, issues with staff (switching counselors, getting help, understanding), and issues of support (the need for more guidance or the perception that services are of little value). In general, these are the same types of issues and concerns raised by clients in 2003 and 2006. Specifically, some clients mentioned:
• Difficulties in obtaining employment or that they could not find a job, the need for more job search help and more job options.
• They needed more support or guidance from the Division and their counselor.
• Difficulties in getting in touch with their counselor or other staff (did not return calls, were not available, delays in communicating with clients, always reached voicemail).
• That they felt, in some instances, services provided were of little help or that they actually did not receive services.
Perhaps the simplest issues to address are concerns around communication since there are actionable steps that can easily be implemented. The suggestions offered in 2003 and 2006 in regards to communication issues are again still relevant in 2008:

DVR & SRC Needs Assessment 9
• Letting clients know what can and cannot be done by the Vermont Division
of Vocational Rehabilitation helps set expectations.
• Follow through with clients to let them know that VR is doing its best to help meet their needs.
• In getting back to clients or following up, give a realistic time frame. Set expectations early with clients based on how much time it can be expected to take based on what the client needs. However, do respond to inquiries as quickly as feasible.
• Inform clients that they will need to leave messages on voicemail when their counselor is not available. Optionally, use e-mail if feasible. Counselors are providing services for many clients. Without a message or an e-mail, the counselor has no way to know that a client has been in contact. It is human nature to want to speak directly with a person at the time of contact but this is not always possible, and it is important that clients understand this is not the most effective means of communicating with their counselor when they are out of the office or busy with other work.
• When feasible, leave messages on voicemail that indicate when a counselor is out of the office and when they are expected to return.
• In terms of providing information to the clients, work to determine if there are potentially other services that may be of benefit to the client. As important, verify with clients that they are clear on the range of services that can be provided.
• In terms of employment, work with the client to determine what they see as their goals but also let them know the realistic options that are available. It is also important that clients give counselors their expectations. Another factor is to provide realistic information about job opportunities. Given the current economic climate, job opportunities may be more limited and identifying a job opportunity that meets a client’s goals will likely take more time.
• Help the clients understand that staff and counselors do have other responsibilities.
• Ask frequently if the client has any concerns or problems. Clients are the least satisfied about financial independence and achieving their job goals. These two measures had the lowest percentages of clients that responded in a positive manner (i.e., agreeing that the services they received had helped them become more financially independent or achieve their job goals). While a majority did evaluate the agency positively on this aspect, only 71% felt the services received from the Vermont Division of Vocational Rehabilitation helped them
DVR & SRC Needs Assessment 10
become more financially independent. When asked why they felt that the services did not help them become more financially independent, the main reasons cited by clients were:
♦ They did not find employment. ♦ Their job did not make them financially independent. ♦ They had to use their own resources to get a job or training.
One of the goals of the agency is to help clients become more financially independent, and in a majority of cases clients do feel the agency is helping. Among those who felt the agency had not helped them become financially independent, job issues are one of the concerns expressed and, to a lesser degree, the need to rely on their own resources to meet the goal of becoming financially independent. Again, the agency should work to best meet the needs of its clients in helping them obtain employment eventually, but it is also important that clients understand what can and cannot be accomplished by the Division. Communicating with the client to determine their goals is important, but it is just as important to help the client understand the types of services the Division can provide to help them to become financially independent, as well as what the Division cannot do. Job Goals Along with the assessment of the impact of services on financial independence, this measure tended to have one of the lowest percentages of clients that responded in a positive manner (i.e., agreeing the agency helped them reach their job goals). While a majority evaluated the agency positively on this aspect, only 73% felt the services received from the Vermont Division of Vocational Rehabilitation helped them to reach their job goals. When asked why they felt that the services did not help them achieve their job goals, the main reasons cited by clients were:
♦ They did not find employment. ♦ They found a job, but it was not the type of employment they wanted. ♦ They were still working on achieving their goals. ♦ The client had to find work or services on their own.
Of course, one of the primary goals of the Vermont Division of Vocational Rehabilitation is to help clients find employment. Among those who felt the agency had not helped them achieve their job goals, the main concern was that they simply had not found a job. To a lesser degree, there was concern among a small percentage of clients that they had to use their own resources to find employment or that they were dissatisfied with the job they found. Providing a feedback mechanism for clients around employment issues might also help them to meet their job needs.

DVR & SRC Needs Assessment 11
The 2011 Consumer Satisfaction Survey Results As noted, at the time of this writing a new consumer satisfaction survey is underway. The results from this survey will be available in the spring of 2011. It will be important for DVR and the SRC to examine any trend data between 2006, 2008 and 2011. In particular this will allow DVR to assess the impact of the recession and related staff reductions on consumer satisfaction. II. Rehabilitation Services Administration Performance Indicators
Overview The RSA Performance Indicators are the formal measures that the federal government can use to hold the VR program accountable. Failure to meet some or all of the performance indicators can result in corrective action and eventually reductions in federal funding. The Performance Indicators are as follows:
1.1 Change in total employment outcomes. 1.2 Percent of individuals achieving an employment outcome. 1.3 Percentage of individuals in competitive employment. 1.4 Percentage of individuals served with a severe disability. 1.5 Ratio of VR consumer earnings compared to state annual average pay. 1.6 Increase in percentage of individuals who report that earnings are their
primary source of support at closure. 2.1 The service ratio for individuals from a minority background compared to
the service ratio for all non minority individuals. Members of the SRC and VR staff met February 12, 2010 to review Vermont’s performance according to these measures for the period 2003 to 2009. The following were the primary observations of this group: 1.1 Change in total employment outcomes. To meet the standard, DVR
must exceed the employment outcomes achieved by at least one over the prior year.
Year 2003 2004 2005 2006 2007 2008 2009 Increase in Outcomes
94 20 84 32 4 67 -43
In reviewing these outcomes it was concluded that DVR had done exceedingly well increasing outcomes up to 2008. Considering the economic climate in 2009, we felt missing the 2008 total by only 43 outcomes was a significant achievement. Though not reflected in this data, for federal fiscal year 2010 DVR exceeded the 2009 employment outcomes by 87. The total number of employment outcomes (1528) for FFY 2010 exceeded both the FFY 2009 and 2008 totals.
DVR & SRC Needs Assessment 12
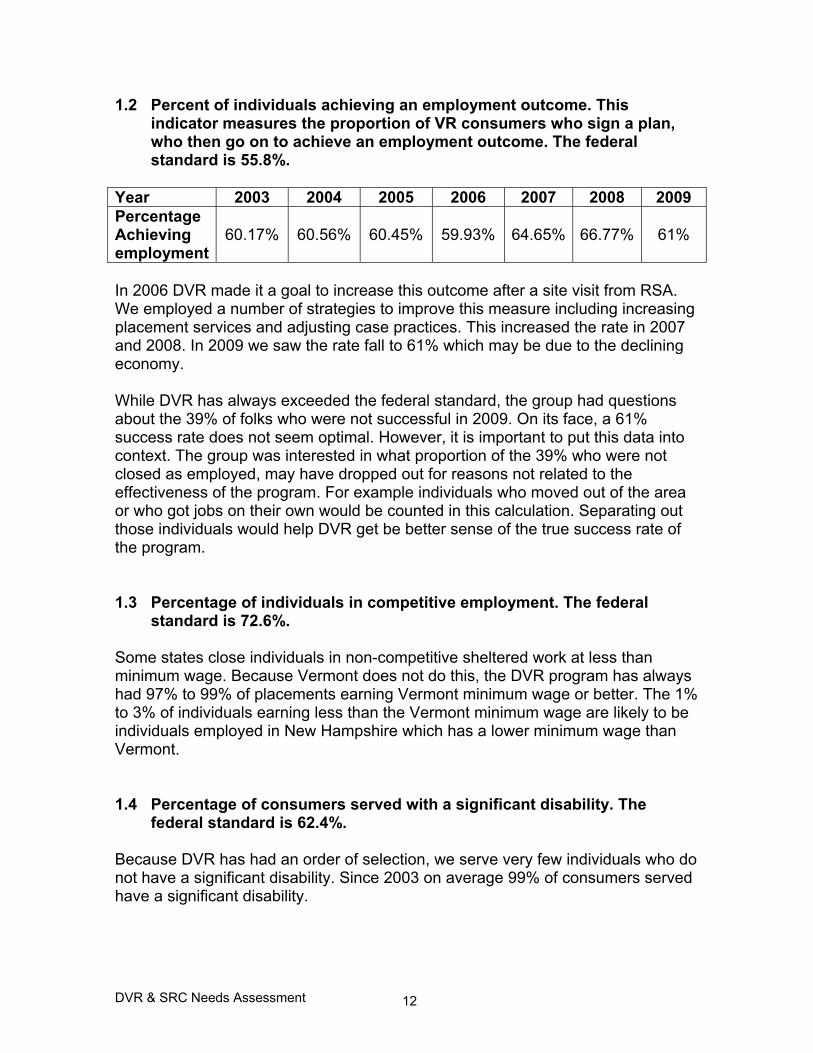
1.2 Percent of individuals achieving an employment outcome. This indicator measures the proportion of VR consumers who sign a plan, who then go on to achieve an employment outcome. The federal standard is 55.8%.
Year 2003 2004 2005 2006 2007 2008 2009 Percentage Achieving employment
60.17%
60.56%
60.45%
59.93%
64.65%
66.77%
61%
In 2006 DVR made it a goal to increase this outcome after a site visit from RSA. We employed a number of strategies to improve this measure including increasing placement services and adjusting case practices. This increased the rate in 2007 and 2008. In 2009 we saw the rate fall to 61% which may be due to the declining economy. While DVR has always exceeded the federal standard, the group had questions about the 39% of folks who were not successful in 2009. On its face, a 61% success rate does not seem optimal. However, it is important to put this data into context. The group was interested in what proportion of the 39% who were not closed as employed, may have dropped out for reasons not related to the effectiveness of the program. For example individuals who moved out of the area or who got jobs on their own would be counted in this calculation. Separating out those individuals would help DVR get be better sense of the true success rate of the program. 1.3 Percentage of individuals in competitive employment. The federal
standard is 72.6%. Some states close individuals in non-competitive sheltered work at less than minimum wage. Because Vermont does not do this, the DVR program has always had 97% to 99% of placements earning Vermont minimum wage or better. The 1% to 3% of individuals earning less than the Vermont minimum wage are likely to be individuals employed in New Hampshire which has a lower minimum wage than Vermont. 1.4 Percentage of consumers served with a significant disability. The
federal standard is 62.4%. Because DVR has had an order of selection, we serve very few individuals who do not have a significant disability. Since 2003 on average 99% of consumers served have a significant disability.
DVR & SRC Needs Assessment 13
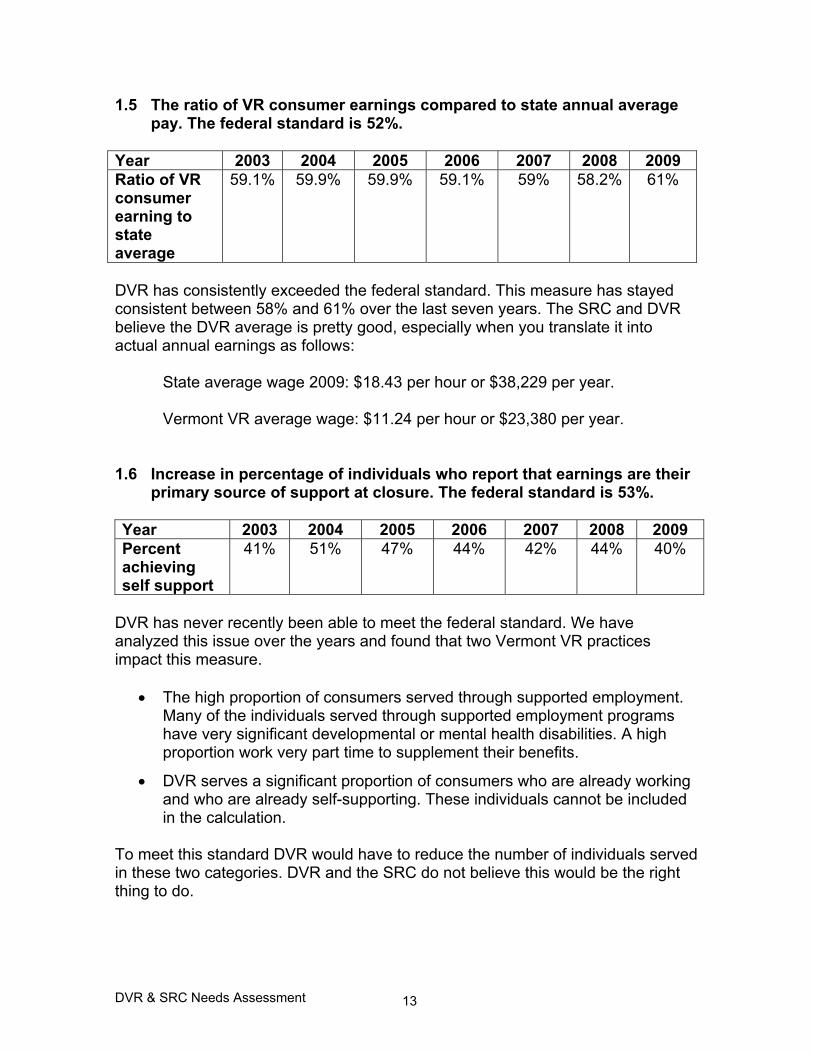
1.5 The ratio of VR consumer earnings compared to state annual average pay. The federal standard is 52%.
Year 2003 2004 2005 2006 2007 2008 2009 Ratio of VR consumer earning to state average
59.1% 59.9% 59.9% 59.1% 59% 58.2% 61%
DVR has consistently exceeded the federal standard. This measure has stayed consistent between 58% and 61% over the last seven years. The SRC and DVR believe the DVR average is pretty good, especially when you translate it into actual annual earnings as follows:
State average wage 2009: $18.43 per hour or $38,229 per year. Vermont VR average wage: $11.24 per hour or $23,380 per year.
1.6 Increase in percentage of individuals who report that earnings are their
primary source of support at closure. The federal standard is 53%. Year 2003 2004 2005 2006 2007 2008 2009 Percent achieving self support
41% 51% 47% 44% 42% 44% 40%
DVR has never recently been able to meet the federal standard. We have analyzed this issue over the years and found that two Vermont VR practices impact this measure.
• The high proportion of consumers served through supported employment. Many of the individuals served through supported employment programs have very significant developmental or mental health disabilities. A high proportion work very part time to supplement their benefits.
• DVR serves a significant proportion of consumers who are already working and who are already self-supporting. These individuals cannot be included in the calculation.
To meet this standard DVR would have to reduce the number of individuals served in these two categories. DVR and the SRC do not believe this would be the right thing to do.
DVR & SRC Needs Assessment 14
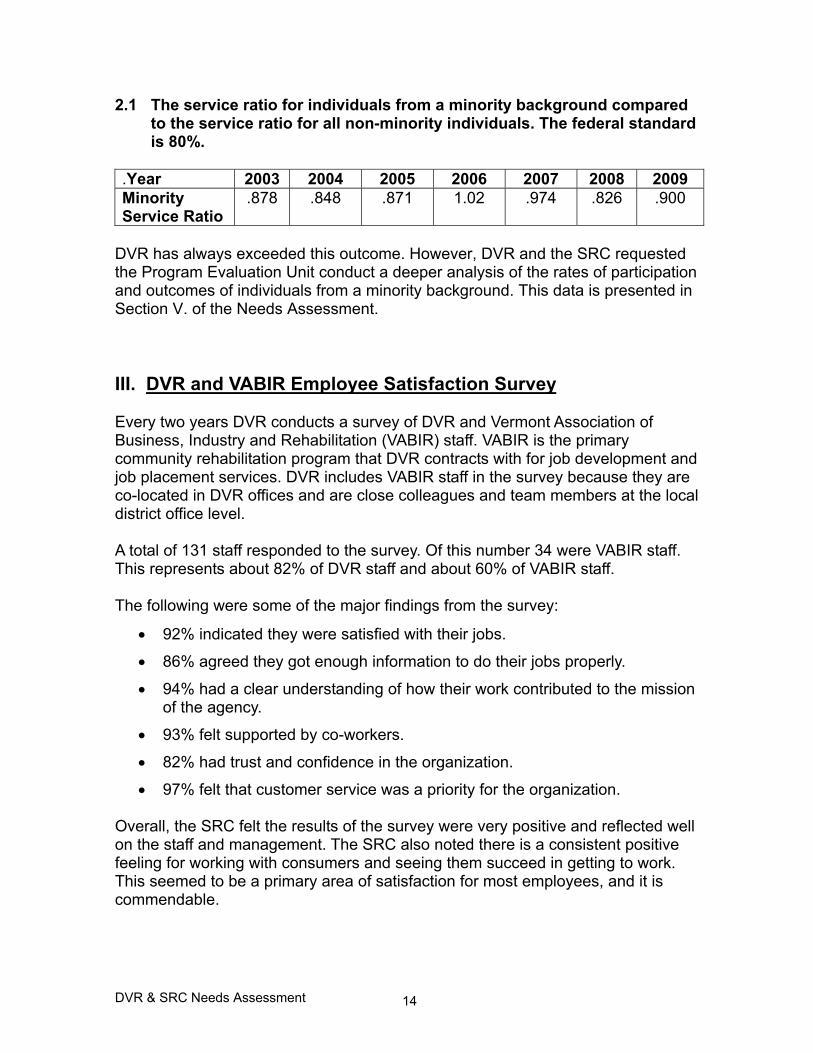
2.1 The service ratio for individuals from a minority background compared to the service ratio for all non-minority individuals. The federal standard is 80%.
.Year 2003 2004 2005 2006 2007 2008 2009 Minority Service Ratio
.878 .848 .871 1.02 .974 .826 .900
DVR has always exceeded this outcome. However, DVR and the SRC requested the Program Evaluation Unit conduct a deeper analysis of the rates of participation and outcomes of individuals from a minority background. This data is presented in Section V. of the Needs Assessment. III. DVR and VABIR Employee Satisfaction Survey Every two years DVR conducts a survey of DVR and Vermont Association of Business, Industry and Rehabilitation (VABIR) staff. VABIR is the primary community rehabilitation program that DVR contracts with for job development and job placement services. DVR includes VABIR staff in the survey because they are co-located in DVR offices and are close colleagues and team members at the local district office level. A total of 131 staff responded to the survey. Of this number 34 were VABIR staff. This represents about 82% of DVR staff and about 60% of VABIR staff. The following were some of the major findings from the survey:
• 92% indicated they were satisfied with their jobs.
• 86% agreed they got enough information to do their jobs properly.
• 94% had a clear understanding of how their work contributed to the mission of the agency.
• 93% felt supported by co-workers.
• 82% had trust and confidence in the organization.
• 97% felt that customer service was a priority for the organization. Overall, the SRC felt the results of the survey were very positive and reflected well on the staff and management. The SRC also noted there is a consistent positive feeling for working with consumers and seeing them succeed in getting to work. This seemed to be a primary area of satisfaction for most employees, and it is commendable.
DVR & SRC Needs Assessment 15
Areas of Need Based on staff ratings and narrative comments, a number of areas of need were identified. Performance evaluations, supervision and training seem to be in need of tighter congruence between what is evaluated and the goals and supports offered. An example of this is the disparity between perceived need for further training to do the job and perceived access to that training. Of concern is the heavy workload, described as too many cases, too much paperwork and too many meetings. Paperwork is most often cited as the least-liked work activity and in the way of having time to do a better job. The perception that bureaucratic work overwhelms the hours in which to accomplish the DVR mission is a strong stressor and the source of much dissatisfaction. Plans are advancing toward implementing electronic records which might help eliminate some duplication of effort. Counselors sometimes encounter consumers who are not ready to work and need many services before employment. Referral organizations might benefit from educative strategies regarding who would be appropriate consumers of VR services. There were some concerns about physical space, citing lack of daylight and cramped, non-private cubicles as impeding the work done with clients. Assessment of space and working conditions, focusing on maximizing work spaces to increase productivity and morale, may improve this picture. In summary, the SRC recommended the following actions for the 2011 Needs Assessment:
1. Reduce meetings, duplicate processes and paperwork through technology enhancement.
2. Explore strategies to educate referral organizations about consumer readiness for VR.
3. Improve supervision and performance evaluations to manage poor performers.
4. Maximize work space to increase productivity and morale. IV. Employer Satisfaction Survey Market Decisions conducted this project in 2009 on behalf of the Vermont Division of Vocational Rehabilitation. The goal of this survey was to determine employer satisfaction with VR employment services. In addition, a telephone survey of the general business community was conducted to gauge awareness of VR and VR services among employers in Vermont.
DVR & SRC Needs Assessment 16
The Survey Questionnaire The survey questions were developed in collaboration with the staff of the Vermont Division of Vocational Rehabilitation. The survey included questions in six sections:
• Awareness of and familiarity with the Division and VABIR • Communications with and use of services provided by the Division and
VABIR • Satisfaction with the services provided by the Division and VABIR • Interest in receiving services provided by the Division and VABIR • Company hiring process and prior experiences with employees with
disabilities • Communications
Sampling The sampling plan for this survey was targeted to primary groups of employers in Vermont. The goal of the sampling plan was to:
• Gather information from current clients of the Division; and • Gather information from the general business community in Vermont.
Current Clients The sampling strategy gathered data from 100 clients of the Division and from 200 employers in the broader business community in Vermont. In order to reach clients, the Division provided a list of businesses with which the Division had a current or a past working relationship. General Business Community Among the general business community, the goal was to complete a minimum of 200 surveys among businesses located in Vermont. The sampling frame consisted of all privately-owned businesses in the state. The sample was generated by Marketing Systems Group, one of the nation’s leading sample generation firms. The sample was stratified by geography as well as by the size of the business based on the total number of employees. The sample was stratified based upon four geographic strata and three business size classes. Survey Results The responses from the survey indicate that respondents clearly fall into three categories. These include:
1. Current clients – those that are currently receiving services from the Division (n=63).

DVR & SRC Needs Assessment 17
2. DVR Non-clients – these represent respondents whose information was provided by the Division but during the interview indicated that they had not received services from the Division during the past year (n=54).
3. General Business Non-clients – these are respondents drawn from the
general business community (a random sample of all Vermont businesses) that have not received services from the Division during the past year (n=225).
This breakdown will help the Division focus efforts on their current clients, on those with which there has been contact but for whom services have not been provided, and on the larger business community in Vermont. Summary by Respondent Group 1. Current Clients 92% of clients indicated they are familiar with the Vermont Division of Vocational Rehabilitation, though only 33% indicated they are very familiar with the Division. Current clients have a positive impression of the Division with 81% having a positive image of the Division. Only 2% indicate they have a negative image of the Division. The level of familiarity with VABIR is significantly lower: 44% indicate any level of familiarity and only 17% indicate they are very familiar. 38% indicate they have a positive image of VABIR, however, 51% simply lack the familiarity to assess VABIR’s image. These results suggest that even among those clients who are currently working with the Division, they know about the specific services they receive and are familiar with the staff with whom they work, but there is still a lack of knowledge or detail about the role of the Division and the services it provides to Vermont businesses. There is also a clear lack of awareness among current clients of VABIR, the role of VABIR, the services it provides, and its relationship with the Vermont Division of Vocational Rehabilitation. Most of the Division’s current clients have a long-term relationship with the Division. 44% have been working with the Division and/or VABIR for more than five years while 24% of clients have been working with the Division and/or VABIR for two to five years. Nearly 80% have met with a representative of or staff from the Division, and 27% have met with a representative of VABIR. Contact with the Division has been fairly recent with more than half of current clients meeting with Division staff within the past three months (13% within the past week, 21% two to three weeks ago, 6% one month ago, and 11% two to three months ago). Among current clients, the most commonly used services include:
• Referral of candidates for job openings (81%)

DVR & SRC Needs Assessment 18
• Training and consulting on disability and employment (49%) • Assistance with accommodations for workers with disabilities (46%) • Job coaching (40%)
Current clients express a high level of satisfaction with the services that are provided by the Division. Only a small percentage of clients report any level of dissatisfaction with the services or with Division staff providing services. Among the small percentage of clients that express dissatisfaction, their main concerns were the training level or qualifications of candidates, the burden of paperwork, and the helpfulness of the staff. Current clients offered a few suggestions for improving the current level of service. These suggestions included the need for more frequent contact and more frequent follow-up by Division staff. A number of clients also stressed the need to better prepare candidates for work including job readiness training and better awareness of job details. Current clients also mentioned the need to ease the burden of paperwork. Given their status as current clients of Vermont Division of Vocational Rehabilitation, it is not surprising that this group has extensive experience with and knowledge about hiring workers with disabilities. 67% of current Division clients have workers with disabilities in their company or business, while 29% have hired workers with disabilities in the past. Only 3% of current clients have never hired a disabled worker. In addition, 70% of current clients have a diversity initiative implemented in their company or business and 87% are aware that the Americans with Disabilities Act offers tax credits and deductions to improve accessibility for employees with disabilities. Three in ten clients say that these tax incentives make them more likely to hire a candidate with a disability. Interest in additional services among current clients is generally very strong. Among this group we find:
• 73% of current clients would be interested in a service where they could assess candidates with disabilities prior to making a hiring commitment.
• 70% would be interested in a service that provides assistance for employees that may develop age-related disabilities.
• 10% say they would be interested in meeting an Invest EAP representative to learn about how their comprehensive EAP program could benefit their company.
Interest for being contacted about the VR EAP program is low among clients because a large percentage of them already offer their own EAP program. Likewise, 75% of clients said they are familiar with EAP programs and 66% of those said that their company already offers access to a program.

DVR & SRC Needs Assessment 19
Not surprisingly, current clients have a high level of engagement and communication with the Division as well as other placement programs. 29% of current clients work with other placement programs in addition to VocRehab Vermont and VABIR. The other programs that current clients work with are diverse and include the Vermont Department of Labor, Vermont Associates, Vermont Employment Center, Reach Up through the Department for Children and Families, and recruiters or staffing agencies in general. Less than half of current clients, 44%, said they would be very interested in having one point of contact to access a range of placement programs. However, 24% indicated that they would need more information before making a decision. Preferred methods of contact are: email 54%; USPS mail 35%; and in-person contact by a representative, 35%. The fact that such a large percentage of current clients prefer to be contacted in-person is an indication that VocRehab Vermont and VABIR representatives have been successfully communicating with clients and clients feel comfortable speaking with representatives. 2. DVR Non-clients This group of respondents represents businesses with which the Division has had some form of contact but are not currently using services provided by the Division, however one-half have used services in the past. Thus, there is some basis for awareness of the Division and the services it provides. Although the group has had either a prior relationship with the Division or at least contact with the Division, a sizeable percentage is unfamiliar with the Division. Even among those with some familiarity, they seem to lack a depth of understanding about the Division. 61% indicate they are familiar with the Vermont Division of Vocational Rehabilitation although only 13% indicate they are very familiar. 39%, more than one third, are not very, or not at all familiar with the Division. 53% have a positive image of the Division. While only 2% have a negative image of the Division, 30% lack the familiarity to offer an assessment. As with current clients, the level of familiarity with VABIR is significantly lower than that of the Division: only 31% are very or somewhat familiar with VABIR while 61% are not very or not at all familiar with VABIR. While 16% have a positive image of VABIR, 65% lack the familiarity to assess VABIR’s image. These results suggest the need for additional communication with this group. Many are simply not familiar with the Division and many more are likely not familiar with the specific services offered by the Division. As with current clients, there is a lack of familiarity of VABIR, the role of VABIR, the services it provides, and its relationship with the Vermont Division of Vocational Rehabilitation.
DVR & SRC Needs Assessment 20
44% of this group has met with a representative of the Division and 31% have met with a representative of VABIR. Contact with the Division was, in general, not recent; only 6% have met with a representative within the past month and only 27% within the past year. 50% of this group has worked with the Division and/or VABIR in the past. The services this group had most likely obtained from the Division included referral of candidates for job openings, job coaching, help with accommodations for workers with disabilities, and identification of hiring incentives such as tax credits and training reimbursement. However, these respondents have not worked with the Division recently. 29% of those indicating they had worked with DVR or VABIR in the past had a working relationship one to two years ago. 25% indicate this working relationship was two to five years ago, and 29% indicate they last worked with the Division and/or VABIR more than five years ago. The main reasons cited for not continuing a working relationship include the poor economy affecting the number of jobs, the lack of job openings, or simply that there was no need for the services provided by the Division. Many respondents expressed an interest in the services provided by the Division. A majority of the respondents in this group indicate they are very or somewhat interested in obtaining one of more services offered by the Vermont Division of Vocational Rehabilitation. Respondents expressed the highest level of interest in the following:
• Referral of candidates for job openings (52% very or somewhat interested) • Retention and/or retraining of incumbent workers who develop disabilities
(44% very or somewhat interested) • Assistance with accommodations for workers with disabilities (44% very or
somewhat interested) • Training and consulting on disability and employment (41% very or
somewhat interested) • Disability awareness and etiquette trainings for supervisors, managers and
staff (41% very or somewhat interested) • Identification of hiring incentives such as tax credits, training reimbursement
(41% very or somewhat interested) • “Try before you buy” options for assessing a candidate (41% very or
somewhat interested) A sizeable percentage of this group has used referral of candidates for job openings (37%) and job coaching services (20%) in the past. (Smaller percentages have obtained other services from the Division.) 50% obtained some type of service from the Division in the past. However, 50% have NOT obtained prior service. Thus, there are two distinct populations within this group that the Division will have to reach out to and engage their interest.

DVR & SRC Needs Assessment 21
Regardless of whether or not they have used services in the past, this group is included among those that have contact with the Division. Thus, it seems that the opportunity here is likely one of better communication. For those that might have used these services in the past, follow-up to determine if there is a continued need is warranted. For those that have not used these services in the past, the need is communication, awareness, and education. There is a need to not only communicate with this group about the Division in general, but provide information about the specific services the Division offers. Despite the fact that this group of respondents say they do not use any services provided by the Division of Vocational Rehabilitation and VABIR, their experience with hiring workers with disabilities is similar to that of current clients. Among this non-client group, 46% currently have workers with disabilities in their company or business, while 31% have hired workers with disabilities in the past. Only 15% of this group have never hired a worker with a disability. 61% of DVR non-clients report they currently have a diversity initiative in their company or business and 65% are aware that the Americans with Disabilities Act provides tax credits and deductions to improve accessibility for employees with disabilities. 24% of these respondents say that these tax incentives make them more likely to hire a candidate with a disability. However, unlike current clients, respondents from this group expressed less interest in potential services. Only 48% of DVR non-clients would be interested in a service that allows them to assess candidates with disabilities before committing to hiring the candidate. 25% said that they would need more information before making a decision. In addition, 44% of this group would be interested in a service that provides assistance for employees that may develop age-related disabilities. 60% of the DVR non-clients indicated they are familiar with EAPs and 64% of those who are familiar with them said their company offers employee access to one. Similar to the current clients, only 10% said they would be interested meeting an Invest EAP representative to learn about how their comprehensive EAP program could benefit their company. The DVR non-clients share some similarities to current clients in their communication interests. 28% of these respondents indicated that they work with other placement programs. Other types of placement programs they work with are similar to what current clients use. 33% of DVR non-clients would prefer one point of contact for all their placement needs, while an additional 28% of these respondents indicate they would need more information before making a decision. 43% of this group prefers to be contacted by email and 43% by USPS mail. A smaller percentage, 22%, said they prefer in-person contact by a representative.
DVR & SRC Needs Assessment 22
3. General Business Non-clients General non-business respondents represent organizations with which the Division has had little or no contact; only 12% report ever meeting with a representative or staff of the Division. With this limited contact it is not surprising that there is a lack of familiarity with the Division. Only 31% report any level of familiarity with the Vermont Division of Vocational Rehabilitation. Only 6% indicate that they are very familiar. 27% have a positive image of the Division but since such a large percentage lacks familiarity, 34% indicate their image of the Division is neutral while 38% did not offer an assessment given their lack of familiarity. Less than 10% indicate any level of familiarity with VABIR and 87% indicate they are not very or not at all familiar with VABIR. Given the general lack of familiarity, 68% did not offer an assessment of the image of VABIR. This group recommends building awareness. The results suggest that communications need to first increase awareness of the Division among the larger Vermont business community, then to conduct an effort to get businesses to use the services offered by the Division. The good news is that there is interest among the broader business community for the services provided by the Division, especially among the larger companies in Vermont. Only 12% of general business non-clients have met with a representative or staff of the Division only, and 3% have met with a representative of VABIR. Contact with the Division was, in general, not recent. Only 6% have met with a representative within the past year. 10% report working with the Division and/or VABIR in the past. The services this group obtained include referral of candidates for job openings, training and consulting on disability and employment, and assistance with accommodations for workers with disabilities. Those receiving services in the past have not done so recently. 29% had a working relationship with the Division and/or VABIR one to two years ago; 6% indicate this working relationship was two to five years ago. 35% of those who reported working with the Division or VABIR in the past indicated they last worked with the Division and/or VABIR more than five years ago. The main reasons cited for not continuing a working relationship included a lack of job openings or simply that there was no need for services provided by the Division. However, 39% of those with a prior working relationship with the Division were unsure why their company was no longer working with the Division. The general business non-clients do, however, express an interest in the services provided by the Division. Those with the highest level of interest include:
• Identification of hiring incentives such as tax credits, training reimbursement (46% very or somewhat interested)

DVR & SRC Needs Assessment 23
• Retention and/or retraining of incumbent workers who develop disabilities (45% very or somewhat interested)
• Try before you buy options for assessing a candidate (45% very or somewhat interested)
• Assistance with accommodations for workers with disabilities (40% very or somewhat interested)
This group differs from the two others in the report in that they have had far less contact with the Division in the past: Only 10% have received services, and only 12% have met with a representative or staff of the Division. Thus, this group has little experience or relationship with the Division and does not know how the services the Division provides can assist their business. Here the remedy is clearly to first increase awareness and then educate businesses about the Division and its role. The bright point is that there is interest among the general business community for the services and assistance that the Division provides. Once familiar with the Division, there is the opportunity to educate the general business community about VR services and begin working with these businesses. In looking at specific segments of the general business community, the groups that convey the highest level of interest are the larger employers, those employing 50 or more, as well as those in the Brattleboro/Springfield service region. The general business non-client community exhibited less knowledge about, or experience hiring workers with disabilities than both current DVR clients and non-clients. 50% of general business non-clients either currently have workers with disabilities in their company or have hired workers with disabilities in the past. 42% of these respondents have never hired a disabled worker. Only 35% of general business non-clients report that they currently have a diversity initiative implemented in their company or business, and 47% are aware of the tax credits and deductions offered to improve accessibility for employees with disabilities. 22% of this group said that these tax incentives make them more likely to hire a candidate with a disability. Interest in additional services among general business non-clients is weaker than it is among current clients. Among this group:
• 47% of general business non-clients would be interested in a service where they could assess candidates with disabilities prior to making a hiring commitment.
• The same percentage, 47%, would be interested in a service that provides assistance for employees that may develop age-related disabilities.

DVR & SRC Needs Assessment 24
• 16% say they would be interested in meeting an Invest EAP representative to learn about how their comprehensive EAP program could benefit their company.
However, within the general business community, respondents working in companies with 50 or more employees expressed more interest in these programs. 57% of this segment expressed interest in the service to assess candidates before hiring, while 59% of this segment would be interested in a program for aging workers. Therefore, while overall interest in these programs among non-client businesses lags behind that of current clients, interest among larger businesses is only slightly below that of current clients. Only 46% of general business non-clients said they are familiar with EAPs, and 53% of those who are familiar with them said their company offers employees access to one. However, among this group of companies with 50 or more employees, 73% are more likely to be familiar with EAP programs and 63% say that their company offers employees access to one. Among general business non-clients, only 17% indicated that they work with other placement programs. The types of agencies that this group said they work with tend to be generic in nature, such as recruiters or staffing agencies and vocational tech programs. Forty-five percent of the general business respondents say they would be interested in having one point of contact to access a range of placement programs. Interest in this program among larger companies with 50 or more employees is higher: 55% of this group expressed interest, compared to only 23% of those with companies with fewer than 10 employees. When they don’t have a pre-existing relationship with VocRehab Vermont and VABIR, 48% prefer to be contacted by USPS mail and 46% by e-mail. Only 8% would like to be contacted in person by a representative. V. DVR Program Evaluation Unit (PEU) Findings As noted, the SRC requested that the DVR program conduct an assessment of a number of areas of interest. The DVR Planning and Evaluation Unit Coordinator conducted this research using a variety of public and administrative data sources. Access to Services The SRC was interested to know if individuals from minority groups accessed VR services at a proportional rate to individuals who are not from minority groups. To make this assessment, the PEU used census data in comparison with the DVR data as a broad measure of the effectiveness of the program in serving eligible

DVR & SRC Needs Assessment 25
minorities. So, for example, if the census showed 50% of the Vermont population of persons with disabilities was non-white, one would expect 50% of VR consumers to be non-white. As a measure of access to services, the PEU used the number of individuals who achieved “post-plan closure”. This means the number of individuals who had an individual plan for employment (IPE) and whose cases were closed during the year. For the federal fiscal years 2009 and 2010 the PEU looked at the number of post-plan closures for the following groups where comparable census data was also available. These included:
• Women • Non-whites • Non-English as a primary language
Population Total
Number Based on Census Data
Post-plan Closures in 2009. Number and Percentage
Post-plan Closures in 2010. Number and Percentage
All working age individuals with disabilities
46,233 2,433 5.26% 2,556 5.53%
Female 22,163 1,156 5.22% 1,139 5.14%
Male 24,070 1,277 5.31% 1,417 5.89%
White 44,291 2,282 5.15% 2,381 5.38%
Non-white 1,942 97 5.00% 116 5.97%
English Primary 44,199 2,393 5.41% 2,509 5.68%
Non-English Primary 2,034 36 1.77% 42 2.06% Based on the above data it does not appear that women and non-whites are accessing the program at a lower rate than the overall eligible population. The group that does not seem to be accessing the Vermont DVR program at a proportional rate are non-English speakers. It is important to note, given the very small numbers, that small variations could affect the percentage served. That said, the numbers are significantly below any other group and warrant further investigation. Outcomes for Minority Groups DVR measured the outcomes of groups using the rate of rehabilitation. The rate of rehabilitation is the percentage of individuals with an Individual Plan for Employment whose cases were closed as successfully employed. The following

DVR & SRC Needs Assessment 26
table includes the total number of rehabilitations and the rehabilitation rate for each group. Population Successful
Rehabilitations in 2009. Number and Rehab Rate
Successful Rehabilitations in 2010. Number and Rehab Rate
All VR Consumers 1,480 60.8% 1,519 59.4%
Female 691 59.8% 653 57.3%
Male 789 61.8% 866 61.1%
White 1,405 61.6% 1,404 59.0%
Non-white 42 43.3% 72 62.1%
English Primary 1,454 60.8% 1,490 59.4%
Non-English Primary 24 66.7% 27 64.3% In 2009 the rehabilitation rate for non-white consumers did seem to be significantly lower than other groups (43.3%). However, in 2010 the rehabilitation rate jumped to 62.1% above the average for all VR consumers. Given the very small numbers involved, it is difficult to draw any conclusions about large percentage shifts. At a minimum, this measure may require further investigation. Access to Services and Outcomes for Veterans Access to Services The PEU conducted the same analysis for veterans as for minority populations to determine level of access and outcomes. As a measure of access to services, the PEU used the number of individuals who achieved “post-plan closure”. Population Total
Number Based on Census Data
Post Plan Closures in 2009. Number and Percentage
Post Plan Closures in 2010. Number and Percentage
Non Veteran working age individuals with disabilities
40,120 2,291 5.71% 2,415 6.02%
Veteran working age individuals with disabilities
6,113 139 2.27% 137 2.24%

DVR & SRC Needs Assessment 27
In 2009 and 2010 it appeared that veterans with disabilities were less likely to access the DVR program. An important context for this data is the fact that the Veterans Administration (VA) operates a parallel VR program. Many eligible veterans are likely to be enrolled in the VA VR program and therefore would not need Vermont VR services. However, this fact alone may not explain the difference in rates of participation. Anecdotal reports suggest veterans often are unwilling to access services from generic human service programs. Some veterans with disabilities may not be eligible for the VA VR program but be unwilling to access the Vermont VR program. As a result there may be unmet needs. In the last two years VR has developed a stronger partnership with the VA’s VR program and other veterans’ services. VR has identified Veterans Specialists in each region to be the point people for veterans outreach and engagement. VA VR and Vermont VR have begun to partner on individual cases to allow veterans to benefit from what both systems have to offer. As Vermont VR expands its partnership with the VA and veterans organizations we hope to get more data on the needs of this group. Outcomes Based on the rehabilitation rate it appears that veterans are slightly more likely to achieve a successful employment outcome than non-veterans. However, the numbers are very small so it is unlikely the difference is statistically different. Population
Successful Rehabilitations in 2009. Number and Rehab Rate
Successful Rehabilitations in 2010. Number and Rehab Rate
Non-Veteran working age individuals with disabilities
1,480 60.8% 1,519 59.4%
Veteran working age individuals with disabilities
87 62.6% 86 62.8%
Outcomes by Disability Type The PEU conducted an analysis of outcomes using the primary disability category identified by the VR counselor. On average, individuals with a primary disability of mental illness are less likely to achieve a successful outcome than any other group. This group represents about 30% of all DVR closures so it is a significant portion of the population served. It is also important to note that a substantial portion of this group is served by VR in partnership with the Department of Mental Health (DMH) and its Community Rehabilitation and Treatment Programs (CRT). DMH and DVR have identified a significant decline in overall employment rates for
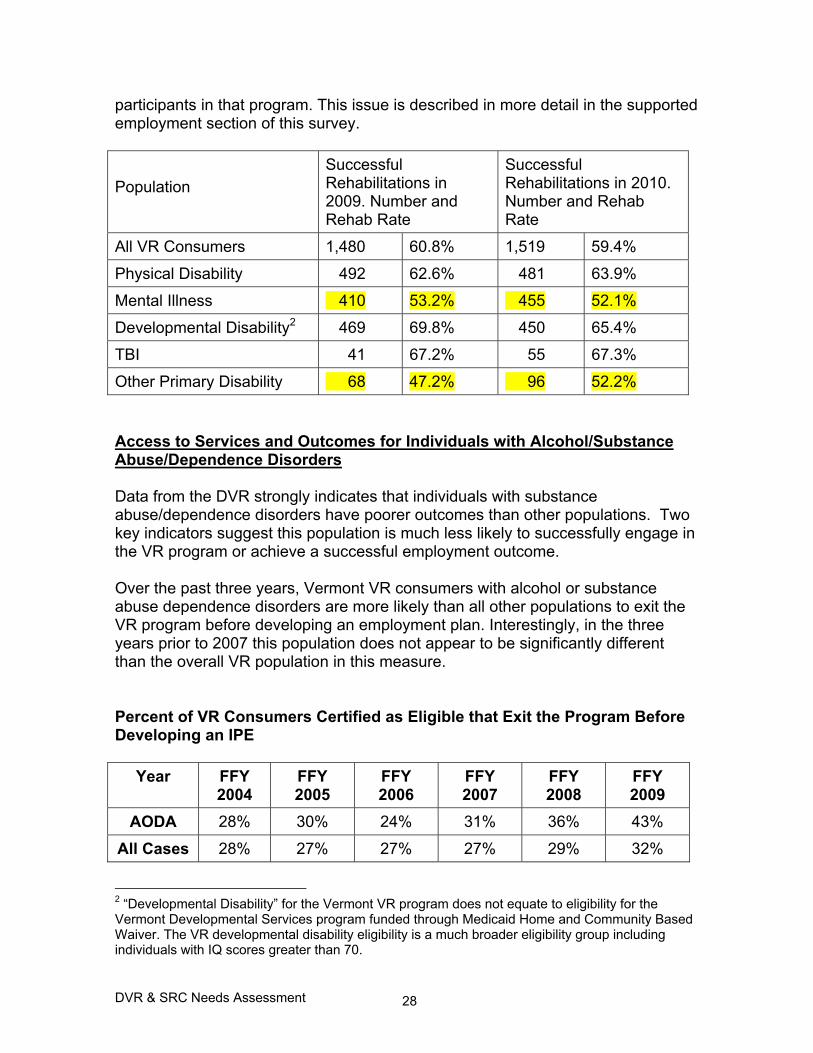
DVR & SRC Needs Assessment 28
participants in that program. This issue is described in more detail in the supported employment section of this survey. Population
Successful Rehabilitations in 2009. Number and Rehab Rate
Successful Rehabilitations in 2010. Number and Rehab Rate
All VR Consumers 1,480 60.8% 1,519 59.4%
Physical Disability 492 62.6% 481 63.9%
Mental Illness 410 53.2% 455 52.1%
Developmental Disability2 469 69.8% 450 65.4%
TBI 41 67.2% 55 67.3%
Other Primary Disability 68 47.2% 96 52.2% Access to Services and Outcomes for Individuals with Alcohol/Substance Abuse/Dependence Disorders Data from the DVR strongly indicates that individuals with substance abuse/dependence disorders have poorer outcomes than other populations. Two key indicators suggest this population is much less likely to successfully engage in the VR program or achieve a successful employment outcome. Over the past three years, Vermont VR consumers with alcohol or substance abuse dependence disorders are more likely than all other populations to exit the VR program before developing an employment plan. Interestingly, in the three years prior to 2007 this population does not appear to be significantly different than the overall VR population in this measure. Percent of VR Consumers Certified as Eligible that Exit the Program Before Developing an IPE
Year FFY 2004
FFY 2005
FFY 2006
FFY 2007
FFY 2008
FFY 2009
AODA 28% 30% 24% 31% 36% 43%
All Cases 28% 27% 27% 27% 29% 32%
2 “Developmental Disability” for the Vermont VR program does not equate to eligibility for the Vermont Developmental Services program funded through Medicaid Home and Community Based Waiver. The VR developmental disability eligibility is a much broader eligibility group including individuals with IQ scores greater than 70.

DVR & SRC Needs Assessment 29
Over the past six years individuals with alcohol or substance abuse/dependence disorders have been consistently less likely to achieve an employment outcome than the overall VR population. Percentage of VR Consumers Achieving an Employment Outcome (Status 26 Closure) from Plan Status (Rehabilitation Rate Performance Indicator 1.2)
Year FFY
2004 FFY 2005
FFY 2006
FFY 2007
FFY 2008
FFY 2009
AODA 49% 55% 54% 60% 57% 47%
All Cases 61% 60% 60% 65% 67% 61% Of greatest concern is that the negative trend appears for both measures in this population. VR consumers with alcohol or substance abuse/dependence disorders are much less likely to get to plan status and when they do, they are increasingly less likely to achieve their employment goal. Field experience mirrors the data findings for this population. VR counseling staff consistently report that alcohol and substance abuse/dependence disorders present the most significant barriers to employment. Program Participation and Outcomes for Individuals with Post-Secondary Education The SRC and the Client Assistance Program (CAP) received anecdotal reports from consumers with post-secondary level educations that indicated they were not being served effectively by the DVR program. Feedback suggested that the DVR program was geared to entry-level employment and DVR counselors lacked the training to serve individuals with higher levels of education and training. As a result, the SRC requested that the DVR Program Evaluation Unit conduct an analysis of program participation and outcomes for individuals with post-secondary levels of education and training. Access to Services The PEU conducted the same analysis for individuals with post-secondary education as for veterans and minority populations to determine level of access and outcomes. As a measure of access to services, the PEU used the number of individuals who achieved “post-plan closure”.

DVR & SRC Needs Assessment 30
Population
Total Number Based on Census Data
Post Plan Closures in 2009. Number and Percentage
Post Plan Closures in 2010. Number and Percentage
All working age individuals with disabilities
46,233 2,433 5.26% 2,556 5.53%
No high school diploma
7,166 601 8.39% 652 9.1%
High school graduate 21,313 1,157 5.43% 1,195 5.61%
Associates degree or some college
12,206 466 3.82% 469 3.84%
BA or higher 5,548 209 3.77% 240 4.33% Based on this data it appears that the higher the level of education, the less likely an eligible individual is to participate in the DVR program. This is a predictable finding since individuals with disabilities with high levels of education tend to be less likely to need DVR services. Conversely, individuals who do not have a high school diploma are more likely to have significant barriers to employment requiring DVR services. However, even if both of the above assumptions are true, it would not also preclude the possibility that some eligible individuals with post-secondary degrees do not access DVR services because they perceive the program as not a match to their needs. Additional data collection through surveys or other methodologies would be required to determine if there was any evidence for this belief. Outcomes DVR measured the outcomes of groups based on educational level using the rate of rehabilitation. The rate of rehabilitation is the percentage of individuals with an Individual Plan for Employment whose cases were closed as successfully employed. The following table includes the total number of rehabilitations and the rehabilitation rate for each group.
DVR & SRC Needs Assessment 31
Population
Successful Rehabilitations in 2009. Number and Rehab Rate
Successful Rehabilitations in 2010. Number and Rehab Rate
All working age individuals with disabilities
1,480 60.8%% 1,519 59.4%
No high school diploma
322 53.6% 355 54.4%
High school graduate 719 62.1% 714 59.7%
Associates degree or some college
284 60.9% 271 57.8%
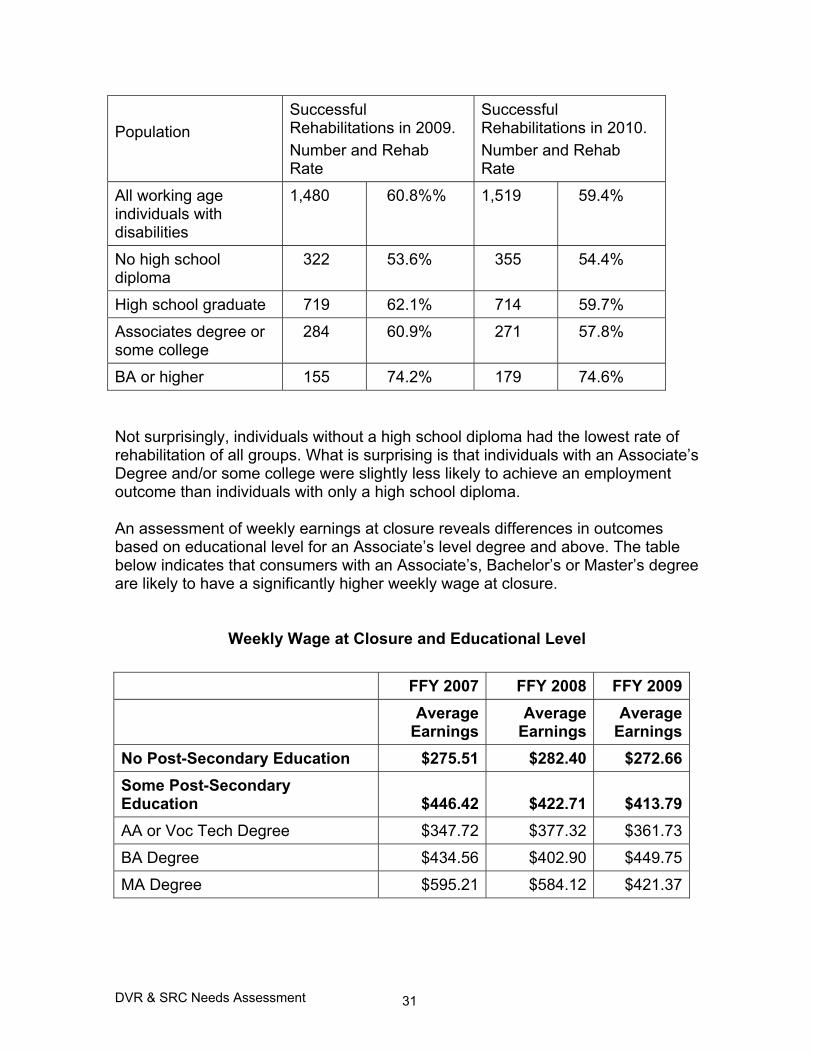
BA or higher 155 74.2% 179 74.6% Not surprisingly, individuals without a high school diploma had the lowest rate of rehabilitation of all groups. What is surprising is that individuals with an Associate’s Degree and/or some college were slightly less likely to achieve an employment outcome than individuals with only a high school diploma. An assessment of weekly earnings at closure reveals differences in outcomes based on educational level for an Associate’s level degree and above. The table below indicates that consumers with an Associate’s, Bachelor’s or Master’s degree are likely to have a significantly higher weekly wage at closure.
Weekly Wage at Closure and Educational Level
FFY 2007 FFY 2008 FFY 2009Average
EarningsAverage
Earnings Average
EarningsNo Post-Secondary Education $275.51 $282.40 $272.66 Some Post-Secondary Education $446.42 $422.71 $413.79 AA or Voc Tech Degree $347.72 $377.32 $361.73
BA Degree $434.56 $402.90 $449.75
MA Degree $595.21 $584.12 $421.37

DVR & SRC Needs Assessment 32
Occupation and Education Level at Closure
Occupations at Rehab FFY 2009
SOC category % Rehabs % Rehabs % Rehabs % Rehabs
No PSE degree AA/VoTech BA MA+
n = 1243 n = 82 n = 109 n = 46Construction and Extraction 3.9% 1.2% 2.2%
Farming, Fishing, and Forestry 1.7% 1.2% 1.8%
Installation, Maintenance, and Repair 2.4% 1.2%
Management, Business and Finance 4.2% 14.6% 15.6% 2.2%
Office Support 14.0% 12.2% 19.3% 8.7%
Production 12.0% 1.2% 3.7%
Professional and Technical 10.1% 31.7% 36.7% 58.7%
Human Services 4.9% 15.9% 19.3% 52.2%
Legal & Healthcare Practitioner 4.3% 12.2% 10.1% 4.4%
Science & Engineering 0.9% 3.7% 7.3% 2.2%
Sales 7.9% 12.2% 6.4% 2.2%
Service 35.4% 17.1% 13.8% 21.7%
Transportation & Material Moving 8.0% 4.9% 1.8% 2.2%
Unpaid Occupations 0.6% 2.4% 0.9% 2.2%
The above table suggests that individuals with higher levels of education are accessing management, professional and technical fields. Supported Employment Services Overview The state of Vermont has a well-established infrastructure of supported employment services for adults with developmental disabilities through the Division of Disability and Aging Services (DDAS) developmental services program, and with adults with mental illness through the Community Rehabilitation and Treatment (CRT) program. The long-term supports are funded through the DDAS

DVR & SRC Needs Assessment 33
Medicaid Waiver and CRT Medicaid case rate respectively. Eligibility for these programs is limited to individuals who meet the eligibility requirements for the CRT and DDAS programs. In addition, to receive Medicaid Waiver services an individual must also meet the DDAS System of Care Priorities. Developmental Services Supported Employment DVR received mixed findings regarding the supported employment outcomes for individuals with developmental disabilities. The total number of VR consumers achieving an employment outcome (status 26 closures) dropped from 188 in State Fiscal Year (SFY) 2006 to 175 in SFY 2007, to 163 in SFY 2008, with a slight increase to 178 in SFY 2009, to 154 in SFY 2010. In SFY 2010 the total number of people with developmental disabilities working in supported employment increased to 950. While Vermont did not meet the targets established in the FFY 2009 State Plan, we feel these results are creditable given the economic environment. With the economic crisis and business layoffs in 2008 and 2009, the supported employment programs did well to maintain the level of employment outcomes (status 26 closures) and the total number of people employed. In addition, the State Division of Disability and Aging Services has continued to place a strong emphasis on supported employment services despite tight fiscal times. For example, DDAS continues to include employment as a funding priority in the system of care plan for people with developmental disabilities. While recent DDAS budget rescissions of Medicaid dollars have led to reduced ongoing support services for supported employment, they have not yet been reduced at the same level as other community support services. DDAS holds public hearings each spring to review options for changing the system of care and its related funding priorities plan as a response to the current fiscal climate. There continues to be a concern that DDAS may feel forced to restrict access to Medicaid-supported employment services. Community Rehabilitation Program Supported Employment The VR Program Evaluation Unit and the DVR Supported Employment (SE) Coordinator have determined that there have been significant errors in the way supported employment status 26 closures have been credited to specific programs. During the past year the SE Coordinator and the PEU have implemented new procedures to tighten data collection and reporting. However, we believe recent data from the programs continues to be somewhat inaccurate. Our current data shows that 470 people with psychiatric disabilities were served in supported employment and 79 individuals achieved successful employment. We

DVR & SRC Needs Assessment 34
believe our data is more accurate than it was during SFY 09; however, we are continuing our improvement efforts to our data systems regarding this measure. We have good data on the other measure, the total number of people with severe psychiatric disabilities who are employed. The total number of individuals with mental illness supported in employment decreased from 826 in SFY 2006 to 803 in SFY 2007, to 768 in SFY 2008, and to 678 in SFY 2009. It is noteworthy that the overall enrollment of individuals with mental health disorders in Vermont’s CRT programs (community mental health programs which house Vermont’s supported employment programs for people with mental illness) decreased from 2971 individuals in SFY 2007 to 2928 individuals in SFY 2008, to 2,850 individuals in SFY 2009. The employment rate reflects a decrease in the percentage of CRT participants supported in employment from 28% in SFY 2006 to 27% in SFY 2007, to 26% in SFY 2008, and to 24% in SFY 2009. Since the most recent annual data, we are able to add quarterly employment data which reflects a continued decrease in the employment participation rate. During the second quarter of SFY 2010 2,565 individuals were served and 16% were employed. DVR believes the overall number of individuals supported in employment is by far the more important measure of progress. The decrease is a concern because it suggests individuals are getting jobs but not sustaining them. Information from the DVR/SRC Needs Assessment and anecdotal reports from field staff suggest that there are not sufficient numbers of employment staff within the community mental health agencies to provide the necessary supports. In addition, there continues to be significant turnover in some programs which represents a loss of experienced staff. Also it has been reported that some agencies or agency staff do not value employment as a core mental health service. In response to the decrease in overall employment of individuals with mental illness along with the noted capacity issues, DVR has implemented a number of overlapping strategies including a DVR/DMH Mental Health and Employment Leadership Committee made up of state and agency staff and consumer representation. With financial assistance from Vermont’s Medicaid Infrastructure Grant (MIG), the Leadership Committee successfully framed and has been guiding a statewide strategic planning process that has lead to a roll-out of a five year strategic plan. The current MIG is supporting this roll-out by providing for incentives and technical assistance for a community mental health provider who volunteers to develop a local strategic plan and/or an employment program action improvement plan which is based upon the results of an IPS (Individual Placement and Support) Fidelity Review. All ten of Vermont’s mental health supported employment providers volunteered to participate in this MIG-sponsored statewide implementation of IPS Fidelity Reviews to support the consistent implementation of supported employment processes which are based on the SAMHSA evidenced-based practice.

DVR & SRC Needs Assessment 35
Additional continuous improvement activities are occurring to support the increase of successful supported employment outcomes for people with mental illness. DVR did a SWOT analysis of supported employment efforts specifically focusing on VR processes that lead to good outcomes. As a result, VR affirmed a set of process practices for VR counselors, managers, and administrators which were formally implemented on October 1, 2009. DVR supported, and participated with, the Vermont Department of Mental Health (DMH) while it completed a State Health Authority Yardstick (SHAY) which is an evaluation of how well the state supports employment-related activities within its mental health system. DVR is supporting DMH as it reviews the SHAY findings with the community mental centers and determines next steps. As an example of a next step, DMH is considering changing employment services from its current status as an “encouraged” service to requiring it as a “core” service. DVR and DMH are working with a group of community mental health employment providers to design and implement a performance-based contracting system which will provide incentives for improved outcomes while charged with providing quality work for individuals with the most significant challenges (e.g. individuals with long-term unemployment). In addition, DVR and DMH continue to support training and technical assistance in evidence-based supported employment through the New Hampshire/Dartmouth Psychiatric Research Center. Ticket to Work (TTW) revenue is beginning to provide a boost in resources and an incentive to increase outcomes for agencies. Vermont’s supported employment providers received $52,000 in TTW revenue (provider share under DVR joint Employment Network agreement) during SFY10 which was collected during calendar year 2008. $80,000 was collected during calendar year 2009 which will be added to their SFY11 grants, and we project $150,000 will be collected during calendar year 2010. Approximately 75% of this revenue, which is the community provider share according to VT DVR joint Employment Network agreement, will be disbursed to providers of employment services to persons with mental illness. Unmet need for supported employment services for individuals who do not meet CRT and DDAS eligibility criteria for services. The 2007 DVR/SRC needs assessment identified that a significant proportion of VR eligible individuals needed some level of supported employment services but are not eligible for DDAS or CRT services. Individuals who need supported employment by definition require ongoing supports to maintain their employment. However, DVR by federal regulation cannot provide ongoing employment supports. If an individual is not then eligible for CRT or DDAS services the options for long-term supports are very limited. For decades now DVR and the SRC have identified this group as “falling through the cracks” of the current system. Over the past five years DVR has attempted to

DVR & SRC Needs Assessment 36
quantify the number of people in this group. During that period of time VR counselors have been asked to systematically identify individuals in this group at the point where they certify eligibility, specifically, if they record that the individual requires ongoing supports to maintain employment and the type of disability. The following are the recent data.
Four Groups codes in 911 2006 2007 2008 2009 2010 1 DD 102 89 66 99 66 2 TBI 45 31 30 43 19 3 MI 281 343 381 387 251 4 Other 251 276 216 190 53
Based on the above reporting from VR counselors, about 700 individuals per year are found eligible for the VR program who need some kind of ongoing case management support. The numbers appear to drop off in 2010 but we suspect that newer counselors may be unaware of the purpose of this data and might be under-reporting the need. Training for this need is being addressed. By far, the largest group identified in this data is individuals with mental illness. This is consistent with the data that indicates individuals with mental illness are less likely to achieve a successful employment outcome. This data suggests that part of the reason is that they may need ongoing case management support. Despite substantial efforts since the 2007 Needs Assessment, DVR has not been able to implement case management supports for non-CRT or non-DDAS consumers. In 2008 a pilot project to put these services in place in six sites was shelved because of the fiscal crisis. As a result this gap in the service system remains an ongoing challenge for the VR program. Overall Impact of the DVR Program on the Total Estimated Population of Eligible Vermonters The following charts provide data about the overall impact of the Vermont DVR program on the potentially eligible population of individuals with disabilities of working age. The PEU used data from the American Community Survey (ACS) provided by the US Census to determine overall population estimates. The PEU used overall estimates of the eligible population in comparison to the actual numbers served in the VR program to determine population coverage.
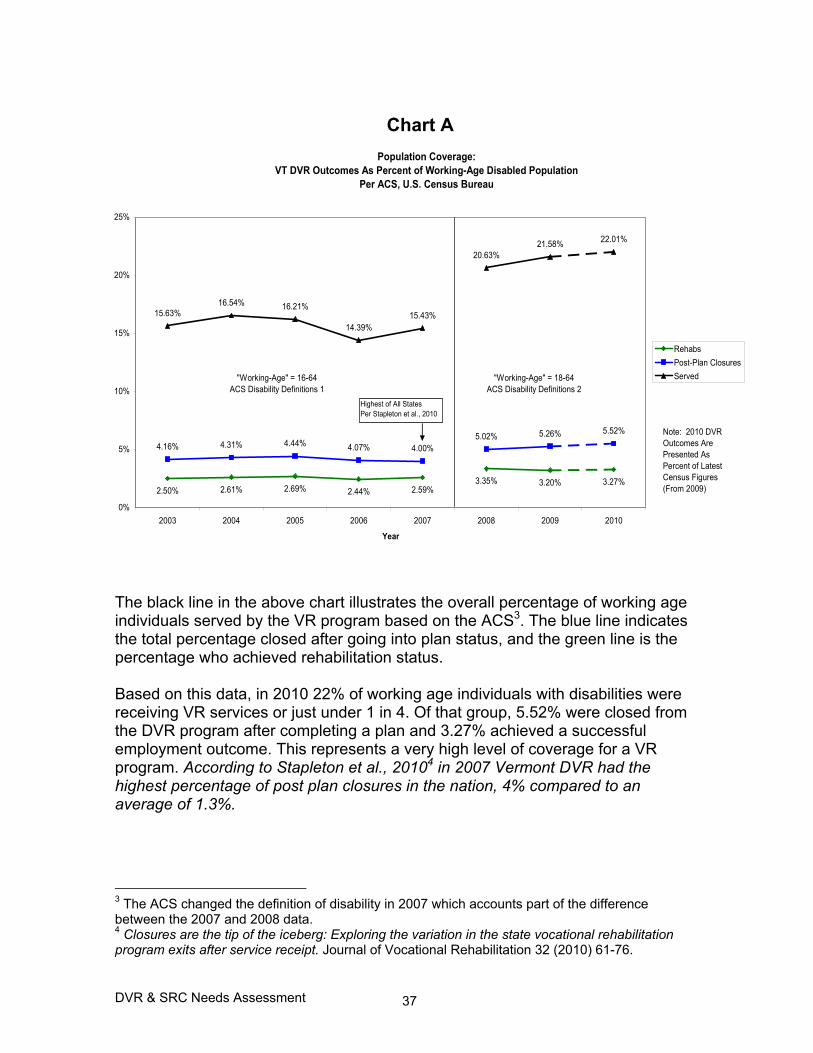
DVR & SRC Needs Assessment 37
Chart A
Population Coverage:VT DVR Outcomes As Percent of Working-Age Disabled Population
Per ACS, U.S. Census Bureau
2.50% 2.61% 2.69% 2.44% 2.59%3.35% 3.20% 3.27%
4.16% 4.31% 4.44% 4.07% 4.00%5.02% 5.26% 5.52%
15.63%16.54% 16.21%
14.39%15.43%
20.63%21.58% 22.01%
0%
5%
10%
15%
20%
25%
2003 2004 2005 2006 2007 2008 2009 2010
Year
RehabsPost-Plan ClosuresServed"Working-Age" = 16-64
ACS Disability Definitions 1"Working-Age" = 18-64
ACS Disability Definitions 2Highest of All StatesPer Stapleton et al., 2010
Note: 2010 DVROutcomes ArePresented As Percent of LatestCensus Figures(From 2009)
The black line in the above chart illustrates the overall percentage of working age individuals served by the VR program based on the ACS3. The blue line indicates the total percentage closed after going into plan status, and the green line is the percentage who achieved rehabilitation status. Based on this data, in 2010 22% of working age individuals with disabilities were receiving VR services or just under 1 in 4. Of that group, 5.52% were closed from the DVR program after completing a plan and 3.27% achieved a successful employment outcome. This represents a very high level of coverage for a VR program. According to Stapleton et al., 20104 in 2007 Vermont DVR had the highest percentage of post plan closures in the nation, 4% compared to an average of 1.3%.
3 The ACS changed the definition of disability in 2007 which accounts part of the difference between the 2007 and 2008 data. 4 Closures are the tip of the iceberg: Exploring the variation in the state vocational rehabilitation program exits after service receipt. Journal of Vocational Rehabilitation 32 (2010) 61-76.

DVR & SRC Needs Assessment 38
Chart B Labor Market Context:
VT DVR Outcomes As Percent of Working-Age Disabled PopulationCompared To Employment Rate for Working-Age Disabled Population
Per ACS, U.S. Census Bureau
2.50% 2.61% 2.69% 2.44% 2.59% 3.35% 3.20% 3.27%
4.16% 4.31% 4.44% 4.07% 4.00% 5.02% 5.26% 5.52%
15.63% 16.54% 16.21%14.39% 15.43%
20.63% 21.58% 22.01%
45.98%
49.78%
44.40% 44.00%46.20% 47.47%
40.22%
0%
10%
20%
30%
40%
50%
60%
2003 2004 2005 2006 2007 2008 2009 2010
Year
RehabsPost-Plan ClosuresServedAnyDisabEmployedRate
"Working-Age" = 16-64ACS Disability Definitions 1
"Working-Age" = 18-64ACS Disability Definitions 2
Note: 2010 DVROutcomes ArePresented As Percent of LatestCensus Figures(From 2009)
The above chart repeats the data from Chart A and adds data on the labor market context. Between 2008 and 2009 there was a precipitous drop in the employment rate for adults with disabilities from 47.47% to 40.22%. This data suggests DVR is already experiencing or will soon experience an upward pressure in the demand for services.
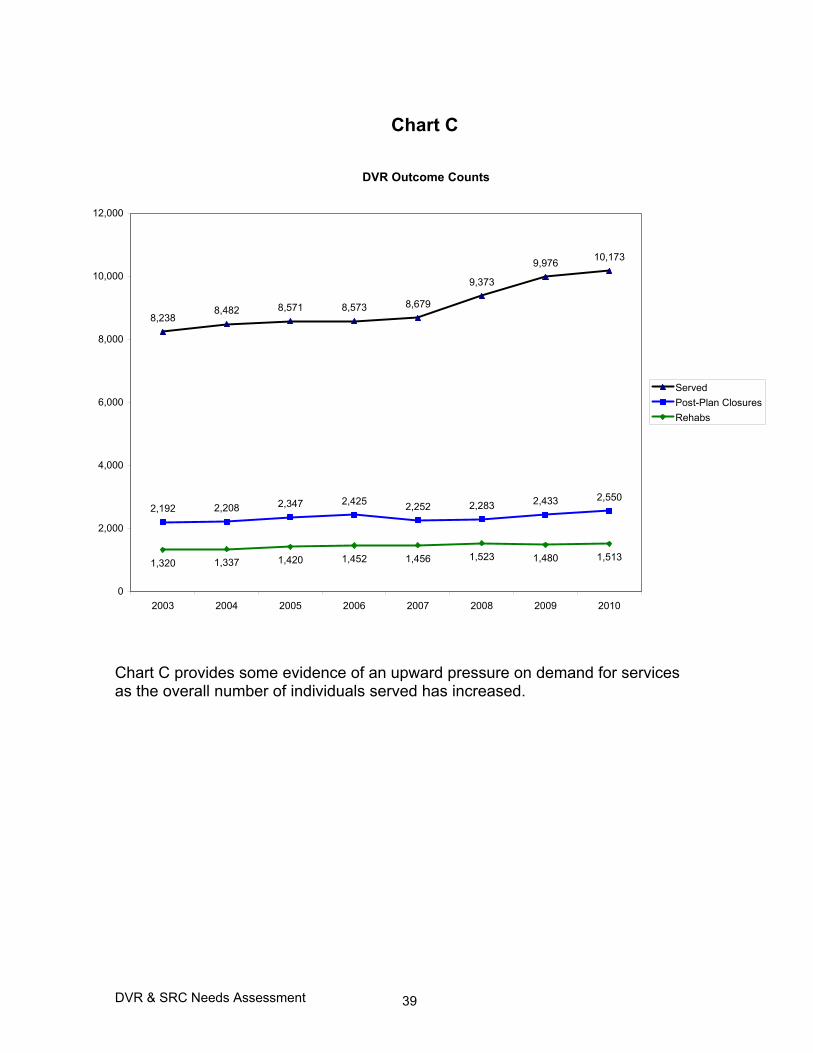
DVR & SRC Needs Assessment 39
Chart C
DVR Outcome Counts
8,2388,482 8,571 8,573 8,679
9,373
9,976 10,173
2,192 2,208 2,347 2,425 2,252 2,283 2,433 2,550
1,320 1,337 1,420 1,452 1,456 1,523 1,480 1,513
0
2,000
4,000
6,000
8,000
10,000
12,000
2003 2004 2005 2006 2007 2008 2009 2010
ServedPost-Plan ClosuresRehabs
Chart C provides some evidence of an upward pressure on demand for services as the overall number of individuals served has increased.

DVR & SRC Needs Assessment 40
Chart D
Upstream Pipeline: Vermont Youth With Disabilities
Counts
6,926
8,736
7,408
6,599
7,2086,995 6,887
1,0731,385 1,235 1,222 1,053
1,790
1,132
965 975 1,070733
972690 505
4,314
7,478
6,1735,947
6,722
5,991 5,854
574
1,124
576 6521,134 1,228
721
0
1,000
2,000
3,000
4,000
5,000
6,000
7,000
8,000
9,000
10,000
2003 2004 2005 2006 2007 2008 2009
Year
Pers
on C
ount Any Disability
Sensory/Visual&Hearing DisabilityPhysical/Ambulatory DisabilityMental/Cognitive DisabilitySelf-Care Disability
Source: American Community Survey, U.S. Census Bureau.
"Youth" = Ages 5-15ACS Disability Definitions 1
"Youth" = Ages 5-17ACS Disability Definitions 2
Chart D illustrates the upstream pipeline of youth in school. The trend suggests a stabilization of or even a very modest decline in the numbers of youth with disabilities coming through the school system. We probably need two or three more years of data to determine if this is the case. The overwhelming majority are identified as being youth with mental or cognitive disabilities.

DVR & SRC Needs Assessment 41
Chart E Pipeline Overview: Age and Disability in Vermont, 2009
363 6,877 11,60534,628
10,839 19,57932,070
87,172
125,918
231,295
36,069 18,961
0
50,000
100,000
150,000
200,000
250,000
300,000
Under 5 5 to 17 18 to 34 35 to 64 65 to 74 75 plus
Age
Peop
le NondisabledDisabled
1.12% 7.31% 8.44% 13.02% 23.11% 50.80%
Disability Rate By Age In VT:
Note:Reliable PopulationProjectionsFor Future YearsNot AvailableUntil Census2010 DataPublished
Source: American Community Survey, U.S. Census Bureau.
Chart E illustrates how the rate of disability increases with age. It is well documented that Vermont has an aging population. The aging population will likely result in an increase in the number of people with disabilities who are eligible for VR services. VI. The Not-So-Secret-Shopper Project In the spring of 2010 SRC members visited all twelve DVR district offices. They went through the initial intake and orientation process in each office. This included participation in an initial interview. The visits were pre-announced so staff were expecting the SRC members. The following are the unedited reports from the SRC: Discussion of Not-So-Secret-Shopper Visits: Martha spoke of her visit to the Burlington Regional Office. Those being oriented were met promptly and asked to go into another room that was more comfortable for everyone. Martha found it to be a very positive experience. Mark Ciociola led the orientation and took great time to explain VR services and how one qualifies
DVR & SRC Needs Assessment 42
for them. He repeatedly emphasized people’s abilities as opposed to their disabilities. He took a lot of time to check for understanding and for questions. Martha thought that there was a lot of paperwork and that that would be very difficult for someone with a print disability; however, Mark told people repeatedly and considerately that they could take the paperwork with them and bring it back. Martha felt like she walked away with a better understanding of what VR services are. People were left to fill out their paperwork, and Martha started her initial interview, which was with Kathy Beebe, who basically walked her through the process. Martha was struck by the passion and empathy she brought to her work; she seemed to have a good understanding of the different kinds of consumers and their needs. If someone does not show up for an appointment, there is follow-up. Martha thought that this was a very understanding approach. She thought there was a lot of information presented in print and this could be a real problem for someone with a print disability who did not feel like disclosing it. Martha enjoyed the experience and was glad to do it. Sam said that he was lucky enough to attend the orientation and do the initial interview on the same day. He was pleasantly surprised to find the group orientation, led by Ben Coplan, to be quite comprehensive, relevant, cogent, consumer-friendly, and exceptional. Ben seemed very responsive to, and understanding of, consumer needs. Other offices (for example, Bennington) might want to consider or reconsider holding their orientations as group orientations. Regarding what was most helpful, Ben gave clear expectations and his presentation was realistic, not “pie-in-the-sky.” He was very open and up-front about what people could expect and about what is available and not available. Sam liked his stress on consumer responsibility and involvement and the consumer’s taking the lead. Regarding what could be improved, Sam suggested that perhaps within the orientation there should be a mention of benefits counseling and of VCIL and, if relevant, the Department of Labor. Nancy Dwyer did his initial interview. Sam had mailed the application ahead of time. Nancy’s cogency and clarity was exceptional. What was most helpful was the assumption of approval and the need to start the process before the determination of eligibility. Sam did not see anything that could be improved. He thought the counselor was experienced and knowledgeable. Regarding the overall experience, he did not feel he was treated differently because he was from the SRC. He was made to feel comfortable, the experience felt sincere and genuine, and he felt confident of the counselor’s ability. Sam thought the process was quite comprehensive, and he liked the counselor’s emphasis on follow-through on both sides – with both counselor and consumer making every effort. Karen said she went to the Middlebury office and met with Donna (counselor) and Lisa (orientation, with one other customer). Lisa was very professional and made sure they had an opportunity to ask questions. They watched a short overview video about VR. Karen was especially impressed that Lisa brought open times with her so that she could schedule an appointment immediately. She had

DVR & SRC Needs Assessment 43
information at her fingertips and was extremely knowledgeable about resources available in the area. Whitney reported he had not been able to get to an office. He made an appointment but was not able to get there. He got in touch with Jim who helped arrange transportation. Whitney wanted to call attention to the website unitedweride.gov; there are great things available there. “This is the direction we need to go to make necessary changes so that people have access for social and professional as well as medical appointments.” John said that he took “a slightly different approach” at the Newport office; playing the role of an SRC member from some years ago, he presented at the district office as “somewhat angry” and as “unpleasant and forceful.” A counselor came out and took him to her office, where he resisted filling out the paperwork (which took almost an hour); the counselor was very professional and did not get rattled. He then met with the Regional Manager (Hib Doe), who stayed after quitting time. John thinks customers arrive some times after multiple disappointments. Paperwork is a problem – you have to make it somewhat fun. For some people, you have to explain it step by step. The office was pleasant and accessible. John was given a Pathways portfolio. The counselor left him (in role) in a positive frame of mind. Diane mentioned that de-escalation training is being given to all staff. Jen said she visited the Morrisville office. Carol Leech, Regional Manager, had familiarized her via phone with the Morrisville office. She then got a phone call from Joe Carlomagno who set up an appointment for the following week. There was not a group orientation. Jen felt that it would be good if there could do a group orientation that segues into an individual appointment, since doing otherwise will pose transportation problems for many people. She found it hard to sit in an office for an hour answering questions. Joe handled her posed TBI very well; he gave her his business card and told her to e-mail him if she had any questions. Jen thinks getting the questionnaire ahead of time could have been helpful, since it would have been challenging for many people. It was a good experience and gave her empathy for counselors. It was a good idea to do this. Don, who visited the Rutland office, thought that he went in with much more of a critical eye. He called David Sagi, Regional Manager, to talk about an appointment. The receptionist was very nice and professional, and had to put him on hold a couple of times because of other calls. She told him they did group orientation but if he didn’t feel he could handle a group process, she could schedule an individual orientation. He received the paperwork ahead of time. The group orientation could have been clearer about expectations. A couple of things “turned him off such as being told, “This is not a crisis agency; things are going to take time.” This was okay, but he was taken back a bit. She said he would have to treat it like a job interview and have to be on time. Don was a little concerned about this, but overall the presenter did a good job. A 5-minute video was shown. Don felt he got conflicting information: In the initial interview he was told he had to

DVR & SRC Needs Assessment 44
have a doctor’s letter, even if he was on SSDI. In the orientation he had been told that they could check on his SSDI and he would not need a doctor’s letter. The counselor was very professional, but said that only the first order of selection for services was open. He had to correct her on this. They had not planned for a debriefing, so that did not happen. Discussion followed. Sam suggested that, on first contact, the customer could be told that the application is available in alternative formats if the customer needs or requests it. Don said that in his orientation, it was said that it would be “4-5 weeks before someone contacts you”. This could be discouraging to some people. Diane observed that it sounded like paperwork is the biggest problem. “We did away with a lot of that paperwork years ago, but it sounds like we have had bureaucratic creep. Maybe it is time to relook at that.” Will suggested that the issue might be the new VR forms; “I think we could be more flexible about that.” Don and John suggested that the issue might ease after counselors get more accustomed to the forms. Martha thought that perhaps some of the forms could be held back until a relationship is established. James noted that some of the forms are “local” forms. Nancy Dwyer said that the forms do seem cumbersome. The statement of rights seems overwhelming “even to me”. She feels uncomfortable about presenting so much information, especially to people who are illiterate. “It is a lot of print to get through.” Whitney suggested that in situations of boredom and high anxiety it is important to have adequate supports. Diane thanked everybody for their visits and their valuable feedback.
SUMMARY OF MAJOR FINDINGS The SRC Performance Review Sub-Committee and the DVR Implementation Team (I Team) consisting of a mix of DVR field staff, managers and central office staff, reviewed all the findings from the Needs Assessment. It is important to note both groups agreed the Needs Assessment demonstrated that the Vermont DVR program is a remarkably effective program with exceptional outcomes. That Vermont DVR increased employment outcomes in 2010 during the worst recession since the 1930’s is one indicator of that fact. However, it is also important that any program look at and attempt to address areas of need in the practice of continuous improvement. The two groups went through a process of assessing and prioritizing the needs for the purpose of strategic planning. We felt it important that we prioritize findings to help guide DVR management and the strategic planning process. The two teams identified the following areas as the major findings of the needs assessment:

DVR & SRC Needs Assessment 45
The numbering of the following items do not reflect any particular ranking. 1) The Need to Improve Employment Outcomes for Individuals with Mental Illness The assessment revealed that individuals with mental illness have a lower rate of employment than other disability groups. Two major factors were identified as contributing to this finding:
• The significant decline in employment outcomes and rate in the community mental health, Community Rehabilitation and Treatment (CRT) supported employment programs. The employment rate in this system has dropped from 26% in 2006 to 16% in 2010.
• The lack of ongoing case management supports for adults with mental illness who do not qualify for adult mental health services. Many individuals with mental illness are unable to retain employment because of lack of case management support in the community. DVR counselors identify between 200 and 400 applicants with mental illness per year that fall into this category.
2) The Need to Evaluate “Unsuccessful” (status 28) Closures Both the SRC and the DVR I Team felt that DVR should conduct an evaluation of status 28 closures. Both groups had lots of questions about the implications of 40% of the post-plan closures being 28 closures. Among the questions were:
• What percentage of the 28 closures is the result of factors unrelated to the effectiveness of the DVR program? For example, the individual becomes employed and feels no need to stay in contact with their DVR counselor.
• For those individuals who do not become employed, are there specific barriers or needs that DVR should attempt to address?
• How much does DVR spend on individuals closed in a status 28 compared to status 26?
3) The Need to Engage Veterans with Disabilities, Especially Those Not Eligible
for the VA VR Program Data from the needs assessment suggests veterans are less likely to access the DVR program than eligible non-veterans. This is consistent with anecdotal reports from field staff that eligible veterans are reluctant to access the DVR program. Our data suggests DVR should continue and intensify its efforts to engage veterans including outreach to veterans’ organizations, partnering with the VA VR programming, and partnering with the Department of Labor veterans staff.

DVR & SRC Needs Assessment 46
4) The Need to Expand Employer Outreach and Marketing Efforts The employer satisfaction survey indicated that a substantial portion of employers were unfamiliar with DVR or VABIR, our primary community rehabilitation partner. Even for employers where DVR does have a relationship it appeared that program engagement was often inconsistent. Based on the survey it appears that DVR and VABIR need to:
• Have more consistent, routine contact with employers with whom we have a relationship.
• Conduct more outreach to employers who are not current clients of VABIR and DVR.
It is important to note that this data was collected before DVR implemented a major initiative, Creative Workforce Solutions (CWS), to improve and expand employer outreach. CWS includes the creation of:
• 11 Business Account Managers focused on employer outreach.
• The formation of inter-agency employer outreach teams at the local level to coordinate job development efforts across programs.
• The implementation of Salesforce, an account management software system designed to track employer outreach.
It will be interesting to see the impact of these efforts on future survey results. Regardless, we expect employer outreach to be a major focus of DVR efforts for the next three years. 5) The Need to Improve Outcomes for DVR Consumers with Alcohol/Substance
Abuse Dependence/Abuse Disorders Data from the VR 911 clearly illustrated that VR consumers with alcohol or substance abuse/dependence disorders are increasingly less likely to get to plan status and when they do, they are increasingly less likely to achieve their employment goal. Field experience mirrors the data findings for this population. VR counseling staff consistently report that alcohol and substance abuse/ dependence disorders present the most significant barriers to employment. This clearly needs to be an area of focus for DVR in the coming three years.
DVR & SRC Needs Assessment 47
6) The Need to Assess the Impact of DVR Support of Post-Secondary Education Services
DVR data revealed that individuals served by the program who have post-secondary degrees are more likely to achieve an employment outcome and earn more money than individuals with high school diplomas or less. However, what is less clear is the impact of DVR investment in post-secondary education. A high proportion of case service funds are invested in this service but DVR has never conducted a formal evaluation of the impact this practice. 7) The Need to Communicate Clearly to VR Applicants Regarding their
Expectations of DVR Services and Continue to Work on Improving Communication Between DVR and DVR Consumers
Feedback from the 2008 DVR consumer satisfaction survey was overwhelmingly positive. For consumers who did have complaints about the DVR program, two themes emerged from the 2008 and prior surveys. These themes appeared to relate to the consumer’s expectations about what the DVR program can and cannot provide and to ongoing communication between the DVR counselor and the consumer. DVR has made a number of efforts to help give consumers a clear picture of what DVR can provide and what are the limitations of the program. This has included efforts to provide improved and more consistent orientation to the program. For example, in response to the 2008 survey DVR established expectations for staff around communication between staff and consumers and minimum expectations for the time it takes to return phone calls. DVR is presently conducting the 2011 consumer survey. It will be interesting to see if there has been any movement in the above areas. It is important to note that in 2009 DVR lost 15% of its staff. This may have an impact on consumer satisfaction, especially on responsiveness of staff given the loss of capacity. 8) The Need to Establish Case Management Supports for DVR Consumers who
are Not Eligible for Community Mental Health or Developmental Services Based on the reporting from VR counselors, about 700 individuals per year are found eligible for the VR program who need some kind of ongoing case management support. The DVR 2007 Needs Assessment identified this as a major area of need. Despite substantial efforts since the 2007 Needs Assessment DVR has not been able to put in place case management supports for non-CRT or non-DDAS consumers. In 2008 a pilot project to put these services in place in six sites was shelved because of the fiscal crisis. As a result, this gap in the service system remains an ongoing challenge for the VR program.

DVR & SRC Needs Assessment 48
Populations identified as needing these supports are:
• Adults with mental illness not eligible for community mental health services • Adults with developmental disabilities not eligible for developmental services • Adults on the autism spectrum who are not eligible for developmental
services • Adults with Traumatic Brain Injury (TBI) • Adults with physical disabilities
9) The Need to Increase Consumer Earnings Even though the DVR data on the RSA Performance Indicator 1.5 was well above the federal standard, the I Team felt DVR should always endeavor to increase consumer earnings. The average hourly earnings at closure in 2009 was $11.24 per hour, which compares to the Vermont “Livable Wage” of $16.75 for a single person. The I Team was interested in looking at the impact of funding short-term training leading to certification in specific fields (e.g. LNA, CDL). DVR used ARRA funds to support a significant expansion in these training options. This presents an ideal opportunity to assess whether investment in these types of training will result in higher wage employment. 10) The Need for Outreach to Eligible Non-English Speaking Individuals While the numbers are relatively small, the census data clearly indicated DVR is under-serving this population. DVR should explore strategies to engage eligible non-English speakers and community organizations representing this population. 11) The Need to Streamline and Automate Case Work and Financial Processes
for DVR Staff and Consumers The results of the staff satisfaction survey suggest staff are struggling to manage the paperwork and administrative processes associated with providing services. In addition, SRC members, as a result of their “not-so-secret shopper” visits reported that they felt DVR paperwork requirements were burdensome for consumers. Given that the Division is operating with reduced staff and increasing numbers, it is important that DVR examine strategies to streamline and eliminate redundant processes.