Embed Size (px)
Citation preview
nedBanK group limited integrated report 201030
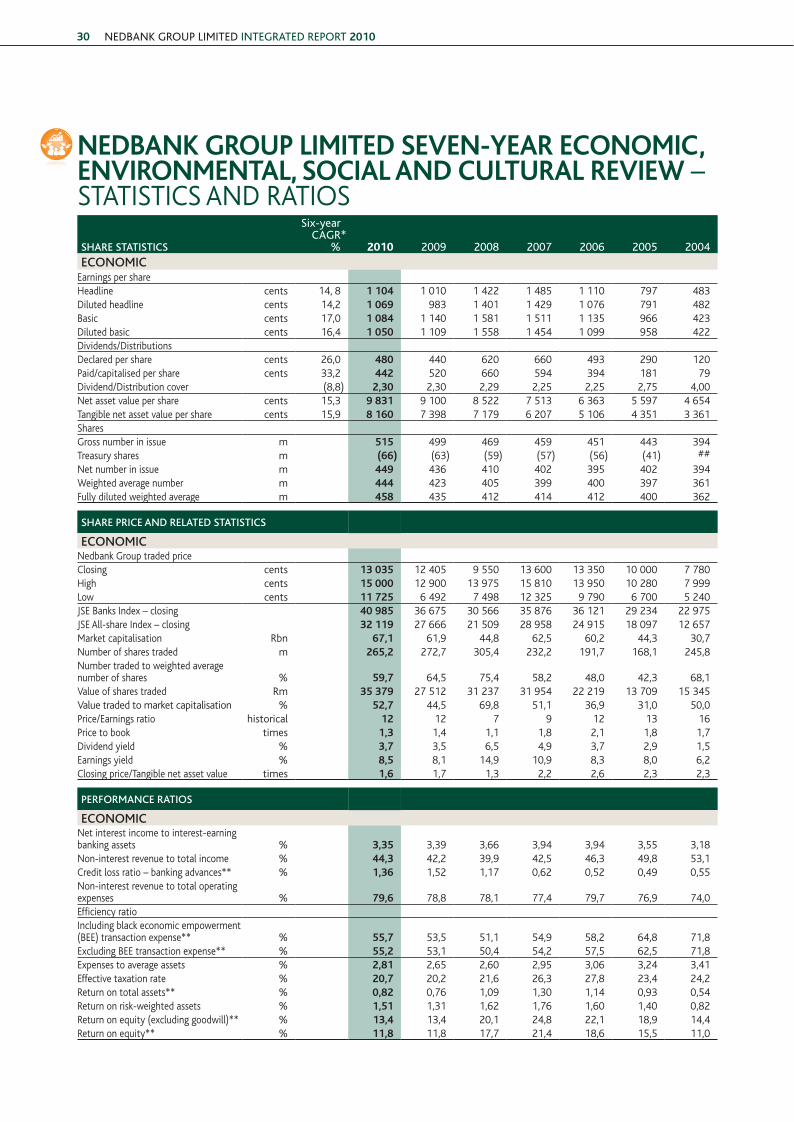
neDBanK Group LimiteD seven-Year economic, environmentaL, sociaL anD cuLturaL review – statistics and ratios
Share StatiSticS
six-yearCagr*
% 2010 2009 2008 2007 2006 2005 2004economic
earnings per shareheadline cents 14, 8 1 104 1 010 1 422 1 485 1 110 797 483 diluted headline cents 14,2 1 069 983 1 401 1 429 1 076 791 482 Basic cents 17,0 1 084 1 140 1 581 1 511 1 135 966 423 diluted basic cents 16,4 1 050 1 109 1 558 1 454 1 099 958 422 dividends/distributionsdeclared per share cents 26,0 480 440 620 660 493 290 120 paid/capitalised per share cents 33,2 442 520 660 594 394 181 79 dividend/distribution cover (8,8) 2,30 2,30 2,29 2,25 2,25 2,75 4,00 net asset value per share cents 15,3 9 831 9 100 8 522 7 513 6 363 5 597 4 654 tangible net asset value per share cents 15,9 8 160 7 398 7 179 6 207 5 106 4 351 3 361 sharesgross number in issue m 515 499 469 459 451 443 394 treasury shares m (66) (63) (59) (57) (56) (41) ## net number in issue m 449 436 410 402 395 402 394 Weighted average number m 444 423 405 399 400 397 361 fully diluted weighted average m 458 435 412 414 412 400 362
Share price and related StatiSticS
economicnedbank group traded priceclosing cents 13 035 12 405 9 550 13 600 13 350 10 000 7 780 high cents 15 000 12 900 13 975 15 810 13 950 10 280 7 999 low cents 11 725 6 492 7 498 12 325 9 790 6 700 5 240 jse Banks index – closing 40 985 36 675 30 566 35 876 36 121 29 234 22 975 jse all-share index – closing 32 119 27 666 21 509 28 958 24 915 18 097 12 657 market capitalisation rbn 67,1 61,9 44,8 62,5 60,2 44,3 30,7 number of shares traded m 265,2 272,7 305,4 232,2 191,7 168,1 245,8 number traded to weighted average number of shares % 59,7 64,5 75,4 58,2 48,0 42,3 68,1 value of shares traded rm 35 379 27 512 31 237 31 954 22 219 13 709 15 345 value traded to market capitalisation % 52,7 44,5 69,8 51,1 36,9 31,0 50,0 price/earnings ratio historical 12 12 7 9 12 13 16 price to book times 1,3 1,4 1,1 1,8 2,1 1,8 1,7 dividend yield % 3,7 3,5 6,5 4,9 3,7 2,9 1,5 earnings yield % 8,5 8,1 14,9 10,9 8,3 8,0 6,2 closing price/tangible net asset value times 1,6 1,7 1,3 2,2 2,6 2,3 2,3
performance ratioS
economicnet interest income to interest-earning banking assets % 3,35 3,39 3,66 3,94 3,94 3,55 3,18 non-interest revenue to total income % 44,3 42,2 39,9 42,5 46,3 49,8 53,1 credit loss ratio – banking advances** % 1,36 1,52 1,17 0,62 0,52 0,49 0,55 non-interest revenue to total operating expenses % 79,6 78,8 78,1 77,4 79,7 76,9 74,0 efficiency ratioincluding black economic empowerment (Bee) transaction expense** % 55,7 53,5 51,1 54,9 58,2 64,8 71,8 excluding Bee transaction expense** % 55,2 53,1 50,4 54,2 57,5 62,5 71,8 expenses to average assets % 2,81 2,65 2,60 2,95 3,06 3,24 3,41 effective taxation rate % 20,7 20,2 21,6 26,3 27,8 23,4 24,2 return on total assets** % 0,82 0,76 1,09 1,30 1,14 0,93 0,54 return on risk-weighted assets % 1,51 1,31 1,62 1,76 1,60 1,40 0,82 return on equity (excluding goodwill)** % 13,4 13,4 20,1 24,8 22,1 18,9 14,4return on equity** % 11,8 11,8 17,7 21,4 18,6 15,5 11,0
1 Ned Overview FA.indd 30 22/03/2011 11:50 AM
31
oVerView group reports
operational overvieW
sustainaBle development performance
risk, governance and compliance
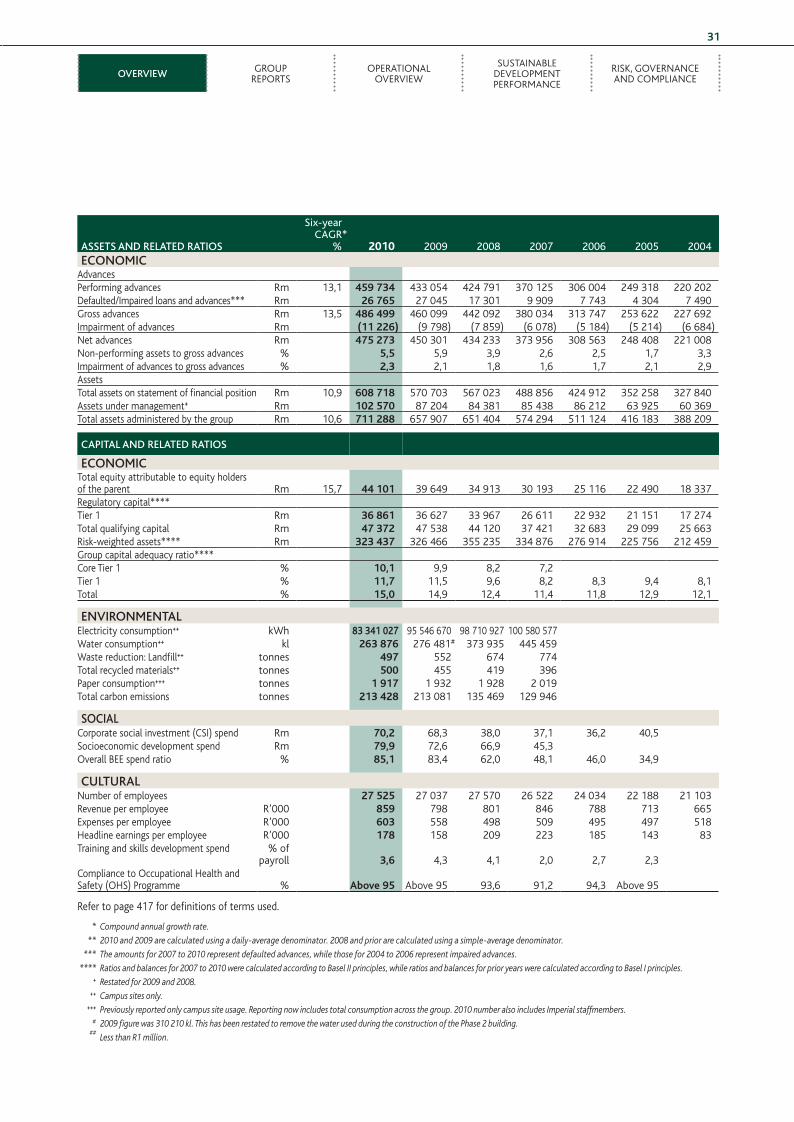
aSSetS and related ratioS
six-yearCagr*
% 2010 2009 2008 2007 2006 2005 2004economic
advancesperforming advances rm 13,1 459 734 433 054 424 791 370 125 306 004 249 318 220 202 defaulted/impaired loans and advances*** rm 26 765 27 045 17 301 9 909 7 743 4 304 7 490 gross advances rm 13,5 486 499 460 099 442 092 380 034 313 747 253 622 227 692 impairment of advances rm (11 226) (9 798) (7 859) (6 078) (5 184) (5 214) (6 684)net advances rm 475 273 450 301 434 233 373 956 308 563 248 408 221 008 non-performing assets to gross advances % 5,5 5,9 3,9 2,6 2,5 1,7 3,3impairment of advances to gross advances % 2,3 2,1 1,8 1,6 1,7 2,1 2,9assetstotal assets on statement of financial position rm 10,9 608 718 570 703 567 023 488 856 424 912 352 258 327 840 assets under management+ rm 102 570 87 204 84 381 85 438 86 212 63 925 60 369 total assets administered by the group rm 10,6 711 288 657 907 651 404 574 294 511 124 416 183 388 209
capital and related ratioS
economictotal equity attributable to equity holders of the parent rm 15,7 44 101 39 649 34 913 30 193 25 116 22 490 18 337 regulatory capital****tier 1 rm 36 861 36 627 33 967 26 611 22 932 21 151 17 274 total qualifying capital rm 47 372 47 538 44 120 37 421 32 683 29 099 25 663 risk-weighted assets**** rm 323 437 326 466 355 235 334 876 276 914 225 756 212 459 group capital adequacy ratio****core tier 1 % 10,1 9,9 8,2 7,2 tier 1 % 11,7 11,5 9,6 8,2 8,3 9,4 8,1 total % 15,0 14,9 12,4 11,4 11,8 12,9 12,1
enVironmentalelectricity consumption++ kWh 83 341 027 95 546 670 98 710 927 100 580 577Water consumption++ kl 263 876 276 481# 373 935 445 459Waste reduction: landfill++ tonnes 497 552 674 774total recycled materials++ tonnes 500 455 419 396paper consumption+++ tonnes 1 917 1 932 1 928 2 019total carbon emissions tonnes 213 428 213 081 135 469 129 946
Socialcorporate social investment (csi) spend rm 70,2 68,3 38,0 37,1 36,2 40,5socioeconomic development spend rm 79,9 72,6 66,9 45,3overall Bee spend ratio % 85,1 83,4 62,0 48,1 46,0 34,9
culturalnumber of employees 27 525 27 037 27 570 26 522 24 034 22 188 21 103 revenue per employee r’000 859 798 801 846 788 713 665 expenses per employee r’000 603 558 498 509 495 497 518 headline earnings per employee r’000 178 158 209 223 185 143 83 training and skills development spend % of
payroll 3,6 4,3 4,1 2,0 2,7 2,3compliance to occupational health and safety (ohs) programme % above 95 above 95 93,6 91,2 94,3 above 95
refer to page 417 for definitions of terms used.
* Compoundannualgrowthrate.
** 2010and2009arecalculatedusingadaily-averagedenominator.2008andpriorarecalculatedusingasimple-averagedenominator.
***Theamountsfor2007to2010representdefaultedadvances,whilethosefor2004to2006representimpairedadvances.
****Ratiosandbalancesfor2007to2010werecalculatedaccordingtoBaselIIprinciples,whileratiosandbalancesforprioryearswerecalculatedaccordingtoBaselIprinciples.
+ Restatedfor2009and2008.
++ Campussitesonly.
+++ Previouslyreportedonlycampussiteusage.Reportingnowincludestotalconsumptionacrossthegroup.2010numberalsoincludesImperialstaffmembers.
# 2009figurewas310210kl.ThishasbeenrestatedtoremovethewaterusedduringtheconstructionofthePhase2building.
##
LessthanR1million.
1 Ned Overview FA.indd 31 22/03/2011 11:50 AM
nedBanK group limited integrated report 201032
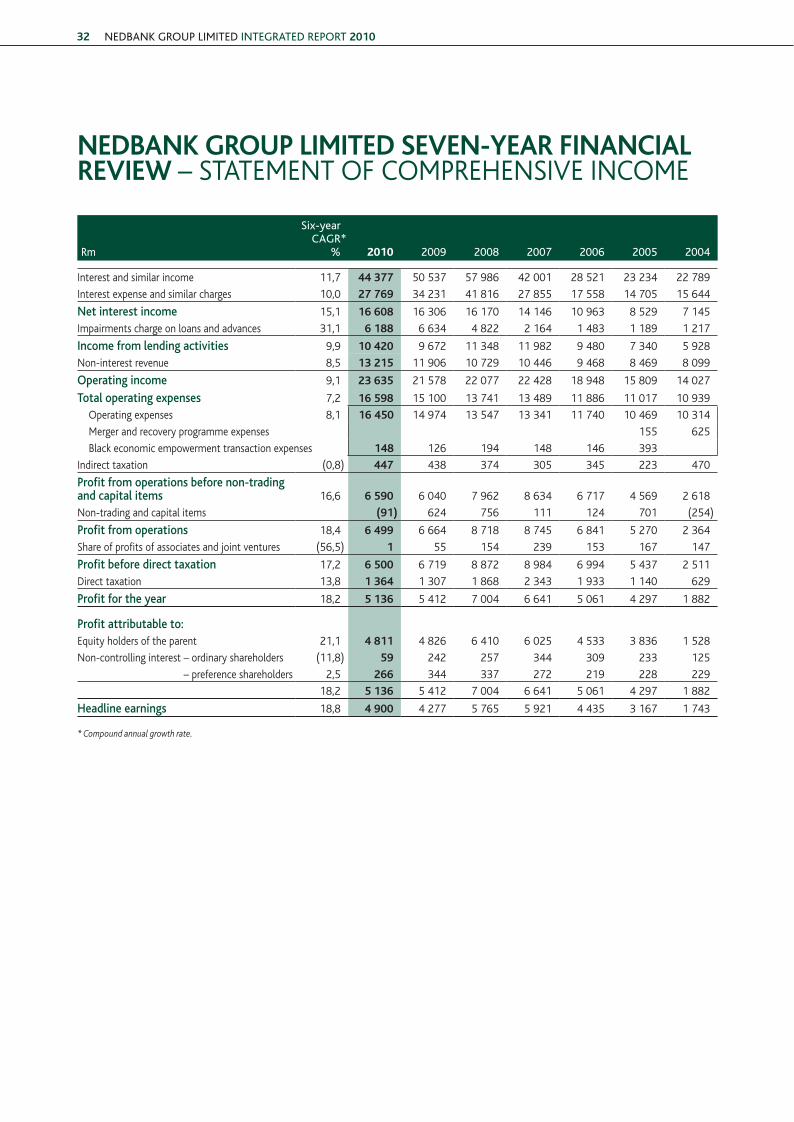
neDBanK Group LimiteD seven-Year financiaL review – statement of comprehensive income
rm
six-year Cagr*
% 2010 2009 2008 2007 2006 2005 2004
interest and similar income 11,7 44 377 50 537 57 986 42 001 28 521 23 234 22 789
interest expense and similar charges 10,0 27 769 34 231 41 816 27 855 17 558 14 705 15 644
net interest income 15,1 16 608 16 306 16 170 14 146 10 963 8 529 7 145
impairments charge on loans and advances 31,1 6 188 6 634 4 822 2 164 1 483 1 189 1 217
income from lending activities 9,9 10 420 9 672 11 348 11 982 9 480 7 340 5 928
non-interest revenue 8,5 13 215 11 906 10 729 10 446 9 468 8 469 8 099
operating income 9,1 23 635 21 578 22 077 22 428 18 948 15 809 14 027
total operating expenses 7,2 16 598 15 100 13 741 13 489 11 886 11 017 10 939
operating expenses 8,1 16 450 14 974 13 547 13 341 11 740 10 469 10 314
merger and recovery programme expenses 155 625
Black economic empowerment transaction expenses 148 126 194 148 146 393
indirect taxation (0,8) 447 438 374 305 345 223 470
profit from operations before non-trading and capital items 16,6 6 590 6 040 7 962 8 634 6 717 4 569 2 618
non-trading and capital items (91) 624 756 111 124 701 (254)
profit from operations 18,4 6 499 6 664 8 718 8 745 6 841 5 270 2 364
share of profits of associates and joint ventures (56,5) 1 55 154 239 153 167 147
profit before direct taxation 17,2 6 500 6 719 8 872 8 984 6 994 5 437 2 511
direct taxation 13,8 1 364 1 307 1 868 2 343 1 933 1 140 629
profit for the year 18,2 5 136 5 412 7 004 6 641 5 061 4 297 1 882
profit attributable to:equity holders of the parent 21,1 4 811 4 826 6 410 6 025 4 533 3 836 1 528
non-controlling interest – ordinary shareholders (11,8) 59 242 257 344 309 233 125
– preference shareholders 2,5 266 344 337 272 219 228 229
18,2 5 136 5 412 7 004 6 641 5 061 4 297 1 882
headline earnings 18,8 4 900 4 277 5 765 5 921 4 435 3 167 1 743
*Compoundannualgrowthrate.
1 Ned Overview FA.indd 32 22/03/2011 11:50 AM
33
oVerView group reports
operational overvieW
sustainaBle development performance
risk, governance and compliance
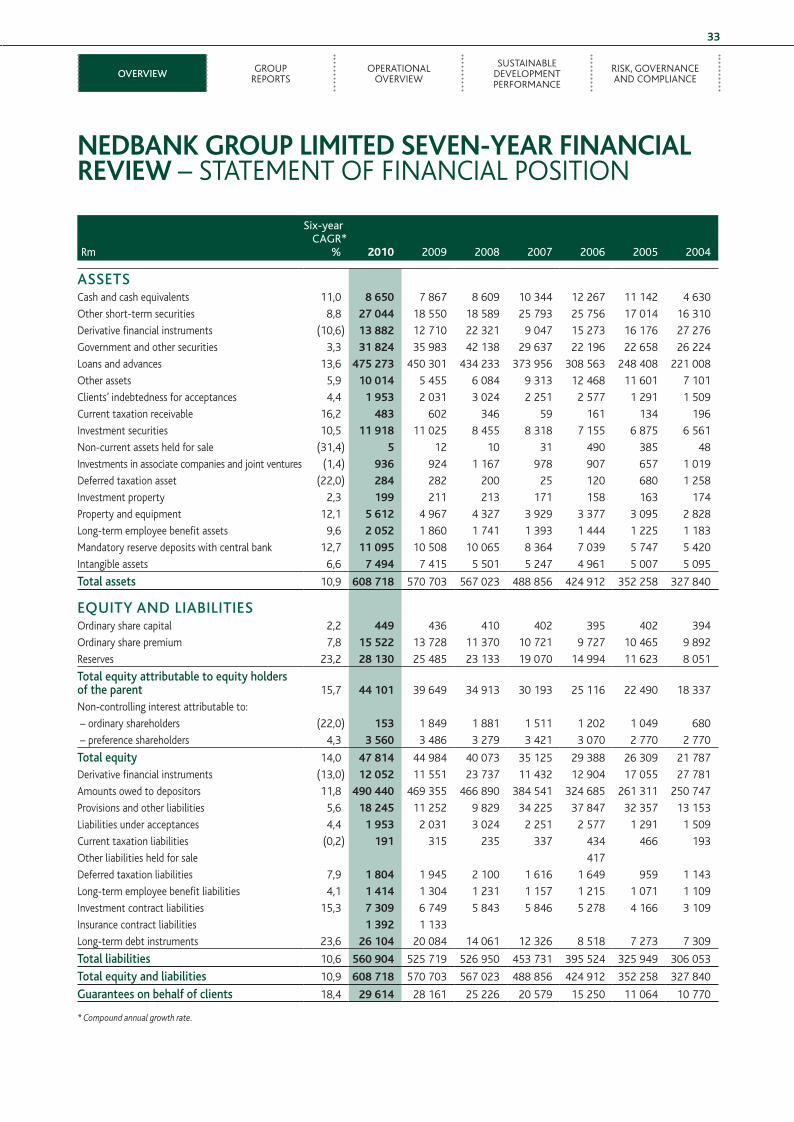
neDBanK Group LimiteD seven-Year financiaL review – statement of financial position
rm
six-year Cagr*
% 2010 2009 2008 2007 2006 2005 2004
aSSetScash and cash equivalents 11,0 8 650 7 867 8 609 10 344 12 267 11 142 4 630
other short-term securities 8,8 27 044 18 550 18 589 25 793 25 756 17 014 16 310
derivative financial instruments (10,6) 13 882 12 710 22 321 9 047 15 273 16 176 27 276
government and other securities 3,3 31 824 35 983 42 138 29 637 22 196 22 658 26 224
loans and advances 13,6 475 273 450 301 434 233 373 956 308 563 248 408 221 008
other assets 5,9 10 014 5 455 6 084 9 313 12 468 11 601 7 101
clients’ indebtedness for acceptances 4,4 1 953 2 031 3 024 2 251 2 577 1 291 1 509
current taxation receivable 16,2 483 602 346 59 161 134 196
investment securities 10,5 11 918 11 025 8 455 8 318 7 155 6 875 6 561
non-current assets held for sale (31,4) 5 12 10 31 490 385 48
investments in associate companies and joint ventures (1,4) 936 924 1 167 978 907 657 1 019
deferred taxation asset (22,0) 284 282 200 25 120 680 1 258
investment property 2,3 199 211 213 171 158 163 174
property and equipment 12,1 5 612 4 967 4 327 3 929 3 377 3 095 2 828
long-term employee benefit assets 9,6 2 052 1 860 1 741 1 393 1 444 1 225 1 183
mandatory reserve deposits with central bank 12,7 11 095 10 508 10 065 8 364 7 039 5 747 5 420
intangible assets 6,6 7 494 7 415 5 501 5 247 4 961 5 007 5 095
total assets 10,9 608 718 570 703 567 023 488 856 424 912 352 258 327 840
equity and liabilitieSordinary share capital 2,2 449 436 410 402 395 402 394
ordinary share premium 7,8 15 522 13 728 11 370 10 721 9 727 10 465 9 892
reserves 23,2 28 130 25 485 23 133 19 070 14 994 11 623 8 051
total equity attributable to equity holders of the parent 15,7 44 101 39 649 34 913 30 193 25 116 22 490 18 337
non-controlling interest attributable to:
– ordinary shareholders (22,0) 153 1 849 1 881 1 511 1 202 1 049 680
– preference shareholders 4,3 3 560 3 486 3 279 3 421 3 070 2 770 2 770
total equity 14,0 47 814 44 984 40 073 35 125 29 388 26 309 21 787
derivative financial instruments (13,0) 12 052 11 551 23 737 11 432 12 904 17 055 27 781
amounts owed to depositors 11,8 490 440 469 355 466 890 384 541 324 685 261 311 250 747
provisions and other liabilities 5,6 18 245 11 252 9 829 34 225 37 847 32 357 13 153
liabilities under acceptances 4,4 1 953 2 031 3 024 2 251 2 577 1 291 1 509
current taxation liabilities (0,2) 191 315 235 337 434 466 193
other liabilities held for sale 417
deferred taxation liabilities 7,9 1 804 1 945 2 100 1 616 1 649 959 1 143
long-term employee benefit liabilities 4,1 1 414 1 304 1 231 1 157 1 215 1 071 1 109
investment contract liabilities 15,3 7 309 6 749 5 843 5 846 5 278 4 166 3 109
insurance contract liabilities 1 392 1 133
long-term debt instruments 23,6 26 104 20 084 14 061 12 326 8 518 7 273 7 309
total liabilities 10,6 560 904 525 719 526 950 453 731 395 524 325 949 306 053
total equity and liabilities 10,9 608 718 570 703 567 023 488 856 424 912 352 258 327 840
guarantees on behalf of clients 18,4 29 614 28 161 25 226 20 579 15 250 11 064 10 770
*Compoundannualgrowthrate.
1 Ned Overview FA.indd 33 22/03/2011 11:50 AM
nedBanK group limited integrated report 201036
goVernance and king iiione of the most dominant themes on the corporate agenda in the past year has
been the king report on corporate governance (king iii) that has introduced profound
changes to reporting through a heightened focus on organisational sustainability.
We welcomed the introduction last year of king iii, as we believe this will be
a catalyst to enhance governance and reporting standards of local companies
further. our governance standards are already highly rated internationally, as
evidenced by south africa being ranked first for auditing and reporting standards
out of 139 countries in the World economic forum global competitiveness report
2010 – 2011.
since the inception of king iii, nedbank group has endeavoured to apply the
principles of the code and reviewed governance practices against these principles.
the board is satisfied with the group’s compliance with king iii and that alternate
governance controls are in place and are appropriately explained in cases where the
principles have not been applied.
integrated SuStainability reportingsustainability is a function of the balance of economic, environmental and
social forces and should create value for staff, clients, investors, the communities
in which we operate and the environment. king iii introduces behaviours and
governance practices that require reporting across these areas. nedbank group has
a fourth dimension of cultural sustainability, as we believe employees have a critical
role to play in building a sustainable group and supporting our efforts in the other
three areas.
an example of how the imbalance of these forces can have disastrous consequences
was the collapse of many international companies during the global financial crisis of
the past few years, which can be ascribed to a lack of social sustainability. in certain
instances executives engaged in self-enrichment and high-risk practices, and lost
sight of their responsibility to their clients and the society in which they operate.
an integrated approach balances the interests of all stakeholder groups,
demonstrating that all are as important as shareholders, and company reporting and
disclosure now need to reflect this. it is therefore with pleasure that nedbank group
presents this first integrated report to its stakeholders.
nedBank group strives to Be a leader in sustainaBilitY, not onlY for the strategic positioning of the group But, most importantlY, Because it makes sound Business and moral sense.
cHairman’s report
marKet Capitalisation
net asset value per share
r67,1bn(2009: r61,9bn)
9 831 cents
only Sa bank (since 2004)
8,0%doW Jones World sustainaBility indeX
1 Ned Overview FA.indd 36 22/03/2011 11:50 AM
37
overvieWgroup
reportSoperational
overvieW
sustainaBle development performance
governance and compliance
leaderShip in SuStainabilityBy creating an equitable balance between the four pillars of
sustainability we can make a valuable contribution not only to the
economic wellbeing of our country, but also to the future of the
country, uplifting and empowering people and preserving our natural
resources. companies operate in an economic ecosystem and, unless
there is balance, they cannot generate returns on a sustainable, long-
term basis.
nedbank group has been widely acknowledged for its progress in
sustainability, from being the first sa bank to be included in the dow
jones World sustainability index and the first local bank to commit
itself to the equator principles to being recognised as a leading
performer in the south african carbon disclosure leadership index.
in july 2010 nedbank group became the first financial services
group in africa to achieve carbon neutrality, highlighting the group’s
commitment to playing a leading role in sustainability.
carbon neutrality provides a powerful platform for nedbank group
to support national government in its efforts to drive the sustainable
development of the country through the green economy. our
sustainability progress is addressed throughout the report, but group
details may be found in the chief executive’s report and in the
sustainability development performance section.
economic and banking enVironmentthe local economy had a strong start to the year primarily driven
by improved global demand for commodities and a rebound
in manufacturing production off the depressed levels of 2009.
economic activity was also boosted by strong infrastructural
spending ahead of the fifa 2010 World cup and by the event
itself, with consumer spending rising steadily for most of the year.
however, fixed investment by the private sector contracted for the
second year off the elevated levels seen in 2008.
growth in both the emerging and some parts of the developed
world surprised on the upside, supported by china’s economic
strength and continued demand for commodities and capital goods.
massive liquidity injections by major central banks and historically
low interest rates helped to stimulate economic growth further,
particularly in emerging economies. in contrast, the underlying
economic and financial environment remained fragile in the
developed world, with fiscal difficulties in parts of europe and
america, continued weakness in credit markets, limited employment
growth and inflationary concerns returning in emerging economies.
household finances improved in south africa as debt started to
decrease and interest rates eased to the lowest levels in 36 years.
the recovery in the credit cycle has proved to be more modest
compared with previous cycles. household demand for credit
was contained by the consumer debt burden remaining relatively
1 Ned Overview FA.indd 37 22/03/2011 11:50 AM
nedBanK group limited integrated report 201038
high, increased regulatory requirements, policy uncertainty and
employment growth only resuming late in the year. against this
background the ratio of household debt to disposable income
declined marginally to 78,2% from just over 80,0% at the end of
2009. at the same time debt service costs decreased to 7,5%, the
lowest level since june 2006, and are now at a level that is more
conducive to improving economic growth in the consumer sector.
in the corporate sector excess capacity and uncertainty over the
sustainability of the local and global recovery limited spending.
government fixed-investment spending, although continuing to
contract, emerged as the main foundation for growth.
real gross domestic product (gdp) in south africa grew by 2,8% in
2010, compared with a decline of 1,7% in 2009.
our political economysouth africa’s political economy is predicated on a few key pillars.
at a political level we adhere to the rule of law, while freedom of
speech and association are largely respected, and this makes our
political environment commendable.
our fiscal policies and practices are firmly entrenched and operate
at a worldclass level. the finance ministry has been resolute in
managing inflation and respecting the sound economic mechanisms
that are in place, rather than artificially intervening to manipulate
the relative strength and weakness of the rand. this approach augurs
well for the economy.
in mid-year south africa hosted the most successful football
World cup in history. the event showcased the country and its
people to the world and boosted our image as a destination for
direct investment and for the hospitality industry. more importantly,
it showed that serious issues such as crime, in particular violent
crime, can be contained and demonstrated that we have the
capacity to manage these issues.
the World cup taught our country numerous lessons and showed
just what can be achieved when we apply our collective minds.
as outlined to shareholders in last year’s annual report, our political
leadership faces the challenge of creating jobs and restoring the
country to a sustainable growth path. the government’s recent
focus on job creation is commendable and in a country where
almost a quarter of our potentially economically active population
is unemployed our priority must be to find employment for as
many people as we can. this conflicts with the views of organised
labour who are campaigning for the creation of ‘decent’ jobs.
in recent times there have been signs that some leaders are intent
on eroding the credibility of our political system. government
appointments have been made that could not be justified in a
mature democracy and restrictions have been placed on freedom
of expression and association, while a concerning trend is the
monetisation of politics in our country where access to and
influence of the governing party can be turned into instant wealth.
politics becomes powerful currency by allowing access to political
largesse, and this can only undermine the essence and soundness
of our political economy.
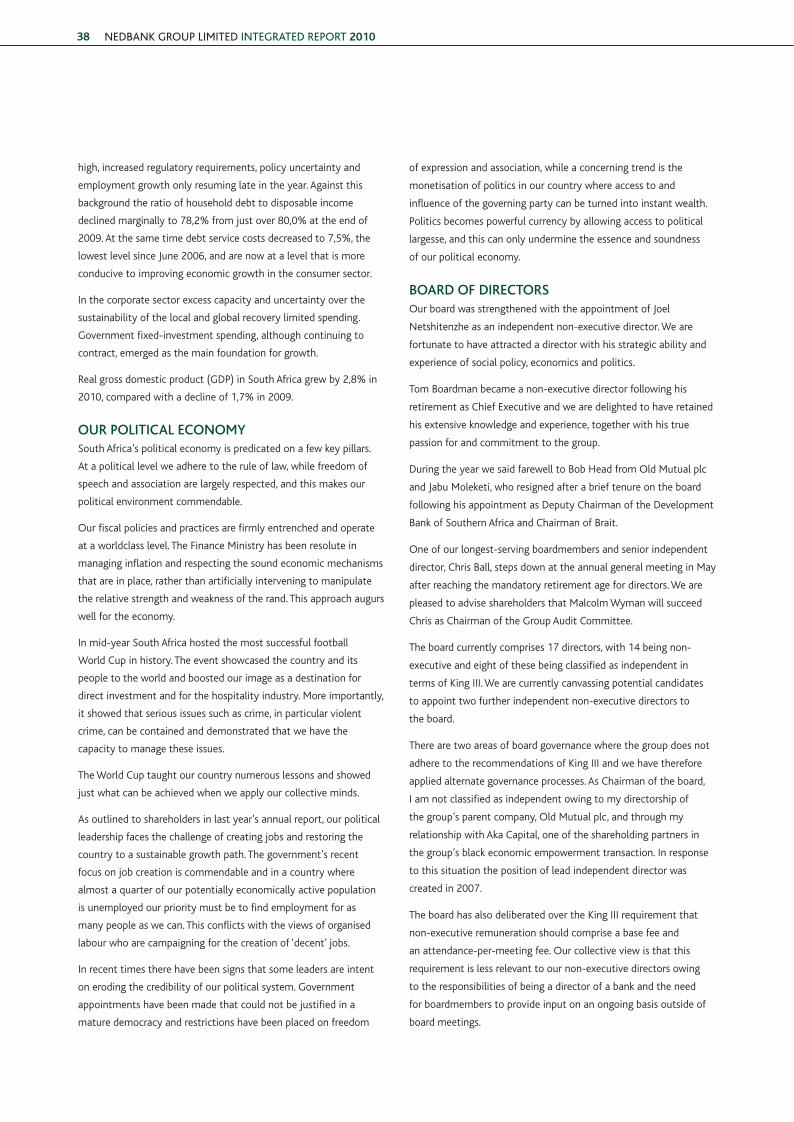
board of directorSour board was strengthened with the appointment of joel
netshitenzhe as an independent non-executive director. We are
fortunate to have attracted a director with his strategic ability and
experience of social policy, economics and politics.
tom Boardman became a non-executive director following his
retirement as chief executive and we are delighted to have retained
his extensive knowledge and experience, together with his true
passion for and commitment to the group.
during the year we said farewell to Bob head from old mutual plc
and jabu moleketi, who resigned after a brief tenure on the board
following his appointment as deputy chairman of the development
Bank of southern africa and chairman of Brait.
one of our longest-serving boardmembers and senior independent
director, chris Ball, steps down at the annual general meeting in may
after reaching the mandatory retirement age for directors. We are
pleased to advise shareholders that malcolm Wyman will succeed
chris as chairman of the group audit committee.
the board currently comprises 17 directors, with 14 being non-
executive and eight of these being classified as independent in
terms of king iii. We are currently canvassing potential candidates
to appoint two further independent non-executive directors to
the board.
there are two areas of board governance where the group does not
adhere to the recommendations of king iii and we have therefore
applied alternate governance processes. as chairman of the board,
i am not classified as independent owing to my directorship of
the group’s parent company, old mutual plc, and through my
relationship with aka capital, one of the shareholding partners in
the group’s black economic empowerment transaction. in response
to this situation the position of lead independent director was
created in 2007.
the board has also deliberated over the king iii requirement that
non-executive remuneration should comprise a base fee and
an attendance-per-meeting fee. our collective view is that this
requirement is less relevant to our non-executive directors owing
to the responsibilities of being a director of a bank and the need
for boardmembers to provide input on an ongoing basis outside of
board meetings.
1 Ned Overview FA.indd 38 22/03/2011 11:50 AM
39
overvieWgroup
reportSoperational
overvieW
sustainaBle development performance
governance and compliance
chairman’S report
Shareholdingthe group has established a credible strategy for growth with the
key thrusts being the repositioning of nedbank retail, growing
the group’s non-interest revenue, focusing on areas that yield
higher economic profit and a greater focus on the rest of africa.
We recognise that having a strong global bank as a controlling
shareholder could accelerate delivery of this strategy and therefore
welcomed hsBc holdings plc approaching old mutual plc to acquire
a controlling stake in the bank.
our bank is robust and adaptable, and following hsBc’s decision
to end the negotiations our people have acquitted themselves
admirably in continuing to focus on our strategy and vision of
building africa’s most admired bank. the group’s results, ending
the year slightly above our expectations at the time of the hsBc
approach, are further testament to this.
old mutual plc has indicated that it would reduce its stake in
nedbank group if it was in the best interests of all stakeholders.
macro-outlook the lower domestic interest rates and rising levels of income
should boost consumer spending. together with improving global
demand, this is expected to increase confidence levels and lead to
better consumer demand and capital formation in 2011 and further
momentum in 2012.
retail banking credit growth should fare better as household credit
demand improves, house prices edge higher and impairments
moderate. corporate markets are expected to show modest
improvement, while the small and medium enterprise market is
likely to remain under pressure until fixed-investment activity
improves.
government spending should continue to underpin growth, although
this is expected to be limited by the reduction in fiscal deficits over
the medium term. government’s stronger focus on job creation
is also positive and much will depend on the ability to create a
more enabling environment for business growth. key to this will be
improvements in the building of infrastructure and a more conducive
and certain regulatory and policy environment to reduce the
medium-term constraints on economic growth.
the group’s prospects across economic, environmental, social and
cultural sustainability are covered in the financial report and the
sustainable development perfomance section.
appreciationin closing, i thank my board colleagues for their insight and counsel
over the past year as well as their commitment to the affairs of
the group in an increasingly demanding governance, regulatory and
legislative environment.
thank you to mike Brown and his group executive committee for
their leadership of the group. mike is a most worthy successor to
tom Boardman and has demonstrated his leadership authority in the
face of serious challenges. he has the wisdom and understanding
of one many years older and has ensured that the members of the
executive team are aligned and focused on a common goal.
leadership can only succeed over the longer term by sharing the
values and aspirations of the followers, and this means being able
to distinguish between that which is expedient and populist, and
that which is serviceable and honest. it takes insight, empathy and
discipline to achieve resonance with followers – and these are the
personal and group qualities that we seek to promote.
on behalf of the board we thank the Banking regulator for the
constructive manner in which he engages with the bank, and for his
oversight of the complex banking sector.
my gratitude knows no bounds for our staffmembers who have
again demonstrated their commitment, and it is most pleasing
to see the benefits of their hard work reflecting in the group’s
improving performance.
Dr reuel Khoza
chairman
sandton
24 february 2011
1 Ned Overview FA.indd 39 22/03/2011 11:50 AM
nedBanK group limited integrated report 201040
BoarD of directors at 1 January 2011
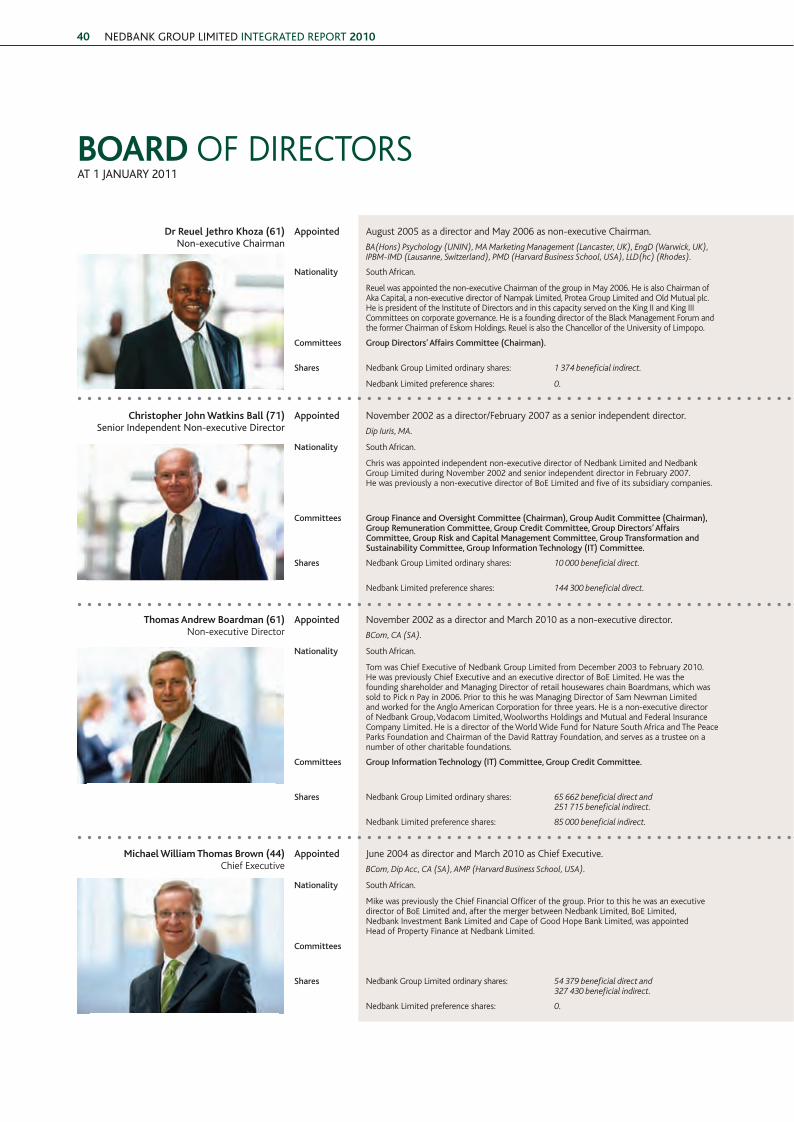
Dr reuel Jethro Khoza (61)non-executive Chairman
appointed august 2005 as a director and may 2006 as non-executive chairman. thenjiwe claudia pamela chikane (45)non-executive director
appointed november 2006.
BA(Hons)Psychology(UNIN),MAMarketingManagement(Lancaster,UK),EngD(Warwick,UK),IPBM-IMD(Lausanne,Switzerland),PMD(HarvardBusinessSchool,USA),LLD(hc)(Rhodes).
CharteredAccountant.
nationality south african. nationality south african.
reuel was appointed the non-executive chairman of the group in may 2006. he is also chairman of aka capital, a non-executive director of nampak limited, protea group limited and old mutual plc. he is president of the institute of directors and in this capacity served on the king ii and king iii committees on corporate governance. he is a founding director of the Black management forum and the former chairman of eskom holdings. reuel is also the chancellor of the university of limpopo.
thenjiwe was previously the chief executive of mgo consulting and the head of the gauteng department of finance and economic affairs. she is a boardmember of datacentrix limited and of the institute of directors and a member of the rice africa Board. she was previously a non-executive director of the development Bank of southern africa, telkom, petrosa and chairperson of the state information technology agency.
committees group directors’ affairs committee (chairman). committees group transformation and Sustainability committee (chairman), group audit committee, group information technology (it) committee, group directors’ affairs committee.
Shares nedbank group limited ordinary shares: 1374beneficialindirect. Shares nedbank group limited ordinary shares: 95319beneficialindirect.
nedbank limited preference shares: 0. nedbank limited preference shares: 0.
christopher John watkins Ball (71)senior independent non-executive director
appointed november 2002 as a director/february 2007 as a senior independent director. Graham wayne Dempster (55)Chief operating officer
appointed august 2009.
DipIuris,MA. BCom,CTA,CA(SA),AMP(HarvardBusinessSchool,USA).
nationality south african. nationality south african.
chris was appointed independent non-executive director of nedbank limited and nedbank group limited during november 2002 and senior independent director in february 2007. he was previously a non-executive director of Boe limited and five of its subsidiary companies.
graham joined the group in 1980 in the corporate finance division of ual merchant Bank limited. he was appointed general manager in 1987 and joint head of the international division. he assumed responsibility for the corporate Banking division in 1999 and was appointed managing director of nedbank corporate in 2003. graham was appointed as the chief operating officer of nedbank group limited in august 2009.
committees group finance and oversight committee (chairman), group audit committee (chairman), group remuneration committee, group credit committee, group directors’ affairs committee, group risk and capital management committee, group transformation and Sustainability committee, group information technology (it) committee.
committees
Shares nedbank group limited ordinary shares: 10000beneficialdirect. Shares nedbank group limited ordinary shares: 11881beneficialdirectand215229beneficialindirect.
nedbank limited preference shares: 144300beneficialdirect. nedbank limited preference shares: 0.
thomas andrew Boardman (61)non-executive director
appointed november 2002 as a director and march 2010 as a non-executive director. mustaq ahmed enus-Brey (56)non-executive director
appointed august 2005.
BCom,CA(SA). BCompt(Hons),CA(SA).
nationality south african. nationality south african.
tom was chief executive of nedbank group limited from december 2003 to february 2010. he was previously chief executive and an executive director of Boe limited. he was the founding shareholder and managing director of retail housewares chain Boardmans, which was sold to pick n pay in 2006. prior to this he was managing director of sam newman limited and worked for the anglo american corporation for three years. he is a non-executive director of nedbank group, vodacom limited, Woolworths holdings and mutual and federal insurance company limited. he is a director of the World Wide fund for nature south africa and the peace parks foundation and chairman of the david rattray foundation, and serves as a trustee on a number of other charitable foundations.
mustaq was appointed as director in august 2005. he is also a director of Brimstone investment corporation limited and oceana group limited.
committees group information technology (it) committee, group credit committee. committees group risk and capital management committee (chairman), group directors’ affairs committee, group credit committee, executive credit committee, group finance and oversight committee.
Shares nedbank group limited ordinary shares: 65662beneficialdirectand251715beneficialindirect.
Shares nedbank group limited ordinary shares: 2113beneficialindirect.
nedbank limited preference shares: 85000beneficialindirect. nedbank limited preference shares: 0.
michael william thomas Brown (44)chief executive
appointed june 2004 as director and march 2010 as chief executive. prof Brian De Lacy figaji (66)non-executive director
appointed november 2002.
BCom,DipAcc,CA(SA),AMP(HarvardBusinessSchool,USA). BSc(Eng),DipTertiaryEduMed,DEd(Coventry,UK),DLitt(hc)(California,USA).
nationality south african. nationality south african.
mike was previously the chief financial officer of the group. prior to this he was an executive director of Boe limited and, after the merger between nedbank limited, Boe limited, nedbank investment Bank limited and cape of good hope Bank limited, was appointed head of property finance at nedbank limited.
Brian is chairman of i&j limited and mariB holdings. he is the former principal and vice-chancellor of the peninsula technikon. he is also a director of cape lime (pty) limited and the development fund of the development Bank of southern africa. he became a nedbank group director in november 2002.
committees committees group remuneration committee (chairman), group credit committee, group directors’ affairs committee, group transformation and Sustainability committee, group audit committee.
Shares nedbank group limited ordinary shares: 54379beneficialdirectand327430beneficialindirect.
Shares nedbank group limited ordinary shares: 125933beneficialindirectand1530non-beneficialindirect.
nedbank limited preference shares: 0. nedbank limited preference shares: 0.
1 Ned Overview FA.indd 40 22/03/2011 11:50 AM

41
Dr reuel Jethro Khoza (61)non-executive Chairman
appointed august 2005 as a director and may 2006 as non-executive chairman. thenjiwe claudia pamela chikane (45)non-executive director
appointed november 2006.
BA(Hons)Psychology(UNIN),MAMarketingManagement(Lancaster,UK),EngD(Warwick,UK),IPBM-IMD(Lausanne,Switzerland),PMD(HarvardBusinessSchool,USA),LLD(hc)(Rhodes).
CharteredAccountant.
nationality south african. nationality south african.
reuel was appointed the non-executive chairman of the group in may 2006. he is also chairman of aka capital, a non-executive director of nampak limited, protea group limited and old mutual plc. he is president of the institute of directors and in this capacity served on the king ii and king iii committees on corporate governance. he is a founding director of the Black management forum and the former chairman of eskom holdings. reuel is also the chancellor of the university of limpopo.
thenjiwe was previously the chief executive of mgo consulting and the head of the gauteng department of finance and economic affairs. she is a boardmember of datacentrix limited and of the institute of directors and a member of the rice africa Board. she was previously a non-executive director of the development Bank of southern africa, telkom, petrosa and chairperson of the state information technology agency.
committees group directors’ affairs committee (chairman). committees group transformation and Sustainability committee (chairman), group audit committee, group information technology (it) committee, group directors’ affairs committee.
Shares nedbank group limited ordinary shares: 1374beneficialindirect. Shares nedbank group limited ordinary shares: 95319beneficialindirect.
nedbank limited preference shares: 0. nedbank limited preference shares: 0.
christopher John watkins Ball (71)senior independent non-executive director
appointed november 2002 as a director/february 2007 as a senior independent director. Graham wayne Dempster (55)Chief operating officer
appointed august 2009.
DipIuris,MA. BCom,CTA,CA(SA),AMP(HarvardBusinessSchool,USA).
nationality south african. nationality south african.
chris was appointed independent non-executive director of nedbank limited and nedbank group limited during november 2002 and senior independent director in february 2007. he was previously a non-executive director of Boe limited and five of its subsidiary companies.
graham joined the group in 1980 in the corporate finance division of ual merchant Bank limited. he was appointed general manager in 1987 and joint head of the international division. he assumed responsibility for the corporate Banking division in 1999 and was appointed managing director of nedbank corporate in 2003. graham was appointed as the chief operating officer of nedbank group limited in august 2009.
committees group finance and oversight committee (chairman), group audit committee (chairman), group remuneration committee, group credit committee, group directors’ affairs committee, group risk and capital management committee, group transformation and Sustainability committee, group information technology (it) committee.
committees
Shares nedbank group limited ordinary shares: 10000beneficialdirect. Shares nedbank group limited ordinary shares: 11881beneficialdirectand215229beneficialindirect.
nedbank limited preference shares: 144300beneficialdirect. nedbank limited preference shares: 0.
thomas andrew Boardman (61)non-executive director
appointed november 2002 as a director and march 2010 as a non-executive director. mustaq ahmed enus-Brey (56)non-executive director
appointed august 2005.
BCom,CA(SA). BCompt(Hons),CA(SA).
nationality south african. nationality south african.
tom was chief executive of nedbank group limited from december 2003 to february 2010. he was previously chief executive and an executive director of Boe limited. he was the founding shareholder and managing director of retail housewares chain Boardmans, which was sold to pick n pay in 2006. prior to this he was managing director of sam newman limited and worked for the anglo american corporation for three years. he is a non-executive director of nedbank group, vodacom limited, Woolworths holdings and mutual and federal insurance company limited. he is a director of the World Wide fund for nature south africa and the peace parks foundation and chairman of the david rattray foundation, and serves as a trustee on a number of other charitable foundations.
mustaq was appointed as director in august 2005. he is also a director of Brimstone investment corporation limited and oceana group limited.
committees group information technology (it) committee, group credit committee. committees group risk and capital management committee (chairman), group directors’ affairs committee, group credit committee, executive credit committee, group finance and oversight committee.
Shares nedbank group limited ordinary shares: 65662beneficialdirectand251715beneficialindirect.
Shares nedbank group limited ordinary shares: 2113beneficialindirect.
nedbank limited preference shares: 85000beneficialindirect. nedbank limited preference shares: 0.
michael william thomas Brown (44)chief executive
appointed june 2004 as director and march 2010 as chief executive. prof Brian De Lacy figaji (66)non-executive director
appointed november 2002.
BCom,DipAcc,CA(SA),AMP(HarvardBusinessSchool,USA). BSc(Eng),DipTertiaryEduMed,DEd(Coventry,UK),DLitt(hc)(California,USA).
nationality south african. nationality south african.
mike was previously the chief financial officer of the group. prior to this he was an executive director of Boe limited and, after the merger between nedbank limited, Boe limited, nedbank investment Bank limited and cape of good hope Bank limited, was appointed head of property finance at nedbank limited.
Brian is chairman of i&j limited and mariB holdings. he is the former principal and vice-chancellor of the peninsula technikon. he is also a director of cape lime (pty) limited and the development fund of the development Bank of southern africa. he became a nedbank group director in november 2002.
committees committees group remuneration committee (chairman), group credit committee, group directors’ affairs committee, group transformation and Sustainability committee, group audit committee.
Shares nedbank group limited ordinary shares: 54379beneficialdirectand327430beneficialindirect.
Shares nedbank group limited ordinary shares: 125933beneficialindirectand1530non-beneficialindirect.
nedbank limited preference shares: 0. nedbank limited preference shares: 0.
overvieWgroup
reportSoperational
overvieW
sustainaBle development performance
risk, governance and compliance
1 Ned Overview FA.indd 41 22/03/2011 11:51 AM
nedBanK group limited integrated report 201042
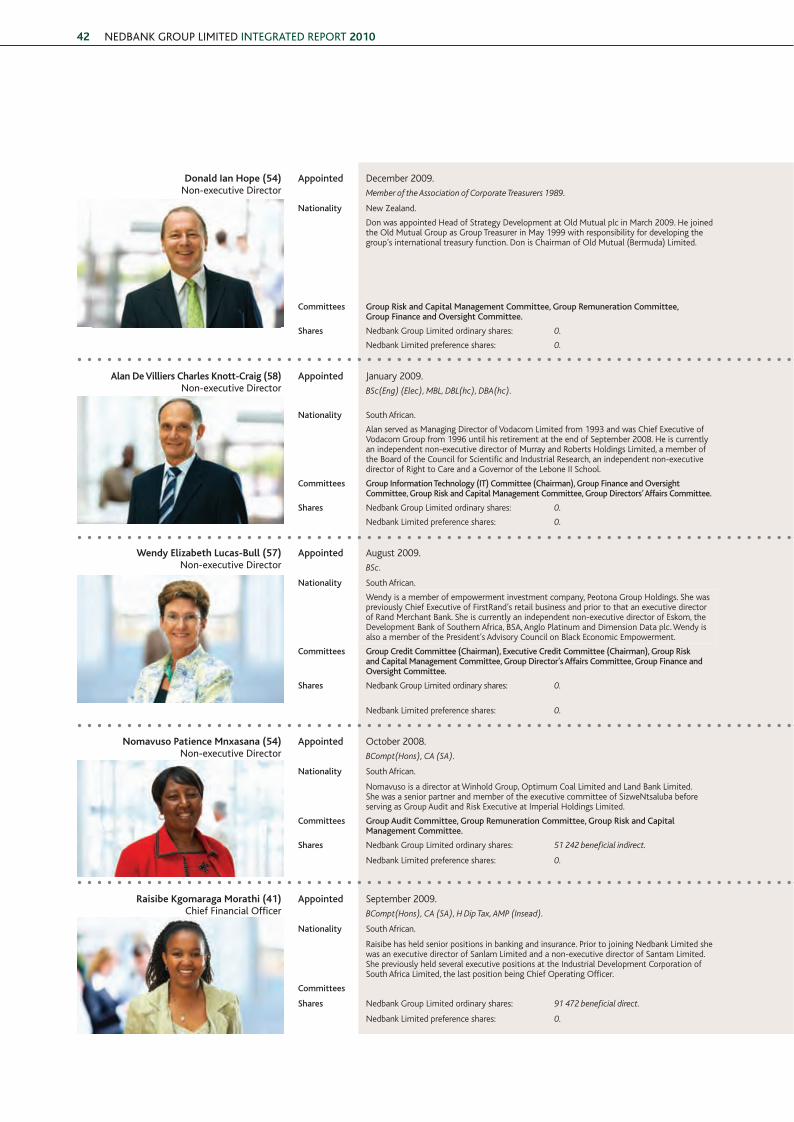
Donald ian Hope (54)non-executive director
appointed december 2009. Joel Khathutshelo netshitenzhe (54)non-executive director
appointed august 2010.MemberoftheAssociationofCorporateTreasurers1989. MSc(UniversityofLondon,UK).
nationality new Zealand. nationality south african.
don was appointed head of strategy development at old mutual plc in march 2009. he joined the old mutual group as group treasurer in may 1999 with responsibility for developing the group’s international treasury function. don is chairman of old mutual (Bermuda) limited.
joel is an executive director of the mapungubwe institute (mistra) and a member of the national planning commission. he has been a member of the national executive committee of the african national congress (anc) since 1991, and is a member of the anc’s economic transformation and political education subcommittees. he served as head of policy coordination and advisory services in the presidency from 2001 to december 2009. he was previously chief executive of the government communication and information system and also served as head of communication in the president’s office. he was appointed to the board of life healthcare group holdings limited as non-executive director with effect from 30 november 2010.
committees group risk and capital management committee, group remuneration committee, group finance and oversight committee.
committees group risk and capital management committee.
Shares nedbank group limited ordinary shares: 0. Shares nedbank group limited ordinary shares: 0.
nedbank limited preference shares: 0. nedbank limited preference shares: 0.
alan De villiers charles Knott-craig (58)non-executive director
appointed january 2009. Julian victor frow roberts (53)non-executive director
appointed december 2009.BSc(Eng)(Elec),MBL,DBL(hc),DBA(hc). FellowofInstituteofCharteredAccountants,memberofAssociationofCorporateTreasurers,
AccountancyandBusinessLaw(UniversityofStirling,Scotland).
nationality south african. nationality British.
alan served as managing director of vodacom limited from 1993 and was chief executive of vodacom group from 1996 until his retirement at the end of september 2008. he is currently an independent non-executive director of murray and roberts holdings limited, a member of the Board of the council for scientific and industrial research, an independent non-executive director of right to care and a governor of the lebone ii school.
julian was appointed group chief executive of old mutual plc in september 2008. prior to this he was chief executive of the group’s skandia business. julian originally joined old mutual plc as group finance director in august 2000. Before joining old mutual, julian was group finance director of sun life & provincial holdings plc (now part of axa) and previously chief financial officer of aon uk holdings limited.
committees group information technology (it) committee (chairman), group finance and oversight committee, group risk and capital management committee, group directors’ affairs committee.
committees group directors’ affairs committee.
Shares nedbank group limited ordinary shares: 0. Shares nedbank group limited ordinary shares: 0.
nedbank limited preference shares: 0. nedbank limited preference shares: 0.
wendy elizabeth Lucas-Bull (57)non-executive director
appointed august 2009. Gloria tomatoe serobe (51)non-executive director
appointed august 2005.BSc. BCom(Unitra),MBA(Rutgers,USA).
nationality south african. nationality south african.
Wendy is a member of empowerment investment company, peotona group holdings. she was previously chief executive of firstrand’s retail business and prior to that an executive director of rand merchant Bank. she is currently an independent non-executive director of eskom, the development Bank of southern africa, Bsa, anglo platinum and dimension data plc. Wendy is also a member of the president’s advisory council on Black economic empowerment.
gloria is the chief executive of Wipcapital limited and also the founder and an executive director of Wiphold limited. she was previously the executive director, finance, at transnet. gloria serves on several boards, including that of jse limited. she is also a non-executive director of old mutual life assurance company (sa) limited.
committees group credit committee (chairman), executive credit committee (chairman), group risk and capital management committee, group director’s affairs committee, group finance and oversight committee.
committees group transformation and Sustainability committee and group credit committee.
Shares nedbank group limited ordinary shares: 0. Shares nedbank group limited ordinary shares: 1296beneficialindirectand1296non-beneficialindirect.
nedbank limited preference shares: 0. nedbank limited preference shares: 0.
nomavuso patience mnxasana (54)non-executive director
appointed october 2008. malcolm ian wyman (64)non-executive director
appointed august 2009.BCompt(Hons),CA(SA). CA(SA)AMP(HarvardBusinessSchool,USA).
nationality south african. nationality British.
nomavuso is a director at Winhold group, optimum coal limited and land Bank limited. she was a senior partner and member of the executive committee of sizwentsaluba before serving as group audit and risk executive at imperial holdings limited.
malcolm is an executive director and the chief financial officer of saBmiller plc, a position he has held since 2001. he was previously executive director responsible for corporate finance, planning and development.
committees group audit committee, group remuneration committee, group risk and capital management committee.
committees group audit committee, group remuneration committee.
Shares nedbank group limited ordinary shares: 51242beneficialindirect. Shares nedbank group limited ordinary shares: 350non-beneficialindirect.
nedbank limited preference shares: 0. nedbank limited preference shares: 0.
raisibe Kgomaraga morathi (41)Chief financial officer
appointed september 2009.BCompt(Hons),CA(SA),HDipTax,AMP(Insead).
nationality south african.
raisibe has held senior positions in banking and insurance. prior to joining nedbank limited she was an executive director of sanlam limited and a non-executive director of santam limited. she previously held several executive positions at the industrial development corporation of south africa limited, the last position being chief operating officer.
committees
Shares nedbank group limited ordinary shares: 91472beneficialdirect.
nedbank limited preference shares: 0.
1 Ned Overview FA.indd 42 22/03/2011 11:51 AM

43
board of directorS
Donald ian Hope (54)non-executive director
appointed december 2009. Joel Khathutshelo netshitenzhe (54)non-executive director
appointed august 2010.MemberoftheAssociationofCorporateTreasurers1989. MSc(UniversityofLondon,UK).
nationality new Zealand. nationality south african.
don was appointed head of strategy development at old mutual plc in march 2009. he joined the old mutual group as group treasurer in may 1999 with responsibility for developing the group’s international treasury function. don is chairman of old mutual (Bermuda) limited.
joel is an executive director of the mapungubwe institute (mistra) and a member of the national planning commission. he has been a member of the national executive committee of the african national congress (anc) since 1991, and is a member of the anc’s economic transformation and political education subcommittees. he served as head of policy coordination and advisory services in the presidency from 2001 to december 2009. he was previously chief executive of the government communication and information system and also served as head of communication in the president’s office. he was appointed to the board of life healthcare group holdings limited as non-executive director with effect from 30 november 2010.
committees group risk and capital management committee, group remuneration committee, group finance and oversight committee.
committees group risk and capital management committee.
Shares nedbank group limited ordinary shares: 0. Shares nedbank group limited ordinary shares: 0.
nedbank limited preference shares: 0. nedbank limited preference shares: 0.
alan De villiers charles Knott-craig (58)non-executive director
appointed january 2009. Julian victor frow roberts (53)non-executive director
appointed december 2009.BSc(Eng)(Elec),MBL,DBL(hc),DBA(hc). FellowofInstituteofCharteredAccountants,memberofAssociationofCorporateTreasurers,
AccountancyandBusinessLaw(UniversityofStirling,Scotland).
nationality south african. nationality British.
alan served as managing director of vodacom limited from 1993 and was chief executive of vodacom group from 1996 until his retirement at the end of september 2008. he is currently an independent non-executive director of murray and roberts holdings limited, a member of the Board of the council for scientific and industrial research, an independent non-executive director of right to care and a governor of the lebone ii school.
julian was appointed group chief executive of old mutual plc in september 2008. prior to this he was chief executive of the group’s skandia business. julian originally joined old mutual plc as group finance director in august 2000. Before joining old mutual, julian was group finance director of sun life & provincial holdings plc (now part of axa) and previously chief financial officer of aon uk holdings limited.
committees group information technology (it) committee (chairman), group finance and oversight committee, group risk and capital management committee, group directors’ affairs committee.
committees group directors’ affairs committee.
Shares nedbank group limited ordinary shares: 0. Shares nedbank group limited ordinary shares: 0.
nedbank limited preference shares: 0. nedbank limited preference shares: 0.
wendy elizabeth Lucas-Bull (57)non-executive director
appointed august 2009. Gloria tomatoe serobe (51)non-executive director
appointed august 2005.BSc. BCom(Unitra),MBA(Rutgers,USA).
nationality south african. nationality south african.
Wendy is a member of empowerment investment company, peotona group holdings. she was previously chief executive of firstrand’s retail business and prior to that an executive director of rand merchant Bank. she is currently an independent non-executive director of eskom, the development Bank of southern africa, Bsa, anglo platinum and dimension data plc. Wendy is also a member of the president’s advisory council on Black economic empowerment.
gloria is the chief executive of Wipcapital limited and also the founder and an executive director of Wiphold limited. she was previously the executive director, finance, at transnet. gloria serves on several boards, including that of jse limited. she is also a non-executive director of old mutual life assurance company (sa) limited.
committees group credit committee (chairman), executive credit committee (chairman), group risk and capital management committee, group director’s affairs committee, group finance and oversight committee.
committees group transformation and Sustainability committee and group credit committee.
Shares nedbank group limited ordinary shares: 0. Shares nedbank group limited ordinary shares: 1296beneficialindirectand1296non-beneficialindirect.
nedbank limited preference shares: 0. nedbank limited preference shares: 0.
nomavuso patience mnxasana (54)non-executive director
appointed october 2008. malcolm ian wyman (64)non-executive director
appointed august 2009.BCompt(Hons),CA(SA). CA(SA)AMP(HarvardBusinessSchool,USA).
nationality south african. nationality British.
nomavuso is a director at Winhold group, optimum coal limited and land Bank limited. she was a senior partner and member of the executive committee of sizwentsaluba before serving as group audit and risk executive at imperial holdings limited.
malcolm is an executive director and the chief financial officer of saBmiller plc, a position he has held since 2001. he was previously executive director responsible for corporate finance, planning and development.
committees group audit committee, group remuneration committee, group risk and capital management committee.
committees group audit committee, group remuneration committee.
Shares nedbank group limited ordinary shares: 51242beneficialindirect. Shares nedbank group limited ordinary shares: 350non-beneficialindirect.
nedbank limited preference shares: 0. nedbank limited preference shares: 0.
raisibe Kgomaraga morathi (41)Chief financial officer
appointed september 2009.BCompt(Hons),CA(SA),HDipTax,AMP(Insead).
nationality south african.
raisibe has held senior positions in banking and insurance. prior to joining nedbank limited she was an executive director of sanlam limited and a non-executive director of santam limited. she previously held several executive positions at the industrial development corporation of south africa limited, the last position being chief operating officer.
committees
Shares nedbank group limited ordinary shares: 91472beneficialdirect.
nedbank limited preference shares: 0.
overvieWgroup
reportSoperational
overvieW
sustainaBle development performance
risk, governance and compliance
1 Ned Overview FA.indd 43 22/03/2011 11:52 AM

nedBanK group limited integrated report 201044
Group eXecutive committee
trevor adams (48) Service: 14 years
mfundo nkuhlu (44) Service: 7 yearsgroup executive: Balance sheet management Bcom(hons), ca (sa) managing executive: nedbank corporate Ba(hons), strategic management in Banking (insead Business school),
amp (harvard Business school, usa)
appointed to the group excecutive in august 2009, trevor directs the group’s credit portfolio, asset and liability (liquidity and funding), margin, capital and shareholder value-based management, ultimately integrated group balance sheet management. trevor also lead the group’s successful Basel ii and Basel iii implementation and is responsible for the significant enhancement of risk, capital and value-based management across the group. trevor was appointed a partner at deloitte & touche in 1996, but left shortly thereafter to join nedbank group.
mfundo started his career in 1994 at the department of trade and industry as a consultant on southern african trade relations. he was appointed chief director of africa trade relations in 1996 and was charged with the responsibility for managing trade, economic policy and programmes covering africa and the middle east, and the new partnership for africa’s development (nepad). he joined the south african revenue service in 2004 as the general manager for strategy and planning responsible for corporate strategy, revenue and economic analysis. he joined nedbank in 2005 as the managing executive for nedbank africa. he subsequently became the managing executive of nedbank corporate Banking later in 2005, and was appointed managing executive of nedbank corporate in 2009.
selby Baqwa sc (59) Service: 8 years sandile shabalala (44) Service: 15 yearsgroup executive: enterprise governance and compliance Biuris, llB, mBa (de montfort university, uk), amp (harvard Business school, usa), diploma
in maritime law, certificate in constitutional lawmanaging executive: Business Banking Badmin, national higher diploma: management practice, caiB (sa), mBl, strategic
management in Banking (insead Business school)
selby had over 20 years’ experience as both an attorney and an advocate prior to being appointed to the position of public protector of the republic of south africa in 1995. he then joined nedbank group in 2002 to head a new corporate governance function, and at the beginning of 2005 also assumed responsibility for compliance.
sandile has over 22 years’ banking experience, including 15 years at nedbank. prior to joining nedbank he worked for Barclays Bank, nBs Bank and telkom sa. he has vast experience in retail, small-business, corporate and business banking in both sales and credit banking functions. prior to his appointment in october 2009 as managing executive, Business Banking, sandile had been leading and managing the northern Business unit in Business Banking as divisional executive.
John Bestbier (55) Service: 15 years fred swanepoel (47) Service: 14 yearsgroup executive: strategic planning BBussci actuarial, ca (sa) chief information officer Bcom(hons), mBa, sepsa, amp (harvard Business school, usa)
john was appointed to the group executive on 1 january 2010 as group executive: strategic planning, having previously been with the group for 14 years. john is an investment banker with extensive experience in the financial services industry, having led a number of large corporate finance transactions both for clients and for the group. he joined the group in 1995 as a director of its investment banking subsidiary ual. during his tenure he has served in various capacities and subsidiary boards in corporate finance, asset management and stock Broking.
fred has more than 20 years’ experience in finance, banking and information technology. he joined nedbank in 1996 as assistant general manager of Western cape operations. since 2004 fred has gained experience at the highest levels of nedbank group’s operations and technology cluster, holding the position of divisional director for finance, risk and compliance; projects and programme management; and group software services. fred was appointed to his current role in november 2008.
ingrid Johnson (44) Service: 17 years ciko thomas (41) Service: 1 yearmanaging executive: retail and Business Banking Bcom, Bacc, ca (sa), amp (harvard Business school, usa) managing executive: consumer Banking, nedbank retail Bsc, mBa
ingrid joined nedbank group in 1993 to set up the foreign currency financing operations in several offshore jurisdictions, and carried operational responsibility for the group’s banking businesses in london and asia. ingrid introduced balance sheet management in the corporate Banking division, and thereafter moved into line management in corporate Banking. in 2004 ingrid was appointed the managing director of corporate Banking and in 2005 the managing director of Business Banking. ingrid was appointed to the nedbank group executive committee in 2008. in august 2009 ingrid assumed the additional responsibility for the turnaround of the retail Banking cluster and the integration of imperial Bank in her new role of running a group of businesses as the group managing executive of retail and Business Banking.
ciko joined the group with effect from 18 january 2010 as group executive: group marketing, communications and corporate affairs. ciko has wide-ranging marketing and business experience in financial services and in the consumer goods and motor industries. he joined nedbank from Barloworld where he was the group marketing director of the automotive division. ciko was previously general manager of retail Banking marketing at absa group. Before 2003 he held various management positions at sa Breweries, unilever, British american tobacco and m-net. in november 2010 ciko was appointed as managing executive, consumer Banking, in the retail cluster.
Brian Kennedy (50) Service: 15 years abe thebyane (51) appointed: 1 february 2011managing executive: nedbank capital msc(eng)(elec), mBa, amp (harvard Business school, usa) group executive: group human resources Badmin, postgraduate diploma in management (human resources), mBa
Brian started his career in engineering before joining firstcorp merchant Bank in 1988. he joined Boe merchant Bank in 1996 and was appointed managing director in 1998. he was appointed an executive director of Boe in 2001. Brian led capital markets following the merger and in november 2003 was appointed to the group executive committee of nedbank group and managing executive of nedbank capital. he has 22 years of investment banking experience.
abe has 25 years’ experience in human resources, which he acquired through the various senior and executive positions held in large corporations in south africa. prior to joining nedbank, abe was executive head, human resources, at anglo platinum for six years and before that he was executive director, human resources, at iscor. he joined nedbank group in february 2011 as head of group human resources.
Dave macready (52) Service: 13 years philip wessels (52) Service: 15 yearsmanaging executive: nedbank Wealth Bcom(hons), ca (sa), sep (harvard Business school, usa) chief risk officer Bcom, cta, ca (sa), diploma in advanced Banking law, institute of stockbrokers
dave joined nedcor investment Bank in 1997 after being a partner at deloitte & touche for more than 10 years in both london and south africa. he assumed responsibility for syfrets private Bank and niB international and was appointed managing director of nedcor retail investments three years later. in 2004 dave took on the role of managing executive for the Bancassurance and Wealth division. in 2009 nedbank Wealth became the fifth client-facing cluster within the nedbank group and dave was appointed to the group executive committee.
philip Wessels has held the position of chief risk officer for nedbank group over the past seven years. through philip’s leadership, together with the commitment and support from management and staff within the group, nedbank has become well recognised and highly regarded for its effective risk management processes and governance principles. prior to his appointment as chief risk officer in 2004 philip was a divisional director in nedbank Business Banking and nedbank corporate. in addition, he was an executive director of Boe limited, managing director of Boe securities, chief executive of Boe international (london) and managing director of Boe Bank, Business Banking and Boland Bank between 1995 and 2003. philip was also a former partner at deloitte & touche between 1989 and 1995.
note: mike Brown, graham dempster and raisibe morathi serve on the nedbank group Board of directors. their cvs are included with those of the rest of the board on page 40.
1 Ned Overview FA.indd 44 22/03/2011 11:52 AM

45
trevor adams (48) Service: 14 years
mfundo nkuhlu (44) Service: 7 yearsgroup executive: Balance sheet management Bcom(hons), ca (sa) managing executive: nedbank corporate Ba(hons), strategic management in Banking (insead Business school),
amp (harvard Business school, usa)
appointed to the group excecutive in august 2009, trevor directs the group’s credit portfolio, asset and liability (liquidity and funding), margin, capital and shareholder value-based management, ultimately integrated group balance sheet management. trevor also lead the group’s successful Basel ii and Basel iii implementation and is responsible for the significant enhancement of risk, capital and value-based management across the group. trevor was appointed a partner at deloitte & touche in 1996, but left shortly thereafter to join nedbank group.
mfundo started his career in 1994 at the department of trade and industry as a consultant on southern african trade relations. he was appointed chief director of africa trade relations in 1996 and was charged with the responsibility for managing trade, economic policy and programmes covering africa and the middle east, and the new partnership for africa’s development (nepad). he joined the south african revenue service in 2004 as the general manager for strategy and planning responsible for corporate strategy, revenue and economic analysis. he joined nedbank in 2005 as the managing executive for nedbank africa. he subsequently became the managing executive of nedbank corporate Banking later in 2005, and was appointed managing executive of nedbank corporate in 2009.
selby Baqwa sc (59) Service: 8 years sandile shabalala (44) Service: 15 yearsgroup executive: enterprise governance and compliance Biuris, llB, mBa (de montfort university, uk), amp (harvard Business school, usa), diploma
in maritime law, certificate in constitutional lawmanaging executive: Business Banking Badmin, national higher diploma: management practice, caiB (sa), mBl, strategic
management in Banking (insead Business school)
selby had over 20 years’ experience as both an attorney and an advocate prior to being appointed to the position of public protector of the republic of south africa in 1995. he then joined nedbank group in 2002 to head a new corporate governance function, and at the beginning of 2005 also assumed responsibility for compliance.
sandile has over 22 years’ banking experience, including 15 years at nedbank. prior to joining nedbank he worked for Barclays Bank, nBs Bank and telkom sa. he has vast experience in retail, small-business, corporate and business banking in both sales and credit banking functions. prior to his appointment in october 2009 as managing executive, Business Banking, sandile had been leading and managing the northern Business unit in Business Banking as divisional executive.
John Bestbier (55) Service: 15 years fred swanepoel (47) Service: 14 yearsgroup executive: strategic planning BBussci actuarial, ca (sa) chief information officer Bcom(hons), mBa, sepsa, amp (harvard Business school, usa)
john was appointed to the group executive on 1 january 2010 as group executive: strategic planning, having previously been with the group for 14 years. john is an investment banker with extensive experience in the financial services industry, having led a number of large corporate finance transactions both for clients and for the group. he joined the group in 1995 as a director of its investment banking subsidiary ual. during his tenure he has served in various capacities and subsidiary boards in corporate finance, asset management and stock Broking.
fred has more than 20 years’ experience in finance, banking and information technology. he joined nedbank in 1996 as assistant general manager of Western cape operations. since 2004 fred has gained experience at the highest levels of nedbank group’s operations and technology cluster, holding the position of divisional director for finance, risk and compliance; projects and programme management; and group software services. fred was appointed to his current role in november 2008.
ingrid Johnson (44) Service: 17 years ciko thomas (41) Service: 1 yearmanaging executive: retail and Business Banking Bcom, Bacc, ca (sa), amp (harvard Business school, usa) managing executive: consumer Banking, nedbank retail Bsc, mBa
ingrid joined nedbank group in 1993 to set up the foreign currency financing operations in several offshore jurisdictions, and carried operational responsibility for the group’s banking businesses in london and asia. ingrid introduced balance sheet management in the corporate Banking division, and thereafter moved into line management in corporate Banking. in 2004 ingrid was appointed the managing director of corporate Banking and in 2005 the managing director of Business Banking. ingrid was appointed to the nedbank group executive committee in 2008. in august 2009 ingrid assumed the additional responsibility for the turnaround of the retail Banking cluster and the integration of imperial Bank in her new role of running a group of businesses as the group managing executive of retail and Business Banking.
ciko joined the group with effect from 18 january 2010 as group executive: group marketing, communications and corporate affairs. ciko has wide-ranging marketing and business experience in financial services and in the consumer goods and motor industries. he joined nedbank from Barloworld where he was the group marketing director of the automotive division. ciko was previously general manager of retail Banking marketing at absa group. Before 2003 he held various management positions at sa Breweries, unilever, British american tobacco and m-net. in november 2010 ciko was appointed as managing executive, consumer Banking, in the retail cluster.
Brian Kennedy (50) Service: 15 years abe thebyane (51) appointed: 1 february 2011managing executive: nedbank capital msc(eng)(elec), mBa, amp (harvard Business school, usa) group executive: group human resources Badmin, postgraduate diploma in management (human resources), mBa
Brian started his career in engineering before joining firstcorp merchant Bank in 1988. he joined Boe merchant Bank in 1996 and was appointed managing director in 1998. he was appointed an executive director of Boe in 2001. Brian led capital markets following the merger and in november 2003 was appointed to the group executive committee of nedbank group and managing executive of nedbank capital. he has 22 years of investment banking experience.
abe has 25 years’ experience in human resources, which he acquired through the various senior and executive positions held in large corporations in south africa. prior to joining nedbank, abe was executive head, human resources, at anglo platinum for six years and before that he was executive director, human resources, at iscor. he joined nedbank group in february 2011 as head of group human resources.
Dave macready (52) Service: 13 years philip wessels (52) Service: 15 yearsmanaging executive: nedbank Wealth Bcom(hons), ca (sa), sep (harvard Business school, usa) chief risk officer Bcom, cta, ca (sa), diploma in advanced Banking law, institute of stockbrokers
dave joined nedcor investment Bank in 1997 after being a partner at deloitte & touche for more than 10 years in both london and south africa. he assumed responsibility for syfrets private Bank and niB international and was appointed managing director of nedcor retail investments three years later. in 2004 dave took on the role of managing executive for the Bancassurance and Wealth division. in 2009 nedbank Wealth became the fifth client-facing cluster within the nedbank group and dave was appointed to the group executive committee.
philip Wessels has held the position of chief risk officer for nedbank group over the past seven years. through philip’s leadership, together with the commitment and support from management and staff within the group, nedbank has become well recognised and highly regarded for its effective risk management processes and governance principles. prior to his appointment as chief risk officer in 2004 philip was a divisional director in nedbank Business Banking and nedbank corporate. in addition, he was an executive director of Boe limited, managing director of Boe securities, chief executive of Boe international (london) and managing director of Boe Bank, Business Banking and Boland Bank between 1995 and 2003. philip was also a former partner at deloitte & touche between 1989 and 1995.
note: details of the full executive management team can be found on pages 206 and 207.
overvieWgroup
reportSoperational
overvieW
sustainaBle development performance
risk, governance and compliance
1 Ned Overview FA.indd 45 22/03/2011 11:52 AM
nedBanK group limited integrated report 201046
While the economic recovery remains fragile, we believe the worst of a very difficult
cycle for banks is behind us. sa banks and regulators have emerged from the crisis
with their reputations enhanced on the global front.
in this report i focus primarily on the group’s performance, strategy, sustainability
and prospects for 2011 and beyond. the chairman in his report has covered several
issues on a macrolevel as well as commented specifically on governance, sustainability
and the proposal from hsBc plc to old mutual plc to acquire a controlling
shareholding in nedbank group. i urge you to read this report in conjunction with
the chairman’s report.
the adoption of the king iii principles on integrated sustainability reporting ensures
that we not only report on our performance in financial and economic terms, but also
across the key tenets of environmental, social and cultural sustainability.
2010 performanCe in revieW
improved results in recovering economic conditions
2010 saw the group’s headline earnings grow for the first time since 2007 when the
banking sector globally and locally was hit by a crisis of unprecedented magnitude
in recent times. the 14,6% growth in headline earnings for the financial year was
marginally above our expectations outlined to shareholders in the third-quarter
trading update. earnings momentum built during the year, with earnings in the second
half up 27% on the first half following strong fourth-quarter performance. these
results were driven by the improving economic conditions, the group’s strategic focus
on growing non-interest revenue (nir) and efficient management of costs.
interest rates are currently at their lowest levels in over three decades, which is
creating strong endowment pressure and have resulted in a reduction in net interest
income (nii) of r925 million. it is, however, most encouraging that we experienced
the first signs of improving impairments, particularly in the retail home loan portfolios
that were so badly impacted during the downturn. overall impairment charges
improved by r446 million. We often speak about endowment pressure being ‘short-
term pain for longer-term gain’ and it is pleasing to see some gains emerging in an
impairment trend we believe is likely to improve into 2011.
We have demonstrated tight cost discipline over a number of years and this has been
balanced with investment in the sustainable growth of our business. in the past year
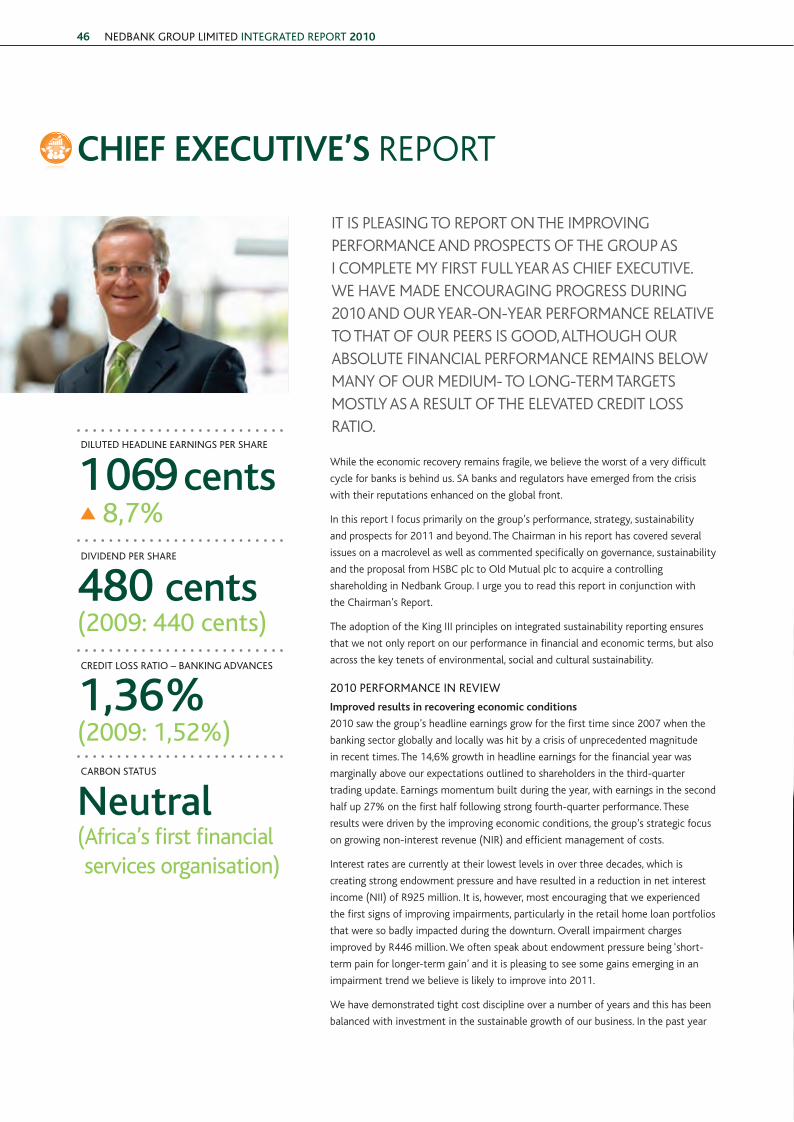
it is pleasing to report on the improving performance and prospects of the group as i complete mY first full Year as chief executive. We have made encouraging progress during 2010 and our Year-on-Year performance relative to that of our peers is good, although our aBsolute financial performance remains BeloW manY of our medium- to long-term targets mostlY as a result of the elevated credit loss ratio.
cHief eXecutive’s report
diluted headline earnings per share
dividend per share
Credit loss ratio – BanKing advanCes
CarBon status
1 069 cents8,7%
480 cents
1,36%
neutral( africa’s first financial services organisation)
(2009: 440 cents)
(2009: 1,52%)
1 Ned Overview FA.indd 46 22/03/2011 11:52 AM
47
overvieWgroup
reportSoperational
overvieW
sustainaBle development performance
risk, governance and compliance
headline earnings grew by almost 15%, with comparable expense
growth being contained at 8,5%, despite the challenges of wage
settlements above the level of inflation. pleasingly we expanded our
distribution network by adding 409 atms, 17 branches, 13 personal
loans branches, 70 personal loans kiosks and a further 69 points of
presence in retail outlets.
While year-on-year growth rates are pleasing, our performance in
absolute terms, as measured by return on equity relative to our cost
of equity, remains below medium- to long-term targets owing to the
endowment effect of lower rates on nii, a high credit loss ratio and
insufficient transactional income.
nir is a key focus area and comparable growth of 10,5% before
fair-value adjustments should be a strong result relative to that
of our peers. While the ratio of nir to expenses has improved to
79,6%, there remains a great deal of work to be done to achieve our
medium- to long-term target of 85%.
the r3 billion invested in 2009 to acquire the remaining 49,9% of
imperial Bank and full ownership of the wealth management joint
ventures is proving to be a solid investment for our shareholders. this
is evidenced through the contribution of motor finance corporation
(mfc) to nedbank retail’s improved performance and the excellent
growth and returns achieved within nedbank Wealth. it is important
to note that the integration of imperial Bank was completed without
any job losses.
the group maintained its well-capitalised balance sheet, with core
tier 1 capital at 10,1% (2009: 9,9%). advances grew by 5,5%, with
market share gains in most lending classes besides home loans. We
have taken a strategic decision to reduce home loan market share in
the current environment and focus rather on the quality of the home
loan portfolio, given the challenging economics in this product line.
net asset value per share grew by 8,0% to 9 831 cents. this is a
pleasing result given the increase in the average number of shares in
issue following the acquisition of the joint ventures from old mutual
and scrip dividend payments last year.
performanCe of Business Clusters
our business clusters delivered strong nir growth, improved
impairment levels and contained costs below the original forecasts
that we gave to the market.
the banking clusters’ results were impacted by the increased allocation
of central costs and negative endowment earnings from lower average
interest rates, which were 198 basis points lower when compared
with 2009. the capital optimisation exercises in nedbank retail and
nedbank Business Banking continued and resulted in more efficient
use of capital. the lower levels of capital used resulted in lower
endowment-related interest revenue in these clusters.
nedbank retail reported an encouraging improvement in
impairments, particularly in home loans, and solid nir growth.
1 Ned Overview FA.indd 47 22/03/2011 11:52 AM
nedBanK group limited integrated report 201048
impairments improved in most businesses, with nedbank corporate,
nedbank Wealth and nedbank Business Banking again recording
credit loss ratios within or below through-the-cycle target ranges.
nedbank capital incurred a higher level of impairments in its private
equity portfolio.
the businesses generated strong growth in core fee and commission
income, driven primarily by volume growth, new primary clients
and a number of innovative products focused on growing nir.
nedbank capital recorded improved trading income, particularly
in the equity businesses. nedbank Wealth performed very well
and increased both headline earnings and the return on ordinary
shareholders’ funds (roe). the business benefited from the
integration of the former joint ventures and strong growth in
new business, particularly in insurance and asset management.
nedbank retail delivered a turnaround in performance, with
headline earnings increasing from a loss of r27 million to a
r760 million profit. roe at 4,6% (2009: -0,2%) remains well below
the cost of equity, resulting in economic losses for the cluster. the
stabilisation of retail, combined with the repositioning of the cluster
to an integrated and client-centred business, should contribute
to a sustainable momentum in earnings growth and a return to
economic profit in the next three to four years.
ViSion and growth Strategyduring the year we refined our vision to ‘building africa’s most
admired bank by our staff, clients, shareholders, regulators and
communities’. to be africa’s most admired bank we need to become
south africa’s most admired bank and, while we made progress in
2010, we still have much work ahead. this vision also highlights the
increasing focus on growing our business reach across the african
continent and not just in south africa.
to achieve our vision we need to deliver the following key strategic
drivers:
reposition nedBanK retail
nedbank retail is both our biggest challenge and our biggest
opportunity. the management team has worked hard in 2010 to
develop a strategy to ensure sustainable growth in retail. this
essentially covers three areas: harnessing the strengths of nedbank
by building on corporate and business banking relationships to grow
retail; growing primary clients by focusing on households, the youth
and small businesses, and integrating the high-net-worth offering
under nedbank Wealth; and managing for value by elevating all risk
management practices and adopting a more discerning approach to
home loans origination, which will lead to reductions in market share
but improved economics on new business written.
non-interest revenue groWth
nir levels are below those of our peers, which results in our roe
and valuation in price-to-book terms being lower than that of our
peers. the 11% growth in nir in 2010 reflects progress in all areas of
electronic banking, mobile products, equity trading and new products
in nedbank Wealth, including the introduction of credit life cover
in the mfc portfolio. We continue to work on product innovation,
system enhancements and bundling to enhance nir growth.
portfolio tilt
this strategy relates to the allocation of scarce resources such as
capital and liquidity to the business to measure them effectively and
enable us proactively to grow businesses we believe are strategically
attractive and generate higher levels of economic profit. importantly,
with reward mechanisms appropriately linked to performance, short-
term incentive payments in 2010 were 17% higher, which is largely
in line with headline earnings growth of 15%, together with some
outperformance on non-financial measures.
Building afriCa’s most admired BanK
Based on the current distribution of economic profit pools in
financial services on the continent, to be africa’s most admired bank
we firstly need to be south africa’s most admired bank. our strategy
for the rest of africa is built on four pillars:
• growing and expanding the operations in the five countries in
which we operate, where we need to achieve roes greater than
in south africa.
• expanding the advisory business of nedbank capital, including
structured trade finance, with the emphasis on mining,
telecommunications and infrastructure.
• strengthening our alliance with ecobank to provide clients with a
one-bank experience in 35 african countries (we have made solid
progress in 2010 by attracting a number of new clients).
• Being alert to acquisition opportunities that align with our
strategy, culture and financial return hurdles.
BeComing Client-driven
our clients are the reason we are in business. We continually strive
to improve service levels across the bank by putting our clients at
the centre of everything we do. in the past year we have improved
scores and ratings in leading independent client service and banking
industry surveys across the retail and wholesale businesses.
as discussed earlier, we also made a significant investment
in extending our retail distribution channels and footprint.
nedbank retail attracted some 96 000 new primary clients,
increasing the total client base to 4,5 million. the number of mzansi
clients reached 1 million. in partnership with vodacom, nedbank
launched the m-pesa mobile banking solution in south africa, which
is a complementary product to mzansi as an entry-level offering that
is affordable and easy to use.
one of the group’s strategic objectives is to become client-driven
and, in striving to achieve this, we aim to transform retail banking
to be more client-focused, become the leader in business banking
and the public sector bank of choice, and maintain our position as a
top-two wholesale bank.
1 Ned Overview FA.indd 48 22/03/2011 11:52 AM
49
overvieWgroup
reportSoperational
overvieW
sustainaBle development performance
risk, governance and compliance
chief executiVe’S report
eXeCutive remuneration
in the aftermath of the global financial crisis there has been a
heightened focus from shareholders and other stakeholders on
remuneration practices. several of the high-profile companies
that failed during the crisis could no doubt claim to have had
remuneration policies that linked reward to performance and
drove shareholder value creation. however, their practices clearly
rewarded short-term performance and ignored behaviour and risk
management that would ensure the longer-term sustainability of
the business.
We believe our remuneration practices are aligned with the interests
of all stakeholders in a manner that does not encourage excessive
risk taking. Quantitative and qualitative performance targets are
linked to variable remuneration to drive the correct behaviour.
nedbank group is well positioned in relation to emerging best
practice in financial services remuneration. corporate performance
targets were introduced into the long-term incentive schemes for
all staff as far back as 2007, and we have had compulsory deferral
and clawback arrangements for short-term incentives since 2009.
in line with the spirit of king iii the group introduced a split in long-
term incentive allocations in 2010, where a portion is allocated for
performance, with associated performance targets, and a portion for
retention only, with time-based vesting.
importantly, our remuneration practices are aligned with the
performance of the business within the board-approved risk
appetite and contribute to the achievement of the group’s business
objectives. the disclosure in our remuneration report has been
further enhanced and can be found on pages 224 to 247.
sustainaBility
nedbank group’s approach to integrated sustainability is holistic
and as such balances stakeholder interests across the following areas:
• economic sustainability – ensuring the delivery of lasting
stakeholder value.
• environmental sustainability – minimising usage of, and
impact on, natural resources.
• social sustainability – building societal capital in southern
africa.
• cultural sustainability – developing a resilient corporate
culture.
aChieving CarBon neutrality
in september 2009 we announced our commitment to working
towards carbon neutrality and less than a year later became the
first african bank – and the first large sa corporate – to achieve
zero carbon status.
our decision to pursue carbon neutrality was not one to achieve
short-term marketing advantage. it was the culmination of more
than 20 years of focusing on environmental issues and positioning
ourselves as the green and caring bank.
stakeholders should note that we have not achieved neutrality
by simply buying carbon offsets. the process included ongoing
awareness and behaviour change, supported by intensity reduction
targets and driving operational efficiencies that have been
incorporated into performance scorecards.
the cost of achieving carbon neutrality is two-fold. direct costs
relating to carbon credits purchased and the indirect costs to achieve
intensity reduction targets. as a result of the carbon reduction
initiatives and operational efficiencies achieved, nedbank group
saved r36 million over three years. this highlights that, in addition
to the environmental and social benefits, carbon neutrality is
economically sustainable.
however, carbon neutrality is not an end in itself and we are
committed to reducing our footprint even further and maintaining
our carbon-neutral status.
We also plan to focus more closely on water issues in 2011, as water
is becoming a major sustainability challenge in south africa. our
focus will include water quality, supply and access.
aCCelerating transformation
on the transformation front we were pleased to be rated as
the third most empowered company in the 2010 FinancialMail
top empowerment companies survey with a score of 86,6
[based on the 2009 department of trade and industry (dti) scores].
this survey covers the top 200 companies listed on jse limited.
nedbank is the only bank with level 2 contributor status based on
scores from the dti codes of good practice. nedbank group was
rated first against its peers in every category, except ownership,
where we were ranked second.
in 2010 we improved our overall score to 89,5, notwithstanding the
integration of imperial Bank and slower headcount growth as well as
less attrition.
Basel iii developments
the majority of the Basel iii proposals have recently been finalised,
although some significant aspects remain to be completed in 2011.
in south africa the details of exactly how Basel iii will be adopted
will be determined by the south african reserve Bank in due course.
for nedbank group the impact of the new capital requirements is
expected to be manageable. on a Basel iii pro forma basis for 2010
the group is in a position to absorb the Basel iii capital implications,
with all capital ratios still remaining above the top end of current
internal target ranges. these should improve further by the end of
2013 from projected earnings, continuing capital and risk-weighted
asset optimisation, and the impact of the group’s active portfolio
management strategy.
1 Ned Overview FA.indd 49 22/03/2011 11:52 AM
nedBanK group limited integrated report 201050
once Basel iii has been finalised, nedbank group will review its
target capital ratios.
in respect of the two proposed liquidity ratios, the liquidity coverage
ratio for implementation in 2015 and the net stable funding ratio
(nsfr) for implementation in 2018, the impact of compliance by
the sa banking industry would be punitive if implemented as they
currently stand, particularly the nsfr in the light of structural
constraints within the sa financial market. this is the case for many
emerging-market jurisdictions around the world, and the negative
effect on economic growth and employment would be significant.
the group anticipates that a pragmatic approach to this issue will be
applied prior to the finalisation in 2018.
proSpectS for 2011nedbank group is well placed for earnings growth in 2011.
the group will continue to invest to generate sustainable nir
growth, underpinned by ongoing cost optimisation and efficiency
improvements. growing the bank’s overall franchise and maintaining
momentum on the turnaround in the retail cluster, supported by
a liquid and well-capitalised balance sheet, are key to delivering
sustainable growth.
margins should widen slightly, given that interest rates are expected
to remain unchanged, and hence the negative effect of assets
repricing quicker than liabilities out to three months will decrease.
in addition, the cost of term liquidity is expected to decline as more
expensive deposits mature and as below-trend economic growth
continues, albeit at higher levels than last year. overall advances
growth is expected to be in the mid to upper single digits.
impairments are expected to continue reducing in line with the
improved quality of assets supported by asset pricing on new
advances that appropriately reflects risk and the related cost of
funds. the credit loss ratio is currently expected to decrease, but to
remain above the group’s target range for 2011.
transactional volumes are expected to increase as the economy
improves and the group focus on growing primary clients is
maintained.
group targets
the group’s medium- to long-term financial targets remain
unchanged. these targets, together with an outlook for performance
for 2011, are detailed in the financial report. the high credit loss
ratio and the impact of endowment were the key factors in most
of the targets not being met in 2010, as expected at this point in
the cycle. Based on the group’s current macroeconomic outlook,
management expects to achieve all these targets by 2013 as the
credit loss ratio unwinds and the nir/expense ratio improves.
finanCial drivers
against this background we expect asset growth in line with nominal
gross domestic product in the mid to upper single digits and some
margin expansion, assuming no further cuts in interest rates.
impairments should decrease, but the credit loss ratio is estimated to
remain above 1%, which is the top of our target range.
the momentum in nir is expected to continue with double-digit
growth before any fair-value movements. We will continue to invest
in our business and optimise costs in a way that we anticipate will
lead to a positive ‘jaws ratio’ and a small reduction in the efficiency
ratio.
on the capital front we will operate above current targets in
anticipation of Basel iii.
acknowledgementSnedbank group performed well in 2010, which in many ways was a
difficult year for the business, and i thank all my fellow stakeholders
for their role in delivering these results.
i thank our chairman, reuel khoza, for his guidance and the benefit
of his wisdom during my first year as chief executive, as well as my
board colleagues for their commitment and active participation in
the group’s affairs. i have also been fortunate to benefit from the
counsel of tom Boardman, who has remained on the board as a
non-executive director, which has ensured continuity and facilitated
a seamless succession process.
it is a privilege to lead a fantastic executive team at nedbank. the
teammembers work well together and i thank them for their support.
during the year ciko thomas and john Bestbier joined the group
executive committee, while sadly we said farewell to shirley Zinn
and saks ntombela who resigned from the group. early in 2011 we
welcomed abe thebyane as group executive, human resources, to
the team.
after a tough period for the banking sector our staffmembers are
beginning to see the results of their efforts, which have not always
been evident in the performance in recent years. thank you for your
loyalty and commitment as, together, we strive to build africa’s most
admired bank.
mike Brown
chief executive
24 february 2011
1 Ned Overview FA.indd 50 22/03/2011 11:52 AM
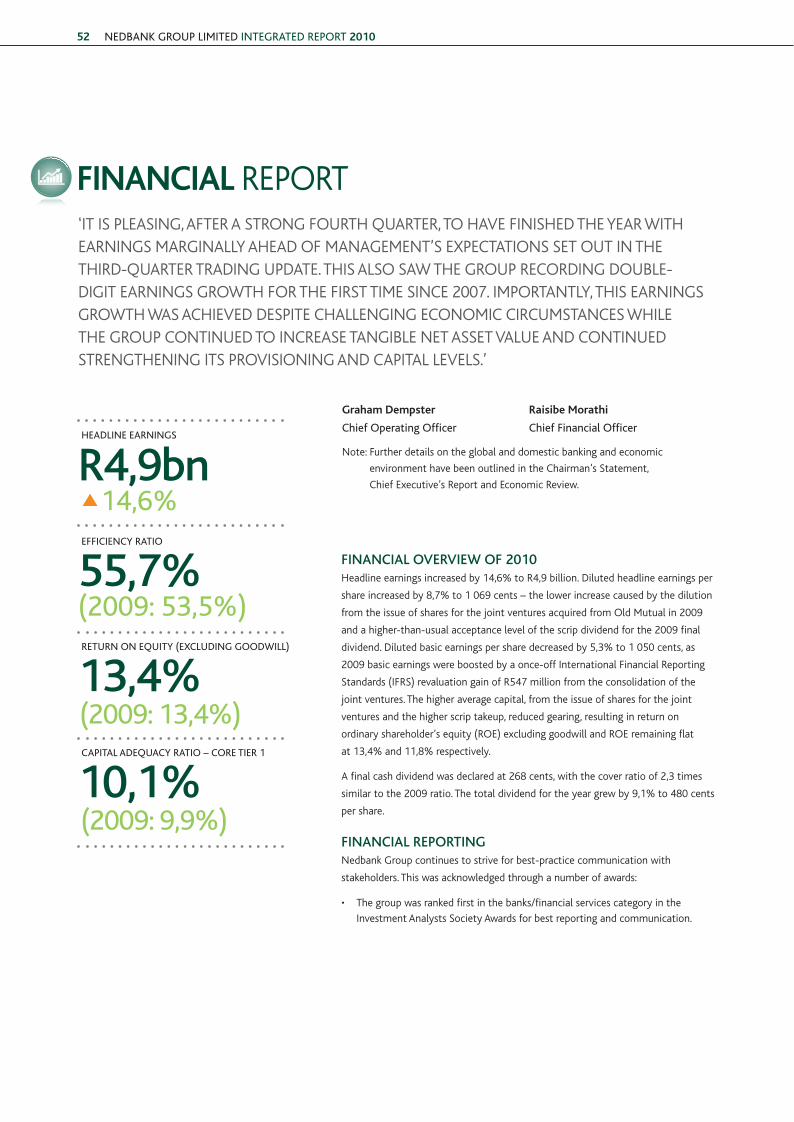
NEDBANK GROUP LimitED iNtEGRAtED REPORt 201052
Financial report‘It Is pleasIng, after a strong fourth quarter, to have fInIshed the year wIth earnIngs margInally ahead of management’s expectatIons set out In the thIrd-quarter tradIng update. thIs also saw the group recordIng double-dIgIt earnIngs growth for the fIrst tIme sInce 2007. Importantly, thIs earnIngs growth was achIeved despIte challengIng economIc cIrcumstances whIle the group contInued to Increase tangIble net asset value and contInued strengthenIng Its provIsIonIng and capItal levels.’
Graham Dempster Raisibe Morathi
Chief Operating Officer Chief Financial Officer
note: further details on the global and domestic banking and economic
environment have been outlined in the chairman’s statement,
chief executive’s report and economic review.
Financial overview oF 2010headline earnings increased by 14,6% to r4,9 billion. diluted headline earnings per
share increased by 8,7% to 1 069 cents – the lower increase caused by the dilution
from the issue of shares for the joint ventures acquired from old mutual in 2009
and a higher-than-usual acceptance level of the scrip dividend for the 2009 final
dividend. diluted basic earnings per share decreased by 5,3% to 1 050 cents, as
2009 basic earnings were boosted by a once-off International financial reporting
standards (Ifrs) revaluation gain of r547 million from the consolidation of the
joint ventures. the higher average capital, from the issue of shares for the joint
ventures and the higher scrip takeup, reduced gearing, resulting in return on
ordinary shareholder’s equity (roe) excluding goodwill and roe remaining flat
at 13,4% and 11,8% respectively.
a final cash dividend was declared at 268 cents, with the cover ratio of 2,3 times
similar to the 2009 ratio. the total dividend for the year grew by 9,1% to 480 cents
per share.
Financial reportingnedbank group continues to strive for best-practice communication with
stakeholders. this was acknowledged through a number of awards:
• the group was ranked first in the banks/financial services category in the
Investment analysts society awards for best reporting and communication.
hEADLiNE EARNiNGs
EFFiCiENCy RAtiO
CAPitAL ADEqUACy RAtiO – CORE tiER 1
REtURN ON EqUity (ExCLUDiNG GOODwiLL)
r4,9bn14,6%
55,7%
10,1%
(2009: 53,5%)
(2009: 9,9%)
13,4%(2009: 13,4%)
2 Nedbank CFO_ops FA.indd 52 22/03/2011 12:00 PM
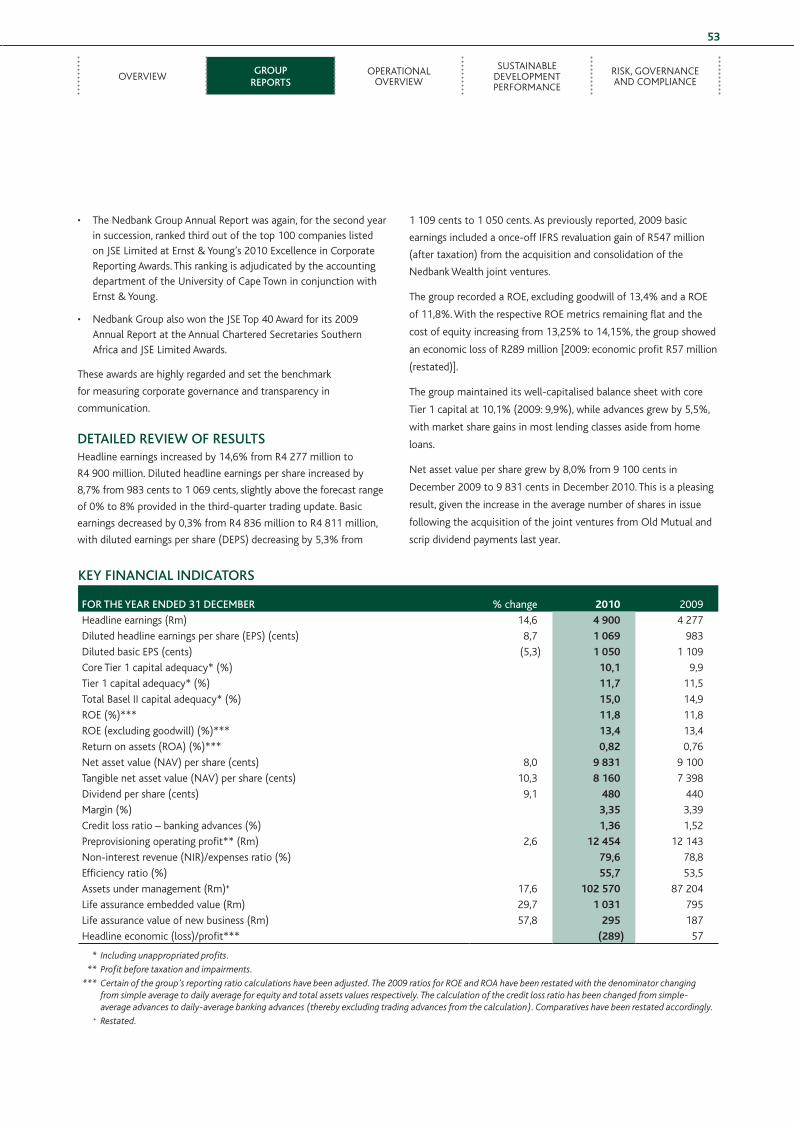
overvIewgroup
reportsoperatIonal
overvIew
sustaInable development performance
rIsk, governance and complIance
53
• the nedbank group annual report was again, for the second year in succession, ranked third out of the top 100 companies listed on Jse limited at ernst & young’s 2010 excellence in corporate reporting awards. this ranking is adjudicated by the accounting department of the university of cape town in conjunction with ernst & young.
• nedbank group also won the Jse top 40 award for its 2009 annual report at the annual chartered secretaries southern africa and Jse limited awards.
these awards are highly regarded and set the benchmark
for measuring corporate governance and transparency in
communication.
DetaileD review oF resultsheadline earnings increased by 14,6% from r4 277 million to
r4 900 million. diluted headline earnings per share increased by
8,7% from 983 cents to 1 069 cents, slightly above the forecast range
of 0% to 8% provided in the third-quarter trading update. basic
earnings decreased by 0,3% from r4 836 million to r4 811 million,
with diluted earnings per share (deps) decreasing by 5,3% from
1 109 cents to 1 050 cents. as previously reported, 2009 basic
earnings included a once-off Ifrs revaluation gain of r547 million
(after taxation) from the acquisition and consolidation of the
nedbank wealth joint ventures.
the group recorded a roe, excluding goodwill of 13,4% and a roe
of 11,8%. with the respective roe metrics remaining flat and the
cost of equity increasing from 13,25% to 14,15%, the group showed
an economic loss of r289 million [2009: economic profit r57 million
(restated)].
the group maintained its well-capitalised balance sheet with core
tier 1 capital at 10,1% (2009: 9,9%), while advances grew by 5,5%,
with market share gains in most lending classes aside from home
loans.
net asset value per share grew by 8,0% from 9 100 cents in
december 2009 to 9 831 cents in december 2010. this is a pleasing
result, given the increase in the average number of shares in issue
following the acquisition of the joint ventures from old mutual and
scrip dividend payments last year.
key Financial inDicators
For the year enDeD 31 December % change 2010 2009
headline earnings (rm) 14,6 4 900 4 277
diluted headline earnings per share (eps) (cents) 8,7 1 069 983
diluted basic eps (cents) (5,3) 1 050 1 109
core tier 1 capital adequacy* (%) 10,1 9,9
tier 1 capital adequacy* (%) 11,7 11,5
total basel II capital adequacy* (%) 15,0 14,9
roe (%)*** 11,8 11,8
roe (excluding goodwill) (%)*** 13,4 13,4
return on assets (roa) (%)*** 0,82 0,76
net asset value (nav) per share (cents) 8,0 9 831 9 100
tangible net asset value (nav) per share (cents) 10,3 8 160 7 398
dividend per share (cents) 9,1 480 440
margin (%) 3,35 3,39
credit loss ratio – banking advances (%) 1,36 1,52
preprovisioning operating profit** (rm) 2,6 12 454 12 143
non-interest revenue (nIr)/expenses ratio (%) 79,6 78,8
efficiency ratio (%) 55,7 53,5
assets under management (rm)+ 17,6 102 570 87 204
life assurance embedded value (rm) 29,7 1 031 795
life assurance value of new business (rm) 57,8 295 187
headline economic (loss)/profit*** (289) 57
* Includingunappropriatedprofits.
** Profitbeforetaxationandimpairments.
*** Certainofthegroup’sreportingratiocalculationshavebeenadjusted.The2009ratiosforROEandROAhavebeenrestatedwiththedenominatorchangingfromsimpleaveragetodailyaverageforequityandtotalassetsvaluesrespectively.Thecalculationofthecreditlossratiohasbeenchangedfromsimple-averageadvancestodaily-averagebankingadvances(therebyexcludingtradingadvancesfromthecalculation).Comparativeshavebeenrestatedaccordingly.
+ Restated.
2 Nedbank CFO_ops FA.indd 53 22/03/2011 12:00 PM
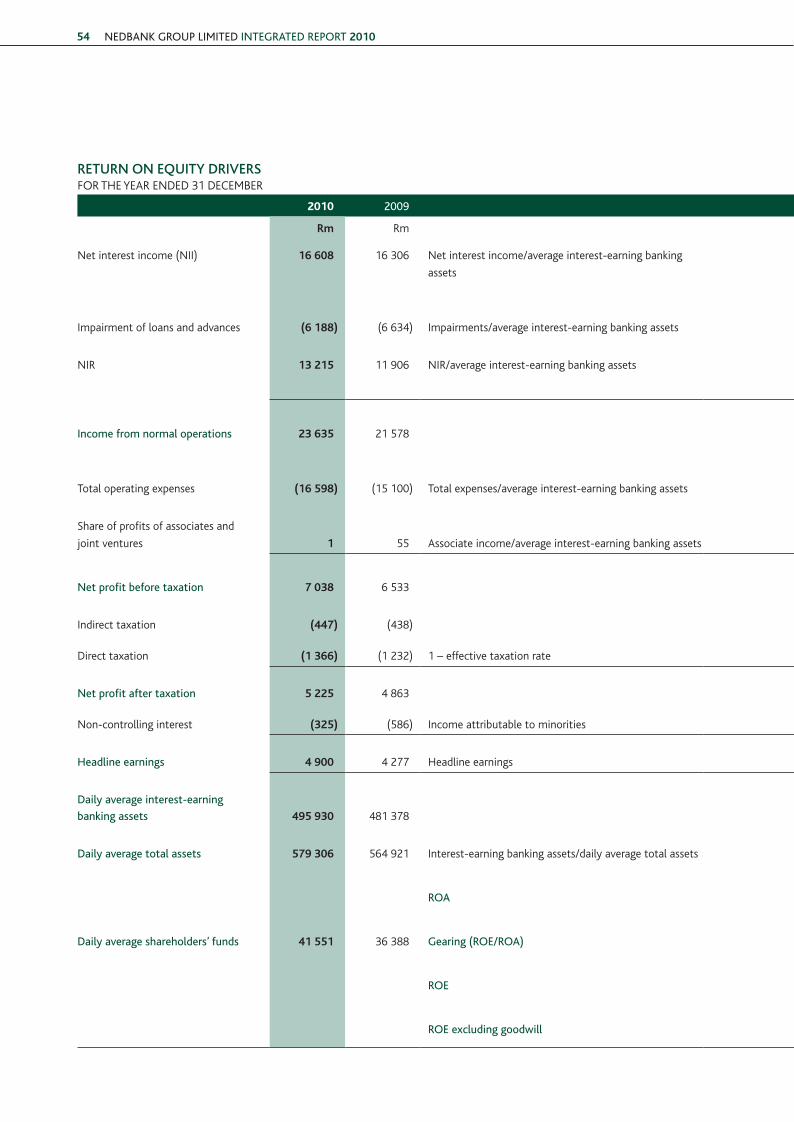
NEDBANK GROUP LimitED iNtEGRAtED REPORt 201054
return on equity Drivers for the year ended 31 december
2010 2009 2010 2009
Rm rm
net interest income (nII) 16 608 16 306 net interest income/average interest-earning banking
assets
less
impairments/
nii less
Impairments/
nII
Impairment of loans and advances (6 188) (6 634) Impairments/average interest-earning banking assets 37,3%
add addnIr 13 215 11 906 nIr/average interest-earning banking assets niR/expenses nIr/expenses
income from normal operations 23 635 21 578
less
Efficiency
ratio less efficiency ratio
total operating expenses (16 598) (15 100) total expenses/average interest-earning banking assets
add addshare of profits of associates and
joint ventures 1 55 associate income/average interest-earning banking assets
Net profit before taxation 7 038 6 533
Indirect taxation (447) (438) multiply multiply
direct taxation (1 366) (1 232) 1 – effective taxation rate
Net profit after taxation 5 225 4 863 multiply multiply
non-controlling interest (325) (586) Income attributable to minorities
headline earnings 4 900 4 277 headline earnings
Daily average interest-earning
banking assets 495 930 481 378 multiply multiply
Daily average total assets 579 306 564 921 Interest-earning banking assets/daily average total assets
= =
ROA
multiply multiply
Daily average shareholders’ funds 41 551 36 388 Gearing (ROE/ROA)
= =
ROE
ROE excluding goodwill
2 Nedbank CFO_ops FA.indd 54 22/03/2011 12:00 PM
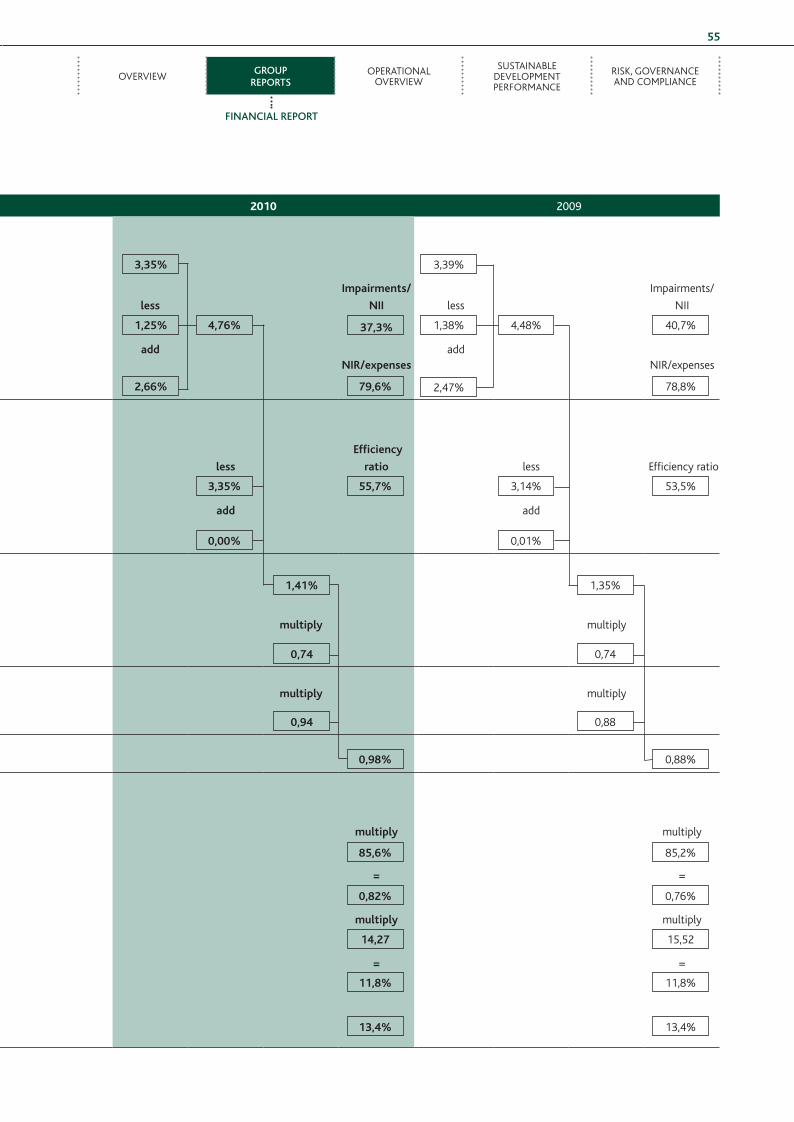
overvIewgroup
reportsoperatIonal
overvIew
sustaInable development performance
rIsk, governance and complIance
55
2010 2009 2010 2009
Rm rm
net interest income (nII) 16 608 16 306 net interest income/average interest-earning banking
assets
less
impairments/
nii less
Impairments/
nII
Impairment of loans and advances (6 188) (6 634) Impairments/average interest-earning banking assets 37,3%
add addnIr 13 215 11 906 nIr/average interest-earning banking assets niR/expenses nIr/expenses
income from normal operations 23 635 21 578
less
Efficiency
ratio less efficiency ratio
total operating expenses (16 598) (15 100) total expenses/average interest-earning banking assets
add addshare of profits of associates and
joint ventures 1 55 associate income/average interest-earning banking assets
Net profit before taxation 7 038 6 533
Indirect taxation (447) (438) multiply multiply
direct taxation (1 366) (1 232) 1 – effective taxation rate
Net profit after taxation 5 225 4 863 multiply multiply
non-controlling interest (325) (586) Income attributable to minorities
headline earnings 4 900 4 277 headline earnings
Daily average interest-earning
banking assets 495 930 481 378 multiply multiply
Daily average total assets 579 306 564 921 Interest-earning banking assets/daily average total assets
= =
ROA
multiply multiply
Daily average shareholders’ funds 41 551 36 388 Gearing (ROE/ROA)
= =
ROE
ROE excluding goodwill
3,35% 3,39%
1,25% 4,76% 1,38% 4,48% 40,7%
3,35% 55,7% 3,14% 53,5%
0,98% 0,88%
85,6% 85,2%
0,82% 0,76%
14,27 15,52
11,8% 11,8%
13,4% 13,4%
0,00% 0,01%
1,41% 1,35%
0,74 0,74
0,94 0,88
79,6% 78,8%2,66% 2,47%
Financial report
2 Nedbank CFO_ops FA.indd 55 22/03/2011 12:00 PM
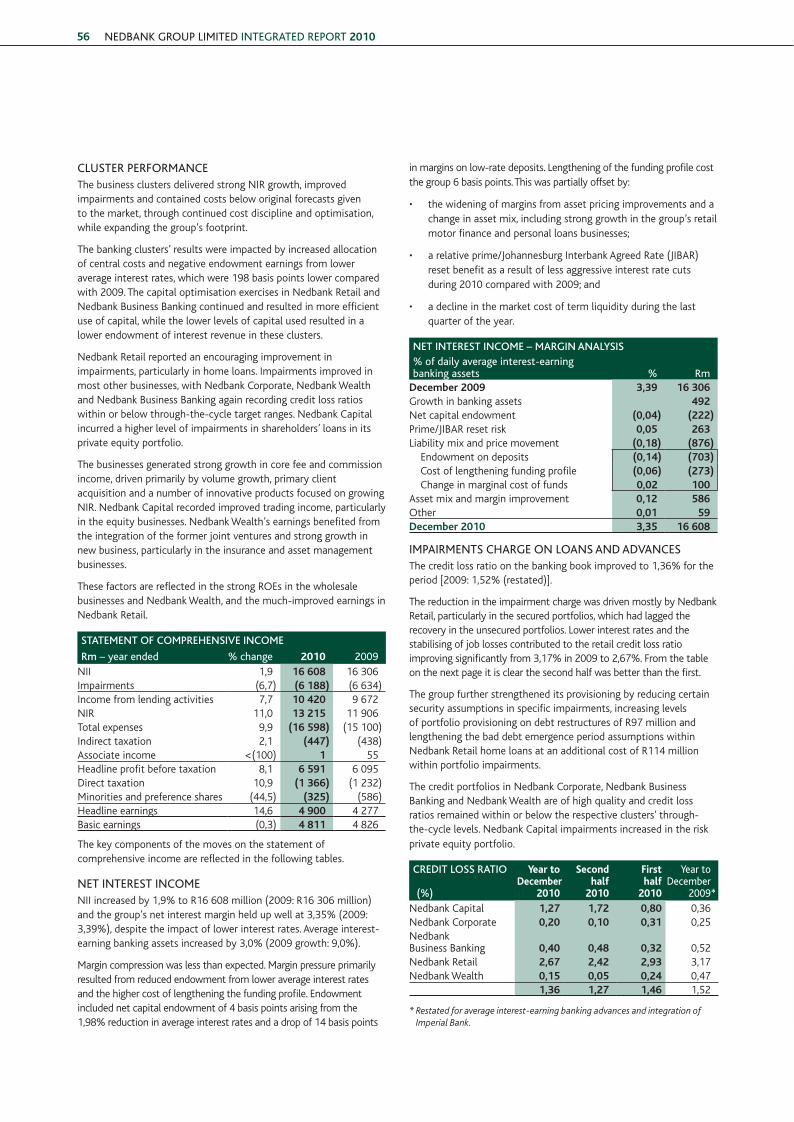
NEDBANK GROUP LimitED iNtEGRAtED REPORt 201056
CLUstER PERFORmANCEthe business clusters delivered strong nIr growth, improved impairments and contained costs below original forecasts given to the market, through continued cost discipline and optimisation, while expanding the group’s footprint.
the banking clusters’ results were impacted by increased allocation of central costs and negative endowment earnings from lower average interest rates, which were 198 basis points lower compared with 2009. the capital optimisation exercises in nedbank retail and nedbank business banking continued and resulted in more efficient use of capital, while the lower levels of capital used resulted in a lower endowment of interest revenue in these clusters.
nedbank retail reported an encouraging improvement in impairments, particularly in home loans. Impairments improved in most other businesses, with nedbank corporate, nedbank wealth and nedbank business banking again recording credit loss ratios within or below through-the-cycle target ranges. nedbank capital incurred a higher level of impairments in shareholders’ loans in its private equity portfolio.
the businesses generated strong growth in core fee and commission income, driven primarily by volume growth, primary client acquisition and a number of innovative products focused on growing nIr. nedbank capital recorded improved trading income, particularly in the equity businesses. nedbank wealth’s earnings benefited from the integration of the former joint ventures and strong growth in new business, particularly in the insurance and asset management businesses.
these factors are reflected in the strong roes in the wholesale businesses and nedbank wealth, and the much-improved earnings in nedbank retail.
statement oF comprehensive income
rm – year ended % change 2010 2009nII 1,9 16 608 16 306 Impairments (6,7) (6 188) (6 634) Income from lending activities 7,7 10 420 9 672 nIr 11,0 13 215 11 906 total expenses 9,9 (16 598) (15 100) Indirect taxation 2,1 (447) (438)associate income <(100) 1 55headline profit before taxation 8,1 6 591 6 095 direct taxation 10,9 (1 366) (1 232) minorities and preference shares (44,5) (325) (586) headline earnings 14,6 4 900 4 277 basic earnings (0,3) 4 811 4 826
the key components of the moves on the statement of comprehensive income are reflected in the following tables.
NEt iNtEREst iNCOmEnII increased by 1,9% to r16 608 million (2009: r16 306 million) and the group’s net interest margin held up well at 3,35% (2009: 3,39%), despite the impact of lower interest rates. average interest-earning banking assets increased by 3,0% (2009 growth: 9,0%).
margin compression was less than expected. margin pressure primarily resulted from reduced endowment from lower average interest rates and the higher cost of lengthening the funding profile. endowment included net capital endowment of 4 basis points arising from the 1,98% reduction in average interest rates and a drop of 14 basis points
in margins on low-rate deposits. lengthening of the funding profile cost the group 6 basis points. this was partially offset by:
• the widening of margins from asset pricing improvements and a change in asset mix, including strong growth in the group’s retail motor finance and personal loans businesses;
• a relative prime/Johannesburg Interbank agreed rate (JIbar) reset benefit as a result of less aggressive interest rate cuts during 2010 compared with 2009; and
• a decline in the market cost of term liquidity during the last quarter of the year.
net interest income – margin analysis% of daily average interest-earning banking assets % Rm
December 2009 3,39 16 306growth in banking assets 492net capital endowment (0,04) (222)prime/JIbar reset risk 0,05 263liability mix and price movement (0,18) (876)
endowment on deposits (0,14) (703)cost of lengthening funding profile (0,06) (273)change in marginal cost of funds 0,02 100
asset mix and margin improvement 0,12 586other 0,01 59December 2010 3,35 16 608
imPAiRmENts ChARGE ON LOANs AND ADvANCEsthe credit loss ratio on the banking book improved to 1,36% for the period [2009: 1,52% (restated)].
the reduction in the impairment charge was driven mostly by nedbank retail, particularly in the secured portfolios, which had lagged the recovery in the unsecured portfolios. lower interest rates and the stabilising of job losses contributed to the retail credit loss ratio improving significantly from 3,17% in 2009 to 2,67%. from the table on the next page it is clear the second half was better than the first.
the group further strengthened its provisioning by reducing certain security assumptions in specific impairments, increasing levels of portfolio provisioning on debt restructures of r97 million and lengthening the bad debt emergence period assumptions within nedbank retail home loans at an additional cost of r114 million within portfolio impairments.
the credit portfolios in nedbank corporate, nedbank business banking and nedbank wealth are of high quality and credit loss ratios remained within or below the respective clusters’ through-the-cycle levels. nedbank capital impairments increased in the risk private equity portfolio.
creDit loss ratio
(%)
Year to December
2010
Second half
2010
First half
2010
year to December
2009* nedbank capital 1,27 1,72 0,80 0,36nedbank corporate 0,20 0,10 0,31 0,25nedbank business banking 0,40 0,48 0,32 0,52nedbank retail 2,67 2,42 2,93 3,17nedbank wealth 0,15 0,05 0,24 0,47
1,36 1,27 1,46 1,52
*Restatedforaverageinterest-earningbankingadvancesandintegrationofImperialBank.
2 Nedbank CFO_ops FA.indd 56 22/03/2011 12:00 PM
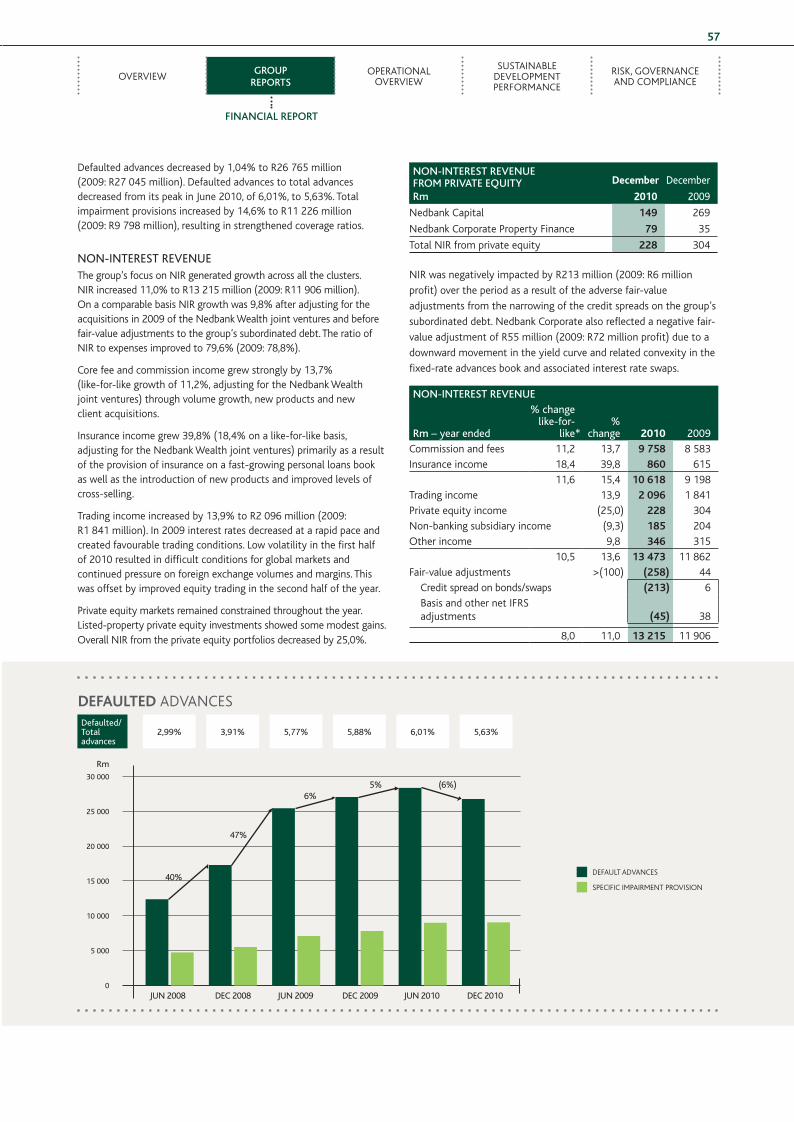
overvIewgroup
reportsoperatIonal
overvIew
sustaInable development performance
rIsk, governance and complIance
57
defaulted advances decreased by 1,04% to r26 765 million (2009: r27 045 million). defaulted advances to total advances decreased from its peak in June 2010, of 6,01%, to 5,63%. total impairment provisions increased by 14,6% to r11 226 million (2009: r9 798 million), resulting in strengthened coverage ratios.
NON-iNtEREst REvENUEthe group’s focus on nIr generated growth across all the clusters. nIr increased 11,0% to r13 215 million (2009: r11 906 million). on a comparable basis nIr growth was 9,8% after adjusting for the acquisitions in 2009 of the nedbank wealth joint ventures and before fair-value adjustments to the group’s subordinated debt. the ratio of nIr to expenses improved to 79,6% (2009: 78,8%).
core fee and commission income grew strongly by 13,7% (like-for-like growth of 11,2%, adjusting for the nedbank wealth joint ventures) through volume growth, new products and new client acquisitions.
Insurance income grew 39,8% (18,4% on a like-for-like basis, adjusting for the nedbank wealth joint ventures) primarily as a result of the provision of insurance on a fast-growing personal loans book as well as the introduction of new products and improved levels of cross-selling.
trading income increased by 13,9% to r2 096 million (2009: r1 841 million). In 2009 interest rates decreased at a rapid pace and created favourable trading conditions. low volatility in the first half of 2010 resulted in difficult conditions for global markets and continued pressure on foreign exchange volumes and margins. this was offset by improved equity trading in the second half of the year.
private equity markets remained constrained throughout the year. listed-property private equity investments showed some modest gains. overall nIr from the private equity portfolios decreased by 25,0%.
non-interest revenue From private equity rm
December
2010
December
2009
nedbank capital 149 269
nedbank corporate property finance 79 35
total nIr from private equity 228 304
nIr was negatively impacted by r213 million (2009: r6 million
profit) over the period as a result of the adverse fair-value
adjustments from the narrowing of the credit spreads on the group’s
subordinated debt. nedbank corporate also reflected a negative fair-
value adjustment of r55 million (2009: r72 million profit) due to a
downward movement in the yield curve and related convexity in the
fixed-rate advances book and associated interest rate swaps.
non-interest revenue
rm – year ended
% changelike-for-
like* %
change 2010 2009
commission and fees 11,2 13,7 9 758 8 583Insurance income 18,4 39,8 860 615
11,6 15,4 10 618 9 198trading income 13,9 2 096 1 841 private equity income (25,0) 228 304non-banking subsidiary income (9,3) 185 204other income 9,8 346 315
10,5 13,6 13 473 11 862fair-value adjustments >(100) (258) 44
credit spread on bonds/swaps (213) 6basis and other net Ifrs adjustments (45) 38
8,0 11,0 13 215 11 906
DEFaultED advances
Rm
Defaulted/total advances
2,99% 3,91% 5,77% 5,88% 6,01% 5,63%
default advances
specIfIc ImpaIrment provIsIon
30 000
25 000
20 000
15 000
10 000
5 000
0JUN 2008
40%
47%
6%5% (6%)
DEC 2008 JUN 2009 DEC 2009 JUN 2010 DEC 2010
Financial report
2 Nedbank CFO_ops FA.indd 57 22/03/2011 12:00 PM
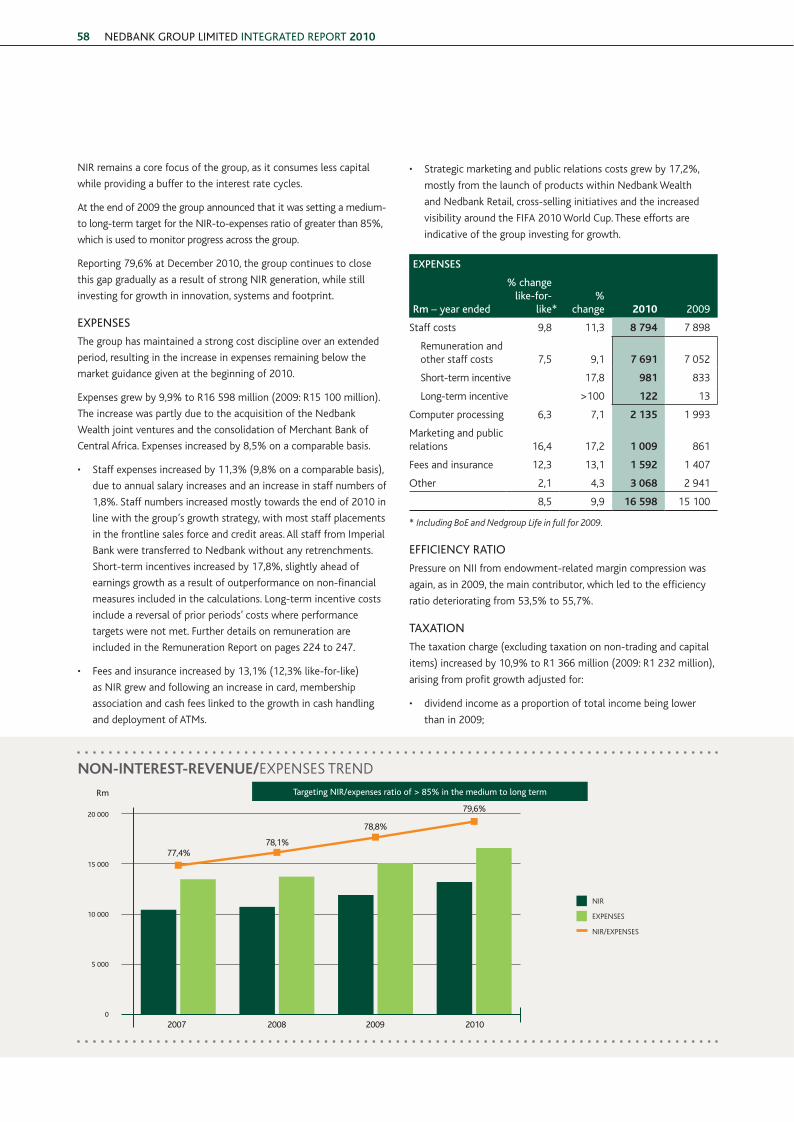
NEDBANK GROUP LimitED iNtEGRAtED REPORt 201058
nIr remains a core focus of the group, as it consumes less capital
while providing a buffer to the interest rate cycles.
at the end of 2009 the group announced that it was setting a medium-
to long-term target for the nIr-to-expenses ratio of greater than 85%,
which is used to monitor progress across the group.
reporting 79,6% at december 2010, the group continues to close
this gap gradually as a result of strong nIr generation, while still
investing for growth in innovation, systems and footprint.
ExPENsEs
the group has maintained a strong cost discipline over an extended
period, resulting in the increase in expenses remaining below the
market guidance given at the beginning of 2010.
expenses grew by 9,9% to r16 598 million (2009: r15 100 million).
the increase was partly due to the acquisition of the nedbank
wealth joint ventures and the consolidation of merchant bank of
central africa. expenses increased by 8,5% on a comparable basis.
• staff expenses increased by 11,3% (9,8% on a comparable basis),
due to annual salary increases and an increase in staff numbers of
1,8%. staff numbers increased mostly towards the end of 2010 in
line with the group’s growth strategy, with most staff placements
in the frontline sales force and credit areas. all staff from Imperial
bank were transferred to nedbank without any retrenchments.
short-term incentives increased by 17,8%, slightly ahead of
earnings growth as a result of outperformance on non-financial
measures included in the calculations. long-term incentive costs
include a reversal of prior periods’ costs where performance
targets were not met. further details on remuneration are
included in the remuneration report on pages 224 to 247.
• fees and insurance increased by 13,1% (12,3% like-for-like)
as nIr grew and following an increase in card, membership
association and cash fees linked to the growth in cash handling
and deployment of atms.
• strategic marketing and public relations costs grew by 17,2%,
mostly from the launch of products within nedbank wealth
and nedbank retail, cross-selling initiatives and the increased
visibility around the fIfa 2010 world cup. these efforts are
indicative of the group investing for growth.
expenses
rm – year ended
% changelike-for-
like* %
change 2010 2009
staff costs 9,8 11,3 8 794 7 898
remuneration and other staff costs 7,5 9,1 7 691 7 052
short-term incentive 17,8 981 833
long-term incentive >100 122 13
computer processing 6,3 7,1 2 135 1 993
marketing and public relations 16,4 17,2 1 009 861
fees and insurance 12,3 13,1 1 592 1 407
other 2,1 4,3 3 068 2 941
8,5 9,9 16 598 15 100
* IncludingBoEandNedgroupLifeinfullfor2009.
EFFiCiENCy RAtiO
pressure on nII from endowment-related margin compression was
again, as in 2009, the main contributor, which led to the efficiency
ratio deteriorating from 53,5% to 55,7%.
tAxAtiON
the taxation charge (excluding taxation on non-trading and capital
items) increased by 10,9% to r1 366 million (2009: r1 232 million),
arising from profit growth adjusted for:
• dividend income as a proportion of total income being lower
than in 2009;
non-intEREst-REvEnuE/expenses trend
Rm targeting NiR/expenses ratio of > 85% in the medium to long term
nIr
expenses
nIr/expenses
20 000
15 000
10 000
5 000
0
2007 2008 2009 2010
78,1%
78,8%
79,6%
77,4%
2 Nedbank CFO_ops FA.indd 58 22/03/2011 12:00 PM
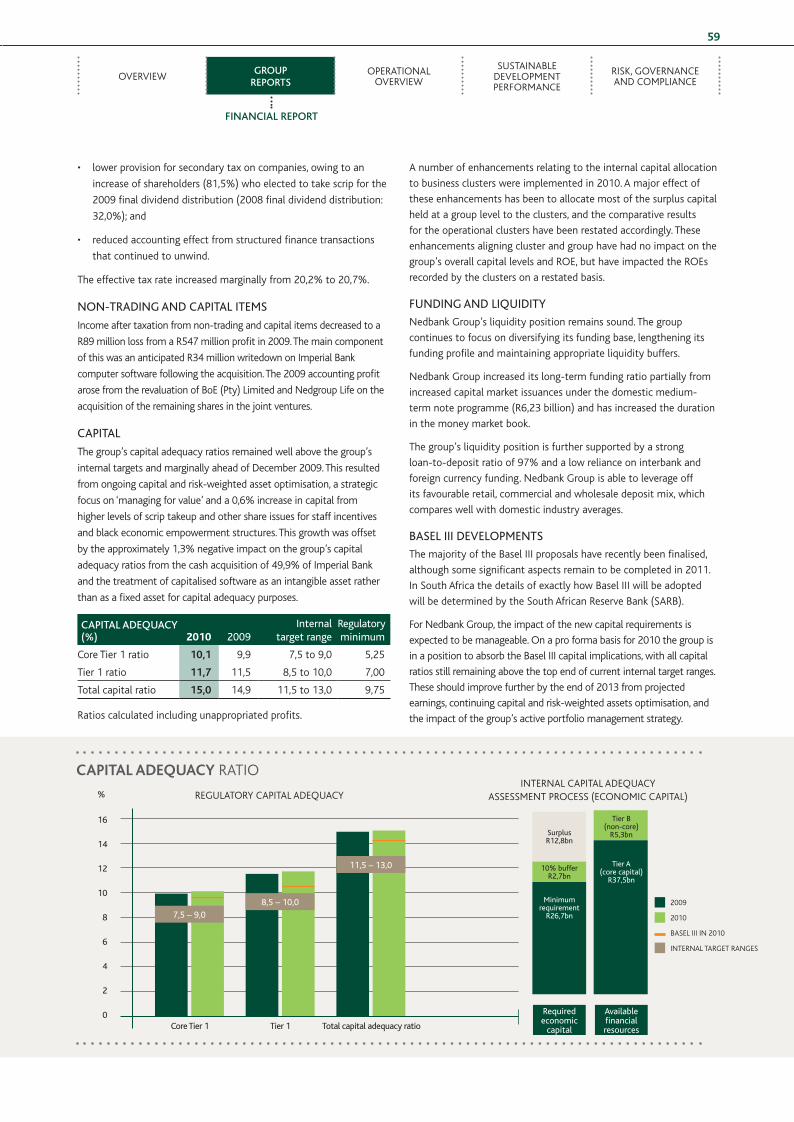
overvIewgroup
reportsoperatIonal
overvIew
sustaInable development performance
rIsk, governance and complIance
59
• lower provision for secondary tax on companies, owing to an
increase of shareholders (81,5%) who elected to take scrip for the
2009 final dividend distribution (2008 final dividend distribution:
32,0%); and
• reduced accounting effect from structured finance transactions
that continued to unwind.
the effective tax rate increased marginally from 20,2% to 20,7%.
NON-tRADiNG AND CAPitAL itEms
Income after taxation from non-trading and capital items decreased to a
r89 million loss from a r547 million profit in 2009. the main component
of this was an anticipated r34 million writedown on Imperial bank
computer software following the acquisition. the 2009 accounting profit
arose from the revaluation of boe (pty) limited and nedgroup life on the
acquisition of the remaining shares in the joint ventures.
CAPitAL
the group’s capital adequacy ratios remained well above the group’s
internal targets and marginally ahead of december 2009. this resulted
from ongoing capital and risk-weighted asset optimisation, a strategic
focus on ‘managing for value’ and a 0,6% increase in capital from
higher levels of scrip takeup and other share issues for staff incentives
and black economic empowerment structures. this growth was offset
by the approximately 1,3% negative impact on the group’s capital
adequacy ratios from the cash acquisition of 49,9% of Imperial bank
and the treatment of capitalised software as an intangible asset rather
than as a fixed asset for capital adequacy purposes.
capital aDequacy (%) 2010 2009
internal target range
Regulatory minimum
core tier 1 ratio 10,1 9,9 7,5 to 9,0 5,25
tier 1 ratio 11,7 11,5 8,5 to 10,0 7,00
total capital ratio 15,0 14,9 11,5 to 13,0 9,75
ratios calculated including unappropriated profits.
a number of enhancements relating to the internal capital allocation
to business clusters were implemented in 2010. a major effect of
these enhancements has been to allocate most of the surplus capital
held at a group level to the clusters, and the comparative results
for the operational clusters have been restated accordingly. these
enhancements aligning cluster and group have had no impact on the
group’s overall capital levels and roe, but have impacted the roes
recorded by the clusters on a restated basis.
FUNDiNG AND LiqUiDity
nedbank group’s liquidity position remains sound. the group
continues to focus on diversifying its funding base, lengthening its
funding profile and maintaining appropriate liquidity buffers.
nedbank group increased its long-term funding ratio partially from
increased capital market issuances under the domestic medium-
term note programme (r6,23 billion) and has increased the duration
in the money market book.
the group’s liquidity position is further supported by a strong
loan-to-deposit ratio of 97% and a low reliance on interbank and
foreign currency funding. nedbank group is able to leverage off
its favourable retail, commercial and wholesale deposit mix, which
compares well with domestic industry averages.
BAsEL iii DEvELOPmENts
the majority of the basel III proposals have recently been finalised,
although some significant aspects remain to be completed in 2011.
In south africa the details of exactly how basel III will be adopted
will be determined by the south african reserve bank (sarb).
for nedbank group, the impact of the new capital requirements is
expected to be manageable. on a pro forma basis for 2010 the group is
in a position to absorb the basel III capital implications, with all capital
ratios still remaining above the top end of current internal target ranges.
these should improve further by the end of 2013 from projected
earnings, continuing capital and risk-weighted assets optimisation, and
the impact of the group’s active portfolio management strategy.
Financial report
the group will continue to invest to generate sustainable revenue
growth underpinned by ongoing cost optimisation and efficiency
improvements. growing the bank’s overall franchise and maintaining
momentum on the turnaround in the retail cluster, supported by
a liquid and well-capitalised balance sheet, are key to delivering
sustainable growth.
margins should widen slightly, given that interest rates are expected
to remain unchanged and hence the negative effect of assets
repricing quicker than liabilities out to three months will reduce. In
addition the cost of term liquidity is expected to decline as more
expensive deposits mature and as below trend economic growth
continues, albeit at higher levels than last year. overall advances
growth is expected be in the mid to upper single digits.
Impairments are expected to continue reducing in line with the
improved quality of assets supported by asset pricing on new
advances that appropriately reflects risk and the related cost of
funds. the credit loss ratio is currently expected to reduce but in
2011 to still remain above the group’s target range.
transactional volumes are expected to increase as the economy
improves and the group focus on growing primary clients is
maintained.
the group’s medium-term targets remain unchanged and are
included, with our current outlook for performance against these
targets for the 2011 year, in the table below:
capital aDEquacy ratIo
regulatory capItal adequacyInternal capItal adequacy
assessment process (economIc capItal)%
2009
2010
basel III In 2010
Internal target ranges
Core tier 1 tier 1 total capital adequacy ratio
7,5 – 9,08,5 – 10,0
11,5 – 13,0
Required economic
capital
surplus R12,8bn
tier B (non-core)
R5,3bn
tier A (core capital)
R37,5bn
10% buffer R2,7bn
minimum requirement
R26,7bn
Available financial resources
16
14
12
10
8
6
4
2
0
2 Nedbank CFO_ops FA.indd 59 22/03/2011 12:00 PM
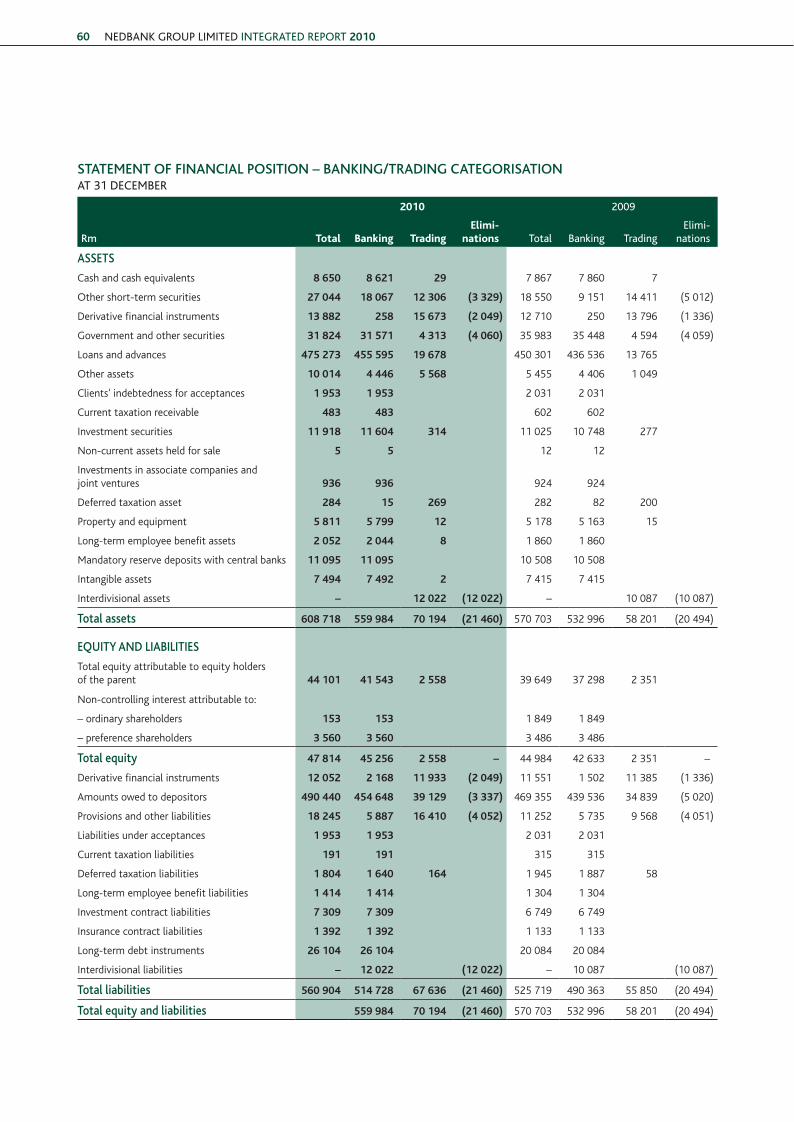
NEDBANK GROUP LimitED iNtEGRAtED REPORt 201060
statement oF Financial position – banking/traDing categorisationAt 31 DECEmBER
rm
2010 2009
Total Banking TradingElimi-
nations total Banking tradingElimi-
nations
assets
cash and cash equivalents 8 650 8 621 29 7 867 7 860 7
other short-term securities 27 044 18 067 12 306 (3 329) 18 550 9 151 14 411 (5 012)
derivative financial instruments 13 882 258 15 673 (2 049) 12 710 250 13 796 (1 336)
government and other securities 31 824 31 571 4 313 (4 060) 35 983 35 448 4 594 (4 059)
loans and advances 475 273 455 595 19 678 450 301 436 536 13 765
other assets 10 014 4 446 5 568 5 455 4 406 1 049
clients’ indebtedness for acceptances 1 953 1 953 2 031 2 031
current taxation receivable 483 483 602 602
Investment securities 11 918 11 604 314 11 025 10 748 277
non-current assets held for sale 5 5 12 12
Investments in associate companies and joint ventures 936 936 924 924
deferred taxation asset 284 15 269 282 82 200
property and equipment 5 811 5 799 12 5 178 5 163 15
long-term employee benefit assets 2 052 2 044 8 1 860 1 860
mandatory reserve deposits with central banks 11 095 11 095 10 508 10 508
Intangible assets 7 494 7 492 2 7 415 7 415
Interdivisional assets – 12 022 (12 022) – 10 087 (10 087)
total assets 608 718 559 984 70 194 (21 460) 570 703 532 996 58 201 (20 494)
equity anD liabilities
total equity attributable to equity holders of the parent 44 101 41 543 2 558 39 649 37 298 2 351
non-controlling interest attributable to:
– ordinary shareholders 153 153 1 849 1 849
– preference shareholders 3 560 3 560 3 486 3 486
total equity 47 814 45 256 2 558 – 44 984 42 633 2 351 –
derivative financial instruments 12 052 2 168 11 933 (2 049) 11 551 1 502 11 385 (1 336)
amounts owed to depositors 490 440 454 648 39 129 (3 337) 469 355 439 536 34 839 (5 020)
provisions and other liabilities 18 245 5 887 16 410 (4 052) 11 252 5 735 9 568 (4 051)
liabilities under acceptances 1 953 1 953 2 031 2 031
current taxation liabilities 191 191 315 315
deferred taxation liabilities 1 804 1 640 164 1 945 1 887 58
long-term employee benefit liabilities 1 414 1 414 1 304 1 304
Investment contract liabilities 7 309 7 309 6 749 6 749
Insurance contract liabilities 1 392 1 392 1 133 1 133
long-term debt instruments 26 104 26 104 20 084 20 084
Interdivisional liabilities – 12 022 (12 022) – 10 087 (10 087)
total liabilities 560 904 514 728 67 636 (21 460) 525 719 490 363 55 850 (20 494)
total equity and liabilities 559 984 70 194 (21 460) 570 703 532 996 58 201 (20 494)
2 Nedbank CFO_ops FA.indd 60 22/03/2011 12:00 PM
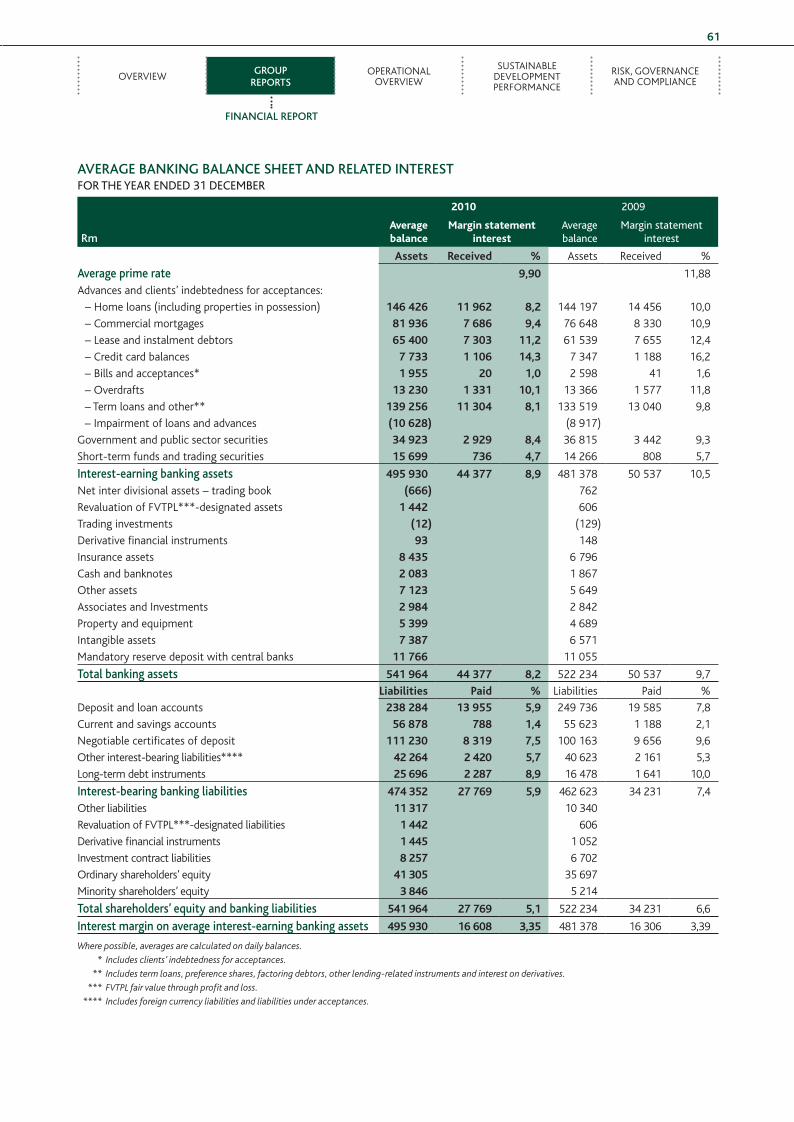
overvIewgroup
reportsoperatIonal
overvIew
sustaInable development performance
rIsk, governance and complIance
61
Financial report
average banking balance sheet anD relateD interestFOR thE yEAR ENDED 31 DECEmBER
rm
2010 2009
Averagebalance
Margin statement interest
Averagebalance
margin statement interest
assets Received % assets received %
average prime rate 9,90 11,88
advances and clients’ indebtedness for acceptances:
– home loans (including properties in possession) 146 426 11 962 8,2 144 197 14 456 10,0
– commercial mortgages 81 936 7 686 9,4 76 648 8 330 10,9
– lease and instalment debtors 65 400 7 303 11,2 61 539 7 655 12,4
– credit card balances 7 733 1 106 14,3 7 347 1 188 16,2
– bills and acceptances* 1 955 20 1,0 2 598 41 1,6
– overdrafts 13 230 1 331 10,1 13 366 1 577 11,8
– term loans and other** 139 256 11 304 8,1 133 519 13 040 9,8
– Impairment of loans and advances (10 628) (8 917)
government and public sector securities 34 923 2 929 8,4 36 815 3 442 9,3
short-term funds and trading securities 15 699 736 4,7 14 266 808 5,7
interest-earning banking assets 495 930 44 377 8,9 481 378 50 537 10,5
net inter divisional assets – trading book (666) 762
revaluation of fvtpl***-designated assets 1 442 606
trading investments (12) (129)
derivative financial instruments 93 148
Insurance assets 8 435 6 796
cash and banknotes 2 083 1 867
other assets 7 123 5 649
associates and Investments 2 984 2 842
property and equipment 5 399 4 689
Intangible assets 7 387 6 571
mandatory reserve deposit with central banks 11 766 11 055
total banking assets 541 964 44 377 8,2 522 234 50 537 9,7
liabilities paid % liabilities paid %
deposit and loan accounts 238 284 13 955 5,9 249 736 19 585 7,8
current and savings accounts 56 878 788 1,4 55 623 1 188 2,1
negotiable certificates of deposit 111 230 8 319 7,5 100 163 9 656 9,6
other interest-bearing liabilities**** 42 264 2 420 5,7 40 623 2 161 5,3
long-term debt instruments 25 696 2 287 8,9 16 478 1 641 10,0
interest-bearing banking liabilities 474 352 27 769 5,9 462 623 34 231 7,4
other liabilities 11 317 10 340
revaluation of fvtpl***-designated liabilities 1 442 606
derivative financial instruments 1 445 1 052
Investment contract liabilities 8 257 6 702
ordinary shareholders’ equity 41 305 35 697
minority shareholders’ equity 3 846 5 214
total shareholders’ equity and banking liabilities 541 964 27 769 5,1 522 234 34 231 6,6
interest margin on average interest-earning banking assets 495 930 16 608 3,35 481 378 16 306 3,39
Wherepossible,averagesarecalculatedondailybalances.
* Includesclients’indebtednessforacceptances.
** Includestermloans,preferenceshares,factoringdebtors,otherlending-relatedinstrumentsandinterestonderivatives.
*** FVTPLfairvaluethroughprofitandloss.
**** Includesforeigncurrencyliabilitiesandliabilitiesunderacceptances.
2 Nedbank CFO_ops FA.indd 61 22/03/2011 12:00 PM
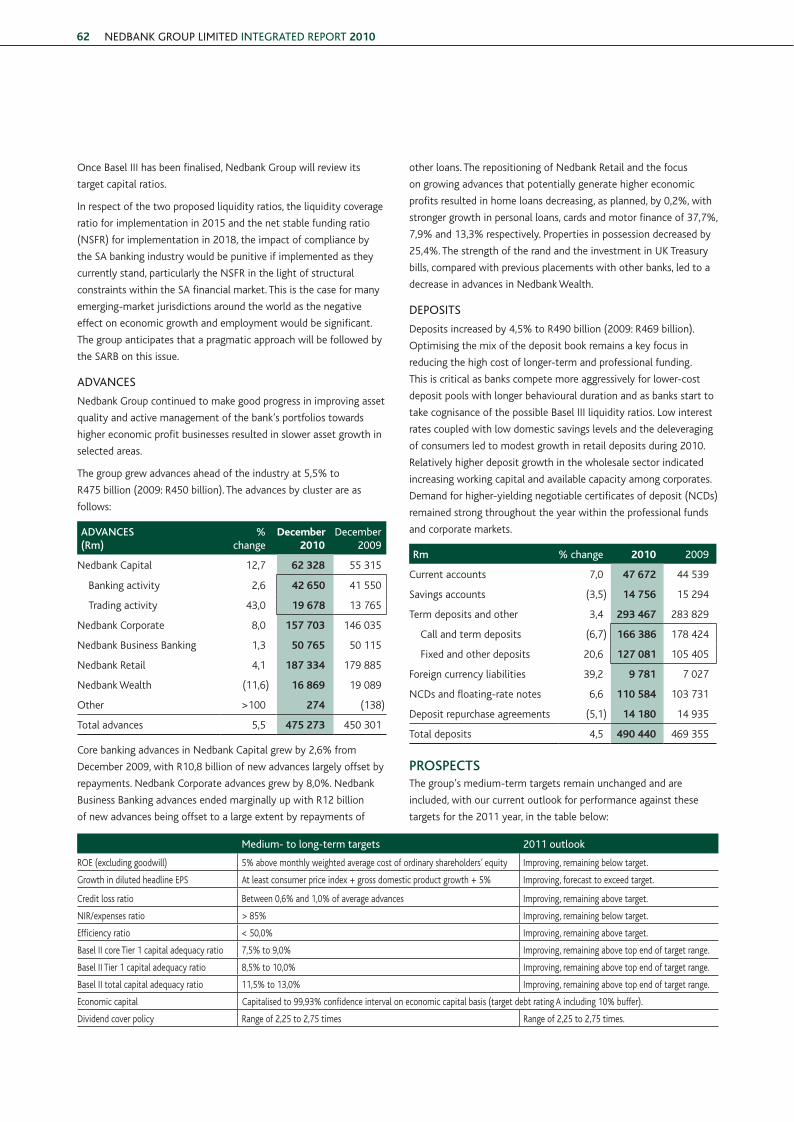
NEDBANK GROUP LimitED iNtEGRAtED REPORt 201062
once basel III has been finalised, nedbank group will review its
target capital ratios.
In respect of the two proposed liquidity ratios, the liquidity coverage
ratio for implementation in 2015 and the net stable funding ratio
(nsfr) for implementation in 2018, the impact of compliance by
the sa banking industry would be punitive if implemented as they
currently stand, particularly the nsfr in the light of structural
constraints within the sa financial market. this is the case for many
emerging-market jurisdictions around the world as the negative
effect on economic growth and employment would be significant.
the group anticipates that a pragmatic approach will be followed by
the sarb on this issue.
ADvANCEs
nedbank group continued to make good progress in improving asset
quality and active management of the bank’s portfolios towards
higher economic profit businesses resulted in slower asset growth in
selected areas.
the group grew advances ahead of the industry at 5,5% to
r475 billion (2009: r450 billion). the advances by cluster are as
follows:
aDvances (rm)
% change
December 2010
December 2009
nedbank capital 12,7 62 328 55 315
banking activity 2,6 42 650 41 550
trading activity 43,0 19 678 13 765
nedbank corporate 8,0 157 703 146 035
nedbank business banking 1,3 50 765 50 115
nedbank retail 4,1 187 334 179 885
nedbank wealth (11,6) 16 869 19 089
other >100 274 (138)
total advances 5,5 475 273 450 301
core banking advances in nedbank capital grew by 2,6% from
december 2009, with r10,8 billion of new advances largely offset by
repayments. nedbank corporate advances grew by 8,0%. nedbank
business banking advances ended marginally up with r12 billion
of new advances being offset to a large extent by repayments of
other loans. the repositioning of nedbank retail and the focus
on growing advances that potentially generate higher economic
profits resulted in home loans decreasing, as planned, by 0,2%, with
stronger growth in personal loans, cards and motor finance of 37,7%,
7,9% and 13,3% respectively. properties in possession decreased by
25,4%. the strength of the rand and the investment in uk treasury
bills, compared with previous placements with other banks, led to a
decrease in advances in nedbank wealth.
DEPOsits
deposits increased by 4,5% to r490 billion (2009: r469 billion).
optimising the mix of the deposit book remains a key focus in
reducing the high cost of longer-term and professional funding.
this is critical as banks compete more aggressively for lower-cost
deposit pools with longer behavioural duration and as banks start to
take cognisance of the possible basel III liquidity ratios. low interest
rates coupled with low domestic savings levels and the deleveraging
of consumers led to modest growth in retail deposits during 2010.
relatively higher deposit growth in the wholesale sector indicated
increasing working capital and available capacity among corporates.
demand for higher-yielding negotiable certificates of deposit (ncds)
remained strong throughout the year within the professional funds
and corporate markets.
rm % change 2010 2009
current accounts 7,0 47 672 44 539
savings accounts (3,5) 14 756 15 294
term deposits and other 3,4 293 467 283 829
call and term deposits (6,7) 166 386 178 424
fixed and other deposits 20,6 127 081 105 405
foreign currency liabilities 39,2 9 781 7 027
ncds and floating-rate notes 6,6 110 584 103 731
deposit repurchase agreements (5,1) 14 180 14 935
total deposits 4,5 490 440 469 355
prospectsthe group’s medium-term targets remain unchanged and are
included, with our current outlook for performance against these
targets for the 2011 year, in the table below:
medium- to long-term targets 2011 outlook
roe (excluding goodwill) 5% above monthly weighted average cost of ordinary shareholders’ equity Improving, remaining below target.
growth in diluted headline eps at least consumer price index + gross domestic product growth + 5% Improving, forecast to exceed target.
credit loss ratio between 0,6% and 1,0% of average advances Improving, remaining above target.
nIr/expenses ratio > 85% Improving, remaining below target.
efficiency ratio < 50,0% Improving, remaining above target.
basel II core tier 1 capital adequacy ratio 7,5% to 9,0% Improving, remaining above top end of target range.
basel II tier 1 capital adequacy ratio 8,5% to 10,0% Improving, remaining above top end of target range.
basel II total capital adequacy ratio 11,5% to 13,0% Improving, remaining above top end of target range.
economic capital capitalised to 99,93% confidence interval on economic capital basis (target debt rating a including 10% buffer).
dividend cover policy range of 2,25 to 2,75 times range of 2,25 to 2,75 times.
2 Nedbank CFO_ops FA.indd 62 22/03/2011 12:00 PM
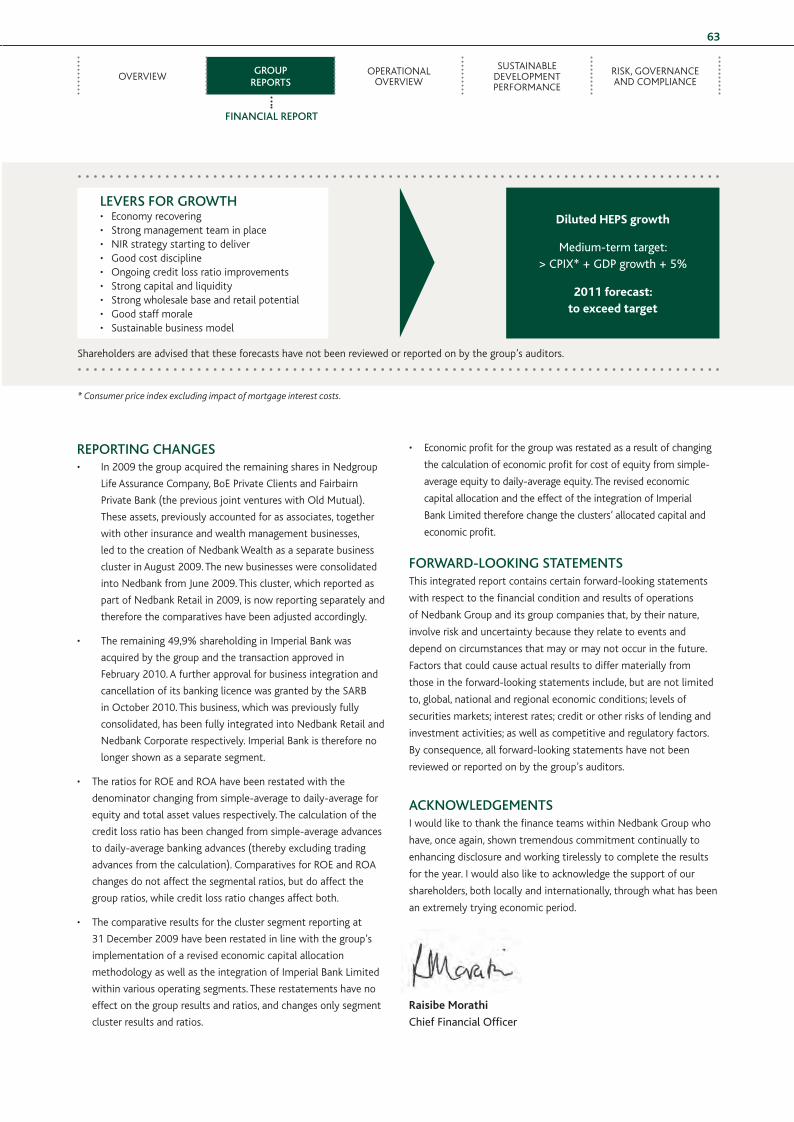
overvIewgroup
reportsoperatIonal
overvIew
sustaInable development performance
rIsk, governance and complIance
63
levers For growth• economy recovering• strong management team in place• nIr strategy starting to deliver• good cost discipline• ongoing credit loss ratio improvements• strong capital and liquidity• strong wholesale base and retail potential• good staff morale• sustainable business model
Diluted HEPS growth
medium-term target:> CPix* + GDP growth + 5%
2011 forecast:to exceed target
shareholders are advised that these forecasts have not been reviewed or reported on by the group’s auditors.
Financial report
*Consumerpriceindexexcludingimpactofmortgageinterestcosts.
reporting changes• In 2009 the group acquired the remaining shares in nedgroup
life assurance company, boe private clients and fairbairn
private bank (the previous joint ventures with old mutual).
these assets, previously accounted for as associates, together
with other insurance and wealth management businesses,
led to the creation of nedbank wealth as a separate business
cluster in august 2009. the new businesses were consolidated
into nedbank from June 2009. this cluster, which reported as
part of nedbank retail in 2009, is now reporting separately and
therefore the comparatives have been adjusted accordingly.
• the remaining 49,9% shareholding in Imperial bank was
acquired by the group and the transaction approved in
february 2010. a further approval for business integration and
cancellation of its banking licence was granted by the sarb
in october 2010. this business, which was previously fully
consolidated, has been fully integrated into nedbank retail and
nedbank corporate respectively. Imperial bank is therefore no
longer shown as a separate segment.
• the ratios for roe and roa have been restated with the
denominator changing from simple-average to daily-average for
equity and total asset values respectively. the calculation of the
credit loss ratio has been changed from simple-average advances
to daily-average banking advances (thereby excluding trading
advances from the calculation). comparatives for roe and roa
changes do not affect the segmental ratios, but do affect the
group ratios, while credit loss ratio changes affect both.
• the comparative results for the cluster segment reporting at
31 december 2009 have been restated in line with the group’s
implementation of a revised economic capital allocation
methodology as well as the integration of Imperial bank limited
within various operating segments. these restatements have no
effect on the group results and ratios, and changes only segment
cluster results and ratios.
• economic profit for the group was restated as a result of changing
the calculation of economic profit for cost of equity from simple-
average equity to daily-average equity. the revised economic
capital allocation and the effect of the integration of Imperial
bank limited therefore change the clusters’ allocated capital and
economic profit.
ForwarD-looking statementsthis integrated report contains certain forward-looking statements
with respect to the financial condition and results of operations
of nedbank group and its group companies that, by their nature,
involve risk and uncertainty because they relate to events and
depend on circumstances that may or may not occur in the future.
factors that could cause actual results to differ materially from
those in the forward-looking statements include, but are not limited
to, global, national and regional economic conditions; levels of
securities markets; interest rates; credit or other risks of lending and
investment activities; as well as competitive and regulatory factors.
by consequence, all forward-looking statements have not been
reviewed or reported on by the group’s auditors.
acknowleDgementsI would like to thank the finance teams within nedbank group who
have, once again, shown tremendous commitment continually to
enhancing disclosure and working tirelessly to complete the results
for the year. I would also like to acknowledge the support of our
shareholders, both locally and internationally, through what has been
an extremely trying economic period.
Raisibe Morathi
Chief Financial Officer
2 Nedbank CFO_ops FA.indd 63 22/03/2011 12:00 PM