Embed Size (px)
Citation preview

RESULTS
NEDBANK GROUP LIMITED
2017
ANNUALar
FOR THE YEAR ENDED 31 DECEMBER

2NEDBANK GROUP LIMITED – Annual Results '17ar
Solid performance during a
difficult and volatile year
OVERVIEW
MIKE BROWN

3NEDBANK GROUP LIMITED – Annual Results '17ar
Overview of our 2017 performance
Solid financial performance – headline earnings +2.8% (H1 2017: -2.9%)
Good performance from managed operations – headline earnings +7.8% (H1 2017: +6.7%)
− Unresolved structural challenges in SA economy compounded by political & policy uncertainty
− Cyclical economic downturn in SA
− Multiple event risks resulted in high levels of volatility – Nedbank navigated these well
− Business & consumer confidence at multiyear lows – slowdown in asset growth & transactional
activity, particularly evident in CIB & Wealth
− Selective loan origination & quality advances book with high levels of resolutions of historically
problematic accounts
− Expenses well managed
ETI loss from Q4 2016 impacted Nedbank’s H1 2017 result – returned to profitability in the
9 months to 30 September 2017, boosting Nedbank Group's H2 growth rates
Accelerated digital delivery to enhance client experience & improve efficiency
Delivering value to all our stakeholders – ongoing focus on governance & sustainability

4NEDBANK GROUP LIMITED – Annual Results '17ar
Financial services activity impacted by unresolved structural
challenges, exacerbated by cyclical downturn in SA
GDP growth (%)
-2
-1
0
1
2
3
4
5
6
7
8
00 02 04 06 08 10 12 14 16
World Sub-Saharan Africa South Africa
Structural challenges
Supportive global environment, but …
Infrastructural deficits – eg roads, water, education
Institutional deficits – particularly in key SOEs, but strong judiciary, SARB
Fiscal issues – eg high government wage bill, SOEs (Eskom, SAA etc), tax pressures
Policy deficits – unlikely to promote investment eg Mining Charter.
… exacerbated by prolonged period of political uncertainty, leading to credit rating downgrades
5NEDBANK GROUP LIMITED – Annual Results '17ar
Multiple event risks resulted in high levels of volatility – Nedbank
navigated these well
USD/ZAR JSE top 40
SA 10 year government bond yield (%) 5-year CDS spreads (%)
Pravingate
Fitch downgrade
Surprise rate cut
S&P downgrade
ANC elective conference
11
12
13
14
15
Jan 17 Mar 17 May 17 Jul 17 Sep 17 Nov 17
8
9
10
Jan 17 Mar 17 May 17 Jul 17 Sep 17 Nov 17
Pravingate
Fitch downgrade
Surprise rate cut
S&P downgrade
ANC elective conference
40 000
45 000
50 000
55 000
60 000
Jan 17 Mar 17 May 17 Jul 17 Sep 17 Nov 17
150
200
250
Jan 17 Mar 17 May 17 Jul 17 Sep 17 Nov 17
Steinhoff
Steinhoff
6NEDBANK GROUP LIMITED – Annual Results '17ar
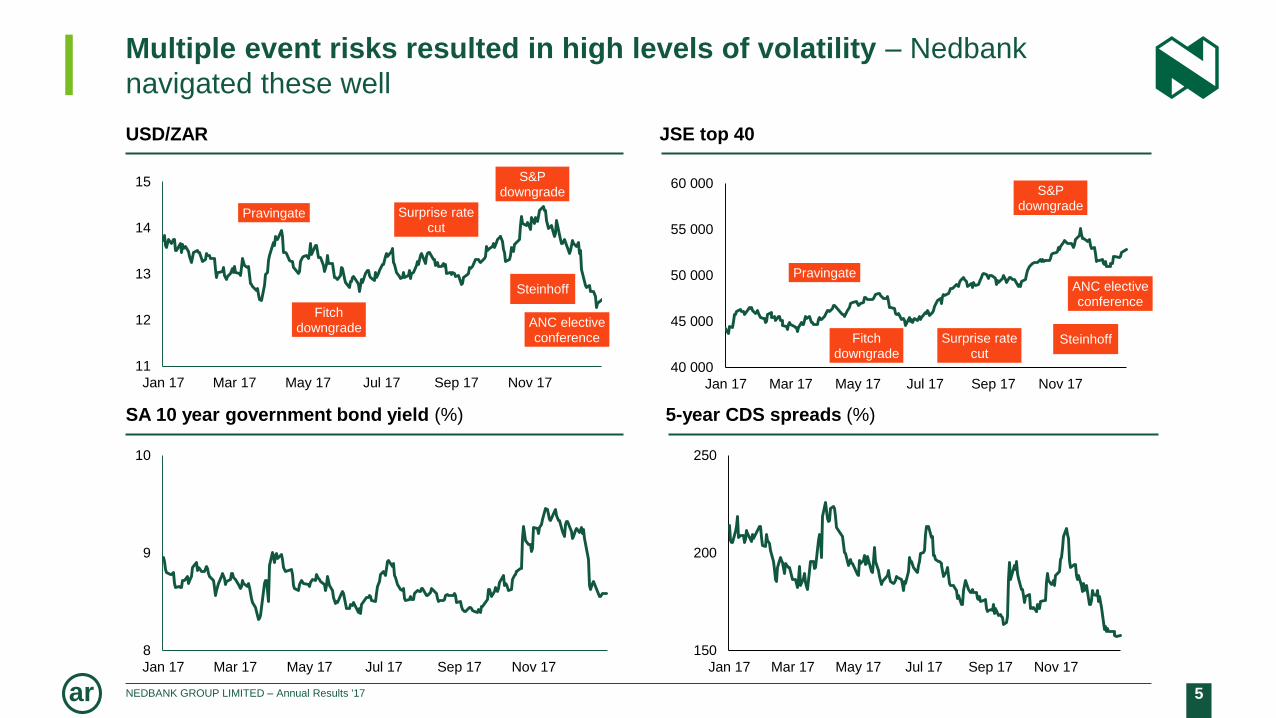
Business & consumer confidence at multiyear lows – slight
improvement in last quarter
BER business confidence index BER consumer confidence index
0
10
20
30
40
50
60
70
80
90
100
94 96 98 00 02 04 06 08 10 12 14 16
-25
-20
-15
-10
-5
0
5
10
15
20
25
94 96 98 00 02 04 06 08 10 12 14 16

7NEDBANK GROUP LIMITED – Annual Results '17ar
Credit demand muted – decline more pronounced in wholesale given
political & policy uncertainty
Industry credit growth (%)
-10
0
10
20
30
40
00 02 04 06 08 10 12 14 16
Households (yoy%) Companies (yoy%)
81 8964 54
2323
2020
5458
6166
915
1713
14 15 16 17
CIB BB Retail Other
Nedbank new loan payouts (Rbn)
167185
153162

8NEDBANK GROUP LIMITED – Annual Results '17ar
149176
123143
Home loans Net client cashflows
16 17
Volumes also at lower levels
Retail credit application volumes (000)
1 271
1 403
1 286
1 381
Personal loans Vehicle finance
CIB trading revenues (2017, indexed from Q1)
91
100
58
6765
Q1 Q2 Q3 Q4
Nedbank JP Morgan FICC & equities
CITI FICC & equities BAML FICC & equities
+1%
(2%)
(17%)
SA industry NCCF1 (Rbn)
(19%)
1 Source: ASISA
9NEDBANK GROUP LIMITED – Annual Results '17ar
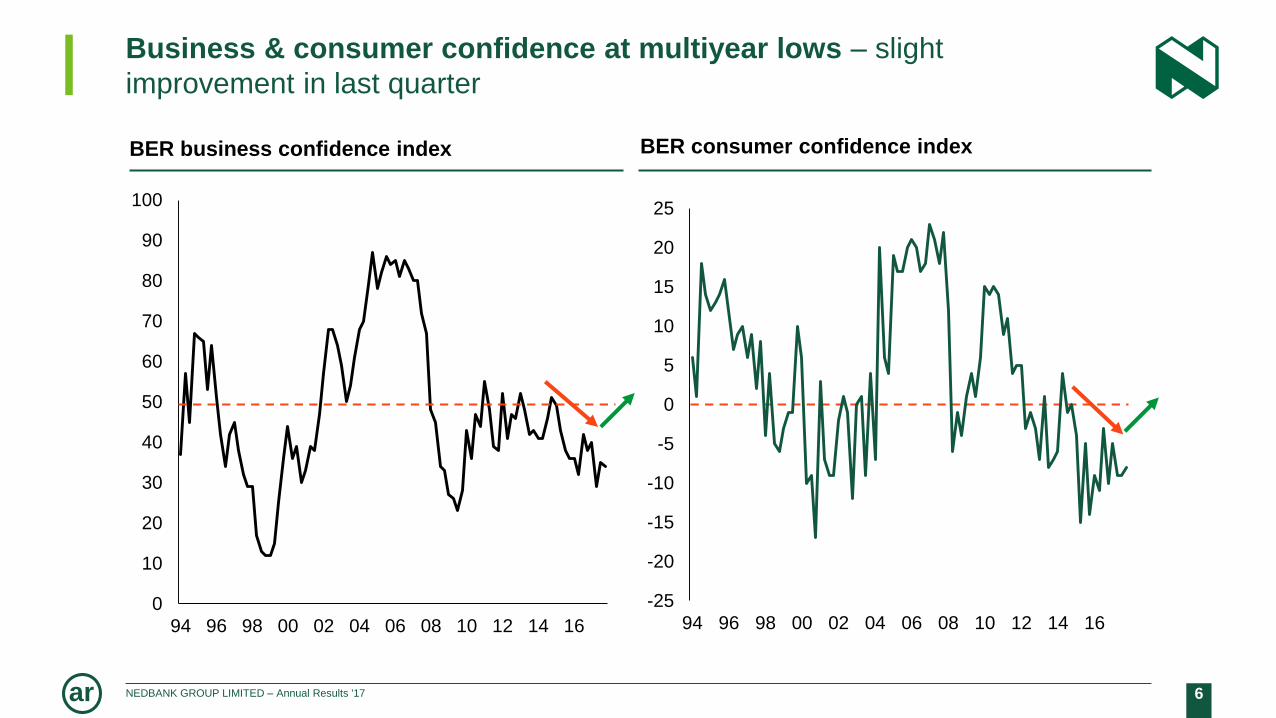
Delivering value to shareholders
13
14
3
14
39
5
15
685
15
83
0
16
99
0
13 14 15 16 17
895
1028
1107
1200
1285
13 14 15 16 17
17.2 17.2 17.0
16.5 16.4
13.013.5
13.0
14.2 14.0
16.8
18.1 18.1
13 14 15 16 17
ROE (excl GW)
COE
ROE (excl GW & ETI)
+7.3% +7.1%
NAV per share (cents) ROE & cost of equity (%) Dividend per share (cents)
CAGR: +6.6% CAGR: +9.5%

10NEDBANK GROUP LIMITED – Annual Results '17ar
Our role in society – contributing by delivering value to all our stakeholders
STAFF
CLIENTS
SHAREHOLDERS
REGULATORS
SOCIETY
Paid R16.5bn in salaries & benefits to support our 31 887 staffmembers & their families
Facilitated transfer of R3.7bn payroll taxes on behalf of staff to government
Implemented a leadership & culture change programme supporting strategy, incl New Ways of Work
Transforming our workforce towards SA demographics (> 78% black employees)
R153bn new loan payouts to enable clients to finance their homes, vehicles, education & grow their businesses
Enhanced client convenience – 234 new Intelligent Depositors, 55% reformatted digitally focused branches & new innovative apps & CVPs
Safeguarded R772bn deposits at competitive interest rates
Voted top SA asset manager – managing our clients’ investments
NAV per share up 7.3% to 169 90 cents
Paid R6.1bn dividends to shareholders who represent pension funds & investments of all South Africans (incl GEPF, a 6.8% shareholder in Nedbank)
Supportive outcomes at 50th AGM – all resolutions passed with > 90% votes of approval
Maintained a strong balance sheet to support a safe & stable banking system
Paid R9.8bn direct, indirect & other taxes
Invested more than R100bn in government & public sector bonds to support the funding needs of government
Procured 75% of our goods & services locally
Contributed R168m to socioeconomic development (50% spent on education)
Active participant in the CEO Initiative
Overall winner at the 2017 Independent Top Empowered Companies Awards. Remained a Level 2 BBBEE contributor, now measured under the Amended FSC
TO BE THE MOST ADMIRED
FINANCIAL SERVICES PROVIDER IN AFRICA
BY OUR STAKEHOLDERS
Our purpose - to use our financial expertise to do good for individuals, families, businesses & society

11NEDBANK GROUP LIMITED – Annual Results '17ar
Good performance from
managed operations in a
challenging macroeconomic
environment
FINANCIAL
OVERVIEW
RAISIBE MORATHI

12NEDBANK GROUP LIMITED – Annual Results '17ar
Key performance indicators – good performance from managed operations
2017 2016 2017¹ 2016¹
Headline earnings (Rm) 2.8% 11 787 11 465 7.8% 12 762 11 839
ROE (excl goodwill) 16.4% 16.5% 18.1% 18.1%
Diluted HEPS growth 2.4% 4.8% 7.3% 15.1%
Preprovisioning operating profit growth (3.2%) 4.4% (0.3%) 10.0%
Net interest margin2 3.62% 3.54%
Credit loss ratio 0.49% 0.68%
CET1 CAR 12.6% 12.1%
Dividend per share (cents) 7.1% 1 285 1 200
Managed operations
1 Excluding ETI associate income/losses, as well as ETI-related funding costs. Managed operations reporting provided to assist in analysis of group performance during the
period of ETI Q4 2015/16 losses, but we will revert to blended results in 2019. 2 2016 rebased.

13NEDBANK GROUP LIMITED – Annual Results '17ar
Headline earnings – good performance from managed operations
11 465 11 787
1 198 560
1 250 (1 446)
(733)
(507)
2016 NII NIR Impairments Expenses Associateincome
Direct tax& other
2017
+4.5% (27.4%)+2.4% +5.1% (> 100.0%)
2.8
7.8
Group Managedoperations
16.418.1
Group Managedoperations
Headline earnings (Rm) HE growth (%)
ROE excl GW (%)

14NEDBANK GROUP LIMITED – Annual Results '17ar
Headline earnings – improved H2 2017 performance from both managed
operations & ETI
H1 2017 vs H2 2017 (Rm)
13
028
13
398
13
548
14
076
H1 H2
NII
11
357
12
146
11
730
12
333
H1 H2
NIR
22
11
2343
1594
1710
H1 H2
Impairments
13
686
14
680
14
369
15
443
H1 H2
Expenses
6030
5809
6433
6329
H1 H2
HE managed operations
(43
1) 32
6
(1 0
53
)
215
H1 H2
Associate income
+4.0% +5.1%
+3.3%+1.5%
(27.9%) (27.0%)
+5.0% +5.2%
+6.7% +9.0%
(144%) (34%)
16 17 ETI: (446) (1061) 321 317

15NEDBANK GROUP LIMITED – Annual Results '17ar
Net interest margin – driven by endowment & asset mix
Net interest margin (bps)
Average interest-earning banking assets1: +2.2%
341 354
362
135
8 (2) (2) (2) 1
2016 Removal oftrading LAP
2016rebased
Endowmentimpact
Assetmix
Assetpricing
Liabilitypricing& mix
Prime-JIBARimpact
Other 2017
1 Rebased NIM for twelve months ended 31 December 2016 would have been 354 bps & AIEBA of R745bn, had HQLA been removed from the banking book & included in the
trading book from 1 January 2016.

16NEDBANK GROUP LIMITED – Annual Results '17ar
2
(3)
(10)
(3)(2)
13 14 15 16 17
(2)
10
5
18
5
(5)
(2)
0
13 14 15 16 17
3
(12) (12)
(4)
8
Net interest margin – driven by endowment & asset mix
change
Asset mix change (bps) Endowment (bps)
BOOKLET SLIDE
Liability mix & pricing (bps) HQLA (bps)

17NEDBANK GROUP LIMITED – Annual Results '17ar
Funding
sources
Funding
base mix
Local currency
downgrade
(what we expected1)
Local currency
downgrade
(what actually happened2)
Further local currency
downgrade
(what we expect3)
Households 21.5%Limited impact – closed
domestic market Limited impact – closed
domestic market
Limited impact – Closed
domestic marketCommercial 28.0%
Cost of new term funding:
+5 bps
Wholesale 37.6%Cost of new term funding:
+10 bps
Cost of new term funding:
+5−8 bps
Cost of new term funding:
+5−10 bps
Capital markets 6.8%Cost of new capital markets
funding: +25 bps
Reprice on new issuances,
however, capital market
spreads have decreased
given demand for good credit
Reprice on new issuances:
+25−35 bps
Foreign – asset matched 5.1%Matched to US$ lending – no
material impact
Matched to US$ lending
No material impact
Matched to US$ lending
No material impact
Foreign – general funding
pool1.0%
Cost of new foreign funding:
+25−50 bps (1 year)
Reprice on contractual
repricing date, however,
funding costs have
decreased on the back of
risk-on foreign appetite
Cost of new foreign funding:
+15−25 bps (1 year)
Volume-weighted total 100% circa +5 bps 0 bps circa +4 bps
Net interest margin – impact of sovereign-credit-ratings
downgrades on funding costs not materialBOOKLET SLIDE
Total funding (deposits + long-term debt) at 31 December 2017: R823bn.1 From June 2017 year-end presentation | 2 On 24 November 2017 S&P downgraded the sovereign long-term local currency rating from BBB- to BB+ while Moody’s placed SA on Review | 3
Moody's is expected to announce the outcome of their credit rating review in March 2018. Assuming they decrease SA’s sovereign long-term local currency rating from Baa3 to Ba1 (sub-
investment grade), SA would be excluded from the WGBI. The potential impact is expected to have reduced substantially given that foreign investors have had time to pro-actively pre-position
their portfolios for this potential event. Following the ANC elective conference, SA 2018 budget announcement & Presidential & Ministerial changes, markets appear to be pointing to a lower
probability of a sovereign-credit ratings downgrade. Assuming a rating downgrade, continued risk-on EM demand is likely to dampen the potential impact..
18NEDBANK GROUP LIMITED – Annual Results '17ar
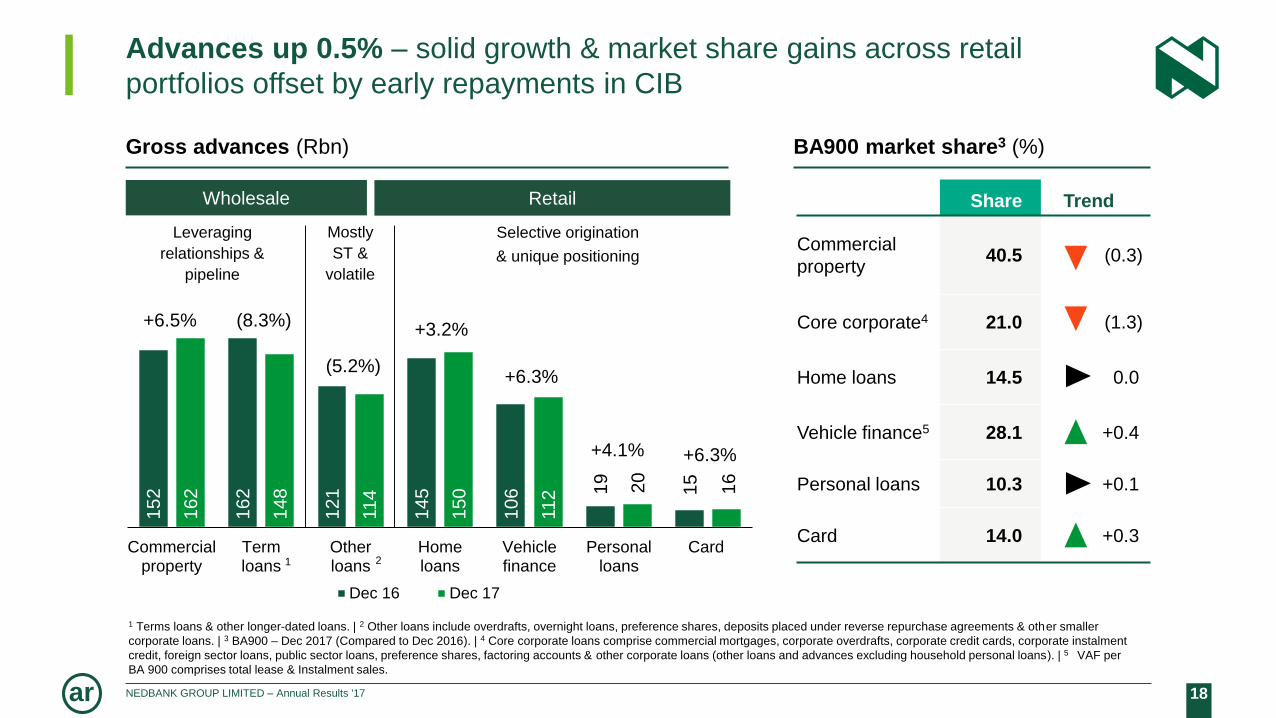
152
162
121
145
106 1
9
15
162
148
11
4
150
11
2 20
16
Commercialproperty
Termloans
Otherloans
Homeloans
Vehiclefinance
Personalloans
Card
Dec 16 Dec 17
21
Selective origination
& unique positioning
Gross advances (Rbn)
Mostly
ST &
volatile
Wholesale
Advances up 0.5% – solid growth & market share gains across retail
portfolios offset by early repayments in CIB
BA900 market share3 (%)
+6.5%+3.2%
(8.3%)
(5.2%)+6.3%
+4.1% +6.3%
Leveraging
relationships &
pipeline
Retail
1 Terms loans & other longer-dated loans. | 2 Other loans include overdrafts, overnight loans, preference shares, deposits placed under reverse repurchase agreements & other smaller
corporate loans. | 3 BA900 – Dec 2017 (Compared to Dec 2016). | 4 Core corporate loans comprise commercial mortgages, corporate overdrafts, corporate credit cards, corporate instalment
credit, foreign sector loans, public sector loans, preference shares, factoring accounts & other corporate loans (other loans and advances excluding household personal loans). | 5 VAF per
BA 900 comprises total lease & Instalment sales.
Share Trend
Commercial
property40.5 (0.3)
Core corporate4 21.0 (1.3)
Home loans 14.5 0.0
Vehicle finance5 28.1 +0.4
Personal loans 10.3 +0.1
Card 14.0 +0.3

19NEDBANK GROUP LIMITED – Annual Results '17ar
BA900 market share1Deposits (Rbn)
Deposits up 1.3% – good household deposit growth, particularly in RBB,
up 8.5%, evident in ongoing market share gains
Share Trend
Wholesale 21.2 (1.1)
Corporate
(non-financial)16.5 +0.2
Household 18.9 +0.2
Foreign
currency 12.8 +0.2
1 BA900 – Dec 2017 (Compared to Dec 2016).
761
772
23
2 1 (4)
(11)
2016 RBB Wealth Rest ofAfrica
CIB CentralMgnt
2017
+8.5% +4.8% +4.2% (1,3%) (13,3%)
Basel III + Basel III -

20NEDBANK GROUP LIMITED – Annual Results '17ar
17 355
3 900
1 566
708
534
Commission& fees
Tradingincome
Insuranceincome
Privateequity
Other¹
Non-interest revenue up 2.4% – resilient underlying performance, offset by high
base, the impact of a challenging economic environment & weak insurance result
NIR growth per cluster (%)Non-interest revenue (Rm)
1 Represents sundry income, investment income & fair-value adjustments. | 2 C&F 72% of NIR.
Rest of Africa & Centre excluded as not material.
CIB RBB Wealth
16 17 16 17 16 17
14.5 (3.9) 6.9 5.0 (5.1) (0.6)
▲2.3
▼(24.1)
▼(4.5)
▼(10.0)
▲18.9
▲3.1
▲16.4
▼(4.3)
▲7.1
▲5.32
21NEDBANK GROUP LIMITED – Annual Results '17ar
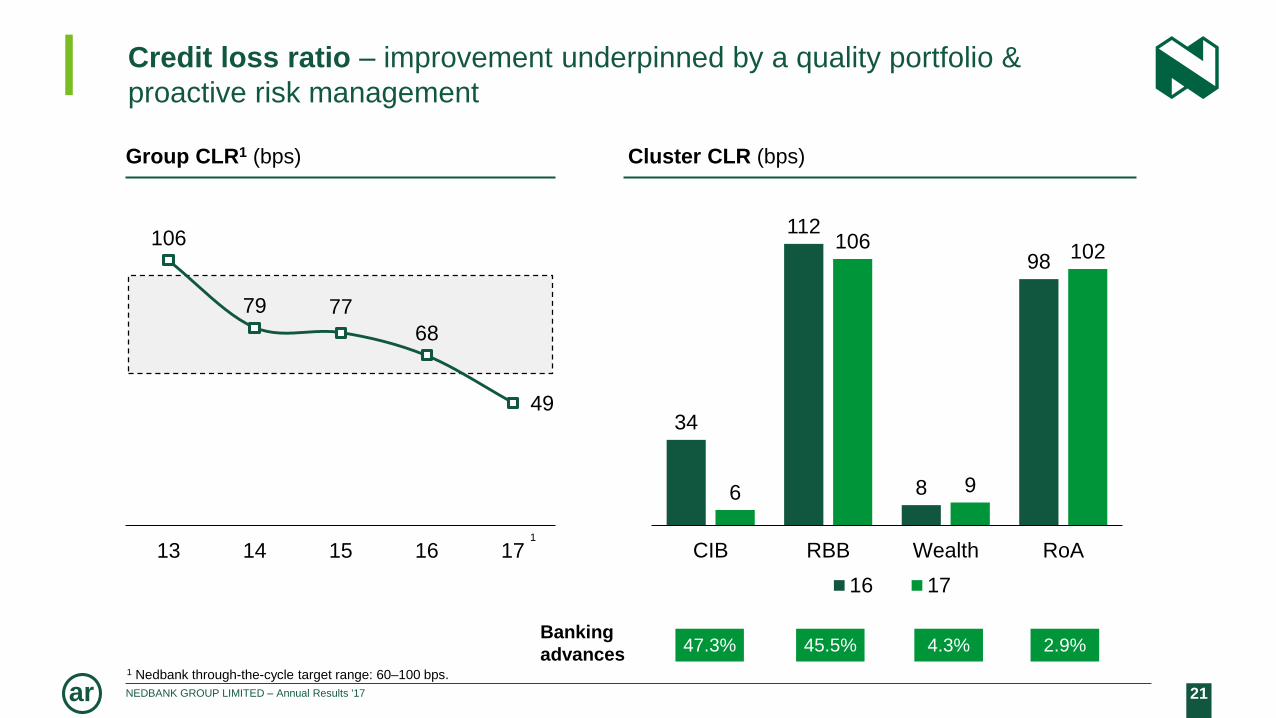
Credit loss ratio – improvement underpinned by a quality portfolio &
proactive risk management
47.3% 45.5% 4.3% 2.9%Banking
advances
106
79 77
68
49
13 14 15 16 17
34
112
8
98
6
106
9
102
CIB RBB Wealth RoA
16 17
1
Group CLR1 (bps) Cluster CLR (bps)
1 Nedbank through-the-cycle target range: 60–100 bps.

22NEDBANK GROUP LIMITED – Annual Results '17ar
Defaulted advances flat & maintained healthy coverage levels
16 17
1 157 1 224 654 350
500150
16 17
RBB Centre
Specific coverage (%) Portfolio coverage (%)
Overlays & central
provision (Rm)
Defaulted advances (Rbn, %)
37.4 36.2
16 17
0.69 0.70
16 17
19.6 19.6 16.2 15.4
2.7 2.7
2.32.1
0
1
2
3
0
10
20
30
16 17 16 17
Defaulted advances Defaulted advances as % of book
+0.0%
(4.9)%Postwriteoff
recoveries (Rm)
Defaulted advances Defaulted advances
(excl performing
defaults)1
1 Performing defaults is defined as Retail advances held in default for longer due to regulatory requirements, but are otherwise performing.

23NEDBANK GROUP LIMITED – Annual Results '17ar
84%70%
16%30%
Specificimpairment
NPLs
10 largest exposures Other
CPF18%
Other82%
CIB – CLR improvement underpinned by resolution of stressed counters &
resultant provision reversals
Top 10 client contribution (%)
CLR driven by resolutions & underpinned by quality
book (bps)
6
10
10(12)
(2)
Dec 17ResolutionsNew
advances
Existing
advances
Dec 2016 to Dec 2017
Postwriteoff
recoveries

24NEDBANK GROUP LIMITED – Annual Results '17ar
RBB – CLR underpinned by quality origination
Nedbank Competitors1 Source: Experian Delphi Score2 Source: Lightstone Risk Quality Grade3 Source: Experian
HL new business – low risk clients proportion1 (%)
HL new business – low risk properties proportion² (%)
0%
10%
20%
30%
40%
09 10 11 12 13 14 15 16 17
0%
10%
20%
30%
40%
09 10 11 12 13 14 15 16 17
PL market share of new business by risk band3 (%)
0%
5%
10%
15%
20%
14 15 16 17
Low Risk * Low-Medium Risk Medium Risk High risk
Nedbank Tier 1 ** Tier 2 **
0%
20%
40%
60%
80%
14 15 16 170%
20%
40%
60%
80%
1714 15 16
Vehicle finance 3 months+ arrears benchmarking3
0%
1%
2%
3%
4%
5%
6%
13 14 15 16 17
* Low risk (Bureau score ≥ 658); Low−medium risk (Bureau score 644−657); Medium risk (Bureau score 626−643); High risk (Bureau score ≤ 625)
** Tier 1 refers to traditional 4 banks excluding Nedbank while tier 2 refers to remaining material providers of unsecured personal loans

25NEDBANK GROUP LIMITED – Annual Results '17ar
0
20
40
60
80
100
120
Group CIB Home loans Vehicle finance Personal loans Card
Nedbank (Dec 17) Nedbank (Dec 16) Bank A Bank B Bank C
Specific coverage – reflecting wholesale & retail asset
mix profile
Big 4 banks’ specific coverage ratios1 (%)
1 Peer information from last reported financials (June 2017).
Wholesale advances contribution
Selective origination
since 2010 & high-
quality book
CPF 40% of CIB book (higher levels of
security) & coverage in CIB individually
determined
Total retail coverage 39.5 42.8 43.0 35.5
59% 39% 32% 38%
BOOKLET SLIDE
26NEDBANK GROUP LIMITED – Annual Results '17ar
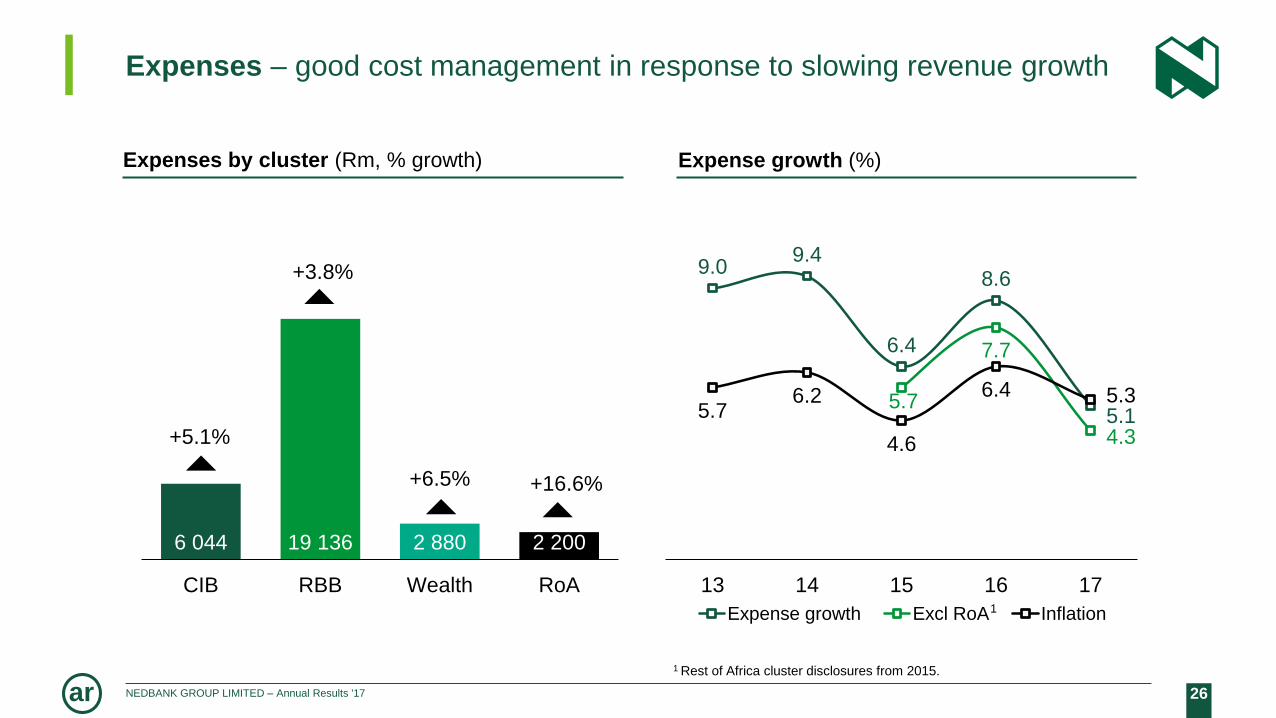
Expenses – good cost management in response to slowing revenue growth
Expense growth (%)
9.09.4
6.4
8.6
5.15.7
7.7
4.3
5.76.2
4.6
6.4 5.3
13 14 15 16 17
Expense growth Excl RoA Inflation
Expenses by cluster (Rm, % growth)
6 044 19 136 2 880 2 200
CIB RBB Wealth RoA
+5.1%
+3.8%
+16.6%+6.5%
1
1 Rest of Africa cluster disclosures from 2015.

27NEDBANK GROUP LIMITED – Annual Results '17ar
28 366 28 850
29 812
1 105 (621) 617 107 238
2016 BAUgrowth
Efficiencies BAUgrowth
Investments Regulatory BancoÚnico
2017
Expenses – good cost management in response to slowing revenue
growth
Expenses (Rm)
1 R621m includes TOM, OM synergies & other cost savings. R444m accrues to RBB2 Investments, including IT projects, branch reformatting costs, etc.
+1.7% +3.4%
21

28NEDBANK GROUP LIMITED – Annual Results '17ar
R238m run-rate savings in
2017, include:
Optimisation of branch
footprint
− reduction in floor space
− closed 53 PL & 32
inretailer outlets
Self-service banking
Sales & service integration
Headcount reduction
Expenses – various initiatives in place to support meeting our efficiency
ratio target of < 53% by 2020
Adoption of automation &
robotics
Procurement benefits from
SAP implementation – eg live
auctions
Managed evolution of core IT
systems – decommissioned
122 since 2010 (16 in 2017)
(target < 60 by 2020)
Headcount reduction
1 Target Operating Model initiatives enable Nedbank to operate with greater agility, leading to revenue & cost savings benefits
Old Mutual synergies
(costs & revenues)
Nedbank >30% of R1bn by 2017
Target &
completion
date:
Target Operating Model1
(costs & revenues)
R1.0bn by 2019 & R1.2bn by 2020
Other ongoing
cost savings
Ongoing
Delivered > R1bn pretax
synergies with Old Mutual,
of which R393m accrued to
Nedbank. Synergies
include:
− IT collaboration to
achieve scale
− Joint procurement
savings
− Wholesale banking
revenue initiatives
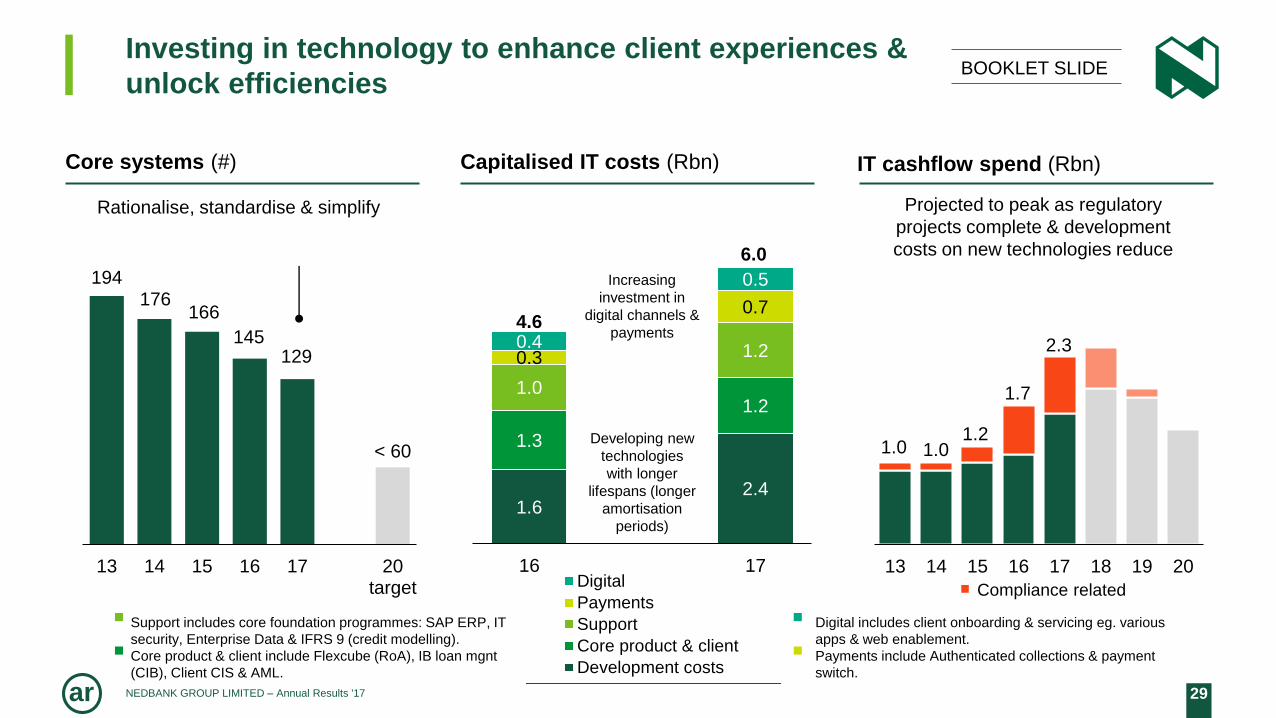
29NEDBANK GROUP LIMITED – Annual Results '17ar
1.0 1.01.2
1.7
2.3
13 14 15 16 17 18 19 20
IT cashflow spend (Rbn)
Investing in technology to enhance client experiences &
unlock efficiencies
Capitalised IT costs (Rbn)
Projected to peak as regulatory
projects complete & development
costs on new technologies reduce
1.62.4
1.3
1.21.0
1.20.3
0.7
0.4
0.5
16 17Digital
Payments
Support
Core product & client
Development costs
4.6
6.0
Developing new
technologies
with longer
lifespans (longer
amortisation
periods)
Increasing
investment in
digital channels &
payments
BOOKLET SLIDE
194176
166
145129
< 60
13 14 15 16 17 20target
Core systems (#)
Rationalise, standardise & simplify
Digital includes client onboarding & servicing eg. various
apps & web enablement.
Payments include Authenticated collections & payment
switch.
Support includes core foundation programmes: SAP ERP, IT
security, Enterprise Data & IFRS 9 (credit modelling).
Core product & client include Flexcube (RoA), IB loan mgnt
(CIB), Client CIS & AML.
Compliance related
30NEDBANK GROUP LIMITED – Annual Results '17ar
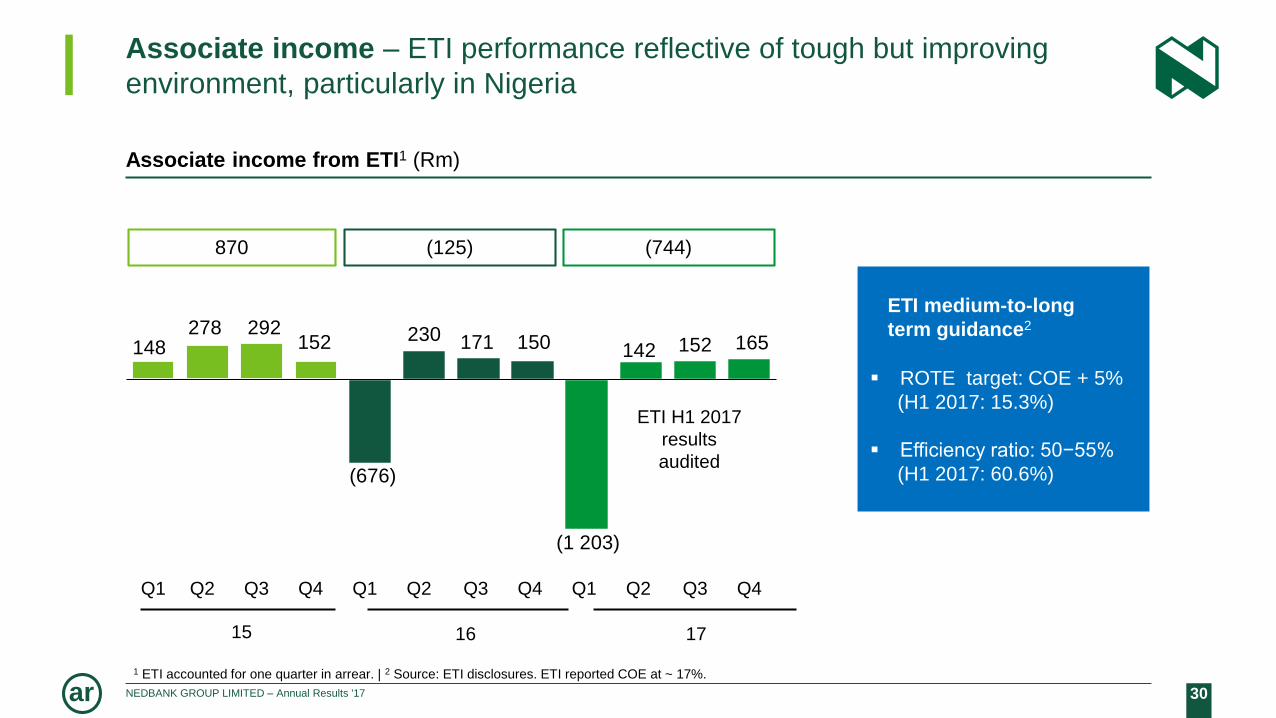
148278 292
152
(676)
230 171 150
(1 203)
142 152 165
Q1 Q2 Q3 Q4 Q1 Q2 Q3 Q4 Q1 Q2 Q3 Q4
Associate income – ETI performance reflective of tough but improving
environment, particularly in Nigeria
Associate income from ETI1 (Rm)
870 (125) (744)
1 ETI accounted for one quarter in arrear. | 2 Source: ETI disclosures. ETI reported COE at ~ 17%.
ETI H1 2017
results
audited
15 16 17
ETI medium-to-long
term guidance2
ROTE target: COE + 5%
(H1 2017: 15.3%)
Efficiency ratio: 50−55%
(H1 2017: 60.6%)
31NEDBANK GROUP LIMITED – Annual Results '17ar
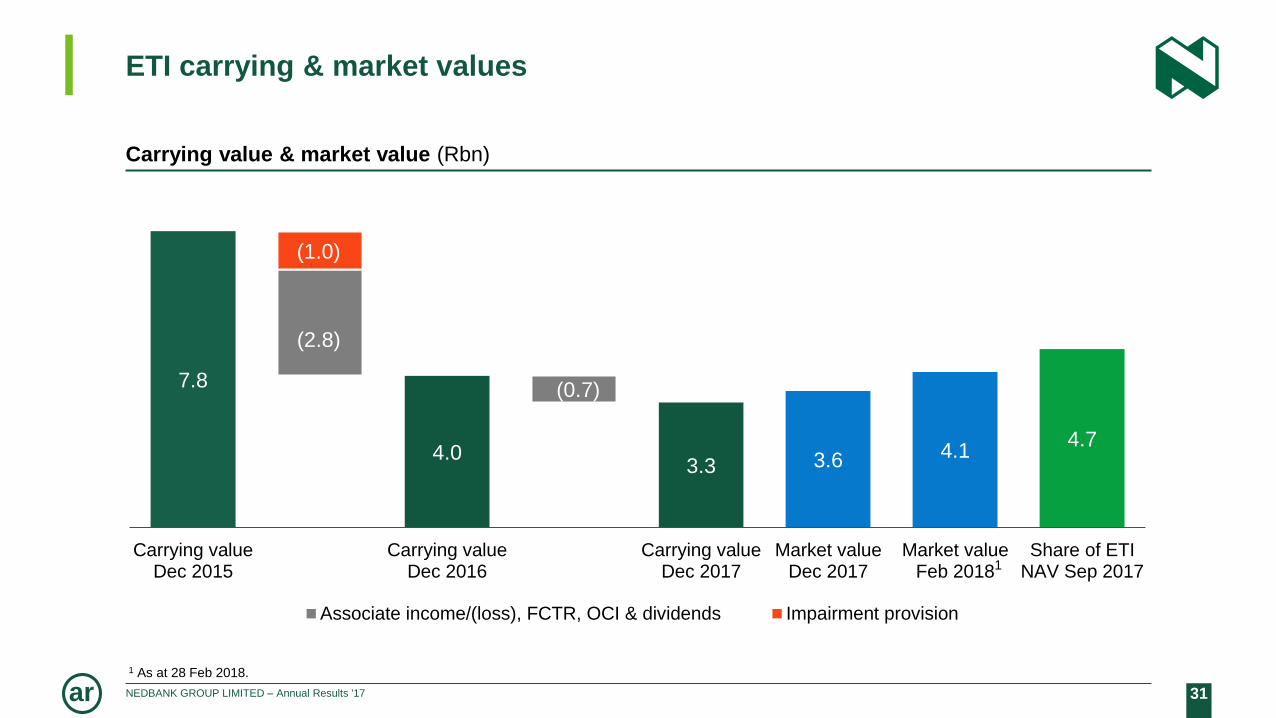
ETI carrying & market values
Carrying value & market value (Rbn)
7.8
4.03.3 3.6 4.1
4.7
(2.8)
(0.7)
(1.0)
Carrying valueDec 2015
Carrying valueDec 2016
Carrying valueDec 2017
Market valueDec 2017
Market valueFeb 2018
Share of ETINAV Sep 2017
Associate income/(loss), FCTR, OCI & dividends Impairment provision
1 As at 28 Feb 2018.
1

32NEDBANK GROUP LIMITED – Annual Results '17ar
12.1
13.0 12.6
12.6
2.1(1.2) (0.4)
Dec2016
Organicprofits
Dividendspaid
RWA increases
Dec2017
Capital – CET1 above the top end of our target range
CET1 capital ratio (%)
CET1: 10.5–12.5%
SARB minimum CET1: 7.25%
Fully loss-absorbent capital adequacy ratios (%)
Jun 17 Dec 2017
16.714.9 14.7 15.2 15.2
14.3 13.7 13.912.8 13.1
Bank A Bank B Bank C Nedbank Nedbank
Tier 1 Tier 2
16.2
14.9 14.715.2 15.4

33NEDBANK GROUP LIMITED – Annual Results '17ar
IFRS 9 & 15 accounting standard day 1 impact1 – strengthened balance
sheet coverage with immaterial impact on CET1
66.4~ 65.7
~ 3.2
2.0~ 0.9 ~ 0.2 ~ 0.2
31 Dec 2017 IFRS 9Impairments
Excess ofdownturn ECLover provisions
Tax effect
IFRS 9Classification &measurement
IFRS 15Revenue
1 Jan 2018proforma
Common equity tier 1 (Rbn)
Portfolio coverage:
CET1:
0.70% ~1.05%
12.6% >12.4%< 0.1%
~ 0.35%
2
< 0.1%
1 These estimates are based on accounting policies, assumptions, judgements & estimation techniques that will be regularly reviewed & assessed during 2018. | 2 Excess downturn expected
credit loss over provisions reversed due to increase in IFRS provisions. | Excludes ETI IFRS 9 impacts to be announced in H1 2018.

34NEDBANK GROUP LIMITED – Annual Results '17ar
Key drivers of IAS 39 to IFRS 9 transition
Balance sheet impairments (Rbn, illustration)
Mix of the lending book
− Nedbank more wholesale than retail
compared with industry (impact from
lengthening of emergence period under
IFRS 9 greater on retail portfolio provisions
than wholesale portfolio provisions)
− Nedbank has relatively large CPF book –
appreciating assets mitigate lifetime ECL
impacts
Relative proportion of book on AIRB
− AIRB book already includes downturn EL
deduction from capital, thereby partially
offsetting impact of IFRS9 on CET1 in AIRB
portfolios
− Nedbank proportion of book on AIRB at 94%
(peer average at ~ 80%)
Cash tax implications
− Depends on individual banks’ tax practices −
Nedbank historically conservative
IFRS 9 drivers
12.0
~15.2
IAS 39 Stage 1 Stage 2 Stage 3 IFRS 9
Removal of
emergence periods
& replacing with
12-month ECL on all
exposures
Retail more
impacted than
wholesale
Inclusion of off-
balance sheet
exposures
Lifetime ECL on
exposures that have
a significant
increase in credit
risk
Minor impact as
default definition
remains unchanged
BOOKLET SLIDE

35NEDBANK GROUP LIMITED – Annual Results '17ar
Dividend – dividend cover within our target range
2.11 2.07 2.062.00
1.91
13 14 15 16 17
Board-approved target range:
1.75 – 2.25x
Dividend cover (times) Dividend yield (%)
Payout
ratio: 47% 48% 48% 50% 52%
3.9
4.8
2.7 2.8
13 14 15 16 17
Nedbank JSE all-share index

36NEDBANK GROUP LIMITED – Annual Results '17ar
Good performance from our managed operations – group headline
earnings up 2.8%
60
14
49
60
11
92
(287)
(414)
63
15
53
02
10
68
(810)
(88)
CIB RBB Wealth Rest ofAfrica
Centre
16 17
+5.0%
+6.9%
(10.4%)
Earnings contribution (Rm)Headline earnings (Rm)
54%
45%
9%
1%
(8%) (1%)
CIB RBB
Wealth Rest of Africa
ETI Centre

37NEDBANK GROUP LIMITED – Annual Results '17ar
Strong risk management in a
difficult and volatile
environment
NEDBANK CORPORATE
AND INVESTMENT
BANKING
BRIAN KENNEDY

38NEDBANK GROUP LIMITED – Annual Results '17ar
39
71
47
27
52
08
60
14
63
15
27.6 27.0
22.621.1 20.7
- 2.0
3.0
8.0
13.0
18.0
23.0
28.0
-
2 000
4 000
6 000
8 000
10 000
12 000
13 14 15 16 17
Headline earnings (Rm) ROE (%)
Strong risk management in a difficult & volatile environment
Operating Income +3.9%: Lack of business
confidence translating to lower advances &
revenue
CIB integration providing significant client
penetration & cross-sell opportunities
CLR 6 bps: Strong risk management,
collections & high-quality portfolio
Expenses +5.1%: Efficient franchise
Strong franchise providing good returns
(ROE > 20%)
Key messagesHeadline earnings, ROE
+5%
Network

39NEDBANK GROUP LIMITED – Annual Results '17ar
54%
46%
Headline earnings
50%50%
Assets
Nedbank CIB Other clustersYear ended % change FY 2017 FY 2016
Headline earnings (Rm) 5.0 6 315 6 014
Operating income (Rm) 3.9 14 187 13 649
PPOP (Rm) (7.9) 8 173 8 878
Net interest margin (%) 2.12 1.97
NIR-to-expense ratio (%) 118.5 129.6
Efficiency ratio (%) 42.3 39.0
Credit loss ratio (%) 0.06 0.34
Average banking advances (Rm) 0.7 327 695 325 428
Average deposits (Rm) 0.1 337 052 336 878
Headline economic profit 1 (Rm) 3.5 2 039 1 970
Allocated capital (Rm) 6.9 30 437 28 462
ROE (%) 20.7 21.1
Corporate & Investment Banking – financial highlights
1 Cost of equity 2016: 14.2%. | 2017: 14.0%.
BOOKLET SLIDE

40NEDBANK GROUP LIMITED – Annual Results '17ar
CIB business unit – financial highlights BOOKLET SLIDE
3 035
4 012 4 584
3 1103 056 3 551
4 703
3 070
Property Finance Investment Banking Markets Short-term &Transactional
16 17
Property
FinanceRest of CIB
16 17 16 17
HE (Rm) 1 540 1 560 4 474 4 755
ROE (%) 21.6% 20.6%
CLR (%) 0.04% (0.05%)
GOI by business unit (Rm)

41NEDBANK GROUP LIMITED – Annual Results '17ar
138187 182
85
128 1387
11 8
13 16 17
Other Property finance Banking
Average advances growth affected by early repayments, although
pipeline remains steady
Average banking advances (Rbn)
1 Banking defined as Investment Banking & Client Coverage combined. | 2 NIM restated for prior years for the removal of the liquid-asset portfolio out of interest-earning banking assets.
(3%)
8%
+7%
+13%
+4%
CAGR
+9%
230
325 328
Investment grade & NIM
71% 73% 74%
1.89%1.97%
2.10%2.14% 2.12%
1.00%
1.50%
2.00%
2.50%
0%
20%
40%
60%
80%
100%
13 16 17
Investment grade exposure Reported NIM (RHS)
Restated NIM (RHS)
1%
1
2

42NEDBANK GROUP LIMITED – Annual Results '17ar
36.0%
1.2%
4.4%
3.7%
2.0%
4.4%
32.5%
1.0%
3.8%
4.0%
1.3%
4.2%
PropertyFinance
Construction
Equity
Mining
Retailers
StateOwnedEntities
16 17
Proactive risk management in prior periods yielding results
CLR (%)
Coverage ratios (%)
23.627.7
17.1
26.3
21.0
0.21 0.24 0.29 0.290.45
13 14 15 16 17
Portfolio Specific
CIB selected sector exposures (%)
Migration
riskDown-
side risk
Change
H
H
M
L
M
L
H
-
-
-
H M -
M M -
M ▲
1 State Owned Entities restated to exclude direct Government related entities
1
[ ] Risk decrease [ ] No change [ ] Risk increase
Change on prior period:
▼ - ▲
0.30
0.19
0.40 0.34
0.06
13 14 15 16 17
43NEDBANK GROUP LIMITED – Annual Results '17ar
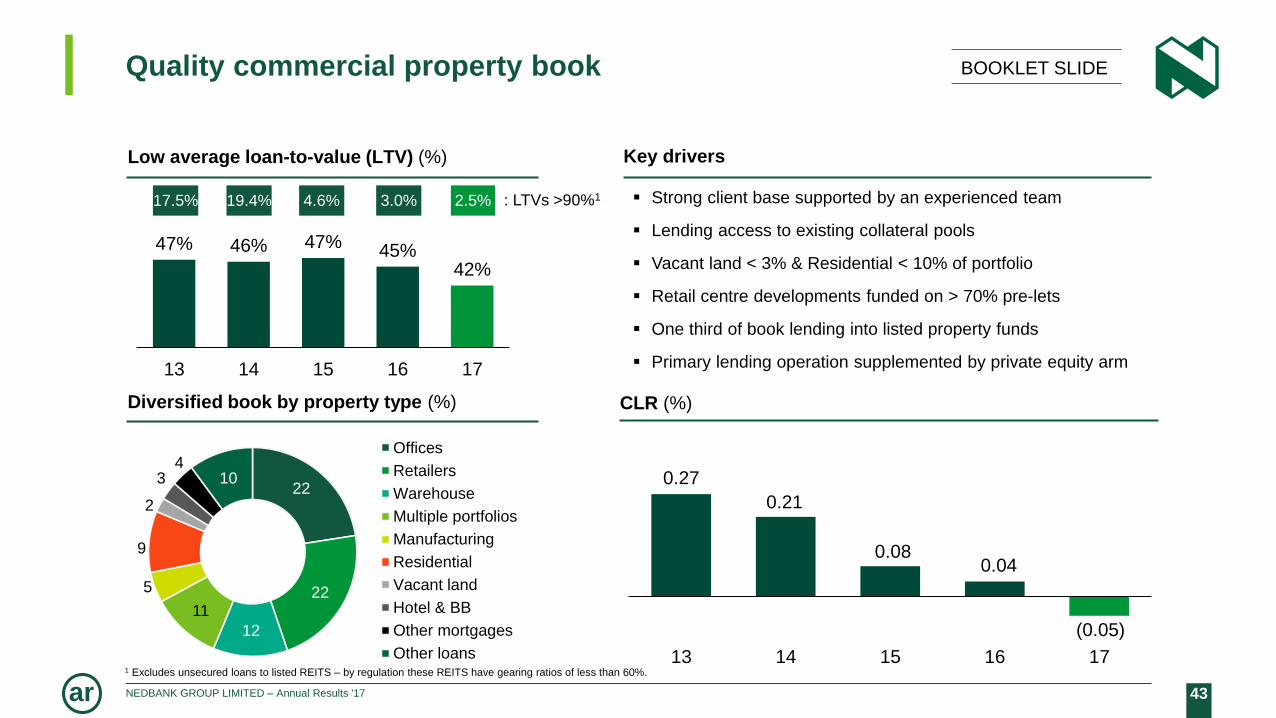
47% 46% 47% 45%42%
13 14 15 16 17
Quality commercial property book
Diversified book by property type (%)
Low average loan-to-value (LTV) (%)
22
22
12
11
5
9
2
34
10
Offices
Retailers
Warehouse
Multiple portfolios
Manufacturing
Residential
Vacant land
Hotel & BB
Other mortgages
Other loans
Key drivers
Strong client base supported by an experienced team
Lending access to existing collateral pools
Vacant land < 3% & Residential < 10% of portfolio
Retail centre developments funded on > 70% pre-lets
One third of book lending into listed property funds
Primary lending operation supplemented by private equity arm
CLR (%)
BOOKLET SLIDE
: LTVs >90%119.4% 4.6% 3.0% 2.5%17.5%
0.27
0.21
0.08 0.04
(0.05)
13 14 15 16 171 Excludes unsecured loans to listed REITS – by regulation these REITS have gearing ratios of less than 60%.

44NEDBANK GROUP LIMITED – Annual Results '17ar
NIR impacted by subdued client activity
Key drivers
Difficult trading conditions with environment
characterised by low volatility & client activity,
interspersed with large event risk
Commission & fee growth weak from lower
levels of corporate activity
Private-equity valuations impacted by economic
conditions & a high base in the prior year
Embedded client intelligence platforms
enhancing our value proposition to clients
Maximising deeper client penetration through
cross-sell of a number of products to key clients
Good transactional client gains
NIR (Rm)
2 347
3 578 3 689
2 043
2 829 2 708631
1 046 767
13 16 17
Private equity & other Commission & fees
Trading income
(4%)
3%
+12%
+7%
+5%
CAGR
+9%
5 021
7 4537 164
(27%)
(4%)

45NEDBANK GROUP LIMITED – Annual Results '17ar
25
5
10
11
2
7
22 21 22
2
3
13 14 15 16 17
Tier 4 Tier 3 Tier 2
Tier 1 Target
Growing our transactional banking franchise faster than the
market – ongoing new primary client wins in CIB
Primary client wins (#) Selected primary transactional account wins
Target = 25 p.a. 26
39
46NEDBANK GROUP LIMITED – Annual Results '17ar
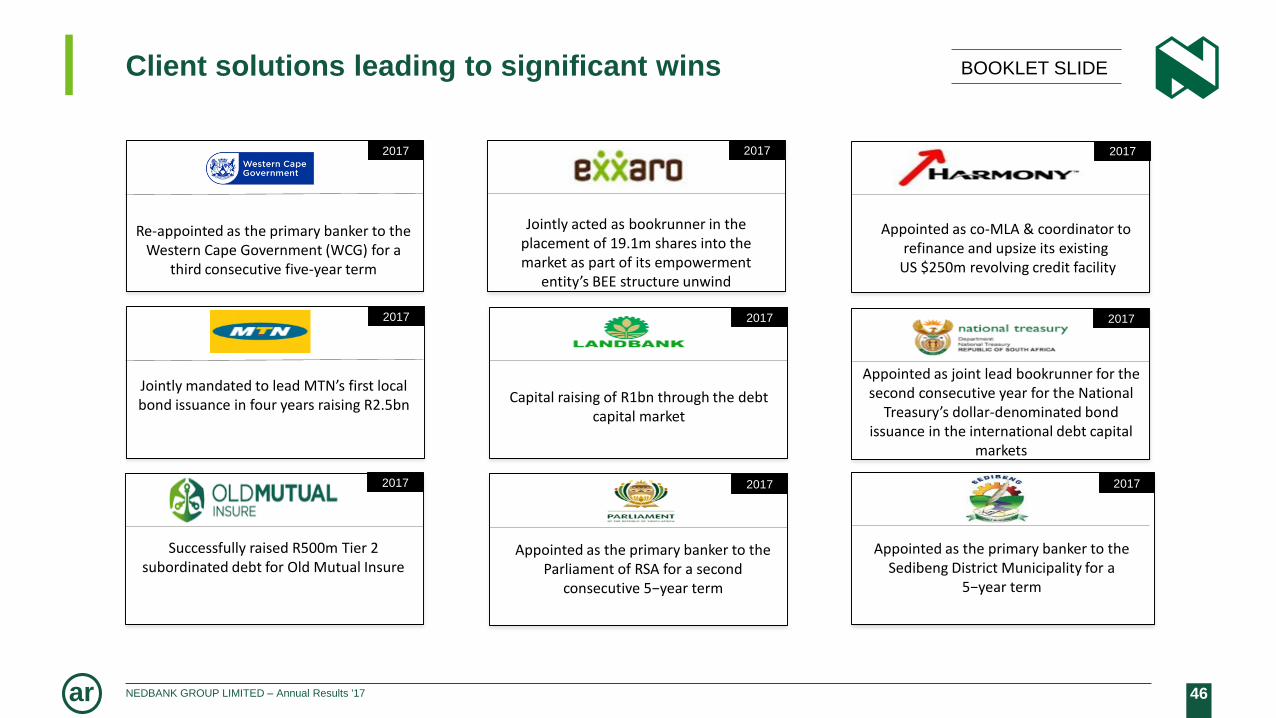
Client solutions leading to significant wins
2017
2017
2017
2017
2017
Jointly acted as bookrunner in the placement of 19.1m shares into the market as part of its empowerment
entity’s BEE structure unwind
Appointed as co-MLA & coordinator to refinance and upsize its existing
US $250m revolving credit facility
Jointly mandated to lead MTN’s first local bond issuance in four years raising R2.5bn Capital raising of R1bn through the debt
capital market
Appointed as joint lead bookrunner for the second consecutive year for the National
Treasury’s dollar-denominated bond issuance in the international debt capital
markets
Appointed as the primary banker to the Parliament of RSA for a second
consecutive 5−year term
Successfully raised R500m Tier 2 subordinated debt for Old Mutual Insure
Appointed as the primary banker to the Sedibeng District Municipality for a
5−year term
2017
20172017
BOOKLET SLIDE
2017
Re-appointed as the primary banker to the Western Cape Government (WCG) for a
third consecutive five-year term

47NEDBANK GROUP LIMITED – Annual Results '17ar
Delivering innovative market-leading client experiences
Executive EySightTM
Real-time client & management
information insight
Robotics Process Automation
Improve efficiencies, accuracy
& quality of work
Technology
Enhancing client experiences
Client
Intelligence
Platform
Executive
EySightTM
First implementations delivering benefits Implementations | Pilots
Cross-sell & client servicing benefits
135 processes identified
Potential cost-savings in man hours
Insight into client cross-or up-sell
opportunities
Continuous enhancements leading to
management insights & predictive
analytics
Implementation of systems to enhance client experience
Continuous testing of disruptive technologies to improve the way we do business
48NEDBANK GROUP LIMITED – Annual Results '17ar
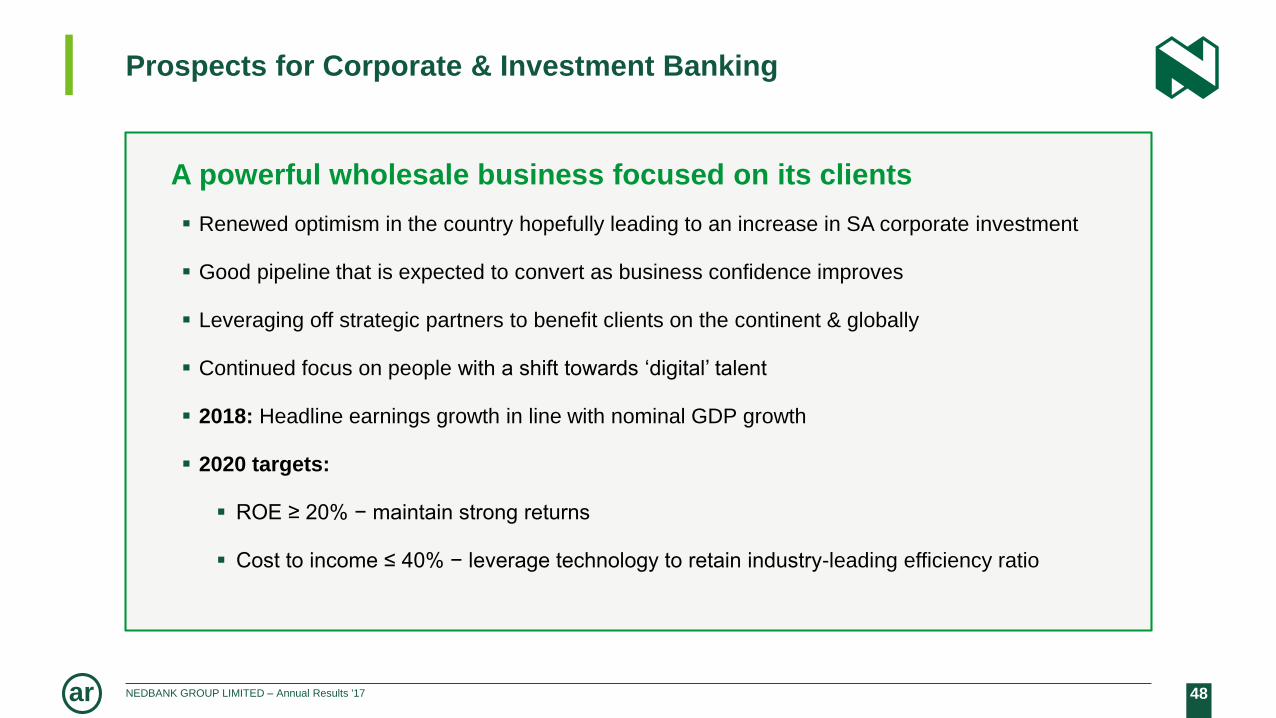
Prospects for Corporate & Investment Banking
A powerful wholesale business focused on its clients
Renewed optimism in the country hopefully leading to an increase in SA corporate investment
Good pipeline that is expected to convert as business confidence improves
Leveraging off strategic partners to benefit clients on the continent & globally
Continued focus on people with a shift towards ‘digital’ talent
2018: Headline earnings growth in line with nominal GDP growth
2020 targets:
ROE ≥ 20% − maintain strong returns
Cost to income ≤ 40% − leverage technology to retain industry-leading efficiency ratio

49NEDBANK GROUP LIMITED – Annual Results '17ar
Ongoing ROE improvement
and good earnings growth
in a difficult environment
NEDBANK RETAIL
& BUSINESS
BANKING
CIKO THOMAS
50NEDBANK GROUP LIMITED – Annual Results '17ar
3468
40
31
44
60
49
60
53
02
13.014.6
16.6
18.9 19.1
-2.0
3.0
8.0
13.0
18.0
23.0
28.0
(1 000)
1 000
3 000
5 000
7 000
9 000
11 000
13 14 15 16 17
Headline earnings (Rm) ROE (%)
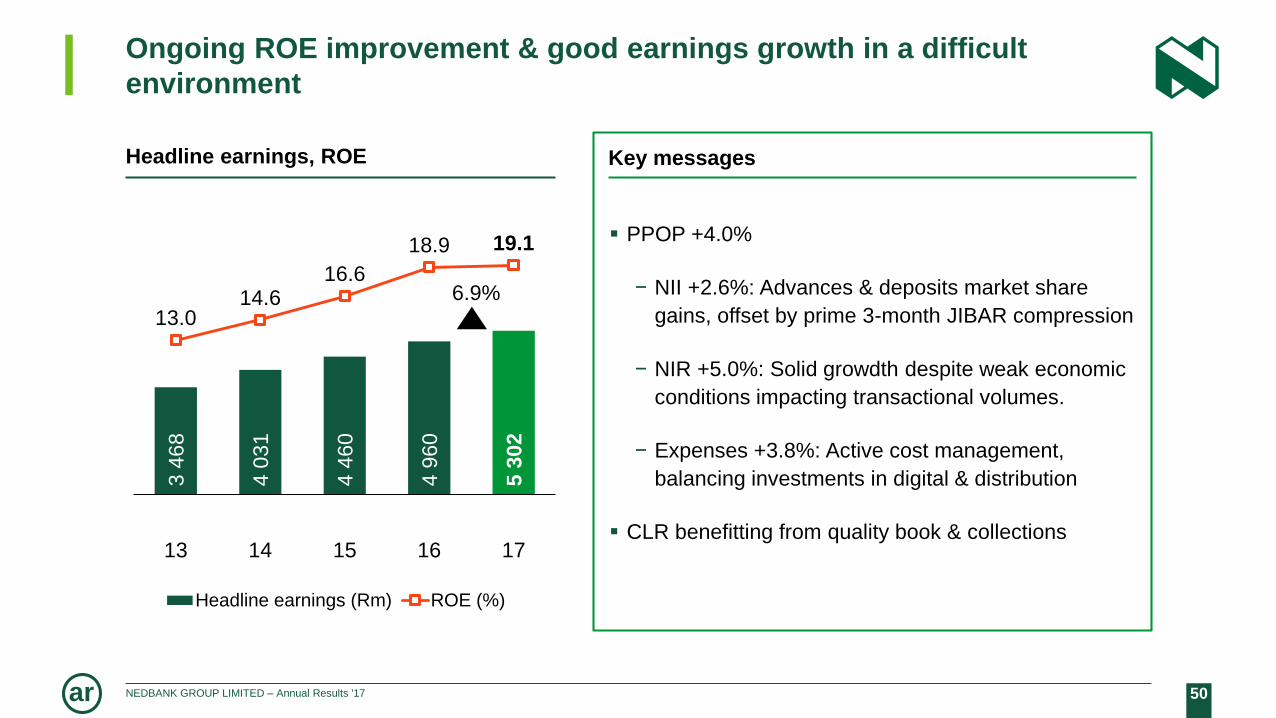
Ongoing ROE improvement & good earnings growth in a difficult
environment
Key messages
PPOP +4.0%
− NII +2.6%: Advances & deposits market share
gains, offset by prime 3-month JIBAR compression
− NIR +5.0%: Solid growdth despite weak economic
conditions impacting transactional volumes.
− Expenses +3.8%: Active cost management,
balancing investments in digital & distribution
CLR benefitting from quality book & collections
Headline earnings, ROE
6.9%

51NEDBANK GROUP LIMITED – Annual Results '17ar
45%55%
Headline earnings
33%
67%
Assets
Nedbank RBB Other clustersYear ended % change 2017 2016
Headline earnings (Rm) 6.9 5 302 4 960
Operating income (Rm) 4.1 26 880 25 810
PPOP (Rm) 4.0 10 606 10 199
Net interest margin (%) 5.81 6.08
NIR-to-expense ratio (%) 64.3 63.6
Efficiency ratio (%) 63.6 63.4
Credit loss ratio (%) 1.06 1.12
Average banking advances (Rm) 4.2 294 930 282 992
Average deposits (Rm) 9.2 281 779 257 968
Headline economic profit 1 (Rm) 13.3 1 394 1 230
Allocated capital (Rm) 5.9 27 812 26 254
ROE (%) 19.1 18.9
Retail & Business Banking – financial highlights BOOKLET SLIDE
1 Cost of equity 2016: 14.2%. | 2017: 14.0%.

52NEDBANK GROUP LIMITED – Annual Results '17ar
3 713 4 019 4 184
1 385 1 430 1 616
4 223 4 566
4 737
15 16 17
Retail transactional NIR growth ahead of client growth – deeper
client penetration
Total retail client base (#000) Retail NIR (Rm)
4 377 4 633 4 755
2 703 2 784 2 783
15 16 17
Retail excl
main-
banked
Total7 5387 417
7 080
+4.8%
+3.0%
0.0%
Main-
banked
+1.6%
Transactional
Other
Total
10 0159 321
+5.2%
+7.4%
+6.0%
+6.9%
10 537
Consumer
card issuing
53NEDBANK GROUP LIMITED – Annual Results '17ar
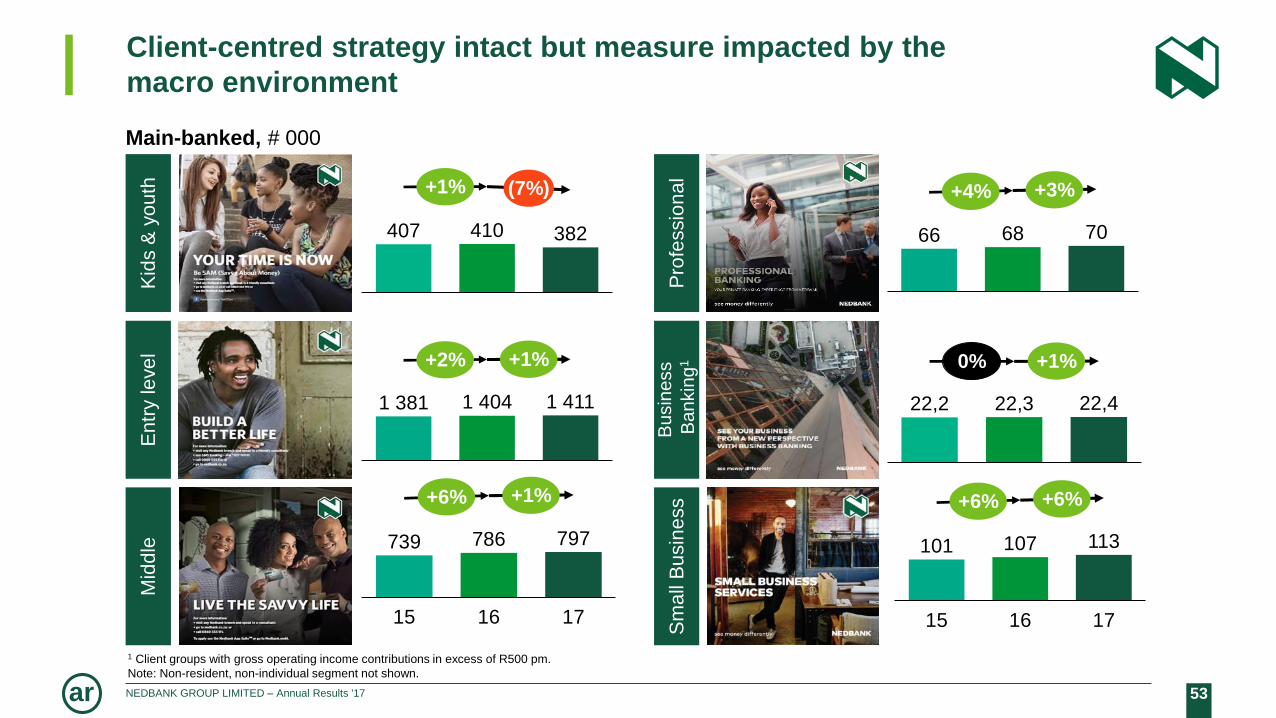
Client-centred strategy intact but measure impacted by the
macro environment
Main-banked, # 000K
ids &
yo
uth
Entr
y le
ve
lM
idd
le
Pro
fessio
na
lS
ma
ll B
usin
ess
Bu
sin
ess
Ba
nkin
g1
1 Client groups with gross operating income contributions in excess of R500 pm.
Note: Non-resident, non-individual segment not shown.
15 16 17
739 786 797
+6% +1%
1615
107
17
101 113
+6% +6%
7066 68
+4% +3%
382407 410
+1% (7%)
22,2 22,3 22,4
0% +1%
1 404 1 4111 381
+2% +1%
54NEDBANK GROUP LIMITED – Annual Results '17ar
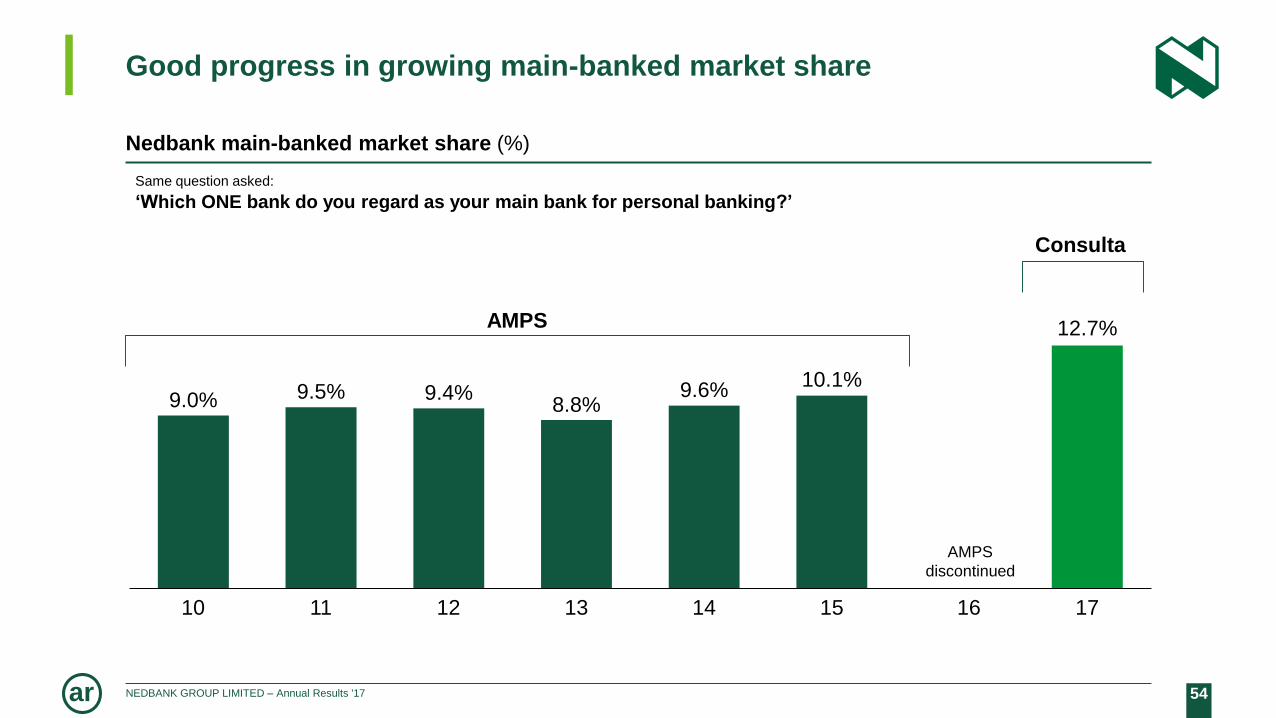
Good progress in growing main-banked market share
9.0% 9.5% 9.4%8.8%
9.6%10.1%
12.7%
1210 11 13 1714 1615
Nedbank main-banked market share (%)
AMPS
Consulta
Same question asked:
‘Which ONE bank do you regard as your main bank for personal banking?’
AMPS
discontinued
55NEDBANK GROUP LIMITED – Annual Results '17ar
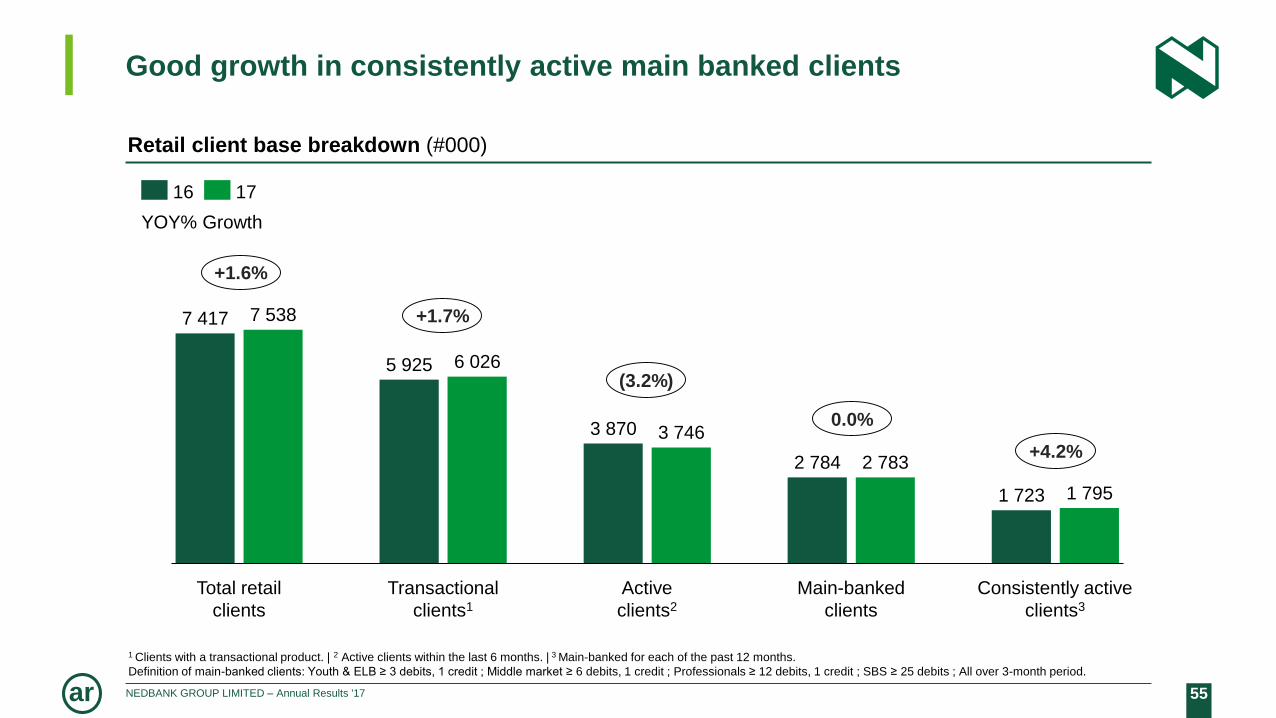
Good growth in consistently active main banked clients
Total retail
clients
Transactional
clients1
Active
clients2
Main-banked
clients
Retail client base breakdown (#000)
Consistently active
clients3
2 7832 784
6 026
7 417 7 538
5 925
3 7463 870
1 723 1 795
16 17
YOY% Growth
+1.6%
+1.7%
(3.2%)
0.0%
+4.2%
1 Clients with a transactional product. | 2 Active clients within the last 6 months. | 3 Main-banked for each of the past 12 months.
Definition of main-banked clients: Youth & ELB ≥ 3 debits, 1 credit ; Middle market ≥ 6 debits, 1 credit ; Professionals ≥ 12 debits, 1 credit ; SBS ≥ 25 debits ; All over 3-month period.
56NEDBANK GROUP LIMITED – Annual Results '17ar
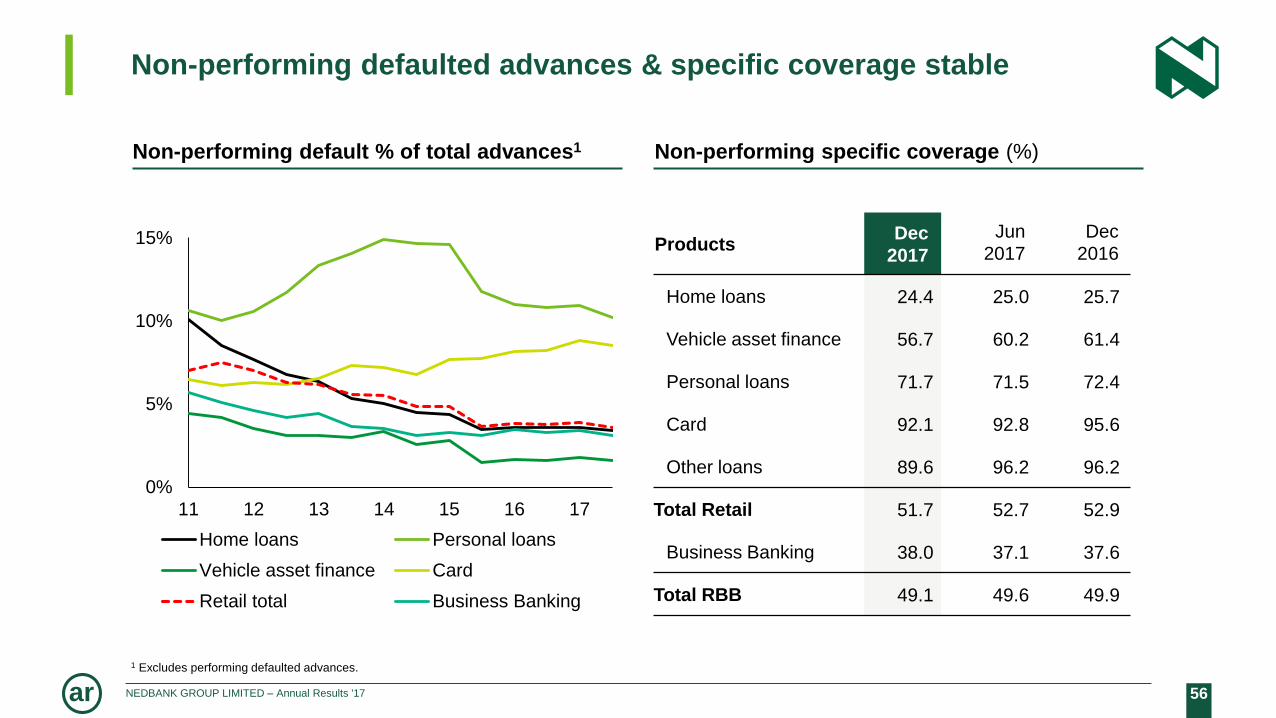
Non-performing defaulted advances & specific coverage stable
ProductsDec
2017
Jun
2017
Dec
2016
Home loans 24.4 25.0 25.7
Vehicle asset finance 56.7 60.2 61.4
Personal loans 71.7 71.5 72.4
Card 92.1 92.8 95.6
Other loans 89.6 96.2 96.2
Total Retail 51.7 52.7 52.9
Business Banking 38.0 37.1 37.6
Total RBB 49.1 49.6 49.9
0%
5%
10%
15%
11 12 13 14 15 16 17
Home loans Personal loans
Vehicle asset finance Card
Retail total Business Banking
Non-performing default % of total advances1 Non-performing specific coverage (%)
1 Excludes performing defaulted advances.
57NEDBANK GROUP LIMITED – Annual Results '17ar
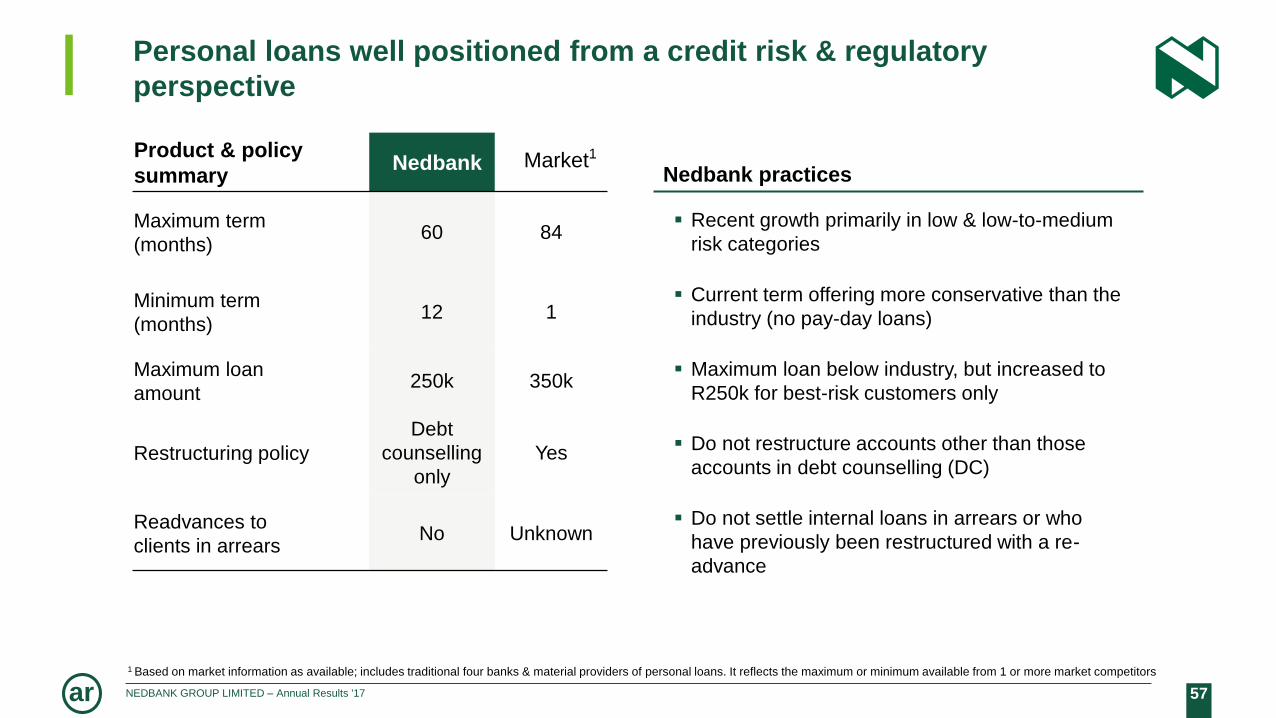
Personal loans well positioned from a credit risk & regulatory
perspective
Product & policy
summaryNedbank Market1
Maximum term
(months)60 84
Minimum term
(months)12 1
Maximum loan
amount250k 350k
Restructuring policy
Debt
counselling
only
Yes
Readvances to
clients in arrearsNo Unknown
Nedbank practices
Recent growth primarily in low & low-to-medium
risk categories
Current term offering more conservative than the
industry (no pay-day loans)
Maximum loan below industry, but increased to
R250k for best-risk customers only
Do not restructure accounts other than those
accounts in debt counselling (DC)
Do not settle internal loans in arrears or who
have previously been restructured with a re-
advance
1 Based on market information as available; includes traditional four banks & material providers of personal loans. It reflects the maximum or minimum available from 1 or more market competitors

58NEDBANK GROUP LIMITED – Annual Results '17ar
Accelerated digitisation of technology & operations
Change in 2017Deposit volumes (# 000)
48%
2015
23%
2017
34%
2016
27 81829 594 29 256
+3%
Traditional deposits Self-service deposits
>100%
(5%)
30%
Launched 2017
21%
38%
18%
(13%)
130k
39%
Digital clients1 (# 000)
5 784
Enabled
5 3442
3 354
+31%
Dec’15 Dec’17Dec’16
891
Active
788852
+6%
Devices
Intelligent Depositors
ATMs
Video bankers
Self-service kiosks
Interactive tellers
Volumes
Digital volumes
Total App usage
Money App registrations
ID deposits
Teller activity
1 Digitally enabled & active clients have been restated to include all digital channels & to allow for only last 90 days of recent activity.2 Growth largely as a result of the Digital Activation Programme run in Q4 2016.

59NEDBANK GROUP LIMITED – Annual Results '17ar
Floor space saved
(m2)
639 593
453391
277
171
255304
336
10 14 15 16 17
Traditional New-image
Integrated channels – efficient use of space & staff,
optimising branch footprint
10 14 15 16 17
Outlets format mix
(#)
Total & new-image outlets
(#)
13 695
18 743
764708 695
7 273
Cumulative target >30 000 m2
by 2020
639
452 500 504 507 512
4371 55 40 0
144
193149 148
101
10 14 15 16 17
Branches Personal Loans
Inretailers
764708 695
63924 485613 613
BOOKLET SLIDE
60NEDBANK GROUP LIMITED – Annual Results '17ar
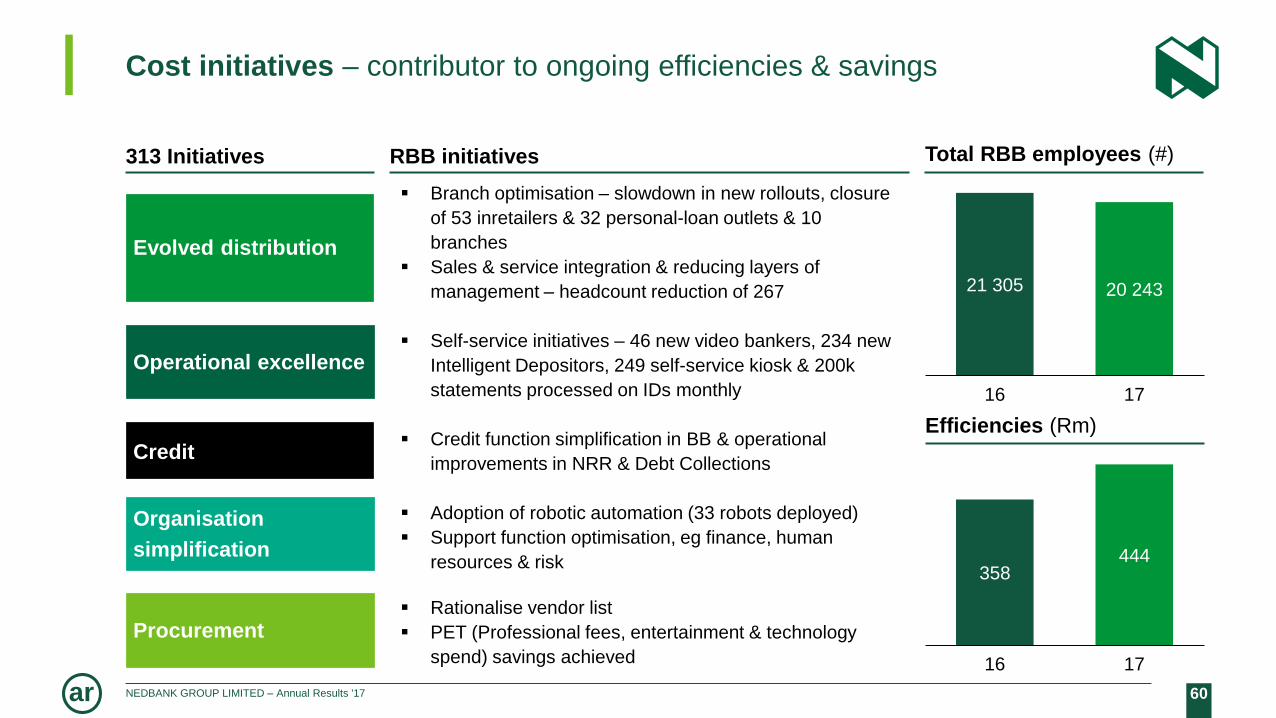
Cost initiatives – contributor to ongoing efficiencies & savings
313 Initiatives
Credit
Evolved distribution
Organisation
simplification
Procurement
Operational excellence
Branch optimisation – slowdown in new rollouts, closure
of 53 inretailers & 32 personal-loan outlets & 10
branches
Sales & service integration & reducing layers of
management – headcount reduction of 267
Self-service initiatives – 46 new video bankers, 234 new
Intelligent Depositors, 249 self-service kiosk & 200k
statements processed on IDs monthly
Credit function simplification in BB & operational
improvements in NRR & Debt Collections
Adoption of robotic automation (33 robots deployed)
Support function optimisation, eg finance, human
resources & risk
Rationalise vendor list
PET (Professional fees, entertainment & technology
spend) savings achieved
RBB initiatives Total RBB employees (#)
Efficiencies (Rm)
21 305 20 243
16 17
358444
16 17

61NEDBANK GROUP LIMITED – Annual Results '17ar
Delivering innovative market-leading client experiences
UNLOCKED.ME
Innovative lifestyle e-commerce platform
Banking’s first
UNLOCKED.ME brings together three pillars, It is a
platform which will allow you to unlock your lifestyle,
your potential and your money.
It is full of unique experiences, sure to thrill our youth
target audience. It is our first lifestyle market place,
designed with our clients in mind.
Payment solutions
Winning in digital
Worldclass banking apps
The Nedbank Money app features user-centred
design for basic banking with self service
capabilities.
The Karri App is an integrated, mobile payment
solution, to reduce the handling of cash at
schools
Digital branch
SA’s first digital branch
– entirely self-service
Leading in digital outlets
Launched at Gautrain Sandton Station (Sept ‘17)
Technology available: Intelligent Depositor, video
banking, quick-chat banking, self service kiosk,
virtual reality, grab-and-learn wall, interactive demo
station, facial recognition
62NEDBANK GROUP LIMITED – Annual Results '17ar
Prospects for Retail & Business Banking
Building sustainable, profitable businesses through the cycle
Grow transactional clients faster than the market through focus on acquisition, retention & cross-sell, enabled by:
− Digital First, First in Digital – accelerate digitisation of key client journeys & services to make it simple & easy for
clients to transact with us
− Disruptive CVPs – accelerate financial inclusivity of our banking propositions & to find ways to reduce transacting
costs for our clients, & tapping into ecosystem-based propositions
− Sales & service excellence – continue to innovate & rollout digital branches to enable clients to migrate to digital
channels, & empower our staff with digital tools to serve clients
− Loyalty & rewards – deliver new differentiated loyalty & reward programme
2018: Headline earnings growth in line with nominal GDP (H1 2018 growth likely to be slower than H2 2018)
2020 targets:
ROE ≥ 20% − ongoing improvement, underpinned by lower cost-to-income ratio & relative CLR outperformance
through the cycle
Cost to income ≤ 58% − enabled by improved client experience, transactional market share gains, continued quality
origination & operational efficiencies
63NEDBANK GROUP LIMITED – Annual Results '17ar
A challenging year
NEDBANK
WEALTH
IOLANDA RUGGIERO
64NEDBANK GROUP LIMITED – Annual Results '17ar
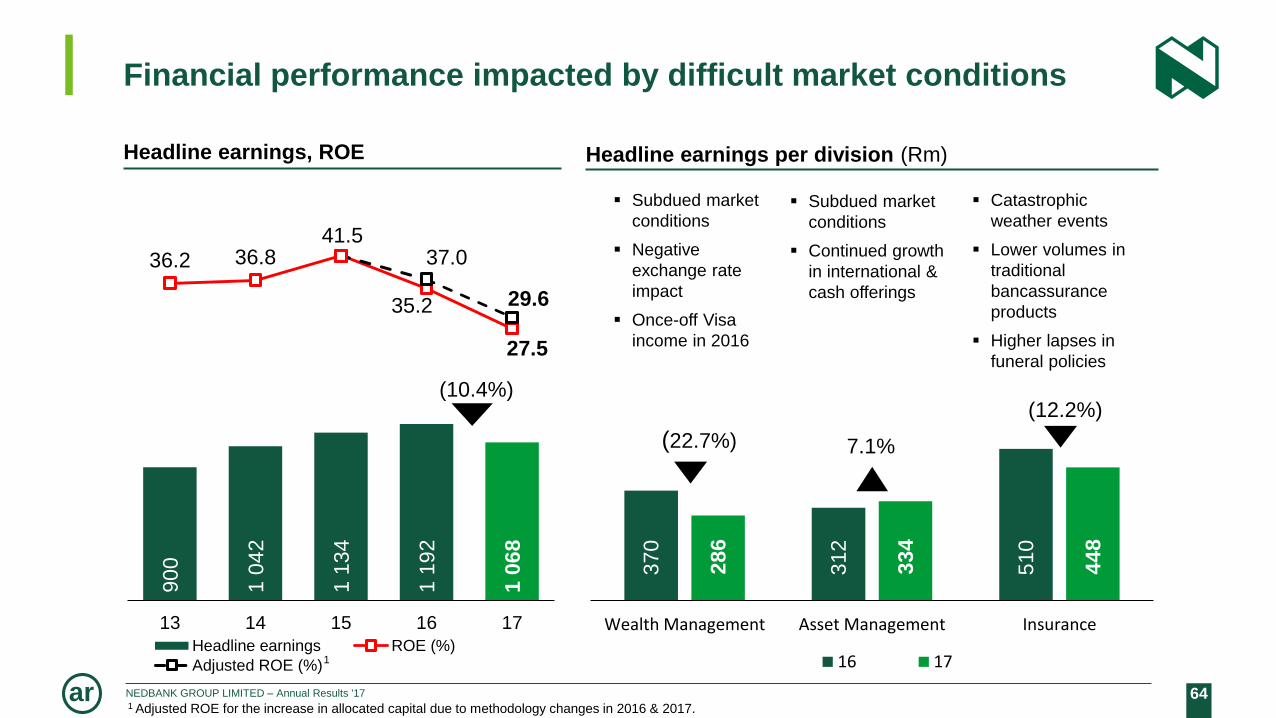
90
0
10
42
11
34
11
92
10
68
36.2 36.841.5
35.2
27.5
37.0
29.6
13 14 15 16 17
Headline earnings ROE (%)
Adjusted ROE (%)
Financial performance impacted by difficult market conditions
Headline earnings, ROE
(10.4%)
Headline earnings per division (Rm)
370
31
2
51
0
28
6
33
4
44
8
Wealth Management Asset Management Insurance
16 17
Catastrophic
weather events
Lower volumes in
traditional
bancassurance
products
Higher lapses in
funeral policies
Subdued market
conditions
Continued growth
in international &
cash offerings
Subdued market
conditions
Negative
exchange rate
impact
Once-off Visa
income in 2016
1 Adjusted ROE for the increase in allocated capital due to methodology changes in 2016 & 2017.
1
(22.7%) 7.1%
(12.2%)
65NEDBANK GROUP LIMITED – Annual Results '17ar
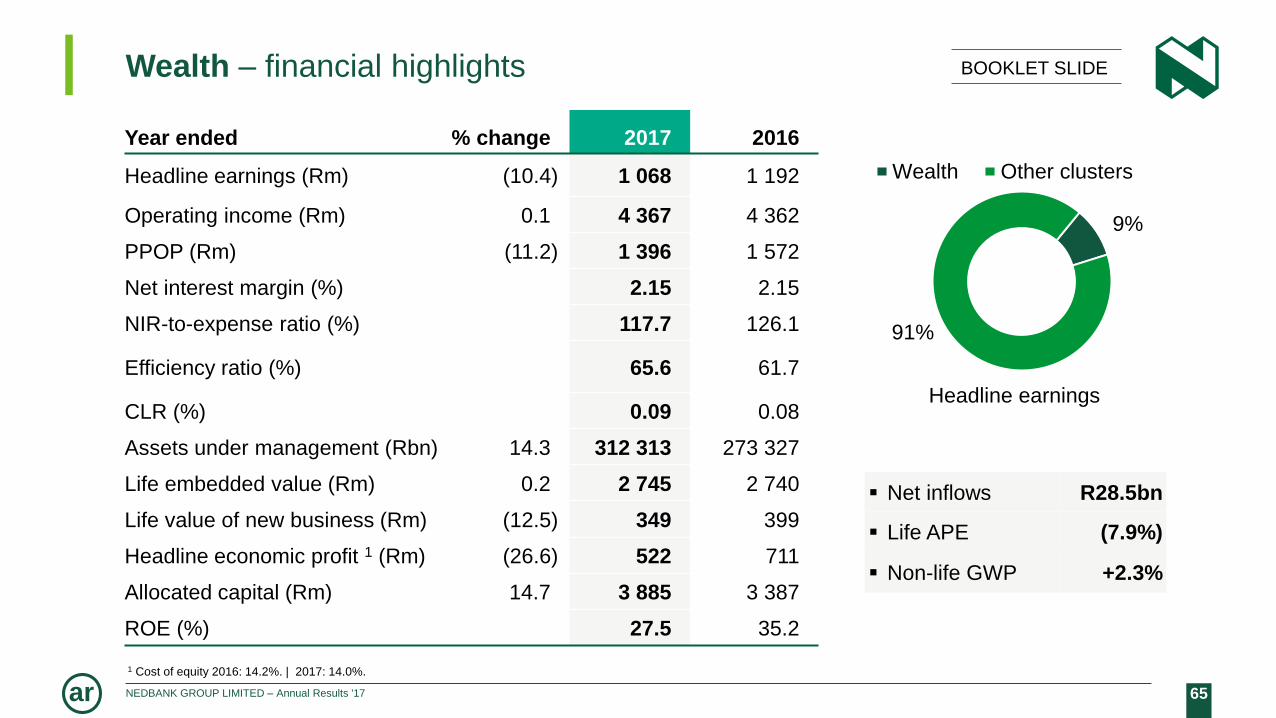
Year ended % change 2017 2016
Headline earnings (Rm) (10.4) 1 068 1 192
Operating income (Rm) 0.1 4 367 4 362
PPOP (Rm) (11.2) 1 396 1 572
Net interest margin (%) 2.15 2.15
NIR-to-expense ratio (%) 117.7 126.1
Efficiency ratio (%) 65.6 61.7
CLR (%) 0.09 0.08
Assets under management (Rbn) 14.3 312 313 273 327
Life embedded value (Rm) 0.2 2 745 2 740
Life value of new business (Rm) (12.5) 349 399
Headline economic profit 1 (Rm) (26.6) 522 711
Allocated capital (Rm) 14.7 3 885 3 387
ROE (%) 27.5 35.2
BOOKLET SLIDE
9%
91%
Headline earnings
Wealth Other clusters
Net inflows R28.5bn
Life APE (7.9%)
Non-life GWP +2.3%
Wealth – financial highlights
1 Cost of equity 2016: 14.2%. | 2017: 14.0%.
66NEDBANK GROUP LIMITED – Annual Results '17ar
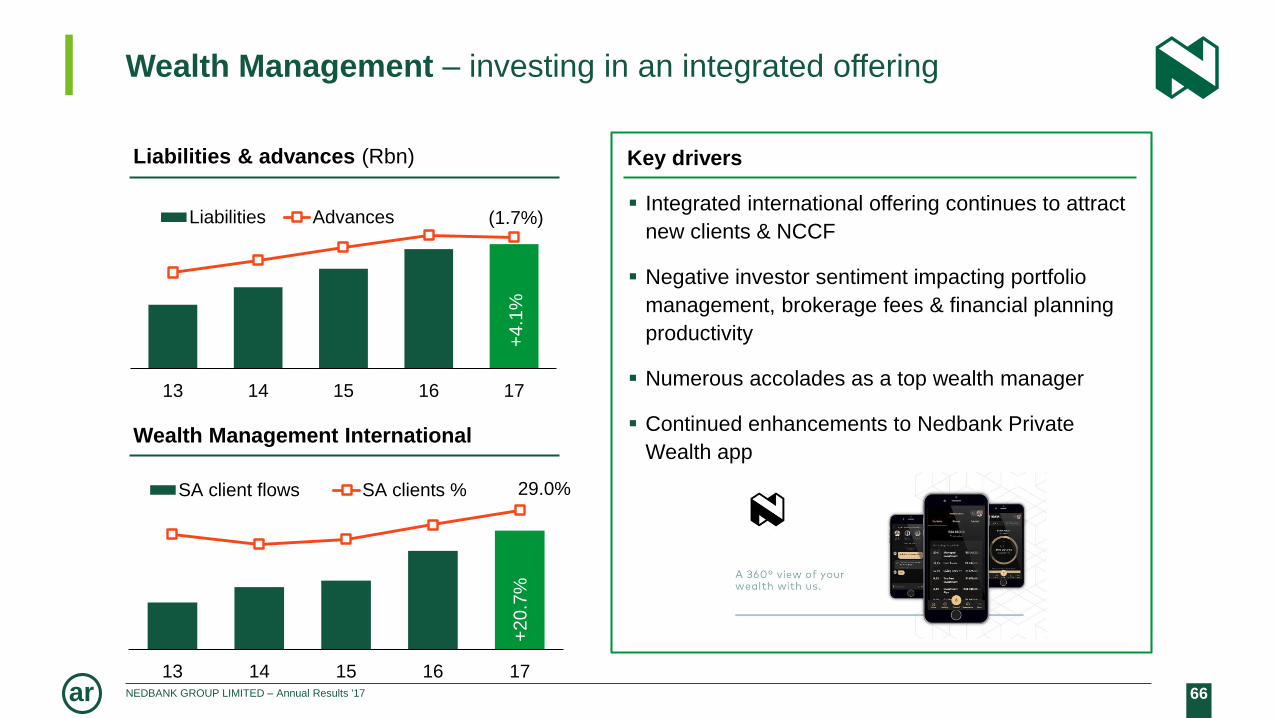
+4.1
%
(1.7%)
13 14 15 16 17
Liabilities Advances
Wealth Management – investing in an integrated offering
Key drivers
Integrated international offering continues to attract
new clients & NCCF
Negative investor sentiment impacting portfolio
management, brokerage fees & financial planning
productivity
Numerous accolades as a top wealth manager
Continued enhancements to Nedbank Private
Wealth app
Liabilities & advances (Rbn)
Wealth Management International
+2
0.7
%
29.0%
13 14 15 16 17
SA client flows SA clients %
67NEDBANK GROUP LIMITED – Annual Results '17ar
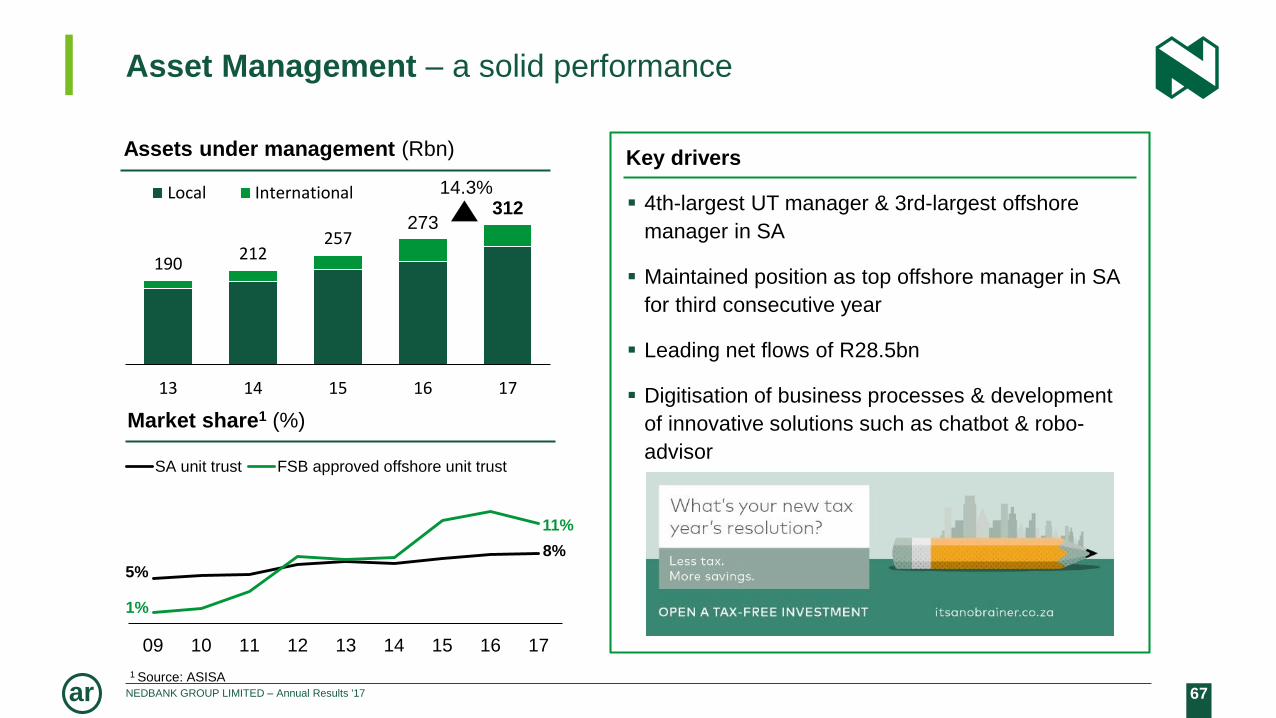
190212
257273
312
13 14 15 16 17
Local International
Asset Management – a solid performance
Key drivers
4th-largest UT manager & 3rd-largest offshore
manager in SA
Maintained position as top offshore manager in SA
for third consecutive year
Leading net flows of R28.5bn
Digitisation of business processes & development
of innovative solutions such as chatbot & robo-
advisor
Assets under management (Rbn)
Market share1 (%)
14.3%
1 Source: ASISA
09 10 11 12 13 14 15 16 17
SA unit trust FSB approved offshore unit trust
8%
11%
5%
1%

68NEDBANK GROUP LIMITED – Annual Results '17ar
399
349
-
50
100
150
200
250
13 14 15 16 17
Insurance – a tough year
Key drivers
Earnings impacted by catastrophic weather events
resulting in higher claims & lower volumes in
traditional bancassurance products, partially offset
by a release of reserves
Decline in VNB driven by lower single-premium
investment policies, an increase in lapses & funeral
acquisition costs as well as pressure on margins
Digital solutions launched, including chatbot &
geyser telemetry
Life value of new business (Rm)
Non-life gross written premiums (Rm)
(12.5%)
1 1
18
1 1
44
13 14 15 16 17
2.3%
69NEDBANK GROUP LIMITED – Annual Results '17ar
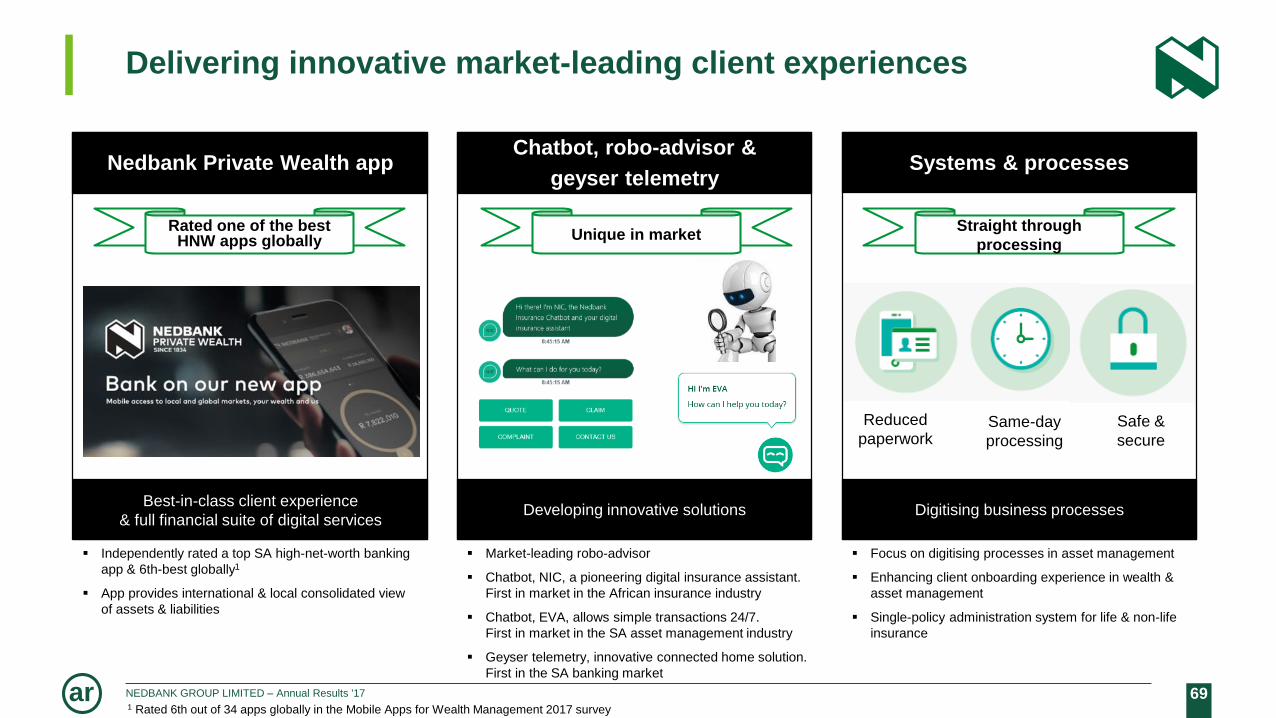
Delivering innovative market-leading client experiences
Chatbot, robo-advisor &
geyser telemetry
Developing innovative solutions
Systems & processes
Digitising business processes
Unique in marketStraight through
processing
Nedbank Private Wealth app
Best-in-class client experience
& full financial suite of digital services
Rated one of the best HNW apps globally
1 Rated 6th out of 34 apps globally in the Mobile Apps for Wealth Management 2017 survey
Reduced
paperworkSame-day
processing
Safe &
secure
Market-leading robo-advisor
Chatbot, NIC, a pioneering digital insurance assistant.
First in market in the African insurance industry
Chatbot, EVA, allows simple transactions 24/7.
First in market in the SA asset management industry
Geyser telemetry, innovative connected home solution.
First in the SA banking market
Focus on digitising processes in asset management
Enhancing client onboarding experience in wealth &
asset management
Single-policy administration system for life & non-life
insurance
Independently rated a top SA high-net-worth banking
app & 6th-best globally1
App provides international & local consolidated view
of assets & liabilities
70NEDBANK GROUP LIMITED – Annual Results '17ar
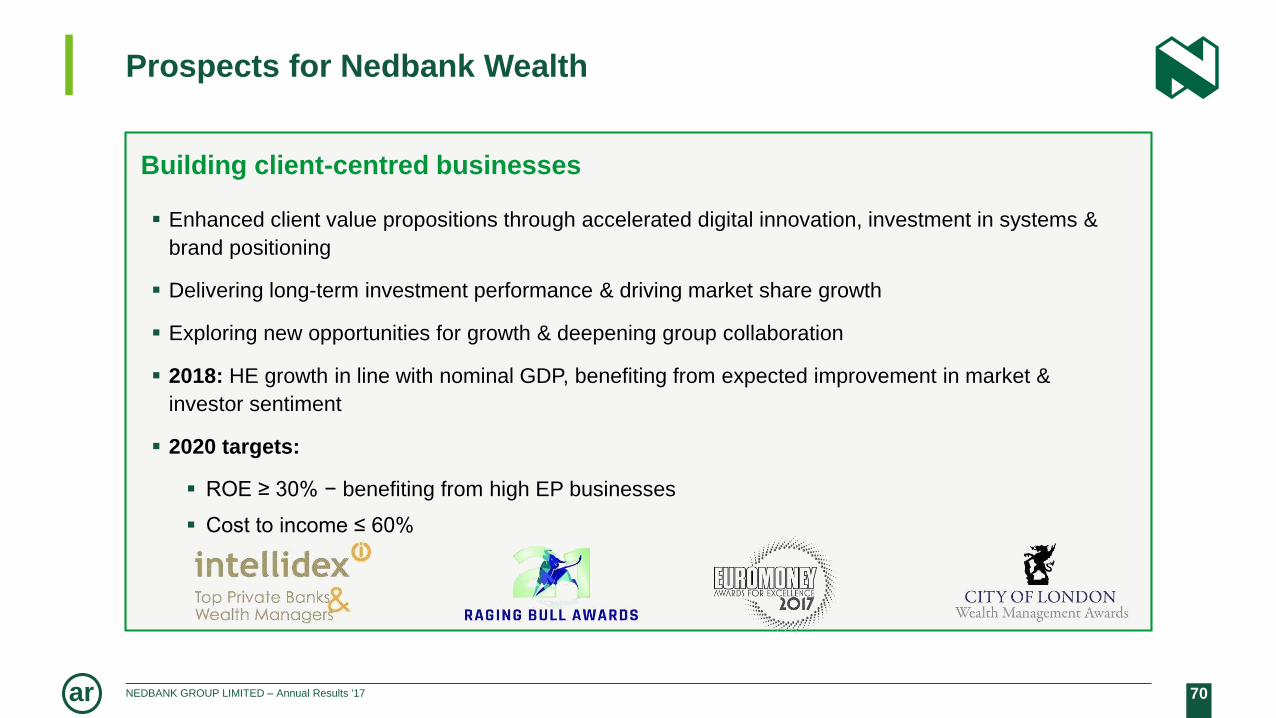
Prospects for Nedbank Wealth
Building client-centred businesses
Enhanced client value propositions through accelerated digital innovation, investment in systems &
brand positioning
Delivering long-term investment performance & driving market share growth
Exploring new opportunities for growth & deepening group collaboration
2018: HE growth in line with nominal GDP, benefiting from expected improvement in market &
investor sentiment
2020 targets:
ROE ≥ 30% − benefiting from high EP businesses
Cost to income ≤ 60%

71NEDBANK GROUP LIMITED – Annual Results '17ar
SADC – investing for growth
and driving client value
ETI – steady progress,
outlook improving
REST OF AFRICA
MFUNDO NKUHLU
72NEDBANK GROUP LIMITED – Annual Results '17ar
-15
-10
-5
0
5
10
-1400.0
-1200.0
-1000.0
-800.0
-600.0
-400.0
-200.0
0.0
200.0
400.0
600.0
16 17
HE SADC (Rm) HE ETI (Rm)
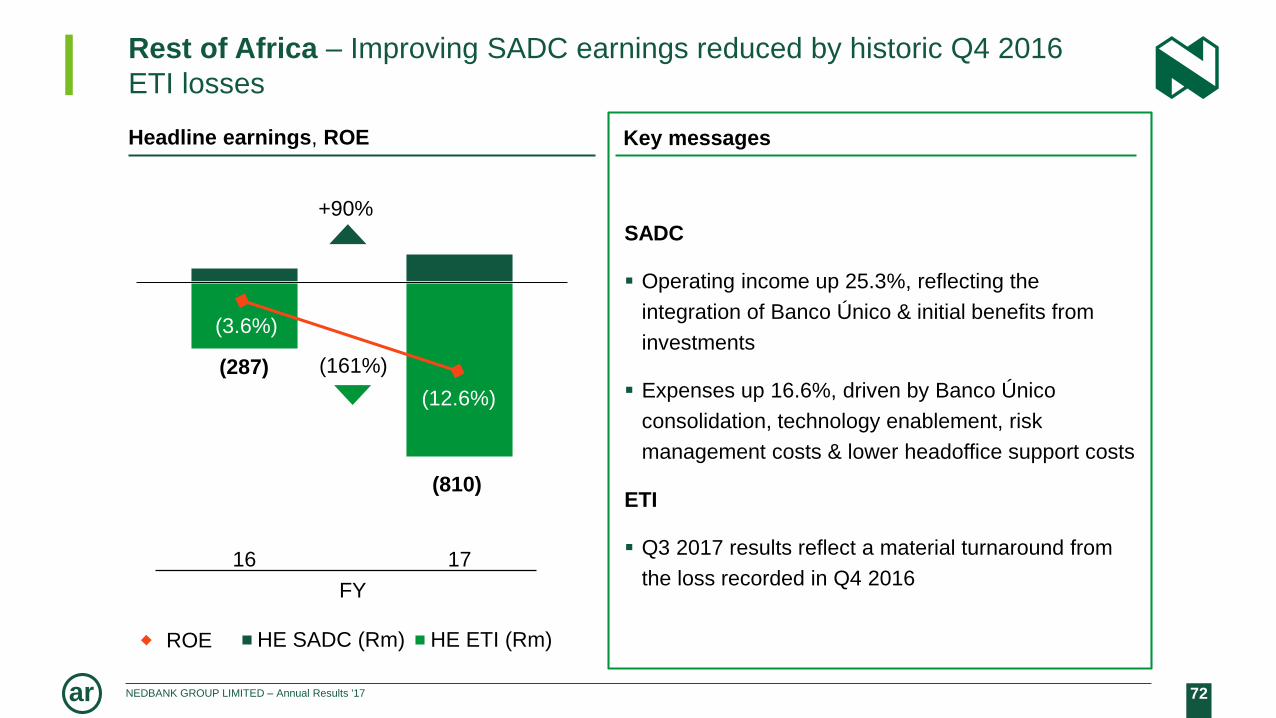
Rest of Africa – Improving SADC earnings reduced by historic Q4 2016
ETI losses
Headline earnings, ROE
+90%
(287)
(810)
FY
(161%)
Key messages
SADC
Operating income up 25.3%, reflecting the
integration of Banco Único & initial benefits from
investments
Expenses up 16.6%, driven by Banco Único
consolidation, technology enablement, risk
management costs & lower headoffice support costs
ETI
Q3 2017 results reflect a material turnaround from
the loss recorded in Q4 2016
(3.6%)
(12.6%)
ROE
73NEDBANK GROUP LIMITED – Annual Results '17ar
4%
96%
Assets
Rest of Africa Other clusters
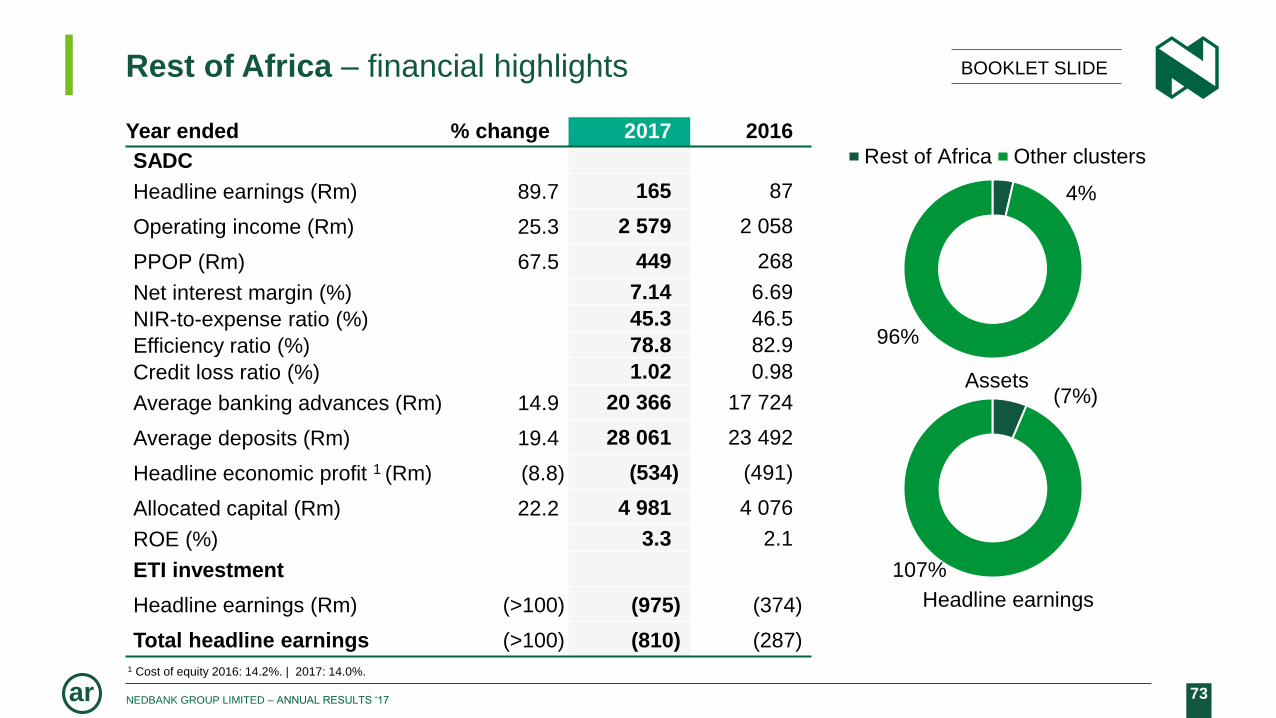
Rest of Africa – financial highlights
NEDBANK GROUP LIMITED – ANNUAL RESULTS ‘17
Year ended % change 2017 2016
SADC
Headline earnings (Rm) 89.7 165 87
Operating income (Rm) 25.3 2 579 2 058
PPOP (Rm) 67.5 449 268
Net interest margin (%) 7.14 6.69
NIR-to-expense ratio (%) 45.3 46.5
Efficiency ratio (%) 78.8 82.9
Credit loss ratio (%) 1.02 0.98
Average banking advances (Rm) 14.9 20 366 17 724
Average deposits (Rm) 19.4 28 061 23 492
Headline economic profit 1 (Rm) (8.8) (534) (491)
Allocated capital (Rm) 22.2 4 981 4 076
ROE (%) 3.3 2.1
ETI investment
Headline earnings (Rm) (>100) (975) (374)
Total headline earnings (>100) (810) (287)
(7%)
107%
Headline earnings
BOOKLET SLIDE
1 Cost of equity 2016: 14.2%. | 2017: 14.0%.

74NEDBANK GROUP LIMITED – Annual Results '17ar
156
68
178
73
28
19
30
20
SADC – Enhanced client value propositions to drive growth
Clients (# 000)
Branches & ATMs
Other subsidiariesBanco Único
Investments made
… with the following key outcomes
Enhanced digital channel access
Deeper client relationships
Improved client value propositions
Improved service
Improved risk management capabilities
Banking app (#000)
Online activations (#000)
18
462
4
+148%
29 36
910
+22%
4638
50
20
274 314
2122
+14%
336
1716
295
Core banking systems Mobile platforms
Risk management
Payment solutionsCard offering
BranchATM BranchATM
184
87
208
93
1716
1716 1716

75NEDBANK GROUP LIMITED – Annual Results '17ar
SADC – Delivering innovative market-leading client experiences
Transactional
Online product application &
debit order switching
Insurance
Life & funeral cover offering
Improved value propositions
Build bancassurancebusiness
Digital
A unique mobile banking solution
for business
Leading in digital
Banco Único Mozambique MBCA1Nedbank Namibia 1 To be rebranded Nedbank Zimbabwe in H1 2018
76NEDBANK GROUP LIMITED – Annual Results '17ar
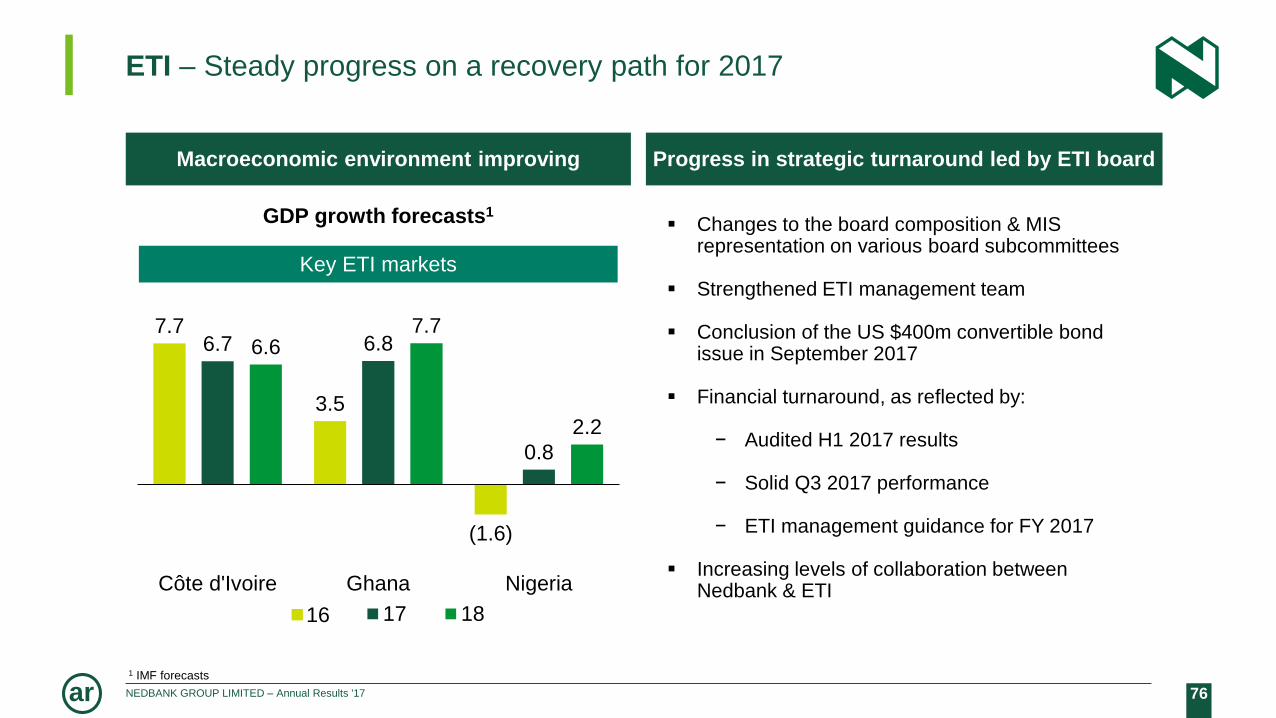
ETI – Steady progress on a recovery path for 2017
Macroeconomic environment improving Progress in strategic turnaround led by ETI board
Changes to the board composition & MIS representation on various board subcommittees
Strengthened ETI management team
Conclusion of the US $400m convertible bond issue in September 2017
Financial turnaround, as reflected by:
− Audited H1 2017 results
− Solid Q3 2017 performance
− ETI management guidance for FY 2017
Increasing levels of collaboration between Nedbank & ETI
1 IMF forecasts
7.7
3.5
(1.6)
6.7 6.8
0.8
6.67.7
2.2
Côte d'Ivoire Ghana Nigeria
GDP growth forecasts1
17 18
Key ETI markets
16

77NEDBANK GROUP LIMITED – Annual Results '17ar
Nedbank – Ecobank collaboration – integrated crossborder transfer
solution (initially outbound only)
African migrants
2.7m
Market size: Remittance
value SA – Rest of Africa
R14−19bn
Through mobile/digital
channels internationally
25%
Through international cash
transfers
60%
Through traditional banking
channels internationally
5%
Access & distributionOpportunity Differentiation 1
Lowest cost to client in the
industry (no third parties)
Cheap
Instant cross border transfer
– subject to regulatory &
compliance checks (other
solutions 10 min to 2 days)
Quick
Usage across all channels
– initially account to account,
mobile app & website.
Moving to wallet, USSD,
ATM, branches, etc
Available in 33 countries
24 hours – initially business
operating hours, moving to
24/7
Easy
1 Key competing products include Mukuru, hello (PAISA), Western Union (BGA), MoneyGram (FNB & Standard Bank)

78NEDBANK GROUP LIMITED – Annual Results '17ar
Prospects for Rest of Africa
SADC
Create shared value with clients from investments made & reposition the business for the digital age
through improved client experience, improved data analytics, work with partners to accelerate digital
capabilities, implement regional talent management programme & enhanced risk management.
ETI
Shareholders are supportive of the strategic agenda
Leveraging the investment in ETI by:
− capitalising on improved growth prospects across the region, especially West Africa
− exploiting opportunities for greater collaboration
2018: From a headline earning loss in 2017 to a profit in 2018 – expect to be the largest contributor to the
Nedbank Group’s earnings growth rate in the year ahead
2020 targets:
ROE ≥ cost of equity1
Cost-to-income ≤ 60% − creating scale from investments & cost optimisation
1 COE approximately 16%

79NEDBANK GROUP LIMITED – Annual Results '17ar
Ongoing delivery into 2018,
supported by recovery in ETI, laying
the foundation for 2020 targets
STRATEGY & 2018
GUIDANCE
MIKE BROWN
80NEDBANK GROUP LIMITED – Annual Results '17ar
Looking forward
2018 has started with renewed optimism & the structural challenges remaining will be tackled.
Improving business & consumer confidence should lead to cyclical economic upturn off a low base
Momentum in delivering on our strategic focus areas – enhancing client experiences & improving
levels of efficiency through digital innovation is key focus for 2018
Old Mutual managed separation to be materially complete in 2018 – for Nedbank this provides
increased shareholder certainty with free float benefits & for clients & staff it remains business as usual
2018 guidance – stronger earnings growth than in 2017
– Revenue growth recovery off low base
– Ongoing focus on expense optimisation & risk management
– ETI turnaround is a key driver
2020 targets – pathway to ongoing & sustainable improvements in key metrics that support
shareholder value creation

81NEDBANK GROUP LIMITED – Annual Results '17ar
Cyclical economic upturn off a low base
Prospects
Clients
– Increasing levels of consumer & business
confidence. Initial benefits likely in CIB & Wealth
Balance sheet
– Stronger wholesale & retail advances growth
– Liquidity metrics & capital levels to remain
strong
Income statement
– Revenue growth in 2018 higher than 2017
– Impairments to increase cyclically; & IFRS 9
impact
– Expenses continue to be well managed
Assets under management
– Good growth, particularly in cash & offshore
2017 2018 2019 2020
GDP SA 0.9% 1.6% 1.8% 2.4%
GDP SSA 2.4% 3.2% 3.5% 3.5%
Inflation (CPI) 5.3% 5.1% 5.5% 5.5%
Industry credit
growth5.0% 6.5% 7.9% 10.1%
Average prime
interest rate10.4% 10.3% 10.3% 10.7%
Macroeconomic drivers1 (%)
1 Assuming no local currency downgrade | All Nedbank economic unit forecasts as
at 15 February 2018 | GDP SSA as per World Bank.

82NEDBANK GROUP LIMITED – Annual Results '17ar
Strategic focus areas – enhancing client experiences & efficiency through
digital innovation is a key focus for 2018
Delivering innovative market-leading client experiences
Growing our transactional
banking franchise faster
than the market
Being
operationally excellent
in all we do
Managing scarce resources
to optimise economic
outcomes
Providing our clients with
access to the best financial
services network in Africa
Delivered in 2017 … … launching in 2018
Managed Evolution – rationalise, simplify & standardise
core systems (reduced by 122, < 60 by 2020)
Digital Fast Lane & New Ways of Work – more client-
focused, competitive, digital & agile
New apps – Nedbank Private Wealth (rated 6th globally),
Nedbank Money, Karri (school payments)
Channels – NZone (self-service digital branch), Solar
Turtle (deep-rural solar-powered branch), Intelligent
Depositors, video banking
Business optimisation – Executive EySightTM, Robotic
Process Automation (50 software robots)
Pilots – Chatbots, robo-advisors, Blockchain
Platforms – UNLOCKED.ME (millennial market place),
Refreshed Nedbank internet banking platform
Simplified client onboarding – convenient, FICA-
compliant account opening from your couch
Ability to sell an unsecured loan bundled with a
transactional account
New Loyalty & reward programme
Geyser telemetry – reduce electricity usage
Stokvel – a community savings solution
Further rollout of software robots, artificial intelligence,
robo-advisors, chatbots
Integration with ETI remittance app to reach 2.7m people

83NEDBANK GROUP LIMITED – Annual Results '17ar
Listing of Old Mutual Limited
(OML)
Old Mutual managed separation
Business as usual for Nedbank
− No impact on strategy, day-to-day management or operations, nor on staff or clients
− Technology, brand & businesses have not been integrated
− Engagements have been at arm’s length – overseen by independent board structures
− No impact on ongoing OM collaboration in SA & Rest of Africa. > R1bn synergies achieved in 2017 (R393m to Nedbank)
UnbundlingAllow OML shareholder base to transition to an SA & EM investor base
At the earliest
opportunity in 2018,
following OM plc’s
2017 full-year results
announcement
Unbundling of Nedbank Group
ordinary shares to OML
shareholders & OML retaining a
strategic minority shareholding1
of 19.9% in Nedbank Group
(underpins the ongoing
commercial relationship)
Sufficient time for OML’s
shareholder register to
transition to an SA & EM
focused & mandated
investor base
Exit of non-EM
shareholders
Nedbank Group shareholding post
unbundling
Increased index
weightings (free-float
from ~45% to ~80%)
Normalisation of SA
shareholding (mostly
underweight given
holding via OM)
‘Independent’ Nedbank
attractive for SA &
international investors
1 Calculated as OML shareholder funds divided by the total Nedbank Group ordinary shares in issue

84NEDBANK GROUP LIMITED – Annual Results '17ar
2018 guidance
Growth in DHEPS for full-year 2018 more than or equal to growth in nominal GDP +5%, supported by ETI recovery
Average interest-earning banking asset1 growth to increase in line with nominal GDP
growth
NIM slightly above the 2017 level of 3.62%
NII
To increase to within the bottom half of our target range of 60–100 bps (under IFRS 9)
Above mid-single-digit growth
Mid-single-digit growth
CLR
NIR
Expenses
To be positive (ETI associate income reported quarterly in arrear)Associate
income
85NEDBANK GROUP LIMITED – Annual Results '17ar
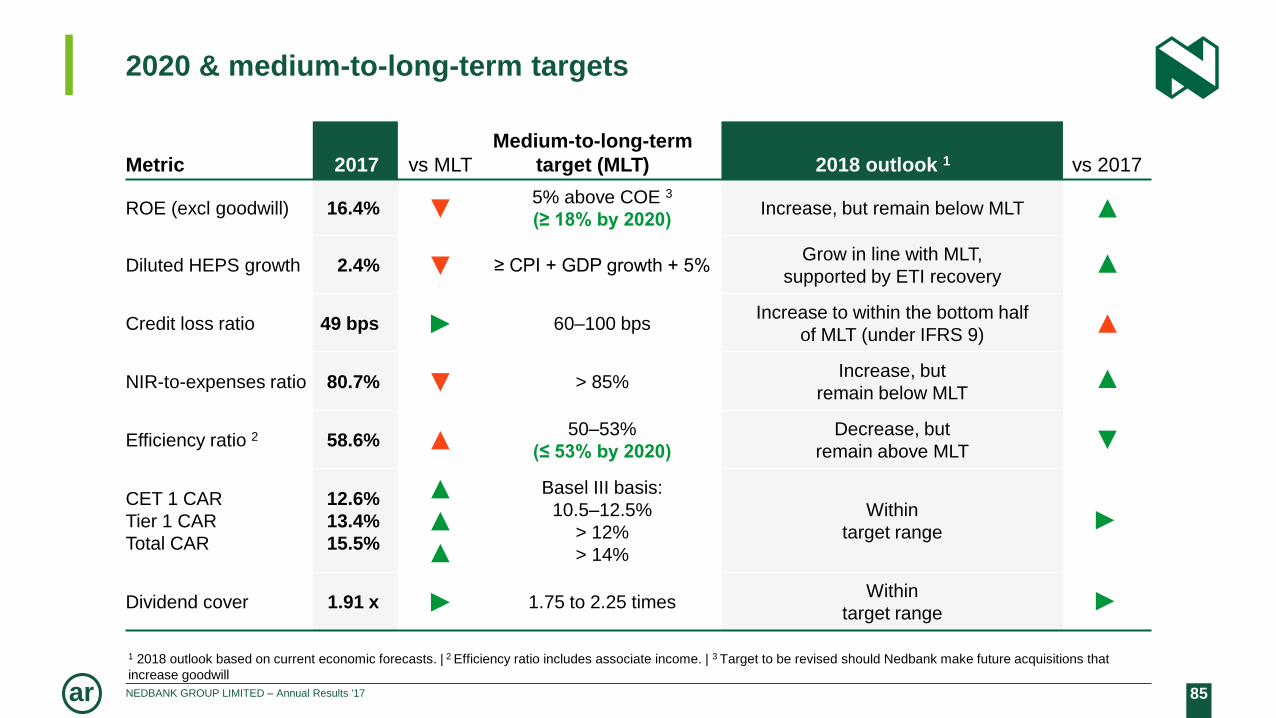
2020 & medium-to-long-term targets
Metric 2017 vs MLT
Medium-to-long-term
target (MLT) 2018 outlook 1 vs 2017
ROE (excl goodwill) 16.4% ▼5% above COE 3
(≥ 18% by 2020)Increase, but remain below MLT
Diluted HEPS growth 2.4% ▼ ≥ CPI + GDP growth + 5%Grow in line with MLT,
supported by ETI recovery
Credit loss ratio 49 bps ► 60–100 bpsIncrease to within the bottom half
of MLT (under IFRS 9)
NIR-to-expenses ratio 80.7% ▼ > 85%Increase, but
remain below MLT
Efficiency ratio 2 58.6% ▲50–53%
(≤ 53% by 2020)
Decrease, but
remain above MLT
CET 1 CAR
Tier 1 CAR
Total CAR
12.6%
13.4%
15.5%
▲
▲
▲
Basel III basis:
10.5–12.5%
> 12%
> 14%
Within
target range
Dividend cover 1.91 x ► 1.75 to 2.25 timesWithin
target range
1 2018 outlook based on current economic forecasts. | 2 Efficiency ratio includes associate income. | 3 Target to be revised should Nedbank make future acquisitions that
increase goodwill
▲
▲
▲
▲
▲
▲▲
86NEDBANK GROUP LIMITED – Annual Results '17ar
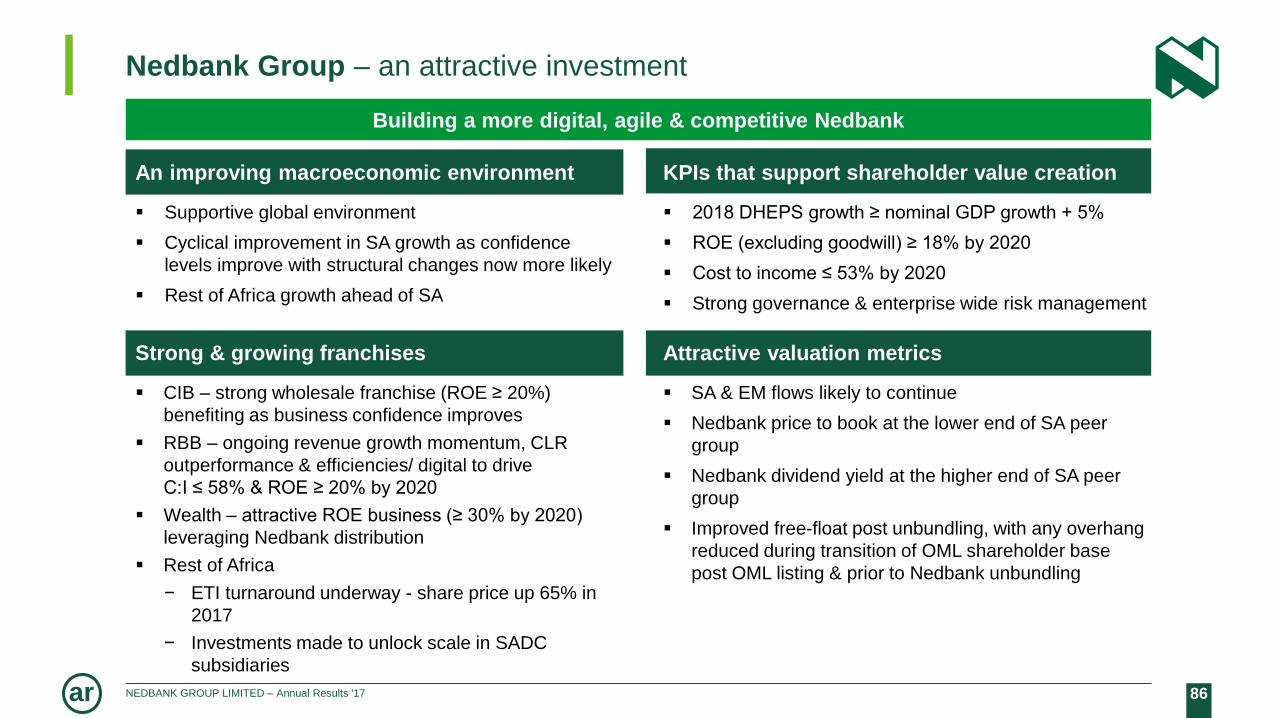
Nedbank Group – an attractive investment
An improving macroeconomic environment
Supportive global environment
Cyclical improvement in SA growth as confidence
levels improve with structural changes now more likely
Rest of Africa growth ahead of SA
Strong & growing franchises
CIB – strong wholesale franchise (ROE ≥ 20%)
benefiting as business confidence improves
RBB – ongoing revenue growth momentum, CLR
outperformance & efficiencies/ digital to drive
C:I ≤ 58% & ROE ≥ 20% by 2020
Wealth – attractive ROE business (≥ 30% by 2020)
leveraging Nedbank distribution
Rest of Africa
− ETI turnaround underway - share price up 65% in
2017
− Investments made to unlock scale in SADC
subsidiaries
KPIs that support shareholder value creation
2018 DHEPS growth ≥ nominal GDP growth + 5%
ROE (excluding goodwill) ≥ 18% by 2020
Cost to income ≤ 53% by 2020
Strong governance & enterprise wide risk management
Attractive valuation metrics
SA & EM flows likely to continue
Nedbank price to book at the lower end of SA peer
group
Nedbank dividend yield at the higher end of SA peer
group
Improved free-float post unbundling, with any overhang
reduced during transition of OML shareholder base
post OML listing & prior to Nedbank unbundling
Building a more digital, agile & competitive Nedbank

THANK YOU
88NEDBANK GROUP LIMITED – Annual Results '17ar
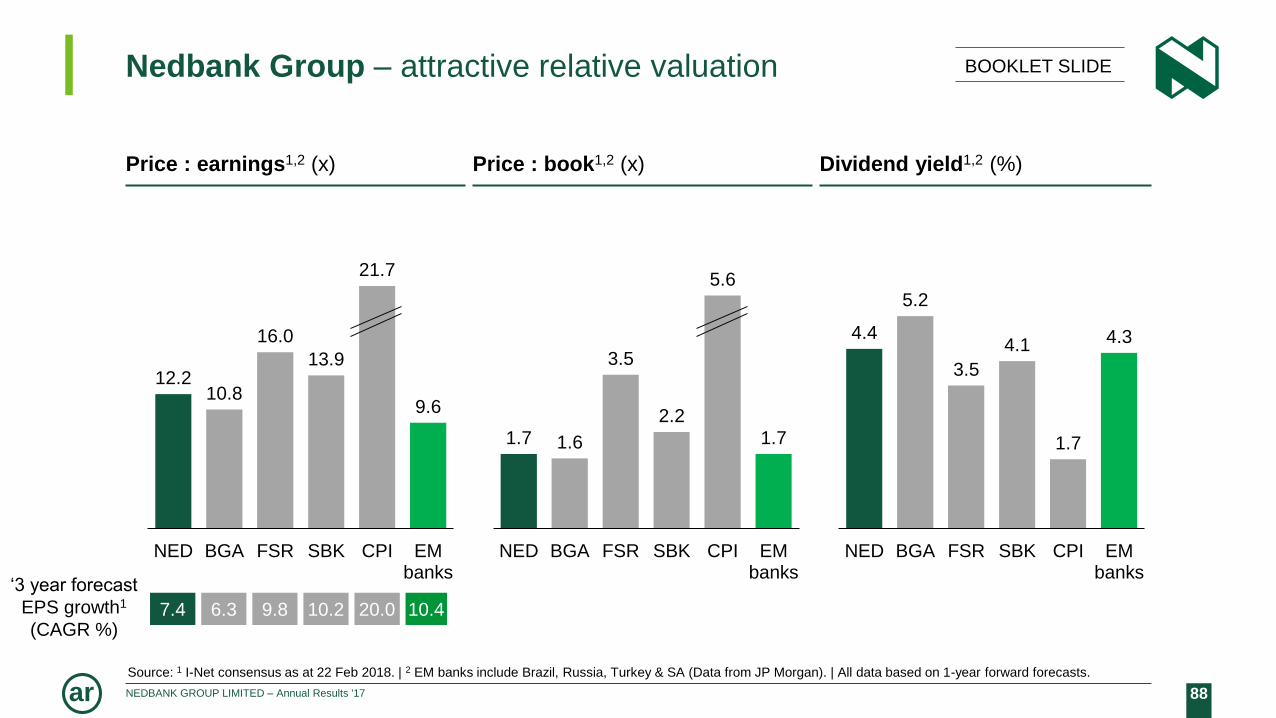
Nedbank Group – attractive relative valuation
Price : earnings1,2 (x)
12.210.8
16.0
13.9
21.7
9.6
NED BGA FSR SBK CPI EMbanks
Price : book1,2 (x) Dividend yield1,2 (%)
Source: 1 I-Net consensus as at 22 Feb 2018. | 2 EM banks include Brazil, Russia, Turkey & SA (Data from JP Morgan). | All data based on 1-year forward forecasts.
1.7 1.6
3.5
2.2
5.6
1.7
NED BGA FSR SBK CPI EMbanks
4.4
5.2
3.5
4.1
1.7
4.3
NED BGA FSR SBK CPI EMbanks
‘3 year forecast
EPS growth1
(CAGR %)7.4 6.3 9.8 10.2 20.0 10.4
BOOKLET SLIDE

89NEDBANK GROUP LIMITED – Annual Results '17ar
2020 targets – strategy in place to improve financial metrics in
RBB & RoA, while maintaining good returns in CIB & Wealth
Efficiency ratio Return on equity1
Nedbank
2017
Peer
average2
Nedbank
2020 target
Nedbank
2017
Peer
average2
Nedbank
2020 target
Nedbank Group 58.6% 54% ≤ 53% 16.4% 18% ≥ 18%
Corporate &
Investment Banking42.3% 48% ≤ 40% 20.7% 21% ≥ 20%
Retail & Business
Banking63.6% 56% ≤ 58% 19.1% 27% ≥ 20%
Wealth 65.6% 64% ≤ 60% 27.5% 24% ≥ 30%
Rest of Africa3 127.1% 54% ≤ 60% (12.6%) 19% ≥ COE
1 Nedbank ROE target at group excluding goodwill for comparability purposes. | 2 Peer averages based on Dec 2016 for BGA & SBK, June 2017 for FSR | CIB – BGA CIB,
RMB & SBK CIB | RBB – BGA SA RBB, FNB & Wesbank, SBK SA PBB, Wealth – BGA WIMI, RoA – BGA RoA (Barclays Africa acquisition), SBK RoA Legal 3 Rest of Africa includes ETI. COE estimated at >16%.
BOOKLET SLIDE
90NEDBANK GROUP LIMITED – Annual Results '17ar
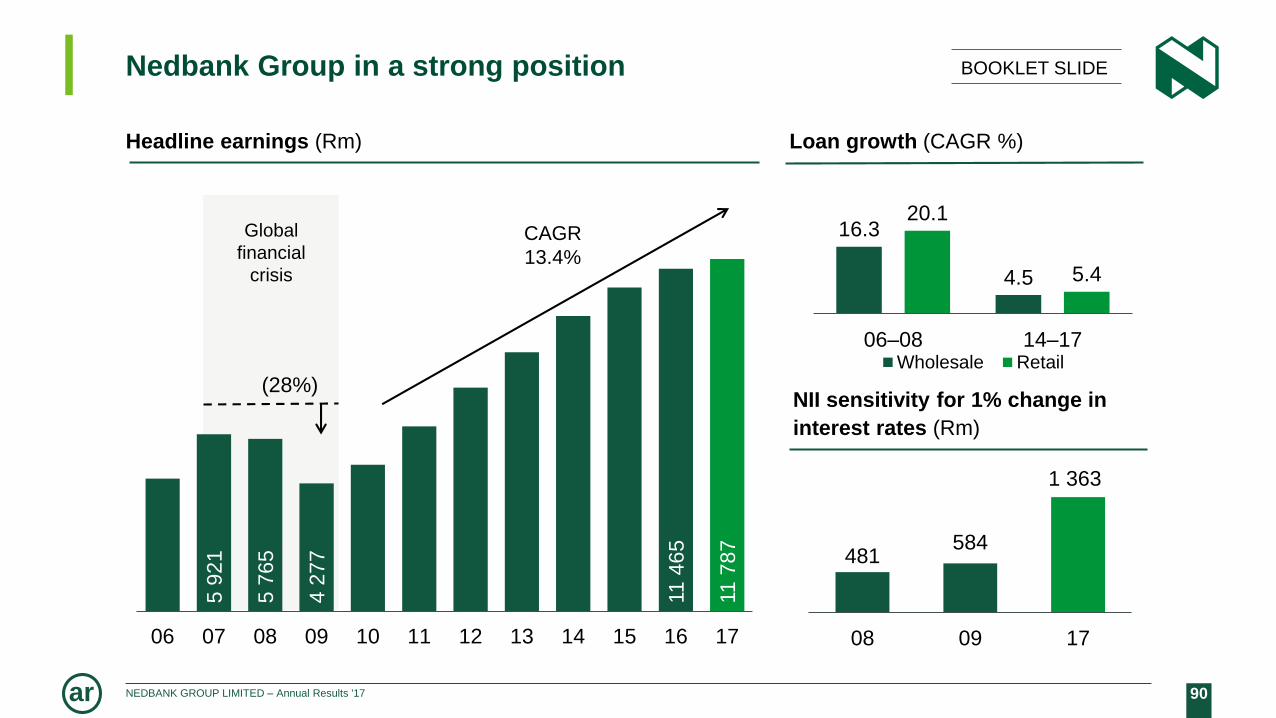
59
21
57
65
42
77
11
46
5
11
78
7
06 07 08 09 10 11 12 13 14 15 16 17
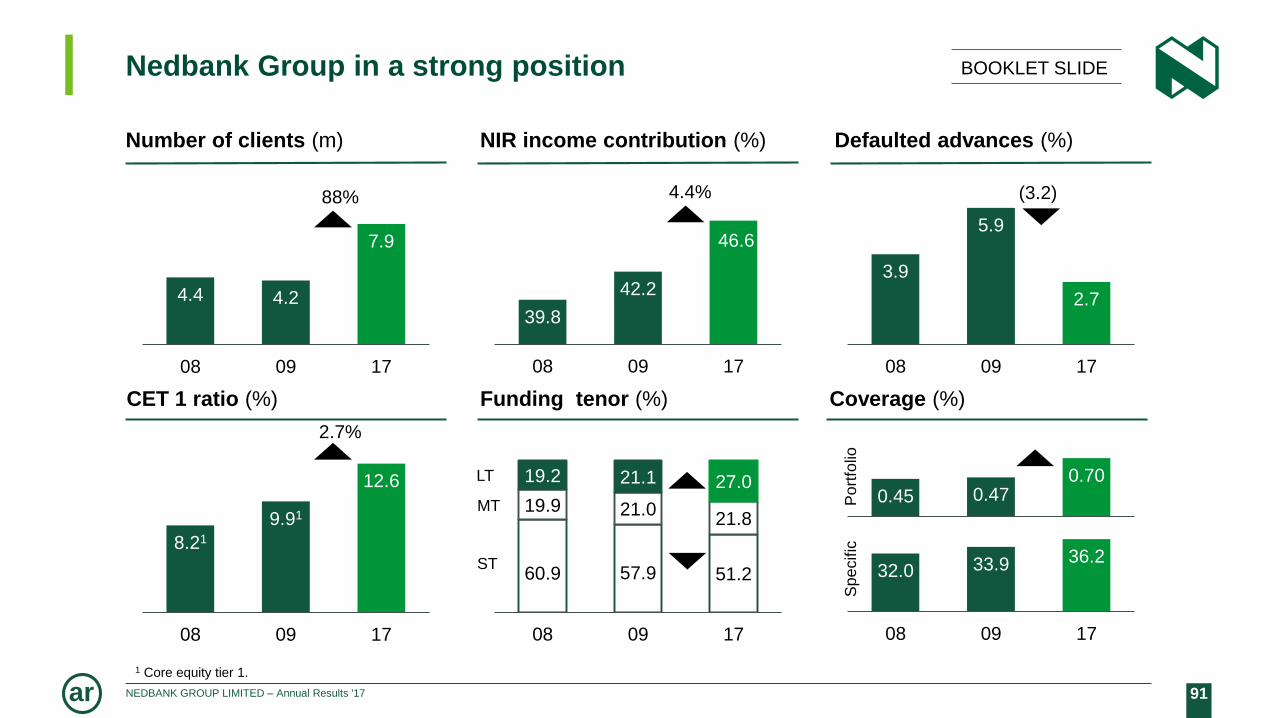
Nedbank Group in a strong position
16.3
4.5
20.1
5.4
06–08 14–17Wholesale Retail
481584
1 363
08 09 17
(28%)
Global
financial
crisis
Headline earnings (Rm) Loan growth (CAGR %)
NII sensitivity for 1% change in
interest rates (Rm)
BOOKLET SLIDE
CAGR
13.4%
91NEDBANK GROUP LIMITED – Annual Results '17ar
0.45 0.470.70
08 09 H1 17
32.0 33.9 36.2
08 09 17
1 Core equity tier 1.
Nedbank Group in a strong position
Number of clients (m) NIR income contribution (%) Defaulted advances (%)
CET 1 ratio (%) Funding tenor (%) Coverage (%)
4.4 4.2
7.9
08 09 17
39.8
42.2
46.6
08 09 17
3.9
5.9
2.7
08 09 17
8.21
9.91
12.6
08 09 17
88% 4.4% (3.2)
BOOKLET SLIDE
2.7%
Sp
ecific
Po
rtfo
lio
60.9 57.9 51.2
19.9 21.021.8
19.2 21.1 27.0
08 09 17
ST
MT
LT

92NEDBANK GROUP LIMITED – Annual Results '17ar
3.0
3.1
3.2
3.3
3.4
3.5
3.6
Jan '16 Mar '16 May '16 Jul '16 Sep '16 Nov '16 Jan '17 Mar '17 May '17 Jul '17 Sep '17 Nov '17
Net interest margin – narrowing of prime−JIBAR spread in 2016 & 2017
Prime – 3-month average JIBAR spread (bps)
H2 2016
Ave: 345 bps Ave: 320 bps Ave: 320 bps
Narrowing of the prime−JIBAR
spreads 2017 vs 2016, continued
volatility due to political uncertainty &
prospects of sovereign-credit-rating
downgrades.
H2 2017
Ave: 317 bps
H1 2016
20172016Ave: 332 bps
NII: R77m
Ave: 318 bps
NII: (R151m)
H1 2017
BOOKLET SLIDE

93NEDBANK GROUP LIMITED – Annual Results '17ar
23
(2) (1)
1
(9)
Nedbank Retail & Business BankingNIM decline mainly due to the compressed spread between prime & the
3-month Jibar linked cost of funding
Funding cost impact (bps) Liability (bps)Endowment impact (bps)
Mix & volume change
impact (bps)
Asset pricing impact (bps)Net interest margin (bps)
559 497 582 608 581
32 6 3
(16)
(5)18
9
28
(0)
13 14 15 16 17
(5) (6)
6 5
(3)
13 14 15 16 17
(0) (1)
(13) (12)
1
13 14 15 16 17
BOOKLET SLIDE

94NEDBANK GROUP LIMITED – Annual Results '17ar
289
189
33247
14 13
(179) (18)
588
Trans-actional
Card Securedlending
Priceincreases
Other Cardmargin
Mix &activity
Personalloans
YOY NIRgrowth
1
Nedbank Retail & Business BankingNIR growth support by good volume growth, but muted by strategic choices & other factors
NIR growth (Rm)
2016 NIR growth (Rm)
Volume–related
+217 +332 +47 +176 +86 (97) +23 (31) +753
BOOKLET SLIDE
1 Includes average price increase of 4.6% implemented on 1 January 2017.
2 Includes average price increase of 4.3% implemented on 1 January 2016 .
2

95NEDBANK GROUP LIMITED – Annual Results '17ar
Nedbank Retail & Business BankingBuilding more enduring client relationships through transactional product cross-sell
+1.2
Card
Personal Loans
MFC
Home Loans
Total Retail clients
Investments
Transactional
product
2.2
7.1
4.9
(6.4)
(2.0)
1.7
% YOY growth# 000
Transactional clients with product line
72%74%
57% 58%
51% 54%
24% 24%
40%38%
27%
Dec 17Dec 16
27%
Number of product line clients
with transactional products
1 432
478
1 534
560
939
985
448
573
306
300
6 026
5 925
% YOY growth
+0.1
(1.4)
+1.8
+3.2
+0.7
BOOKLET SLIDE
Dec 16 Dec 17
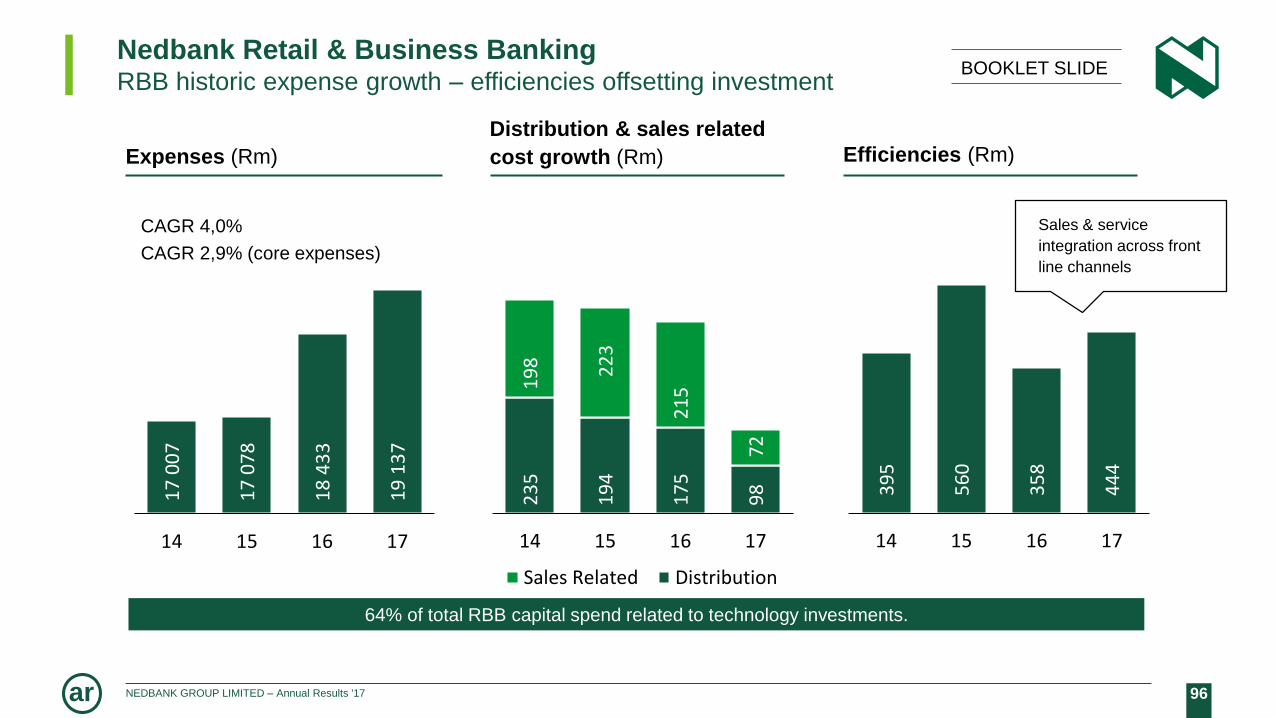
96NEDBANK GROUP LIMITED – Annual Results '17ar
39
5
56
0
35
8
44
4
14 15 16 17
17
00
7
17
07
8
18
43
3
19
13
7
14 15 16 17
Nedbank Retail & Business BankingRBB historic expense growth – efficiencies offsetting investment
Efficiencies (Rm)Expenses (Rm)
64% of total RBB capital spend related to technology investments.
Sales & service
integration across front
line channels
CAGR 4,0%
CAGR 2,9% (core expenses)
Distribution & sales related
cost growth (Rm)
23
5
19
4
17
5
98
19
8 22
3
21
5
72
14 15 16 17
Sales Related Distribution
BOOKLET SLIDE
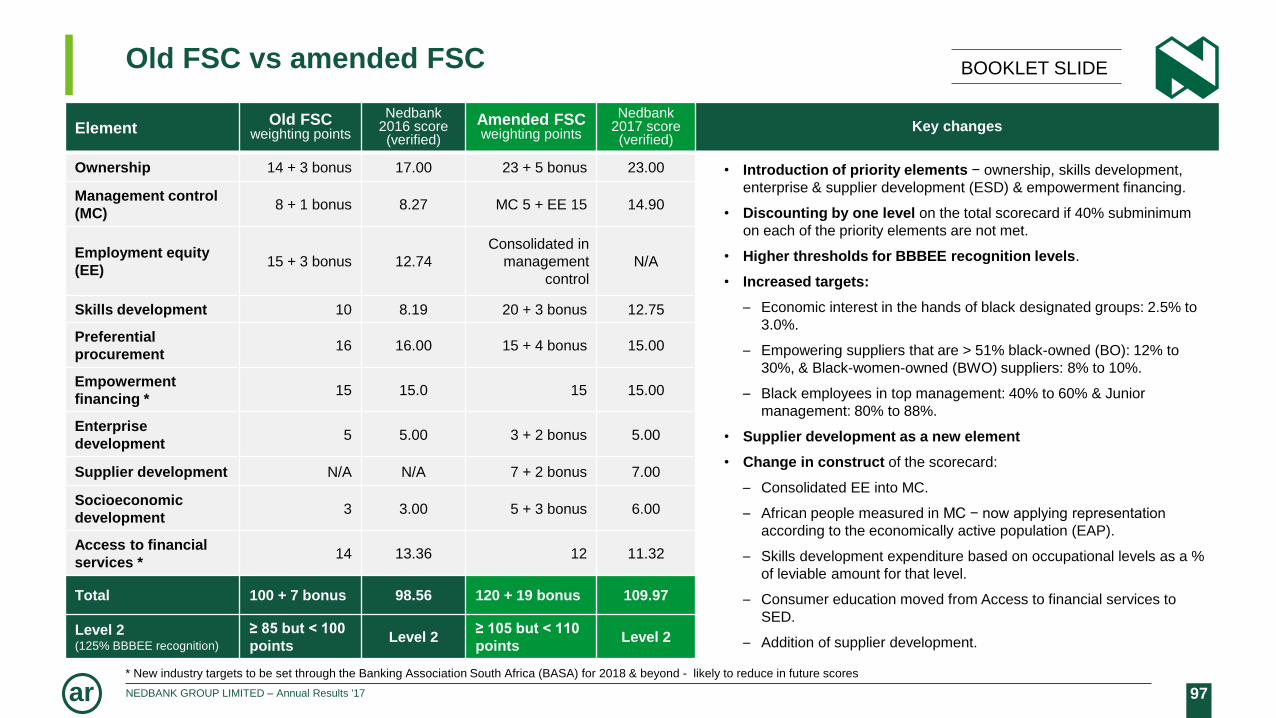
97NEDBANK GROUP LIMITED – Annual Results '17ar
Old FSC vs amended FSC BOOKLET SLIDE
ElementOld FSC
weighting points
Nedbank2016 score(verified)
Amended FSCweighting points
Nedbank2017 score(verified)
Key changes
Ownership 14 + 3 bonus 17.00 23 + 5 bonus 23.00 • Introduction of priority elements − ownership, skills development,
enterprise & supplier development (ESD) & empowerment financing.
• Discounting by one level on the total scorecard if 40% subminimum
on each of the priority elements are not met.
• Higher thresholds for BBBEE recognition levels.
• Increased targets:
– Economic interest in the hands of black designated groups: 2.5% to
3.0%.
– Empowering suppliers that are > 51% black-owned (BO): 12% to
30%, & Black-women-owned (BWO) suppliers: 8% to 10%.
– Black employees in top management: 40% to 60% & Junior
management: 80% to 88%.
• Supplier development as a new element
• Change in construct of the scorecard:
– Consolidated EE into MC.
– African people measured in MC − now applying representation
according to the economically active population (EAP).
– Skills development expenditure based on occupational levels as a %
of leviable amount for that level.
– Consumer education moved from Access to financial services to
SED.
– Addition of supplier development.
Management control
(MC)8 + 1 bonus 8.27 MC 5 + EE 15 14.90
Employment equity
(EE)15 + 3 bonus 12.74
Consolidated in
management
control
N/A
Skills development 10 8.19 20 + 3 bonus 12.75
Preferential
procurement16 16.00 15 + 4 bonus 15.00
Empowerment
financing *15 15.0 15 15.00
Enterprise
development5 5.00 3 + 2 bonus 5.00
Supplier development N/A N/A 7 + 2 bonus 7.00
Socioeconomic
development3 3.00 5 + 3 bonus 6.00
Access to financial
services *14 13.36 12 11.32
Total 100 + 7 bonus 98.56 120 + 19 bonus 109.97
Level 2 (125% BBBEE recognition)
≥ 85 but < 100
pointsLevel 2
≥ 105 but < 110
pointsLevel 2
* New industry targets to be set through the Banking Association South Africa (BASA) for 2018 & beyond - likely to reduce in future scores

98NEDBANK GROUP LIMITED – Annual Results '17ar
Disclaimer
Nedbank Group has acted in good faith and has made every reasonable effort to ensure the accuracy and
completeness of the information contained in this document, including all information that may be defined as
'forward-looking statements' within the meaning of United States securities legislation.
Forward-looking statements may be identified by words such as ‘believe’, 'anticipate', 'expect', 'plan',
'estimate', 'intend', 'project', 'target', 'predict' and 'hope'.
Forward-looking statements are not statements of fact, but statements by the management of Nedbank
Group based on its current estimates, projections, expectations, beliefs and assumptions regarding the
group's future performance.
No assurance can be given that forward-looking statements to be correct and undue reliance should not be
placed on such statements.
The risks and uncertainties inherent in the forward-looking statements contained in this document include,
but are not limited to: changes to IFRS and the interpretations, applications and practices subject thereto as
they apply to past, present and future periods; domestic and international business and market conditions
such as exchange rate and interest rate movements; changes in the domestic and international regulatory
and legislative environments; changes to domestic and international operational, social, economic and
political risks; and the effects of both current and future litigation.
Nedbank Group does not undertake to update any forward-looking statements contained in this document
and does not assume responsibility for any loss or damage arising as a result of the reliance by any party
thereon, including, but not limited to, loss of earnings, profits, or consequential loss or damage.