Embed Size (px)
Citation preview

Nectar Smart Alterna-vesInvestment Opportunity for Selected Partners.
Sponsored by Nectar. Issued by Bank Julius Baer & Co Ltd.
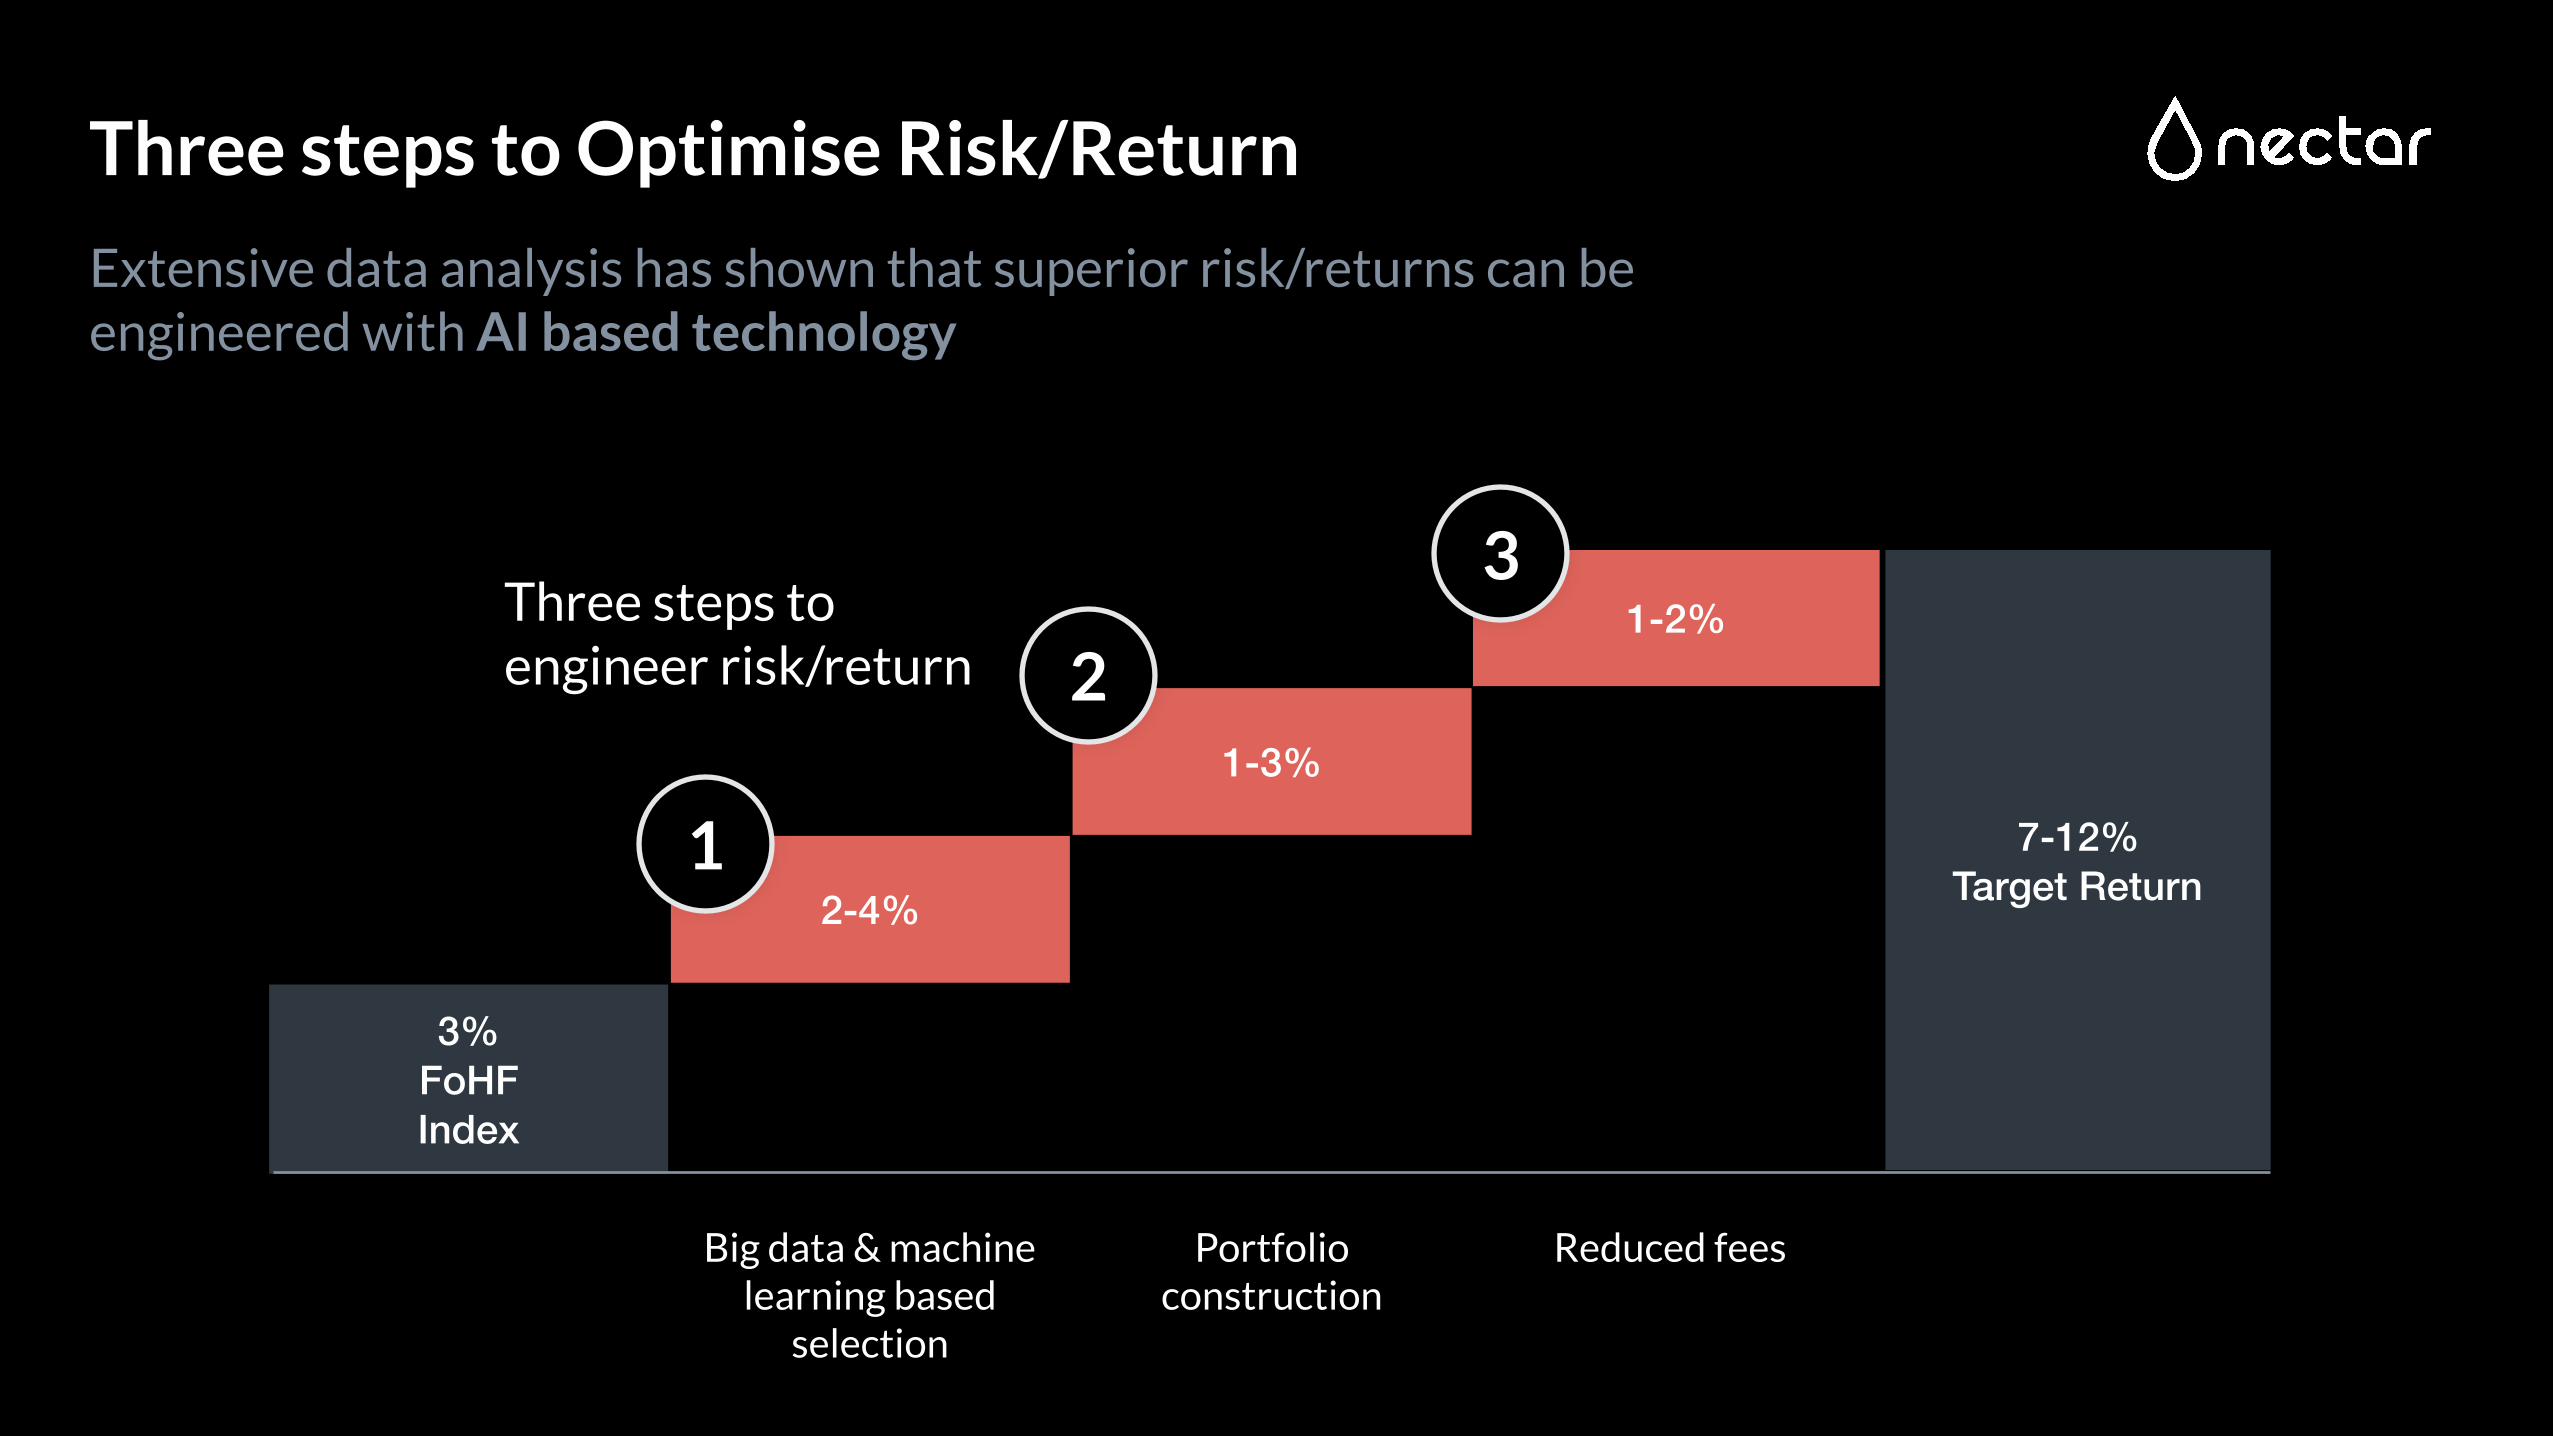
3% FoHF Index
7-12% Target Return
1-2%
Reduced fees
2-4%
Big data & machine learning based
selection
1
1-3%
Portfolio construction
2
3Three steps to engineer risk/return
Extensive data analysis has shown that superior risk/returns can be engineered with AI based technology
Three steps to Optimise Risk/Return
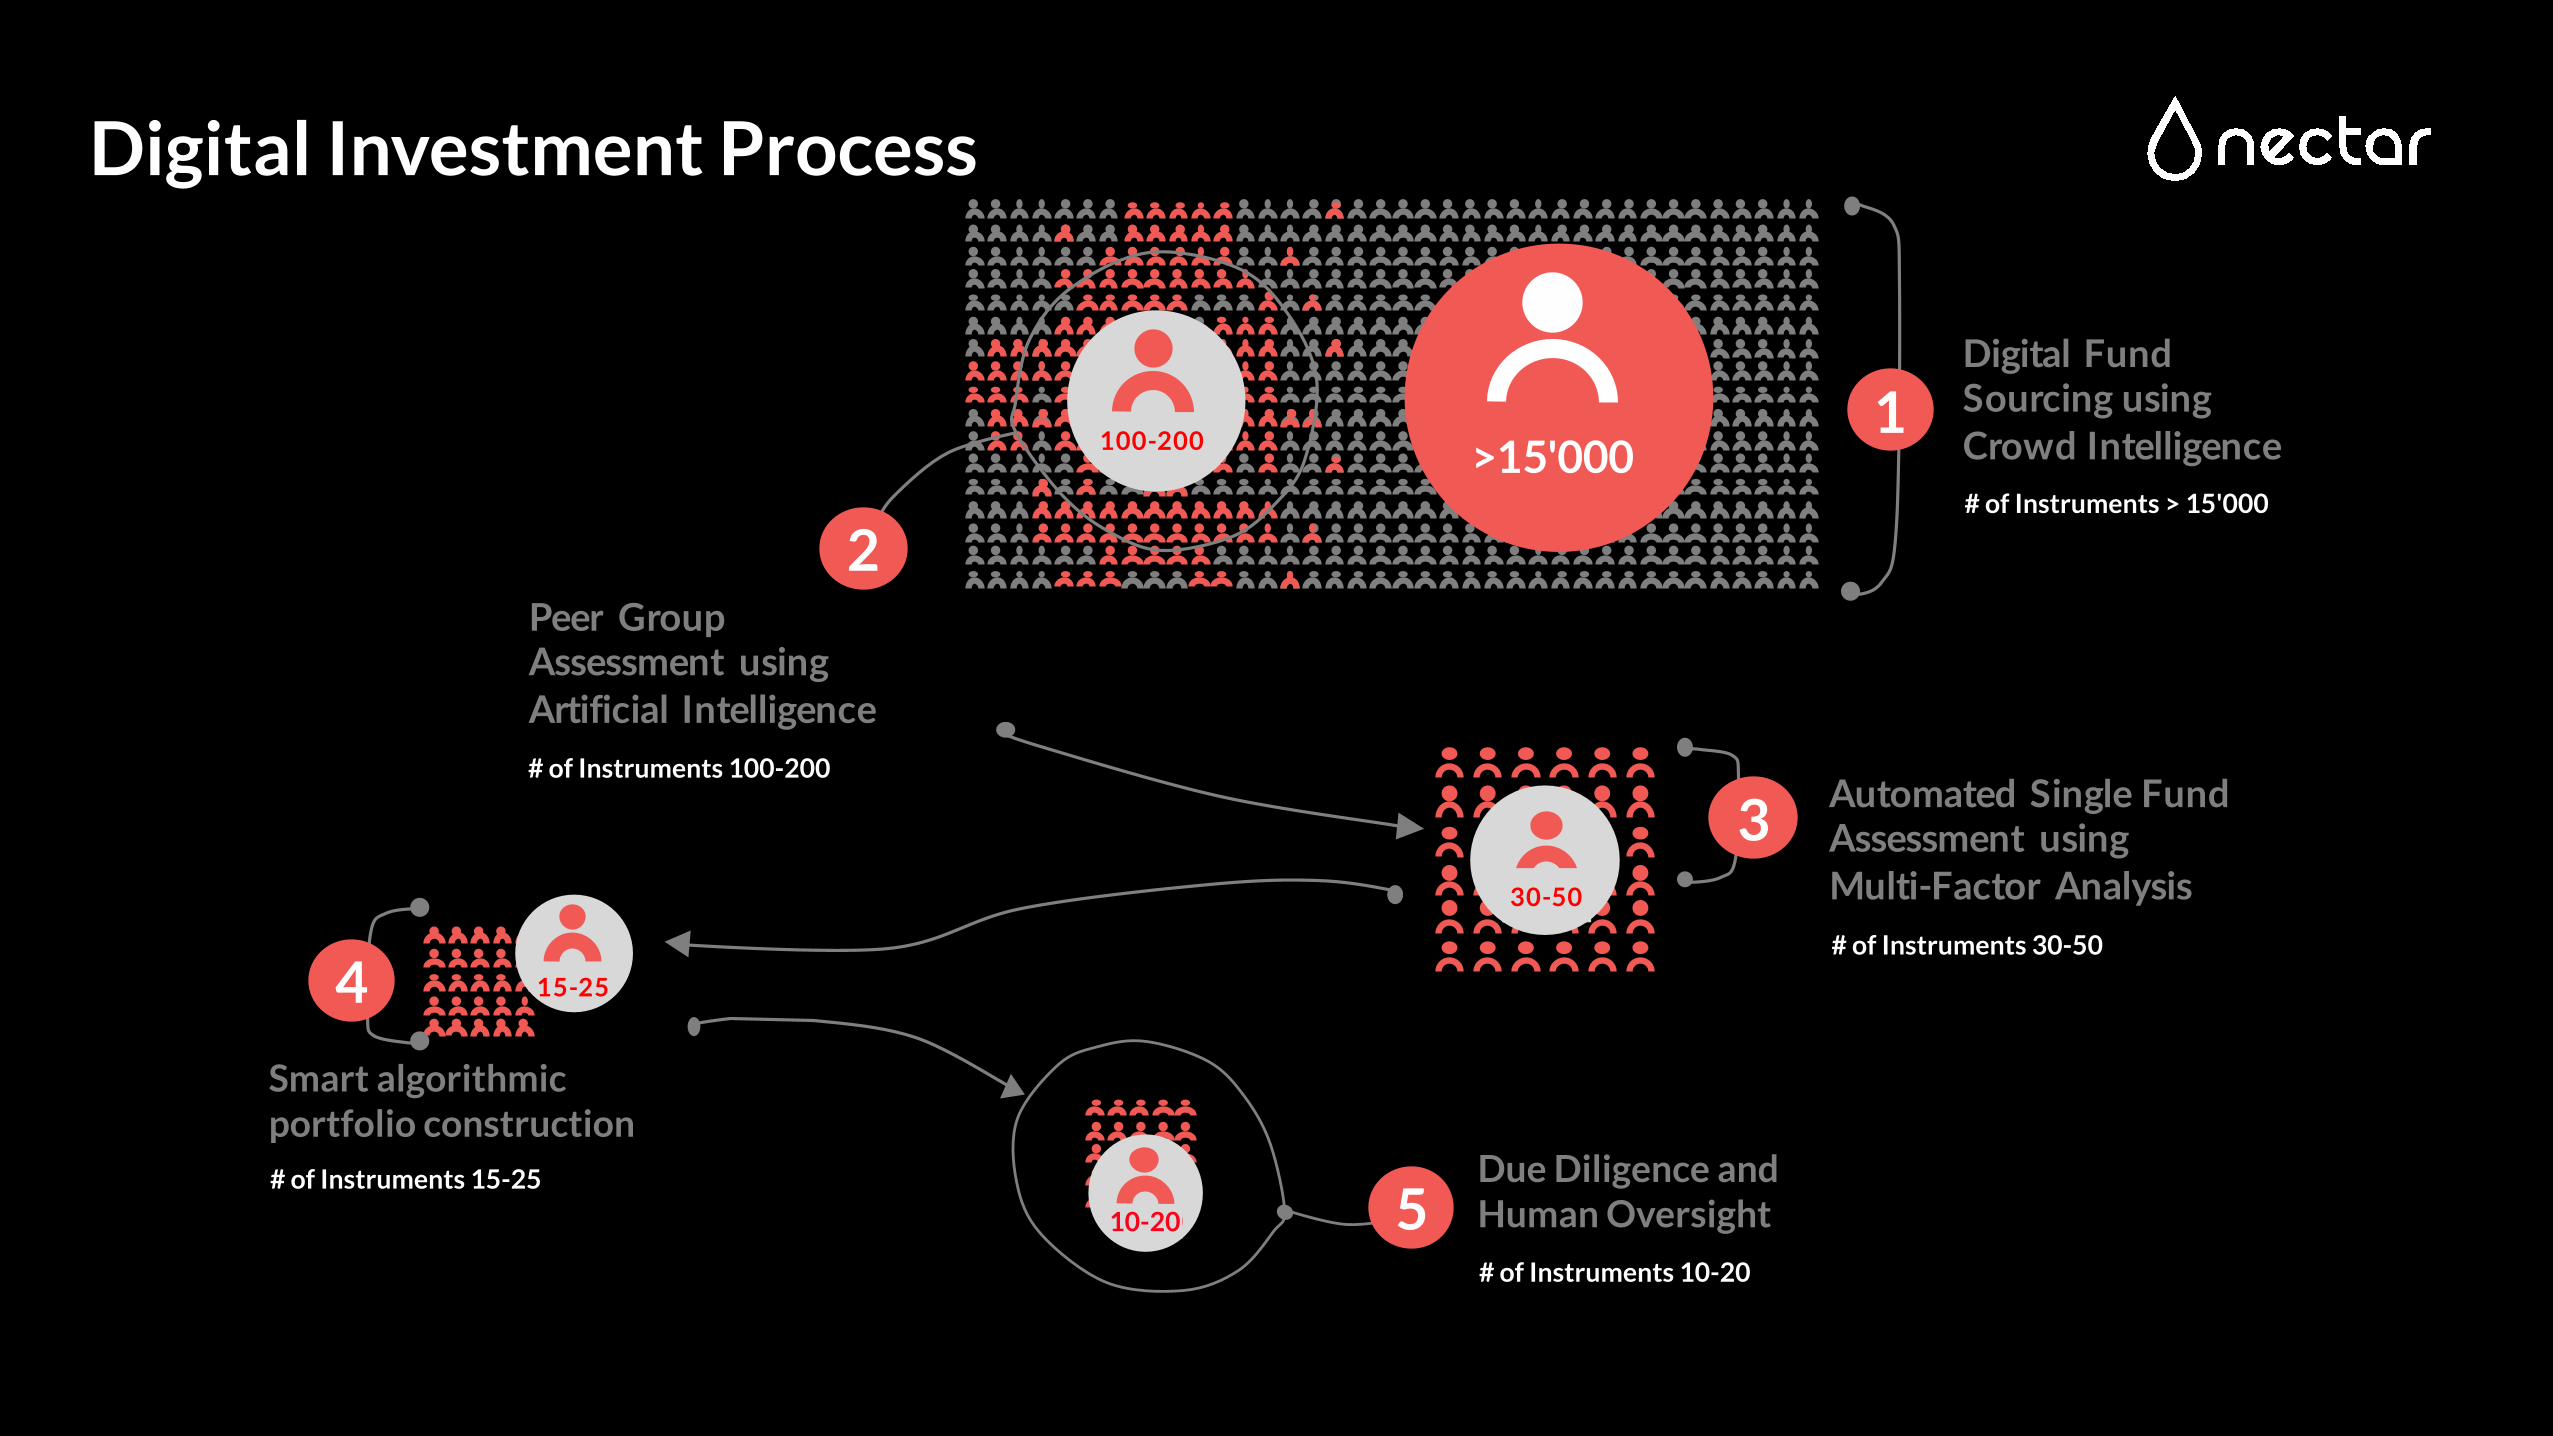
Digital Investment Process
30-50
Automated Single Fund Assessment using Multi-Factor Analysis
3
#of Instruments 30-50
Digital Fund Sourcing using Crowd Intelligence
1# of Instruments > 15'000
>15'000100-200
Peer Group Assessment using Artificial Intelligence
2
# of Instruments 100-200
Smart Portfolio Constructions Algorithm based
15-254
# of Instruments 15-25
Smart algorithmic portfolio construction
15-20
Outsourced Due Diligence with Human Oversight5# of Instruments15-20
Due Diligence and Human Oversight
# of Instruments 15-25
# of Instruments 100-200
# of Instruments 10-20
# of Instruments 30-50
# of Instruments > 15'000
10-20
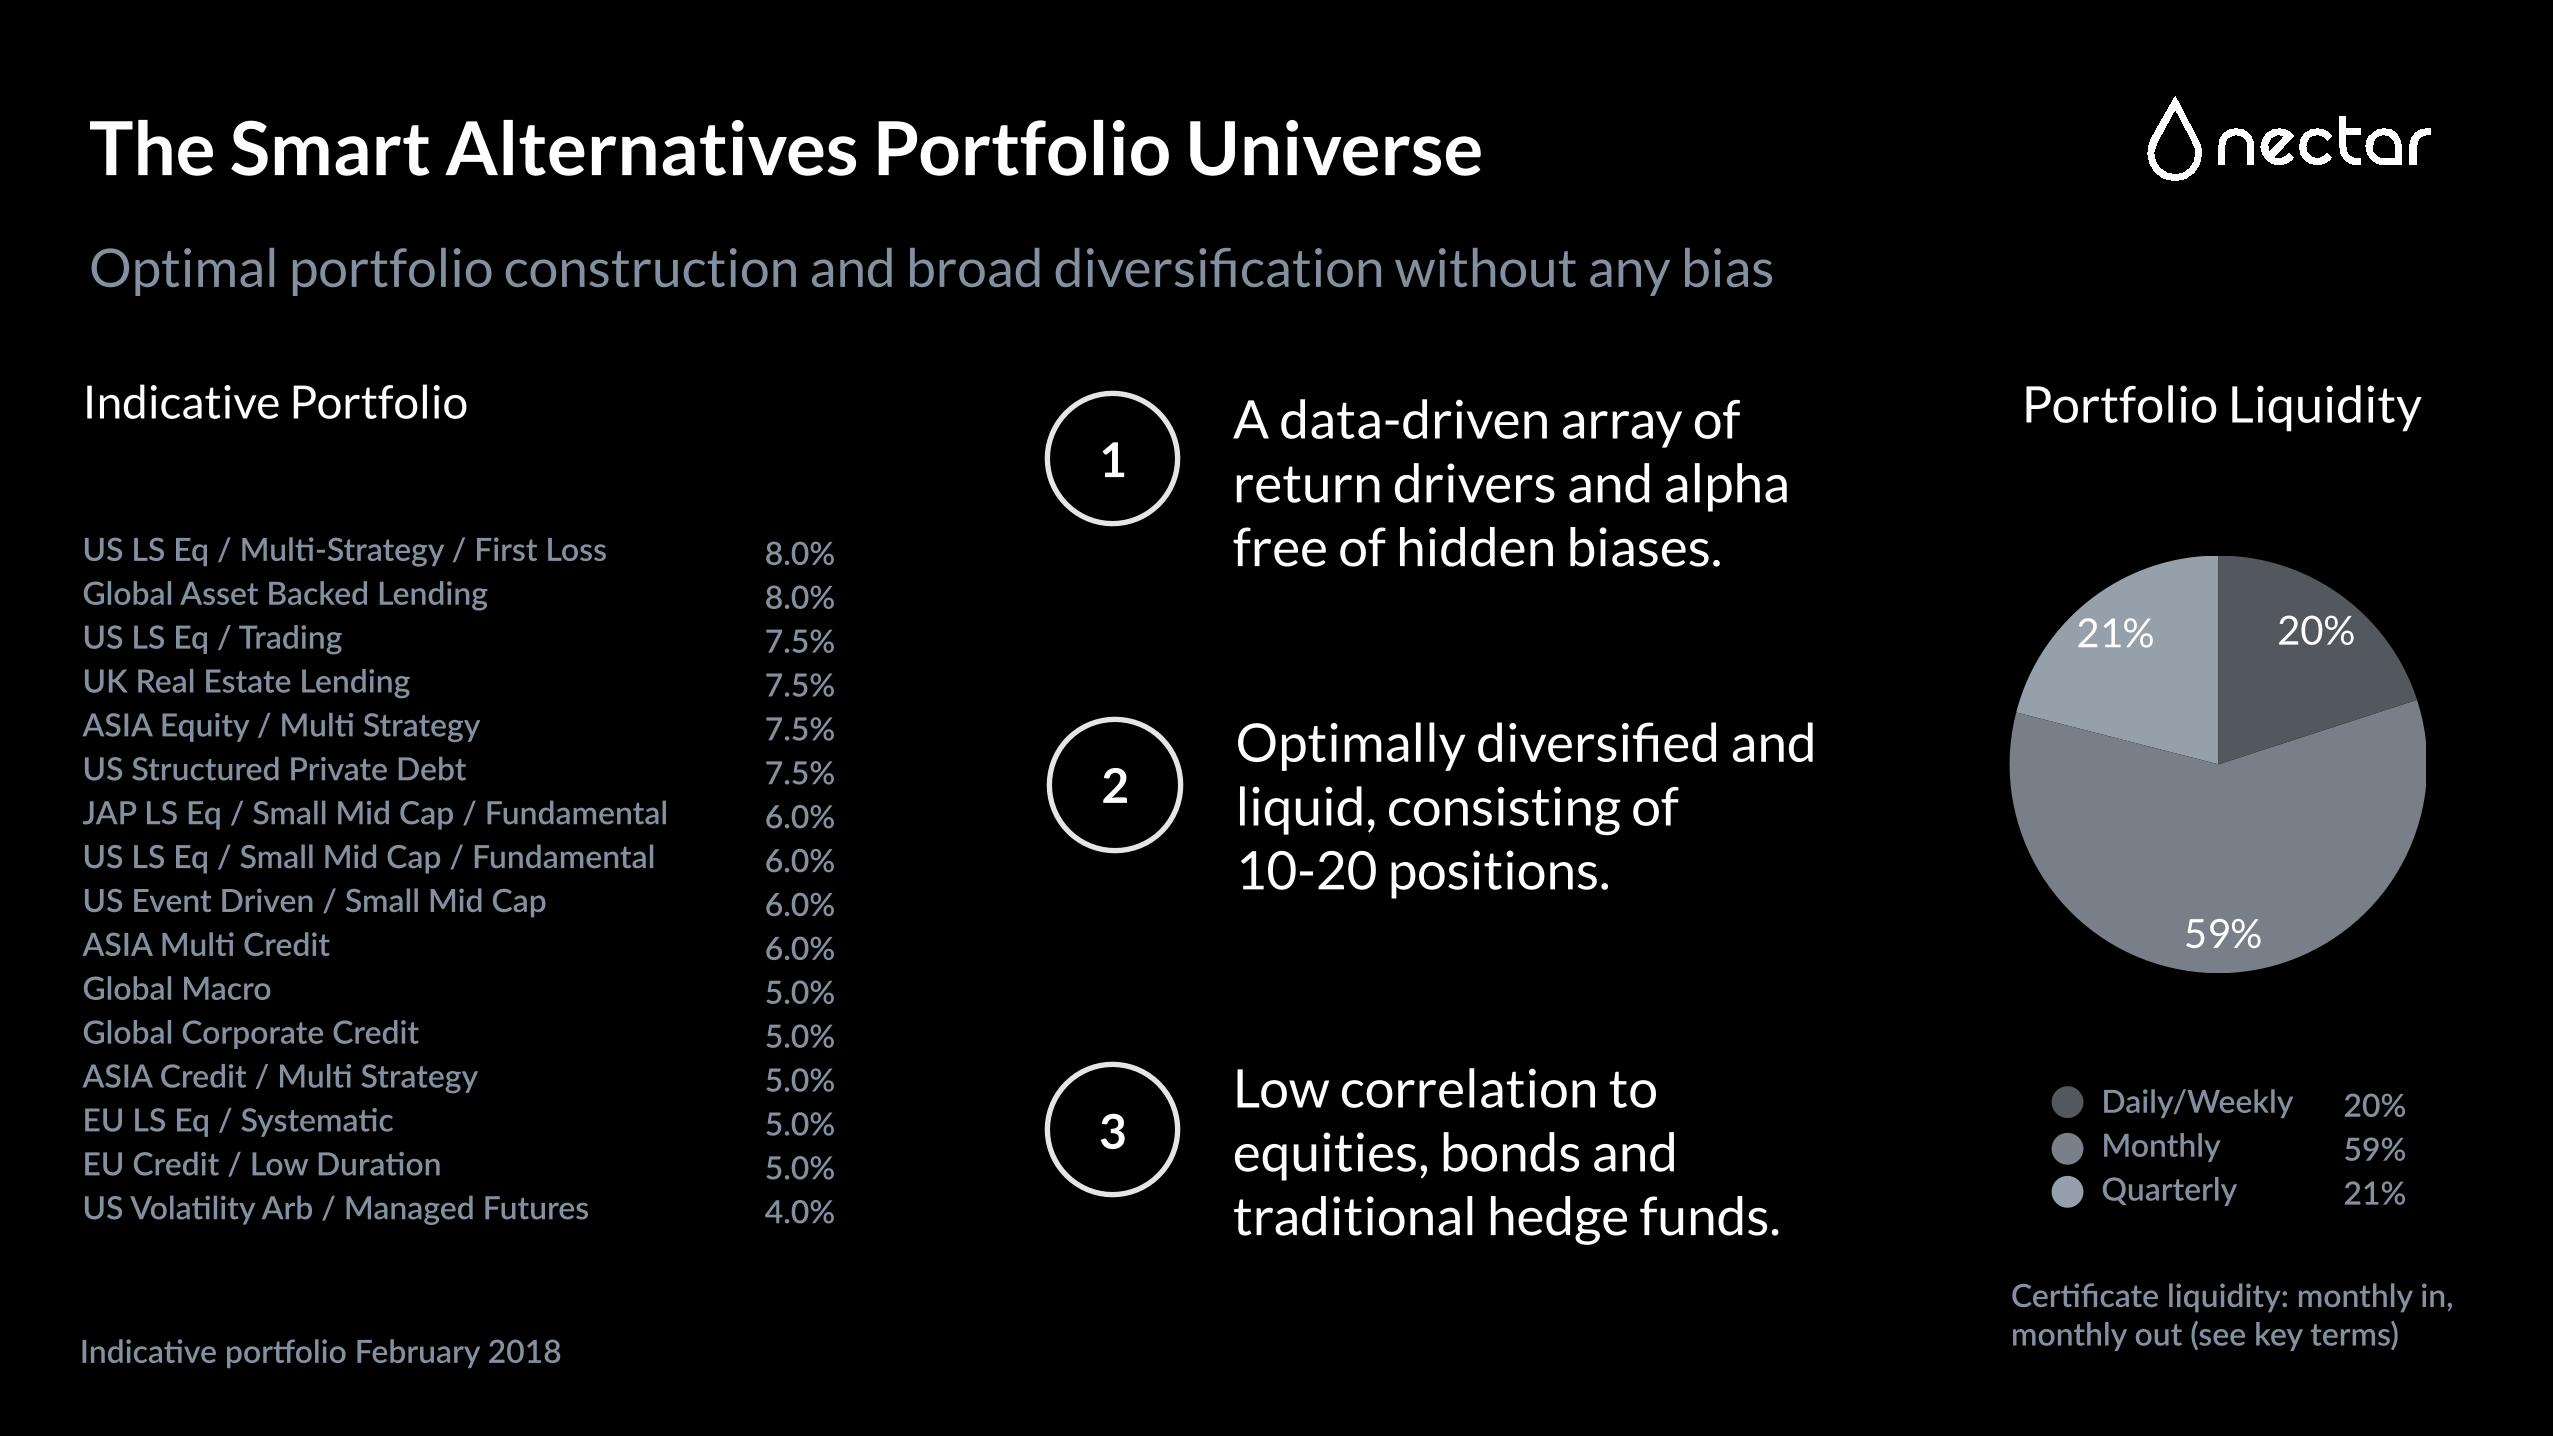
Indicative Portfolio
Optimally diversified and liquid, consisting of 10-20 positions.
2
A data-driven array of return drivers and alpha free of hidden biases.
1
Low correlation to equities, bonds and traditional hedge funds.
3
US LS Eq / Mul--Strategy / First Loss Global Asset Backed Lending US LS Eq / Trading UK Real Estate Lending ASIA Equity / Mul- Strategy US Structured Private Debt JAP LS Eq / Small Mid Cap / Fundamental US LS Eq / Small Mid Cap / Fundamental US Event Driven / Small Mid Cap
ASIA Mul- Credit
Global Macro
Global Corporate Credit
ASIA Credit / Mul- Strategy
EU LS Eq / Systema-c
EU Credit / Low Dura-on
US Vola-lity Arb / Managed Futures
8.0% 8.0% 7.5% 7.5% 7.5% 7.5% 6.0% 6.0% 6.0% 6.0% 5.0% 5.0% 5.0% 5.0% 5.0% 4.0%
21%
59%
20%
Portfolio Liquidity
Daily/Weekly Monthly Quarterly
20% 59% 21%
The Smart Alternatives Portfolio Universe
Optimal portfolio construction and broad diversification without any bias
Cer-ficate liquidity: monthly in, monthly out (see key terms)Indica-ve por`olio February 2018
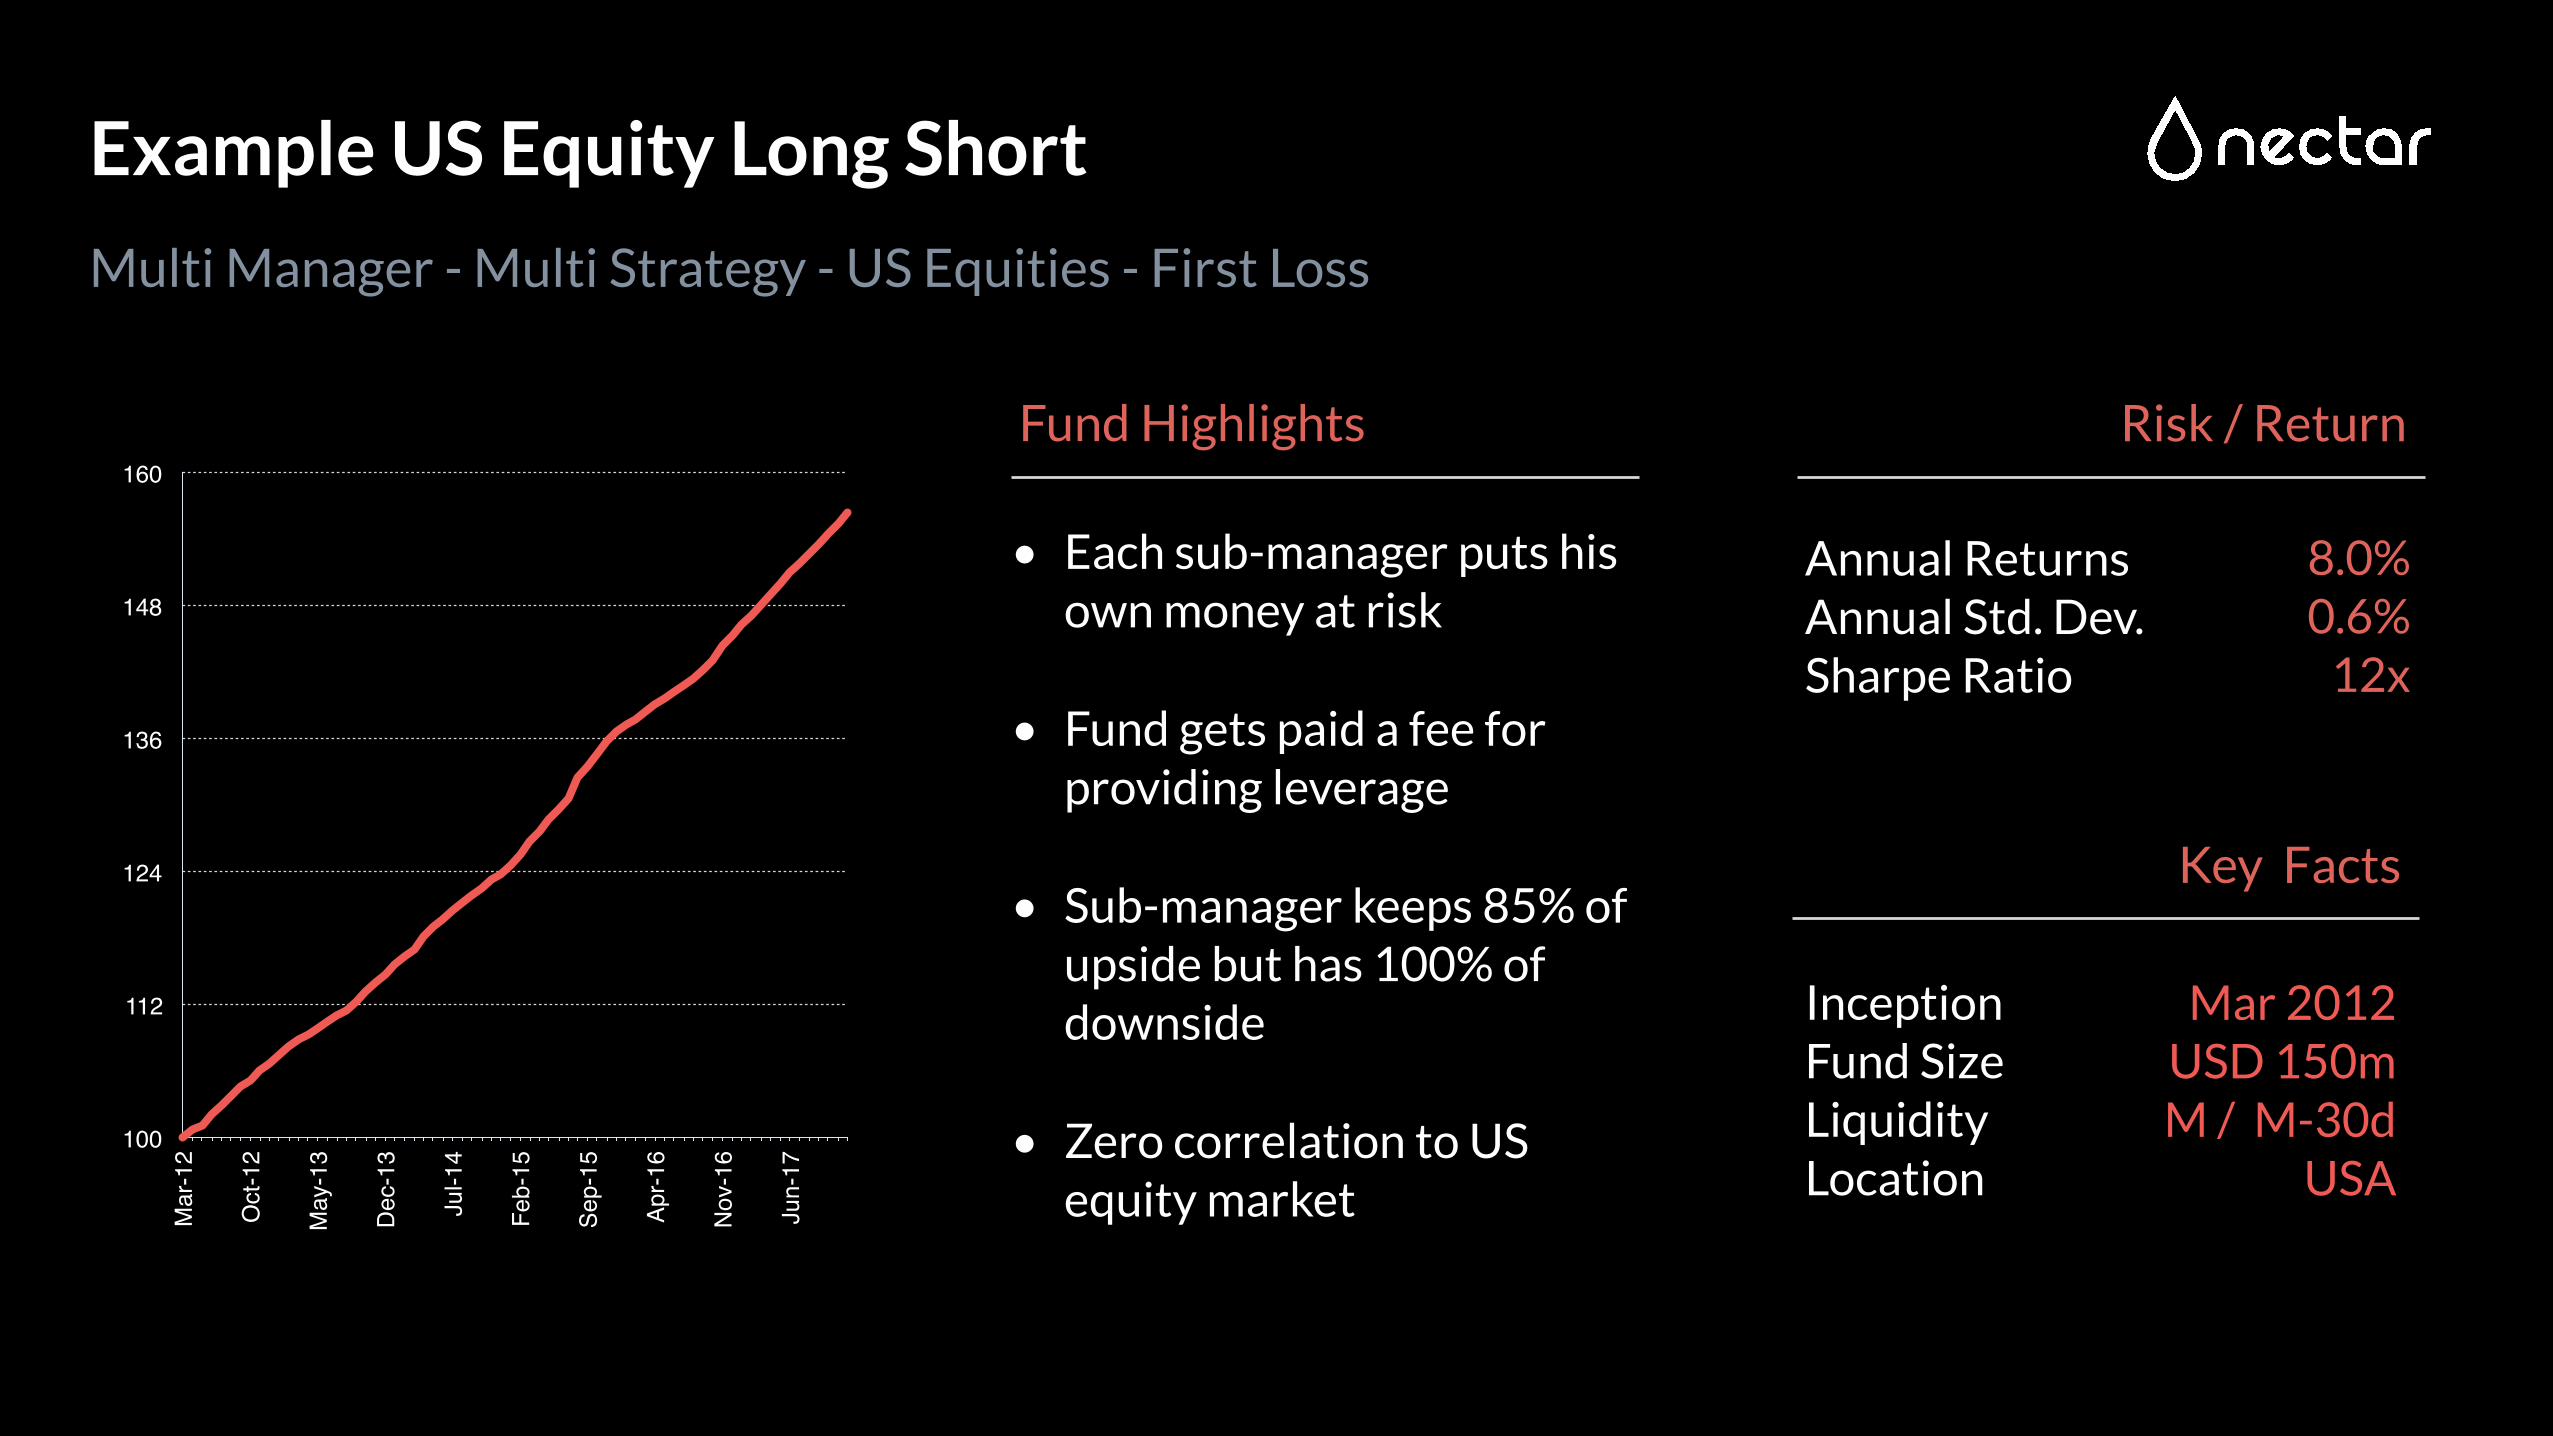
Annual ReturnsAnnual Std. Dev.Sharpe Ratio
8.0%0.6%
12x
Risk / Return
Example US Equity Long Short
Multi Manager - Multi Strategy - US Equities - First Loss
Key Facts
Fund Highlights
InceptionFund SizeLiquidityLocation
Mar 2012USD 150mM / M-30d
USA
• Each sub-manager puts his own money at risk
• Fund gets paid a fee for providing leverage
• Sub-manager keeps 85% of upside but has 100% of downside
• Zero correlation to US equity market
100
112
124
136
148
160
Mar-12
Oct-12
May-13
Dec-13
Jul-14
Feb-15
Sep-15
Apr-16
Nov-16
Jun-17
Annual ReturnsAnnual Std. Dev.Sharpe Ratio
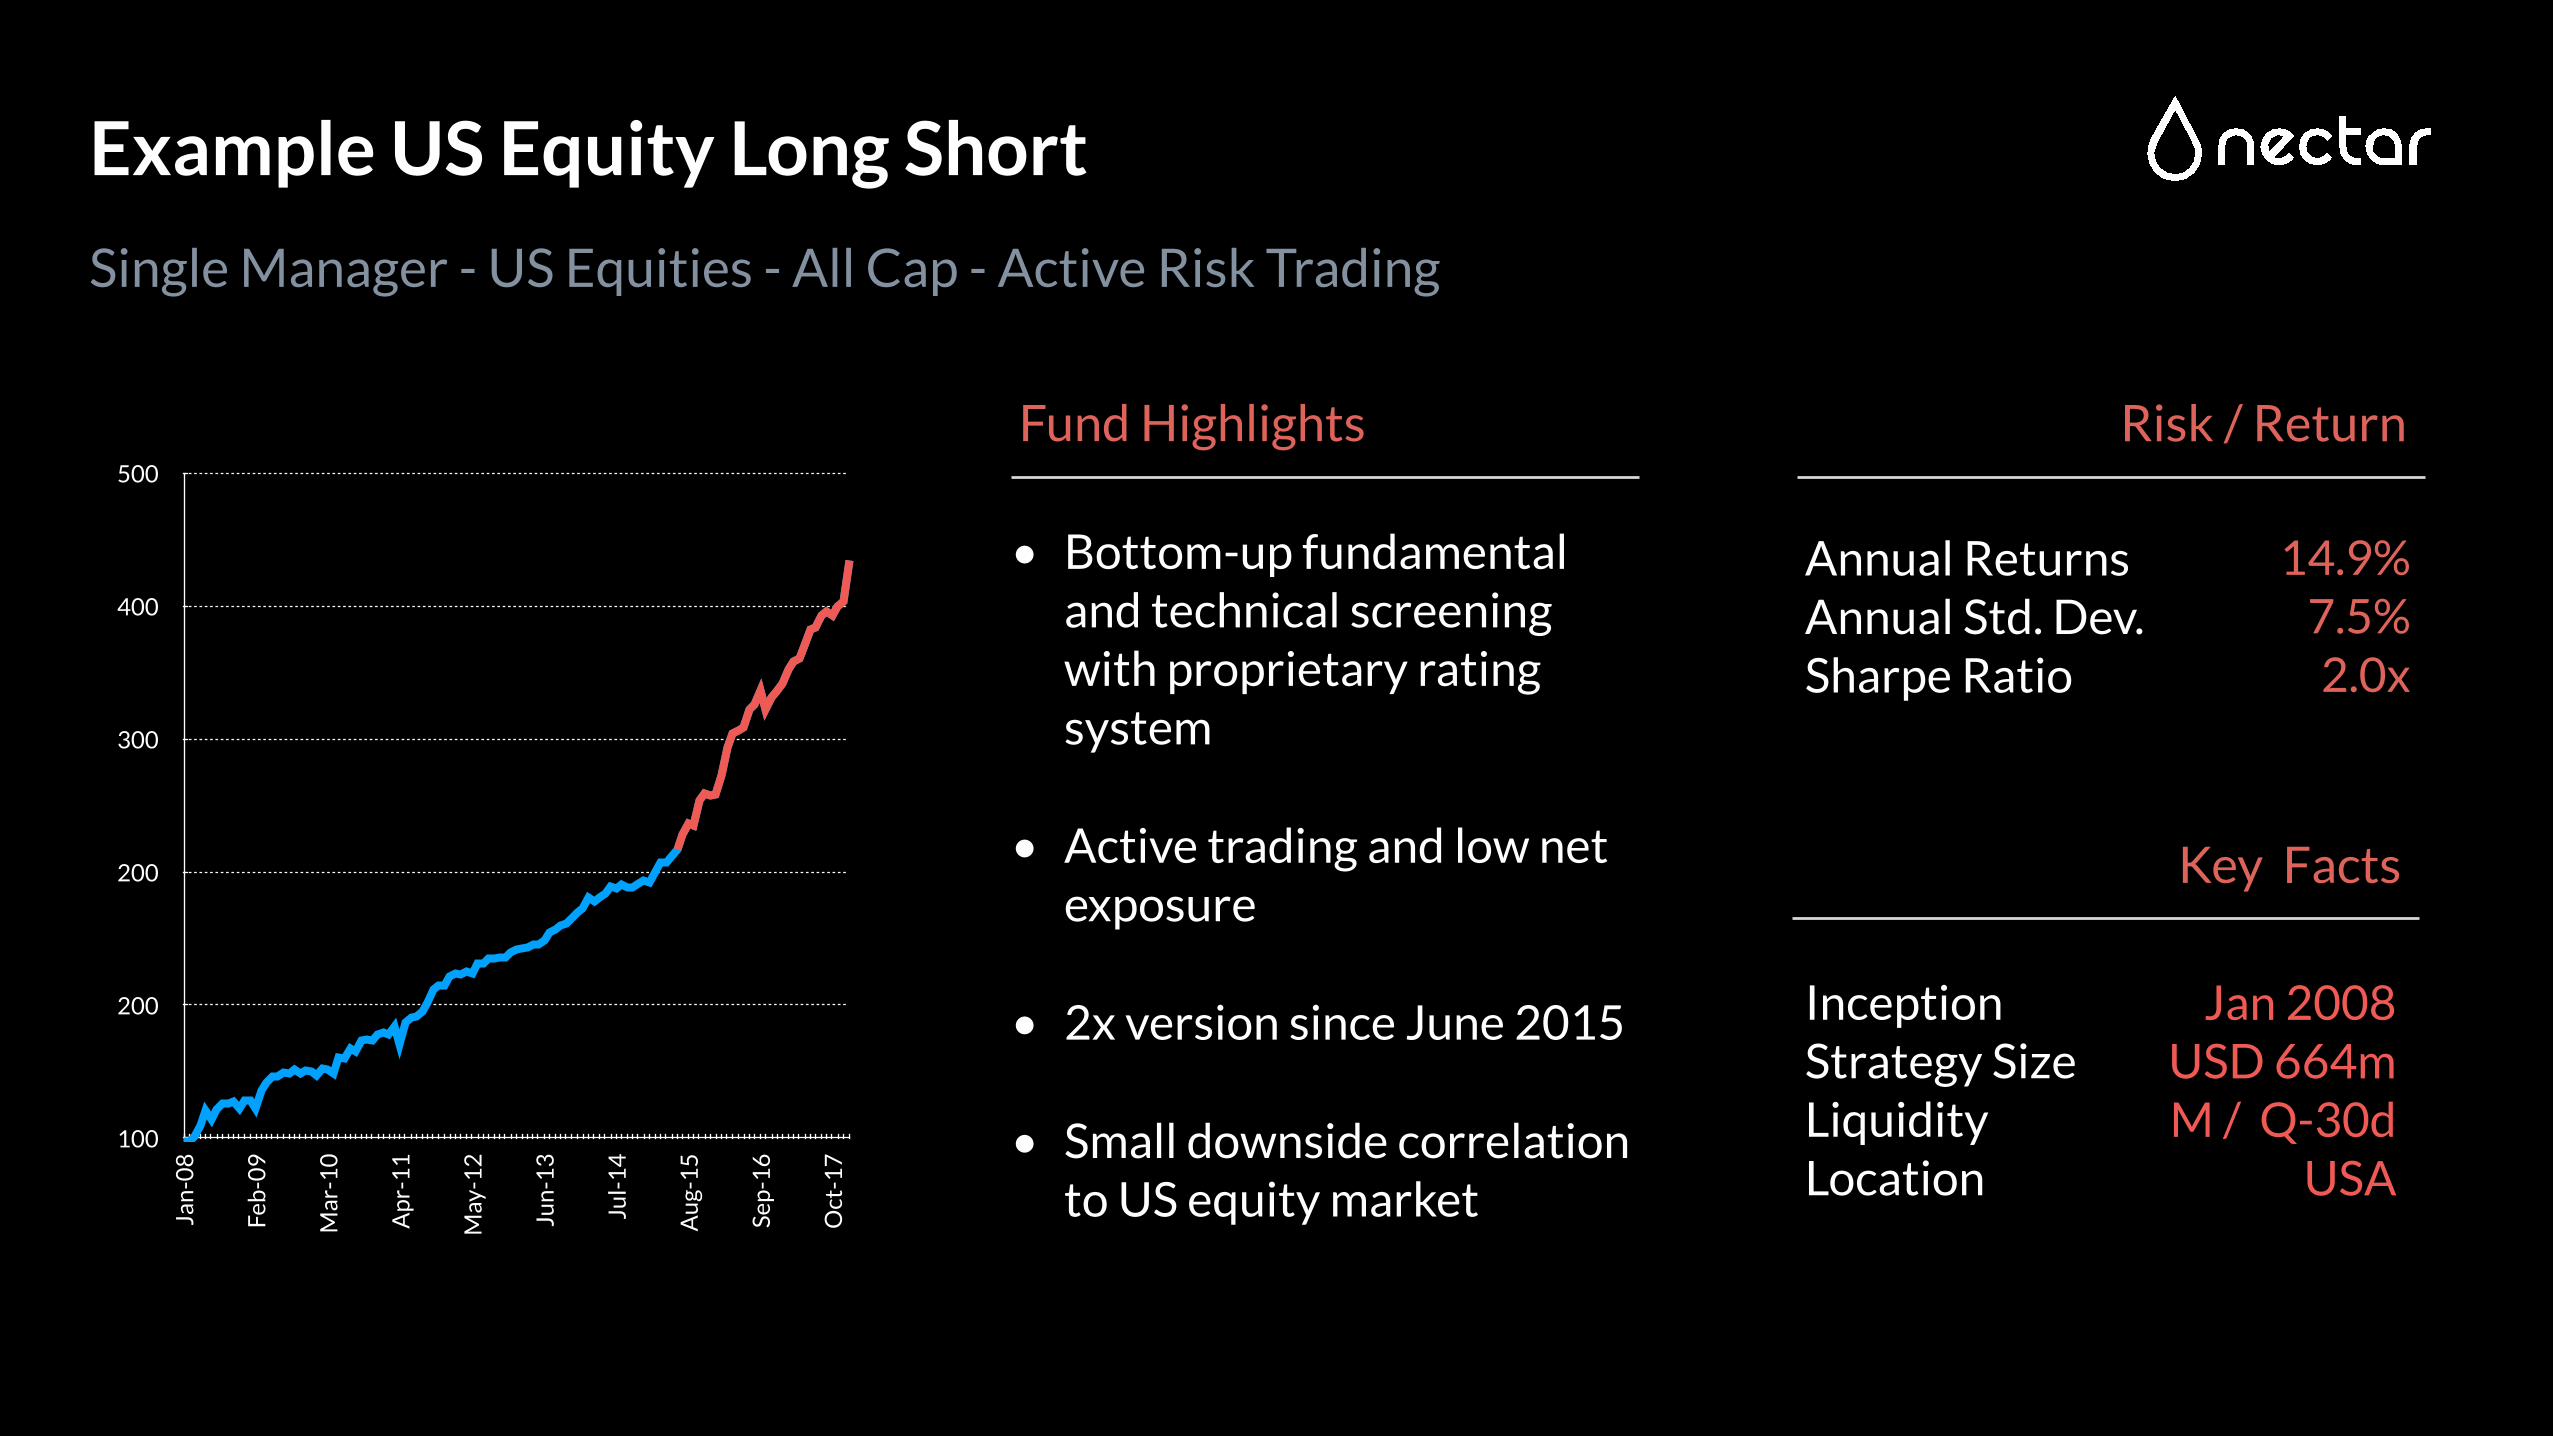
14.9%7.5%2.0x
Risk / Return
Example US Equity Long Short
Single Manager - US Equities - All Cap - Active Risk Trading
100
200
200
300
400
500
Category Axis
Jan
-08
Feb
-09
Mar
-10
Ap
r-1
1
May
-12
Jun
-13
Jul-
14
Au
g-1
5
Sep
-16
Oct
-17
Key Facts
Fund Highlights
InceptionStrategy SizeLiquidityLocation
Jan 2008USD 664mM / Q-30d
USA
• Bottom-up fundamental and technical screening with proprietary rating system
• Active trading and low net exposure
• 2x version since June 2015
• Small downside correlation to US equity market
Annual ReturnsAnnual Std. Dev.Sharpe Ratio
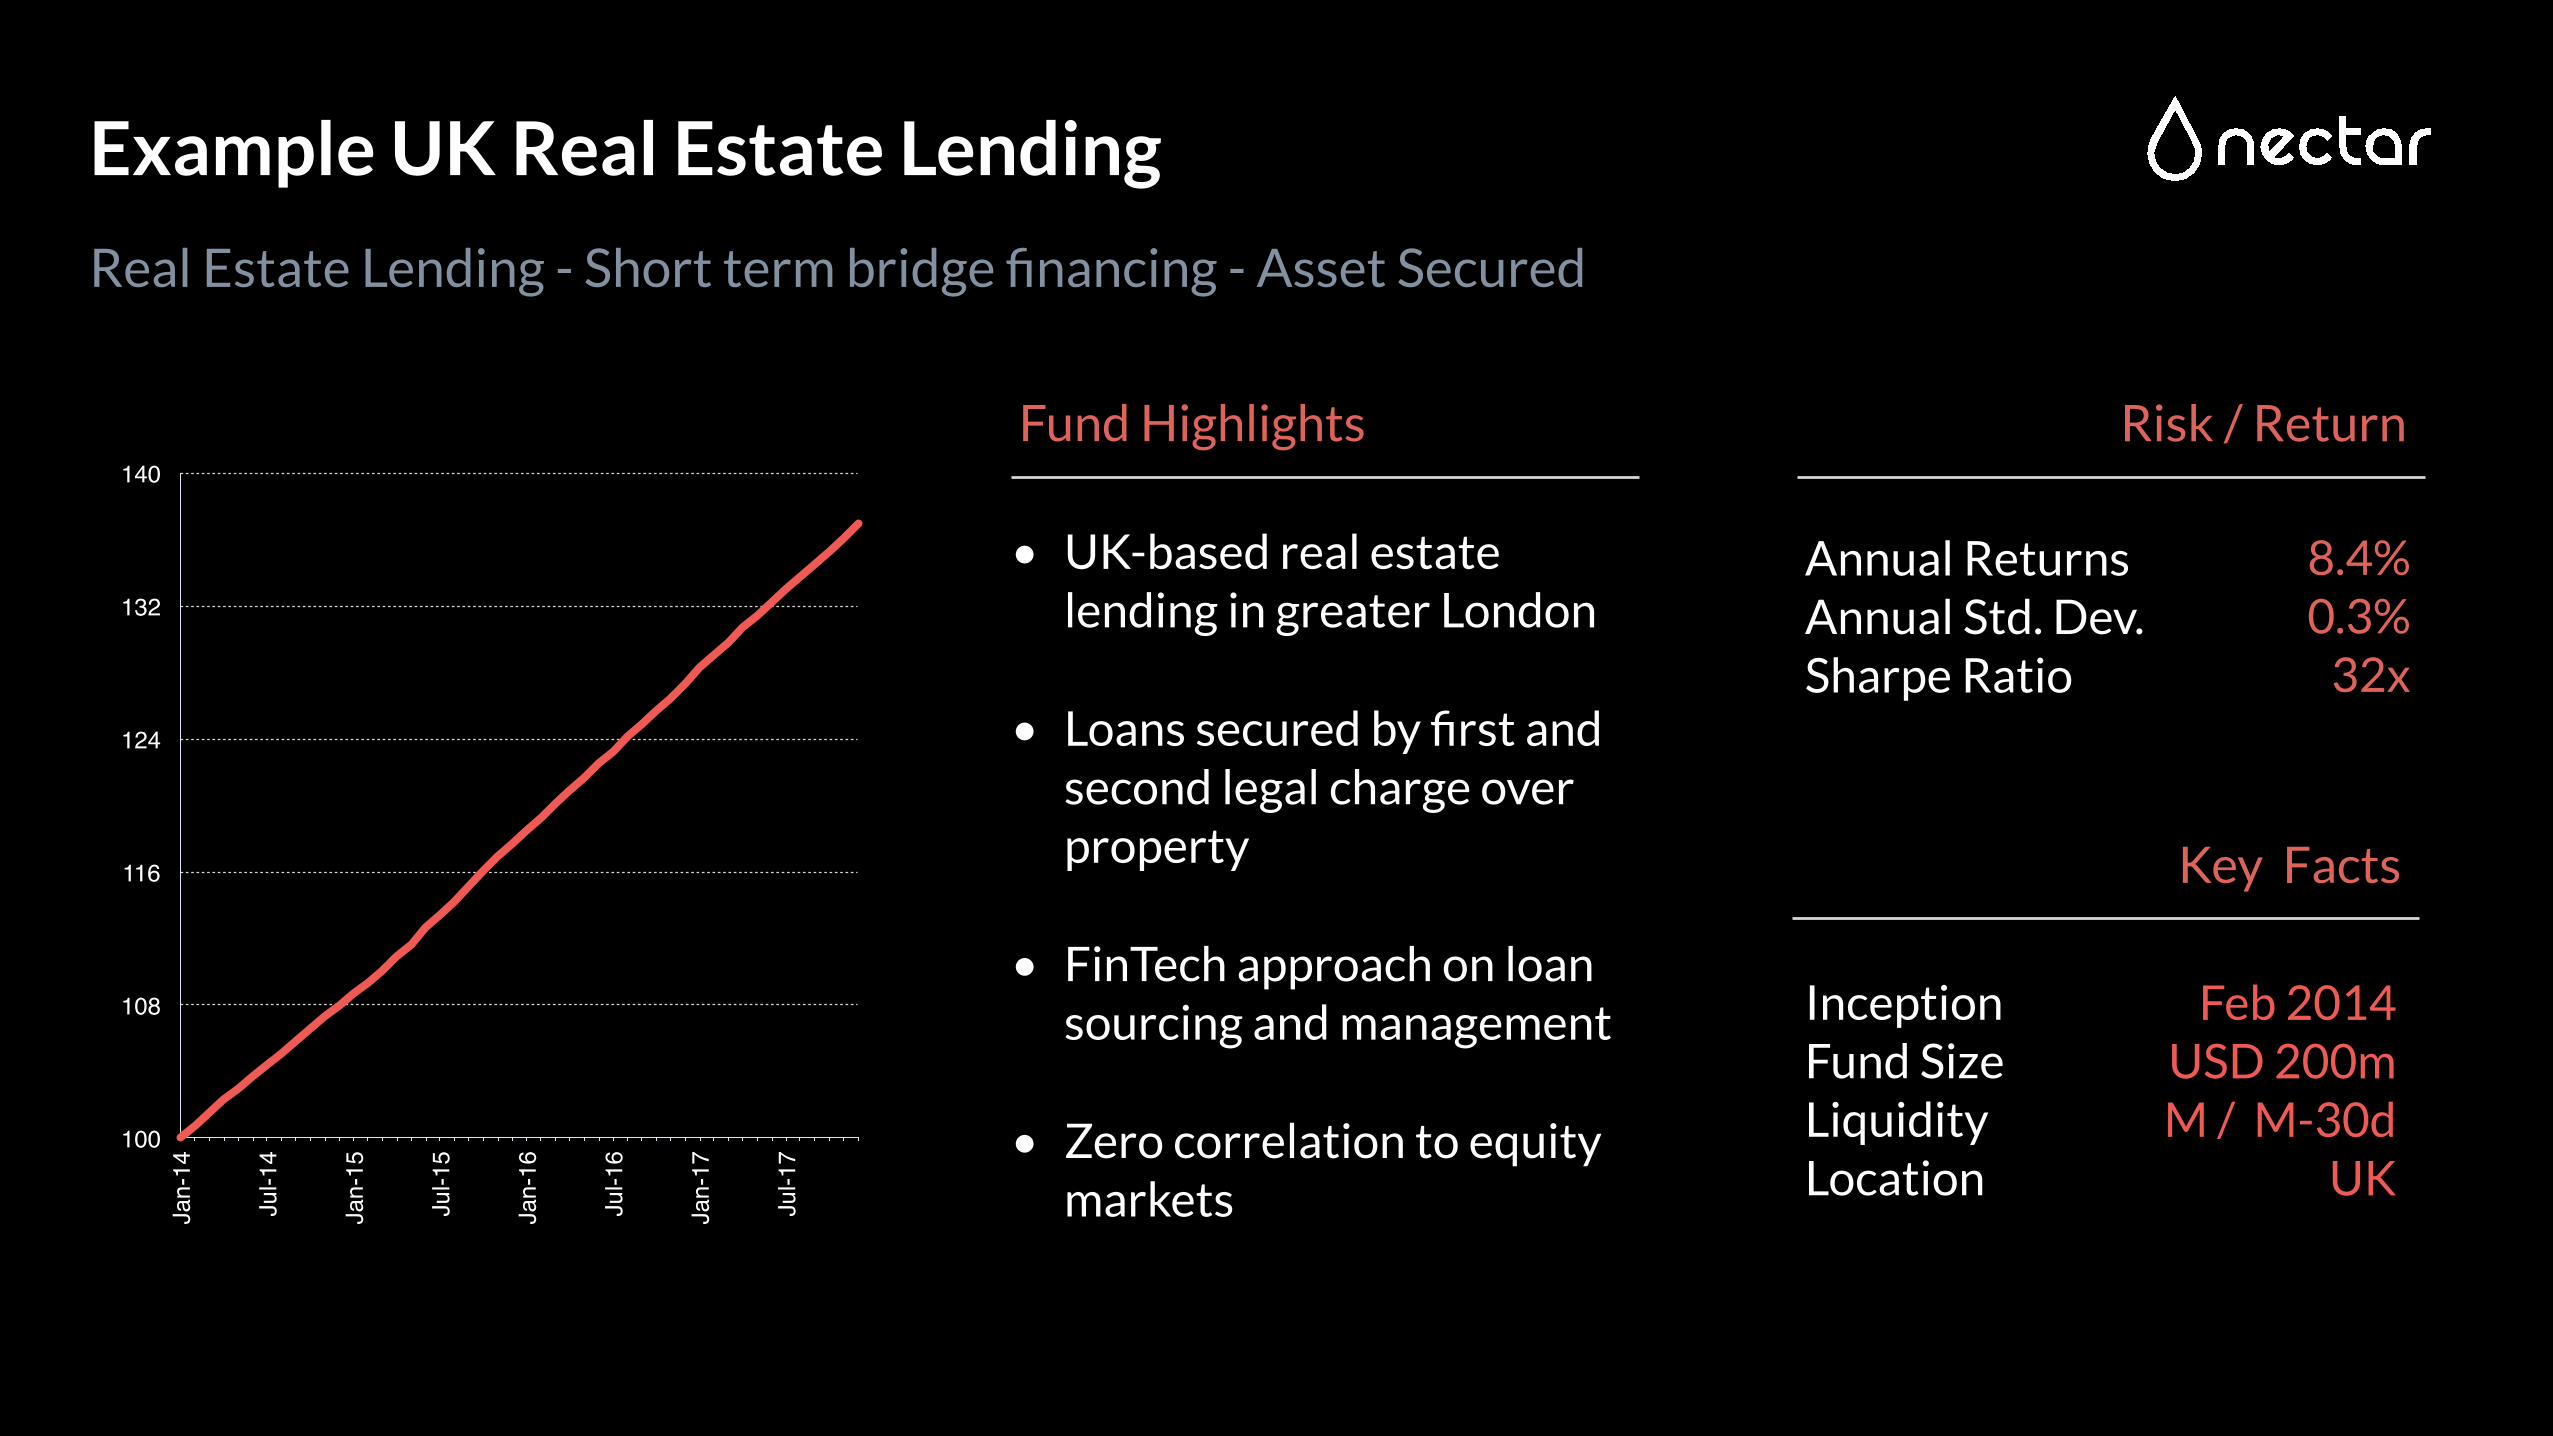
8.4%0.3%
32x
Risk / Return
Example UK Real Estate Lending
Real Estate Lending - Short term bridge financing - Asset Secured
Key Facts
Fund Highlights
InceptionFund SizeLiquidityLocation
Feb 2014USD 200mM / M-30d
UK
• UK-based real estate lending in greater London
• Loans secured by first and second legal charge over property
• FinTech approach on loan sourcing and management
• Zero correlation to equity markets
100
108
116
124
132
140
Jan-14
Jul-14
Jan-15
Jul-15
Jan-16
Jul-16
Jan-17
Jul-17
Annual ReturnsAnnual Std. Dev.Sharpe Ratio
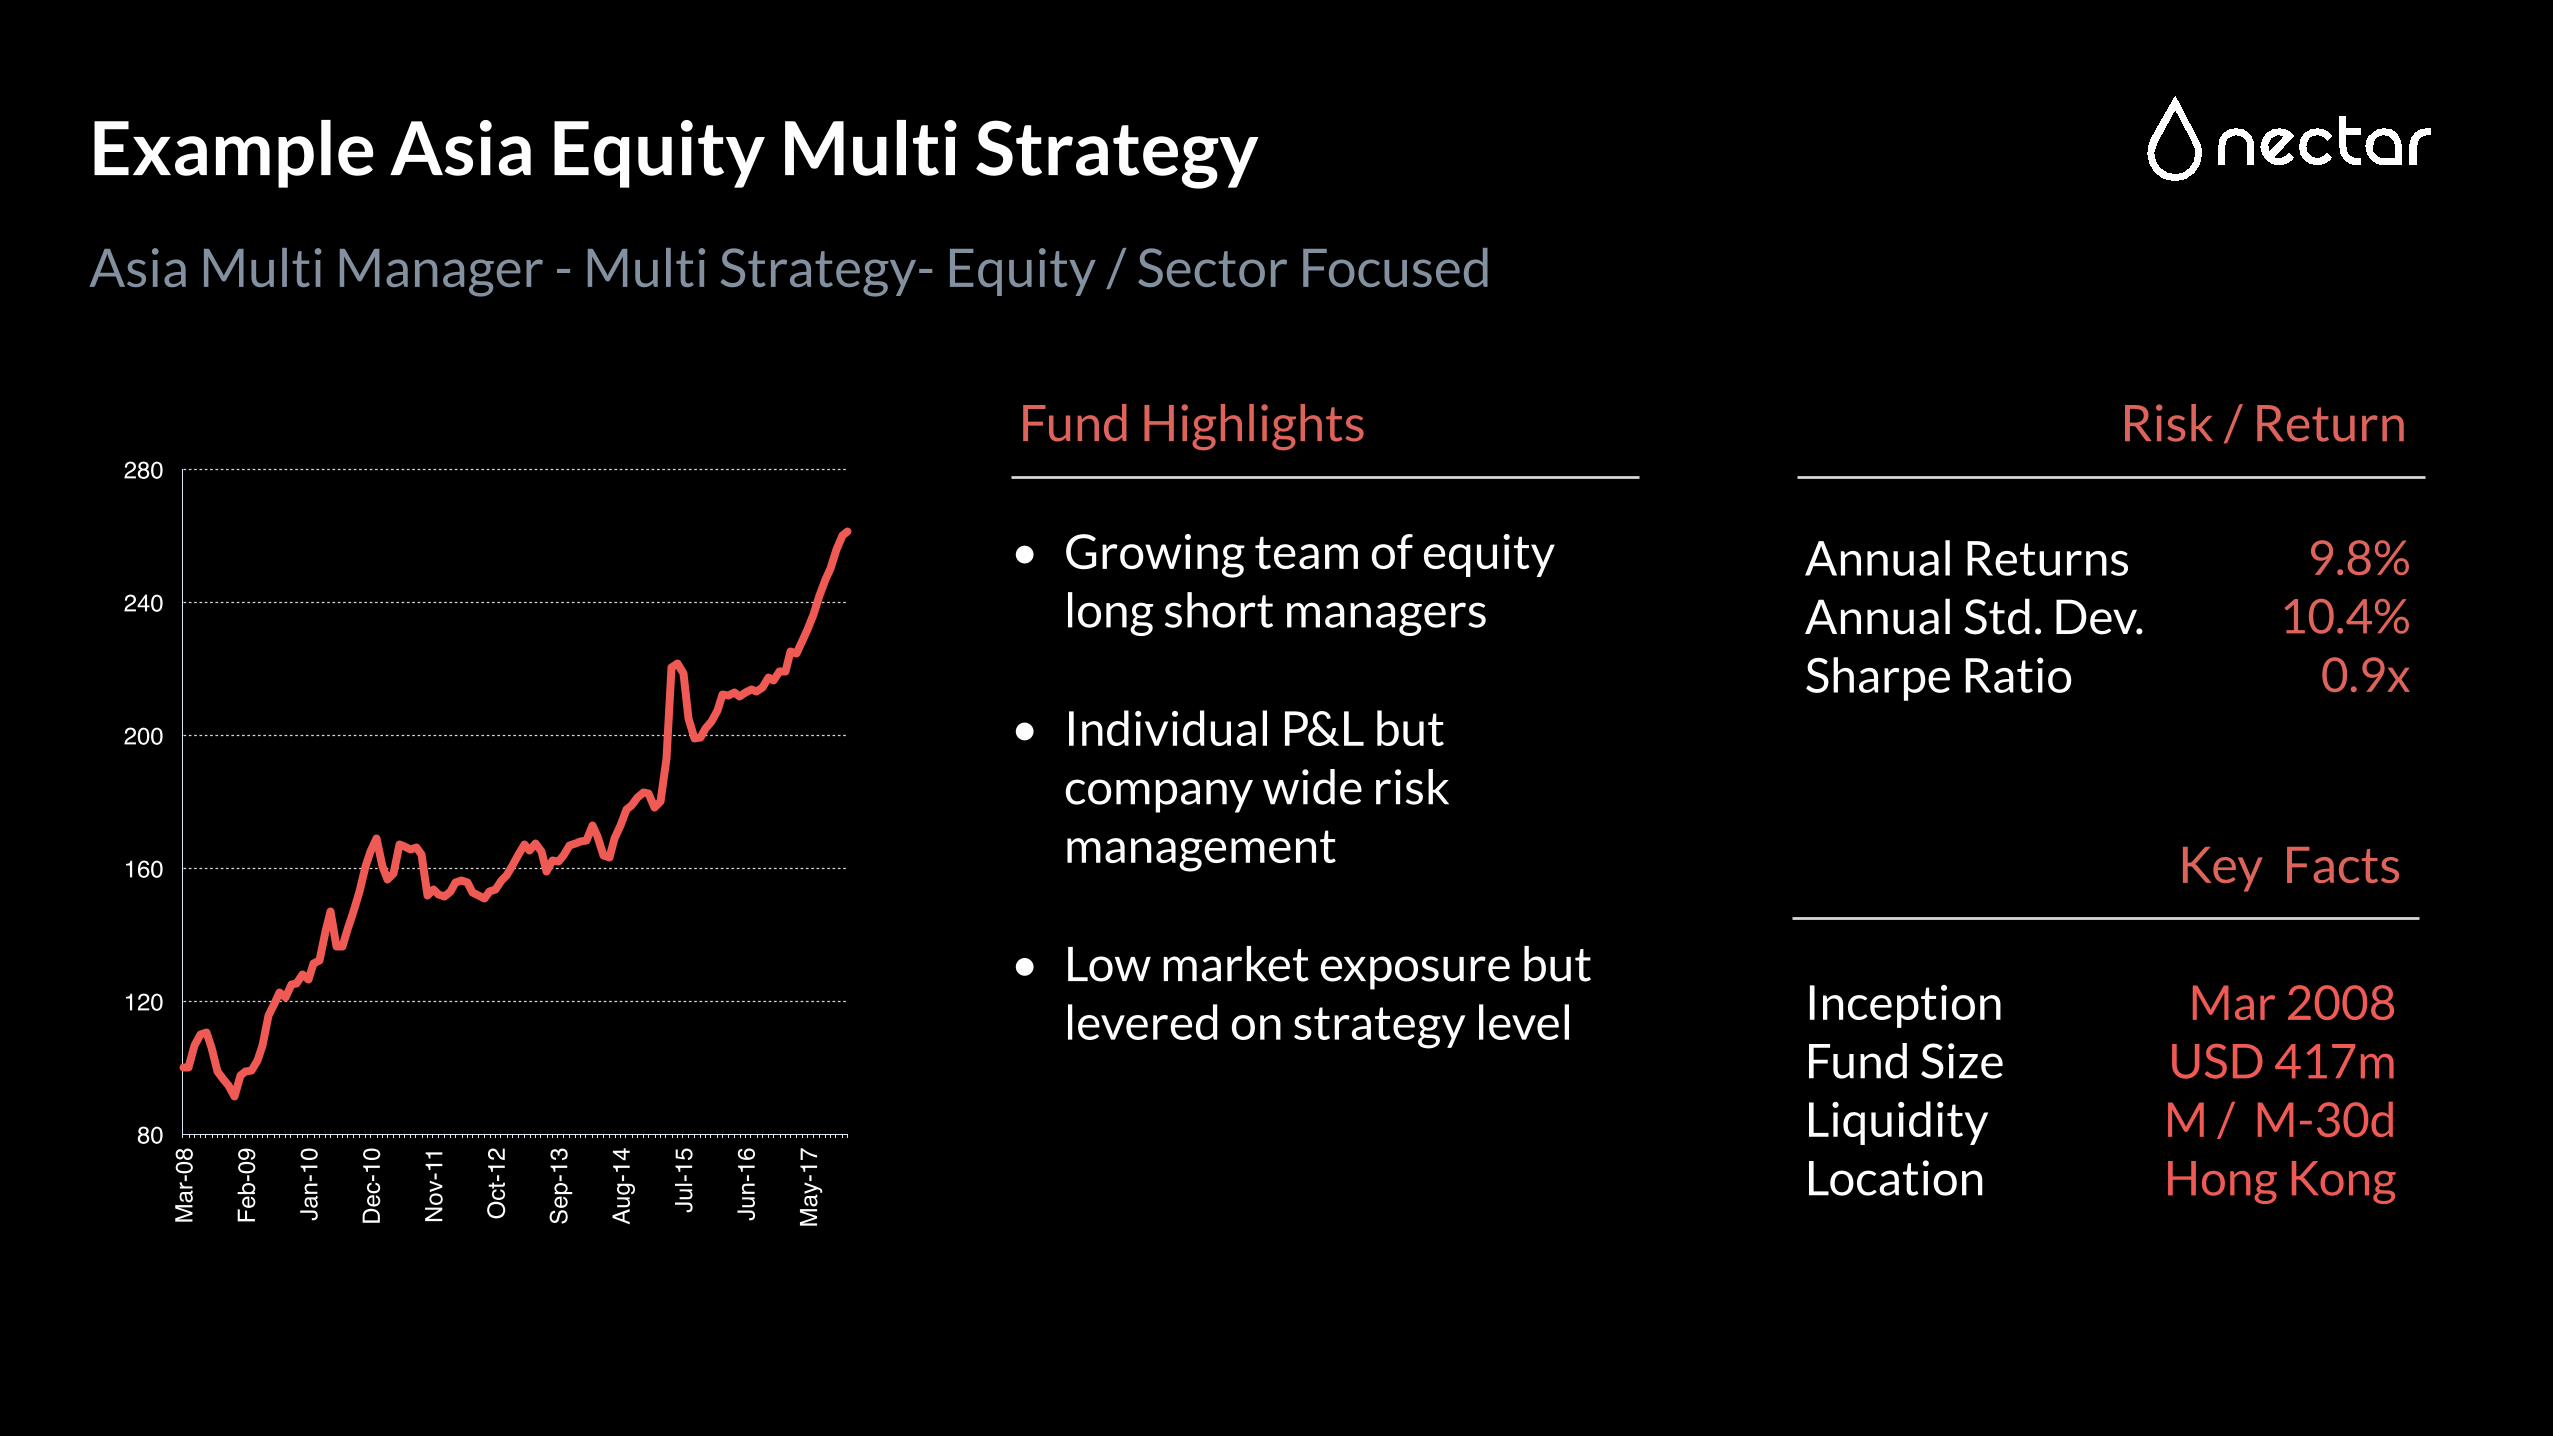
9.8%10.4%
0.9x
Risk / Return
Example Asia Equity Multi Strategy
Asia Multi Manager - Multi Strategy- Equity / Sector Focused
Key Facts
Fund Highlights
InceptionFund SizeLiquidityLocation
Mar 2008USD 417mM / M-30dHong Kong
• Growing team of equity long short managers
• Individual P&L but company wide risk management
• Low market exposure but levered on strategy level
80
120
160
200
240
280
Mar-08
Feb-09
Jan-10
Dec-10
Nov-11
Oct-12
Sep-13
Aug-14
Jul-15
Jun-16
May-17
Annual ReturnsAnnual Std. Dev.Sharpe Ratio
8.4%3.5%
2.1
Nectar Smart Alternatives
Fund of Funds Index
0.8%5.1%
-0.1
The Smart Alternatives Strategy is a digitally built portfolio. Returns shown are NET of fees (see terms and conditions). Walk-forward performance is not indicative for future results.
Barclay Fund of Funds Index
2
2
1
1
80
100
120
140
160
180
Sep
t-0
9
Sep
t-1
1
Sep
t-1
3
Sep
t-1
5
Sep
t-1
7
Sep
t-1
0
Sep
t-1
2
Sep
t-1
4
Sep
t-1
6
Annual ReturnsAnnual Std. Dev.Sharpe Ratio
Walk-Forward Performance Key Statistics
Result of the Implementation
Uncorrelated return sources, digital selection, human proof
• Out of sample walk forward test using digital investment process
• Systematic entry and exit signals
• Considering liquidity limitations on underlying funds
• Net of fees
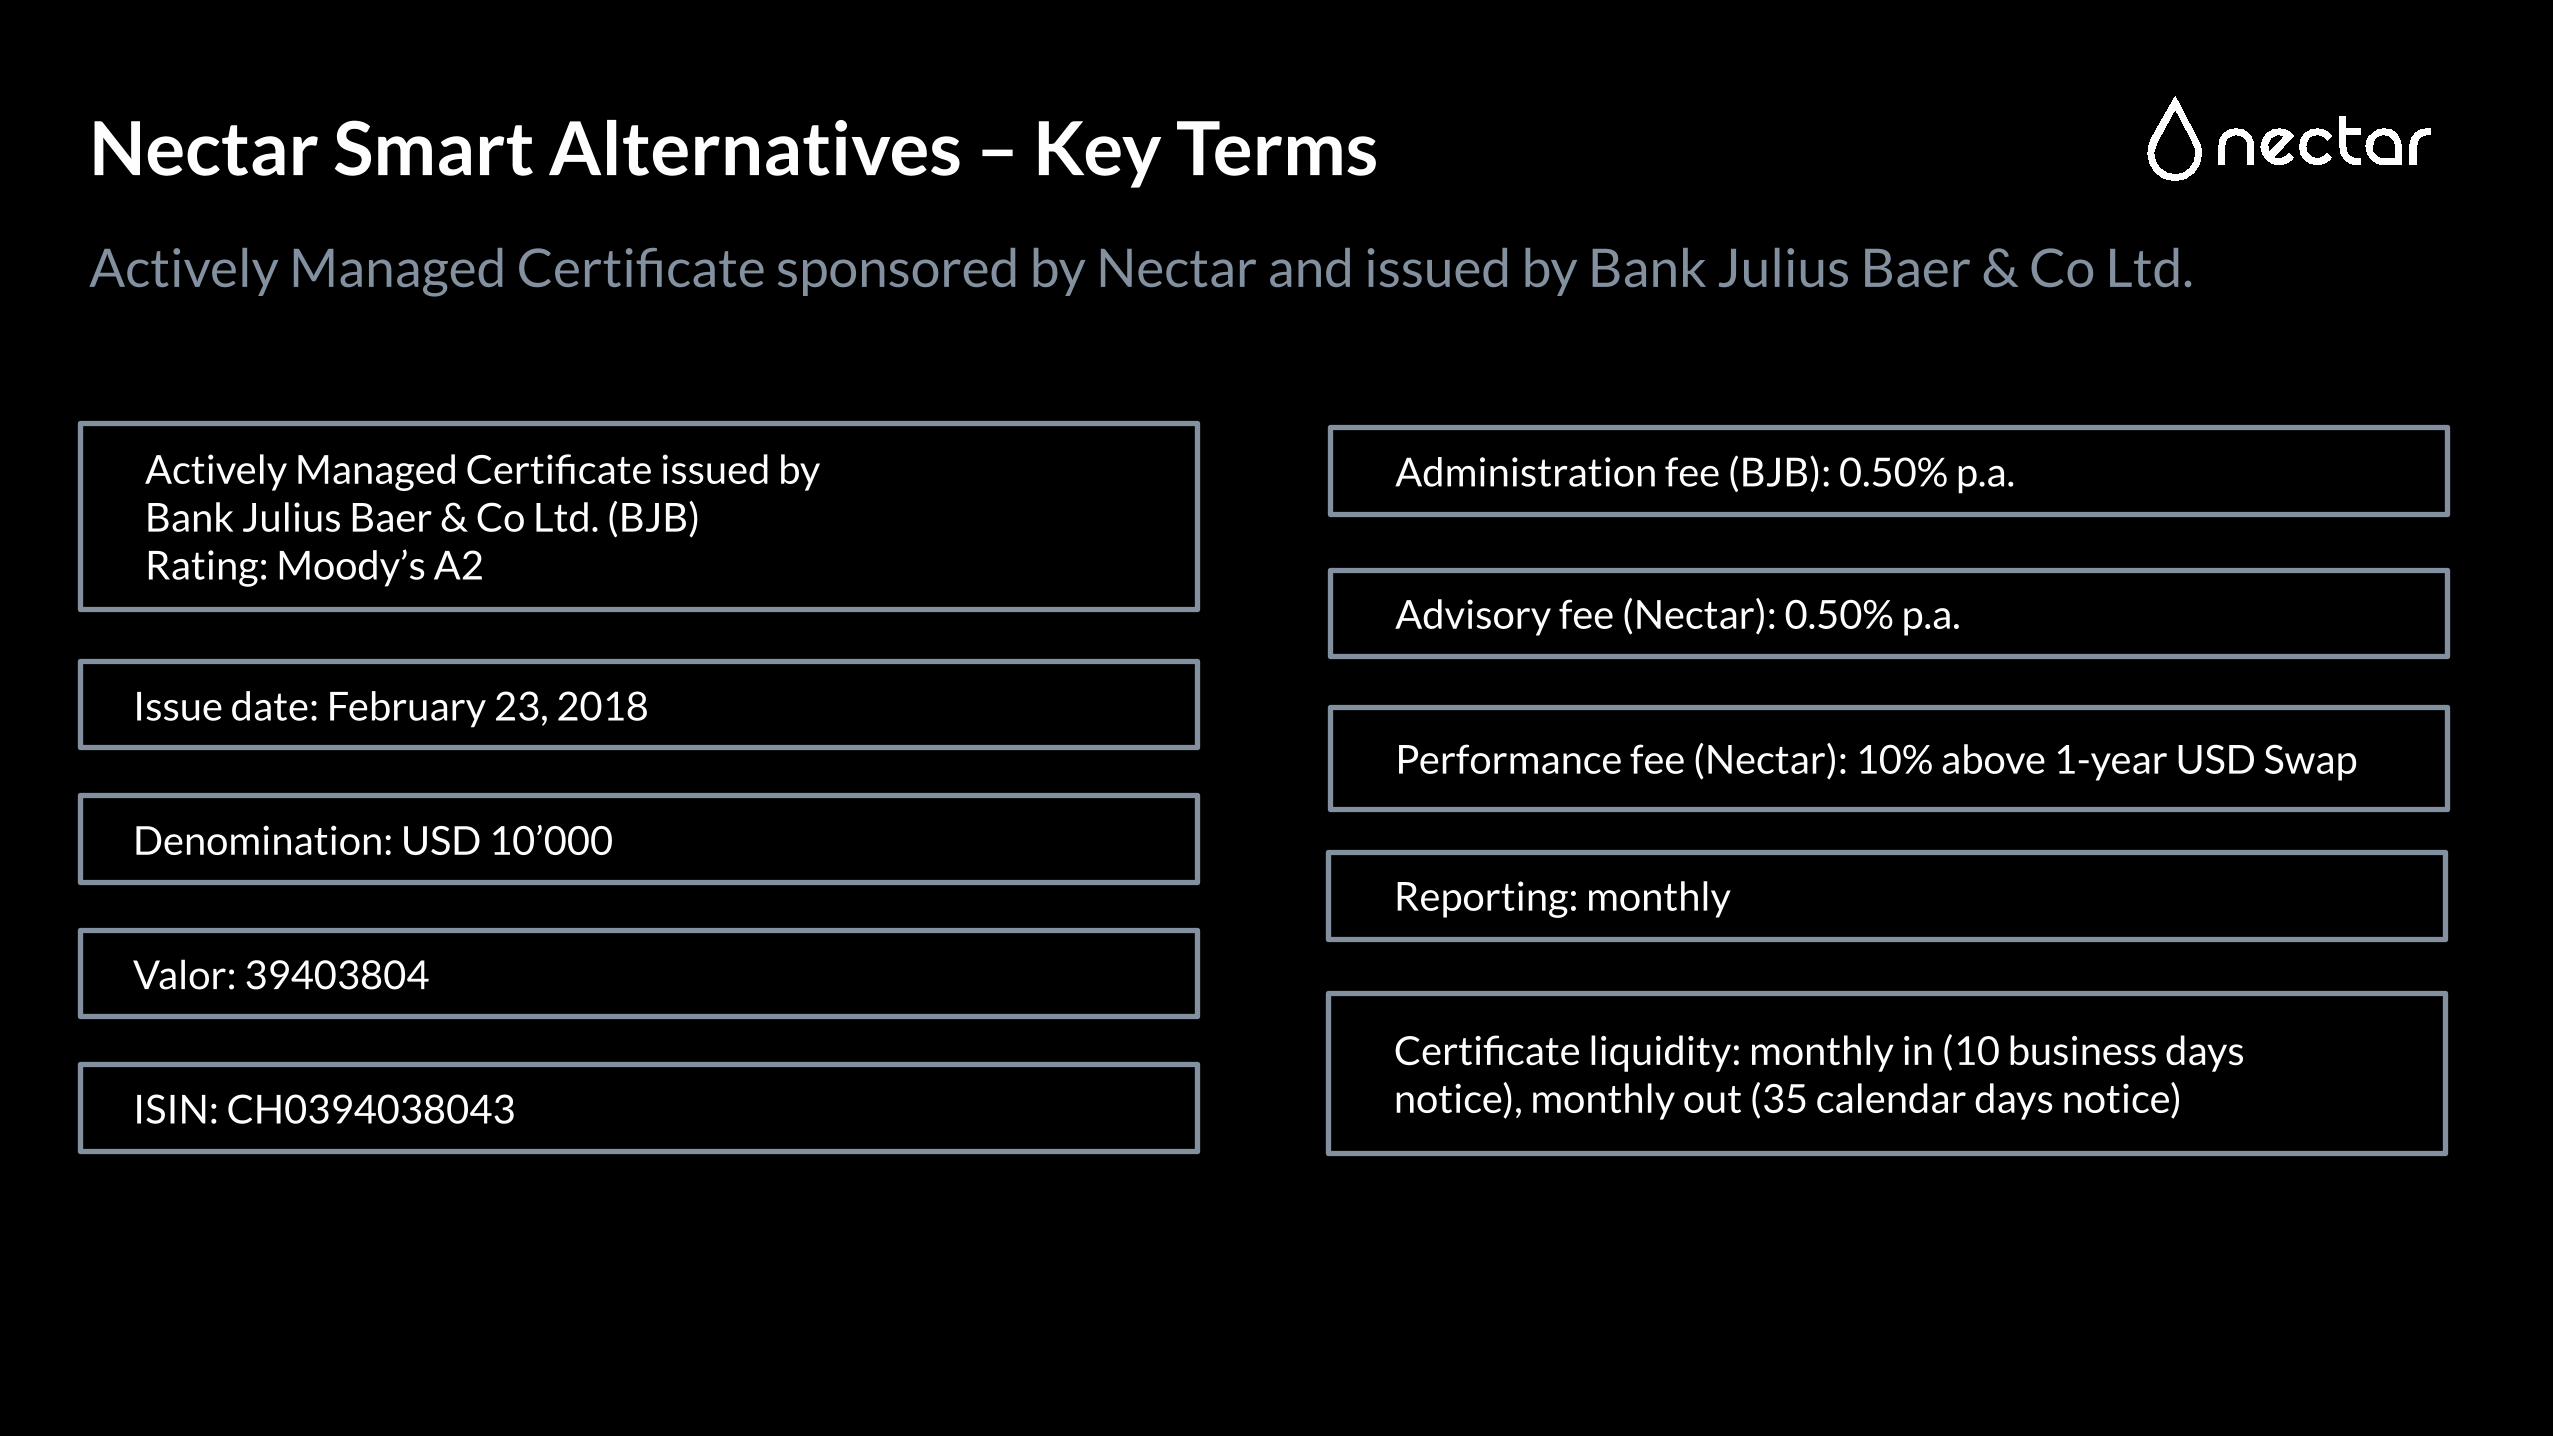
Actively Managed Certificate issued by Bank Julius Baer & Co Ltd. (BJB)Rating: Moody’s A2
Administration fee (BJB): 0.50% p.a.
Advisory fee (Nectar): 0.50% p.a.
Performance fee (Nectar): 10% above 1-year USD Swap
Certificate liquidity: monthly in (10 business days notice), monthly out (35 calendar days notice)
Reporting: monthly
Issue date: February 23, 2018
ISIN: CH0394038043
Denomination: USD 10’000
Nectar Smart Alternatives – Key Terms
Actively Managed Certificate sponsored by Nectar and issued by Bank Julius Baer & Co Ltd.
Valor: 39403804
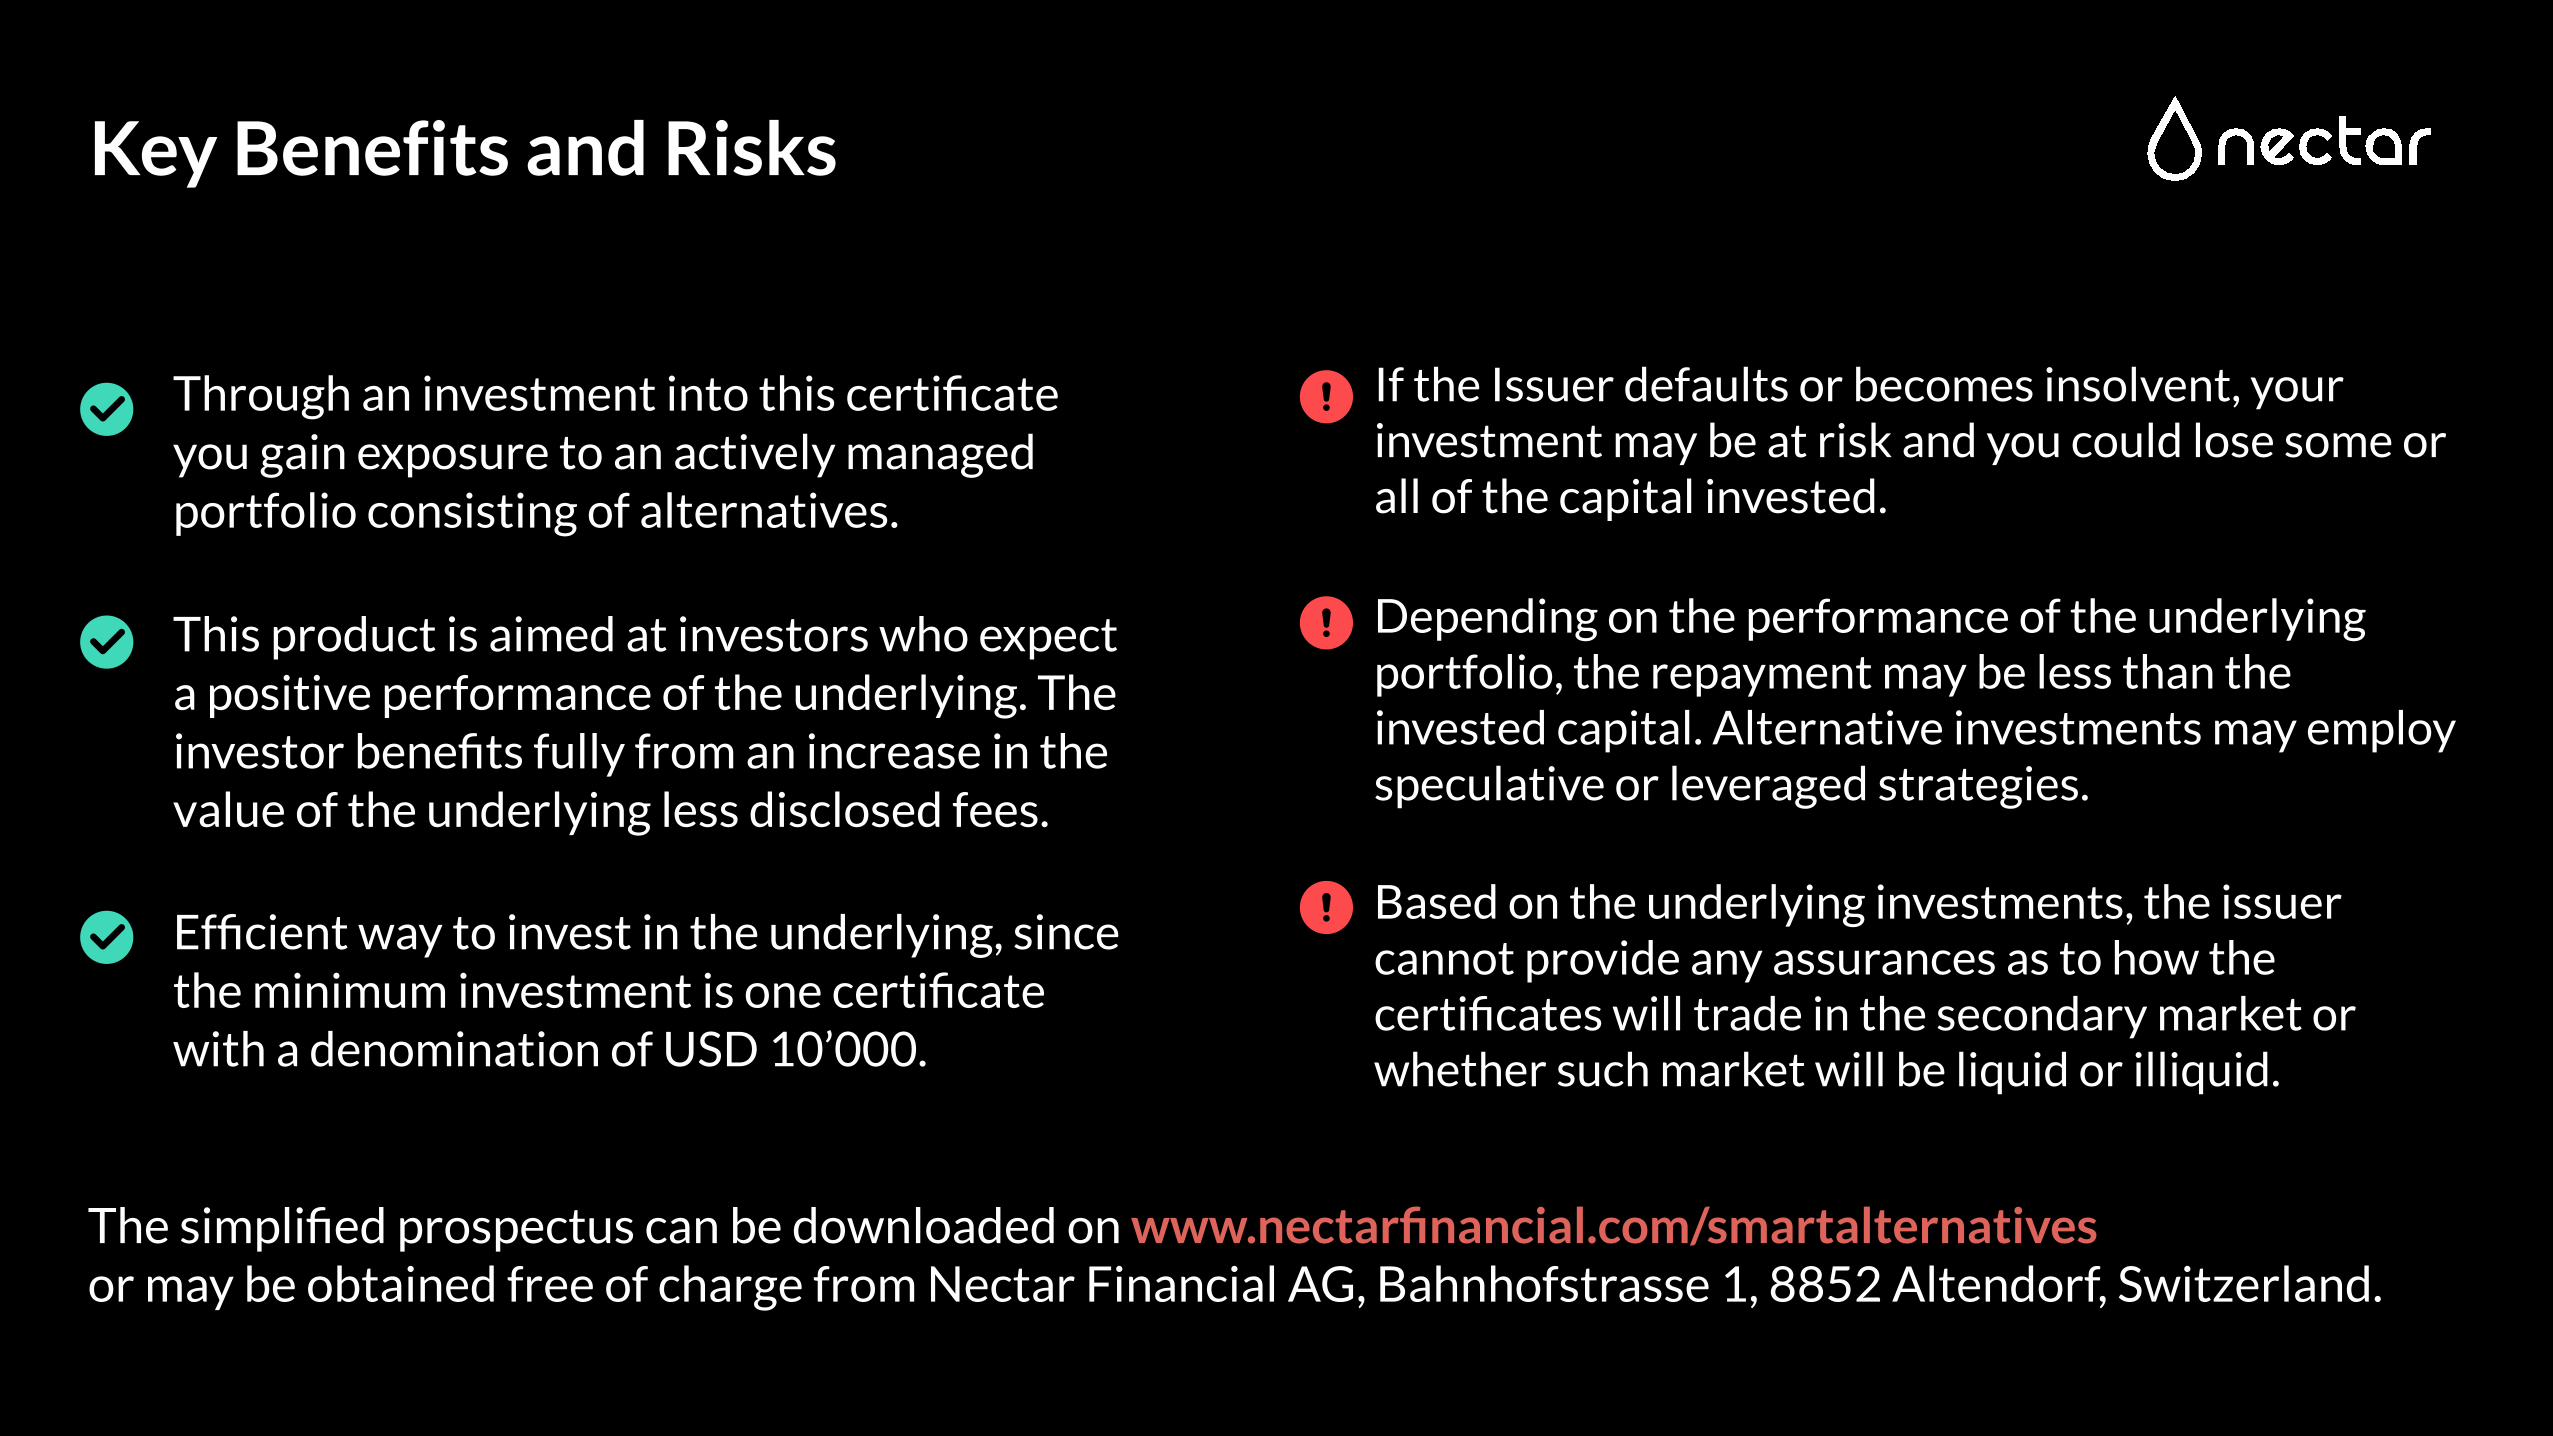
Through an investment into this certificate you gain exposure to an actively managed portfolio consisting of alternatives.
This product is aimed at investors who expect a positive performance of the underlying. The investor benefits fully from an increase in the value of the underlying less disclosed fees.
Efficient way to invest in the underlying, since the minimum investment is one certificate with a denomination of USD 10’000.
The simplified prospectus can be downloaded on www.nectarfinancial.com/smartalternatives or may be obtained free of charge from Nectar Financial AG, Bahnhofstrasse 1, 8852 Altendorf, Switzerland.
If the Issuer defaults or becomes insolvent, your investment may be at risk and you could lose some or all of the capital invested.
Depending on the performance of the underlying portfolio, the repayment may be less than the invested capital. Alternative investments may employ speculative or leveraged strategies.
Based on the underlying investments, the issuer cannot provide any assurances as to how the certificates will trade in the secondary market or whether such market will be liquid or illiquid.
Key Benefits and Risks
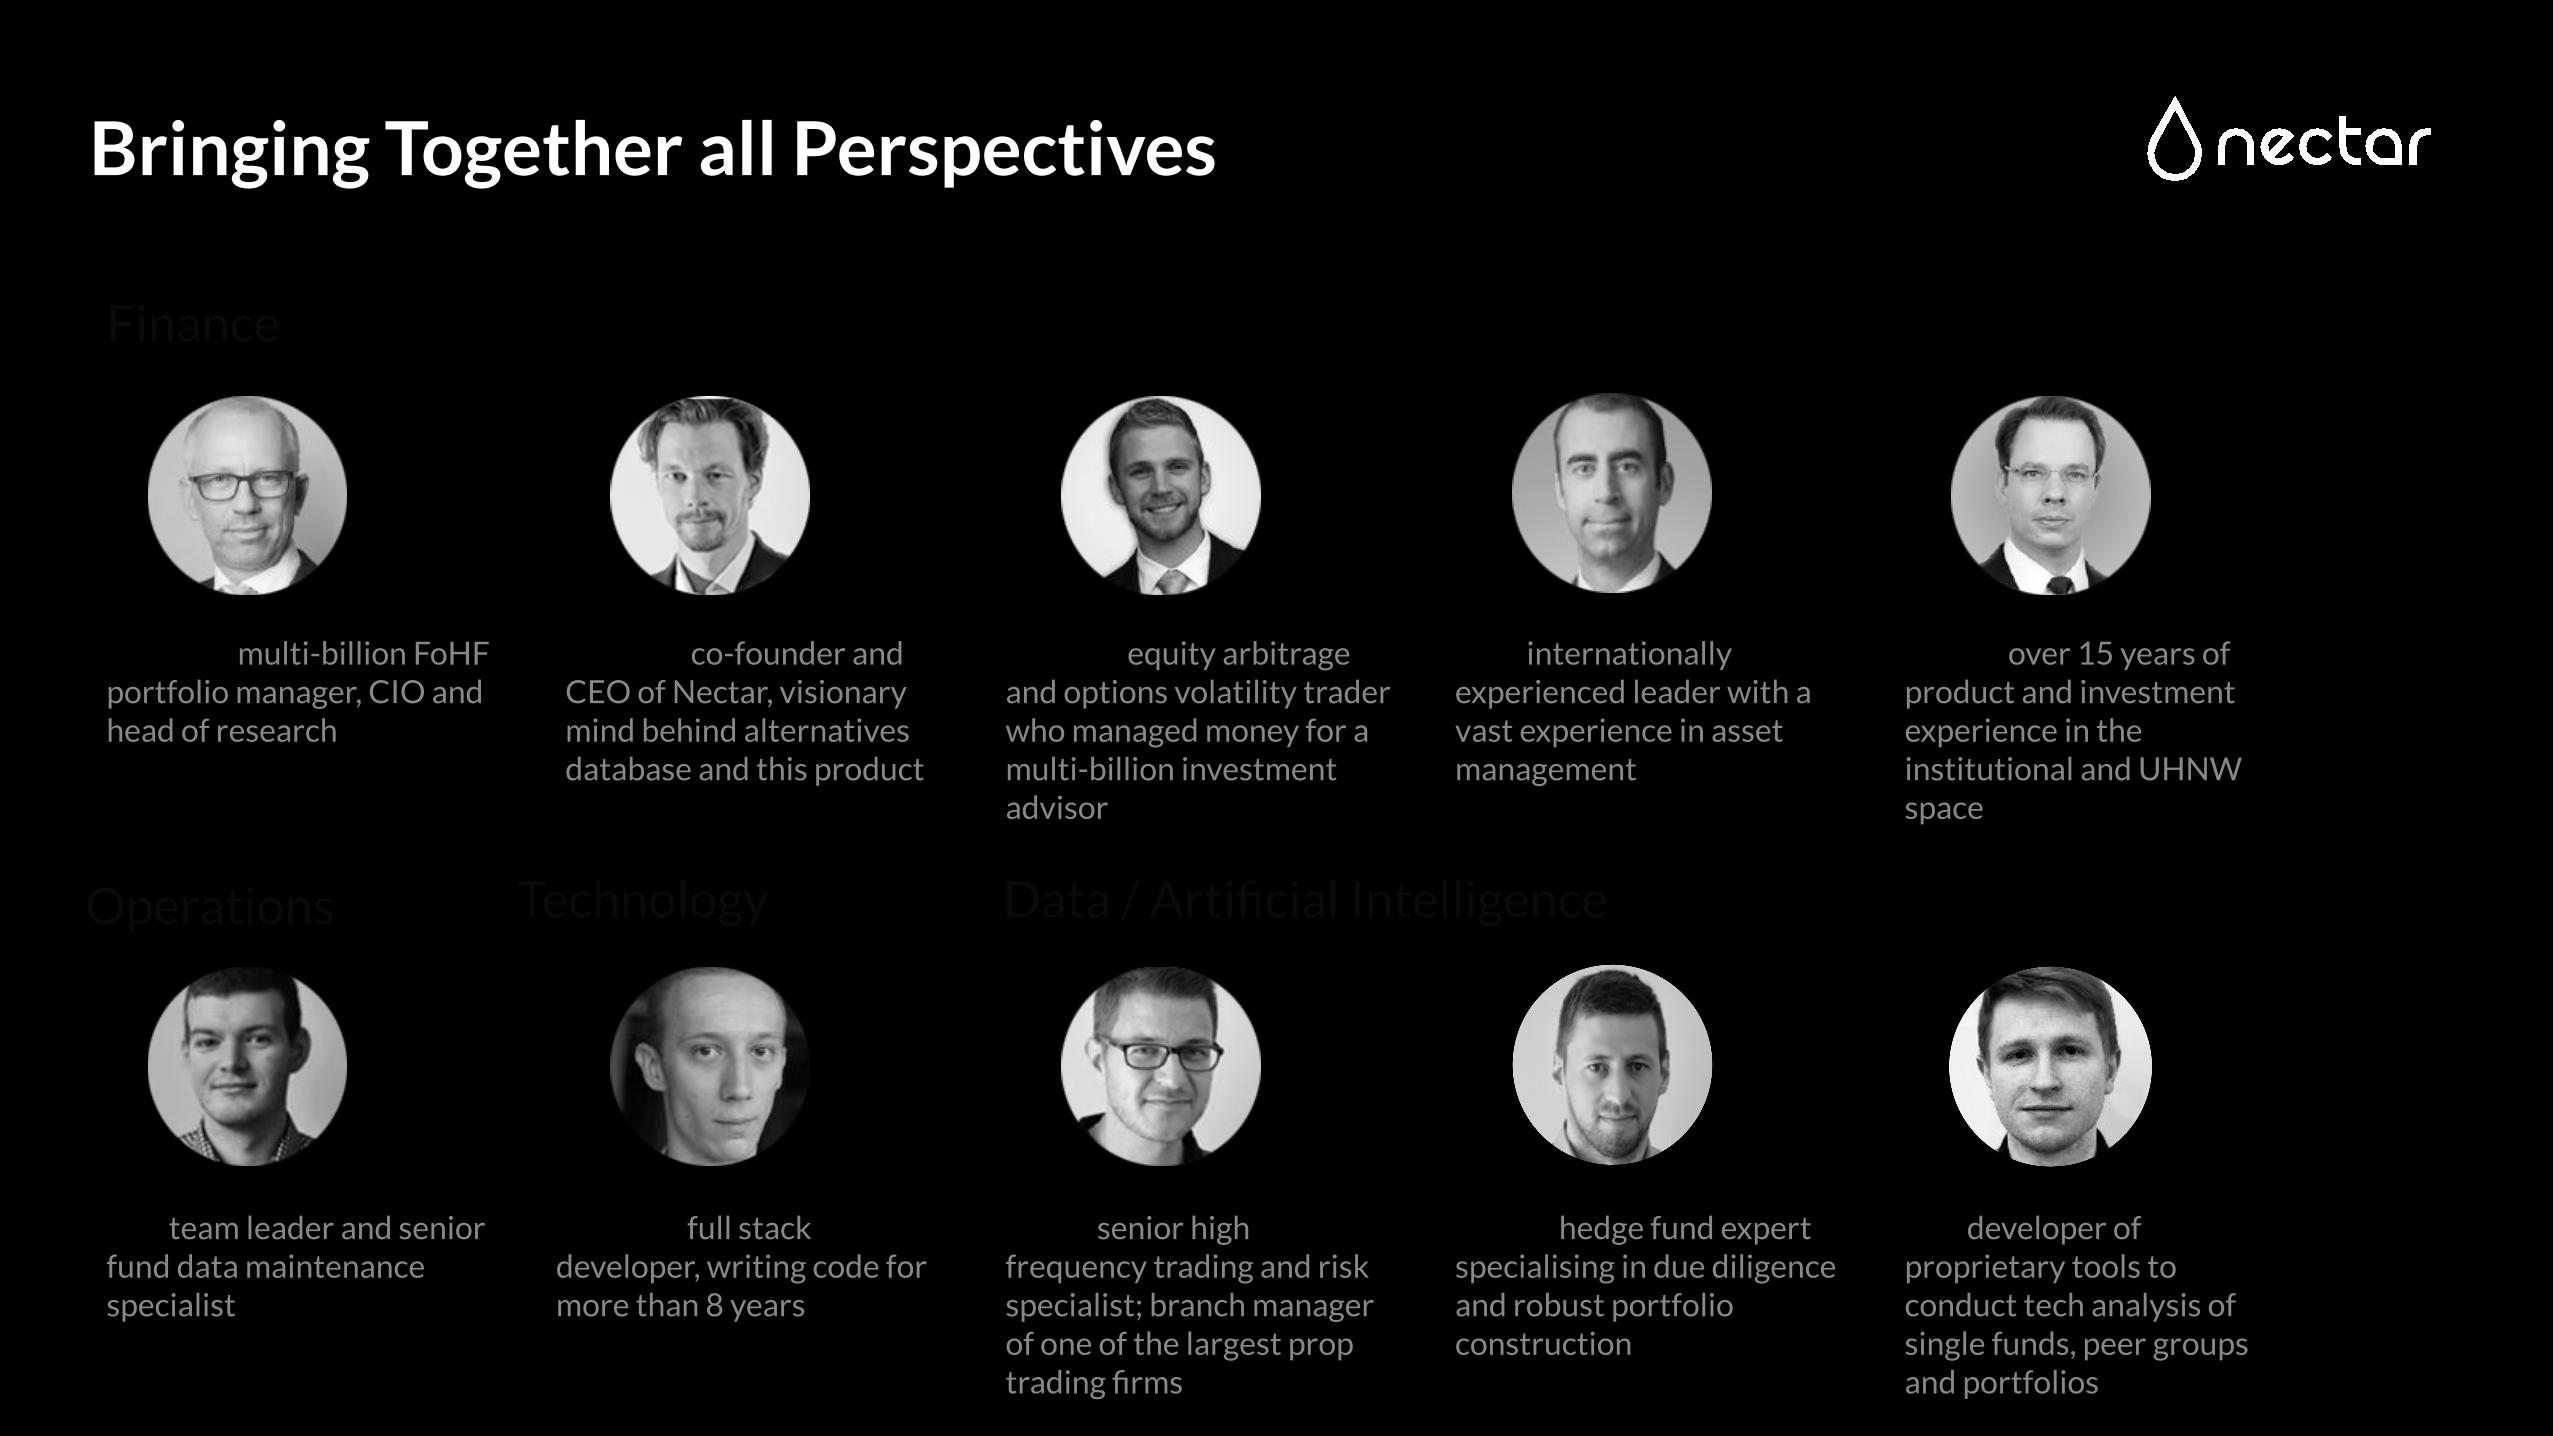
TechnologyOperations
Finance
Data / Artificial Intelligence
Lubomir: full stack developer, writing code for more than 8 years
Andreas: multi-billion FoHF portfolio manager, CIO and head of research
Michael: co-founder and CEO of Nectar, visionary mind behind alternatives database and this product
William: equity arbitrage and options volatility trader who managed money for a multi-billion investment advisor
Neil: internationally experienced leader with a vast experience in asset management
Tobias: over 15 years of product and investment experience in the institutional and UHNW space
Jan: team leader and senior fund data maintenance specialist
Peter: senior high frequency trading and risk specialist; branch manager of one of the largest prop trading firms
Srdjan: hedge fund expert specialising in due diligence and robust portfolio construction
Jan: developer of proprietary tools to conduct tech analysis of single funds, peer groups and portfolios
Bringing Together all Perspectives
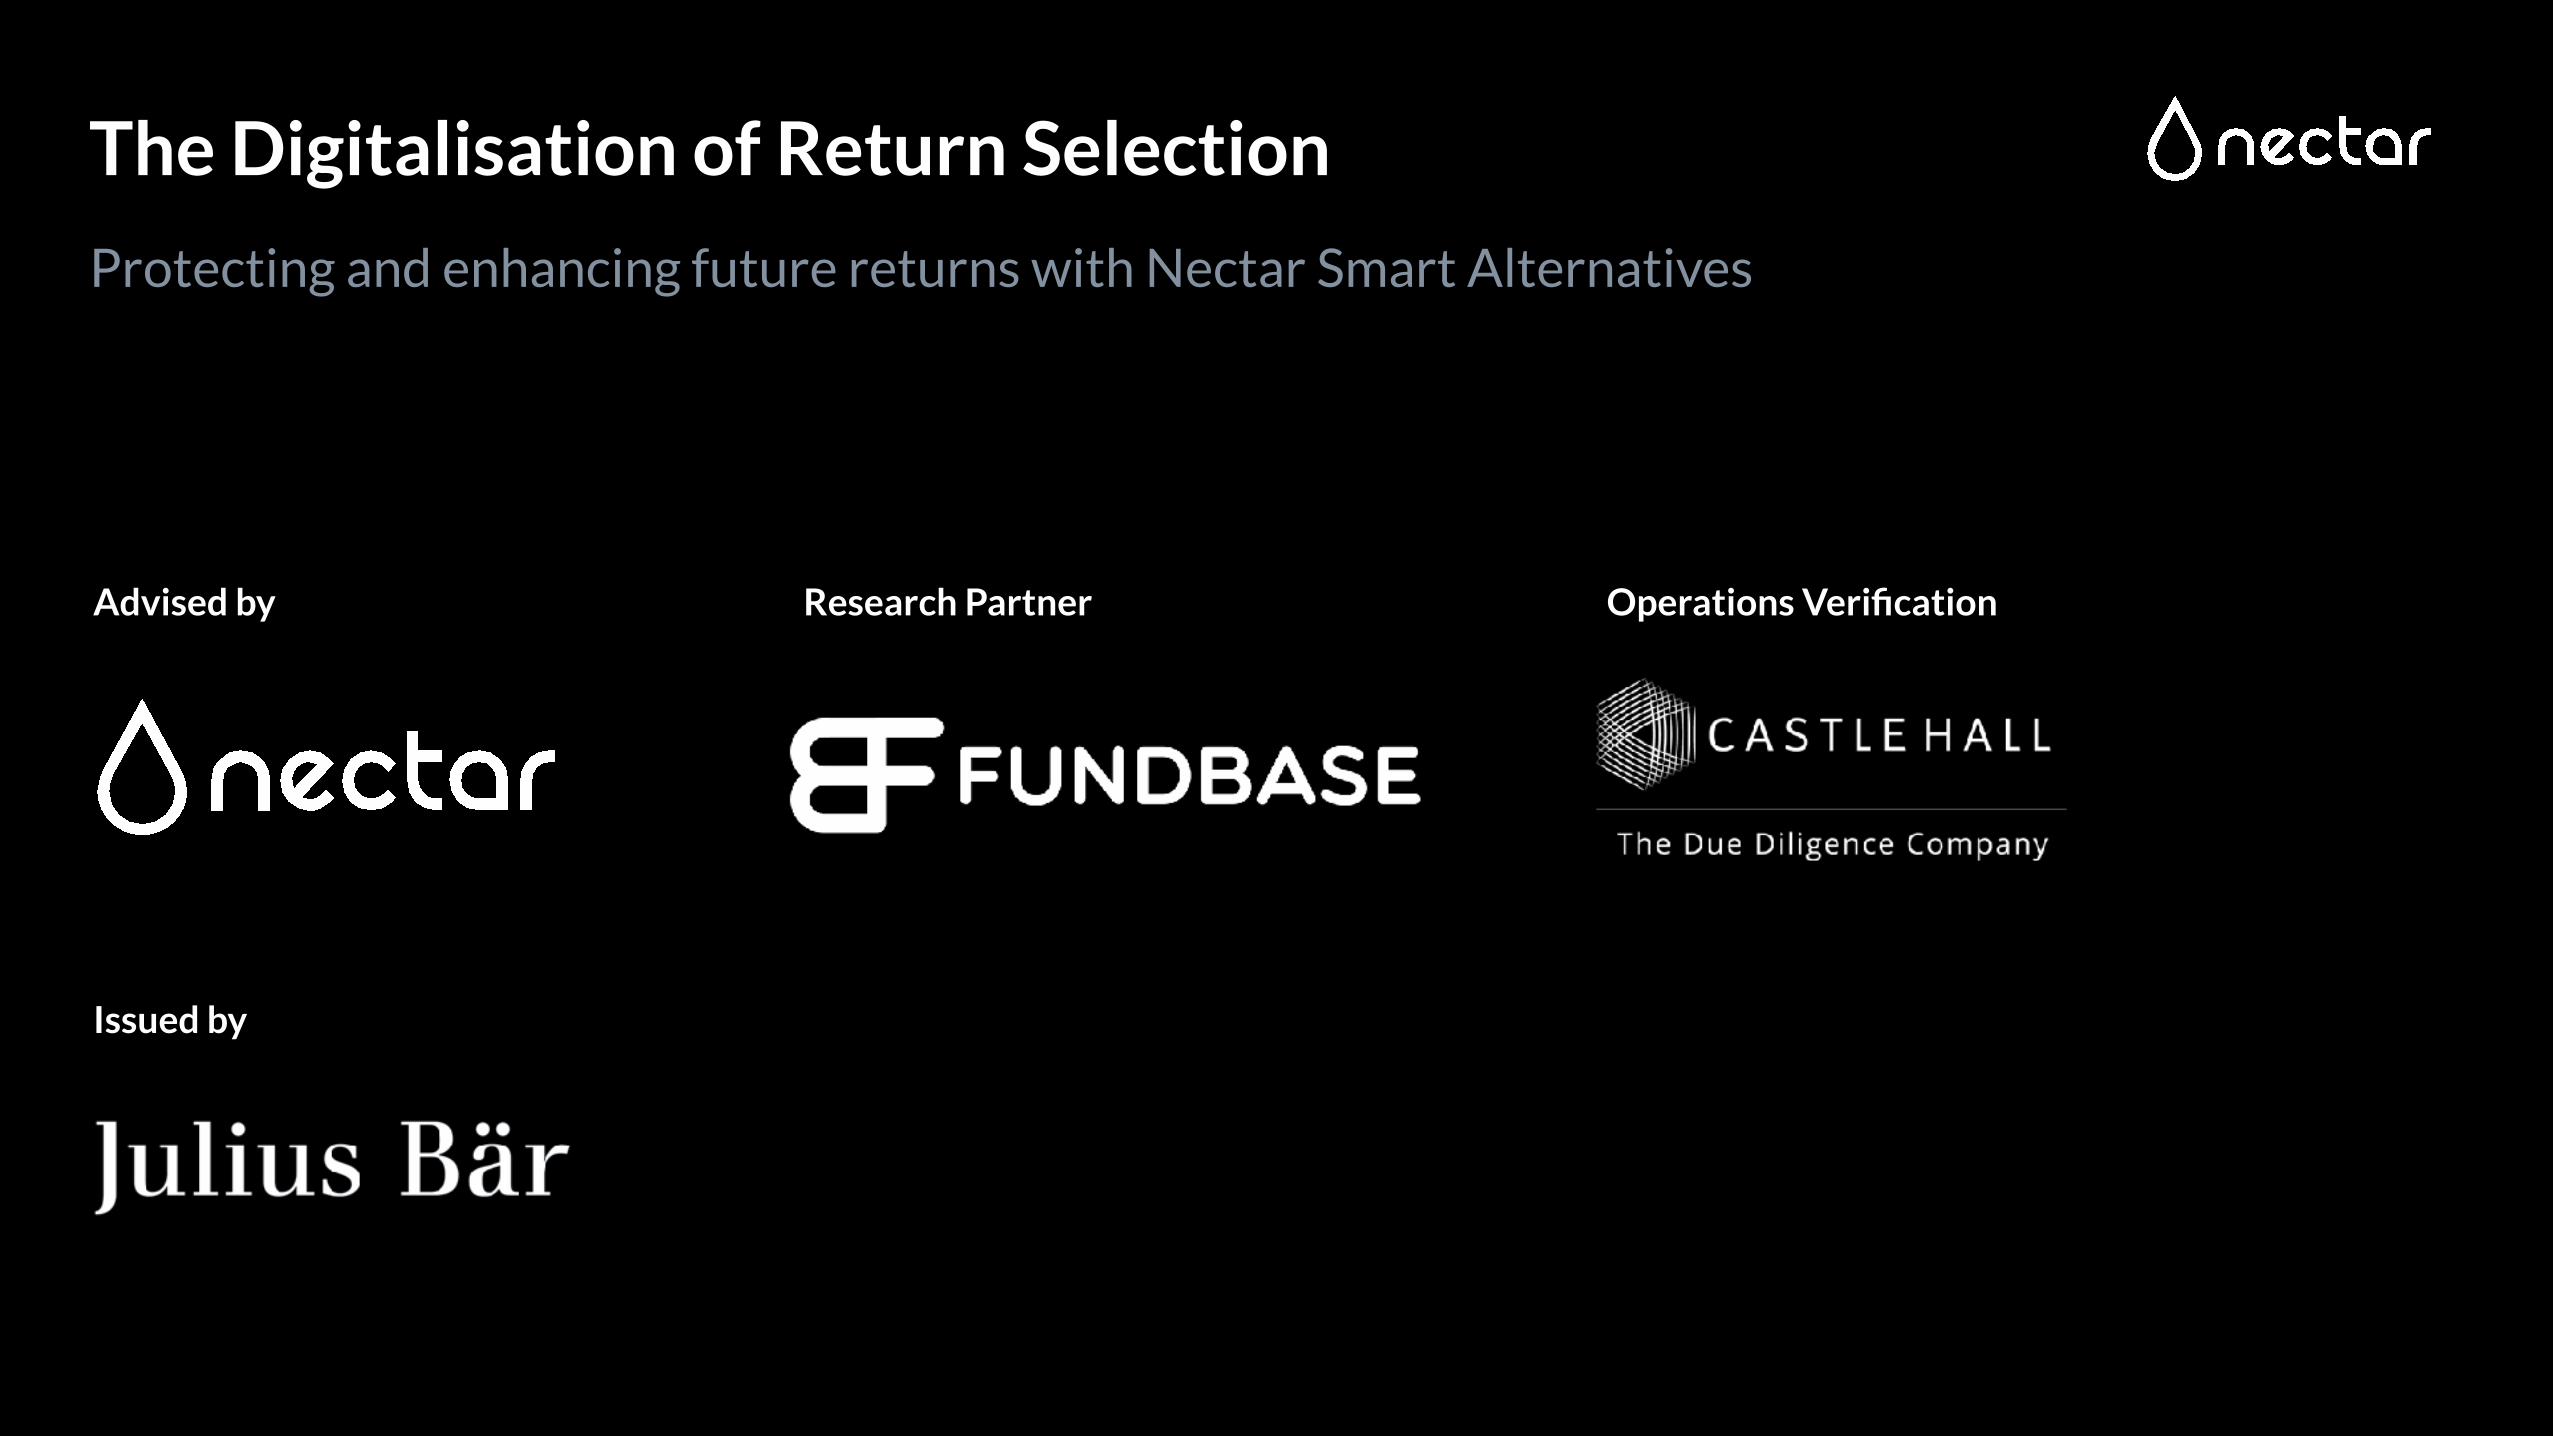
The Digitalisation of Return Selection
Advised by Research Partner Operations Verification
Issued by
Protecting and enhancing future returns with Nectar Smart Alternatives
This document is provided for your information and marketing purposes only. It is confidential and does not carry any right of publication, reproduction or disclosure, in whole or in part, to any other party. Any information including facts, opinions or quotations, may be condensed or summarized and is expressed as of the date of writing. The information may change without notice. Fundbase Fund Services AG (“Fundbase”) and/or Nectar Financial AG (“Nectar Financial”) are under no obligation to ensure that such updates are brought to your attention. Fundbase and Nectar Financial, their affiliates, directors and employees are hereinafter jointly referred to as the Companies.
The products and services described in this document may not be eligible or suitable for sale in all jurisdictions or to certain categories of investors, in particular not for persons subject to a jurisdiction that prohibits such publication and distribution.
No undertaking, representation, warranty or other assurance is given, and none should be implied, as to, and no reliance should be placed on, the accuracy or completeness of the information or opinions contained in the document. The information contained in the document is subject to completion, alteration and verification. The document is partly based on information obtained from sources believed to be reliable but are not guaranteed as being accurate, exact, complete, appropriate or up to date. The Companies’ opinions and estimates constitute the Companies' judgment and should be regarded as indicative, preliminary and for illustrative purposes only. The information and opinions expressed in this document do not constitute an investment advice or recommendation, and shall not be construed as a solicitation or an offer for sale or purchase of any product, to effect any transactions or to conclude any legal act of any kind whatsoever. Nothing in this document is based upon the consideration of the particular needs, investment objectives and financial situation of any specific investor, nor are they a complete statement of the products, services, markets or developments. The products are not suitable for all investors.
The document shall not form the basis of or be relied upon in connection with any contract or commitment to acquire any products. In addition, the analyses are not and do not purport to be appraisals of any asset, business or any other entity nor do the Companies make any representations as to the legal, tax or accounting effects of investing in these products. Prospective investors should consult with legal, tax, accounting and other advisors and must read final offering and product documents prior to making a decision. This document is subject to a more complete description and does not contain all of the information necessary to make an investment decision, including, but not limited to, the risks, fees and investment strategy.
The performance information presented in this document including charts and tables include backtested performance. Backtested performance is hypothetical (it does not reflect trading in actual accounts) and is provided for informational purposes only to indicate historical performance had the strategies been available over the time periods noted. Backtested performance shown is not an indicator of future actual results. The results reflect performance of portfolios not historically offered to investors and do not represent returns that any investor actually attained. Backtested results are calculated by the retroactive application of portfolios constructed on the basis of historical data provided and based on assumptions integral to portfolio construction principals which may or may not be testable and are subject to losses. Investors may get back less than their investment. The price and value of investments mentioned and any income that might accrue could fall or rise or fluctuate. Foreign currency rates of exchange may adversely affect the value, price or income of any products.
All statements of opinion and/or belief herein and all projections, forecasts or statements relating to expectations regarding future events or the possible future performance represent the Companies’ own assessment and interpretation of information available to it currently. No representation is made or assurance given that such statements, view, projections or forecasts are correct or that the objectives will be achieved.
Investments may have no public market or only a restricted or illiquid secondary market giving rise to potential difficulties in valuing and disposing of such investments. Alternative fund strategies may include the use of leverage (borrowing) and derivative instruments resulting in respective risks of potential loss.
The Companies may have or have had positions or holdings, or other material interest or effect transactions in the products described in the document. The Companies may be providing, or have provided advice or other investment services in relation to the investment concerned or a related investment to any company or issuer mentioned.
In no event shall the Companies have any liability whatsoever to any person for any direct or indirect loss, liability, cost, claim, expense or damage of any kind, whether in contract or in tort, including negligence, or otherwise, arising out of or related to the access to or the use of the document, the use of all or part of the information contained therein.
Copyright 2017. Nectar Financial AG.
Disclaimer