Embed Size (px)
Citation preview

NEBRASKA RN SURVEY REPORT
2015
2015
BASED ON 2014 LICENSE RENEWAL DATA BY NEBRASKA CENTER FOR NURSING
NEBRASKA DEPARTMENT OF HEALTH AND HUMAN SERVICES |

1 | P a g e
This Page Intentionally Left Blank

2 | P a g e
EXECUTIVE SUMMARY
Nursing workforce continues to expand in the State of Nebraska, although most
of the growth has been concentrated in metropolitan areas, as in the cities of
Lincoln and Omaha. This contrasts with rural Nebraska where there is a number
of counties without a presence of nurses (RNs or LPNs).
The average age of RNs has kept quite stable over the years, with a minimum
average age of 43.3 in 2004 and a maximum average of 44.7 years in 2010. The
current (2014) average age is 43.6 years, and nationwide the average age is
44.6 years (HRSA, 2013) 1.
The percent of males within Registered Nurses has steadily increased over the
years, reaching a high of 6% in the year 2014. The percentage of males within
RNs is still lower than the national average (9.1%). RNs who are considered
minorities have also increased over the years, from 3.1% in the year 2000, to 6%
in the year 2014. At the state level, 19% of the population is considered a
minority2. Nationwide, 14.8% of RNs are considered minorities (HRSA, 2013).
In terms of education attainment, RNs with bachelor degrees have increased
nearly 10% from the year 2008 to the year 2014 (51.3% vs. 61.0%, respectively).
At the national level, just 44.6% of RNs hold a bachelor degree. Also, RNs with
doctoral degrees have more than doubled, from 74 RNs with doctoral degrees
in 2003 to a total of 163 RNs in 2014 (120% growth). Overall, RNs holding masters
and doctoral degrees represent 10.6% of the workforce, which is similar to the
national statistics (HRSA, 2013).
1 US Department of Health and Human Services. (2013). The US nursing workforce: Trends in
supply and education.
(http://bhpr.hrsa.gov/healthworkforce/supplydemand/nursing/nursingworkforce/nursingworkfor
cefullreport.pdf)
2 U.S. Census Bureau (2013 estimates).
3 | P a g e
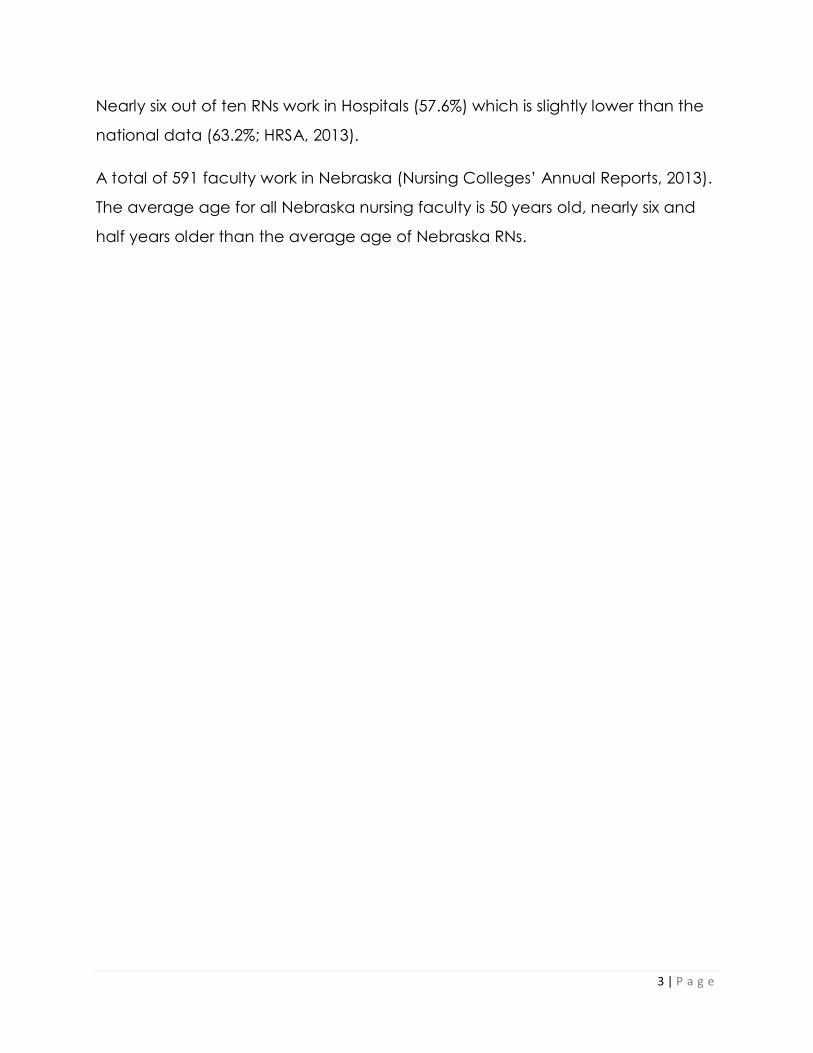
Nearly six out of ten RNs work in Hospitals (57.6%) which is slightly lower than the
national data (63.2%; HRSA, 2013).
A total of 591 faculty work in Nebraska (Nursing Colleges’ Annual Reports, 2013).
The average age for all Nebraska nursing faculty is 50 years old, nearly six and
half years older than the average age of Nebraska RNs.

4 | P a g e
Contents
EXECUTIVE SUMMARY ......................................................................................................................................... 2
2014 RN Renewal Survey.................................................................................................................................... 5
Demographics ................................................................................................................................................. 5
Age ................................................................................................................................................................. 5
Race/ethnicity .............................................................................................................................................. 6
Gender ........................................................................................................................................................... 7
Education ...................................................................................................................................................... 7
Work Environment............................................................................................................................................ 9
Type of Setting .............................................................................................................................................. 9
Employment ................................................................................................................................................ 11
Advance Practice Role ............................................................................................................................ 12
Satisfaction levels with employment ..................................................................................................... 13
Geographic distribution of RNs in Nebraska ........................................................................................... 19
APPENDIX ............................................................................................................................................................ 21
Location of the basic nursing education program that prepared for rn licensing examination 21
Employment specialty that most closely corresponds to your PRIMARY nursing practice position
........................................................................................................................................................................... 22
RN 2014 WORKFORCE RENEWAL SURVEY ................................................................................................. 23
5 | P a g e
2014 RN RENEWAL SURVEY
A total of 21,015 online surveys were analyzed. This total represents RNs who
work in the State of Nebraska. When warranted, results are compared with 2012
or earlier RN Renewal Survey results.
DEMOGRAPHICS
AGE
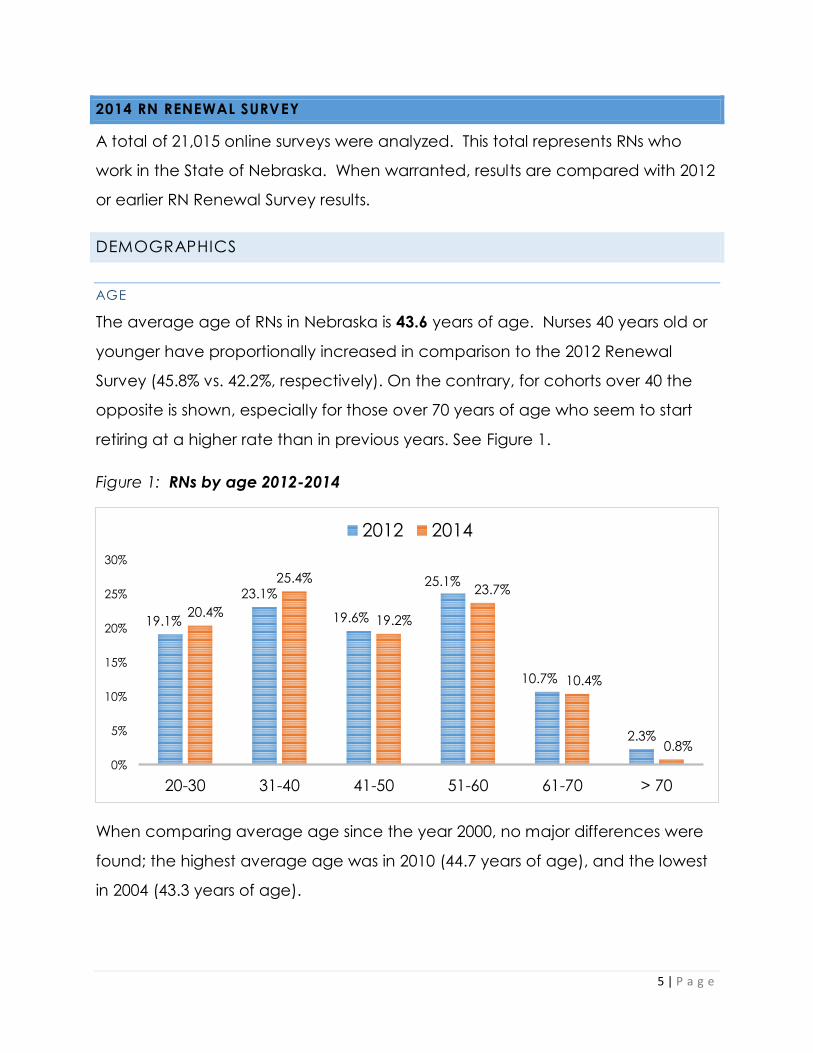
The average age of RNs in Nebraska is 43.6 years of age. Nurses 40 years old or
younger have proportionally increased in comparison to the 2012 Renewal
Survey (45.8% vs. 42.2%, respectively). On the contrary, for cohorts over 40 the
opposite is shown, especially for those over 70 years of age who seem to start
retiring at a higher rate than in previous years. See Figure 1.
Figure 1: RNs by age 2012-2014
When comparing average age since the year 2000, no major differences were
found; the highest average age was in 2010 (44.7 years of age), and the lowest
in 2004 (43.3 years of age).
19.1%
23.1%
19.6%
25.1%
10.7%
2.3%
20.4%
25.4%
19.2%
23.7%
10.4%
0.8%
0%
5%
10%
15%
20%
25%
30%
20-30 31-40 41-50 51-60 61-70 > 70
2012 2014
6 | P a g e
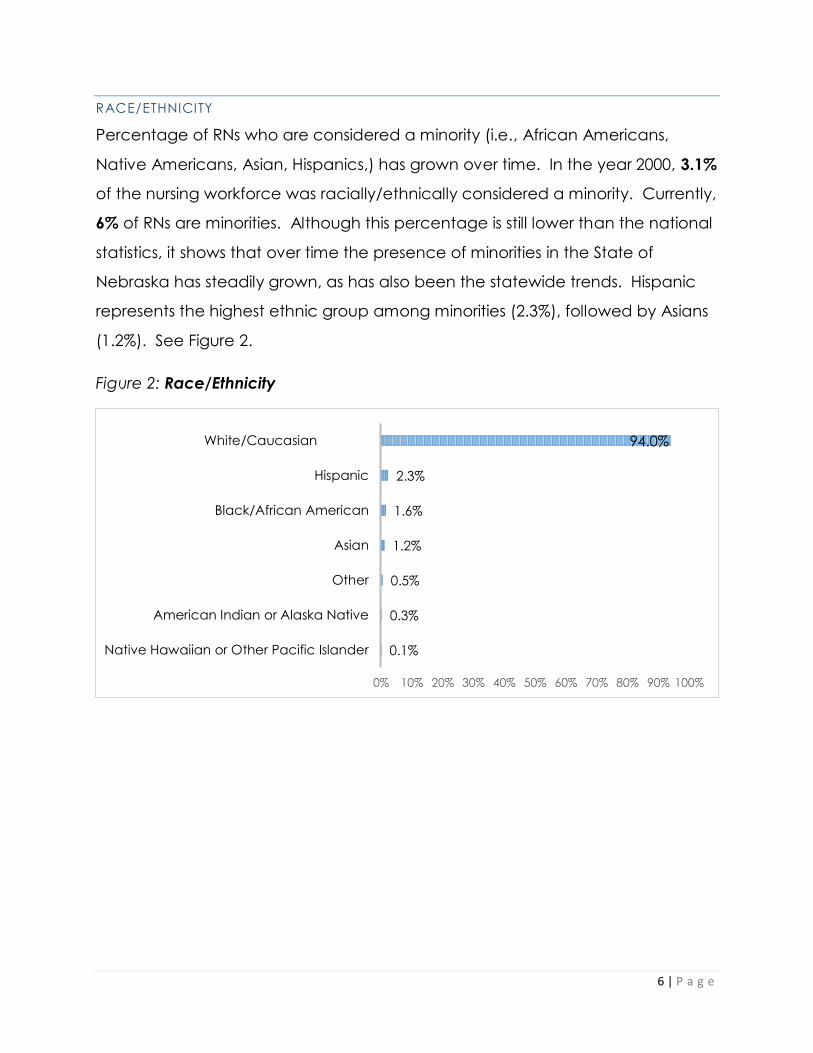
RACE/ETHNICITY
Percentage of RNs who are considered a minority (i.e., African Americans,
Native Americans, Asian, Hispanics,) has grown over time. In the year 2000, 3.1%
of the nursing workforce was racially/ethnically considered a minority. Currently,
6% of RNs are minorities. Although this percentage is still lower than the national
statistics, it shows that over time the presence of minorities in the State of
Nebraska has steadily grown, as has also been the statewide trends. Hispanic
represents the highest ethnic group among minorities (2.3%), followed by Asians
(1.2%). See Figure 2.
Figure 2: Race/Ethnicity
0.1%
0.3%
0.5%
1.2%
1.6%
2.3%
94.0%
0% 10% 20% 30% 40% 50% 60% 70% 80% 90% 100%
Native Hawaiian or Other Pacific Islander
American Indian or Alaska Native
Other
Asian
Black/African American
Hispanic
White/Caucasian

7 | P a g e
GENDER
The presence of men in the nursing
profession has also grown over time,
and again at a lower percentage
than the national trends, but the
trend has always been positive.
Currently, 6.0% of RNs are male.
Figure 3. Comparatively, in the year
2000 only 4.1% of the nursing
workforce were males.
EDUCATION
Educational levels among nurses have increased over the years, especially
those who hold a Baccalaureate degree. Doctoral degrees have also
increased among RNs. According to the 2014 RN Renewal Survey, there are 163
nurses (0.8%) with doctoral degrees (DNPs, EdDs, ad Ph.Ds.) working in the State
of Nebraska. In comparison, there were only 74 nurses with doctoral degrees in
the year 2003. Figure 4 shows the highest level of education held by RNs (2014).
Female
94.0%
Male
6.0%
13.7%
25.1%
49.9%
9.8% 0.8% 0.8%0%
10%
20%
30%
40%
50%
60%
Diploma Associate Baccalaureate Master Post-Master Doctorate
Figure 4: Highest Level of Education
Figure 3: Gender Distribution
8 | P a g e
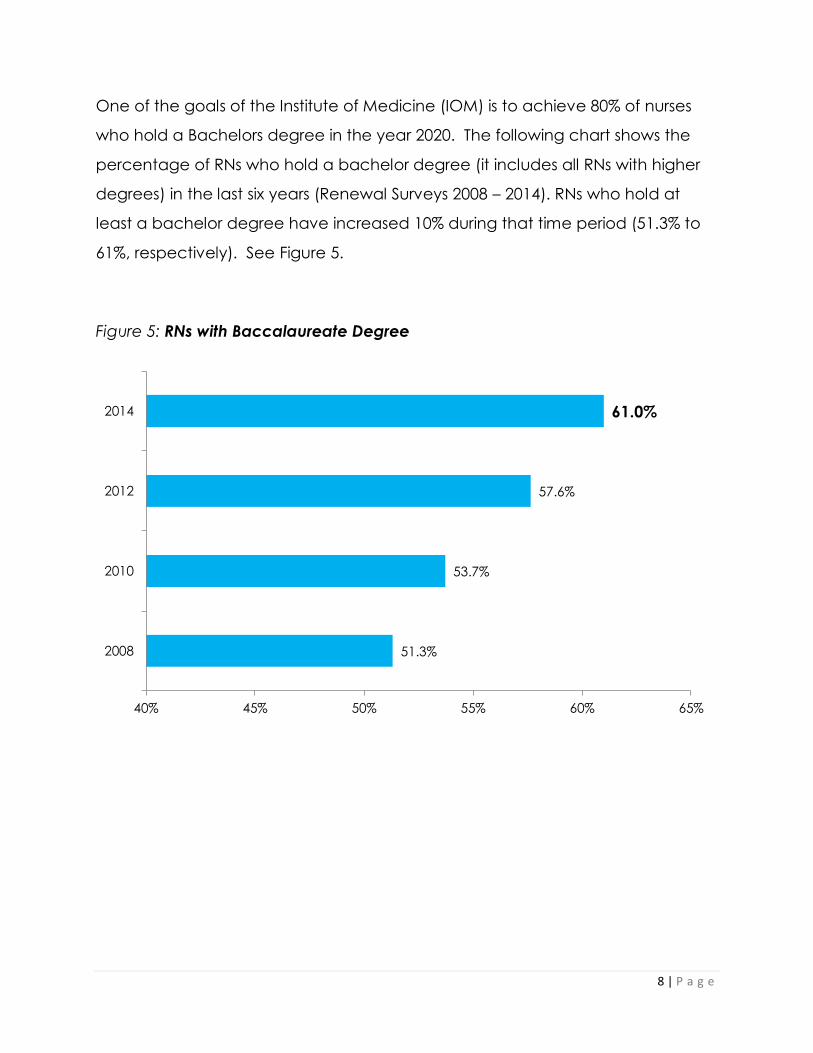
One of the goals of the Institute of Medicine (IOM) is to achieve 80% of nurses
who hold a Bachelors degree in the year 2020. The following chart shows the
percentage of RNs who hold a bachelor degree (it includes all RNs with higher
degrees) in the last six years (Renewal Surveys 2008 – 2014). RNs who hold at
least a bachelor degree have increased 10% during that time period (51.3% to
61%, respectively). See Figure 5.
Figure 5: RNs with Baccalaureate Degree
51.3%
53.7%
57.6%
61.0%
40% 45% 50% 55% 60% 65%
2008
2010
2012
2014
9 | P a g e
WORK ENVIRONMENT
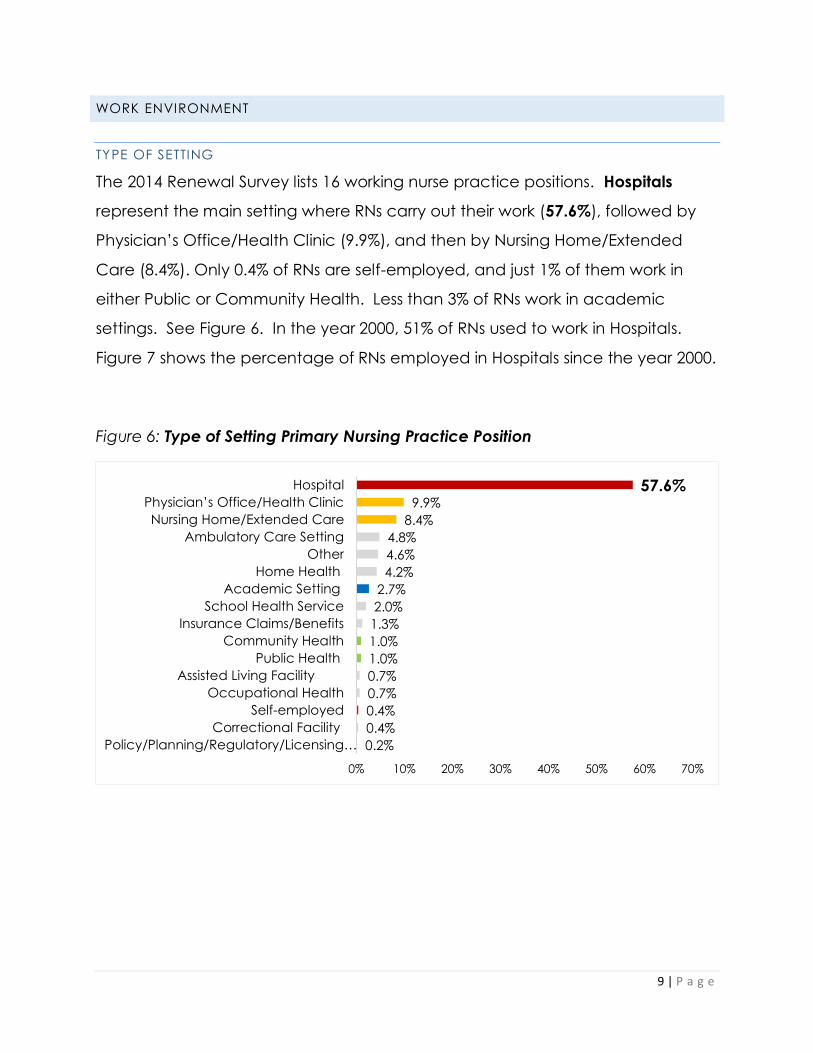
TYPE OF SETTING
The 2014 Renewal Survey lists 16 working nurse practice positions. Hospitals
represent the main setting where RNs carry out their work (57.6%), followed by
Physician’s Office/Health Clinic (9.9%), and then by Nursing Home/Extended
Care (8.4%). Only 0.4% of RNs are self-employed, and just 1% of them work in
either Public or Community Health. Less than 3% of RNs work in academic
settings. See Figure 6. In the year 2000, 51% of RNs used to work in Hospitals.
Figure 7 shows the percentage of RNs employed in Hospitals since the year 2000.
Figure 6: Type of Setting Primary Nursing Practice Position
0.2%
0.4%
0.4%
0.7%
0.7%
1.0%
1.0%
1.3%
2.0%
2.7%
4.2%
4.6%
4.8%
8.4%
9.9%
57.6%
0% 10% 20% 30% 40% 50% 60% 70%
Policy/Planning/Regulatory/Licensing…
Correctional Facility
Self-employed
Occupational Health
Assisted Living Facility
Public Health
Community Health
Insurance Claims/Benefits
School Health Service
Academic Setting
Home Health
Other
Ambulatory Care Setting
Nursing Home/Extended Care
Physician’s Office/Health Clinic
Hospital

10 | P a g e
Figure 7: Hospital: Percent of Employment (2000 – 2014)
Nearly two-thirds of RNs work as “Staff Nurse” (68.1%), followed by “Nurse
Manager” (12.3%), and then by Other-Health Related” position (6.8%). See
Figure 8. Nearly four out of ten RNs who hold positions as a Nurse Manager work
in Hospitals (39.3%).
51.0%
53.0%
57.4%55.6%
58.0% 57.9%
56.6%57.6%
46%
48%
50%
52%
54%
56%
58%
60%
2000 2002 2004 2006 2008 2010 2012 2014
0.2%
0.7%
1.3%
2.0%
2.7%
5.7%
6.8%
12.3%
68.1%
0% 10% 20% 30% 40% 50% 60% 70% 80%
Other-Not Health Related
Nurse Researcher
Consultant
Nurse Executive
Nurse Faculty
Advanced Practice Nurse
Other-Health Related
Nurse Manager
Staff Nurse
Figure 8: RN Position Title

11 | P a g e
EMPLOYMENT
The majority of RNs work for one employer (85.9%), and just two percent work for
three or more employers. Figure 9. Those who work for one employer, 45% are
full-time employees (work over 40 hours/week). Those who work for three or
more employers, 62% of nurses are full-time employees, and the majority (52%)
work in Hospitals, followed by 9%, who work in Nursing Home/Extended Care.
Overall, nearly five out of ten RNs work 40 hours a week or more, and nearly two
out of ten RNs work less than or equal to 20 hours a week. See Figure 10. Just 7%
of RNs work 50 hours or more per week, although this still represents a staggering
number of 1,374 RNs. Eight percent of them work in academic settings, which is
quite relevant considering that this activity only represents 2.7% of all RNs’
professional settings, as shown in Figure 6 (page 12).
85.9%
12.1%2.0%
1 2 3 or more
Figure 9: Number of Positions Currently Employed as a Nurse

12 | P a g e
Figure 10: Hours worked per week
ADVANCE PRACTICE ROLE
According to the 2014 RN
Renewal Survey, there are
1,383 RNs working in
Nebraska licensed with an
advanced practice role.
Nearly seven out of ten RNs
who hold an advance
practice role are Nurse
Practitioners (72%), followed
by Nurse Anesthetist (19%),
Clinical Nurse Specialist (7%), and then by Nurse Midwife (2%). See Figure 11.
3%
4%
11%
35%
41%
7%
0% 5% 10% 15% 20% 25% 30% 35% 40% 45%
10 hours or less
More than 10 hours but less than 20…
At least 20 hours but less than 30…
At least 30 hours but less than 40…
At least 40 hours but less than 50…
50 hours or more
Nurse Midwife
(APRN-CNM)
2%
Clinical Nurse
Specialist (APRN-
CNS)
7%
Nurse
Anesthetist
(APRN-
CRNA)
19%Nurse
Practitioner
(APRN-NP)
72%
Figure 11: RNs Advanced Practice Role

13 | P a g e
SATISFACTION LEVELS WITH EMPLOYMENT
One-fourth of RNs indicated that what they like the most about their job is to
provide services to patients (27%), followed by Work itself (24%), and then by the
People with whom they work (co-workers) (20%). See Figure 12.
Figure 12: What do you like MOST about your principal nursing employment?
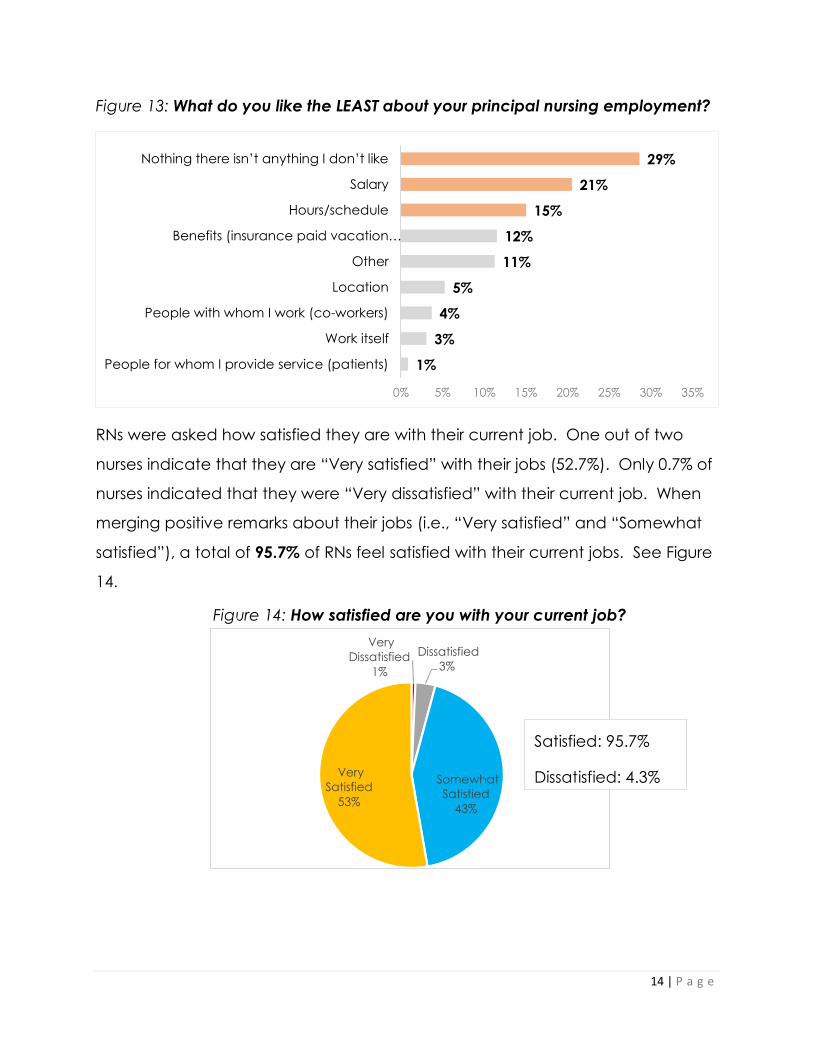
When RNs were asked about what they like the least, nearly three out of ten
indicated that there is nothing they do not like (29%), followed by Salary (21%),
and then by Hours/schedule (15%). See Figure 13.
1%
3%
3%
5%
16%
20%
24%
27%
0% 5% 10% 15% 20% 25% 30%
Other
Salary
Location
Benefits (insurance paid vacation…
Hours/schedule
People with whom I work (co-workers)
Work itself
People for whom I provide service (patients)
14 | P a g e
Figure 13: What do you like the LEAST about your principal nursing employment?
RNs were asked how satisfied they are with their current job. One out of two
nurses indicate that they are “Very satisfied” with their jobs (52.7%). Only 0.7% of
nurses indicated that they were “Very dissatisfied” with their current job. When
merging positive remarks about their jobs (i.e., “Very satisfied” and “Somewhat
satisfied”), a total of 95.7% of RNs feel satisfied with their current jobs. See Figure
14.
1%
3%
4%
5%
11%
12%
15%
21%
29%
0% 5% 10% 15% 20% 25% 30% 35%
People for whom I provide service (patients)
Work itself
People with whom I work (co-workers)
Location
Other
Benefits (insurance paid vacation…
Hours/schedule
Salary
Nothing there isn’t anything I don’t like
Figure 14: How satisfied are you with your current job?
Very
Dissatisfied
1%
Dissatisfied
3%
Somewhat
Satisfied
43%
Very
Satisfied
53%
Satisfied: 95.7%
Dissatisfied: 4.3%

15 | P a g e
RNs were also asked how satisfied they are with nursing as a career. Nearly two-
thirds of RNs answered that they were “Very satisfied” (65.4%), followed by
“Somewhat satisfied” (31.7%). Overall, 2.9% of RNs answered that they were not
satisfied with their career. See Figure 15.
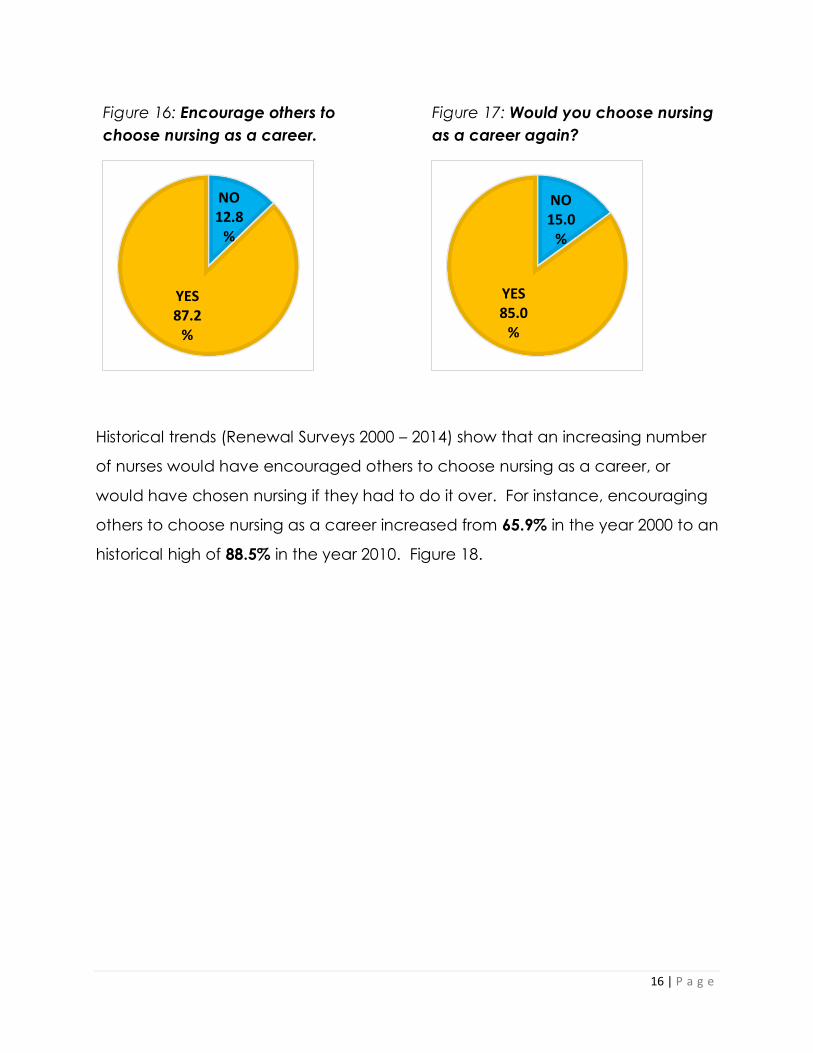
A high proportion of RNs indicate that they would encourage others to choose
nursing as a career (87.2%), and 85% of RNs would do it over if they had the
opportunity to choose nursing as a career again. When comparing with
previous renewal surveys, these percentages are quite consistent, even when
facing difficult workforce challenges such as nursing shortages. See Figures 16
and 17.
Somewhat
Satisfied
31.7%
Very
Satisfied
65.4%
Dissatisfied
2.4%Very Dissatisfied
0.5%
Satisfied: 97.1%
Dissatisfied: 2.9%
Figure 15: How satisfied are you with nursing as a career?
16 | P a g e
Figure 16: Encourage others to
choose nursing as a career.
Figure 17: Would you choose nursing
as a career again?
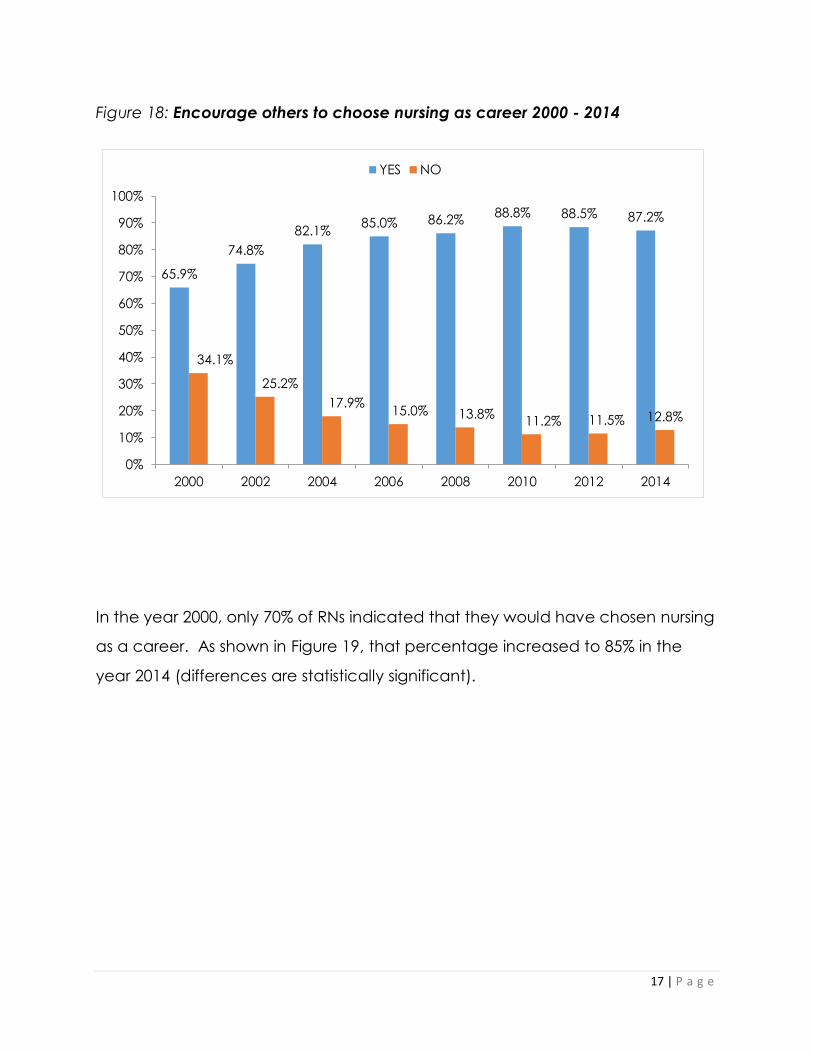
Historical trends (Renewal Surveys 2000 – 2014) show that an increasing number
of nurses would have encouraged others to choose nursing as a career, or
would have chosen nursing if they had to do it over. For instance, encouraging
others to choose nursing as a career increased from 65.9% in the year 2000 to an
historical high of 88.5% in the year 2010. Figure 18.
NO12.8
%
YES87.2
%
NO15.0
%
YES85.0
%
17 | P a g e
In the year 2000, only 70% of RNs indicated that they would have chosen nursing
as a career. As shown in Figure 19, that percentage increased to 85% in the
year 2014 (differences are statistically significant).
65.9%
74.8%
82.1%85.0% 86.2%
88.8% 88.5% 87.2%
34.1%
25.2%
17.9%15.0% 13.8%
11.2% 11.5% 12.8%
0%
10%
20%
30%
40%
50%
60%
70%
80%
90%
100%
2000 2002 2004 2006 2008 2010 2012 2014
YES NO
Figure 18: Encourage others to choose nursing as career 2000 - 2014

18 | P a g e
Figure 19: Would you chose nursing as a career again 2000 - 2014
70.7%74.4%
81.2% 81.0% 82.7%86.1% 86.1% 85.0%
29.3%25.6%
18.8% 19.0% 17.3%13.9% 13.9% 15.0%
0%
10%
20%
30%
40%
50%
60%
70%
80%
90%
100%
2000 2002 2004 2006 2008 2010 2012 2014
YES NO
19 | P a g e
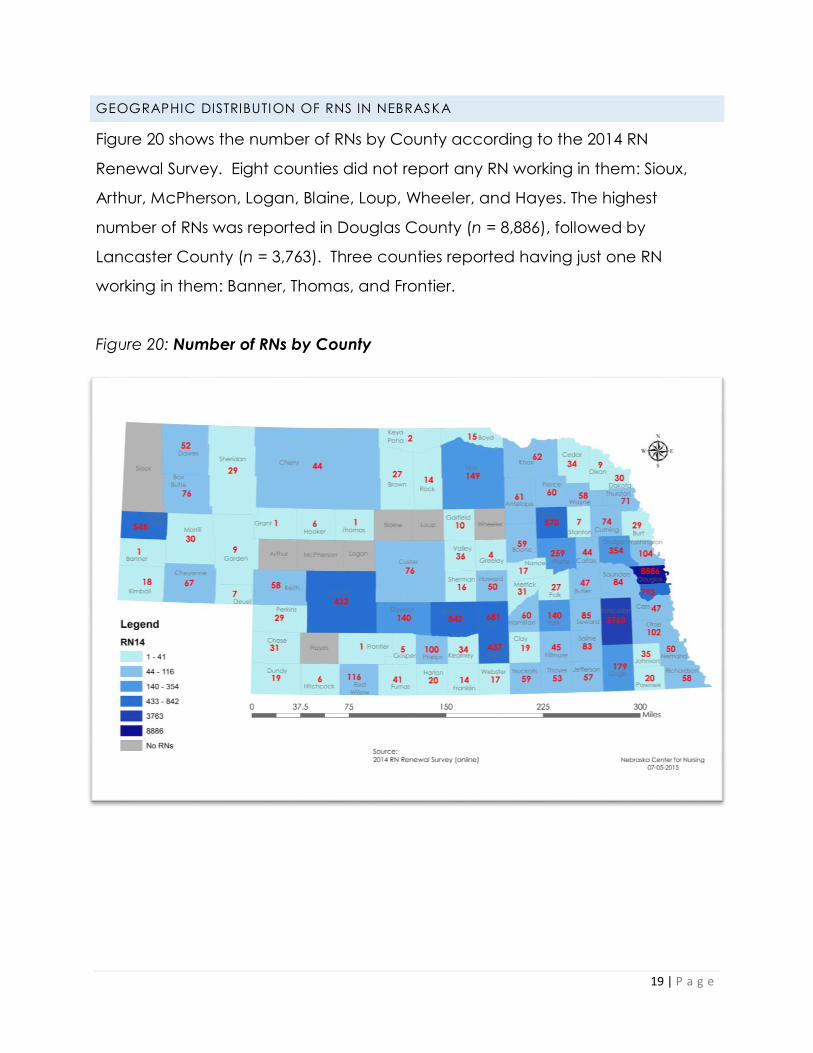
GEOGRAPHIC DISTRIBUTION OF RNS IN NEBRASKA
Figure 20 shows the number of RNs by County according to the 2014 RN
Renewal Survey. Eight counties did not report any RN working in them: Sioux,
Arthur, McPherson, Logan, Blaine, Loup, Wheeler, and Hayes. The highest
number of RNs was reported in Douglas County (n = 8,886), followed by
Lancaster County (n = 3,763). Three counties reported having just one RN
working in them: Banner, Thomas, and Frontier.
Figure 20: Number of RNs by County

20 | P a g e
Figure 21 shows the number of RNs per 1,000 people by county. Buffalo County
shows the highest number of RNs per 1,000 people (18 RNs per 1,000), followed
by Douglas County (16.9 RNs per 1,000), and then by Madison County (16.3 RNs
per 1,000). Frontier County shows the lowest number of RNs per 1,000 people
(0.4 RNs per 1,000), followed by Stanton (1.1 RNs per 1,000), and then by Banner
County (1.2 RNs per 1,000).
Figure 21: RNs per 1,000 People by County

21 | P a g e
APPENDIX
LOCATION OF THE BASIC NURSING EDUCATION PROGRAM THAT PREPARED FOR RN
LICENSING EXAMINATION
81%

22 | P a g e
EMPLOYMENT SPECIALTY THAT MOST CLOSELY CORRESPONDS TO YOUR PRIMARY
NURSING PRACTICE POSITION
20%

23 | P a g e
RN 2014 WORKFORCE RENEWAL SURVEY
1. License Number______________
2. What is your race?
2.a. Hispanic origin or descent?
___Yes ___No ___White/Caucasian ___Native Hawaiian or Other
Pacific Islander ___Black/African American ___American Indian or Alaska
Native ___Asian ___Other____________________
2.b. If you speak another language other than English, please indicate. ___Spanish ____German ___French
2.c. Are you fluent in sign language?
___Yes ___No
3. Where was the location of the basic nursing education program that prepared you to take the RN licensing examination?
4. Which nursing education programs have you completed? (Mark all that apply)
___Nebraska ___Other State or US territory
___Foreign country
___Practical Nursing Program
Diploma
___RN Diploma Program
___ Associate Degree Program
___Baccalaureate Program
___Master’s Program
___Post-Master’s Program
___Doctoral Program
5. Are you currently enrolled in a nursing education program leading to a degree/certificate?
6. Are you currently licensed in Nebraska in an advanced practice role? (Mark all that apply)
____Nurse Practitioner (APRN-NP)
____Nurse Anesthetist (APRN-CRNA)
____Nurse Midwife (APRN-CNM)
____Clinical Nurse Specialist (APRN-CNS)
____Not licensed in an advanced practice role
___Not currently enrolled
___Baccalaureate Degree
___Baccalaureate degree-other
field
___Master’s Degree Program
___Master's degree-other field
___Post Master’s Program ___Doctoral Program ___Other (please specify): _______________________
7. Which non-nursing degree(s) have you completed? (Mark all that apply). ____Associate Degree
____Baccalaureate Degree
____Master’s Degree
____Doctorate
____Do not have a non-
nursing degree
8. Which of the following best describes your current primary work situation? (Select one).
___Actively employed in nursing:
___Full-time
___Part-time
___Per diem
___Working in nursing only as a volunteer
___Actively employed in a field other than nursing:
___Full-time
___Part-time
___Per diem
___Unemployed:
___Seeking work as a
nurse
___Not seeking work as a
nurse
___Retired
9. If unemployed, please indicate the reasons:
___Taking care of home and
family
___Inadequate Salary
___Difficulty in finding a nursing
position
___Disabled
___School
___Other, please specify
_______________________
24 | P a g e
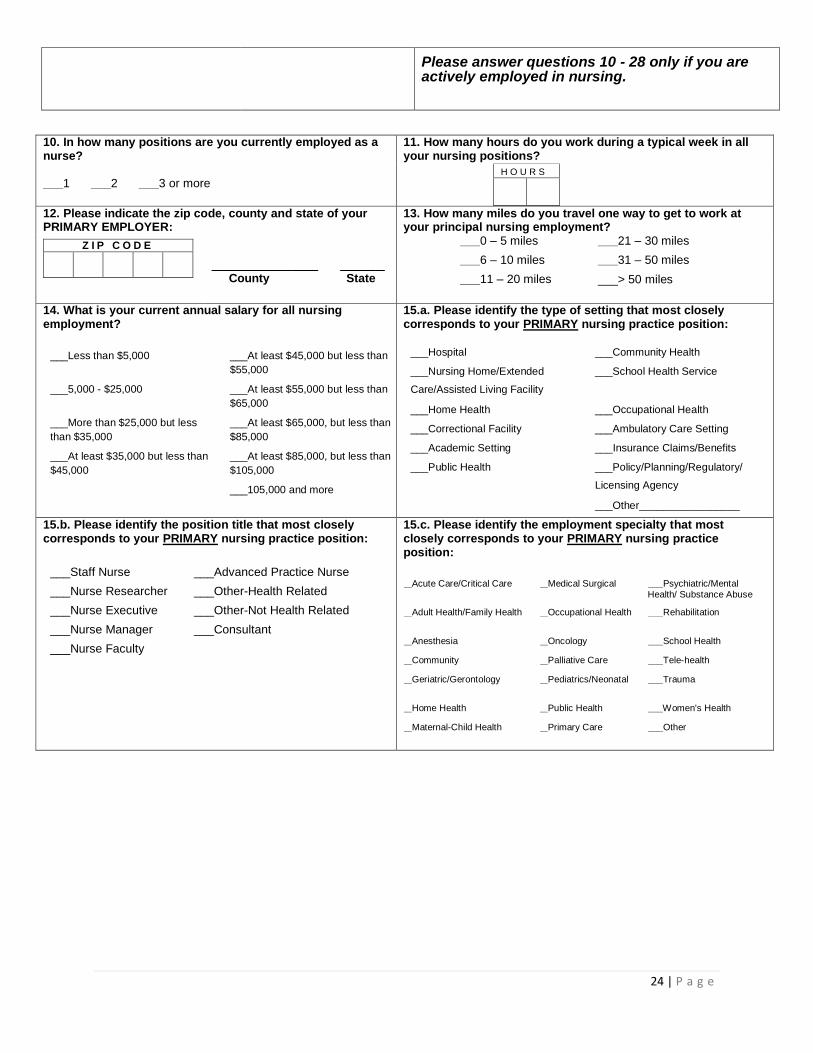
10. In how many positions are you currently employed as a nurse?
___1 ___2 ___3 or more
11. How many hours do you work during a typical week in all your nursing positions?
H O U R S
12. Please indicate the zip code, county and state of your PRIMARY EMPLOYER:
13. How many miles do you travel one way to get to work at your principal nursing employment?
___0 – 5 miles ___21 – 30 miles
___6 – 10 miles ___31 – 50 miles
___11 – 20 miles ___> 50 miles
Z I P C O D E
____________ _____ County State
14. What is your current annual salary for all nursing employment?
___Less than $5,000 ___At least $45,000 but less than
$55,000
___5,000 - $25,000 ___At least $55,000 but less than
$65,000
___More than $25,000 but less
than $35,000
___At least $65,000, but less than
$85,000
___At least $35,000 but less than
$45,000
___At least $85,000, but less than
$105,000
___105,000 and more
15.a. Please identify the type of setting that most closely corresponds to your PRIMARY nursing practice position:
___Hospital ___Community Health
___Nursing Home/Extended
Care/Assisted Living Facility
___School Health Service
___Home Health ___Occupational Health
___Correctional Facility ___Ambulatory Care Setting
___Academic Setting ___Insurance Claims/Benefits
___Public Health ___Policy/Planning/Regulatory/
Licensing Agency
___Other_________________
__
15.b. Please identify the position title that most closely corresponds to your PRIMARY nursing practice position:
___Staff Nurse ___Advanced Practice Nurse
___Nurse Researcher ___Other-Health Related
___Nurse Executive ___Other-Not Health Related
___Nurse Manager ___Consultant
___Nurse Faculty
15.c. Please identify the employment specialty that most closely corresponds to your PRIMARY nursing practice position:
___Acute Care/Critical Care ___Medical Surgical
___Psychiatric/Mental Health/ Substance Abuse
___Adult Health/Family Health ___Occupational Health
___Rehabilitation
___Anesthesia ___Oncology
___School Health
___Community ___Palliative Care
___Tele-health
___Geriatric/Gerontology ___Pediatrics/Neonatal ___Trauma
___Home Health ___Public Health
___Women's Health
___Maternal-Child Health ___Primary Care
___Other
Please answer questions 10 - 28 only if you are actively employed in nursing.

25 | P a g e
16.a. Please identify the type of setting that most closely corresponds to your SECONDARY nursing practice position:
___Hospital ___Community Health
___Nursing Home/Extended
Care/Assisted Living Facility
___School Health Service
___Home Health ___Occupational Health
___Correctional Facility ___Ambulatory Care Setting
___Academic Setting ___Insurance Claims/Benefits
___Public Health ___Policy/Planning/Regulatory/
Licensing Agency
___Other_________________
_
16.b. Please identify the position title that most closely corresponds to your SECONDARY nursing practice position:
___Staff Nurse ___Advanced Practice Nurse
___Nurse Researcher ___Other-Health Related
___Nurse Executive ___Other-Not Health Related
___Nurse Manager ___Consultant
___Nurse Faculty
16.c. Please identify the employment specialty that most closely corresponds to your SECONDARY nursing practice position:
___Acute Care/Critical Care
___Medical Surgical
___Psychiatric/Mental Health/ Substance Abuse
___Adult Health/Family Health
___Occupational Health
___Rehabilitation
___Anesthesia ___Oncology
___School Health
___Community ___Palliative Care
___Tele-health
___Geriatric/Gerontology ___Pediatrics/Neonatal
___Trauma
___Home Health ___Public Health
___Women's Health
___Maternal-Child Health ___Primary Care
___Other
Questions #17 through #24 ask about your satisfaction level with your nursing career
17. What do you like MOST about your principal nursing employment? (Select one)
___Benefits (insurance, paid
vacation, retirement, etc.)
___Hours/schedule
___Location ___People for whom I provide service (patients)
___People with whom I work (co-workers)
___Salary
___Work itself ___Other__________________________________________
18. What do you like LEAST about your principal nursing employment? (Select one)
___Benefits (insurance,
paid vacation, retirement, etc.)
___Hours/schedule
___Location ___People for whom I provide
service (patients)
___People with whom I
work (co-workers) ___Salary
___Work itself ___Nothing, there isn’t anything I
don’t like
___Other

26 | P a g e
19. How likely are you to leave your principal employment in the next 12 months?
___ Very unlikely
___ Somewhat unlikely
___ Somewhat likely
___ Very likely
20. If very likely or somewhat likely that you will leave your principal employment in the next 12 months, what is the main reason? (Select one)
___Dissatisfaction with job ___Retirement
___Dissatisfaction with salary ___Returning to school
___Family/personal ___Other______________
___Lack of opportunity for
upward mobility in the organization
___Does not apply to me
21. How satisfied are you with your current job?
___ Very
Satisfied
___ Somewhat
Satisfied
___ Dissatisfied ___ Very
Dissatisfied
22. If you had to do it over, would you choose nursing as a career? ___Yes ___No
23. Would you encourage others to choose nursing as a career? ___Yes ___No
24. How satisfied are you with nursing as a career?
___ Very
Satisfied
___ Somewhat
Satisfied
___ Dissatisfied ___ Very
Dissatisfied
25. Please list all states in which you hold an active license to practice as an RN:
______ ______ ______ ______ ______ ______
26. Please list all states in which you are currently practicing:
______ ______ ______ ______ ______ ______
27. Do you utilize tele-health in your primary or secondary positions?
___Yes ___No ___Unsure
28. If yes, when utilizing tele-health, are patients ever located in a different state?
___Yes ___No ___Unsure
PLEASE ADD YOUR LICENSE NUMBER ON PAGE 1
THANK YOU FOR COMPLETING THE SURVEY!