Embed Size (px)
Citation preview

Green JobsGreen JobsGreen Jobs
Green Jobs
Green Jobs
Green Jobs
Green Jobs
Green JobsGreen Jobs
Green Jobs
Green Jobs
Green Jobs
Green Jobs
Green Jobs
Green JobsGreen Jobs
Green Jobs
Green Jobs
Green Jobs
Green JobsGreen JobsGreen Jobs
Nebraska
Green JobsD EPARTMENT OF L ABOR
Green JobsReport
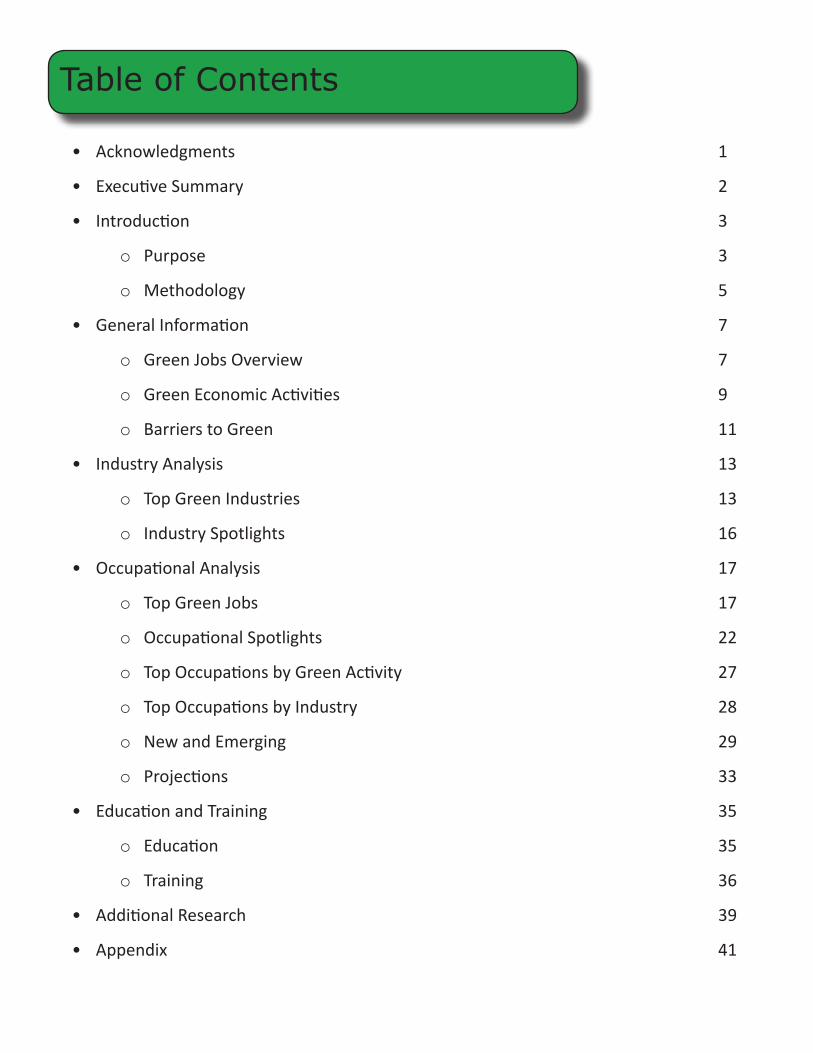
Table of Contents
• Acknowledgments 1
• ExecutiveSummary 2
• Introduction 3
oPurpose 3
oMethodology 5
• GeneralInformation 7
oGreenJobsOverview 7
oGreenEconomicActivities 9
oBarrierstoGreen 11
• IndustryAnalysis 13
oTopGreenIndustries 13
o IndustrySpotlights 16
• OccupationalAnalysis 17
oTopGreenJobs 17
oOccupationalSpotlights 22
oTopOccupationsbyGreenActivity 27
oTopOccupationsbyIndustry 28
oNewandEmerging 29
oProjections 33
• EducationandTraining 35
oEducation 35
oTraining 36
• AdditionalResearch 39
• Appendix 41
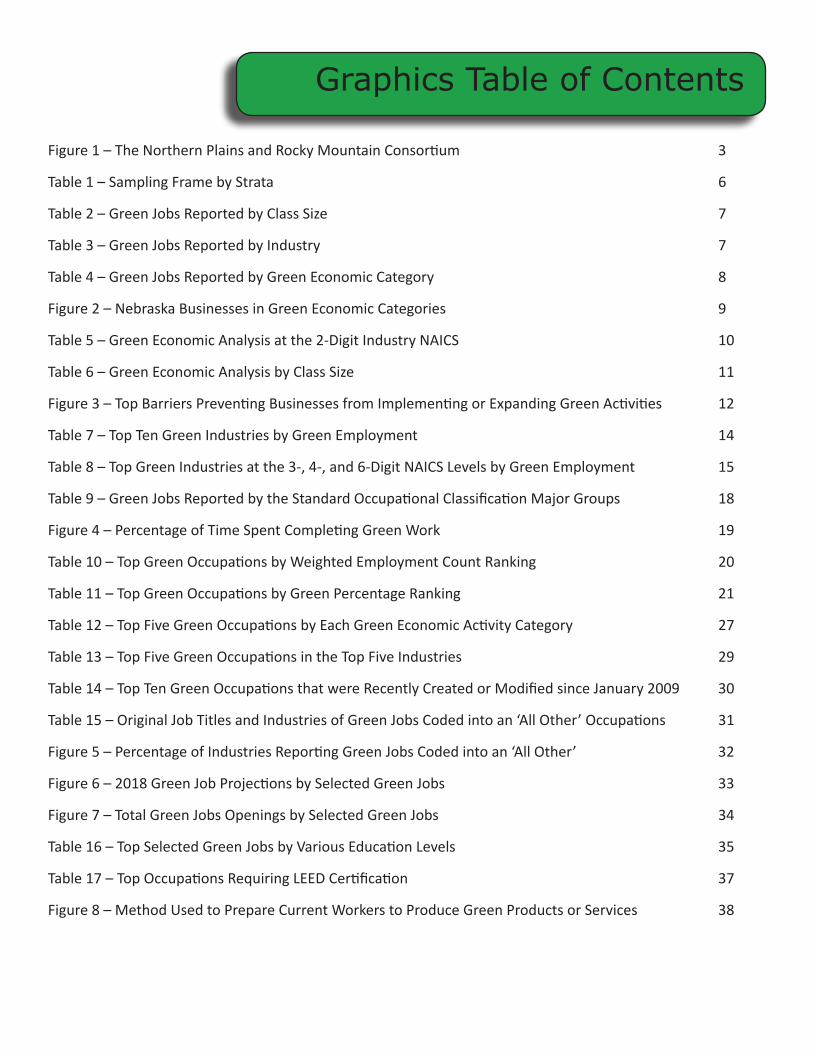
Graphics Table of Contents
Figure1–TheNorthernPlainsandRockyMountainConsortium 3
Table1–SamplingFramebyStrata 6
Table2–GreenJobsReportedbyClassSize 7
Table3–GreenJobsReportedbyIndustry 7
Table4–GreenJobsReportedbyGreenEconomicCategory 8
Figure2–NebraskaBusinessesinGreenEconomicCategories 9
Table5–GreenEconomicAnalysisatthe2-DigitIndustryNAICS 10
Table6–GreenEconomicAnalysisbyClassSize 11
Figure3–TopBarriersPreventingBusinessesfromImplementingorExpandingGreenActivities 12
Table7–TopTenGreenIndustriesbyGreenEmployment 14
Table8–TopGreenIndustriesatthe3-,4-,and6-DigitNAICSLevelsbyGreenEmployment 15
Table9–GreenJobsReportedbytheStandardOccupationalClassificationMajorGroups 18
Figure4–PercentageofTimeSpentCompletingGreenWork 19
Table10–TopGreenOccupationsbyWeightedEmploymentCountRanking 20
Table11–TopGreenOccupationsbyGreenPercentageRanking 21
Table12–TopFiveGreenOccupationsbyEachGreenEconomicActivityCategory 27
Table13–TopFiveGreenOccupationsintheTopFiveIndustries 29
Table14–TopTenGreenOccupationsthatwereRecentlyCreatedorModifiedsinceJanuary2009 30
Table15–OriginalJobTitlesandIndustriesofGreenJobsCodedintoan‘AllOther’Occupations 31
Figure5–PercentageofIndustriesReportingGreenJobsCodedintoan‘AllOther’ 32
Figure6–2018GreenJobProjectionsbySelectedGreenJobs 33
Figure7–TotalGreenJobsOpeningsbySelectedGreenJobs 34
Table16–TopSelectedGreenJobsbyVariousEducationLevels 35
Table17–TopOccupationsRequiringLEEDCertification 37
Figure8–MethodUsedtoPrepareCurrentWorkerstoProduceGreenProductsorServices 38
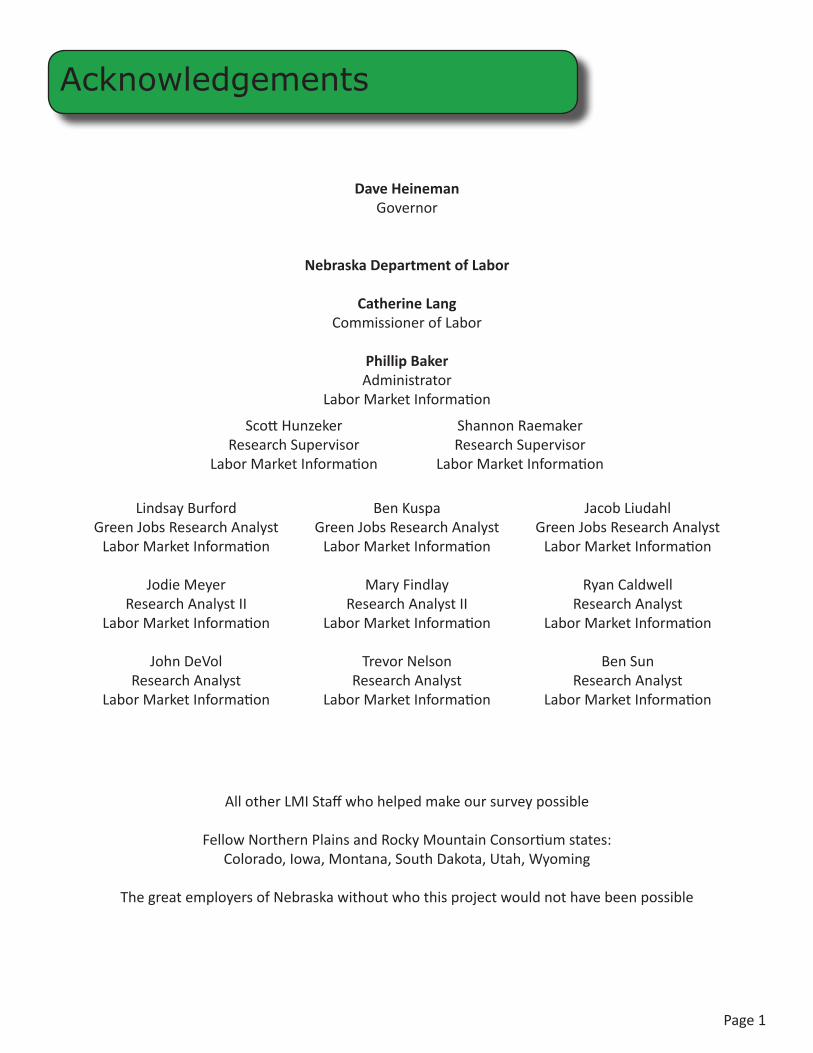
Acknowledgements
Page1
Dave HeinemanGovernor
Nebraska Department of Labor
Catherine LangCommissionerofLabor
Phillip BakerAdministrator
LaborMarketInformation
AllotherLMIStaffwhohelpedmakeoursurveypossible
FellowNorthernPlainsandRockyMountainConsortiumstates:Colorado,Iowa,Montana,SouthDakota,Utah,Wyoming
ThegreatemployersofNebraskawithoutwhothisprojectwouldnothavebeenpossible
LindsayBurfordGreenJobsResearchAnalystLaborMarketInformation
JodieMeyerResearchAnalystII
LaborMarketInformation
JohnDeVolResearchAnalyst
LaborMarketInformation
JacobLiudahlGreenJobsResearchAnalystLaborMarketInformation
RyanCaldwellResearchAnalyst
LaborMarketInformation
BenSunResearchAnalyst
LaborMarketInformation
BenKuspaGreenJobsResearchAnalystLaborMarketInformation
MaryFindlayResearchAnalystII
LaborMarketInformation
TrevorNelsonResearchAnalyst
LaborMarketInformation
ScottHunzekerResearchSupervisor
LaborMarketInformation
ShannonRaemakerResearchSupervisor
LaborMarketInformation
Executive Summary
NebraskacollaboratedwithseveralotherstatestoformtheNorthernPlainsandRockyMountainConsortium.ThesestatesincludedIowa,Montana,SouthDakota,Utah,andWyoming.Collectively,almost64,000businessesweresurveyedtodeterminethefrequencyofgreenjobswithintheconsortiumstates.Nebraska’sefforts,alongwiththeotherconsortiumstates,representafirst-timecollaborationtoseekvaluableinformationaboutgreeneffortsfromaworkforcestandpoint.
ThepurposeoftheGreenJobsSurveywastolearnaboutbusinesses’greeneconomiccategoriesandhowoccupationsareevolvingorbeingcreatedtoembraceanewareawithintheworkforce.Specificinformationrelatedtogreenjobsincludedjobtitles,educationlevels,greencertifications,andothertrainingneeded.TheConsortiumdefinedagreenjobas“one in which an employee produces a product or service that improves energy efficiency, expands the use of renewable energy, or supports environmental sustainability.”
Nebraskasampled11,917businessesthroughouttheentirestate.Thesamplewasstratifiedaccordingtoindustryandthenumberofemployeeswithinthebusiness.Over6,000businessesresponded,foranoverallresponserateof52.8%.
Key Survey FindingsTheNebraska2010GreenJobsReportdisclosesamultitudeoffindingsasitrelatestobusinesses’greeneconomiccategoriesandgreenjobswithinthestate.Belowaresomeofthehighlightsoftheseresults:
• Duringthesecondquarter2010,therewereanestimated30,725greenjobsthroughoutNebraska,or3.4%ofNebraska’sworkforce.Greenemployeesarefoundinapproximately13%ofbusinesses.
• Therewere26.6%ofNebraskabusinessesthatreportedgreeneconomicactivitywithintheirbusiness.Ofthesebusinesseshavingaprimarygreeneconomiccategory,36.1%identifiedthemselvesundertheEnergyEfficiencyandConservationcategory.
• TheindustrywiththelargestgreenemploymentwasConstructionwith6,595greenemployees;15.1%ofConstruction’stotalemploymentwasgreen.TheWholesaleTradeindustryemployed4,115greenemployees,or10.2%ofitstotalemployment.
• TheProductionOccupationshadthelargestgreenemploymentnumberswith6,565greenemployees,where21.3%ofitstotalemploymentwasconstruedasgreenemployment.
• Heating,AirConditioning,andRefrigerationMechanicsandInstallershadthelargestgreenemploymentwhere1,656individualsinthisoccupationwerereportedashavingagreenjob.Othertopoccupationsbygreenemploymentinclude:Electricians;HeavyandTractor-TrailerTruckDrivers;IndustrialTruckandTractorDrivers;andFirst-LineSupervisorsofProductionandOperatingWorkers.
• Topgreenoccupationsbygreenpercentageinclude:HazardousMaterialsRemovalWorkers;EnvironmentalSci-enceandProtectionTechnicians,IncludingHealth;ForestandConservationTechnicians;TransportationWorkers,AllOther;andProductionWorkers,AllOther.
Page2
Introduction
Page3
Purpose
“Goinggreen”istransformingdailylifeatthelocal,nationalandgloballevels.Forenvironmentalprotection,nationalsecurity,jobcreationandotherreasons,theworldisevolvingwithinandtowardagreenereconomy.Withthegrowthofgreentechnologiesandindustriescomesaneedforaskilledandknowledgeableworkforce.Unfortunately,federalandstateagencieshavenothadanopportunitytoidentifyhowoccupationshaveevolvedtoincludegreentasksortrackthesegrowingandemergingmarkets.Thislackofinformationongreenindustriesandoccupationsmeansthatworkforcedevelopmentboardsandtrainingprogramsmaynotbeabletofocusonprovidingtheskillsandtrainingneededforthegreenworkforce.
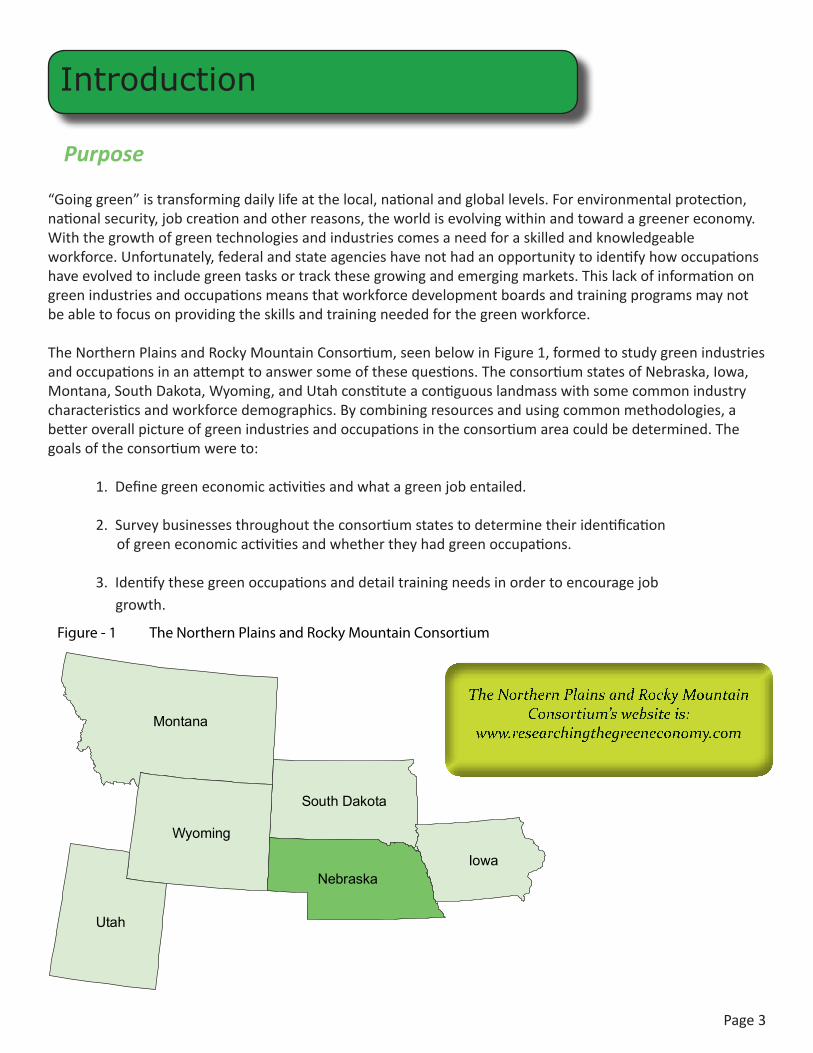
TheNorthernPlainsandRockyMountainConsortium,seenbelowinFigure1,formedtostudygreenindustriesandoccupationsinanattempttoanswersomeofthesequestions.TheconsortiumstatesofNebraska,Iowa,Montana,SouthDakota,Wyoming,andUtahconstituteacontiguouslandmasswithsomecommonindustrycharacteristicsandworkforcedemographics.Bycombiningresourcesandusingcommonmethodologies,abetteroverallpictureofgreenindustriesandoccupationsintheconsortiumareacouldbedetermined.Thegoalsoftheconsortiumwereto:
1.Definegreeneconomicactivitiesandwhatagreenjobentailed.
2.Surveybusinessesthroughouttheconsortiumstatestodeterminetheiridentification ofgreeneconomicactivitiesandwhethertheyhadgreenoccupations.
3.Identifythesegreenoccupationsanddetailtrainingneedsinordertoencouragejob growth.
Utah
Montana
Iowa
Wyoming
Nebraska
South Dakota
Figure - 1 The Northern Plains and Rocky Mountain Consortium
Page4
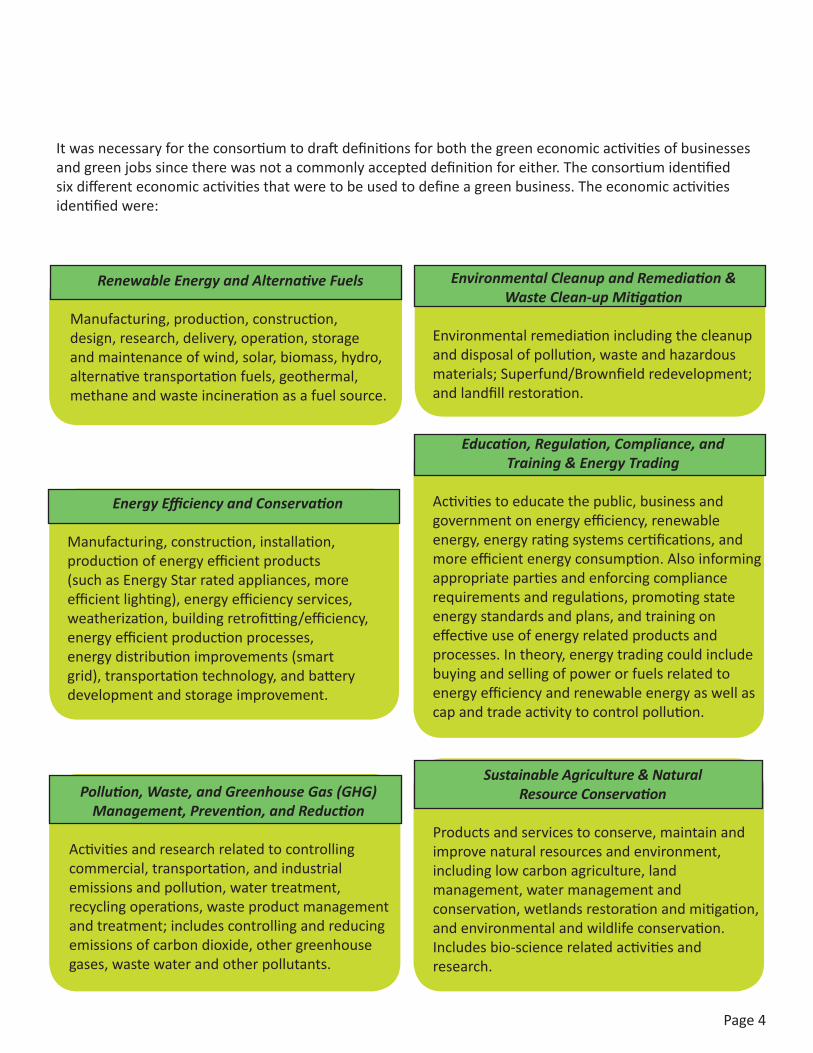
Itwasnecessaryfortheconsortiumtodraftdefinitionsforboththegreeneconomicactivitiesofbusinessesandgreenjobssincetherewasnotacommonlyaccepteddefinitionforeither.Theconsortiumidentifiedsixdifferenteconomicactivitiesthatweretobeusedtodefineagreenbusiness.Theeconomicactivitiesidentifiedwere:
Energy Efficiency and Conservation
Manufacturing,construction,installation,productionofenergyefficientproducts(suchasEnergyStarratedappliances,moreefficientlighting),energyefficiencyservices,weatherization,buildingretrofitting/efficiency,energyefficientproductionprocesses,energydistributionimprovements(smartgrid),transportationtechnology,andbatterydevelopmentandstorageimprovement.
Environmental Cleanup and Remediation & Waste Clean-up Mitigation
Environmentalremediationincludingthecleanupanddisposalofpollution,wasteandhazardousmaterials;Superfund/Brownfieldredevelopment;andlandfillrestoration.
Education, Regulation, Compliance, and Training & Energy Trading
Activitiestoeducatethepublic,businessandgovernmentonenergyefficiency,renewableenergy,energyratingsystemscertifications,andmoreefficientenergyconsumption.Alsoinformingappropriatepartiesandenforcingcompliancerequirementsandregulations,promotingstateenergystandardsandplans,andtrainingoneffectiveuseofenergyrelatedproductsandprocesses.Intheory,energytradingcouldincludebuyingandsellingofpowerorfuelsrelatedtoenergyefficiencyandrenewableenergyaswellascapandtradeactivitytocontrolpollution.
Pollution, Waste, and Greenhouse Gas (GHG) Management, Prevention, and Reduction
Activitiesandresearchrelatedtocontrollingcommercial,transportation,andindustrialemissionsandpollution,watertreatment,recyclingoperations,wasteproductmanagementandtreatment;includescontrollingandreducingemissionsofcarbondioxide,othergreenhousegases,wastewaterandotherpollutants.
Sustainable Agriculture & Natural Resource Conservation
Productsandservicestoconserve,maintainandimprovenaturalresourcesandenvironment,includinglowcarbonagriculture,landmanagement,watermanagementandconservation,wetlandsrestorationandmitigation,andenvironmentalandwildlifeconservation.Includesbio-sciencerelatedactivitiesandresearch.
Renewable Energy and Alternative Fuels
Manufacturing,production,construction,design,research,delivery,operation,storageandmaintenanceofwind,solar,biomass,hydro,alternativetransportationfuels,geothermal,methaneandwasteincinerationasafuelsource.
Page5
Whileitwasexpectedthatmostgreenjobswouldberelatedtobusinessesthathadoperationsrelatedtooneoftheaforementionedactivities,greenjobscouldexistinbusinessesthatdidnotdirectlyengageintheseactivities.Duetothis,thedefinitionofagreenjobwasleftmoreopensotheconsortiumresearchcouldcaptureasmanygreenjobsaspossible.
The definition used for a green job was:
“One in which an employee produces a product or provides a service that improves energy efficiency, expands the use of renewable energy, or supports environmental sustainability.”
Forthepurposesofthisstudy,employerswereaskednottoincludeemployeesthatwereconsultants,contractors,ortemporaryemployeeswhenreportinggreenjobssoastoavoiddoublecountingthesejobsduringdatacollection.
ThedatacontainedinthisreportcontainsthestudyresultsforNebraskaonly.InformationfortheConsortiumstudyandsecondarystudiesonrelatedtopicsofinterestincludingthelaborforce,newandemergingtechnologies,andeconomicanalysiscanbefoundatwww.researchingthegreeneconomy.com.
Methodology
Sample Selection
TheNebraskaGreenJobsSurvey’ssamplingframewasbaseduponemployersfoundintheQuarterlyCensusofEmploymentandWages(QCEW)duringthefourthquarterof2009.TheQCEWisacensusofbusinessesthatareliabletoNebraska’sUnemploymentInsuranceprogram.Therewere61,660Nebraskabusinessestablishmentsduringthesampletime-frame.
Businesseswithanaveragequarterlyemploymentof0.67orlesswereremovedfromthesamplingframe.Thisexclusionsoughttoavoidbusinessesthatcouldbeclosingdownorhaveseasonalemployment.Privatehouseholdswerealsoexcludedinthesamplingframe.
Severalstates’researchpriortoNebraska’sincorporatedtheNorthAmericanIndustryClassificationSystem(NAICS)intotheirsamplingprocess.TheNAICSclassifieseveryestablishmentintoaspecificindustrycode,whichisbasedupontheestablishment’sprimaryeconomicactivity.Unlikepreviousresearchfromotherstates,Nebraskaelectedtoincludeallindustrieswithinthesampleframe.Forinstance,HawaiiexcludedthePublicAdministrationindustry,whileMissouripickedcertainindustriesatthe6-digitNAICSlevel.
Amulti-stagesamplingtechniquewasusedtodrawNebraska’ssample.First,astratifiedrandomsamplewasselected.Businesseswerestratifiedbyindustryatthe2-digitNAICSlevelandclasssize.Inthesecondstep,NebraskaLaborMarketInformationstaffwentthrougheach6-digitNAICScodetodeterminethelikelihoodthattheindustryparticipatedingreenactivities.Staffreferencedthreestates’(Michigan,Oregon,andWashington)previoussampleandmethodologicaldesignsduringtheoversamplingselectionofspecificindustries.
Ultimately,Nebraskaselected127ofapproximately1,2006-digitNAICScodestopossiblyhaveahigherproportionofgreenbusinessesand/orgreenoccupations.These127industrieswereoversampled
Page6
Sector1 - 4
employees5 - 9
employees10 - 19
employees20 - 49
employees50 - 99
employees100 - 249
employees250 - 499
employees500 or more employees
Total
11 147 247 185 82 22 10 1 1 695 21 73 30 18 6 3 - - - 130 22 129 39 45 45 14 12 5 4 293 23 1,004 474 285 242 98 35 12 1 2,151 31 139 115 160 225 129 112 39 31 950 42 91 71 105 151 49 21 5 2 495 44 27 59 81 81 58 81 44 3 434 48 53 65 72 127 64 33 4 8 426 51 56 71 124 86 45 10 7 6 405 52 64 73 74 96 56 31 24 13 431 53 130 113 97 58 14 8 - - 420 54 648 197 145 124 79 36 13 6 1,248 55 95 81 76 63 30 23 10 7 385 56 140 104 96 113 88 48 20 5 614 61 12 13 23 130 141 51 20 19 409 62 20 35 50 84 91 103 21 28 432 71 38 57 122 113 42 25 3 1 401 72 15 33 87 186 81 26 1 - 429 81 99 122 106 74 28 14 1 - 444 92 204 106 100 117 103 68 17 10 725 Total 3,184 2,105 2,051 2,203 1,235 747 247 145 11,917
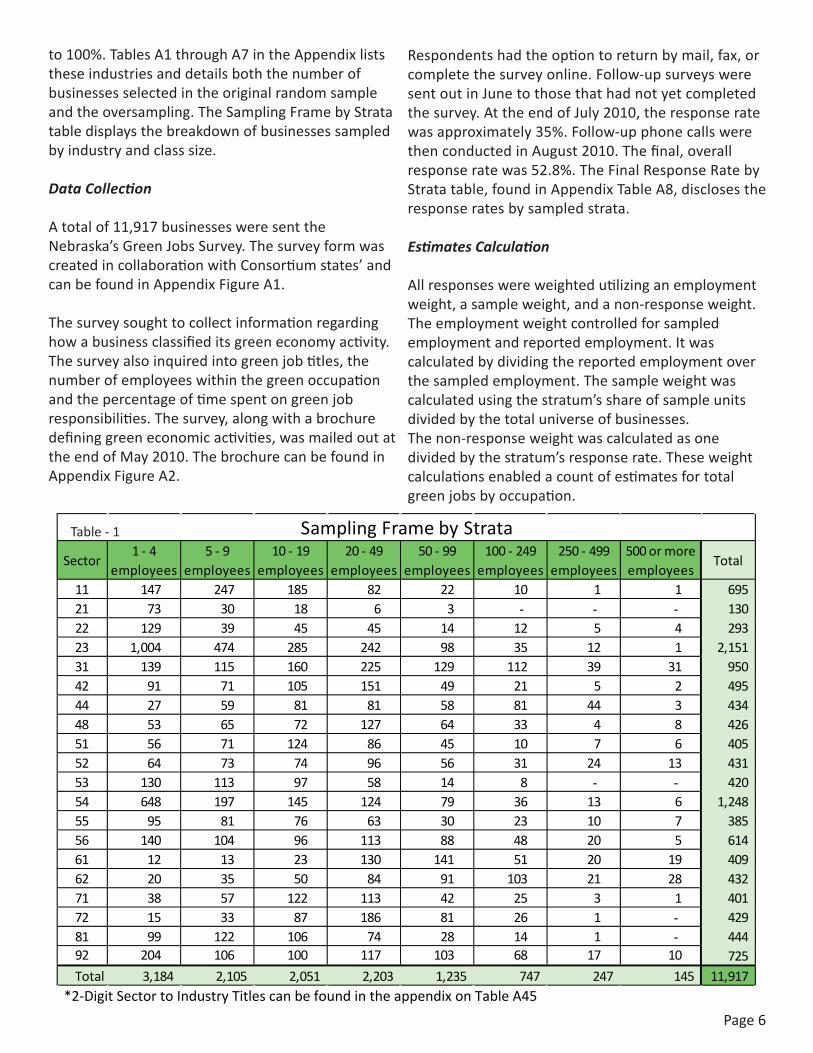
Sampling Frame by StrataTable - 1
*2-Digit Sector to Industry Titles can be found in the appendix on Table A45
to100%.TablesA1throughA7intheAppendixliststheseindustriesanddetailsboththenumberofbusinessesselectedintheoriginalrandomsampleandtheoversampling.TheSamplingFramebyStratatabledisplaysthebreakdownofbusinessessampledbyindustryandclasssize.
Data Collection
Atotalof11,917businessesweresenttheNebraska’sGreenJobsSurvey.ThesurveyformwascreatedincollaborationwithConsortiumstates’andcanbefoundinAppendixFigureA1.
Thesurveysoughttocollectinformationregardinghowabusinessclassifieditsgreeneconomyactivity.Thesurveyalsoinquiredintogreenjobtitles,thenumberofemployeeswithinthegreenoccupationandthepercentageoftimespentongreenjobresponsibilities.Thesurvey,alongwithabrochuredefininggreeneconomicactivities,wasmailedoutattheendofMay2010.ThebrochurecanbefoundinAppendixFigureA2.
Respondentshadtheoptiontoreturnbymail,fax,orcompletethesurveyonline.Follow-upsurveysweresentoutinJunetothosethathadnotyetcompletedthesurvey.AttheendofJuly2010,theresponseratewasapproximately35%.Follow-upphonecallswerethenconductedinAugust2010.Thefinal,overallresponseratewas52.8%.TheFinalResponseRatebyStratatable,foundinAppendixTableA8,disclosestheresponseratesbysampledstrata.
Estimates Calculation
Allresponseswereweightedutilizinganemploymentweight,asampleweight,andanon-responseweight.Theemploymentweightcontrolledforsampledemploymentandreportedemployment.Itwascalculatedbydividingthereportedemploymentoverthesampledemployment.Thesampleweightwascalculatedusingthestratum’sshareofsampleunitsdividedbythetotaluniverseofbusinesses.Thenon-responseweightwascalculatedasonedividedbythestratum’sresponserate.Theseweightcalculationsenabledacountofestimatesfortotalgreenjobsbyoccupation.
Page7
Green Jobs Overview
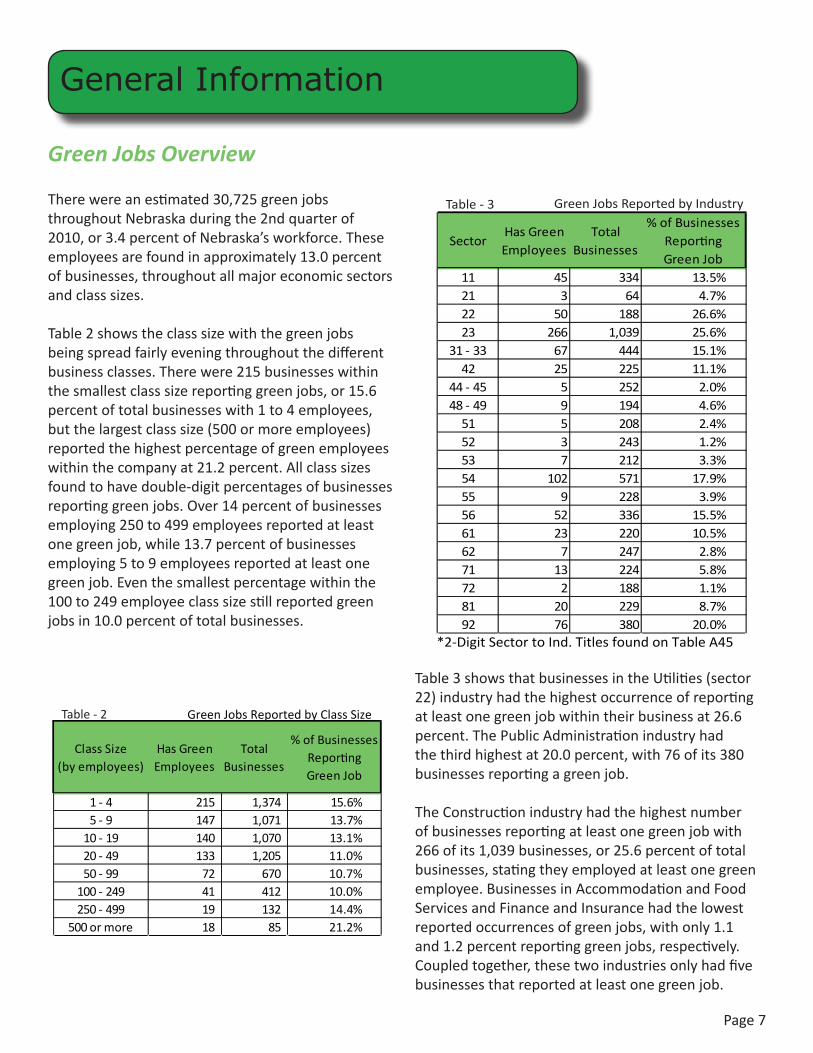
Therewereanestimated30,725greenjobsthroughoutNebraskaduringthe2ndquarterof2010,or3.4percentofNebraska’sworkforce.Theseemployeesarefoundinapproximately13.0percentofbusinesses,throughoutallmajoreconomicsectorsandclasssizes.
Table2showstheclasssizewiththegreenjobsbeingspreadfairlyeveningthroughoutthedifferentbusinessclasses.Therewere215businesseswithinthesmallestclasssizereportinggreenjobs,or15.6percentoftotalbusinesseswith1to4employees,butthelargestclasssize(500ormoreemployees)reportedthehighestpercentageofgreenemployeeswithinthecompanyat21.2percent.Allclasssizesfoundtohavedouble-digitpercentagesofbusinessesreportinggreenjobs.Over14percentofbusinessesemploying250to499employeesreportedatleastonegreenjob,while13.7percentofbusinessesemploying5to9employeesreportedatleastonegreenjob.Eventhesmallestpercentagewithinthe100to249employeeclasssizestillreportedgreenjobsin10.0percentoftotalbusinesses.
Table3showsthatbusinessesintheUtilities(sector22)industryhadthehighestoccurrenceofreportingatleastonegreenjobwithintheirbusinessat26.6percent.ThePublicAdministrationindustryhadthethirdhighestat20.0percent,with76ofits380businessesreportingagreenjob.
TheConstructionindustryhadthehighestnumberofbusinessesreportingatleastonegreenjobwith266ofits1,039businesses,or25.6percentoftotalbusinesses,statingtheyemployedatleastonegreenemployee.BusinessesinAccommodationandFoodServicesandFinanceandInsurancehadthelowestreportedoccurrencesofgreenjobs,withonly1.1and1.2percentreportinggreenjobs,respectively.Coupledtogether,thesetwoindustriesonlyhadfivebusinessesthatreportedatleastonegreenjob.
General Information
SectorHas Green Employees
Total Businesses
% of Businesses Reporting Green Job
11 45 334 13.5%21 3 64 4.7%22 50 188 26.6%23 266 1,039 25.6%
31 - 33 67 444 15.1%42 25 225 11.1%
44 - 45 5 252 2.0%48 - 49 9 194 4.6%
51 5 208 2.4%52 3 243 1.2%53 7 212 3.3%54 102 571 17.9%55 9 228 3.9%56 52 336 15.5%61 23 220 10.5%62 7 247 2.8%71 13 224 5.8%72 2 188 1.1%81 20 229 8.7%92 76 380 20.0%
Table - 3 Green Jobs Reported by Industry
*2-Digit Sector to Ind. Titles found on Table A45
Class Size (by employees)
Has Green Employees
Total Businesses
% of Businesses Reporting Green Job
1 - 4 215 1,374 15.6%5 - 9 147 1,071 13.7%
10 - 19 140 1,070 13.1%20 - 49 133 1,205 11.0%50 - 99 72 670 10.7%
100 - 249 41 412 10.0%250 - 499 19 132 14.4%
500 or more 18 85 21.2%
Table - 2 Green Jobs Reported by Class Size
Page8
AsmentionedinthePurposesectionofthisreport,greeneconomiccategoriesweredifferentthangreenjobs.Businessescouldhaveaprimaryactivitythatcouldbeconsideredgreen,butnotmeetthemorestringentdefinitionofagreenjob.Theycouldalsonotfitintoagreeneconomiccategory,buthaveemployeesparticipatinginworkthatcouldbeconsideredgreen.
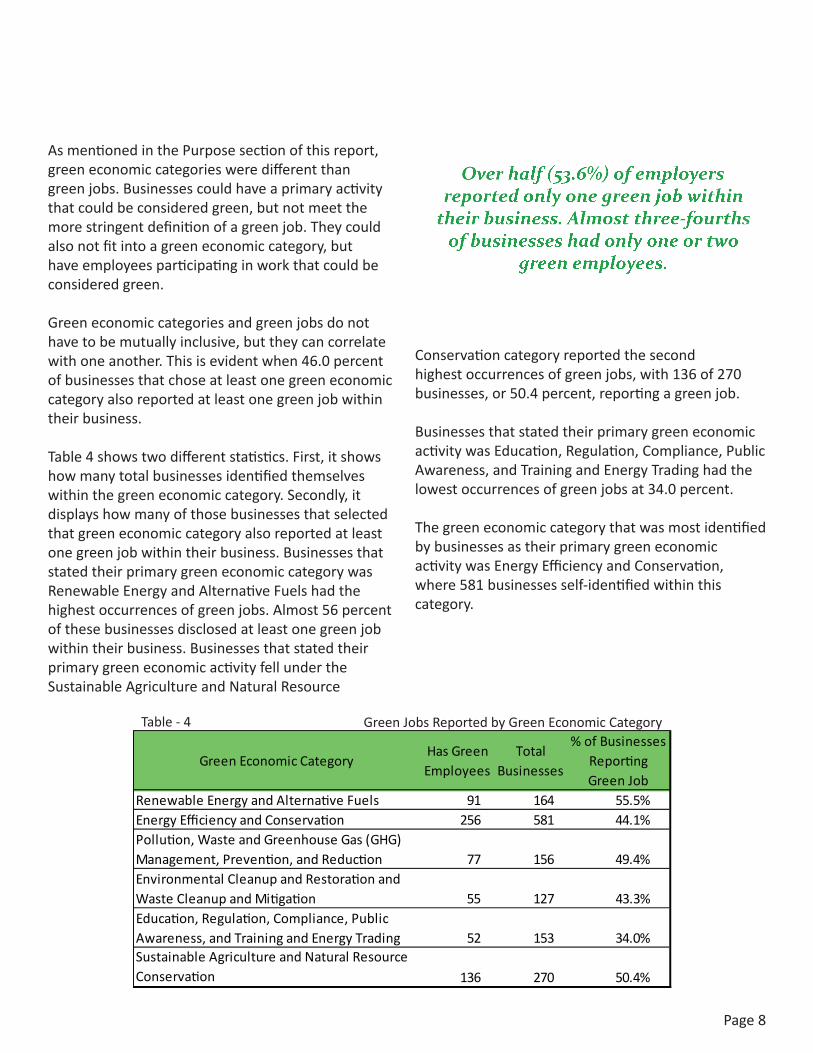
Greeneconomiccategoriesandgreenjobsdonothavetobemutuallyinclusive,buttheycancorrelatewithoneanother.Thisisevidentwhen46.0percentofbusinessesthatchoseatleastonegreeneconomiccategoryalsoreportedatleastonegreenjobwithintheirbusiness.Table4showstwodifferentstatistics.First,itshowshowmanytotalbusinessesidentifiedthemselveswithinthegreeneconomiccategory.Secondly,itdisplayshowmanyofthosebusinessesthatselectedthatgreeneconomiccategoryalsoreportedatleastonegreenjobwithintheirbusiness.BusinessesthatstatedtheirprimarygreeneconomiccategorywasRenewableEnergyandAlternativeFuelshadthehighestoccurrencesofgreenjobs.Almost56percentofthesebusinessesdisclosedatleastonegreenjobwithintheirbusiness.BusinessesthatstatedtheirprimarygreeneconomicactivityfellundertheSustainableAgricultureandNaturalResource
Conservationcategoryreportedthesecondhighestoccurrencesofgreenjobs,with136of270businesses,or50.4percent,reportingagreenjob.
BusinessesthatstatedtheirprimarygreeneconomicactivitywasEducation,Regulation,Compliance,PublicAwareness,andTrainingandEnergyTradinghadthelowestoccurrencesofgreenjobsat34.0percent.
ThegreeneconomiccategorythatwasmostidentifiedbybusinessesastheirprimarygreeneconomicactivitywasEnergyEfficiencyandConservation,where581businessesself-identifiedwithinthiscategory.
Green Economic CategoryHas Green Employees
Total Businesses
% of Businesses Reporting Green Job
Renewable Energy and Alternative Fuels 91 164 55.5%Energy Efficiency and Conservation 256 581 44.1%Pollution, Waste and Greenhouse Gas (GHG) Management, Prevention, and Reduction 77 156 49.4%Environmental Cleanup and Restoration and Waste Cleanup and Mitigation 55 127 43.3%Education, Regulation, Compliance, Public Awareness, and Training and Energy Trading 52 153 34.0%Sustainable Agriculture and Natural Resource Conservation 136 270 50.4%
Table - 4 Green Jobs Reported by Green Economic Category
Over half (53.6%) of employers reported only one green job within
their business. Almost three-fourths of businesses had only one or two
green employees.
Page9
Green Economic Activities
Businessescouldconceivetheirprimaryactivitywasgreen,yetnotmeetthemorerigorousdefinitionofagreenjob.Itwasimportanttoconsiderabusiness’economicactivityifitsoutputcouldbeconstruedasgreeninsomemanner.Thus,eachbusinesswasaskedtoidentifyitsprimarygreeneconomicactivity,regardlessofthenumberofgreenjobsitmayreport.Almost27percentofbusinessesidentifiedthemselvesintooneormoreoftheprovidedgreeneconomiccategoriesinthesurvey.Comparatively,only13percentofbusinessesreportedjobsthatfittheprovideddefinitionofgreenjobs.
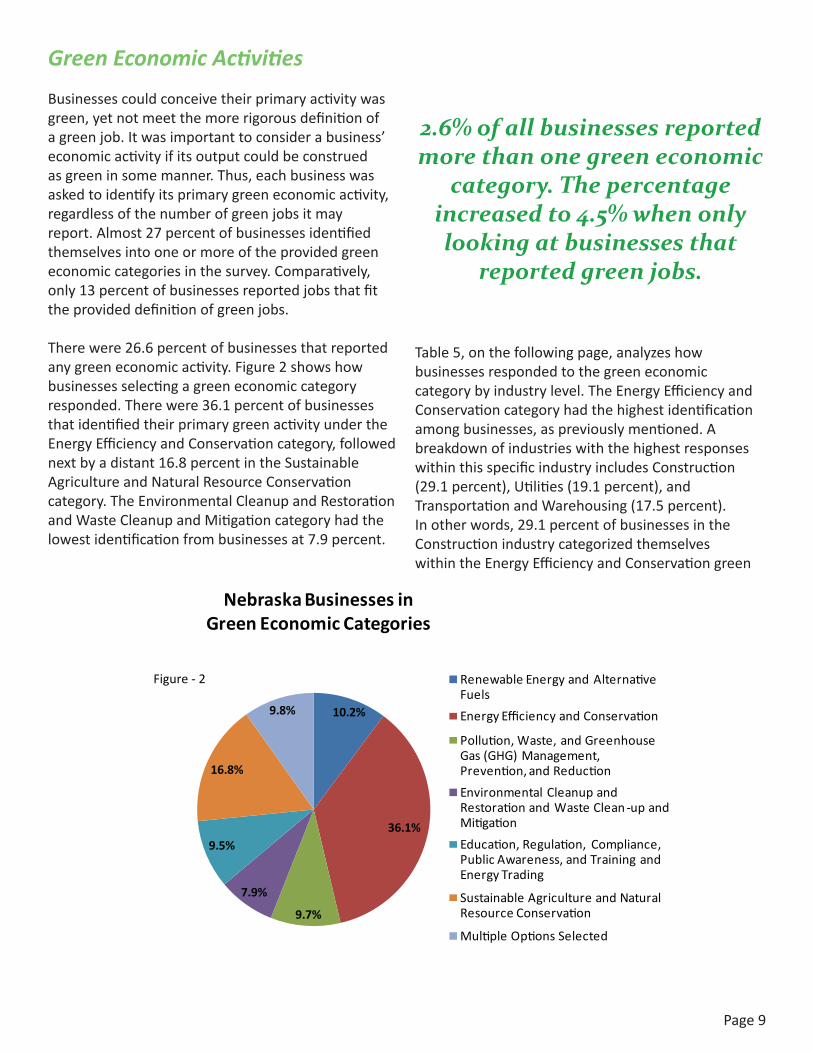
Therewere26.6percentofbusinessesthatreportedanygreeneconomicactivity.Figure2showshowbusinessesselectingagreeneconomiccategoryresponded.Therewere36.1percentofbusinessesthatidentifiedtheirprimarygreenactivityundertheEnergyEfficiencyandConservationcategory,followednextbyadistant16.8percentintheSustainableAgricultureandNaturalResourceConservationcategory.TheEnvironmentalCleanupandRestorationandWasteCleanupandMitigationcategoryhadthelowestidentificationfrombusinessesat7.9percent.
Table5,onthefollowingpage,analyzeshowbusinessesrespondedtothegreeneconomiccategorybyindustrylevel.TheEnergyEfficiencyandConservationcategoryhadthehighestidentificationamongbusinesses,aspreviouslymentioned.AbreakdownofindustrieswiththehighestresponseswithinthisspecificindustryincludesConstruction(29.1percent),Utilities(19.1percent),andTransportationandWarehousing(17.5percent).Inotherwords,29.1percentofbusinessesintheConstructionindustrycategorizedthemselveswithintheEnergyEfficiencyandConservationgreen
10.2%
36.1%
9.7%
7.9%
9.5%
16.8%
9.8%
Nebraska Businesses in Green Economic Categories
Renewable Energy and Alternative Fuels
Energy Efficiency and Conservation
Pollution, Waste, and Greenhouse Gas (GHG) Management, Prevention, and Reduction
Environmental Cleanup and Restoration and Waste Clean -up and Mitigation
Education, Regulation, Compliance, Public Awareness, and Training and Energy Trading
Sustainable Agriculture and Natural Resource Conservation
Multiple Options Selected
Figure - 2
2.6% of all businesses reported more than one green economic
category. The percentage increased to 4.5% when only looking at businesses that
reported green jobs.
Page10
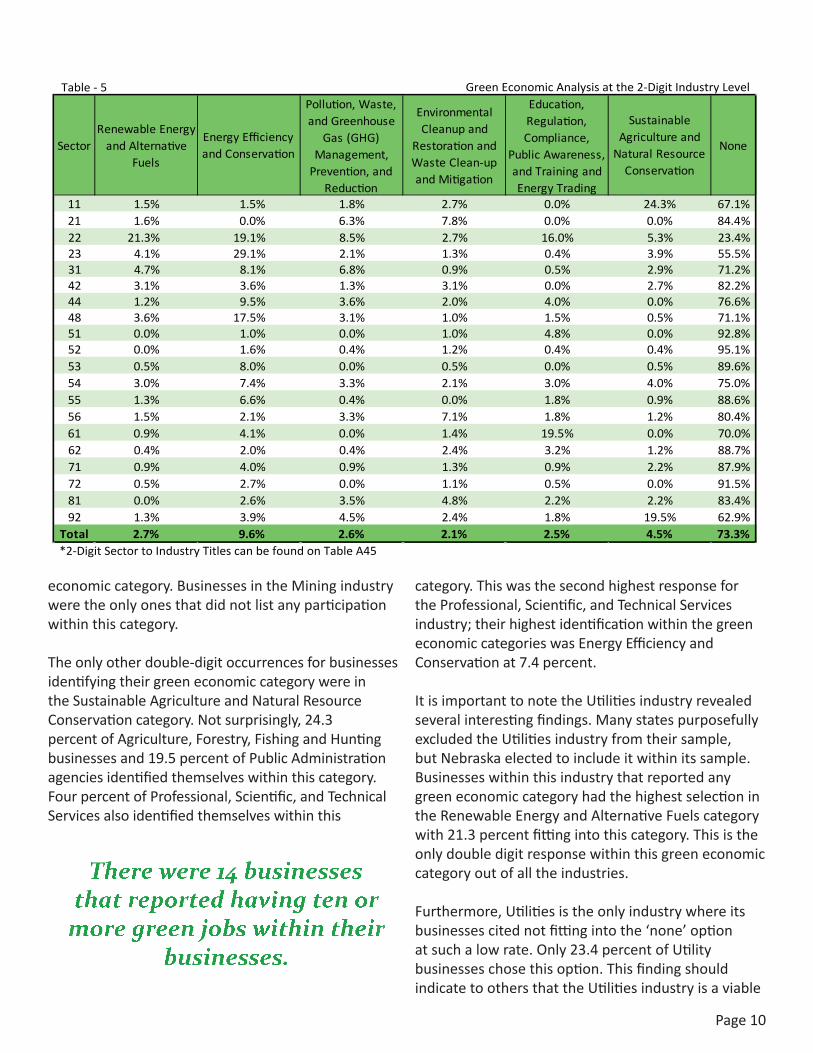
economiccategory.BusinessesintheMiningindustryweretheonlyonesthatdidnotlistanyparticipationwithinthiscategory.
Theonlyotherdouble-digitoccurrencesforbusinessesidentifyingtheirgreeneconomiccategorywereintheSustainableAgricultureandNaturalResourceConservationcategory.Notsurprisingly,24.3percentofAgriculture,Forestry,FishingandHuntingbusinessesand19.5percentofPublicAdministrationagenciesidentifiedthemselveswithinthiscategory.FourpercentofProfessional,Scientific,andTechnicalServicesalsoidentifiedthemselveswithinthis
category.ThiswasthesecondhighestresponsefortheProfessional,Scientific,andTechnicalServicesindustry;theirhighestidentificationwithinthegreeneconomiccategorieswasEnergyEfficiencyandConservationat7.4percent.
ItisimportanttonotetheUtilitiesindustryrevealedseveralinterestingfindings.ManystatespurposefullyexcludedtheUtilitiesindustryfromtheirsample,butNebraskaelectedtoincludeitwithinitssample.BusinesseswithinthisindustrythatreportedanygreeneconomiccategoryhadthehighestselectionintheRenewableEnergyandAlternativeFuelscategorywith21.3percentfittingintothiscategory.Thisistheonlydoubledigitresponsewithinthisgreeneconomiccategoryoutofalltheindustries.
Furthermore,Utilitiesistheonlyindustrywhereitsbusinessescitednotfittingintothe‘none’optionatsuchalowrate.Only23.4percentofUtilitybusinesseschosethisoption.ThisfindingshouldindicatetoothersthattheUtilitiesindustryisaviable
SectorRenewable Energy
and Alternative Fuels
Energy Efficiency and Conservation
Pollution, Waste, and Greenhouse
Gas (GHG) Management,
Prevention, and Reduction
Environmental Cleanup and
Restoration and Waste Clean-up and Mitigation
Education, Regulation, Compliance,
Public Awareness, and Training and Energy Trading
Sustainable Agriculture and
Natural Resource Conservation
None
11 1.5% 1.5% 1.8% 2.7% 0.0% 24.3% 67.1%21 1.6% 0.0% 6.3% 7.8% 0.0% 0.0% 84.4%22 21.3% 19.1% 8.5% 2.7% 16.0% 5.3% 23.4%23 4.1% 29.1% 2.1% 1.3% 0.4% 3.9% 55.5%31 4.7% 8.1% 6.8% 0.9% 0.5% 2.9% 71.2%42 3.1% 3.6% 1.3% 3.1% 0.0% 2.7% 82.2%44 1.2% 9.5% 3.6% 2.0% 4.0% 0.0% 76.6%48 3.6% 17.5% 3.1% 1.0% 1.5% 0.5% 71.1%51 0.0% 1.0% 0.0% 1.0% 4.8% 0.0% 92.8%52 0.0% 1.6% 0.4% 1.2% 0.4% 0.4% 95.1%53 0.5% 8.0% 0.0% 0.5% 0.0% 0.5% 89.6%54 3.0% 7.4% 3.3% 2.1% 3.0% 4.0% 75.0%55 1.3% 6.6% 0.4% 0.0% 1.8% 0.9% 88.6%56 1.5% 2.1% 3.3% 7.1% 1.8% 1.2% 80.4%61 0.9% 4.1% 0.0% 1.4% 19.5% 0.0% 70.0%62 0.4% 2.0% 0.4% 2.4% 3.2% 1.2% 88.7%71 0.9% 4.0% 0.9% 1.3% 0.9% 2.2% 87.9%72 0.5% 2.7% 0.0% 1.1% 0.5% 0.0% 91.5%81 0.0% 2.6% 3.5% 4.8% 2.2% 2.2% 83.4%92 1.3% 3.9% 4.5% 2.4% 1.8% 19.5% 62.9%
Total 2.7% 9.6% 2.6% 2.1% 2.5% 4.5% 73.3%
Table - 5 Green Economic Analysis at the 2-Digit Industry Level
*2-Digit Sector to Industry Titles can be found on Table A45
There were 14 businesses that reported having ten or
more green jobs within their businesses.
Page11
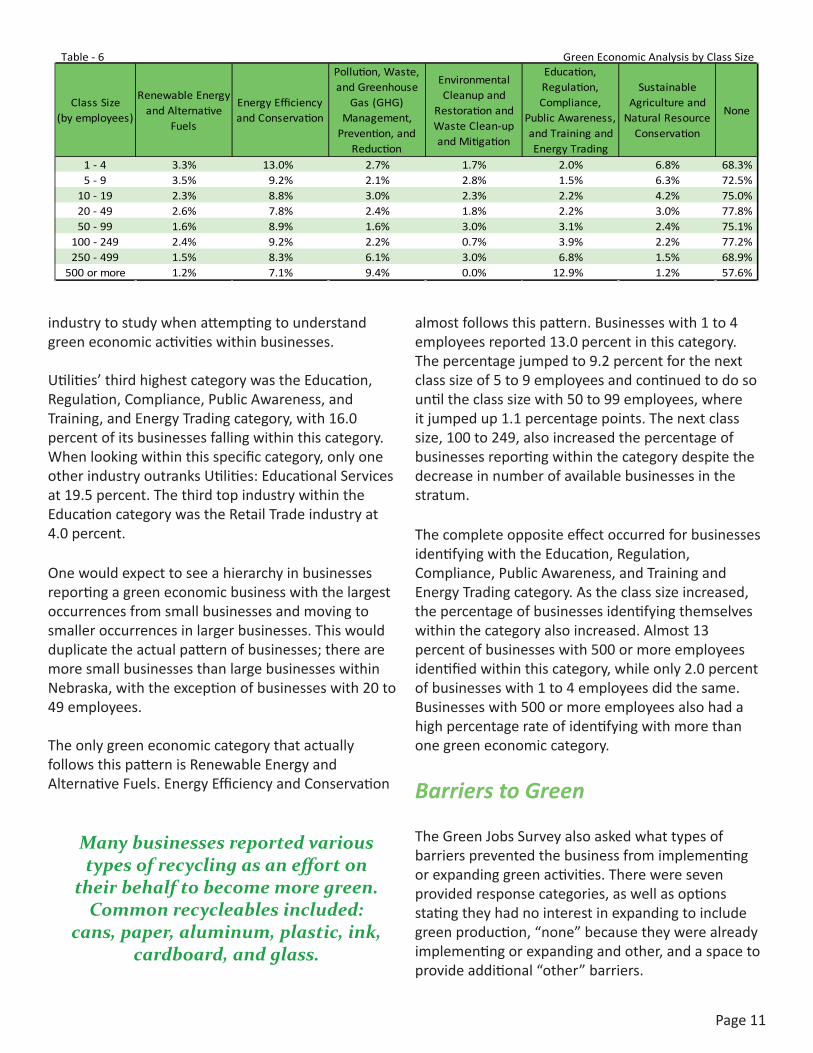
industrytostudywhenattemptingtounderstandgreeneconomicactivitieswithinbusinesses.
Utilities’thirdhighestcategorywastheEducation,Regulation,Compliance,PublicAwareness,andTraining,andEnergyTradingcategory,with16.0percentofitsbusinessesfallingwithinthiscategory.Whenlookingwithinthisspecificcategory,onlyoneotherindustryoutranksUtilities:EducationalServicesat19.5percent.ThethirdtopindustrywithintheEducationcategorywastheRetailTradeindustryat4.0percent.
Onewouldexpecttoseeahierarchyinbusinessesreportingagreeneconomicbusinesswiththelargestoccurrencesfromsmallbusinessesandmovingtosmalleroccurrencesinlargerbusinesses.Thiswouldduplicatetheactualpatternofbusinesses;therearemoresmallbusinessesthanlargebusinesseswithinNebraska,withtheexceptionofbusinesseswith20to49employees.
TheonlygreeneconomiccategorythatactuallyfollowsthispatternisRenewableEnergyandAlternativeFuels.EnergyEfficiencyandConservation
almostfollowsthispattern.Businesseswith1to4employeesreported13.0percentinthiscategory.Thepercentagejumpedto9.2percentforthenextclasssizeof5to9employeesandcontinuedtodosountiltheclasssizewith50to99employees,whereitjumpedup1.1percentagepoints.Thenextclasssize,100to249,alsoincreasedthepercentageofbusinessesreportingwithinthecategorydespitethedecreaseinnumberofavailablebusinessesinthestratum.
ThecompleteoppositeeffectoccurredforbusinessesidentifyingwiththeEducation,Regulation,Compliance,PublicAwareness,andTrainingandEnergyTradingcategory.Astheclasssizeincreased,thepercentageofbusinessesidentifyingthemselveswithinthecategoryalsoincreased.Almost13percentofbusinesseswith500ormoreemployeesidentifiedwithinthiscategory,whileonly2.0percentofbusinesseswith1to4employeesdidthesame.Businesseswith500ormoreemployeesalsohadahighpercentagerateofidentifyingwithmorethanonegreeneconomiccategory.
Barriers to Green
TheGreenJobsSurveyalsoaskedwhattypesofbarrierspreventedthebusinessfromimplementingorexpandinggreenactivities.Thereweresevenprovidedresponsecategories,aswellasoptionsstatingtheyhadnointerestinexpandingtoincludegreenproduction,“none”becausetheywerealreadyimplementingorexpandingandother,andaspacetoprovideadditional“other”barriers.
Class Size(by employees)
Renewable Energy and Alternative
Fuels
Energy Efficiency and Conservation
Pollution, Waste, and Greenhouse
Gas (GHG) Management,
Prevention, and Reduction
Environmental Cleanup and
Restoration and Waste Clean-up and Mitigation
Education, Regulation, Compliance,
Public Awareness, and Training and Energy Trading
Sustainable Agriculture and
Natural Resource Conservation
None
1 - 4 3.3% 13.0% 2.7% 1.7% 2.0% 6.8% 68.3%5 - 9 3.5% 9.2% 2.1% 2.8% 1.5% 6.3% 72.5%
10 - 19 2.3% 8.8% 3.0% 2.3% 2.2% 4.2% 75.0%20 - 49 2.6% 7.8% 2.4% 1.8% 2.2% 3.0% 77.8%50 - 99 1.6% 8.9% 1.6% 3.0% 3.1% 2.4% 75.1%
100 - 249 2.4% 9.2% 2.2% 0.7% 3.9% 2.2% 77.2%250 - 499 1.5% 8.3% 6.1% 3.0% 6.8% 1.5% 68.9%
500 or more 1.2% 7.1% 9.4% 0.0% 12.9% 1.2% 57.6%
Table - 6 Green Economic Analysis by Class Size
Many businesses reported various types of recycling as an effort on
their behalf to become more green. Common recycleables included:
cans, paper, aluminum, plastic, ink, cardboard, and glass.
Page12
Almost4,200surveyedbusinessesresponded,or70.6percentofthetotal.Businesseswereallowedtoselectmultipleoptions.Asaresult,therewereover5,700totalresponsesforthisquestion.
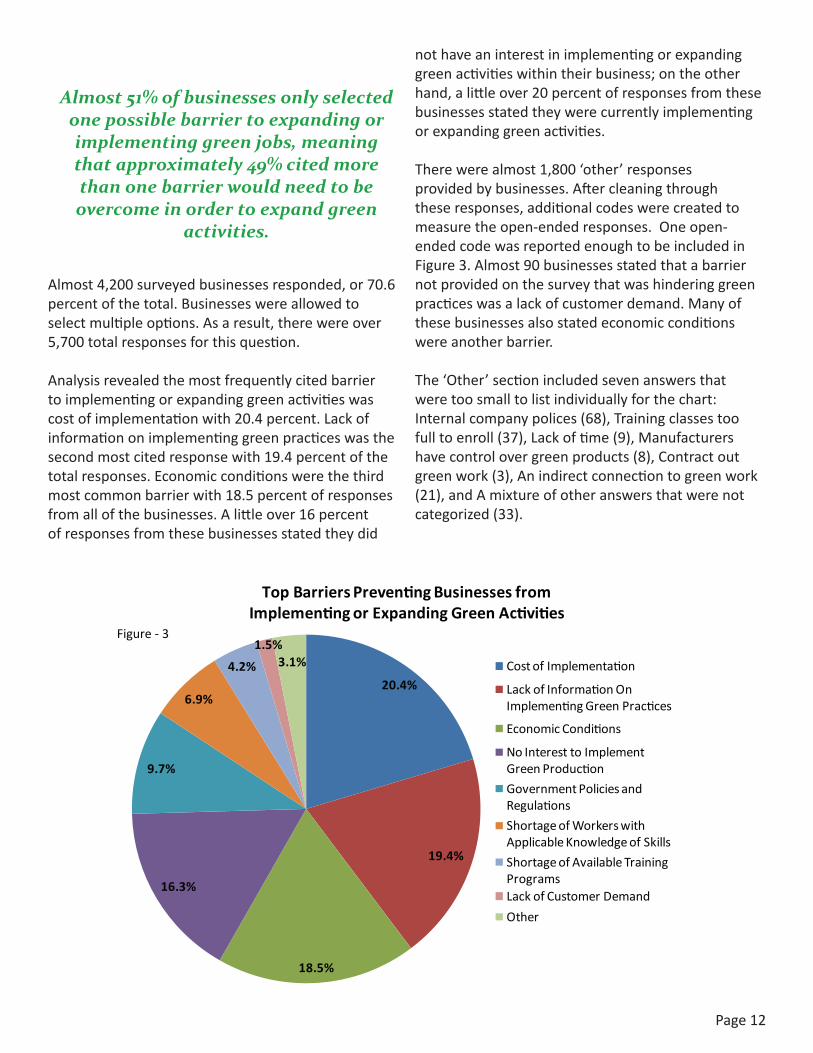
Analysisrevealedthemostfrequentlycitedbarriertoimplementingorexpandinggreenactivitieswascostofimplementationwith20.4percent.Lackofinformationonimplementinggreenpracticeswasthesecondmostcitedresponsewith19.4percentofthetotalresponses.Economicconditionswerethethirdmostcommonbarrierwith18.5percentofresponsesfromallofthebusinesses.Alittleover16percentofresponsesfromthesebusinessesstatedtheydid
nothaveaninterestinimplementingorexpandinggreenactivitieswithintheirbusiness;ontheotherhand,alittleover20percentofresponsesfromthesebusinessesstatedtheywerecurrentlyimplementingorexpandinggreenactivities.
Therewerealmost1,800‘other’responsesprovidedbybusinesses.Aftercleaningthroughtheseresponses,additionalcodeswerecreatedtomeasuretheopen-endedresponses.Oneopen-endedcodewasreportedenoughtobeincludedinFigure3.Almost90businessesstatedthatabarriernotprovidedonthesurveythatwashinderinggreenpracticeswasalackofcustomerdemand.Manyofthesebusinessesalsostatedeconomicconditionswereanotherbarrier.
The‘Other’sectionincludedsevenanswersthatweretoosmalltolistindividuallyforthechart:Internalcompanypolices(68),Trainingclassestoofulltoenroll(37),Lackoftime(9),Manufacturershavecontrolovergreenproducts(8),Contractoutgreenwork(3),Anindirectconnectiontogreenwork(21),andAmixtureofotheranswersthatwerenotcategorized(33).
20.4%
19.4%
18.5%
16.3%
9.7%
6.9%
4.2%
1.5%3.1%
Top Barriers Preventing Businesses from Implementing or Expanding Green Activities
Cost of Implementation
Lack of Information On Implementing Green Practices
Economic Conditions
No Interest to Implement Green Production
Government Policies and Regulations
Shortage of Workers with Applicable Knowledge of Skills
Shortage of Available Training ProgramsLack of Customer Demand
Other
Figure - 3
Almost 51% of businesses only selected one possible barrier to expanding or implementing green jobs, meaning that approximately 49% cited more than one barrier would need to be overcome in order to expand green
activities.
Page13
Top Green Industries
TheGreenJobsSurveywasstratifiedbytheeconomicsectorsfoundintheNAICSsystematthemostbroadlevel,or2-digitNAICSlevel.TheConstructionandProfessional,Scientific,andTechnicalServicesindustrieswerethetwoindustrieswiththelargestamountofbusinessessampled;theConstructionindustryhadover2,100businessesincludedinthesample,whiletheProfessional,Scientific,andTechnicalServicesindustryhadalittlemorethan1,200businessesinthesample.
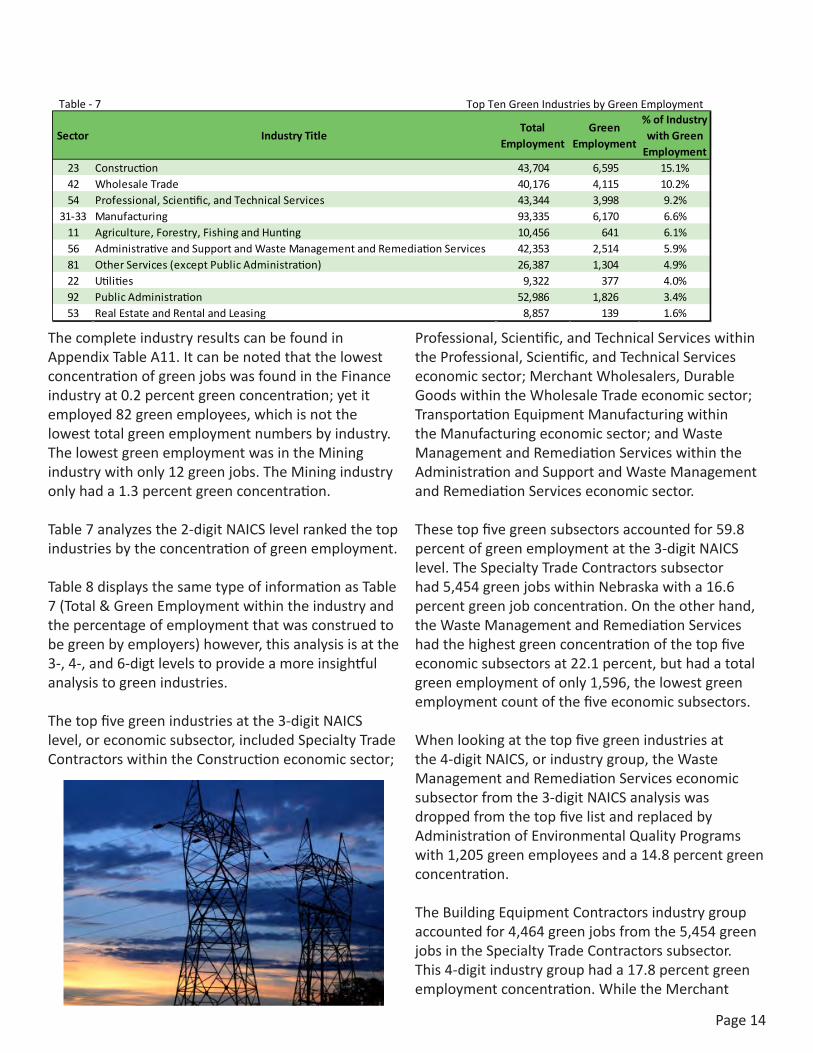
Table7displaysthetoptengreenindustriesbypercentageofgreenemployment.Theindustrywiththehighestconcentrationoftotalgreenemploymentwasalsotheindustrywiththelargestnumberofgreenjobs:theConstructionindustry.TheConstructionindustryhad15.1percentgreenemploymentwithatotalof6,595greenjobs.
ThesecondhighestconcentrationofgreenemploymentwasfoundintheWholesaleTradeindustry;however,itsgreenemploymentrankedthirdwith4,115greenjobs.ThesecondhighestgreenemploymentoccurredwithintheManufacturingindustrywith6,170greenjobs,yetitrankedfourthintermsofpercentgreenconcentrationat6.1percent.
Professional,Scientific,andTechnicalServicesrankedthirdforpercentgreenconcentrationandfourthfortotalgreenemploymentwith3,998greenemployees.Agriculture,Forestry,FishingandHunting;AdministrativeandSupportandWasteManagementandRemediationServices;OtherServices;Utilities;PublicAdministration;andRealEstateandRentalandLeasingroundedoutthetoptenindustrieswiththehighestconcentrationofgreenjobs.
Industry Analysis
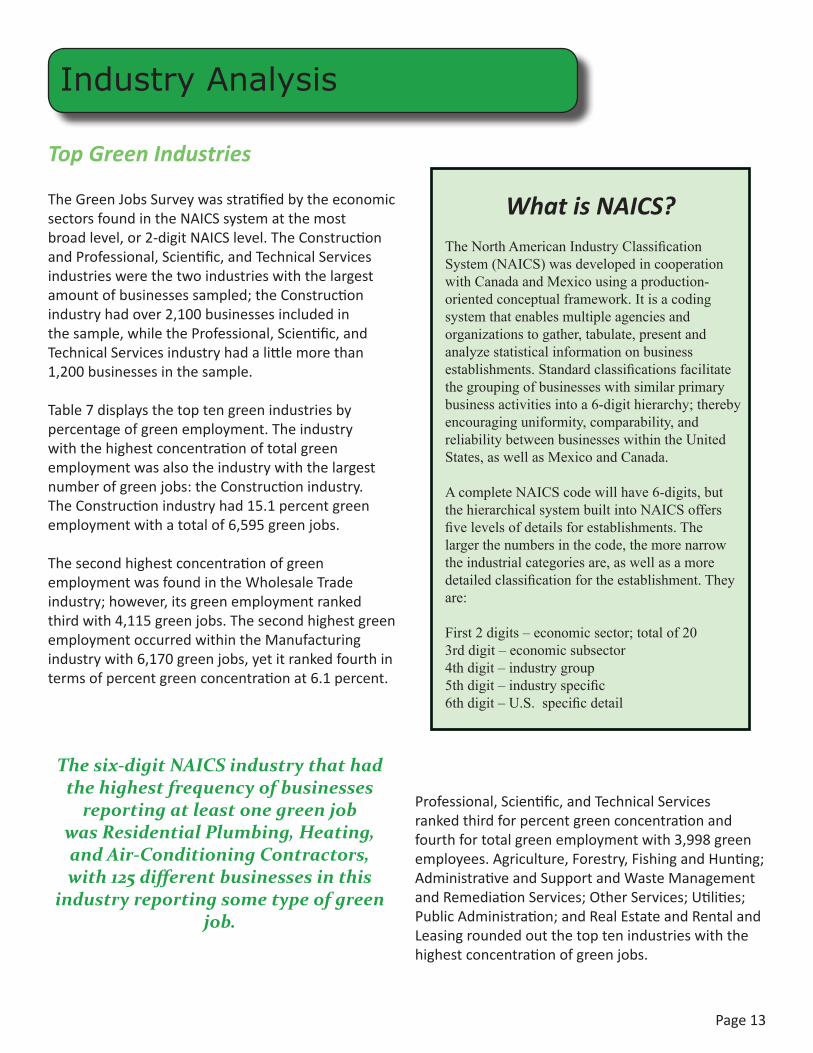
What is NAICS?The North American Industry Classification System (NAICS) was developed in cooperation with Canada and Mexico using a production-oriented conceptual framework. It is a coding system that enables multiple agencies and organizations to gather, tabulate, present and analyze statistical information on business establishments. Standard classifications facilitate the grouping of businesses with similar primary business activities into a 6-digit hierarchy; thereby encouraging uniformity, comparability, and reliability between businesses within the United States, as well as Mexico and Canada.
A complete NAICS code will have 6-digits, but the hierarchical system built into NAICS offers five levels of details for establishments. The larger the numbers in the code, the more narrow the industrial categories are, as well as a more detailed classification for the establishment. They are:
First 2 digits – economic sector; total of 203rd digit – economic subsector4th digit – industry group5th digit – industry specific6th digit – U.S. specific detail
The six-digit NAICS industry that had the highest frequency of businesses
reporting at least one green job was Residential Plumbing, Heating, and Air-Conditioning Contractors, with 125 different businesses in this
industry reporting some type of green job.
Page14
ThecompleteindustryresultscanbefoundinAppendixTableA11.ItcanbenotedthatthelowestconcentrationofgreenjobswasfoundintheFinanceindustryat0.2percentgreenconcentration;yetitemployed82greenemployees,whichisnotthelowesttotalgreenemploymentnumbersbyindustry.ThelowestgreenemploymentwasintheMiningindustrywithonly12greenjobs.TheMiningindustryonlyhada1.3percentgreenconcentration.
Table7analyzesthe2-digitNAICSlevelrankedthetopindustriesbytheconcentrationofgreenemployment.
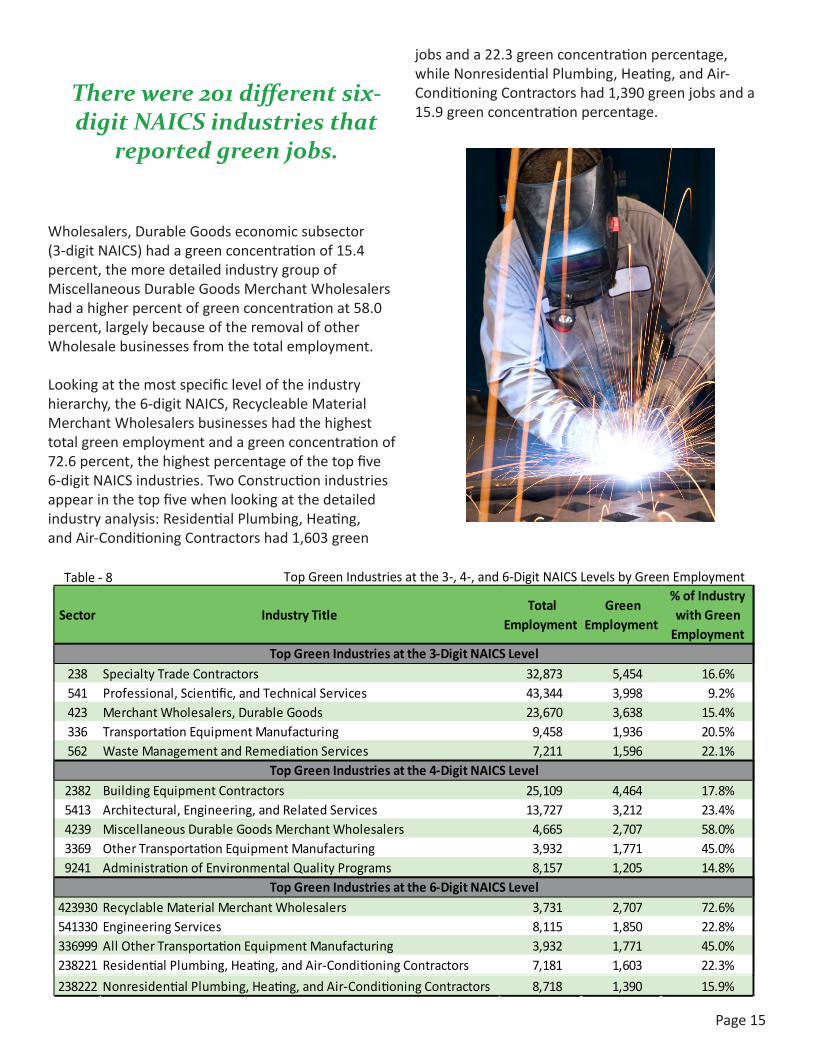
Table8displaysthesametypeofinformationasTable7(Total&GreenEmploymentwithintheindustryandthepercentageofemploymentthatwasconstruedtobegreenbyemployers)however,thisanalysisisatthe3-,4-,and6-digtlevelstoprovideamoreinsightfulanalysistogreenindustries.
Thetopfivegreenindustriesatthe3-digitNAICSlevel,oreconomicsubsector,includedSpecialtyTradeContractorswithintheConstructioneconomicsector;
Professional,Scientific,andTechnicalServiceswithintheProfessional,Scientific,andTechnicalServiceseconomicsector;MerchantWholesalers,DurableGoodswithintheWholesaleTradeeconomicsector;TransportationEquipmentManufacturingwithintheManufacturingeconomicsector;andWasteManagementandRemediationServiceswithintheAdministrationandSupportandWasteManagementandRemediationServiceseconomicsector.
Thesetopfivegreensubsectorsaccountedfor59.8percentofgreenemploymentatthe3-digitNAICSlevel.TheSpecialtyTradeContractorssubsectorhad5,454greenjobswithinNebraskawitha16.6percentgreenjobconcentration.Ontheotherhand,theWasteManagementandRemediationServiceshadthehighestgreenconcentrationofthetopfiveeconomicsubsectorsat22.1percent,buthadatotalgreenemploymentofonly1,596,thelowestgreenemploymentcountofthefiveeconomicsubsectors.
Whenlookingatthetopfivegreenindustriesatthe4-digitNAICS,orindustrygroup,theWasteManagementandRemediationServiceseconomicsubsectorfromthe3-digitNAICSanalysiswasdroppedfromthetopfivelistandreplacedbyAdministrationofEnvironmentalQualityProgramswith1,205greenemployeesanda14.8percentgreenconcentration.TheBuildingEquipmentContractorsindustrygroupaccountedfor4,464greenjobsfromthe5,454greenjobsintheSpecialtyTradeContractorssubsector.This4-digitindustrygrouphada17.8percentgreenemploymentconcentration.WhiletheMerchant
Sector Industry TitleTotal
EmploymentGreen
Employment
% of Industry with Green
Employment23 Construction 43,704 6,595 15.1%42 Wholesale Trade 40,176 4,115 10.2%54 Professional, Scientific, and Technical Services 43,344 3,998 9.2%
31-33 Manufacturing 93,335 6,170 6.6%11 Agriculture, Forestry, Fishing and Hunting 10,456 641 6.1%56 Administrative and Support and Waste Management and Remediation Services 42,353 2,514 5.9%81 Other Services (except Public Administration) 26,387 1,304 4.9%22 Utilities 9,322 377 4.0%92 Public Administration 52,986 1,826 3.4%53 Real Estate and Rental and Leasing 8,857 139 1.6%
Top Ten Green Industries by Green EmploymentTable - 7
Page15
Wholesalers,DurableGoodseconomicsubsector(3-digitNAICS)hadagreenconcentrationof15.4percent,themoredetailedindustrygroupofMiscellaneousDurableGoodsMerchantWholesalershadahigherpercentofgreenconcentrationat58.0percent,largelybecauseoftheremovalofotherWholesalebusinessesfromthetotalemployment. Lookingatthemostspecificleveloftheindustryhierarchy,the6-digitNAICS,RecycleableMaterialMerchantWholesalersbusinesseshadthehighesttotalgreenemploymentandagreenconcentrationof72.6percent,thehighestpercentageofthetopfive6-digitNAICSindustries.TwoConstructionindustriesappearinthetopfivewhenlookingatthedetailedindustryanalysis:ResidentialPlumbing,Heating,andAir-ConditioningContractorshad1,603green
jobsanda22.3greenconcentrationpercentage,whileNonresidentialPlumbing,Heating,andAir-ConditioningContractorshad1,390greenjobsanda15.9greenconcentrationpercentage.
Sector Industry Title Total
Employment Green
Employment
% of Industry with Green
Employment
238 Specialty Trade Contractors 32,873 5,454 16.6%541 Professional, Scientific, and Technical Services 43,344 3,998 9.2%423 Merchant Wholesalers, Durable Goods 23,670 3,638 15.4%336 Transportation Equipment Manufacturing 9,458 1,936 20.5%562 Waste Management and Remediation Services 7,211 1,596 22.1%
2382 Building Equipment Contractors 25,109 4,464 17.8%5413 Architectural, Engineering, and Related Services 13,727 3,212 23.4%4239 Miscellaneous Durable Goods Merchant Wholesalers 4,665 2,707 58.0%3369 Other Transportation Equipment Manufacturing 3,932 1,771 45.0%9241 Administration of Environmental Quality Programs 8,157 1,205 14.8%
423930 Recyclable Material Merchant Wholesalers 3,731 2,707 72.6%541330 Engineering Services 8,115 1,850 22.8%336999 All Other Transportation Equipment Manufacturing 3,932 1,771 45.0%238221 Residential Plumbing, Heating, and Air-Conditioning Contractors 7,181 1,603 22.3%238222 Nonresidential Plumbing, Heating, and Air-Conditioning Contractors 8,718 1,390 15.9%
Top Green Industries at the 3-Digit NAICS Level
Top Green Industries at the 4-Digit NAICS Level
Top Green Industries at the 6-Digit NAICS Level
Sector Industry Title Total
Employment Green
Employment
% of Industry with Green
Employment
238 Specialty Trade Contractors 32,873 5,454 16.6%541 Professional, Scientific, and Technical Services 43,344 3,998 9.2%423 Merchant Wholesalers, Durable Goods 23,670 3,638 15.4%336 Transportation Equipment Manufacturing 9,458 1,936 20.5%562 Waste Management and Remediation Services 7,211 1,596 22.1%
2382 Building Equipment Contractors 25,109 4,464 17.8%5413 Architectural, Engineering, and Related Services 13,727 3,212 23.4%4239 Miscellaneous Durable Goods Merchant Wholesalers 4,665 2,707 58.0%3369 Other Transportation Equipment Manufacturing 3,932 1,771 45.0%9241 Administration of Environmental Quality Programs 8,157 1,205 14.8%
423930 Recyclable Material Merchant Wholesalers 3,731 2,707 72.6%541330 Engineering Services 8,115 1,850 22.8%336999 All Other Transportation Equipment Manufacturing 3,932 1,771 45.0%238221 Residential Plumbing, Heating, and Air-Conditioning Contractors 7,181 1,603 22.3%
Top Green Industries at the 3-Digit NAICS Level
Top Green Industries at the 4-Digit NAICS Level
Top Green Industries at the 6-Digit NAICS Level
Table - 8 Top Green Industries at the 3-, 4-, and 6-Digit NAICS Levels by Green Employment
There were 201 different six-digit NAICS industries that
reported green jobs.
Page16
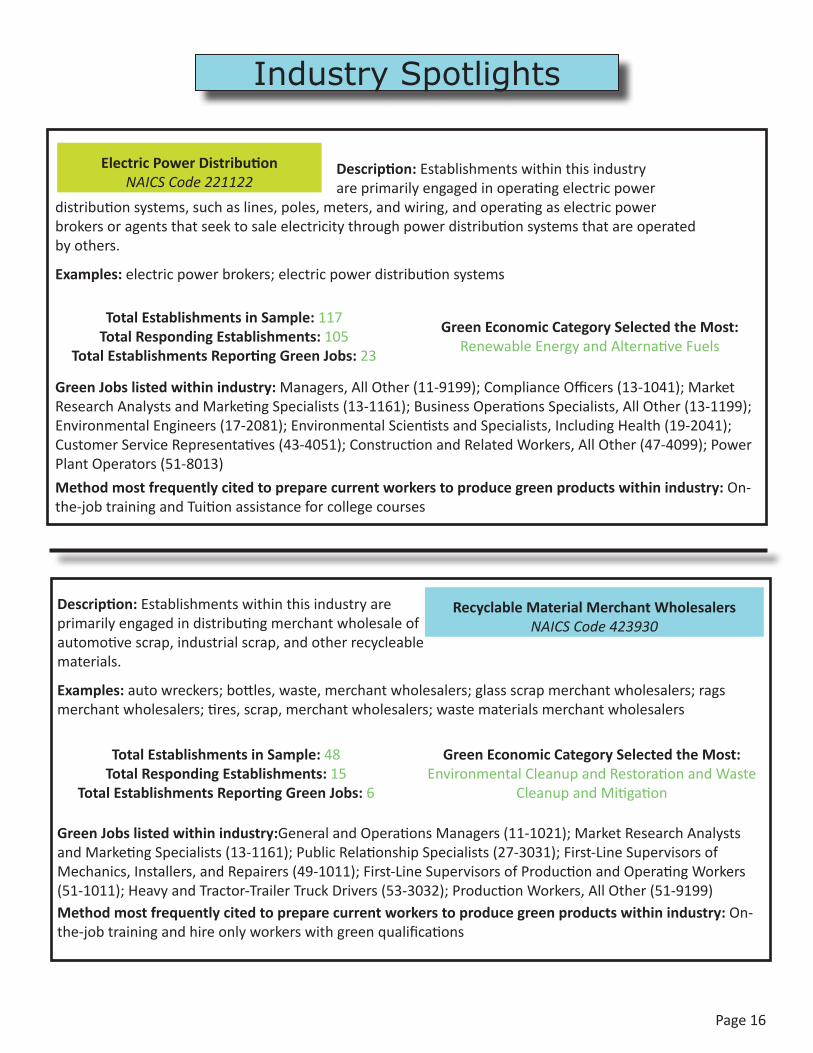
Description:Establishmentswithinthisindustryareprimarilyengagedinoperatingelectricpower
distributionsystems,suchaslines,poles,meters,andwiring,andoperatingaselectricpowerbrokersoragentsthatseektosaleelectricitythroughpowerdistributionsystemsthatareoperatedbyothers.
Examples:electricpowerbrokers;electricpowerdistributionsystems
Description:Establishmentswithinthisindustryareprimarilyengagedindistributingmerchantwholesaleofautomotivescrap,industrialscrap,andotherrecycleablematerials.
Examples:autowreckers;bottles,waste,merchantwholesalers;glassscrapmerchantwholesalers;ragsmerchantwholesalers;tires,scrap,merchantwholesalers;wastematerialsmerchantwholesalers
Total Establishments in Sample: 117Total Responding Establishments:105
Total Establishments Reporting Green Jobs:23
Green Economic Category Selected the Most:RenewableEnergyandAlternativeFuels
Green Jobs listed within industry: Managers,AllOther(11-9199);ComplianceOfficers(13-1041);MarketResearchAnalystsandMarketingSpecialists(13-1161);BusinessOperationsSpecialists,AllOther(13-1199);EnvironmentalEngineers(17-2081);EnvironmentalScientistsandSpecialists,IncludingHealth(19-2041);CustomerServiceRepresentatives(43-4051);ConstructionandRelatedWorkers,AllOther(47-4099);PowerPlantOperators(51-8013)
Method most frequently cited to prepare current workers to produce green products within industry:On-the-jobtrainingandTuitionassistanceforcollegecourses
Electric Power DistributionNAICS Code 221122
Recyclable Material Merchant WholesalersNAICS Code 423930
Total Establishments in Sample: 48Total Responding Establishments:15
Total Establishments Reporting Green Jobs:6
Green Economic Category Selected the Most:EnvironmentalCleanupandRestorationandWaste
CleanupandMitigation
Green Jobs listed within industry:GeneralandOperationsManagers(11-1021);MarketResearchAnalystsandMarketingSpecialists(13-1161);PublicRelationshipSpecialists(27-3031);First-LineSupervisorsofMechanics,Installers,andRepairers(49-1011);First-LineSupervisorsofProductionandOperatingWorkers(51-1011);HeavyandTractor-TrailerTruckDrivers(53-3032);ProductionWorkers,AllOther(51-9199)Method most frequently cited to prepare current workers to produce green products within industry:On-the-jobtrainingandhireonlyworkerswithgreenqualifications
Industry Spotlights
Page17
Top Green Jobs
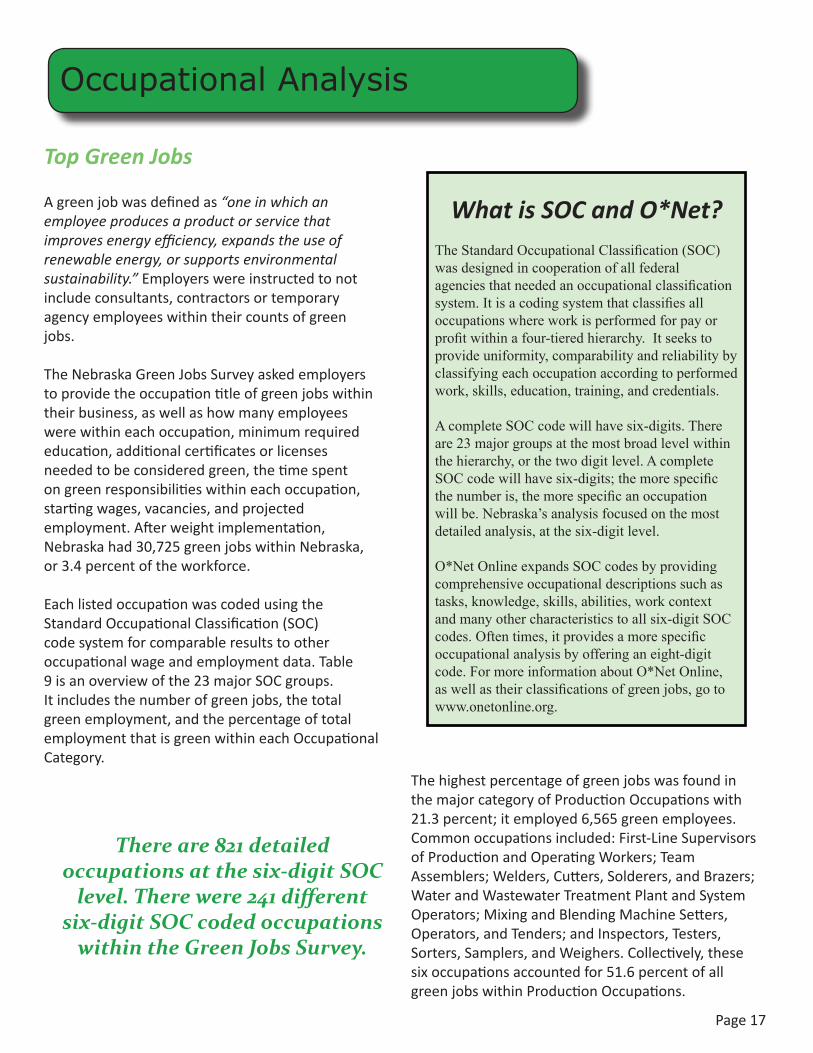
Agreenjobwasdefinedas“one in which an employee produces a product or service that improves energy efficiency, expands the use of renewable energy, or supports environmental sustainability.” Employerswereinstructedtonotincludeconsultants,contractorsortemporaryagencyemployeeswithintheircountsofgreenjobs.
TheNebraskaGreenJobsSurveyaskedemployerstoprovidetheoccupationtitleofgreenjobswithintheirbusiness,aswellashowmanyemployeeswerewithineachoccupation,minimumrequirededucation,additionalcertificatesorlicensesneededtobeconsideredgreen,thetimespentongreenresponsibilitieswithineachoccupation,startingwages,vacancies,andprojectedemployment.Afterweightimplementation,Nebraskahad30,725greenjobswithinNebraska,or3.4percentoftheworkforce.
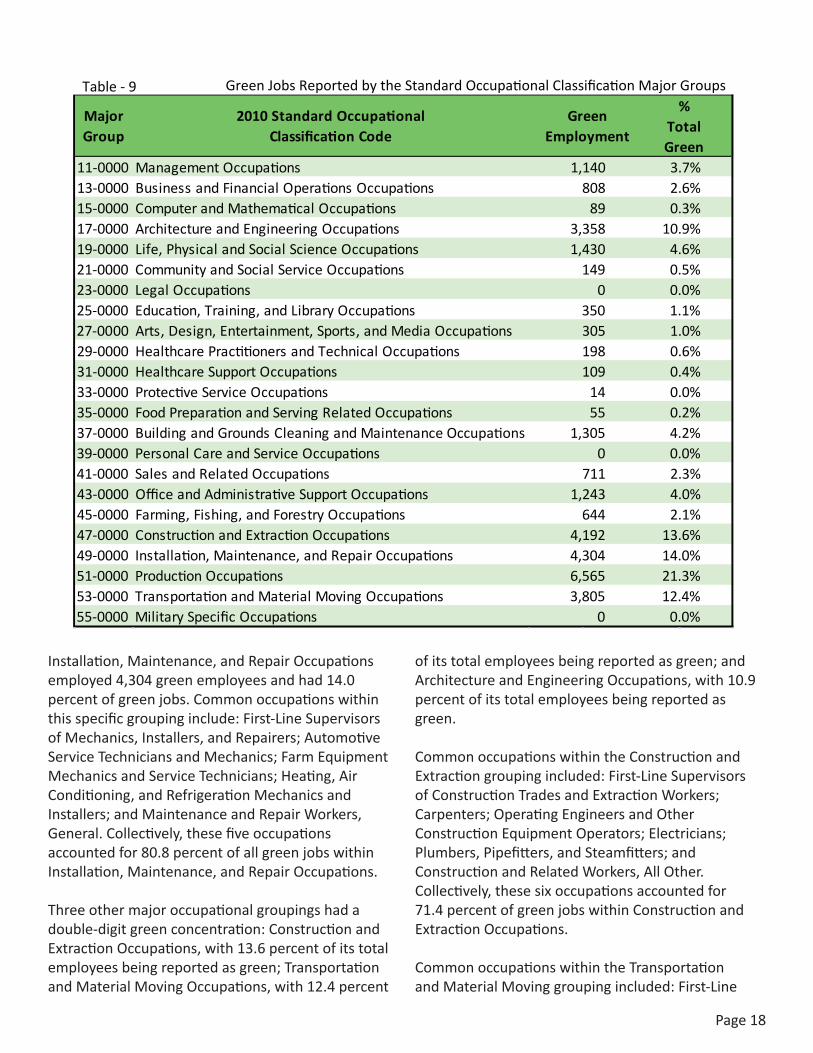
EachlistedoccupationwascodedusingtheStandardOccupationalClassification(SOC)codesystemforcomparableresultstootheroccupationalwageandemploymentdata.Table9isanoverviewofthe23majorSOCgroups.Itincludesthenumberofgreenjobs,thetotalgreenemployment,andthepercentageoftotalemploymentthatisgreenwithineachOccupationalCategory.
ThehighestpercentageofgreenjobswasfoundinthemajorcategoryofProductionOccupationswith21.3percent;itemployed6,565greenemployees.Commonoccupationsincluded:First-LineSupervisorsofProductionandOperatingWorkers;TeamAssemblers;Welders,Cutters,Solderers,andBrazers;WaterandWastewaterTreatmentPlantandSystemOperators;MixingandBlendingMachineSetters,Operators,andTenders;andInspectors,Testers,Sorters,Samplers,andWeighers.Collectively,thesesixoccupationsaccountedfor51.6percentofallgreenjobswithinProductionOccupations.
Occupational Analysis
What is SOC and O*Net?The Standard Occupational Classification (SOC) was designed in cooperation of all federal agencies that needed an occupational classification system. It is a coding system that classifies all occupations where work is performed for pay or profit within a four-tiered hierarchy. It seeks to provide uniformity, comparability and reliability by classifying each occupation according to performed work, skills, education, training, and credentials.
A complete SOC code will have six-digits. There are 23 major groups at the most broad level within the hierarchy, or the two digit level. A complete SOC code will have six-digits; the more specific the number is, the more specific an occupation will be. Nebraska’s analysis focused on the most detailed analysis, at the six-digit level.
O*Net Online expands SOC codes by providing comprehensive occupational descriptions such as tasks, knowledge, skills, abilities, work context and many other characteristics to all six-digit SOC codes. Often times, it provides a more specific occupational analysis by offering an eight-digit code. For more information about O*Net Online, as well as their classifications of green jobs, go to www.onetonline.org.
There are 821 detailed occupations at the six-digit SOC
level. There were 241 different six-digit SOC coded occupations
within the Green Jobs Survey.
Page18
Installation,Maintenance,andRepairOccupationsemployed4,304greenemployeesandhad14.0percentofgreenjobs.Commonoccupationswithinthisspecificgroupinginclude:First-LineSupervisorsofMechanics,Installers,andRepairers;AutomotiveServiceTechniciansandMechanics;FarmEquipmentMechanicsandServiceTechnicians;Heating,AirConditioning,andRefrigerationMechanicsandInstallers;andMaintenanceandRepairWorkers,General.Collectively,thesefiveoccupationsaccountedfor80.8percentofallgreenjobswithinInstallation,Maintenance,andRepairOccupations.
Threeothermajoroccupationalgroupingshadadouble-digitgreenconcentration:ConstructionandExtractionOccupations,with13.6percentofitstotalemployeesbeingreportedasgreen;TransportationandMaterialMovingOccupations,with12.4percent
ofitstotalemployeesbeingreportedasgreen;andArchitectureandEngineeringOccupations,with10.9percentofitstotalemployeesbeingreportedasgreen.
CommonoccupationswithintheConstructionandExtractiongroupingincluded:First-LineSupervisorsofConstructionTradesandExtractionWorkers;Carpenters;OperatingEngineersandOtherConstructionEquipmentOperators;Electricians;Plumbers,Pipefitters,andSteamfitters;andConstructionandRelatedWorkers,AllOther.Collectively,thesesixoccupationsaccountedfor71.4percentofgreenjobswithinConstructionandExtractionOccupations.
CommonoccupationswithintheTransportationandMaterialMovinggroupingincluded:First-Line
Major Group
2010 Standard Occupational Classification Code
Green Employment
% Total Green
11-0000 Management Occupations 1,140 3.7%13-0000 Business and Financial Operations Occupations 808 2.6%15-0000 Computer and Mathematical Occupations 89 0.3%17-0000 Architecture and Engineering Occupations 3,358 10.9%19-0000 Life, Physical and Social Science Occupations 1,430 4.6%21-0000 Community and Social Service Occupations 149 0.5%23-0000 Legal Occupations 0 0.0%25-0000 Education, Training, and Library Occupations 350 1.1%27-0000 Arts, Design, Entertainment, Sports, and Media Occupations 305 1.0%29-0000 Healthcare Practitioners and Technical Occupations 198 0.6%31-0000 Healthcare Support Occupations 109 0.4%33-0000 Protective Service Occupations 14 0.0%35-0000 Food Preparation and Serving Related Occupations 55 0.2%37-0000 Building and Grounds Cleaning and Maintenance Occupations 1,305 4.2%39-0000 Personal Care and Service Occupations 0 0.0%41-0000 Sales and Related Occupations 711 2.3%43-0000 Office and Administrative Support Occupations 1,243 4.0%45-0000 Farming, Fishing, and Forestry Occupations 644 2.1%47-0000 Construction and Extraction Occupations 4,192 13.6%49-0000 Installation, Maintenance, and Repair Occupations 4,304 14.0%51-0000 Production Occupations 6,565 21.3%53-0000 Transportation and Material Moving Occupations 3,805 12.4%55-0000 Military Specific Occupations 0 0.0%
Table - 9 Green Jobs Reported by the Standard Occupational Classification Major Groups
Page19
SupervisorsofHelpers,Laborers,andMaterialMovers,Hand;HeavyandTractor-TrailerTruckDrivers;IndustrialTruckandTractorOperators;LaborersandFreight,StockandMaterialMovers,Hand;andRefuseandRecyclableMaterialCollectors.Collectively,thesefiveoccupationsaccountedfor91.1percentofgreenjobswithinTransportationandMaterialMovingOccupations.
CommonoccupationswithintheArchitectureandEngineeringgroupingincluded:Architects,ExceptLandscapeandNaval;CivilEngineers;IndustrialEngineers;MechanicalEngineers;ArchitecturalandCivilDrafters;andCivilEngineeringTechnicians.Collectively,thesesixoccupationsaccountedfor77.8percentofallgreenjobswithinArchitectureandEngineeringOccupations.
Despitesmallergreenconcentrationlevels,therewereseveraloccupationalgroupingsthatreportedafairamountofgreenjobsforadecentamountofgreenemployment.Life,PhysicalandSocialScienceOccupationshadatotalof1,430greenemployees.BuildingandGroundsCleaningandMaintenanceOccupationshad1,305greenemployees.ManagementOccupationsreported1,140greenemployees.
Therewereonlythreemajoroccupationgroupswithoutanygreenjobswithinthem:LegalOccupations,PersonalCareandServiceOccupations,andMilitarySpecificOccupations.ExamplesofoccupationsfoundinLegalOccupationsincludeLawyersandCourtReporters.ExamplesofoccupationswithinthePersonalCareandServiceOccupationsare:AnimalTrainers;Hairdressers;ChildcareWorkers;andTravelGuides.Finally,examplesofMilitarySpecificOccupationsincludeSpecialForcesOfficersandRadarandSonarTechnicians.
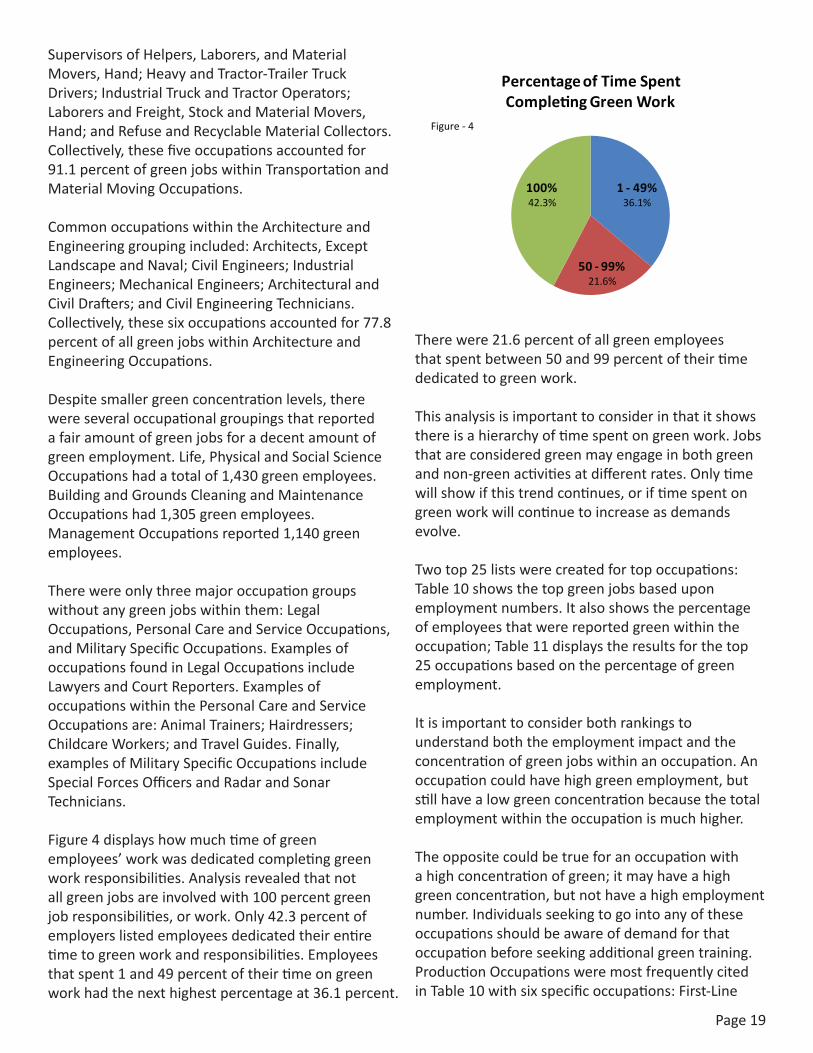
Figure4displayshowmuchtimeofgreenemployees’workwasdedicatedcompletinggreenworkresponsibilities.Analysisrevealedthatnotallgreenjobsareinvolvedwith100percentgreenjobresponsibilities,orwork.Only42.3percentofemployerslistedemployeesdedicatedtheirentiretimetogreenworkandresponsibilities.Employeesthatspent1and49percentoftheirtimeongreenworkhadthenexthighestpercentageat36.1percent.
Therewere21.6percentofallgreenemployeesthatspentbetween50and99percentoftheirtimededicatedtogreenwork.
Thisanalysisisimportanttoconsiderinthatitshowsthereisahierarchyoftimespentongreenwork.Jobsthatareconsideredgreenmayengageinbothgreenandnon-greenactivitiesatdifferentrates.Onlytimewillshowifthistrendcontinues,oriftimespentongreenworkwillcontinuetoincreaseasdemandsevolve.
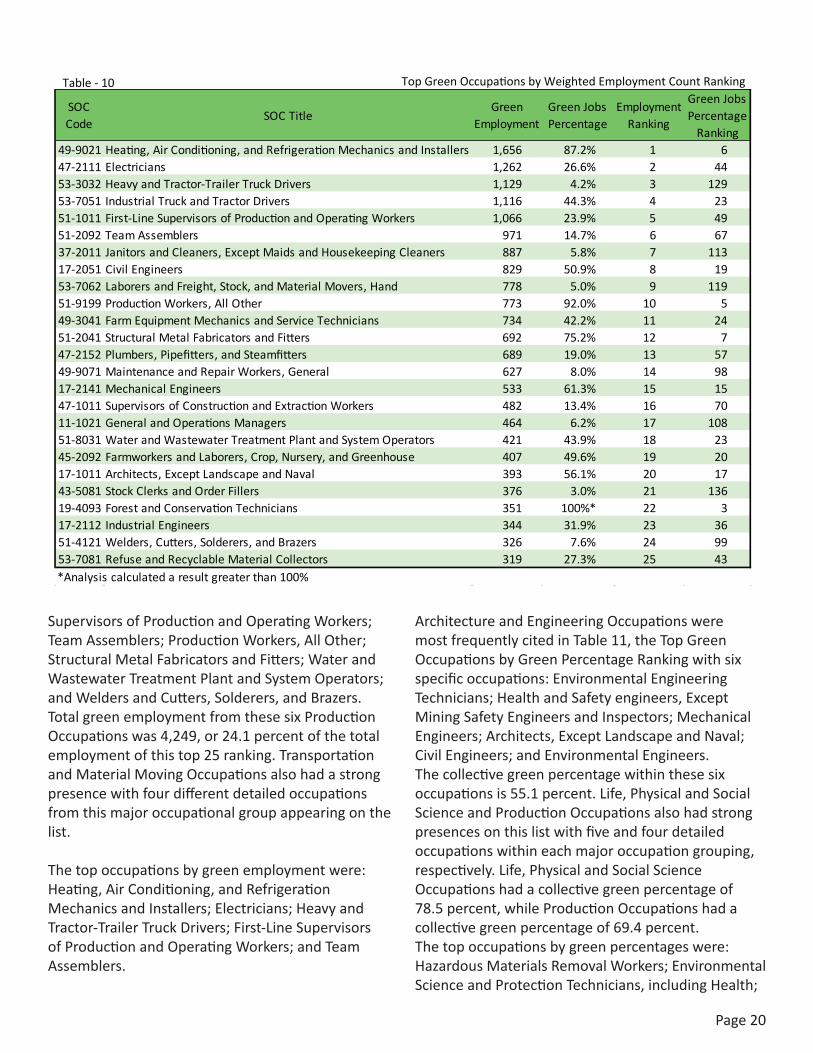
Twotop25listswerecreatedfortopoccupations:Table10showsthetopgreenjobsbaseduponemploymentnumbers.Italsoshowsthepercentageofemployeesthatwerereportedgreenwithintheoccupation;Table11displaystheresultsforthetop25occupationsbasedonthepercentageofgreenemployment.
Itisimportanttoconsiderbothrankingstounderstandboththeemploymentimpactandtheconcentrationofgreenjobswithinanoccupation.Anoccupationcouldhavehighgreenemployment,butstillhavealowgreenconcentrationbecausethetotalemploymentwithintheoccupationismuchhigher.
Theoppositecouldbetrueforanoccupationwithahighconcentrationofgreen;itmayhaveahighgreenconcentration,butnothaveahighemploymentnumber.Individualsseekingtogointoanyoftheseoccupationsshouldbeawareofdemandforthatoccupationbeforeseekingadditionalgreentraining.ProductionOccupationsweremostfrequentlycitedinTable10withsixspecificoccupations:First-Line
1 - 49% 36.1%
50 - 99% 21.6%
100%42.3%
Percentage of Time Spent Completing Green Work
Figure - 4
Page20
SupervisorsofProductionandOperatingWorkers;TeamAssemblers;ProductionWorkers,AllOther;StructuralMetalFabricatorsandFitters;WaterandWastewaterTreatmentPlantandSystemOperators;andWeldersandCutters,Solderers,andBrazers.TotalgreenemploymentfromthesesixProductionOccupationswas4,249,or24.1percentofthetotalemploymentofthistop25ranking.TransportationandMaterialMovingOccupationsalsohadastrongpresencewithfourdifferentdetailedoccupationsfromthismajoroccupationalgroupappearingonthelist.
Thetopoccupationsbygreenemploymentwere:Heating,AirConditioning,andRefrigerationMechanicsandInstallers;Electricians;HeavyandTractor-TrailerTruckDrivers;First-LineSupervisorsofProductionandOperatingWorkers;andTeamAssemblers.
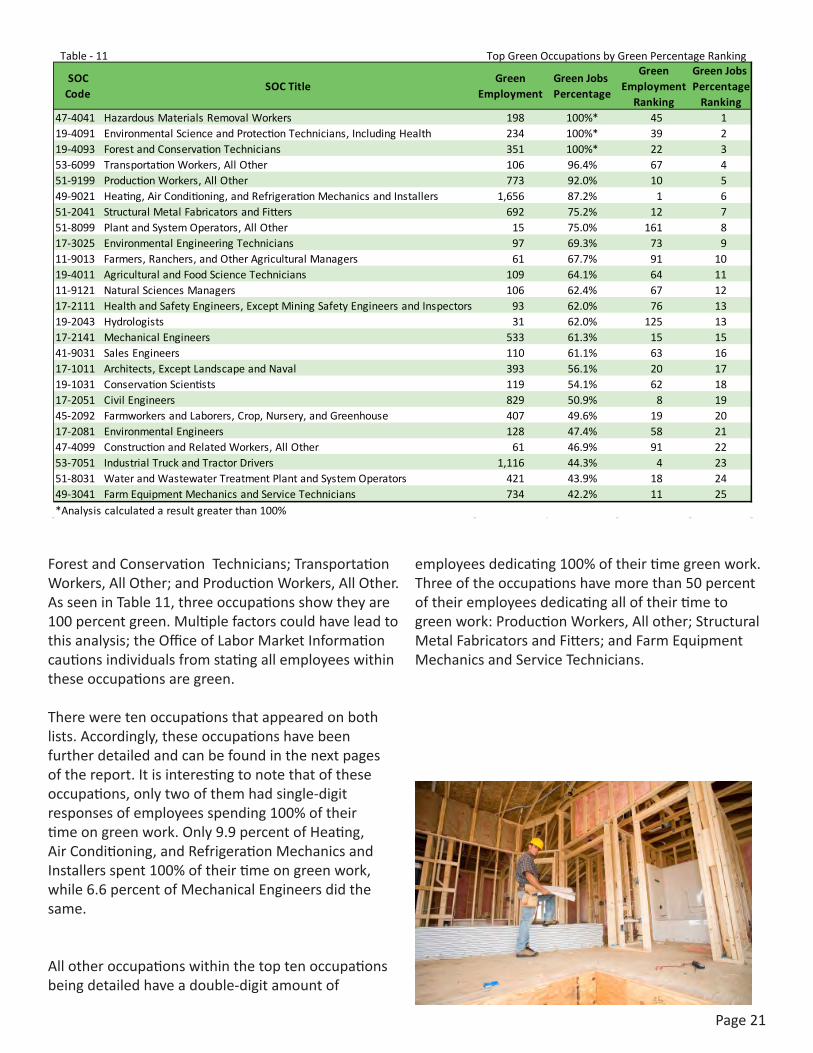
ArchitectureandEngineeringOccupationsweremostfrequentlycitedinTable11,theTopGreenOccupationsbyGreenPercentageRankingwithsixspecificoccupations:EnvironmentalEngineeringTechnicians;HealthandSafetyengineers,ExceptMiningSafetyEngineersandInspectors;MechanicalEngineers;Architects,ExceptLandscapeandNaval;CivilEngineers;andEnvironmentalEngineers.Thecollectivegreenpercentagewithinthesesixoccupationsis55.1percent.Life,PhysicalandSocialScienceandProductionOccupationsalsohadstrongpresencesonthislistwithfiveandfourdetailedoccupationswithineachmajoroccupationgrouping,respectively.Life,PhysicalandSocialScienceOccupationshadacollectivegreenpercentageof78.5percent,whileProductionOccupationshadacollectivegreenpercentageof69.4percent.Thetopoccupationsbygreenpercentageswere:HazardousMaterialsRemovalWorkers;EnvironmentalScienceandProtectionTechnicians,includingHealth;
SOC Code
SOC TitleGreen
EmploymentGreen Jobs Percentage
Employment Ranking
Green Jobs Percentage
Ranking49-9021 Heating, Air Conditioning, and Refrigeration Mechanics and Installers 1,656 87.2% 1 647-2111 Electricians 1,262 26.6% 2 4453-3032 Heavy and Tractor-Trailer Truck Drivers 1,129 4.2% 3 12953-7051 Industrial Truck and Tractor Drivers 1,116 44.3% 4 2351-1011 First-Line Supervisors of Production and Operating Workers 1,066 23.9% 5 4951-2092 Team Assemblers 971 14.7% 6 6737-2011 Janitors and Cleaners, Except Maids and Housekeeping Cleaners 887 5.8% 7 11317-2051 Civil Engineers 829 50.9% 8 1953-7062 Laborers and Freight, Stock, and Material Movers, Hand 778 5.0% 9 11951-9199 Production Workers, All Other 773 92.0% 10 549-3041 Farm Equipment Mechanics and Service Technicians 734 42.2% 11 2451-2041 Structural Metal Fabricators and Fitters 692 75.2% 12 747-2152 Plumbers, Pipefitters, and Steamfitters 689 19.0% 13 5749-9071 Maintenance and Repair Workers, General 627 8.0% 14 9817-2141 Mechanical Engineers 533 61.3% 15 1547-1011 Supervisors of Construction and Extraction Workers 482 13.4% 16 7011-1021 General and Operations Managers 464 6.2% 17 10851-8031 Water and Wastewater Treatment Plant and System Operators 421 43.9% 18 2345-2092 Farmworkers and Laborers, Crop, Nursery, and Greenhouse 407 49.6% 19 2017-1011 Architects, Except Landscape and Naval 393 56.1% 20 1743-5081 Stock Clerks and Order Fillers 376 3.0% 21 13619-4093 Forest and Conservation Technicians 351 100%* 22 317-2112 Industrial Engineers 344 31.9% 23 3651-4121 Welders, Cutters, Solderers, and Brazers 326 7.6% 24 9953-7081 Refuse and Recyclable Material Collectors 319 27.3% 25 43*Analysis calculated a result greater than 100%
Table - 10 Top Green Occupations by Weighted Employment Count Ranking
Page21
ForestandConservationTechnicians;TransportationWorkers,AllOther;andProductionWorkers,AllOther.AsseeninTable11,threeoccupationsshowtheyare100percentgreen.Multiplefactorscouldhaveleadtothisanalysis;theOfficeofLaborMarketInformationcautionsindividualsfromstatingallemployeeswithintheseoccupationsaregreen.
Thereweretenoccupationsthatappearedonbothlists.Accordingly,theseoccupationshavebeenfurtherdetailedandcanbefoundinthenextpagesofthereport.Itisinterestingtonotethatoftheseoccupations,onlytwoofthemhadsingle-digitresponsesofemployeesspending100%oftheirtimeongreenwork.Only9.9percentofHeating,AirConditioning,andRefrigerationMechanicsandInstallersspent100%oftheirtimeongreenwork,while6.6percentofMechanicalEngineersdidthesame.
Allotheroccupationswithinthetoptenoccupationsbeingdetailedhaveadouble-digitamountof
employeesdedicating100%oftheirtimegreenwork.Threeoftheoccupationshavemorethan50percentoftheiremployeesdedicatingalloftheirtimetogreenwork:ProductionWorkers,Allother;StructuralMetalFabricatorsandFitters;andFarmEquipmentMechanicsandServiceTechnicians.
SOC Code
SOC TitleGreen
EmploymentGreen Jobs Percentage
Green Employment
Ranking
Green Jobs Percentage
Ranking47-4041 Hazardous Materials Removal Workers 198 100%* 45 119-4091 Environmental Science and Protection Technicians, Including Health 234 100%* 39 219-4093 Forest and Conservation Technicians 351 100%* 22 353-6099 Transportation Workers, All Other 106 96.4% 67 451-9199 Production Workers, All Other 773 92.0% 10 549-9021 Heating, Air Conditioning, and Refrigeration Mechanics and Installers 1,656 87.2% 1 651-2041 Structural Metal Fabricators and Fitters 692 75.2% 12 751-8099 Plant and System Operators, All Other 15 75.0% 161 817-3025 Environmental Engineering Technicians 97 69.3% 73 911-9013 Farmers, Ranchers, and Other Agricultural Managers 61 67.7% 91 1019-4011 Agricultural and Food Science Technicians 109 64.1% 64 1111-9121 Natural Sciences Managers 106 62.4% 67 1217-2111 Health and Safety Engineers, Except Mining Safety Engineers and Inspectors 93 62.0% 76 1319-2043 Hydrologists 31 62.0% 125 1317-2141 Mechanical Engineers 533 61.3% 15 1541-9031 Sales Engineers 110 61.1% 63 1617-1011 Architects, Except Landscape and Naval 393 56.1% 20 1719-1031 Conservation Scientists 119 54.1% 62 1817-2051 Civil Engineers 829 50.9% 8 1945-2092 Farmworkers and Laborers, Crop, Nursery, and Greenhouse 407 49.6% 19 2017-2081 Environmental Engineers 128 47.4% 58 2147-4099 Construction and Related Workers, All Other 61 46.9% 91 2253-7051 Industrial Truck and Tractor Drivers 1,116 44.3% 4 2351-8031 Water and Wastewater Treatment Plant and System Operators 421 43.9% 18 2449-3041 Farm Equipment Mechanics and Service Technicians 734 42.2% 11 25*Analysis calculated a result greater than 100%
Table - 11 Top Green Occupations by Green Percentage Ranking
Page22
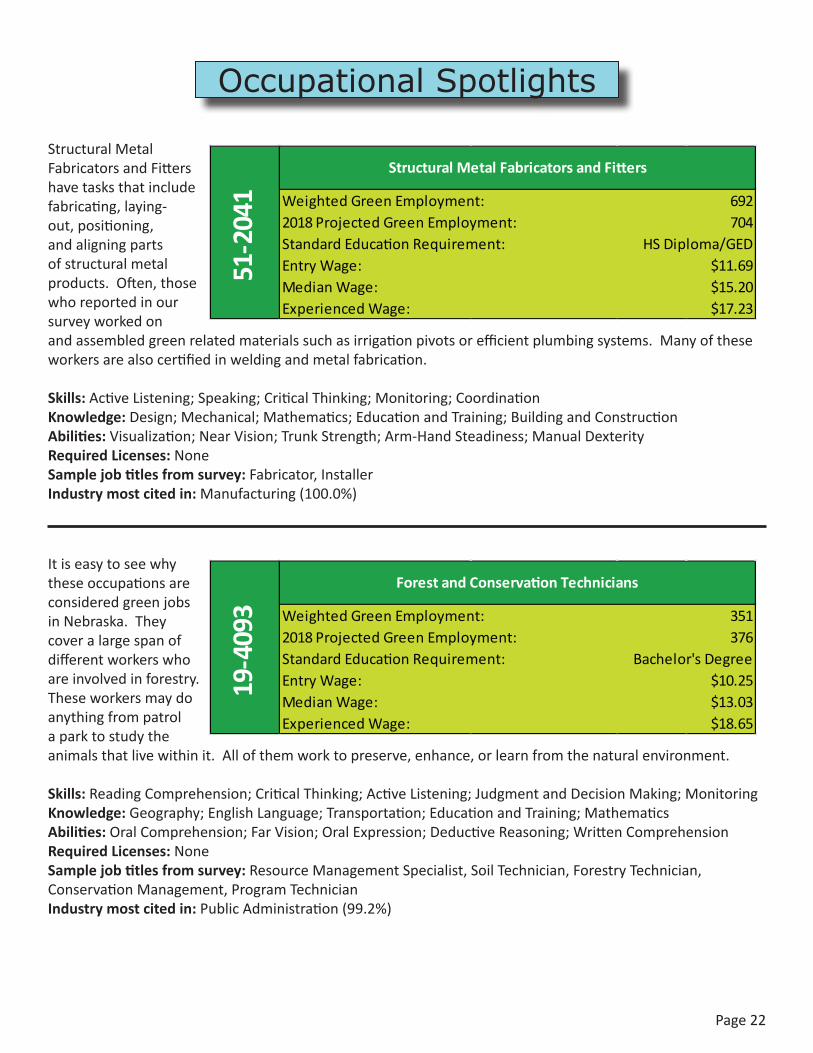
ItiseasytoseewhytheseoccupationsareconsideredgreenjobsinNebraska.Theycoveralargespanofdifferentworkerswhoareinvolvedinforestry.Theseworkersmaydoanythingfrompatrolaparktostudytheanimalsthatlivewithinit.Allofthemworktopreserve,enhance,orlearnfromthenaturalenvironment.
Skills:ReadingComprehension;CriticalThinking;ActiveListening;JudgmentandDecisionMaking;MonitoringKnowledge:Geography;EnglishLanguage;Transportation;EducationandTraining;MathematicsAbilities:OralComprehension;FarVision;OralExpression;DeductiveReasoning;WrittenComprehensionRequired Licenses: NoneSample job titles from survey: ResourceManagementSpecialist,SoilTechnician,ForestryTechnician,ConservationManagement,ProgramTechnicianIndustry most cited in:PublicAdministration(99.2%)
Weighted Green Employment:2018 Projected Green Employment:Standard Education Requirement:Entry Wage:Median Wage:Experienced Wage:
$13.03$18.65
19-4
093
Forest and Conservation Technicians
351376
Bachelor's Degree$10.25
StructuralMetalFabricatorsandFittershavetasksthatincludefabricating,laying-out,positioning,andaligningpartsofstructuralmetalproducts.Often,thosewhoreportedinoursurveyworkedonandassembledgreenrelatedmaterialssuchasirrigationpivotsorefficientplumbingsystems.Manyoftheseworkersarealsocertifiedinweldingandmetalfabrication.
Skills:ActiveListening;Speaking;CriticalThinking;Monitoring;CoordinationKnowledge:Design;Mechanical;Mathematics;EducationandTraining;BuildingandConstructionAbilities:Visualization;NearVision;TrunkStrength;Arm-HandSteadiness;ManualDexterityRequired Licenses:NoneSample job titles from survey:Fabricator,InstallerIndustry most cited in:Manufacturing(100.0%)
Weighted Green Employment:2018 Projected Green Employment:Standard Education Requirement:Entry Wage:Median Wage:Experienced Wage:
$15.20$17.23
51-2
041
Structural Metal Fabricators and Fitters
692704
HS Diploma/GED$11.69
Occupational Spotlights
Page23
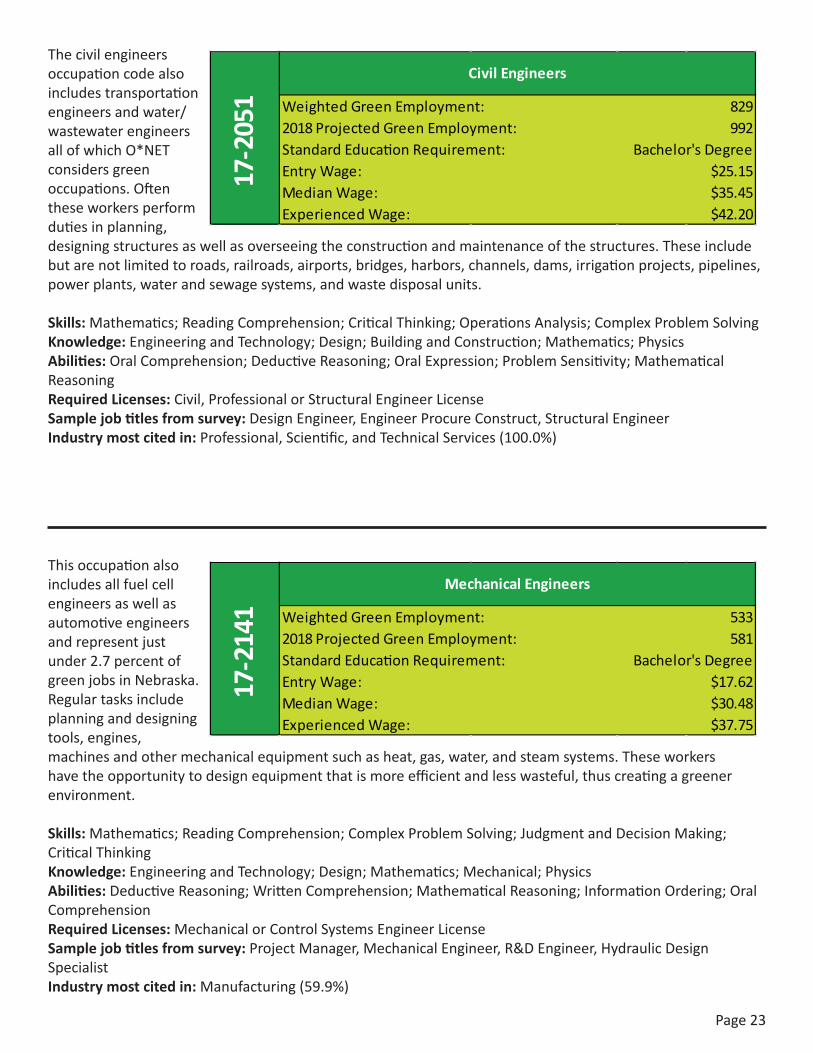
Thecivilengineersoccupationcodealsoincludestransportationengineersandwater/wastewaterengineersallofwhichO*NETconsidersgreenoccupations.Oftentheseworkersperformdutiesinplanning,designingstructuresaswellasoverseeingtheconstructionandmaintenanceofthestructures.Theseincludebutarenotlimitedtoroads,railroads,airports,bridges,harbors,channels,dams,irrigationprojects,pipelines,powerplants,waterandsewagesystems,andwastedisposalunits.
Skills:Mathematics;ReadingComprehension;CriticalThinking;OperationsAnalysis;ComplexProblemSolvingKnowledge:EngineeringandTechnology;Design;BuildingandConstruction;Mathematics;PhysicsAbilities:OralComprehension;DeductiveReasoning;OralExpression;ProblemSensitivity;MathematicalReasoningRequired Licenses:Civil,ProfessionalorStructuralEngineerLicenseSample job titles from survey:DesignEngineer,EngineerProcureConstruct,StructuralEngineerIndustry most cited in:Professional,Scientific,andTechnicalServices(100.0%)
Weighted Green Employment:2018 Projected Green Employment:Standard Education Requirement:Entry Wage:Median Wage:Experienced Wage:
$35.45$42.20
17-2
051
Civil Engineers
829992
Bachelor's Degree$25.15
Thisoccupationalsoincludesallfuelcellengineersaswellasautomotiveengineersandrepresentjustunder2.7percentofgreenjobsinNebraska.Regulartasksincludeplanninganddesigningtools,engines,machinesandothermechanicalequipmentsuchasheat,gas,water,andsteamsystems.Theseworkershavetheopportunitytodesignequipmentthatismoreefficientandlesswasteful,thuscreatingagreenerenvironment.
Skills: Mathematics;ReadingComprehension;ComplexProblemSolving;JudgmentandDecisionMaking;CriticalThinkingKnowledge:EngineeringandTechnology;Design;Mathematics;Mechanical;PhysicsAbilities:DeductiveReasoning;WrittenComprehension;MathematicalReasoning;InformationOrdering;OralComprehensionRequired Licenses:MechanicalorControlSystemsEngineerLicenseSample job titles from survey:ProjectManager,MechanicalEngineer,R&DEngineer,HydraulicDesignSpecialistIndustry most cited in:Manufacturing(59.9%)
Weighted Green Employment:2018 Projected Green Employment:Standard Education Requirement:Entry Wage:Median Wage:Experienced Wage:
$30.48$37.75
17-2
141
Mechanical Engineers
533581
Bachelor's Degree$17.62
Page24
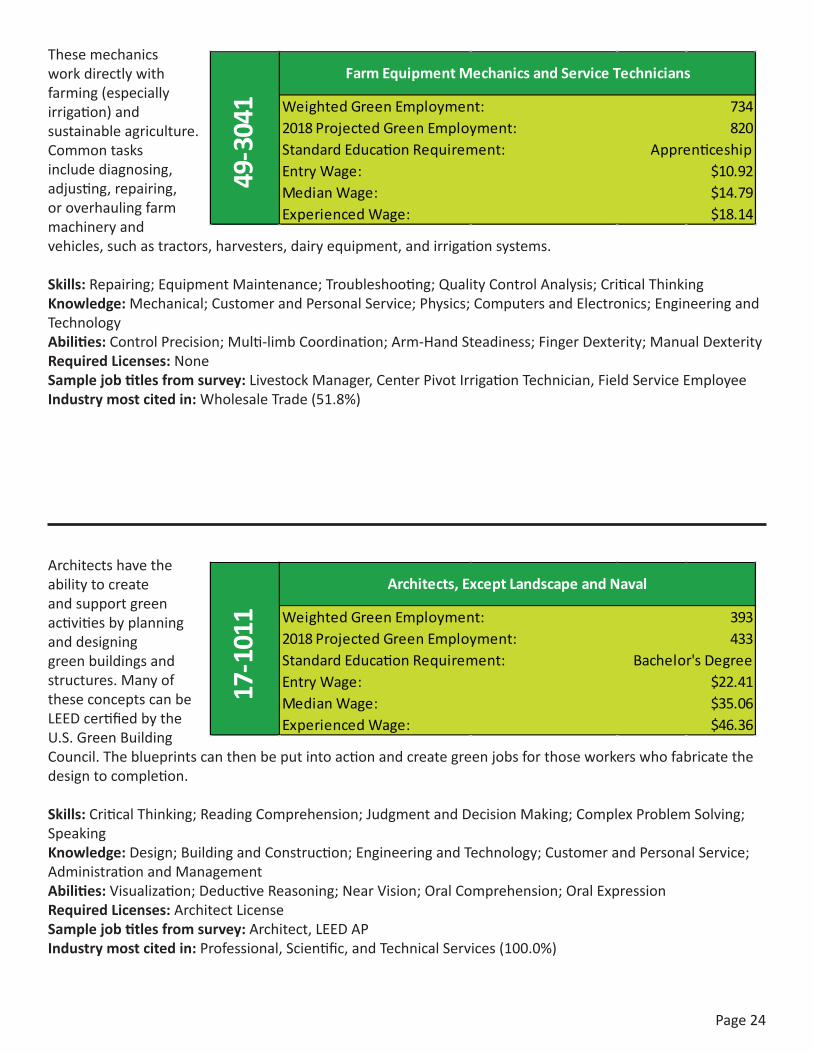
Thesemechanicsworkdirectlywithfarming(especiallyirrigation)andsustainableagriculture.Commontasksincludediagnosing,adjusting,repairing,oroverhaulingfarmmachineryandvehicles,suchastractors,harvesters,dairyequipment,andirrigationsystems.
Skills:Repairing;EquipmentMaintenance;Troubleshooting;QualityControlAnalysis;CriticalThinkingKnowledge:Mechanical;CustomerandPersonalService;Physics;ComputersandElectronics;EngineeringandTechnologyAbilities:ControlPrecision;Multi-limbCoordination;Arm-HandSteadiness;FingerDexterity;ManualDexterityRequired Licenses:NoneSample job titles from survey:LivestockManager,CenterPivotIrrigationTechnician,FieldServiceEmployeeIndustry most cited in:WholesaleTrade(51.8%)
Weighted Green Employment:2018 Projected Green Employment:Standard Education Requirement:Entry Wage:Median Wage:Experienced Wage:
$14.79$18.14
49-3
041
Farm Equipment Mechanics and Service Technicians
734820
Apprenticeship$10.92
Architectshavetheabilitytocreateandsupportgreenactivitiesbyplanninganddesigninggreenbuildingsandstructures.ManyoftheseconceptscanbeLEEDcertifiedbytheU.S.GreenBuildingCouncil.Theblueprintscanthenbeputintoactionandcreategreenjobsforthoseworkerswhofabricatethedesigntocompletion.
Skills:CriticalThinking;ReadingComprehension;JudgmentandDecisionMaking;ComplexProblemSolving;SpeakingKnowledge: Design;BuildingandConstruction;EngineeringandTechnology;CustomerandPersonalService;AdministrationandManagementAbilities:Visualization;DeductiveReasoning;NearVision;OralComprehension;OralExpressionRequired Licenses:ArchitectLicenseSample job titles from survey:Architect,LEEDAPIndustry most cited in:Professional,Scientific,andTechnicalServices(100.0%)
Weighted Green Employment:2018 Projected Green Employment:Standard Education Requirement:Entry Wage:Median Wage:Experienced Wage:
$35.06$46.36
17-1
011
Architects, Except Landscape and Naval
393433
Bachelor's Degree$22.41
Page25
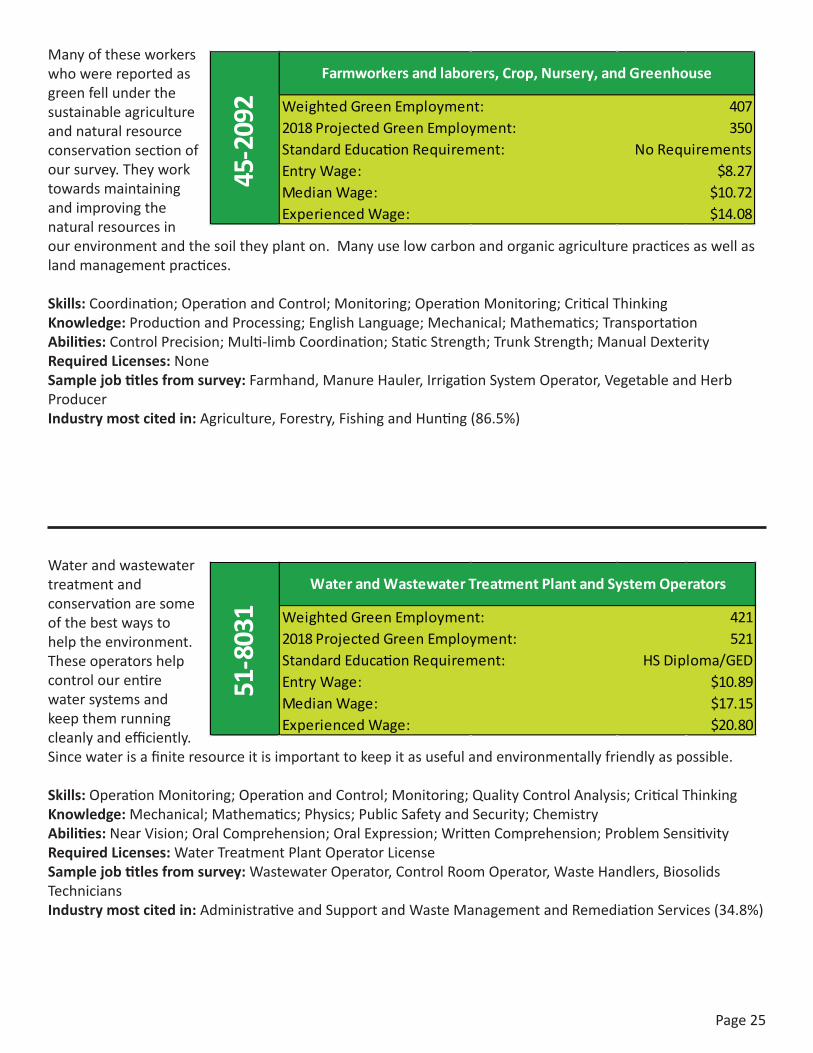
Waterandwastewatertreatmentandconservationaresomeofthebestwaystohelptheenvironment.Theseoperatorshelpcontrolourentirewatersystemsandkeepthemrunningcleanlyandefficiently.Sincewaterisafiniteresourceitisimportanttokeepitasusefulandenvironmentallyfriendlyaspossible.
Skills:OperationMonitoring;OperationandControl;Monitoring;QualityControlAnalysis;CriticalThinkingKnowledge:Mechanical;Mathematics;Physics;PublicSafetyandSecurity;ChemistryAbilities:NearVision;OralComprehension;OralExpression;WrittenComprehension;ProblemSensitivityRequired Licenses: WaterTreatmentPlantOperatorLicenseSample job titles from survey:WastewaterOperator,ControlRoomOperator,WasteHandlers,BiosolidsTechniciansIndustry most cited in:AdministrativeandSupportandWasteManagementandRemediationServices(34.8%)
Weighted Green Employment:2018 Projected Green Employment:Standard Education Requirement:Entry Wage:Median Wage:Experienced Wage:
$17.15$20.80
51-8
031
Water and Wastewater Treatment Plant and System Operators
421521
HS Diploma/GED$10.89
Manyoftheseworkerswhowerereportedasgreenfellunderthesustainableagricultureandnaturalresourceconservationsectionofoursurvey.Theyworktowardsmaintainingandimprovingthenaturalresourcesinourenvironmentandthesoiltheyplanton.Manyuselowcarbonandorganicagriculturepracticesaswellaslandmanagementpractices.
Skills:Coordination;OperationandControl;Monitoring;OperationMonitoring;CriticalThinkingKnowledge: ProductionandProcessing;EnglishLanguage;Mechanical;Mathematics;TransportationAbilities:ControlPrecision;Multi-limbCoordination;StaticStrength;TrunkStrength;ManualDexterityRequired Licenses:NoneSample job titles from survey:Farmhand,ManureHauler,IrrigationSystemOperator,VegetableandHerbProducerIndustry most cited in:Agriculture,Forestry,FishingandHunting(86.5%)
Weighted Green Employment:2018 Projected Green Employment:Standard Education Requirement:Entry Wage:Median Wage:Experienced Wage:
$10.72$14.08
45-2
092
Farmworkers and laborers, Crop, Nursery, and Greenhouse
407350
No Requirements$8.27
Page26
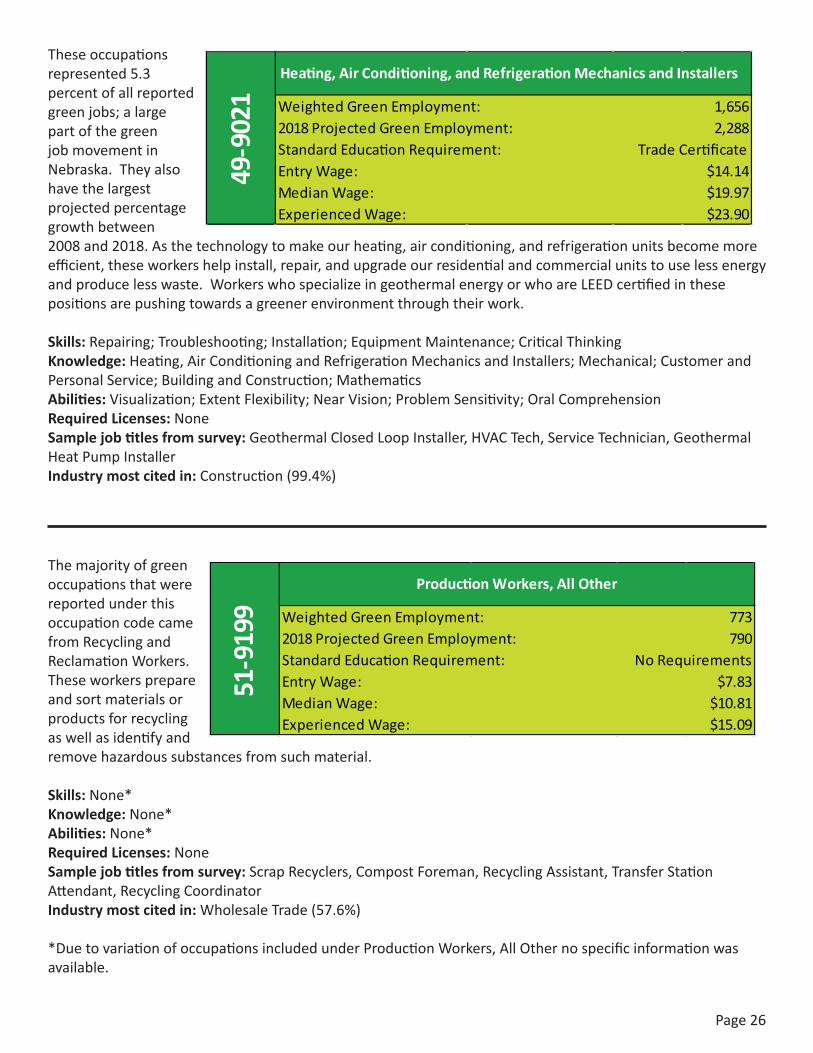
Theseoccupationsrepresented5.3percentofallreportedgreenjobs;alargepartofthegreenjobmovementinNebraska.Theyalsohavethelargestprojectedpercentagegrowthbetween2008and2018.Asthetechnologytomakeourheating,airconditioning,andrefrigerationunitsbecomemoreefficient,theseworkershelpinstall,repair,andupgradeourresidentialandcommercialunitstouselessenergyandproducelesswaste.WorkerswhospecializeingeothermalenergyorwhoareLEEDcertifiedinthesepositionsarepushingtowardsagreenerenvironmentthroughtheirwork.
Skills:Repairing;Troubleshooting;Installation;EquipmentMaintenance;CriticalThinkingKnowledge:Heating,AirConditioningandRefrigerationMechanicsandInstallers;Mechanical;CustomerandPersonalService;BuildingandConstruction;MathematicsAbilities:Visualization;ExtentFlexibility;NearVision;ProblemSensitivity;OralComprehensionRequired Licenses:NoneSample job titles from survey:GeothermalClosedLoopInstaller,HVACTech,ServiceTechnician,GeothermalHeatPumpInstallerIndustry most cited in:Construction(99.4%)
Weighted Green Employment:2018 Projected Green Employment:Standard Education Requirement:Entry Wage:Median Wage:Experienced Wage:
$14.14$19.97$23.90
Heating, Air Conditioning, and Refrigeration Mechanics and Installers
49-9
021 1,656
2,288Trade Certificate
ThemajorityofgreenoccupationsthatwerereportedunderthisoccupationcodecamefromRecyclingandReclamationWorkers.Theseworkersprepareandsortmaterialsorproductsforrecyclingaswellasidentifyandremovehazardoussubstancesfromsuchmaterial.
Skills:None*Knowledge: None*Abilities:None*Required Licenses:NoneSample job titles from survey:ScrapRecyclers,CompostForeman,RecyclingAssistant,TransferStationAttendant,RecyclingCoordinatorIndustry most cited in: WholesaleTrade(57.6%)
*DuetovariationofoccupationsincludedunderProductionWorkers,AllOthernospecificinformationwasavailable.
Weighted Green Employment:2018 Projected Green Employment:Standard Education Requirement:Entry Wage:Median Wage:Experienced Wage:
$10.81$15.09
51-9
199
Production Workers, All Other
773790
No Requirements$7.83
Page27
Top Occupations by Green Activity
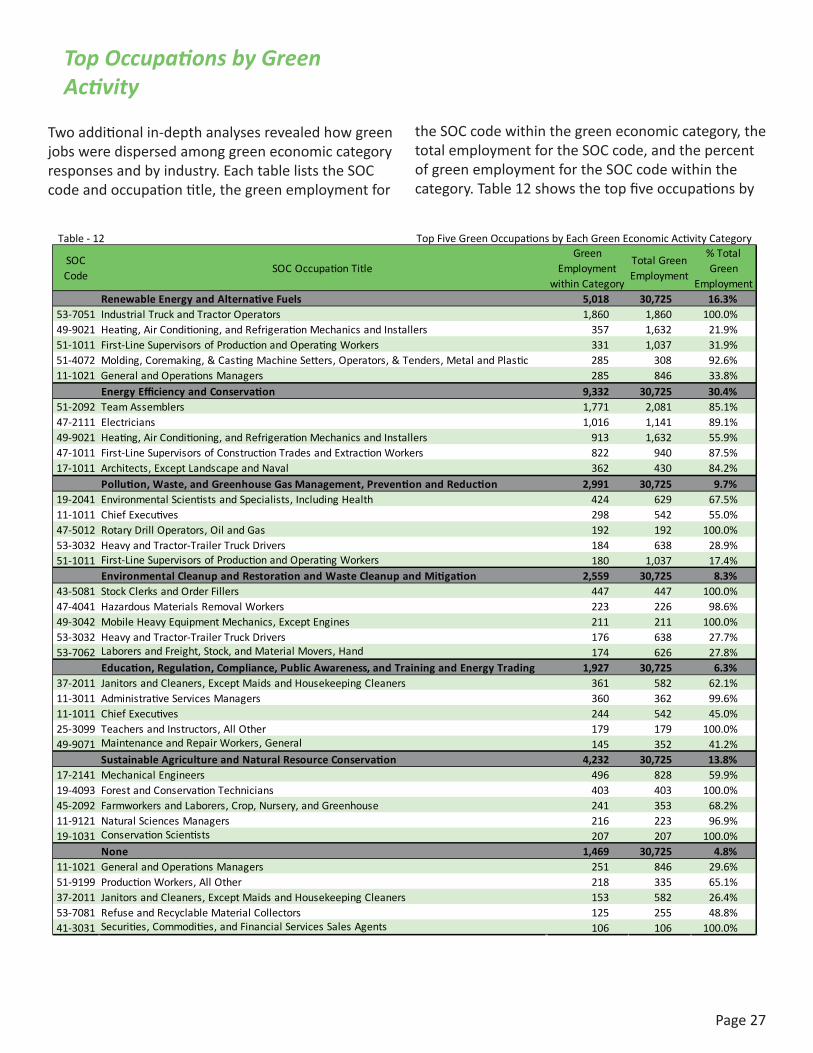
Twoadditionalin-depthanalysesrevealedhowgreenjobsweredispersedamonggreeneconomiccategoryresponsesandbyindustry.EachtableliststheSOCcodeandoccupationtitle,thegreenemploymentfor
theSOCcodewithinthegreeneconomiccategory,thetotalemploymentfortheSOCcode,andthepercentofgreenemploymentfortheSOCcodewithinthecategory.Table12showsthetopfiveoccupationsby
Table - 12 Top Five Green Occupations by Each Green Economic Activity Category
SOC Code
SOC Occupation TitleGreen
Employment within Category
Total Green Employment
% Total Green
Employment5,018 30,725 16.3%
53-7051 Industrial Truck and Tractor Operators 1,860 1,860 100.0%49-9021 Heating, Air Conditioning, and Refrigeration Mechanics and Installers 357 1,632 21.9%51-1011 First-Line Supervisors of Production and Operating Workers 331 1,037 31.9%51-4072 Molding, Coremaking, & Casting Machine Setters, Operators, & Tenders, Metal and Plastic 285 308 92.6%11-1021 General and Operations Managers 285 846 33.8%
9,332 30,725 30.4%51-2092 Team Assemblers 1,771 2,081 85.1%47-2111 Electricians 1,016 1,141 89.1%49-9021 Heating, Air Conditioning, and Refrigeration Mechanics and Installers 913 1,632 55.9%47-1011 First-Line Supervisors of Construction Trades and Extraction Workers 822 940 87.5%17-1011 Architects, Except Landscape and Naval 362 430 84.2%
2,991 30,725 9.7%19-2041 Environmental Scientists and Specialists, Including Health 424 629 67.5%11-1011 Chief Executives 298 542 55.0%47-5012 Rotary Drill Operators, Oil and Gas 192 192 100.0%53-3032 Heavy and Tractor-Trailer Truck Drivers 184 638 28.9%51-1011 First-Line Supervisors of Production and Operating Workers 180 1,037 17.4%
2,559 30,725 8.3%43-5081 Stock Clerks and Order Fillers 447 447 100.0%47-4041 Hazardous Materials Removal Workers 223 226 98.6%49-3042 Mobile Heavy Equipment Mechanics, Except Engines 211 211 100.0%53-3032 Heavy and Tractor-Trailer Truck Drivers 176 638 27.7%53-7062 Laborers and Freight, Stock, and Material Movers, Hand 174 626 27.8%
1,927 30,725 6.3%37-2011 Janitors and Cleaners, Except Maids and Housekeeping Cleaners 361 582 62.1%11-3011 Administrative Services Managers 360 362 99.6%11-1011 Chief Executives 244 542 45.0%25-3099 Teachers and Instructors, All Other 179 179 100.0%49-9071 Maintenance and Repair Workers, General 145 352 41.2%
4,232 30,725 13.8%17-2141 Mechanical Engineers 496 828 59.9%19-4093 Forest and Conservation Technicians 403 403 100.0%45-2092 Farmworkers and Laborers, Crop, Nursery, and Greenhouse 241 353 68.2%11-9121 Natural Sciences Managers 216 223 96.9%19-1031 Conservation Scientists 207 207 100.0%
1,469 30,725 4.8%11-1021 General and Operations Managers 251 846 29.6%51-9199 Production Workers, All Other 218 335 65.1%37-2011 Janitors and Cleaners, Except Maids and Housekeeping Cleaners 153 582 26.4%53-7081 Refuse and Recyclable Material Collectors 125 255 48.8%41-3031 Securities, Commodities, and Financial Services Sales Agents 106 106 100.0%
Renewable Energy and Alternative Fuels
Sustainable Agriculture and Natural Resource Conservation
None
Pollution, Waste, and Greenhouse Gas Management, Prevention and Reduction
Energy Efficiency and Conservation
Environmental Cleanup and Restoration and Waste Cleanup and Mitigation
Education, Regulation, Compliance, Public Awareness, and Training and Energy Trading
Page28
eachgreeneconomiccategory.TheEnergyEfficiencyandConservationgreeneconomiccategoryhad66differentoccupationscitedwithinthecategory,thehighestnumberofoccurrencesoutofallthecategories.
ThetopgreenjobwiththehighestemploymentintheEnergyEfficiencyandConservationcategorywasTeamAssemblers.Accordingly,85.1percentofTeamAssemblerswerelistedunderthisgreeneconomiccategory.Heating,AirConditioning,andRefrigerationMechanicsandInstallerswereamongthetopcitedoccupationsintwodifferentgreeneconomiccategories:55.9percentoftheseemployeeswerereportedintheEnergyEfficiencyandConservationcategoryand21.9percentoftheseemployeeswerereportedintheRenewableEnergyandAlternativeFuelscategory.
Severalgreenjobswerereportedasoperatingonlyinbusinessesthatengagedinasinglegreeneconomicactivity.AllIndustrialTruckandTractorsOperatorsemployeeswereemployedbybusinessesthatcitedRenewableEnergyandAlternativeFuelsastheirprimarygreeneconomicactivity.Likewise,allRotaryDrillOperators,OilandGasemployeeswerereportedinbusinessescitingPollution,Waste,andGreenhouseGasManagement,Prevention,andReductionastheirprimarygreeneconomicactivity.BothgreeneconomiccategoriesEnvironmentalCleanupandRestorationandWasteCleanupandMitigationandSustainableAgricultureandNaturalResourceConservationhadtwogreenjobs(ofthetopfive)thatweresolelylocatedwithintheeconomiccategory.
Businessesthatstatedtheydidnotfitintoanygreeneconomicactivitylisted27differentgreenjobs.GeneralandOperationsManagershadthelargestemploymentcountwithinthiscategory;however,only29.6percentofthesemanagersfitinsidethiscategory.Onegreenjob,Securities,Commodities,andFinancialServicesSales,hadallofits106greenemploymentcountwithinthisgreeneconomiccategory.
AfulllistingofoccupationsbyeachgreeneconomiccategorycanbefoundintheAppendixintableA16-A22.
Top Occupations by Industry
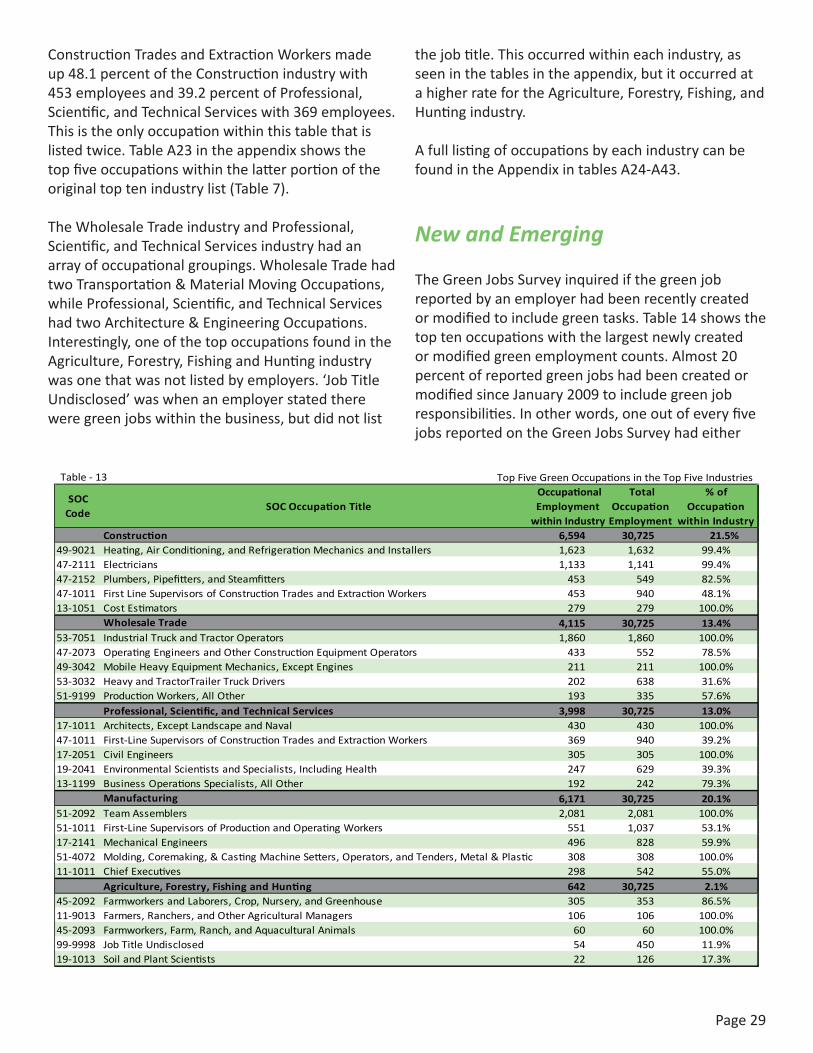
Table13showsthetopfiveoccupationswithinthetopfiveindustries.ConstructionandManufacturingaccountedforthehighestoccurrencesofgreenemploymentwith6,594and6,171greenemployees,respectively.Notsurprisingly,businesseswithintheConstructionindustrycited57differentoccupationswithinthissector.BusinessesintheProfessional,Scientific,andTechnicalServicesreported47differentoccupations,followedbyManufacturingbusinessesthatreported39differentoccupations.
ThetopoccupationsintheConstructionindustrywereHeating,AirConditioning,andRefrigerationMechanicsandInstallers;Electricians;Plumbers,Pipefitters,andSteamfitters;First-LineSupervisorsofConstructionTradesandExtractionWorkers;andCostEstimators.AsnotedinTable10,Heating,AirConditioning,andRefrigerationMechanicsandInstallers,Electricians,andPlumbers,Pipefitters,andSteamFitterswerelistedastopgreenoccupationsbyemploymentcount.Table13showsthatthevastmajorityofindividualswithintheseoccupationsarelocatedintheConstructionindustry.
ThetopoccupationsfortheManufacturingindustrywere:TeamAssemblers;First-LineSupervisorsofProductionandOperatingWorkers;MechanicalEngineers;Molding,Coremaking&CastingMachineSetters,Operators,andTenders,Metal&Plastic;andChiefExecutives.Thelatteroccupation,ChiefExecutives,isonlyoneoftwoManagementOccupationsthatcanbefoundwithinTable13,suggestingthatmanagersfoundintheManufacturingindustryaremorelikelytohavegreenresponsibilitiesthanperhapsmanagersinotherindustries.Multiplegreenjobswerereportedasonlyoccurringinasingularindustry.CostestimatorsweresolelyreportedbyConstructionbusinesses,yielding279greenjobs.AllreportedArchitects,ExceptLandscapeandNaval,aswellasCivilEngineers,werelocatedintheProfessional,Scientific,andTechnicalServices.Manyoftheseoccupationsinsingularindustriesmadesense.
Therewereotheroccupationsthathadthetopfiveemploymentcountswithineachindustrythatalsomadesense.Forinstance,First-LineSupervisorsof
Page29
ConstructionTradesandExtractionWorkersmadeup48.1percentoftheConstructionindustrywith453employeesand39.2percentofProfessional,Scientific,andTechnicalServiceswith369employees.Thisistheonlyoccupationwithinthistablethatislistedtwice.TableA23intheappendixshowsthetopfiveoccupationswithinthelatterportionoftheoriginaltoptenindustrylist(Table7).
TheWholesaleTradeindustryandProfessional,Scientific,andTechnicalServicesindustryhadanarrayofoccupationalgroupings.WholesaleTradehadtwoTransportation&MaterialMovingOccupations,whileProfessional,Scientific,andTechnicalServiceshadtwoArchitecture&EngineeringOccupations.Interestingly,oneofthetopoccupationsfoundintheAgriculture,Forestry,FishingandHuntingindustrywasonethatwasnotlistedbyemployers.‘JobTitleUndisclosed’waswhenanemployerstatedthereweregreenjobswithinthebusiness,butdidnotlist
thejobtitle.Thisoccurredwithineachindustry,asseeninthetablesintheappendix,butitoccurredatahigherratefortheAgriculture,Forestry,Fishing,andHuntingindustry.
AfulllistingofoccupationsbyeachindustrycanbefoundintheAppendixintablesA24-A43.
New and Emerging
TheGreenJobsSurveyinquiredifthegreenjobreportedbyanemployerhadbeenrecentlycreatedormodifiedtoincludegreentasks.Table14showsthetoptenoccupationswiththelargestnewlycreatedormodifiedgreenemploymentcounts.Almost20percentofreportedgreenjobshadbeencreatedormodifiedsinceJanuary2009toincludegreenjobresponsibilities.Inotherwords,oneoutofeveryfivejobsreportedontheGreenJobsSurveyhadeither
Table - 13 Top Five Green Occupations in the Top Five Industries
SOC Code
SOC Occupation Title Occupational Employment
Total
Employment
% of Occupation
within Industry6,594 30,725 21.5%
49-9021 Heating, Air Conditioning, and Refrigeration Mechanics and Installers 1,623 1,632 99.4%47-2111 Electricians 1,133 1,141 99.4%47-2152 Plumbers, Pipefitters, and Steamfitters 453 549 82.5%47-1011 First Line Supervisors of Construction Trades and Extraction Workers 453 940 48.1%13-1051 Cost Estimators 279 279 100.0%
4,115 30,725 13.4%53-7051 Industrial Truck and Tractor Operators 1,860 1,860 100.0%47-2073 Operating Engineers and Other Construction Equipment Operators 433 552 78.5%49-3042 Mobile Heavy Equipment Mechanics, Except Engines 211 211 100.0%53-3032 Heavy and TractorTrailer Truck Drivers 202 638 31.6%51-9199 Production Workers, All Other 193 335 57.6%
3,998 30,725 13.0%17-1011 Architects, Except Landscape and Naval 430 430 100.0%47-1011 First-Line Supervisors of Construction Trades and Extraction Workers 369 940 39.2%17-2051 Civil Engineers 305 305 100.0%19-2041 Environmental Scientists and Specialists, Including Health 247 629 39.3%13-1199 Business Operations Specialists, All Other 192 242 79.3%
6,171 30,725 20.1%51-2092 Team Assemblers 2,081 2,081 100.0%51-1011 First-Line Supervisors of Production and Operating Workers 551 1,037 53.1%17-2141 Mechanical Engineers 496 828 59.9%51-4072 Molding, Coremaking, & Casting Machine Setters, Operators, and Tenders, Metal & Plastic 308 308 100.0%11-1011 Chief Executives 298 542 55.0%
642 30,725 2.1%45-2092 Farmworkers and Laborers, Crop, Nursery, and Greenhouse 305 353 86.5%11-9013 Farmers, Ranchers, and Other Agricultural Managers 106 106 100.0%45-2093 Farmworkers, Farm, Ranch, and Aquacultural Animals 60 60 100.0%99-9998 Job Title Undisclosed 54 450 11.9%19-1013 Soil and Plant Scientists 22 126 17.3%
Construction
Agriculture, Forestry, Fishing and Hunting
Manufacturing
Professional, Scientific, and Technical Services
Wholesale Trade
within Industry Occupation
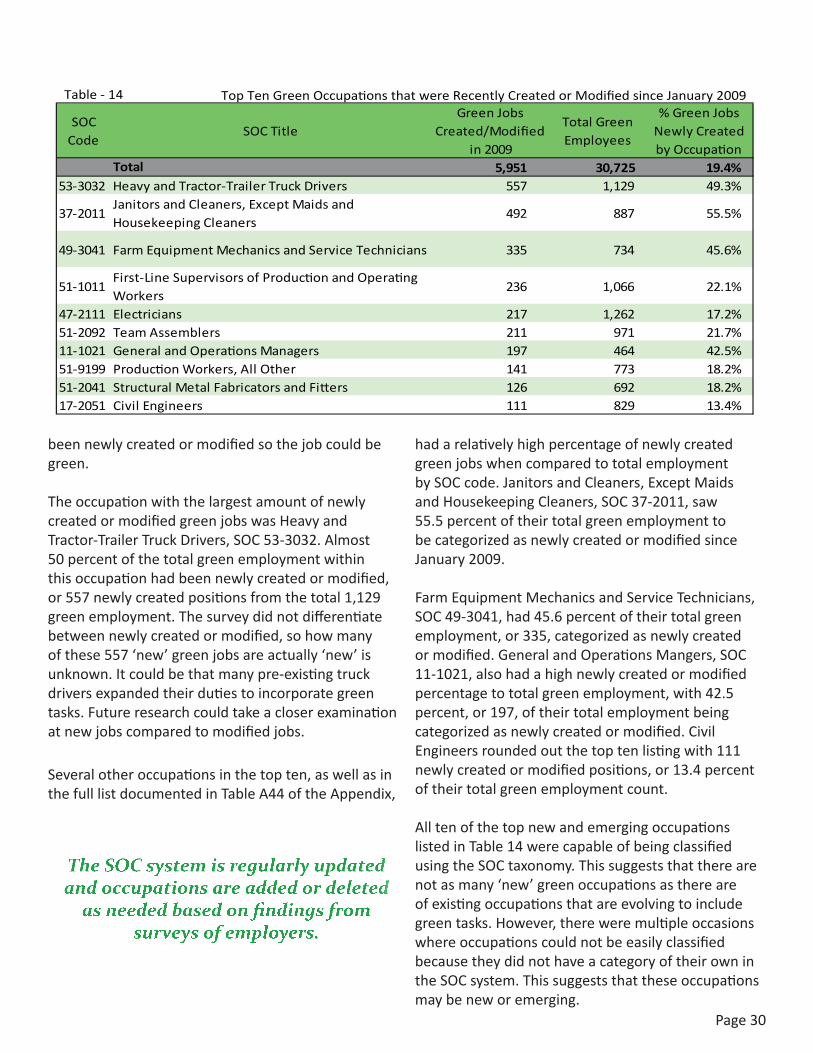
Page30
beennewlycreatedormodifiedsothejobcouldbegreen.
TheoccupationwiththelargestamountofnewlycreatedormodifiedgreenjobswasHeavyandTractor-TrailerTruckDrivers,SOC53-3032.Almost50percentofthetotalgreenemploymentwithinthisoccupationhadbeennewlycreatedormodified,or557newlycreatedpositionsfromthetotal1,129greenemployment.Thesurveydidnotdifferentiatebetweennewlycreatedormodified,sohowmanyofthese557‘new’greenjobsareactually‘new’isunknown.Itcouldbethatmanypre-existingtruckdriversexpandedtheirdutiestoincorporategreentasks.Futureresearchcouldtakeacloserexaminationatnewjobscomparedtomodifiedjobs.
Severalotheroccupationsinthetopten,aswellasinthefulllistdocumentedinTableA44oftheAppendix,
hadarelativelyhighpercentageofnewlycreatedgreenjobswhencomparedtototalemploymentbySOCcode.JanitorsandCleaners,ExceptMaidsandHousekeepingCleaners,SOC37-2011,saw55.5percentoftheirtotalgreenemploymenttobecategorizedasnewlycreatedormodifiedsinceJanuary2009.
FarmEquipmentMechanicsandServiceTechnicians,SOC49-3041,had45.6percentoftheirtotalgreenemployment,or335,categorizedasnewlycreatedormodified.GeneralandOperationsMangers,SOC11-1021,alsohadahighnewlycreatedormodifiedpercentagetototalgreenemployment,with42.5percent,or197,oftheirtotalemploymentbeingcategorizedasnewlycreatedormodified.CivilEngineersroundedoutthetoptenlistingwith111newlycreatedormodifiedpositions,or13.4percentoftheirtotalgreenemploymentcount.
AlltenofthetopnewandemergingoccupationslistedinTable14werecapableofbeingclassifiedusingtheSOCtaxonomy.Thissuggeststhattherearenotasmany‘new’greenoccupationsasthereareofexistingoccupationsthatareevolvingtoincludegreentasks.However,thereweremultipleoccasionswhereoccupationscouldnotbeeasilyclassifiedbecausetheydidnothaveacategoryoftheirownintheSOCsystem.Thissuggeststhattheseoccupationsmaybeneworemerging.
SOC Code
SOC TitleGreen Jobs
Created/Modified in 2009
Total Green Employees
% Green Jobs Newly Created by Occupation
5,951 30,725 19.4%53-3032 Heavy and Tractor-Trailer Truck Drivers 557 1,129 49.3%
37-2011Janitors and Cleaners, Except Maids and Housekeeping Cleaners
492 887 55.5%
49-3041 Farm Equipment Mechanics and Service Technicians 335 734 45.6%
51-1011First-Line Supervisors of Production and Operating Workers
236 1,066 22.1%
47-2111 Electricians 217 1,262 17.2%51-2092 Team Assemblers 211 971 21.7%11-1021 General and Operations Managers 197 464 42.5%51-9199 Production Workers, All Other 141 773 18.2%51-2041 Structural Metal Fabricators and Fitters 126 692 18.2%17-2051 Civil Engineers 111 829 13.4%
Total
Table - 14 Top Ten Green Occupations that were Recently Created or Modified since January 2009
The SOC system is regularly updated and occupations are added or deleted
as needed based on findings from surveys of employers.

Page31
Therewere97jobtitlesthatcouldnotbeeasilyclassifiedunderaspecificsix-digitSOCcodewereplacedintoamajorgroups’‘AllOther’category.The‘AllOther’categoryisdesignedtocaptureresidualoccupationsnotelsewhereclassifiedinaspecificoccupation.
InthetoptenlistinginTable14,one‘AllOther’codeispresent:ProductionWorkers,AllOther,SOCcode51-9199.ReportedjobtitlesunderthisSOCcodeinclude:CompostForeman,RecyclingSorter,ScrapRecyclers,RecyclingAssistants,andTransferStationAttendants.Alittleover18percentofthetotalgreenemploymentwasconsiderednewlycreatedofmodifiedforthisspecificoccupation.Employersreportedthattheyprojectcreating108newpositionswithinthisreportedgreenjobwithinthenexttwoyears.Therewerenoprojectedeliminations,resulting
witha14.0percentgrowthrateoverthenexttwoyears.
SimilarpatternswerefoundinTable15,whichdetailswhatjobtitleswerereportedinthesurveythatledtothecodingintoan‘AllOther’code,aswellasinwhichindustriesthesejobscanbefound.Theadditionalsix‘AllOther’codeswere:BusinessOperationsSpecialists,AllOther;TeachersandInstructors,AllOther;ConstructionandRelatedWorkers,AllOther;Managers,AllOther;PostsecondaryTeachers,AllOther;andEngineeringTechnicians,ExceptDrafters,AllOther.BusinessOperationsSpecialists,AllOther,SOC13-1199,had40differentreportedjobtitlescomingfromindustriessuchasUtilities,Construction,andManufacturing.Alittleover20percentofthetotalemploymentwithinthisoccupationwaslistedasnewlycreatedorrecentlymodifiedbyemployers.
SOC Code
SOC Title Original Job Titles Industries citing Job Titles
51-9199Production Workers, All Other
Compost Foreman; Recycling Sorter; Recycling Assistant; Scrap Recyclers; Transfer Station Attendants; Deli workers
Administrative and Support and Waste Management and Remediation Services; Manufacturing; Construction; Wholesale Trade
13-1199Business Operations Specialists, All Other
Energy Service Specialist, Energy Efficiency Consultant, EHS Analyst, Renewable Resource Locator, LEED Consultant, Consumer Services, Sustainability Coordinator, Business Partners Program Consultant
Utilities; Construction; Manufacturing; Professional, Scientific, and Technical Services; Educational Services; Other Services (Except Public Administration); Public Administration
25-3099Teachers and Instructors, All Other
Environmental Educator; Ag & Science Teacher; Industrial Technology Teacher
Retail Trade; Educational Services; Other Services (except Public Administration)
47-4099Construction and Related Workers, All Other
Line Superindendent; Apprentice Lineperson; Hydronic Solar Installation; Weatherization Worker
Utilities; Construction; Other Services
11-9199 Managers, All Other
Renewable Energy Development Manger; EHG Manager; Conservation Director; Energy Effiencies Manager; Environmental Protection Supervisor; Manager of Safety and Regulatory Compliance
Utilities; Manufacturing; Transportation and Warehousing; Public Administration
25-1199Postsecondary Teachers, All Other
Wind Technology Instructor; Energy Operations Instructor; Renewable Fuels Instructor
Educational Services
17-3029Engineering Technicians, Except Drafters, All Other
Production Technicians; Designer; Energy Saving Mechanical & Electrical Design System; Chief Facility Manager
Manufacturing; Professional, Scientific, and Technical Services; Management of Companies and Enterprises
Table - 15 Original Job Titles and Industries of Green Jobs Coded into an ‘All Other’ Occupations
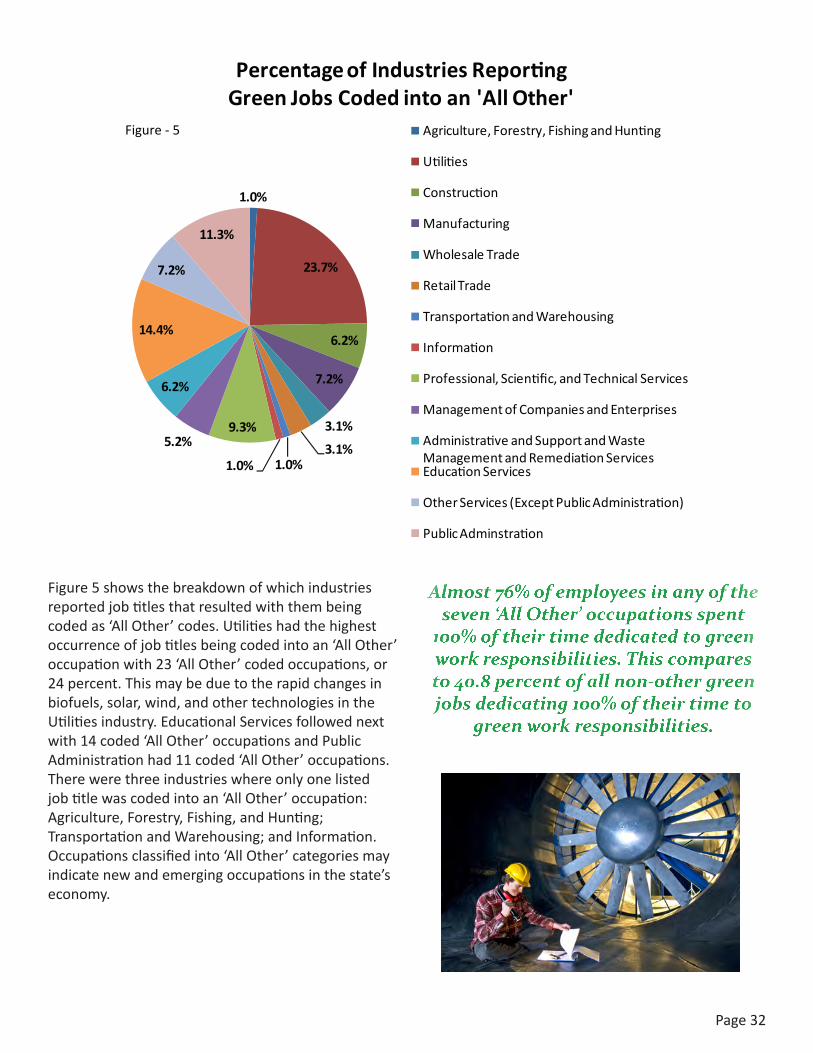
Page32
Figure5showsthebreakdownofwhichindustriesreportedjobtitlesthatresultedwiththembeingcodedas‘AllOther’codes.Utilitieshadthehighestoccurrenceofjobtitlesbeingcodedintoan‘AllOther’occupationwith23‘AllOther’codedoccupations,or24percent.Thismaybeduetotherapidchangesinbiofuels,solar,wind,andothertechnologiesintheUtilitiesindustry.EducationalServicesfollowednextwith14coded‘AllOther’occupationsandPublicAdministrationhad11coded‘AllOther’occupations.Therewerethreeindustrieswhereonlyonelistedjobtitlewascodedintoan‘AllOther’occupation:Agriculture,Forestry,Fishing,andHunting;TransportationandWarehousing;andInformation.Occupationsclassifiedinto‘AllOther’categoriesmayindicatenewandemergingoccupationsinthestate’seconomy.
Almost 76% of employees in any of the seven ‘All Other’ occupations spent
100% of their time dedicated to green work responsibilities. This compares to 40.8 percent of all non-other green jobs dedicating 100% of their time to
green work responsibilities.
1.0%
23.7%
6.2%
7.2%
3.1%
3.1%1.0%1.0%
9.3%5.2%
6.2%
14.4%
7.2%
11.3%
Percentage of Industries Reporting Green Jobs Coded into an 'All Other'
Agriculture, Forestry, Fishing and Hunting
Utilities
Construction
Manufacturing
Wholesale Trade
Retail Trade
Transportation and Warehousing
Information
Professional, Scientific, and Technical Services
Management of Companies and Enterprises
Administrative and Support and Waste Management and Remediation ServicesEducation Services
Other Services (Except Public Administration)
Public Adminstration
Figure - 5
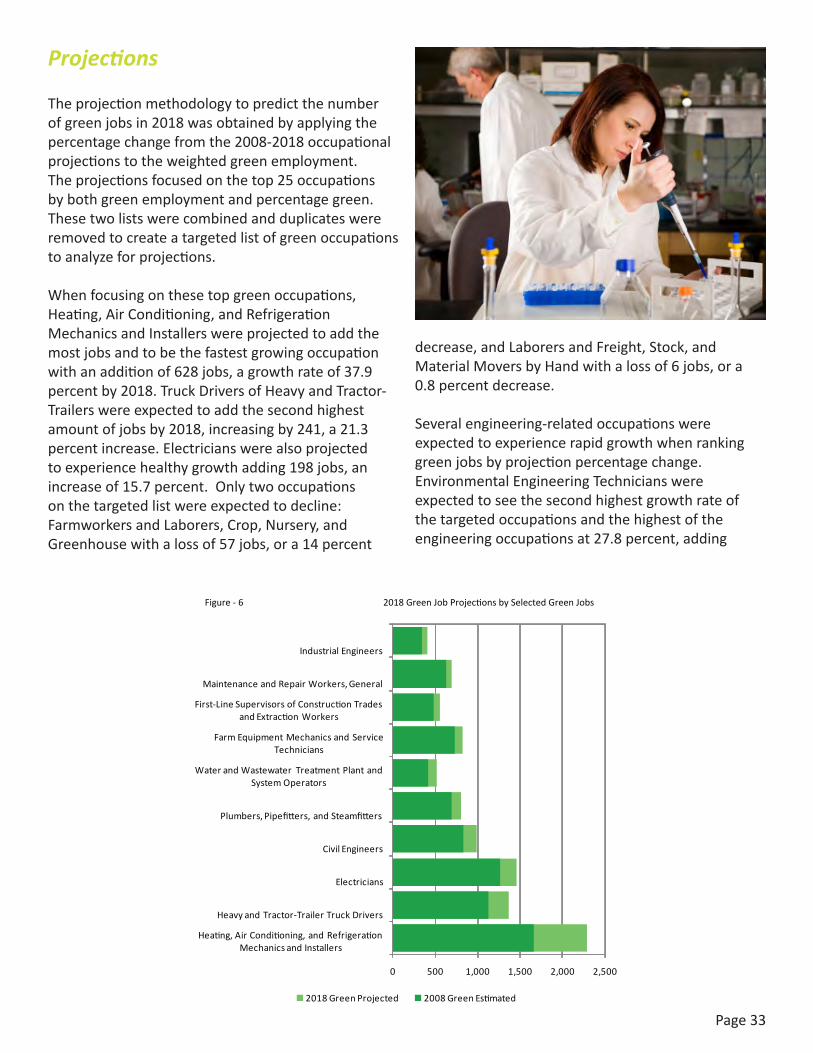
Page33
Projections
Theprojectionmethodologytopredictthenumberofgreenjobsin2018wasobtainedbyapplyingthepercentagechangefromthe2008-2018occupationalprojectionstotheweightedgreenemployment.Theprojectionsfocusedonthetop25occupationsbybothgreenemploymentandpercentagegreen.Thesetwolistswerecombinedandduplicateswereremovedtocreateatargetedlistofgreenoccupationstoanalyzeforprojections.
Whenfocusingonthesetopgreenoccupations,Heating,AirConditioning,andRefrigerationMechanicsandInstallerswereprojectedtoaddthemostjobsandtobethefastestgrowingoccupationwithanadditionof628jobs,agrowthrateof37.9percentby2018.TruckDriversofHeavyandTractor-Trailerswereexpectedtoaddthesecondhighestamountofjobsby2018,increasingby241,a21.3percentincrease.Electricianswerealsoprojectedtoexperiencehealthygrowthadding198jobs,anincreaseof15.7percent.Onlytwooccupationsonthetargetedlistwereexpectedtodecline:FarmworkersandLaborers,Crop,Nursery,andGreenhousewithalossof57jobs,ora14percent
decrease,andLaborersandFreight,Stock,andMaterialMoversbyHandwithalossof6jobs,ora0.8percentdecrease.
Severalengineering-relatedoccupationswereexpectedtoexperiencerapidgrowthwhenrankinggreenjobsbyprojectionpercentagechange.EnvironmentalEngineeringTechnicianswereexpectedtoseethesecondhighestgrowthrateofthetargetedoccupationsandthehighestoftheengineeringoccupationsat27.8percent,adding
0 500 1,000 1,500 2,000 2,500
Heating, Air Conditioning, and Refrigeration Mechanics and Installers
Heavy and Tractor-Trailer Truck Drivers
Electricians
Civil Engineers
Plumbers, Pipefitters, and Steamfitters
Water and Wastewater Treatment Plant and System Operators
Farm Equipment Mechanics and Service Technicians
First-Line Supervisors of Construction Trades and Extraction Workers
Maintenance and Repair Workers, General
Industrial Engineers
2018 Green Projected 2008 Green Estimated
Figure - 6 2018 Green Job Projections by Selected Green Jobs
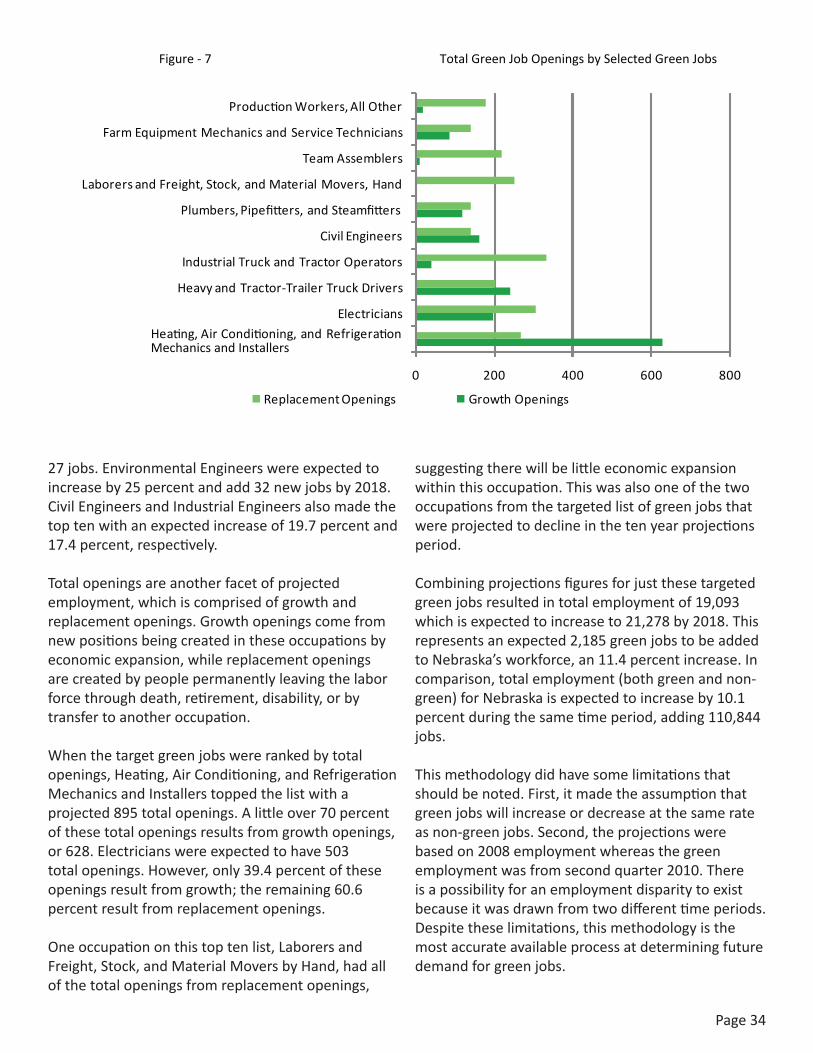
Page34
27jobs.EnvironmentalEngineerswereexpectedtoincreaseby25percentandadd32newjobsby2018.CivilEngineersandIndustrialEngineersalsomadethetoptenwithanexpectedincreaseof19.7percentand17.4percent,respectively.
Totalopeningsareanotherfacetofprojectedemployment,whichiscomprisedofgrowthandreplacementopenings.Growthopeningscomefromnewpositionsbeingcreatedintheseoccupationsbyeconomicexpansion,whilereplacementopeningsarecreatedbypeoplepermanentlyleavingthelaborforcethroughdeath,retirement,disability,orbytransfertoanotheroccupation.
Whenthetargetgreenjobswererankedbytotalopenings,Heating,AirConditioning,andRefrigerationMechanicsandInstallerstoppedthelistwithaprojected895totalopenings.Alittleover70percentofthesetotalopeningsresultsfromgrowthopenings,or628.Electricianswereexpectedtohave503totalopenings.However,only39.4percentoftheseopeningsresultfromgrowth;theremaining60.6percentresultfromreplacementopenings.
Oneoccupationonthistoptenlist,LaborersandFreight,Stock,andMaterialMoversbyHand,hadallofthetotalopeningsfromreplacementopenings,
suggestingtherewillbelittleeconomicexpansionwithinthisoccupation.Thiswasalsooneofthetwooccupationsfromthetargetedlistofgreenjobsthatwereprojectedtodeclineinthetenyearprojectionsperiod.
Combiningprojectionsfiguresforjustthesetargetedgreenjobsresultedintotalemploymentof19,093whichisexpectedtoincreaseto21,278by2018.Thisrepresentsanexpected2,185greenjobstobeaddedtoNebraska’sworkforce,an11.4percentincrease.Incomparison,totalemployment(bothgreenandnon-green)forNebraskaisexpectedtoincreaseby10.1percentduringthesametimeperiod,adding110,844jobs.
Thismethodologydidhavesomelimitationsthatshouldbenoted.First,itmadetheassumptionthatgreenjobswillincreaseordecreaseatthesamerateasnon-greenjobs.Second,theprojectionswerebasedon2008employmentwhereasthegreenemploymentwasfromsecondquarter2010.Thereisapossibilityforanemploymentdisparitytoexistbecauseitwasdrawnfromtwodifferenttimeperiods.Despitetheselimitations,thismethodologyisthemostaccurateavailableprocessatdeterminingfuturedemandforgreenjobs.
0 200 400 600 800
Heating, Air Conditioning, and Refrigeration
Electricians
Heavy and Tractor-Trailer Truck Drivers
Industrial Truck and Tractor Operators
Civil Engineers
Plumbers, Pipefitters, and Steamfitters
Laborers and Freight, Stock, and Material Movers, Hand
Team Assemblers
Farm Equipment Mechanics and Service Technicians
Production Workers, All Other
Replacement Openings Growth Openings
Figure - 7 Total Green Job Openings by Selected Green Jobs
Mechanics and Installers
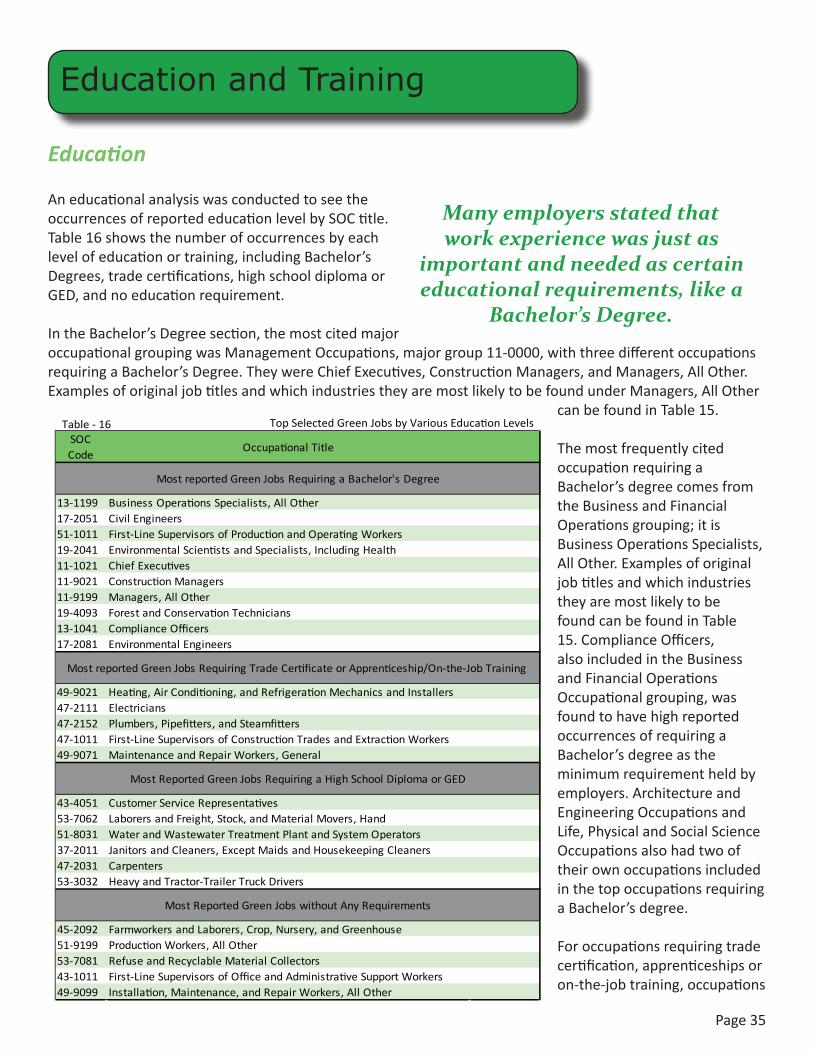
Page35
Education
AneducationalanalysiswasconductedtoseetheoccurrencesofreportededucationlevelbySOCtitle.Table16showsthenumberofoccurrencesbyeachlevelofeducationortraining,includingBachelor’sDegrees,tradecertifications,highschooldiplomaorGED,andnoeducationrequirement.
IntheBachelor’sDegreesection,themostcitedmajoroccupationalgroupingwasManagementOccupations,majorgroup11-0000,withthreedifferentoccupationsrequiringaBachelor’sDegree.TheywereChiefExecutives,ConstructionManagers,andManagers,AllOther.ExamplesoforiginaljobtitlesandwhichindustriestheyaremostlikelytobefoundunderManagers,AllOther
canbefoundinTable15.
ThemostfrequentlycitedoccupationrequiringaBachelor’sdegreecomesfromtheBusinessandFinancialOperationsgrouping;itisBusinessOperationsSpecialists,AllOther.ExamplesoforiginaljobtitlesandwhichindustriestheyaremostlikelytobefoundcanbefoundinTable15.ComplianceOfficers,alsoincludedintheBusinessandFinancialOperationsOccupationalgrouping,wasfoundtohavehighreportedoccurrencesofrequiringaBachelor’sdegreeastheminimumrequirementheldbyemployers.ArchitectureandEngineeringOccupationsandLife,PhysicalandSocialScienceOccupationsalsohadtwooftheirownoccupationsincludedinthetopoccupationsrequiringaBachelor’sdegree.
Foroccupationsrequiringtradecertification,apprenticeshipsoron-the-jobtraining,occupations
Education and Training
Table - 16 Top Selected Green Jobs by Various Education LevelsSOC Code
Occupational Title
13-1199 Business Operations Specialists, All Other17-2051 Civil Engineers51-1011 First-Line Supervisors of Production and Operating Workers19-2041 Environmental Scientists and Specialists, Including Health11-1021 Chief Executives11-9021 Construction Managers11-9199 Managers, All Other19-4093 Forest and Conservation Technicians13-1041 Compliance Officers17-2081 Environmental Engineers
49-9021 Heating, Air Conditioning, and Refrigeration Mechanics and Installers47-2111 Electricians47-2152 Plumbers, Pipefitters, and Steamfitters47-1011 First-Line Supervisors of Construction Trades and Extraction Workers49-9071 Maintenance and Repair Workers, General
43-4051 Customer Service Representatives53-7062 Laborers and Freight, Stock, and Material Movers, Hand51-8031 Water and Wastewater Treatment Plant and System Operators37-2011 Janitors and Cleaners, Except Maids and Housekeeping Cleaners47-2031 Carpenters53-3032 Heavy and Tractor-Trailer Truck Drivers
45-2092 Farmworkers and Laborers, Crop, Nursery, and Greenhouse51-9199 Production Workers, All Other53-7081 Refuse and Recyclable Material Collectors43-1011 First-Line Supervisors of Office and Administrative Support Workers49-9099 Installation, Maintenance, and Repair Workers, All Other
Most reported Green Jobs Requiring a Bachelor's Degree
Most reported Green Jobs Requiring Trade Certificate or Apprenticeship/On-the-Job Training
Most Reported Green Jobs Requiring a High School Diploma or GED
Most Reported Green Jobs without Any Requirements
Many employers stated that work experience was just as
important and needed as certain educational requirements, like a
Bachelor’s Degree.
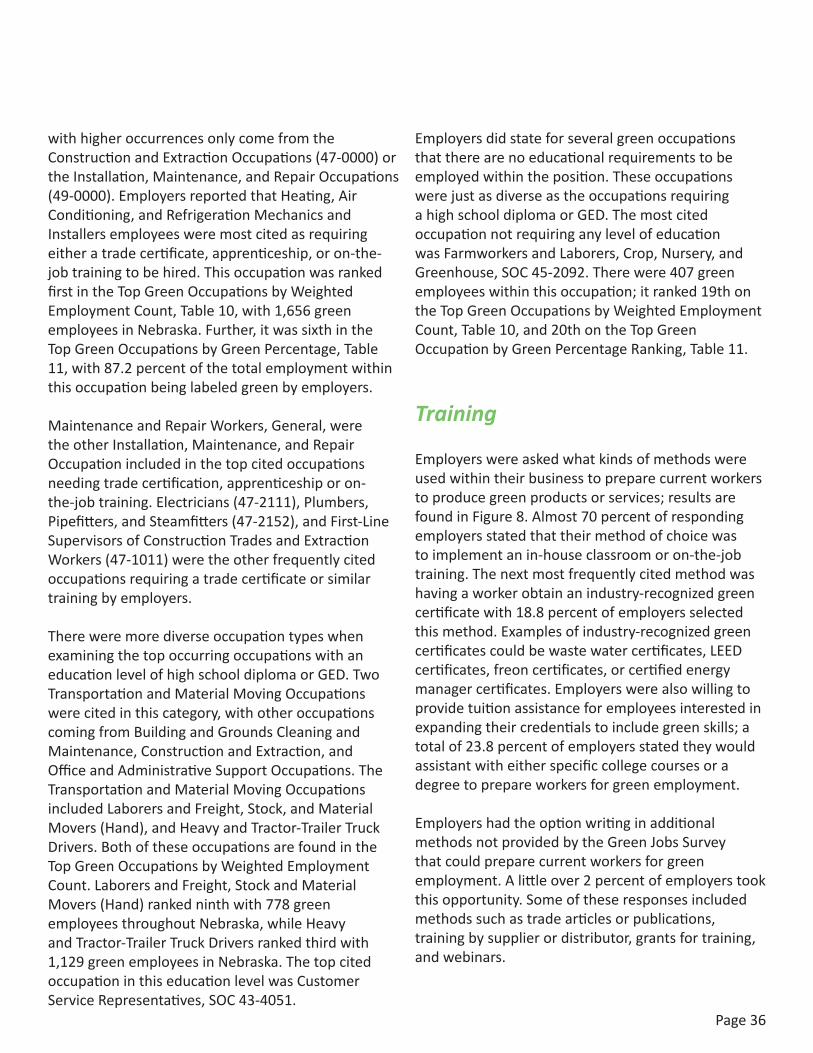
Page36
withhigheroccurrencesonlycomefromtheConstructionandExtractionOccupations(47-0000)ortheInstallation,Maintenance,andRepairOccupations(49-0000).EmployersreportedthatHeating,AirConditioning,andRefrigerationMechanicsandInstallersemployeesweremostcitedasrequiringeitheratradecertificate,apprenticeship,oron-the-jobtrainingtobehired.ThisoccupationwasrankedfirstintheTopGreenOccupationsbyWeightedEmploymentCount,Table10,with1,656greenemployeesinNebraska.Further,itwassixthintheTopGreenOccupationsbyGreenPercentage,Table11,with87.2percentofthetotalemploymentwithinthisoccupationbeinglabeledgreenbyemployers.
MaintenanceandRepairWorkers,General,weretheotherInstallation,Maintenance,andRepairOccupationincludedinthetopcitedoccupationsneedingtradecertification,apprenticeshiporon-the-jobtraining.Electricians(47-2111),Plumbers,Pipefitters,andSteamfitters(47-2152),andFirst-LineSupervisorsofConstructionTradesandExtractionWorkers(47-1011)weretheotherfrequentlycitedoccupationsrequiringatradecertificateorsimilartrainingbyemployers.
ThereweremorediverseoccupationtypeswhenexaminingthetopoccurringoccupationswithaneducationlevelofhighschooldiplomaorGED.TwoTransportationandMaterialMovingOccupationswerecitedinthiscategory,withotheroccupationscomingfromBuildingandGroundsCleaningandMaintenance,ConstructionandExtraction,andOfficeandAdministrativeSupportOccupations.TheTransportationandMaterialMovingOccupationsincludedLaborersandFreight,Stock,andMaterialMovers(Hand),andHeavyandTractor-TrailerTruckDrivers.BothoftheseoccupationsarefoundintheTopGreenOccupationsbyWeightedEmploymentCount.LaborersandFreight,StockandMaterialMovers(Hand)rankedninthwith778greenemployeesthroughoutNebraska,whileHeavyandTractor-TrailerTruckDriversrankedthirdwith1,129greenemployeesinNebraska.ThetopcitedoccupationinthiseducationlevelwasCustomerServiceRepresentatives,SOC43-4051.
Employersdidstateforseveralgreenoccupationsthattherearenoeducationalrequirementstobeemployedwithintheposition.TheseoccupationswerejustasdiverseastheoccupationsrequiringahighschooldiplomaorGED.ThemostcitedoccupationnotrequiringanylevelofeducationwasFarmworkersandLaborers,Crop,Nursery,andGreenhouse,SOC45-2092.Therewere407greenemployeeswithinthisoccupation;itranked19thontheTopGreenOccupationsbyWeightedEmploymentCount,Table10,and20thontheTopGreenOccupationbyGreenPercentageRanking,Table11.
Training
Employerswereaskedwhatkindsofmethodswereusedwithintheirbusinesstopreparecurrentworkerstoproducegreenproductsorservices;resultsarefoundinFigure8.Almost70percentofrespondingemployersstatedthattheirmethodofchoicewastoimplementanin-houseclassroomoron-the-jobtraining.Thenextmostfrequentlycitedmethodwashavingaworkerobtainanindustry-recognizedgreencertificatewith18.8percentofemployersselectedthismethod.Examplesofindustry-recognizedgreencertificatescouldbewastewatercertificates,LEEDcertificates,freoncertificates,orcertifiedenergymanagercertificates.Employerswerealsowillingtoprovidetuitionassistanceforemployeesinterestedinexpandingtheircredentialstoincludegreenskills;atotalof23.8percentofemployersstatedtheywouldassistantwitheitherspecificcollegecoursesoradegreetoprepareworkersforgreenemployment.
EmployershadtheoptionwritinginadditionalmethodsnotprovidedbytheGreenJobsSurveythatcouldpreparecurrentworkersforgreenemployment.Alittleover2percentofemployerstookthisopportunity.Someoftheseresponsesincludedmethodssuchastradearticlesorpublications,trainingbysupplierordistributor,grantsfortraining,andwebinars.
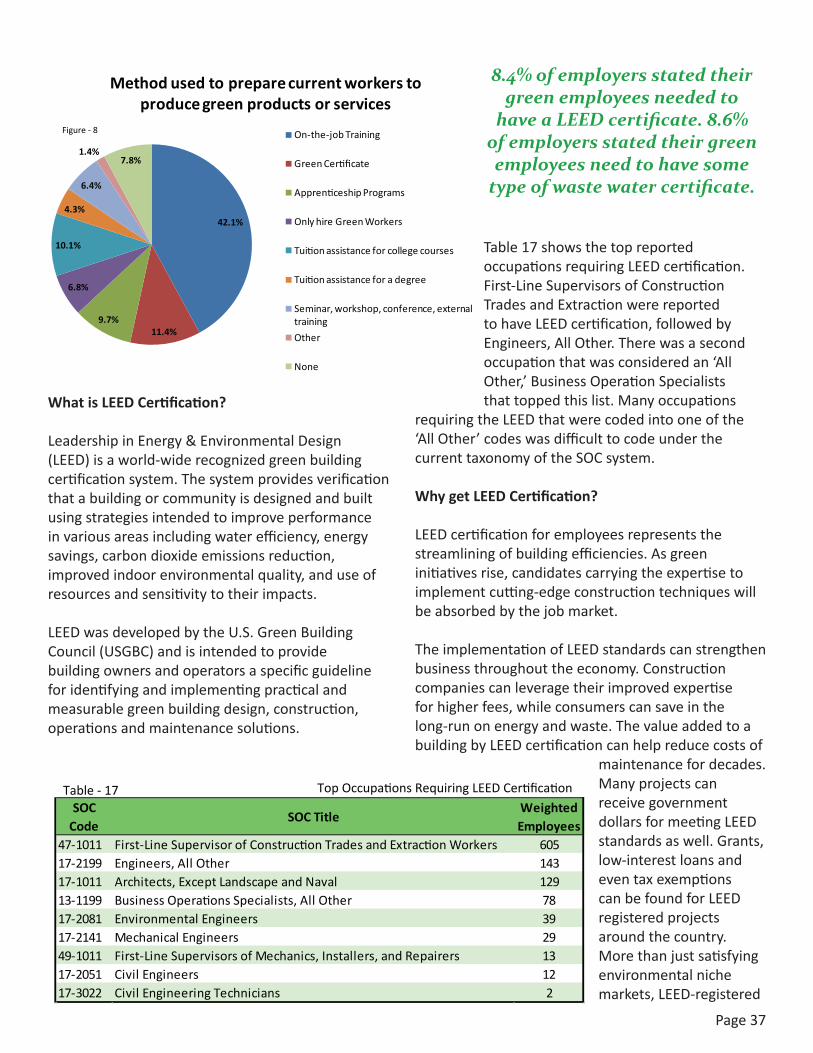
Page37
What is LEED Certification?
LeadershipinEnergy&EnvironmentalDesign(LEED)isaworld-widerecognizedgreenbuildingcertificationsystem.Thesystemprovidesverificationthatabuildingorcommunityisdesignedandbuiltusingstrategiesintendedtoimproveperformanceinvariousareasincludingwaterefficiency,energysavings,carbondioxideemissionsreduction,improvedindoorenvironmentalquality,anduseofresourcesandsensitivitytotheirimpacts.
LEEDwasdevelopedbytheU.S.GreenBuildingCouncil(USGBC)andisintendedtoprovidebuildingownersandoperatorsaspecificguidelineforidentifyingandimplementingpracticalandmeasurablegreenbuildingdesign,construction,operationsandmaintenancesolutions.
Table17showsthetopreportedoccupationsrequiringLEEDcertification.First-LineSupervisorsofConstructionTradesandExtractionwerereportedtohaveLEEDcertification,followedbyEngineers,AllOther.Therewasasecondoccupationthatwasconsideredan‘AllOther,’BusinessOperationSpecialiststhattoppedthislist.Manyoccupations
requiringtheLEEDthatwerecodedintooneofthe‘AllOther’codeswasdifficulttocodeunderthecurrenttaxonomyoftheSOCsystem.
Why get LEED Certification?
LEEDcertificationforemployeesrepresentsthestreamliningofbuildingefficiencies.Asgreeninitiativesrise,candidatescarryingtheexpertisetoimplementcutting-edgeconstructiontechniqueswillbeabsorbedbythejobmarket.
TheimplementationofLEEDstandardscanstrengthenbusinessthroughouttheeconomy.Constructioncompaniescanleveragetheirimprovedexpertiseforhigherfees,whileconsumerscansaveinthelong-runonenergyandwaste.ThevalueaddedtoabuildingbyLEEDcertificationcanhelpreducecostsof
maintenancefordecades.ManyprojectscanreceivegovernmentdollarsformeetingLEEDstandardsaswell.Grants,low-interestloansandeventaxexemptionscanbefoundforLEEDregisteredprojectsaroundthecountry.Morethanjustsatisfyingenvironmentalnichemarkets,LEED-registered
Table - 17 Top Occupations Requiring LEED CertificationSOC
CodeSOC Title
Weighted Employees
47-1011 First-Line Supervisor of Construction Trades and Extraction Workers 60517-2199 Engineers, All Other 14317-1011 Architects, Except Landscape and Naval 12913-1199 Business Operations Specialists, All Other 7817-2081 Environmental Engineers 3917-2141 Mechanical Engineers 2949-1011 First-Line Supervisors of Mechanics, Installers, and Repairers 1317-2051 Civil Engineers 1217-3022 Civil Engineering Technicians 2
8.4% of employers stated their green employees needed to
have a LEED certificate. 8.6% of employers stated their green employees need to have some
type of waste water certificate.
42.1%
11.4%9.7%
6.8%
10.1%
4.3%
6.4%
1.4%7.8%
Method used to prepare current workers to produce green products or services
On-the-job Training
Green Certificate
Apprenticeship Programs
Only hire Green Workers
Tuition assistance for college courses
Tuition assistance for a degree
Seminar, workshop, conference, external training
Other
None
Figure - 8
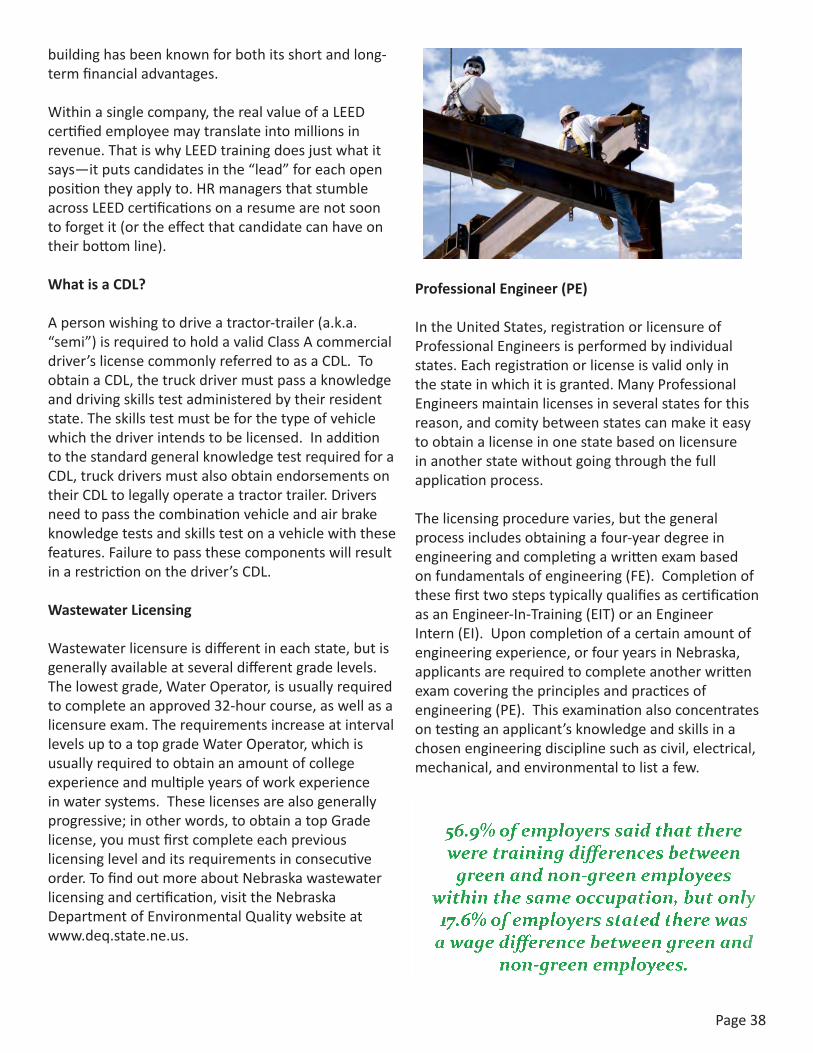
buildinghasbeenknownforbothitsshortandlong-termfinancialadvantages.
Withinasinglecompany,therealvalueofaLEEDcertifiedemployeemaytranslateintomillionsinrevenue.ThatiswhyLEEDtrainingdoesjustwhatitsays—itputscandidatesinthe“lead”foreachopenpositiontheyapplyto.HRmanagersthatstumbleacrossLEEDcertificationsonaresumearenotsoontoforgetit(ortheeffectthatcandidatecanhaveontheirbottomline).
What is a CDL?
Apersonwishingtodriveatractor-trailer(a.k.a.“semi”)isrequiredtoholdavalidClassAcommercialdriver’slicensecommonlyreferredtoasaCDL.ToobtainaCDL,thetruckdrivermustpassaknowledgeanddrivingskillstestadministeredbytheirresidentstate.Theskillstestmustbeforthetypeofvehiclewhichthedriverintendstobelicensed.InadditiontothestandardgeneralknowledgetestrequiredforaCDL,truckdriversmustalsoobtainendorsementsontheirCDLtolegallyoperateatractortrailer.Driversneedtopassthecombinationvehicleandairbrakeknowledgetestsandskillstestonavehiclewiththesefeatures.Failuretopassthesecomponentswillresultinarestrictiononthedriver’sCDL.
Wastewater Licensing
Wastewaterlicensureisdifferentineachstate,butisgenerallyavailableatseveraldifferentgradelevels.Thelowestgrade,WaterOperator,isusuallyrequiredtocompleteanapproved32-hourcourse,aswellasalicensureexam.TherequirementsincreaseatintervallevelsuptoatopgradeWaterOperator,whichisusuallyrequiredtoobtainanamountofcollegeexperienceandmultipleyearsofworkexperienceinwatersystems.Theselicensesarealsogenerallyprogressive;inotherwords,toobtainatopGradelicense,youmustfirstcompleteeachpreviouslicensinglevelanditsrequirementsinconsecutiveorder.TofindoutmoreaboutNebraskawastewaterlicensingandcertification,visittheNebraskaDepartmentofEnvironmentalQualitywebsiteatwww.deq.state.ne.us.
Professional Engineer (PE)
IntheUnitedStates,registrationorlicensureofProfessionalEngineersisperformedbyindividualstates.Eachregistrationorlicenseisvalidonlyinthestateinwhichitisgranted.ManyProfessionalEngineersmaintainlicensesinseveralstatesforthisreason,andcomitybetweenstatescanmakeiteasytoobtainalicenseinonestatebasedonlicensureinanotherstatewithoutgoingthroughthefullapplicationprocess.
Thelicensingprocedurevaries,butthegeneralprocessincludesobtainingafour-yeardegreeinengineeringandcompletingawrittenexambasedonfundamentalsofengineering(FE).CompletionofthesefirsttwostepstypicallyqualifiesascertificationasanEngineer-In-Training(EIT)oranEngineerIntern(EI).Uponcompletionofacertainamountofengineeringexperience,orfouryearsinNebraska,applicantsarerequiredtocompleteanotherwrittenexamcoveringtheprinciplesandpracticesofengineering(PE).Thisexaminationalsoconcentratesontestinganapplicant’sknowledgeandskillsinachosenengineeringdisciplinesuchascivil,electrical,mechanical,andenvironmentaltolistafew.
Page38
56.9% of employers said that there were training differences between
green and non-green employees within the same occupation, but only 17.6% of employers stated there was
a wage difference between green and non-green employees.
Page39
Additional Research
New Hires
AspartoftheLaborMarketInformationImprovementgrant,Nebraskaconductedastudyofindividualswhowerenewlyhiredwithinaspecifictime-frame.Thesamplewascomposedofthoseindividualswhowerehiredinthefourthquarterof2009andhadnoemployee-employerrelationshippresentduringthepreviousquarter.SampleselectionpreferencewasgiventothosewhohadeitherreceivedWorkforceInvestmentActtrainingassistanceorwereregisteredwiththeCareerCenterforStaffAssistedServices.Atotalof2,717surveysweresenttodifferentbusinesses.
Thesurveyinstrumentcollectedinformationfromtheemployeronboththeemployeeandthejobtheemployeeholds.Thesurveycoveredseveraltopicsincludingskillsrequiredforthejob,desiredskillsofapplicants,pre-identifiedgreenskills,educationrequirements,demographics,compensation,benefits,andsatisfactionwithemployeeperformance.Resultsfromthesurveyaretabulatedbyindustryandoccupationalcategory.
DetailedinformationabouttheNebraskaNewHiresSurveycanbeaccessedonlineinthePublicationssectionofNebraska’sLaborMarketInformationwebsiteathttp://neworks.nebraska.gov/analyzer.
Economic Impact of Green ARRA Projects
TheBureauofEconomicResearchattheUniversityofNebraskaLincolnprovidedananalysisoftheeconomicimplicationsforAmericanReinvestmentandRecoveryAct(ARRA)fundedgreenprojectsinNebraska.Therewere82greenARRAprojectsimplementedinNebraskawhichhadatotalbudgetof$192.1million.TheseprojectswereoverseenbyseveraldifferentfederalagenciesincludingtheDepartmentofEnergy,theEnvironmentalProtectionAgency,theDepartmentofTransportation,theDepartmentofHousingandUrbanDevelopment,andtheNationalScienceFoundation.
ThefocusoftheseARRAprojectsincludedresearchonalternativeenergysourcessuchasgeothermalandsolar;energyefficiencyprogramsthatdealtwithweatherizationofbuildings,efficientlightbulbs,energystarappliancesorheatingandcoolingsystems;researchandfundingforhybridorcleandieselvehicles;andfundingforenvironmentalclean-upandresearchforBrownfieldorwetlands.TheanalysisdonebytheBureauofEconomicResearchfocusedonthegrosseconomicimpactofthefundingfortheseprojectstotheNebraskaeconomyandlabormarketusingIMPLANsoftware.Itwasdeterminedthatthefundingfortheseprojectsprovidedtheequivalentof1,970Nebraskanjobsforayear.AnalysiswasalsorunforLincoln,Omaha,andthefiveothereconomicregionsinNebraska.
ThefullEconomicImpactAnalysisreportcanbefoundonlineinthepublicationsectionoftheNEworkswebsiteathttp://neworks.nebraska.gov/analyzer.
Green Jobs as a Source of Re-Employment
TheBureauofEconomicResearchattheUniversityofNebraskaLincolncompletedastudyfortheconsortiumareaonutilizingdemandforgreenjobstore-employthosewholostjobsduetotheeconomicrecession.Thestudyidentifiedsub-sectorsintheConstructionandManufacturingindustriesaswellastheserviceindustriesrelateConstructionandManufacturing.Occupationsinthoseindustriesthathadtherelatableskillsorattributestotransferintogreenoccupationsfromtraditionallynon-greenoccupationswerealsoidentified.AnalysisdrewfromdatasetsprovidedbytheDisplacedWorkerSurvey,whichispartoftheCurrentPopulationSurveyconductedbytheBureauofLaborStatistics.Whenlookingatworker’sskillsandattributes,theanalysisfoundthat:1)workerswithanassociate’s,bachelor’s,ormaster’sdegreewerelesslikelytoswitchintoagreenoccupationthanworkerswithahighschooldegreeorlower,2)agedidnothaveastatisticallysignificanteffectontheprobabilityof
Page40
switchingintoagreenoccupation,3)malesweremorelikelytoswitchintogreenoccupationsthanfemales,and4)workerswhomovedweremorelikelytoswitchintogreenoccupations.Afteridentifyingthecharacteristicsofindividualsmorelikelytoswitchtogreenoccupations,handoutsweredevelopedforcareercentersanddisplacedworkersidentifyinggreenoccupationsthatmatchedtheirskillset.
ThefullreportongreenoccupationsfordisplacedworkerscanbefoundonlineinthepublicationsectionoftheNEworkswebsiteathttp://neworks.nebraska.gov/analyzer.
Drinking Water Systems Infrastructure
TheAmericanRecoveryandReinvestmentAct(ARRA)providedNebraskawith$19.5millionforimprovementstothedrinkingwatersysteminfrastructuresuchaswaterwellfields,watermeters,powerlines,waterbasins,variablefrequencypumps,andwatertreatmentplans.Alittleoverfourmilliondollarsofthisfundingwasprovidedspecificallyfor“GreenInfrastructure”.
TheBureauofBusinessResearchattheUniversityofNebraskaLincolnusedIMPLANsoftwaretodeterminetheeconomicimpactofARRAspendingondrinkingwatersysteminfrastructure.Itwasdeterminedthatthemajorityofthefunding(79.1%)wasutilizedintheConstructionofOtherNewNonresidentialStructuressector.Thebalanceofthefundingwasutilizedbythreeothersectors:Architecture,Engineering,andRelatedServices(11.5%),MaintenanceandRepairofResidentialStructures(8.7%),andMaintenanceandRepairofNonresidentialStructures(0.7%).ThesesectorswereusedtodeterminetheeconomicmultiplierofARRAfunding.Theresultsofthisanalysisindicatethatforeveryonemilliondollarsoffunding,7.3jobsweredirectlyfundedforayear.Additionally,5.3jobswereindirectlyfundedforatotalof13jobsforeveryonemilliondollarsoffunding.
ThefullreportontheSpecialMultiplierStudyforDrinkingWaterSystemsInfrastructurecanbefoundonlineinthepublicationssectionoftheNEworkswebsiteathttp://neworks.nebraska.gov/analyzer.
Waste Water Systems Infrastructure
TheAmericanRecoveryandReinvestmentAct(ARRA)providedNebraskawithovertwentymilliondollarsforimprovementstothewastewatersysteminfrastructuresuchasretentionlagoons,variablefrequencypumps,sewerlines,liftstations,andenhancementoftreatmentstations.Approximately$4.86milliondollarsofthisfundingwasprovidedspecificallyfor“GreenInfrastructure”.
TheBureauofBusinessResearchattheUniversityofNebraskaLincolnusedIMPLANsoftwaretodeterminetheeconomicimpactofARRAspendingonwastewatersystemsinfrastructure.Itwasdeterminedthatthemajorityofthefunding(72.9%)wasutilizedintheConstructionofOtherNewNonresidentialStructuressector.Twoothersectorsreceivedmostoftherestofthefunding:Architecture,Engineering,andRelatedServices(13.1%)andWholesaleTrade(11.1%).Threeothersectorsreceivedlessthan2.4%ofthefundingcombined.ThesesectorswereusedtodeterminetheeconomicmultiplierofARRAfunding.Theresultsofthisanalysisindicatethatforeveryonemilliondollarsoffunding,6.4jobsweredirectlyfundedforayear.Additionally,5.2jobswereindirectlyfundedforatotalof11.6jobsforeveryonemilliondollarsoffunding.
ThefullreportontheSpecialMultiplierStudyforWastewaterSystemsInfrastructurecanbefoundonlineinthepublicationssectionoftheNEworkswebsiteathttp://neworks.nebraska.gov/analyzer.
Consortium Research
TheNorthernPlainsandRockyMountainConsortiumplanonreleasingreportongreenjobsspanningthefullconsortiumarea,includingNebraska,Iowa,Montana,SouthDakota,Wyoming,andUtahontheconsortiumwebsiteathttp://researchingthegreeneconomy.com.Thereisalsoinformationonstate-specificstudies,workforcedevelopmenthandouts,andspecialconsortiumstudiessuchasthereportonnewandemerginggreentechnologies.MaterialsfromtheResearchingtheGreenEconomyConferenceheldinDesMoinesarealsoavailablefordownload.
Appendix Table of Contents
• TableA1–OversampledConstructionIndustryintheNebraskaSample
• TableA2–OversampledManufacturingIndustryintheNebraskaSample
• TableA3–OversampledWholesaleTradeIndustryintheNebraskaSample
• TableA4–OversampledProfessional,Scientific,andTechnicalServicesIndustryintheNebraskaSample
• TableA5–OversampledAdministrativeandSupportandWasteManagementandRemediationServicesIndustryintheNebraskaSample
• TableA6–OversampledOtherServicesIndustryintheNebraskaSample
• TableA7–OversampledPublicAdministrationIndustryintheNebraskaSample
• FigureA1–SampleGreenJobsSurveyForm
• FigureA2–SampleGreenJobsBrochure
• TableA8–FinalResponseRatebyStrata
• TableA9–A10–GreenEconomicAnalysisbyEconomicIndustryatthe3-DigitLevel
• TableA11–GreenIndustriesatthe2-DigitNAICSLevelbyGreenEmployment
• TableA12–Top25GreenIndustriesatthe3-DigitNAICSLevelbyGreenEmployment
• TableA13–Top25GreenIndustriesatthe4-DigitNAICSLevelbyGreenEmployment
• TableA14–Top26GreenIndustriesatthe6-DigitNAICSLevelbyGreenEmployment
• TableA15–AllOccupationsbySOCCode
• TableA16–AllOccupationsListedUndertheGreenEconomicCategory‘RenewableEnergyandAlternativeFuels’
• TableA17–AllOccupationsListedUndertheGreenEconomicCategory‘EnergyEfficiencyandConservation’
• TableA18–AllOccupationsListedUndertheGreenEconomicCategory‘Education,Regulation,Compliance,PublicAwareness,andTrainingandEnergyTrading’
• TableA19–AllOccupationsListedUndertheGreenEconomicCategory‘Pollution,Waste,andGreenhouseGas(GHG)Management,Prevention,andReduction’
• TableA20–AllOccupationsListedUndertheGreenEconomicCategory‘EnvironmentalCleanupandRestorationandWasteCleanupandMitigation’
• TableA21–AllOccupationsListedUndertheGreenEconomicCategory‘SustaninableAgricultureandNaturalResourceConservation’
• TableA22–AllOccupationsListedUnderthe‘None’Option
Page41
43
43
45
46
46
46
46
47
51
55
56
58
58
59
59
60
65
66
67
68
69
70
71
• TableA23–TopFiveGreenOccupationsfortheRemainingTopTenIndustries
• TableA24–AllOccupationsListedwithinAgriculture,Forestry,Fishing,andHunting
• TableA25–AllOccupationsListedwithinMining
• TableA26–AllOccupationsListedwithinUtilities
• TableA27–AllOccupationsListedwithinConstruction
• TableA28–AllOccupationsListedwithinManufacturing
• TableA29–AllOccupationsListedwithinWholesaleTrade
• TableA30–AllOccupationsListedwithinRetailTrade
• TableA31–AllOccupationsListedwithinTransportationandWarehousing
• TableA32–AllOccupationsListedwithinInformation
• TableA33–AllOccupationsListedwithinFinanceandInsurance
• TableA34–AllOccupationsListedwithinRealEstateandRentalandLeasing
• TableA35–AllOccupationsListedwithinManagementofCompaniesandEnterprises
• TableA36–AllOccupationsListedwithinProfessional,Scientific,andTechnicalServices
• TableA37–AllOccupationsListedwithinAdministrativeandSupportandWasteManagementandRemediationServices
• TableA38–AllOccupationsListedwithinEducationalServices
• TableA39–AllOccupationsListedwithinHealthCareandSocialAssistance
• TableA40–AllOccupationsListedwithinArts,Entertainment,andRecreation
• TableA41–AllOccupationListedwithinAccommodationandFoodServices
• TableA42–AllOccupationsListedwithinOtherServices(exceptPublicAdministration)
• TableA43–AllOccupationsListedwithinPublicAdministration
• TableA44–AllGreenJobsReportedthatwereRecentlyCreatedorModifiedtoIncludeGreenTaskssinceJanuary2009byGreenEmployment
• TableA45–2-DigitSectortoIndustryTitles
• TableA46–3-DigitSectortoIndustryTitles
Appendix Table of Contents
Page42
72
73
73
73
74
75
76
76
76
77
77
77
77
78
79
79
80
80
80
81
81
82
83
84
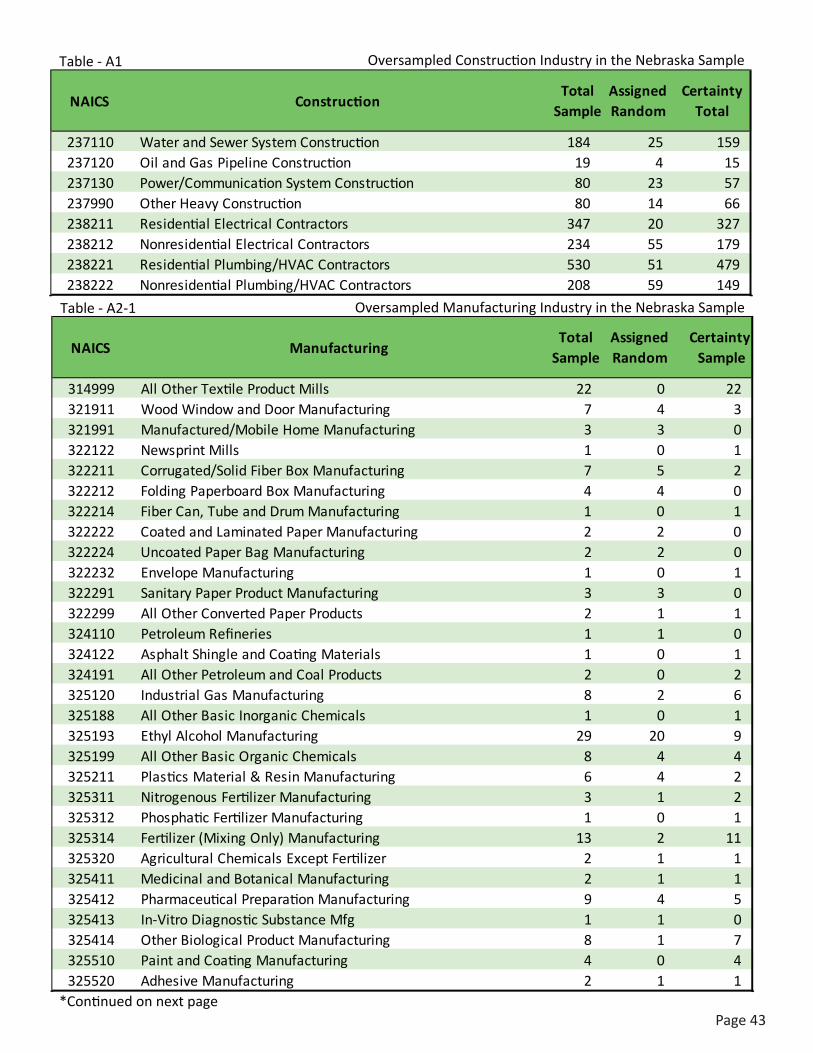
Page43
NAICS ConstructionTotal Assigned
RandomCertainty
Total
237110 Water and Sewer System Construction 184 25 159237120 Oil and Gas Pipeline Construction 19 4 15237130 Power/Communication System Construction 80 23 57237990 Other Heavy Construction 80 14 66238211 Residential Electrical Contractors 347 20 327238212 Nonresidential Electrical Contractors 234 55 179238221 Residential Plumbing/HVAC Contractors 530 51 479238222 Nonresidential Plumbing/HVAC Contractors 208 59 149
Table - A1 Oversampled Construction Industry in the Nebraska Sample
Sample
Table - A2-1 Oversampled Manufacturing Industry in the Nebraska Sample
NAICS ManufacturingAssigned Random
Certainty
314999 All Other Textile Product Mills 22 0 22321911 Wood Window and Door Manufacturing 7 4 3321991 Manufactured/Mobile Home Manufacturing 3 3 0322122 Newsprint Mills 1 0 1322211 Corrugated/Solid Fiber Box Manufacturing 7 5 2322212 Folding Paperboard Box Manufacturing 4 4 0322214 Fiber Can, Tube and Drum Manufacturing 1 0 1322222 Coated and Laminated Paper Manufacturing 2 2 0322224 Uncoated Paper Bag Manufacturing 2 2 0322232 Envelope Manufacturing 1 0 1322291 Sanitary Paper Product Manufacturing 3 3 0322299 All Other Converted Paper Products 2 1 1324110 Petroleum Refineries 1 1 0324122 Asphalt Shingle and Coating Materials 1 0 1324191 All Other Petroleum and Coal Products 2 0 2325120 Industrial Gas Manufacturing 8 2 6325188 All Other Basic Inorganic Chemicals 1 0 1325193 Ethyl Alcohol Manufacturing 29 20 9325199 All Other Basic Organic Chemicals 8 4 4325211 Plastics Material & Resin Manufacturing 6 4 2325311 Nitrogenous Fertilizer Manufacturing 3 1 2325312 Phosphatic Fertilizer Manufacturing 1 0 1325314 Fertilizer (Mixing Only) Manufacturing 13 2 11325320 Agricultural Chemicals Except Fertilizer 2 1 1325411 Medicinal and Botanical Manufacturing 2 1 1325412 Pharmaceutical Preparation Manufacturing 9 4 5325413 In-Vitro Diagnostic Substance Mfg 1 1 0325414 Other Biological Product Manufacturing 8 1 7325510 Paint and Coating Manufacturing 4 0 4325520 Adhesive Manufacturing 2 1 1
SampleTotal
Sample
*Continued on next page
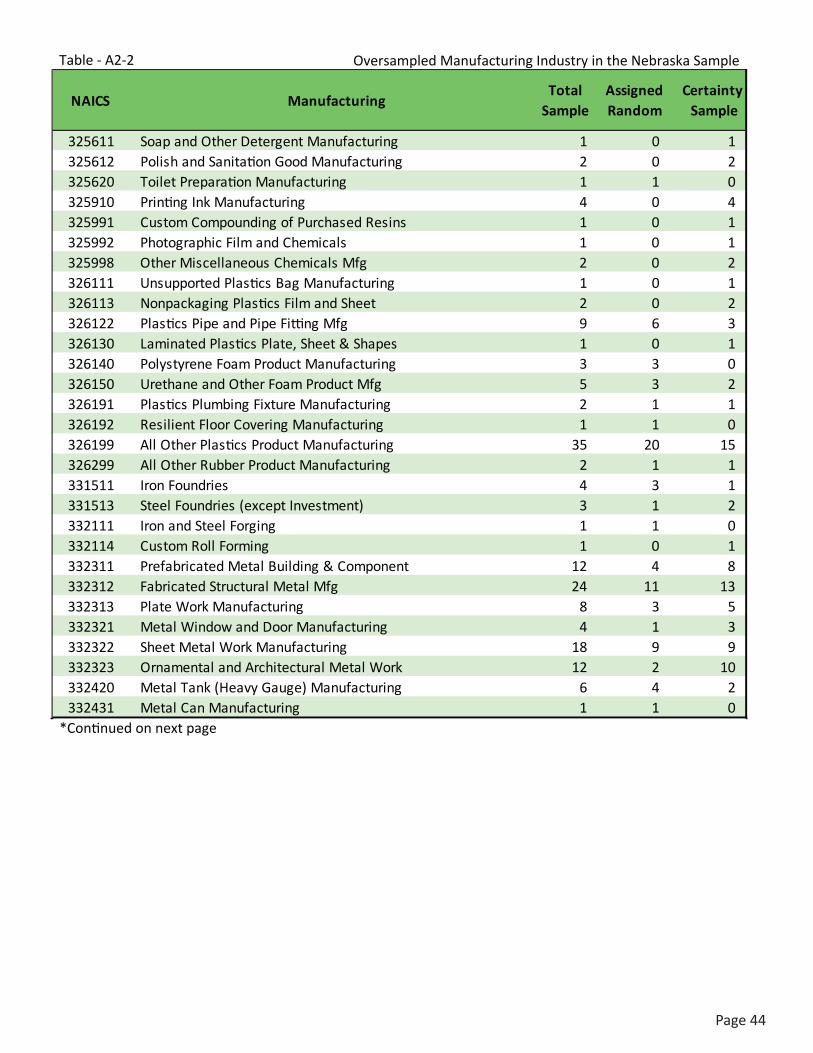
Page44
Table - A2-2 Oversampled Manufacturing Industry in the Nebraska Sample
NAICS ManufacturingAssigned Random
Certainty
325611 Soap and Other Detergent Manufacturing 1 0 1325612 Polish and Sanitation Good Manufacturing 2 0 2325620 Toilet Preparation Manufacturing 1 1 0325910 Printing Ink Manufacturing 4 0 4325991 Custom Compounding of Purchased Resins 1 0 1325992 Photographic Film and Chemicals 1 0 1325998 Other Miscellaneous Chemicals Mfg 2 0 2326111 Unsupported Plastics Bag Manufacturing 1 0 1326113 Nonpackaging Plastics Film and Sheet 2 0 2326122 Plastics Pipe and Pipe Fitting Mfg 9 6 3326130 Laminated Plastics Plate, Sheet & Shapes 1 0 1326140 Polystyrene Foam Product Manufacturing 3 3 0326150 Urethane and Other Foam Product Mfg 5 3 2326191 Plastics Plumbing Fixture Manufacturing 2 1 1326192 Resilient Floor Covering Manufacturing 1 1 0326199 All Other Plastics Product Manufacturing 35 20 15326299 All Other Rubber Product Manufacturing 2 1 1331511 Iron Foundries 4 3 1331513 Steel Foundries (except Investment) 3 1 2332111 Iron and Steel Forging 1 1 0332114 Custom Roll Forming 1 0 1332311 Prefabricated Metal Building & Component 12 4 8332312 Fabricated Structural Metal Mfg 24 11 13332313 Plate Work Manufacturing 8 3 5332321 Metal Window and Door Manufacturing 4 1 3332322 Sheet Metal Work Manufacturing 18 9 9332323 Ornamental and Architectural Metal Work 12 2 10332420 Metal Tank (Heavy Gauge) Manufacturing 6 4 2332431 Metal Can Manufacturing 1 1 0
SampleTotal
Sample
*Continued on next page
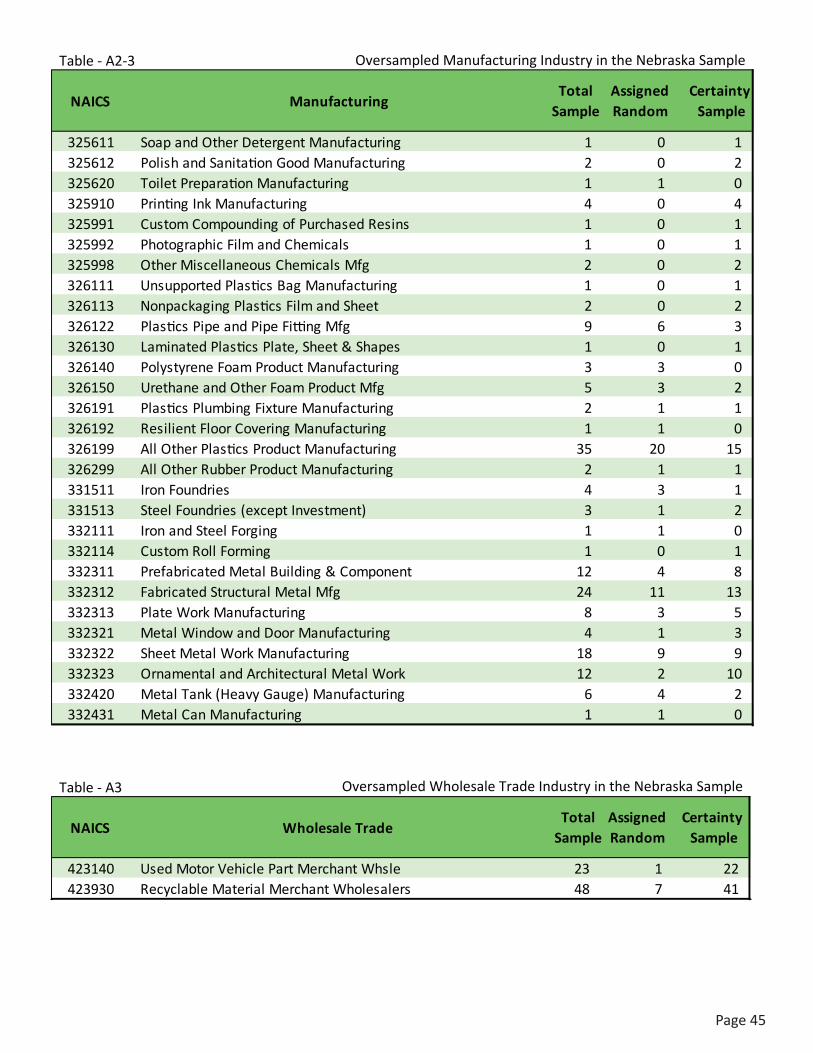
Page45
NAICS ManufacturingAssigned Random
Certainty
325611 Soap and Other Detergent Manufacturing 1 0 1325612 Polish and Sanitation Good Manufacturing 2 0 2325620 Toilet Preparation Manufacturing 1 1 0325910 Printing Ink Manufacturing 4 0 4325991 Custom Compounding of Purchased Resins 1 0 1325992 Photographic Film and Chemicals 1 0 1325998 Other Miscellaneous Chemicals Mfg 2 0 2326111 Unsupported Plastics Bag Manufacturing 1 0 1326113 Nonpackaging Plastics Film and Sheet 2 0 2326122 Plastics Pipe and Pipe Fitting Mfg 9 6 3326130 Laminated Plastics Plate, Sheet & Shapes 1 0 1326140 Polystyrene Foam Product Manufacturing 3 3 0326150 Urethane and Other Foam Product Mfg 5 3 2326191 Plastics Plumbing Fixture Manufacturing 2 1 1326192 Resilient Floor Covering Manufacturing 1 1 0326199 All Other Plastics Product Manufacturing 35 20 15326299 All Other Rubber Product Manufacturing 2 1 1331511 Iron Foundries 4 3 1331513 Steel Foundries (except Investment) 3 1 2332111 Iron and Steel Forging 1 1 0332114 Custom Roll Forming 1 0 1332311 Prefabricated Metal Building & Component 12 4 8332312 Fabricated Structural Metal Mfg 24 11 13332313 Plate Work Manufacturing 8 3 5332321 Metal Window and Door Manufacturing 4 1 3332322 Sheet Metal Work Manufacturing 18 9 9332323 Ornamental and Architectural Metal Work 12 2 10332420 Metal Tank (Heavy Gauge) Manufacturing 6 4 2332431 Metal Can Manufacturing 1 1 0
Table - A2-3 Oversampled Manufacturing Industry in the Nebraska Sample
SampleTotal
Sample
NAICS Wholesale TradeAssigned Random
Certainty
423140 Used Motor Vehicle Part Merchant Whsle 23 1 22423930 Recyclable Material Merchant Wholesalers 48 7 41
Table - A3 Oversampled Wholesale Trade Industry in the Nebraska Sample
SampleTotal
Sample
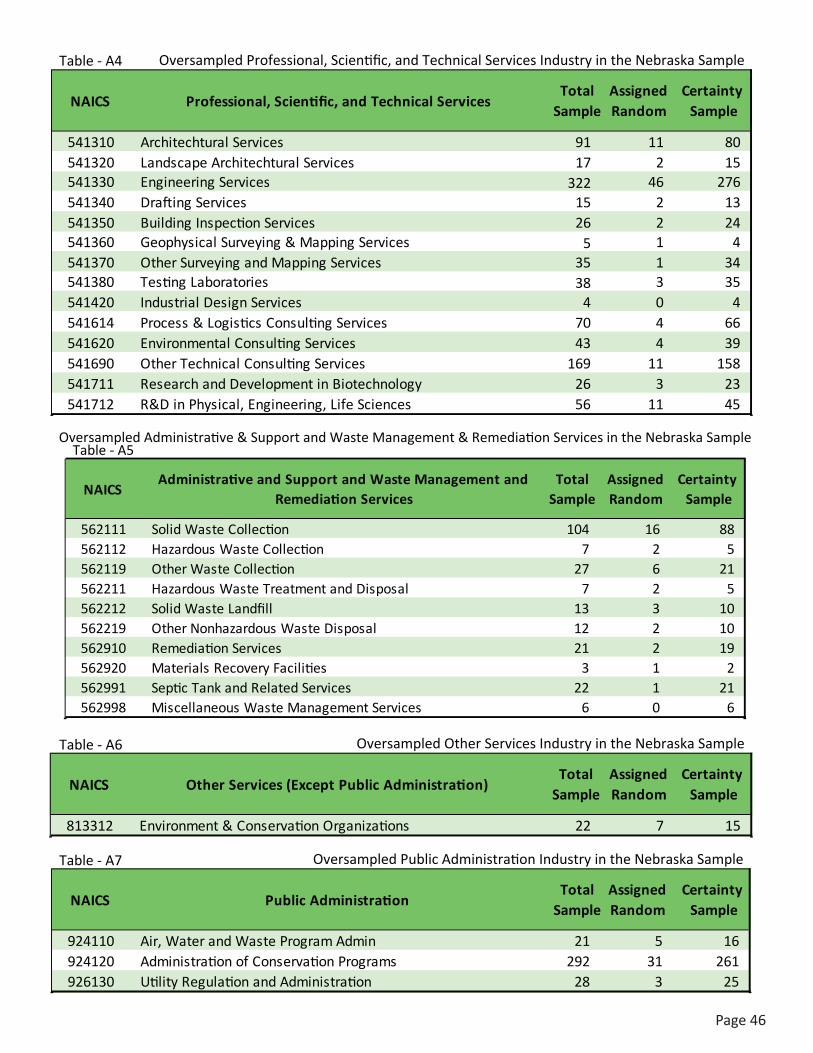
Page46
NAICS Professional, Scientific, and Technical ServicesAssigned Random
Certainty
541310 Architechtural Services 91 11 80541320 Landscape Architechtural Services 17 2 15541330 Engineering Services 322 46 276541340 Drafting Services 15 2 13541350 Building Inspection Services 26 2 24541360 Geophysical Surveying & Mapping Services 5 1 4541370 Other Surveying and Mapping Services 35 1 34541380 Testing Laboratories 38 3 35541420 Industrial Design Services 4 0 4541614 Process & Logistics Consulting Services 70 4 66541620 Environmental Consulting Services 43 4 39541690 Other Technical Consulting Services 169 11 158541711 Research and Development in Biotechnology 26 3 23541712 R&D in Physical, Engineering, Life Sciences 56 11 45
Table - A4 Oversampled Professional, Scientific, and Technical Services Industry in the Nebraska Sample
SampleTotal
Sample
NAICSAdministrative and Support and Waste Management and
Remediation ServicesAssigned Random
Certainty
562111 Solid Waste Collection 104 16 88562112 Hazardous Waste Collection 7 2 5562119 Other Waste Collection 27 6 21562211 Hazardous Waste Treatment and Disposal 7 2 5562212 Solid Waste Landfill 13 3 10562219 Other Nonhazardous Waste Disposal 12 2 10562910 Remediation Services 21 2 19562920 Materials Recovery Facilities 3 1 2562991 Septic Tank and Related Services 22 1 21562998 Miscellaneous Waste Management Services 6 0 6
Table - A5Oversampled Administrative & Support and Waste Management & Remediation Services in the Nebraska Sample
SampleTotal
Sample
NAICS Other Services (Except Public Administration)Sample
Assigned Random
Certainty
813312 Environment & Conservation Organizations 22 7 15
Table - A6 Oversampled Other Services Industry in the Nebraska Sample
TotalSample
NAICS Public AdministrationAssigned Random
Certainty
924110 Air, Water and Waste Program Admin 21 5 16924120 Administration of Conservation Programs 292 31 261926130 Utility Regulation and Administration 28 3 25
Table - A7 Oversampled Public Administration Industry in the Nebraska Sample
TotalSample Sample
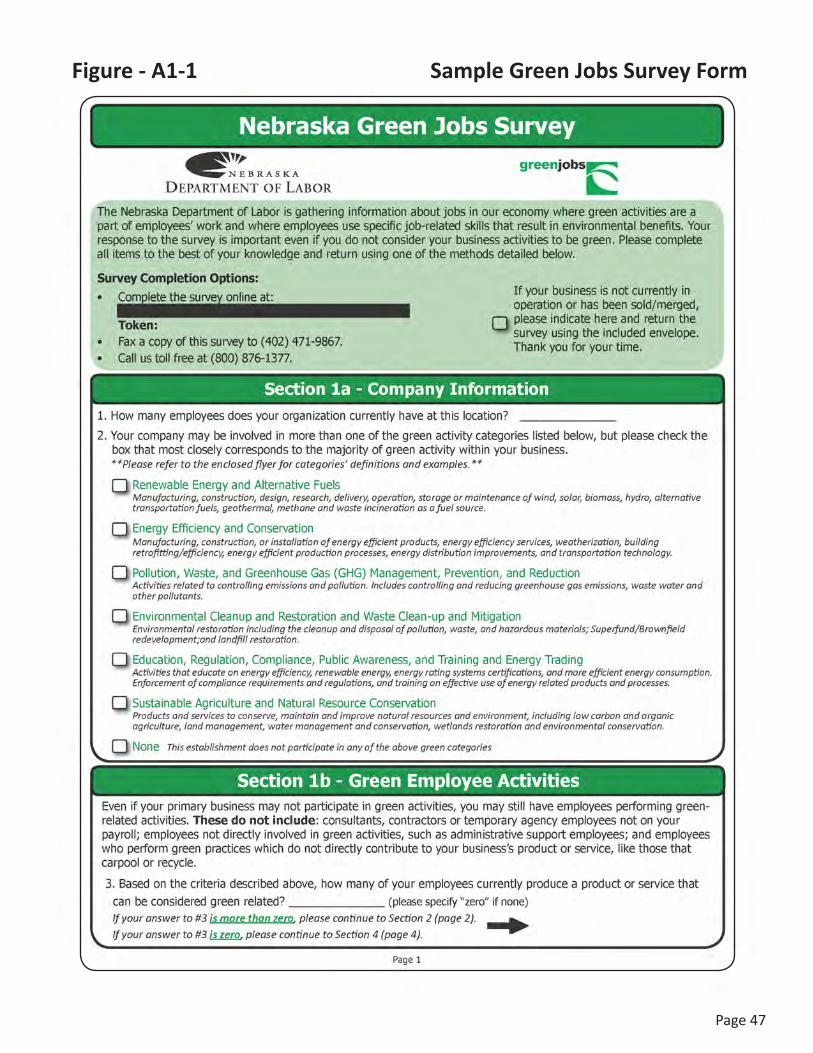
Page47
Figure - A1-1 Sample Green Jobs Survey Form
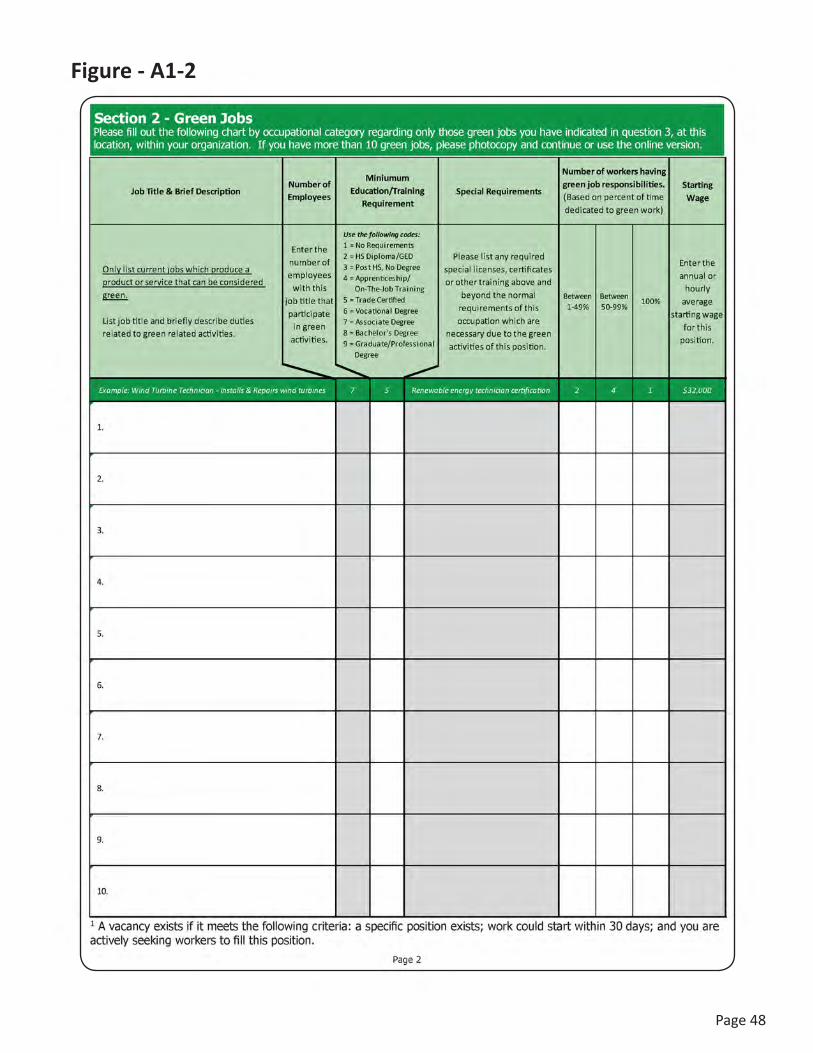
Page48
Figure - A1-2
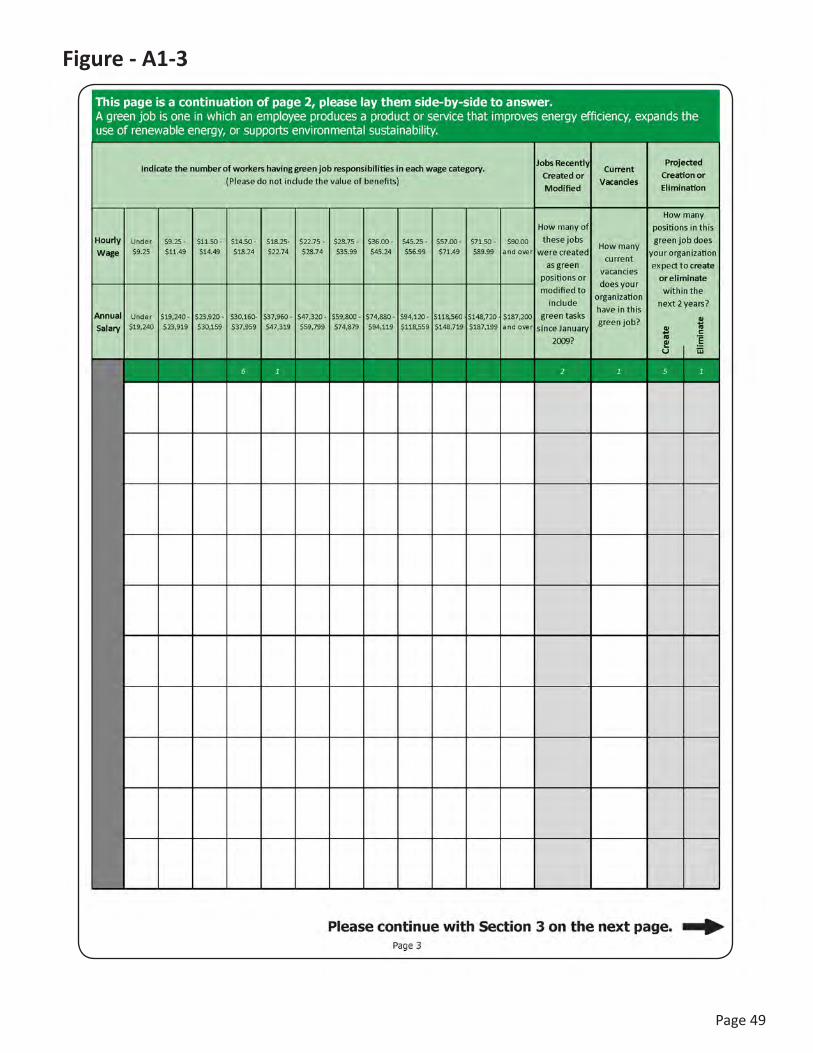
Page49
Figure - A1-3
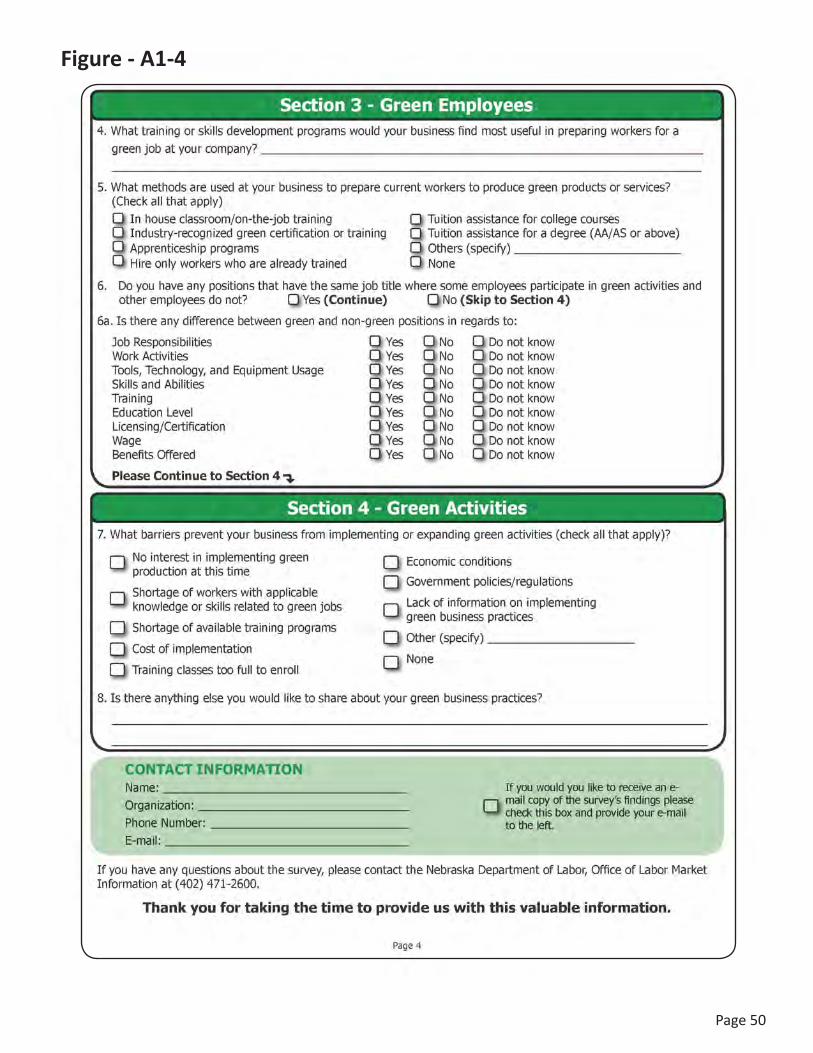
Page50
Figure - A1-4
Page51
Figure - A2-1 Sample Green Jobs Brochure
Page52
Figure - A2-2
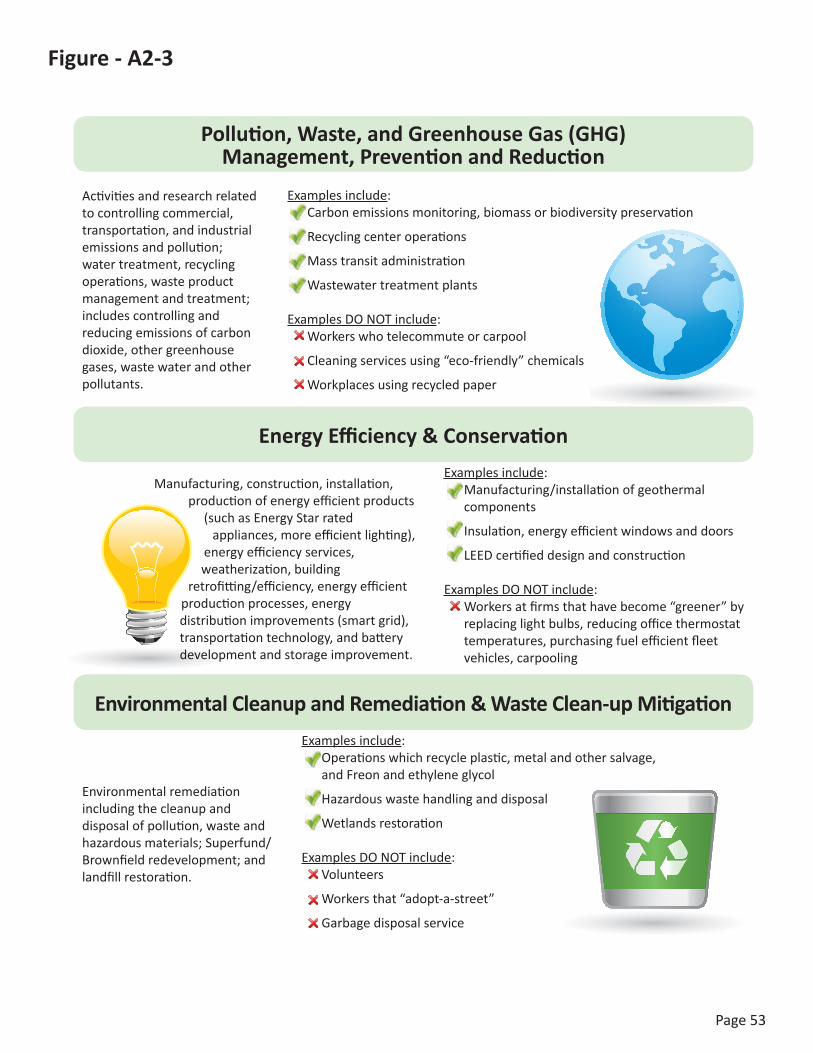
Page53
Figure - A2-3
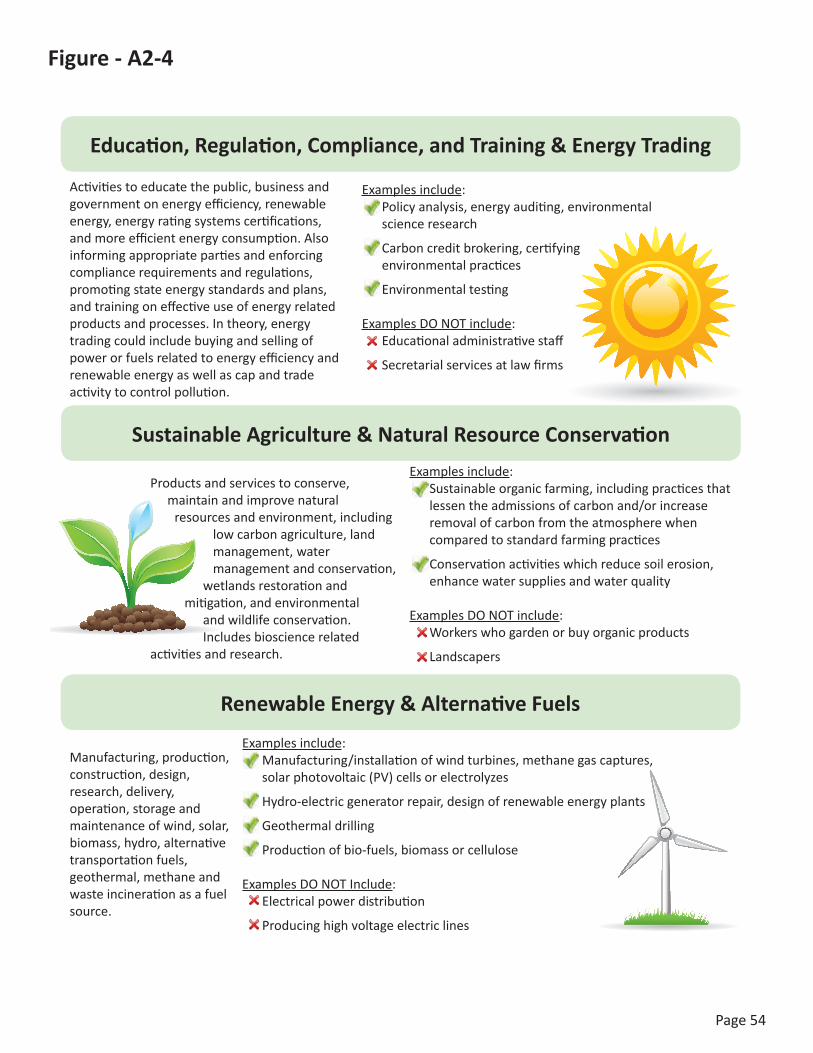
Page54
Figure - A2-4
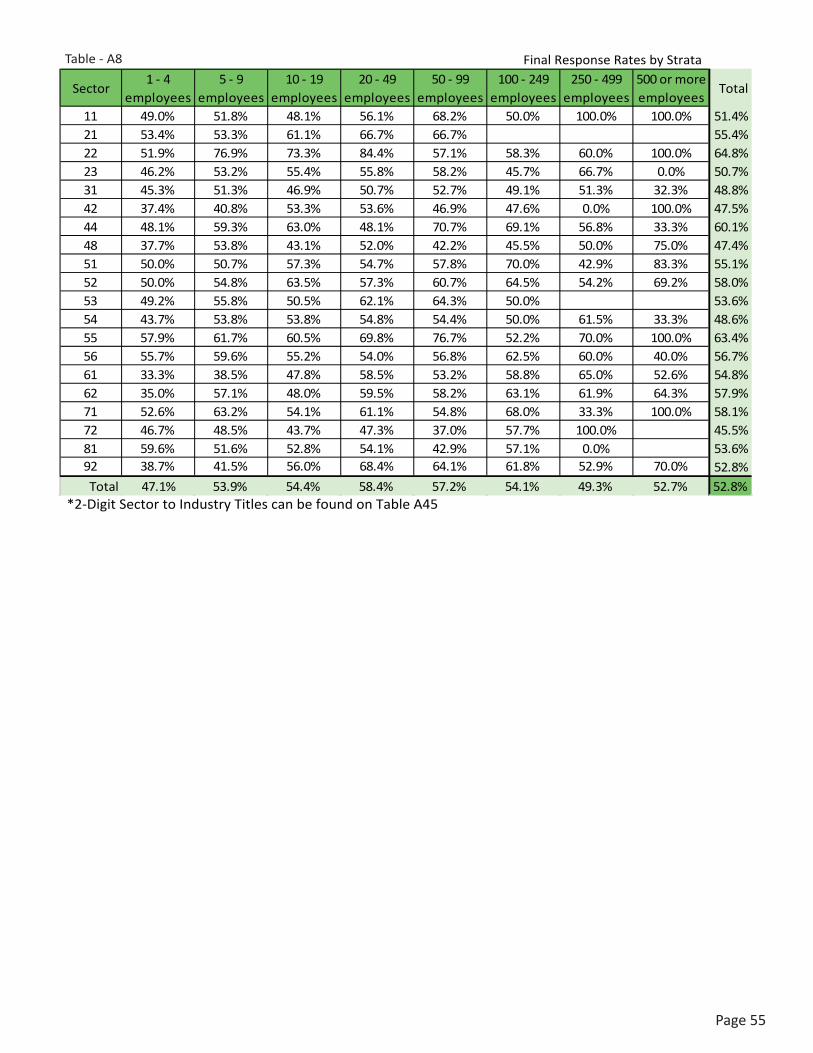
Page55
Sector1 - 4
employees5 - 9
employees10 - 19
employees20 - 49
employees50 - 99
employees100 - 249
employees250 - 499
employees500 or more employees
Total
11 49.0% 51.8% 48.1% 56.1% 68.2% 50.0% 100.0% 100.0% 51.4%21 53.4% 53.3% 61.1% 66.7% 66.7% 55.4%22 51.9% 76.9% 73.3% 84.4% 57.1% 58.3% 60.0% 100.0% 64.8%23 46.2% 53.2% 55.4% 55.8% 58.2% 45.7% 66.7% 0.0% 50.7%31 45.3% 51.3% 46.9% 50.7% 52.7% 49.1% 51.3% 32.3% 48.8%42 37.4% 40.8% 53.3% 53.6% 46.9% 47.6% 0.0% 100.0% 47.5%44 48.1% 59.3% 63.0% 48.1% 70.7% 69.1% 56.8% 33.3% 60.1%48 37.7% 53.8% 43.1% 52.0% 42.2% 45.5% 50.0% 75.0% 47.4%51 50.0% 50.7% 57.3% 54.7% 57.8% 70.0% 42.9% 83.3% 55.1%52 50.0% 54.8% 63.5% 57.3% 60.7% 64.5% 54.2% 69.2% 58.0%53 49.2% 55.8% 50.5% 62.1% 64.3% 50.0% 53.6%54 43.7% 53.8% 53.8% 54.8% 54.4% 50.0% 61.5% 33.3% 48.6%55 57.9% 61.7% 60.5% 69.8% 76.7% 52.2% 70.0% 100.0% 63.4%56 55.7% 59.6% 55.2% 54.0% 56.8% 62.5% 60.0% 40.0% 56.7%61 33.3% 38.5% 47.8% 58.5% 53.2% 58.8% 65.0% 52.6% 54.8%62 35.0% 57.1% 48.0% 59.5% 58.2% 63.1% 61.9% 64.3% 57.9%71 52.6% 63.2% 54.1% 61.1% 54.8% 68.0% 33.3% 100.0% 58.1%72 46.7% 48.5% 43.7% 47.3% 37.0% 57.7% 100.0% 45.5%81 59.6% 51.6% 52.8% 54.1% 42.9% 57.1% 0.0% 53.6%92 38.7% 41.5% 56.0% 68.4% 64.1% 61.8% 52.9% 70.0% 52.8%Total 47.1% 53.9% 54.4% 58.4% 57.2% 54.1% 49.3% 52.7% 52.8%
Final Response Rates by Strata Table - A8
*2-Digit Sector to Industry Titles can be found on Table A45
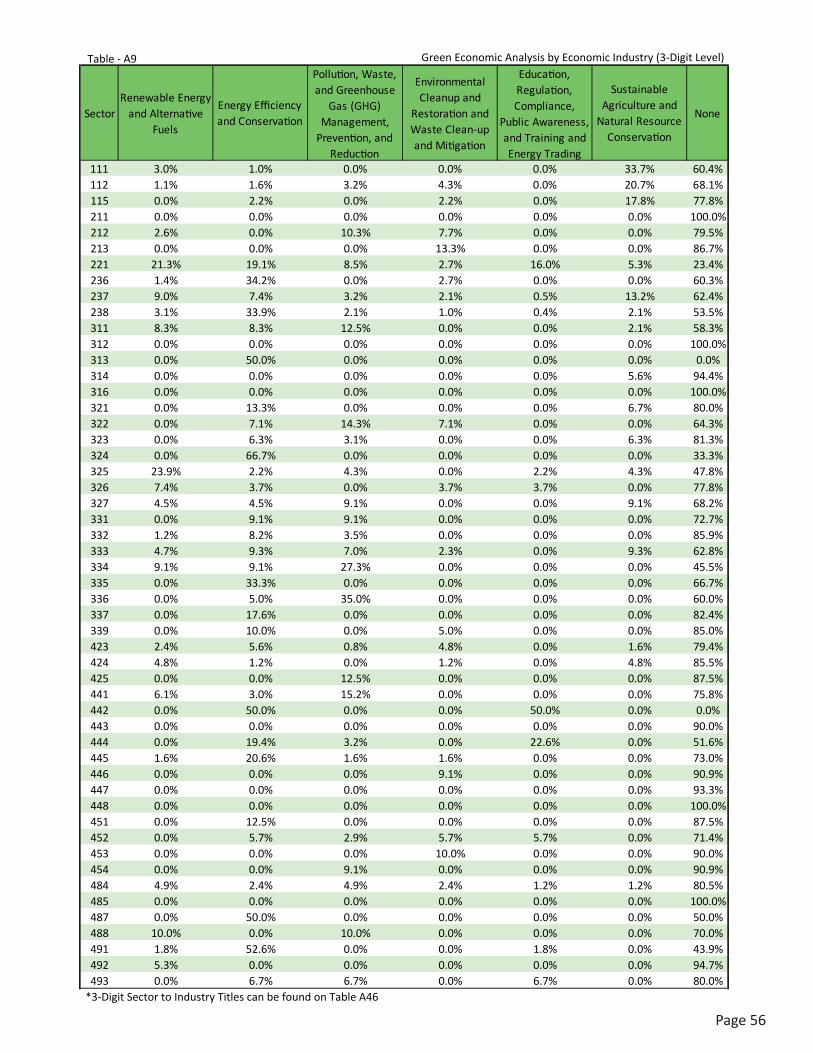
Page56
SectorRenewable Energy
and Alternative Fuels
Energy Efficiency and Conservation
Pollution, Waste, and Greenhouse
Gas (GHG) Management,
Prevention, and Reduction
Environmental Cleanup and
Restoration and Waste Clean-up and Mitigation
Education, Regulation, Compliance,
Public Awareness, and Training and Energy Trading
Sustainable Agriculture and
Natural Resource Conservation
None
111 3.0% 1.0% 0.0% 0.0% 0.0% 33.7% 60.4%112 1.1% 1.6% 3.2% 4.3% 0.0% 20.7% 68.1%115 0.0% 2.2% 0.0% 2.2% 0.0% 17.8% 77.8%211 0.0% 0.0% 0.0% 0.0% 0.0% 0.0% 100.0%212 2.6% 0.0% 10.3% 7.7% 0.0% 0.0% 79.5%213 0.0% 0.0% 0.0% 13.3% 0.0% 0.0% 86.7%221 21.3% 19.1% 8.5% 2.7% 16.0% 5.3% 23.4%236 1.4% 34.2% 0.0% 2.7% 0.0% 0.0% 60.3%237 9.0% 7.4% 3.2% 2.1% 0.5% 13.2% 62.4%238 3.1% 33.9% 2.1% 1.0% 0.4% 2.1% 53.5%311 8.3% 8.3% 12.5% 0.0% 0.0% 2.1% 58.3%312 0.0% 0.0% 0.0% 0.0% 0.0% 0.0% 100.0%313 0.0% 50.0% 0.0% 0.0% 0.0% 0.0% 0.0%314 0.0% 0.0% 0.0% 0.0% 0.0% 5.6% 94.4%316 0.0% 0.0% 0.0% 0.0% 0.0% 0.0% 100.0%321 0.0% 13.3% 0.0% 0.0% 0.0% 6.7% 80.0%322 0.0% 7.1% 14.3% 7.1% 0.0% 0.0% 64.3%323 0.0% 6.3% 3.1% 0.0% 0.0% 6.3% 81.3%324 0.0% 66.7% 0.0% 0.0% 0.0% 0.0% 33.3%325 23.9% 2.2% 4.3% 0.0% 2.2% 4.3% 47.8%326 7.4% 3.7% 0.0% 3.7% 3.7% 0.0% 77.8%327 4.5% 4.5% 9.1% 0.0% 0.0% 9.1% 68.2%331 0.0% 9.1% 9.1% 0.0% 0.0% 0.0% 72.7%332 1.2% 8.2% 3.5% 0.0% 0.0% 0.0% 85.9%333 4.7% 9.3% 7.0% 2.3% 0.0% 9.3% 62.8%334 9.1% 9.1% 27.3% 0.0% 0.0% 0.0% 45.5%335 0.0% 33.3% 0.0% 0.0% 0.0% 0.0% 66.7%336 0.0% 5.0% 35.0% 0.0% 0.0% 0.0% 60.0%337 0.0% 17.6% 0.0% 0.0% 0.0% 0.0% 82.4%339 0.0% 10.0% 0.0% 5.0% 0.0% 0.0% 85.0%423 2.4% 5.6% 0.8% 4.8% 0.0% 1.6% 79.4%424 4.8% 1.2% 0.0% 1.2% 0.0% 4.8% 85.5%425 0.0% 0.0% 12.5% 0.0% 0.0% 0.0% 87.5%441 6.1% 3.0% 15.2% 0.0% 0.0% 0.0% 75.8%442 0.0% 50.0% 0.0% 0.0% 50.0% 0.0% 0.0%443 0.0% 0.0% 0.0% 0.0% 0.0% 0.0% 90.0%444 0.0% 19.4% 3.2% 0.0% 22.6% 0.0% 51.6%445 1.6% 20.6% 1.6% 1.6% 0.0% 0.0% 73.0%446 0.0% 0.0% 0.0% 9.1% 0.0% 0.0% 90.9%447 0.0% 0.0% 0.0% 0.0% 0.0% 0.0% 93.3%448 0.0% 0.0% 0.0% 0.0% 0.0% 0.0% 100.0%451 0.0% 12.5% 0.0% 0.0% 0.0% 0.0% 87.5%452 0.0% 5.7% 2.9% 5.7% 5.7% 0.0% 71.4%453 0.0% 0.0% 0.0% 10.0% 0.0% 0.0% 90.0%454 0.0% 0.0% 9.1% 0.0% 0.0% 0.0% 90.9%484 4.9% 2.4% 4.9% 2.4% 1.2% 1.2% 80.5%485 0.0% 0.0% 0.0% 0.0% 0.0% 0.0% 100.0%487 0.0% 50.0% 0.0% 0.0% 0.0% 0.0% 50.0%488 10.0% 0.0% 10.0% 0.0% 0.0% 0.0% 70.0%491 1.8% 52.6% 0.0% 0.0% 1.8% 0.0% 43.9%492 5.3% 0.0% 0.0% 0.0% 0.0% 0.0% 94.7%493 0.0% 6.7% 6.7% 0.0% 6.7% 0.0% 80.0%
Green Economic Analysis by Economic Industry (3-Digit Level)Table - A9
*3-Digit Sector to Industry Titles can be found on Table A46
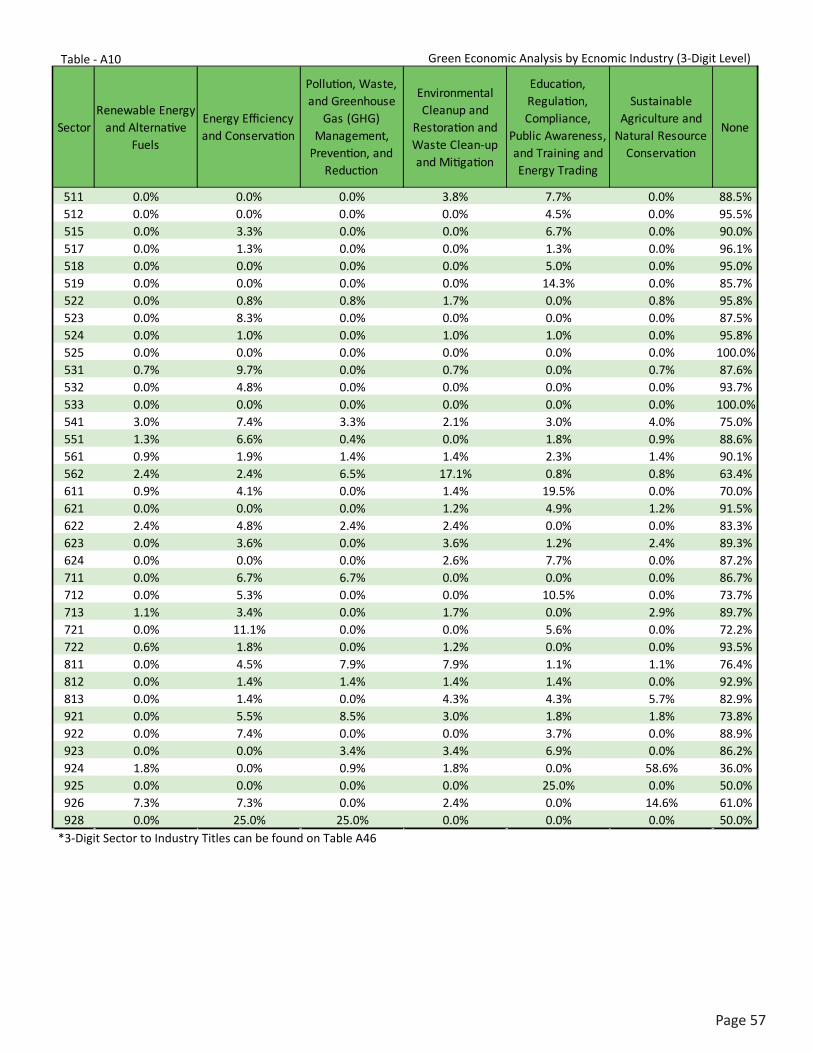
Page57
SectorRenewable Energy
and Alternative Fuels
Energy Efficiency and Conservation
Pollution, Waste, and Greenhouse
Gas (GHG) Management,
Prevention, and Reduction
Environmental Cleanup and
Restoration and Waste Clean-up and Mitigation
Education, Regulation, Compliance,
Public Awareness, and Training and Energy Trading
Sustainable Agriculture and
Natural Resource Conservation
None
511 0.0% 0.0% 0.0% 3.8% 7.7% 0.0% 88.5%512 0.0% 0.0% 0.0% 0.0% 4.5% 0.0% 95.5%515 0.0% 3.3% 0.0% 0.0% 6.7% 0.0% 90.0%517 0.0% 1.3% 0.0% 0.0% 1.3% 0.0% 96.1%518 0.0% 0.0% 0.0% 0.0% 5.0% 0.0% 95.0%519 0.0% 0.0% 0.0% 0.0% 14.3% 0.0% 85.7%522 0.0% 0.8% 0.8% 1.7% 0.0% 0.8% 95.8%523 0.0% 8.3% 0.0% 0.0% 0.0% 0.0% 87.5%524 0.0% 1.0% 0.0% 1.0% 1.0% 0.0% 95.8%525 0.0% 0.0% 0.0% 0.0% 0.0% 0.0% 100.0%531 0.7% 9.7% 0.0% 0.7% 0.0% 0.7% 87.6%532 0.0% 4.8% 0.0% 0.0% 0.0% 0.0% 93.7%533 0.0% 0.0% 0.0% 0.0% 0.0% 0.0% 100.0%541 3.0% 7.4% 3.3% 2.1% 3.0% 4.0% 75.0%551 1.3% 6.6% 0.4% 0.0% 1.8% 0.9% 88.6%561 0.9% 1.9% 1.4% 1.4% 2.3% 1.4% 90.1%562 2.4% 2.4% 6.5% 17.1% 0.8% 0.8% 63.4%611 0.9% 4.1% 0.0% 1.4% 19.5% 0.0% 70.0%621 0.0% 0.0% 0.0% 1.2% 4.9% 1.2% 91.5%622 2.4% 4.8% 2.4% 2.4% 0.0% 0.0% 83.3%623 0.0% 3.6% 0.0% 3.6% 1.2% 2.4% 89.3%624 0.0% 0.0% 0.0% 2.6% 7.7% 0.0% 87.2%711 0.0% 6.7% 6.7% 0.0% 0.0% 0.0% 86.7%712 0.0% 5.3% 0.0% 0.0% 10.5% 0.0% 73.7%713 1.1% 3.4% 0.0% 1.7% 0.0% 2.9% 89.7%721 0.0% 11.1% 0.0% 0.0% 5.6% 0.0% 72.2%722 0.6% 1.8% 0.0% 1.2% 0.0% 0.0% 93.5%811 0.0% 4.5% 7.9% 7.9% 1.1% 1.1% 76.4%812 0.0% 1.4% 1.4% 1.4% 1.4% 0.0% 92.9%813 0.0% 1.4% 0.0% 4.3% 4.3% 5.7% 82.9%921 0.0% 5.5% 8.5% 3.0% 1.8% 1.8% 73.8%922 0.0% 7.4% 0.0% 0.0% 3.7% 0.0% 88.9%923 0.0% 0.0% 3.4% 3.4% 6.9% 0.0% 86.2%924 1.8% 0.0% 0.9% 1.8% 0.0% 58.6% 36.0%925 0.0% 0.0% 0.0% 0.0% 25.0% 0.0% 50.0%926 7.3% 7.3% 0.0% 2.4% 0.0% 14.6% 61.0%928 0.0% 25.0% 25.0% 0.0% 0.0% 0.0% 50.0%
Green Economic Analysis by Ecnomic Industry (3-Digit Level)Table - A10
*3-Digit Sector to Industry Titles can be found on Table A46
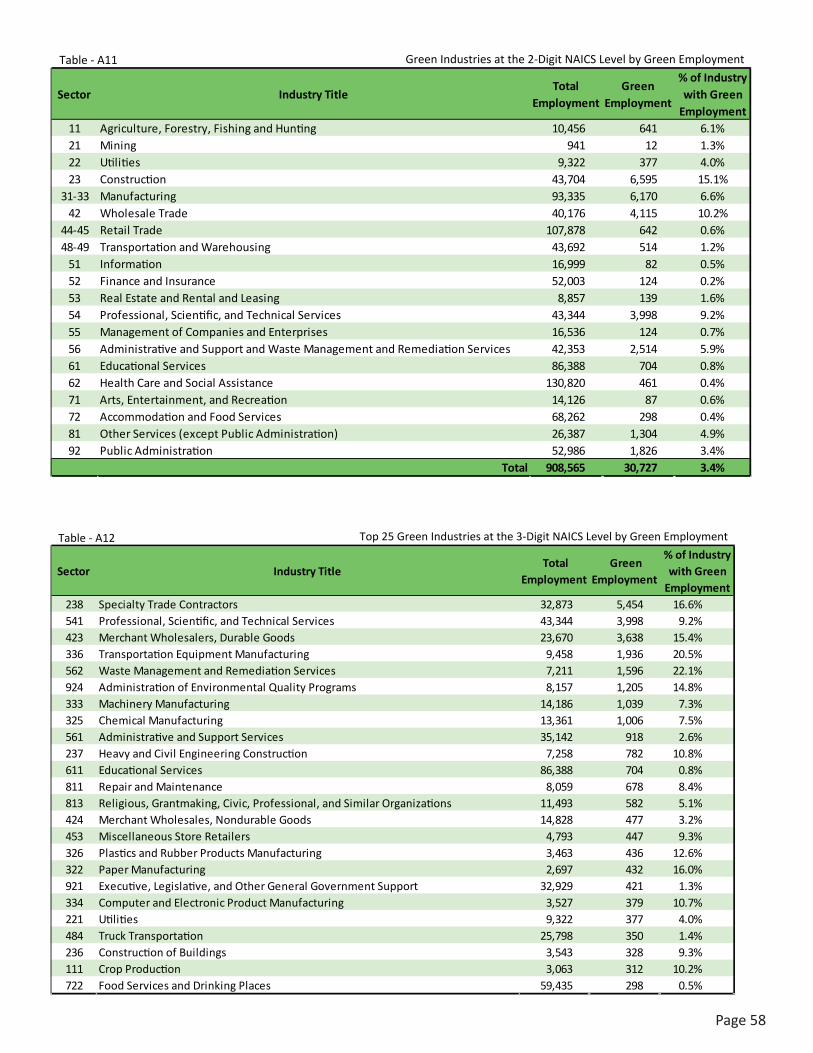
Page58
Sector Industry TitleTotal
EmploymentGreen
Employment
% of Industry with Green
Employment11 Agriculture, Forestry, Fishing and Hunting 10,456 641 6.1%21 Mining 941 12 1.3%22 Utilities 9,322 377 4.0%23 Construction 43,704 6,595 15.1%
31-33 Manufacturing 93,335 6,170 6.6%42 Wholesale Trade 40,176 4,115 10.2%
44-45 Retail Trade 107,878 642 0.6%48-49 Transportation and Warehousing 43,692 514 1.2%
51 Information 16,999 82 0.5%52 Finance and Insurance 52,003 124 0.2%53 Real Estate and Rental and Leasing 8,857 139 1.6%54 Professional, Scientific, and Technical Services 43,344 3,998 9.2%55 Management of Companies and Enterprises 16,536 124 0.7%56 Administrative and Support and Waste Management and Remediation Services 42,353 2,514 5.9%61 Educational Services 86,388 704 0.8%62 Health Care and Social Assistance 130,820 461 0.4%71 Arts, Entertainment, and Recreation 14,126 87 0.6%72 Accommodation and Food Services 68,262 298 0.4%81 Other Services (except Public Administration) 26,387 1,304 4.9%92 Public Administration 52,986 1,826 3.4%
908,565 30,727 3.4%Total
Green Industries at the 2-Digit NAICS Level by Green EmploymentTable - A11
Sector Industry Title Total
Employment Green
Employment
% of Industry with Green
Employment238 Specialty Trade Contractors 32,873 5,454 16.6%541 Professional, Scientific, and Technical Services 43,344 3,998 9.2%423 Merchant Wholesalers, Durable Goods 23,670 3,638 15.4%336 Transportation Equipment Manufacturing 9,458 1,936 20.5%562 Waste Management and Remediation Services 7,211 1,596 22.1%924 Administration of Environmental Quality Programs 8,157 1,205 14.8%333 Machinery Manufacturing 14,186 1,039 7.3%325 Chemical Manufacturing 13,361 1,006 7.5%561 Administrative and Support Services 35,142 918 2.6%237 Heavy and Civil Engineering Construction 7,258 782 10.8%611 Educational Services 86,388 704 0.8%811 Repair and Maintenance 8,059 678 8.4%813 Religious, Grantmaking, Civic, Professional, and Similar Organizations 11,493 582 5.1%424 Merchant Wholesales, Nondurable Goods 14,828 477 3.2%453 Miscellaneous Store Retailers 4,793 447 9.3%326 Plastics and Rubber Products Manufacturing 3,463 436 12.6%322 Paper Manufacturing 2,697 432 16.0%921 Executive, Legislative, and Other General Government Support 32,929 421 1.3%334 Computer and Electronic Product Manufacturing 3,527 379 10.7%221 Utilities 9,322 377 4.0%484 Truck Transportation 25,798 350 1.4%236 Construction of Buildings 3,543 328 9.3%111 Crop Production 3,063 312 10.2%722 Food Services and Drinking Places 59,435 298 0.5%
Top 25 Green Industries at the 3-Digit NAICS Level by Green EmploymentTable - A12
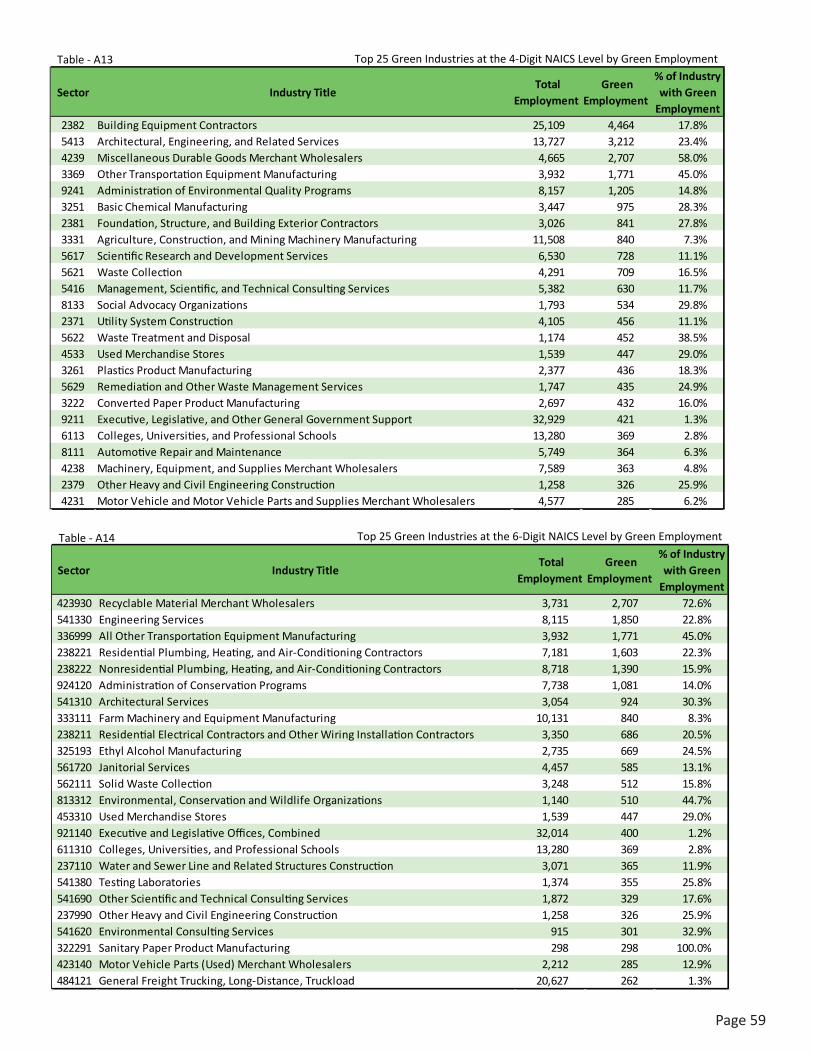
Page59
Sector Industry Title Total
Employment Green
Employment
% of Industry with Green
Employment2382 Building Equipment Contractors 25,109 4,464 17.8%5413 Architectural, Engineering, and Related Services 13,727 3,212 23.4%4239 Miscellaneous Durable Goods Merchant Wholesalers 4,665 2,707 58.0%3369 Other Transportation Equipment Manufacturing 3,932 1,771 45.0%9241 Administration of Environmental Quality Programs 8,157 1,205 14.8%3251 Basic Chemical Manufacturing 3,447 975 28.3%2381 Foundation, Structure, and Building Exterior Contractors 3,026 841 27.8%3331 Agriculture, Construction, and Mining Machinery Manufacturing 11,508 840 7.3%5617 Scientific Research and Development Services 6,530 728 11.1%5621 Waste Collection 4,291 709 16.5%5416 Management, Scientific, and Technical Consulting Services 5,382 630 11.7%8133 Social Advocacy Organizations 1,793 534 29.8%2371 Utility System Construction 4,105 456 11.1%5622 Waste Treatment and Disposal 1,174 452 38.5%4533 Used Merchandise Stores 1,539 447 29.0%3261 Plastics Product Manufacturing 2,377 436 18.3%5629 Remediation and Other Waste Management Services 1,747 435 24.9%3222 Converted Paper Product Manufacturing 2,697 432 16.0%9211 Executive, Legislative, and Other General Government Support 32,929 421 1.3%6113 Colleges, Universities, and Professional Schools 13,280 369 2.8%8111 Automotive Repair and Maintenance 5,749 364 6.3%4238 Machinery, Equipment, and Supplies Merchant Wholesalers 7,589 363 4.8%2379 Other Heavy and Civil Engineering Construction 1,258 326 25.9%4231 Motor Vehicle and Motor Vehicle Parts and Supplies Merchant Wholesalers 4,577 285 6.2%
Top 25 Green Industries at the 4-Digit NAICS Level by Green EmploymentTable - A13
Sector Industry Title Total
Employment Green
Employment
% of Industry with Green
Employment423930 Recyclable Material Merchant Wholesalers 3,731 2,707 72.6%541330 Engineering Services 8,115 1,850 22.8%336999 All Other Transportation Equipment Manufacturing 3,932 1,771 45.0%238221 Residential Plumbing, Heating, and Air-Conditioning Contractors 7,181 1,603 22.3%238222 Nonresidential Plumbing, Heating, and Air-Conditioning Contractors 8,718 1,390 15.9%924120 Administration of Conservation Programs 7,738 1,081 14.0%541310 Architectural Services 3,054 924 30.3%333111 Farm Machinery and Equipment Manufacturing 10,131 840 8.3%238211 Residential Electrical Contractors and Other Wiring Installation Contractors 3,350 686 20.5%325193 Ethyl Alcohol Manufacturing 2,735 669 24.5%561720 Janitorial Services 4,457 585 13.1%562111 Solid Waste Collection 3,248 512 15.8%813312 Environmental, Conservation and Wildlife Organizations 1,140 510 44.7%453310 Used Merchandise Stores 1,539 447 29.0%921140 Executive and Legislative Offices, Combined 32,014 400 1.2%611310 Colleges, Universities, and Professional Schools 13,280 369 2.8%237110 Water and Sewer Line and Related Structures Construction 3,071 365 11.9%541380 Testing Laboratories 1,374 355 25.8%541690 Other Scientific and Technical Consulting Services 1,872 329 17.6%237990 Other Heavy and Civil Engineering Construction 1,258 326 25.9%541620 Environmental Consulting Services 915 301 32.9%322291 Sanitary Paper Product Manufacturing 298 298 100.0%423140 Motor Vehicle Parts (Used) Merchant Wholesalers 2,212 285 12.9%484121 General Freight Trucking, Long-Distance, Truckload 20,627 262 1.3%
Top 25 Green Industries at the 6-Digit NAICS Level by Green EmploymentTable - A14
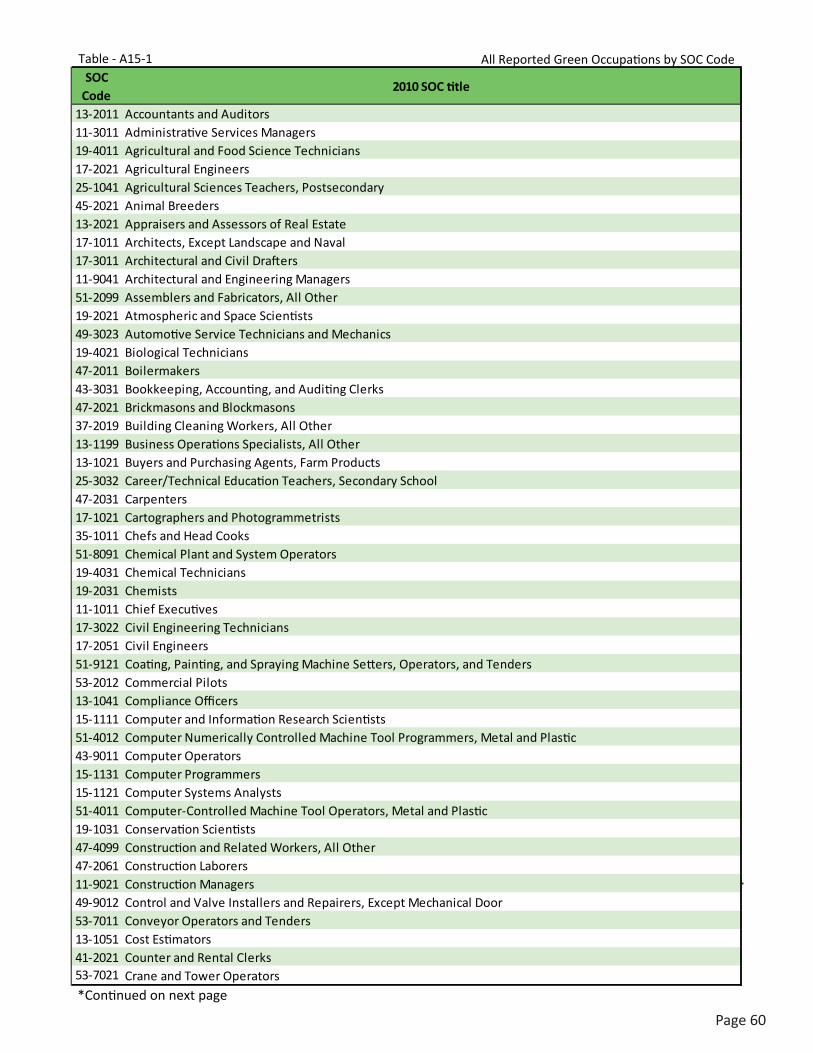
Page60
SOC Code
2010 SOC title
13-2011 Accountants and Auditors11-3011 Administrative Services Managers19-4011 Agricultural and Food Science Technicians17-2021 Agricultural Engineers25-1041 Agricultural Sciences Teachers, Postsecondary45-2021 Animal Breeders13-2021 Appraisers and Assessors of Real Estate17-1011 Architects, Except Landscape and Naval17-3011 Architectural and Civil Drafters11-9041 Architectural and Engineering Managers51-2099 Assemblers and Fabricators, All Other19-2021 Atmospheric and Space Scientists49-3023 Automotive Service Technicians and Mechanics19-4021 Biological Technicians47-2011 Boilermakers43-3031 Bookkeeping, Accounting, and Auditing Clerks47-2021 Brickmasons and Blockmasons37-2019 Building Cleaning Workers, All Other13-1199 Business Operations Specialists, All Other13-1021 Buyers and Purchasing Agents, Farm Products25-3032 Career/Technical Education Teachers, Secondary School47-2031 Carpenters17-1021 Cartographers and Photogrammetrists35-1011 Chefs and Head Cooks51-8091 Chemical Plant and System Operators19-4031 Chemical Technicians19-2031 Chemists11-1011 Chief Executives17-3022 Civil Engineering Technicians17-2051 Civil Engineers51-9121 Coating, Painting, and Spraying Machine Setters, Operators, and Tenders53-2012 Commercial Pilots13-1041 Compliance Officers15-1111 Computer and Information Research Scientists51-4012 Computer Numerically Controlled Machine Tool Programmers, Metal and Plastic43-9011 Computer Operators15-1131 Computer Programmers15-1121 Computer Systems Analysts51-4011 Computer-Controlled Machine Tool Operators, Metal and Plastic19-1031 Conservation Scientists47-4099 Construction and Related Workers, All Other47-2061 Construction Laborers11-9021 Construction Managers49-9012 Control and Valve Installers and Repairers, Except Mechanical Door53-7011 Conveyor Operators and Tenders13-1051 Cost Estimators41-2021 Counter and Rental Clerks53-7021 Crane and Tower Operators
All Reported Green Occupations by SOC CodeTable - A15-1
*Continued on next page

Page61
SOC Code
2010 SOC title
51-9021 Crushing, Grinding, and Polishing Machine Setters, Operators, and Tenders43-4051 Customer Service Representatives51-9032 Cutting and Slicing Machine Setters, Operators, and Tenders51-4031 Cutting, Punching, and Press Machine Setters, Operators, and Tenders, Metal and Plastic43-9021 Data Entry Keyers31-9091 Dental Assistants17-3019 Drafters, All Other53-7031 Dredge Operators53-3031 Driver/Sales Workers47-5021 Earth Drillers, Except Oil and Gas11-9039 Education Administrators, All Other11-9032 Education Administrators, Elementary and Secondary School11-9031 Education Administrators, Preschool and Childcare Center/Program51-2022 Electrical and Electronic Equipment Assemblers17-3012 Electrical and Electronics Drafters17-3023 Electrical and Electronics Engineering Technicians17-2071 Electrical Engineers49-9051 Electrical Power-Line Installers and Repairers47-2111 Electricians51-2023 Electromechanical Equipment Assemblers49-2097 Electronic Home Entertainment Equipment Installers and Repairers43-4061 Eligibility Interviewers, Government Programs17-3029 Engineering Technicians, Except Drafters, All Other17-2199 Engineers, All Other17-3025 Environmental Engineering Technicians17-2081 Environmental Engineers19-4091 Environmental Science and Protection Technicians, Including Health19-2041 Environmental Scientists and Specialists, Including Health53-7032 Excavating and Loading Machine and Dragline Operators43-6011 Executive Secretaries and Executive Administrative Assistants51-9041 Extruding, Forming, Pressing, and Compacting Machine Setters, Operators, and Tenders49-3041 Farm Equipment Mechanics and Service Technicians11-9013 Farmers, Ranchers, and Other Agricultural Managers**45-2092 Farmworkers and Laborers, Crop, Nursery, and Greenhouse45-2093 Farmworkers, Farm, Ranch, and Aquacultural Animals51-2091 Fiberglass Laminators and Fabricators11-3031 Financial Managers47-1011 First-Line Supervisors of Construction Trades and Extraction Workers45-1011 First-Line Supervisors of Farming, Fishing, and Forestry Workers53-1021 First-Line Supervisors of Helpers, Laborers, and Material Movers, Hand37-1011 First-Line Supervisors of Housekeeping and Janitorial Workers37-1012 First-Line Supervisors of Landscaping, Lawn Service, and Groundskeeping Workers49-1011 First-Line Supervisors of Mechanics, Installers, and Repairers43-1011 First-Line Supervisors of Office and Administrative Support Workers51-1011 First-Line Supervisors of Production and Operating Workers53-1031 First-Line Supervisors of Transportation and Material-Moving Machine and Vehicle Operators47-2042 Floor Layers, Except Carpet, Wood, and Hard Tiles51-3091 Food and Tobacco Roasting, Baking, and Drying Machine Operators and Tenders35-9099 Food Preparation and Serving Related Workers, All Other51-3099 Food Processing Workers, All Other
All Reported Green Occupations by SOC CodeTable - A15-2
*Continued on next page
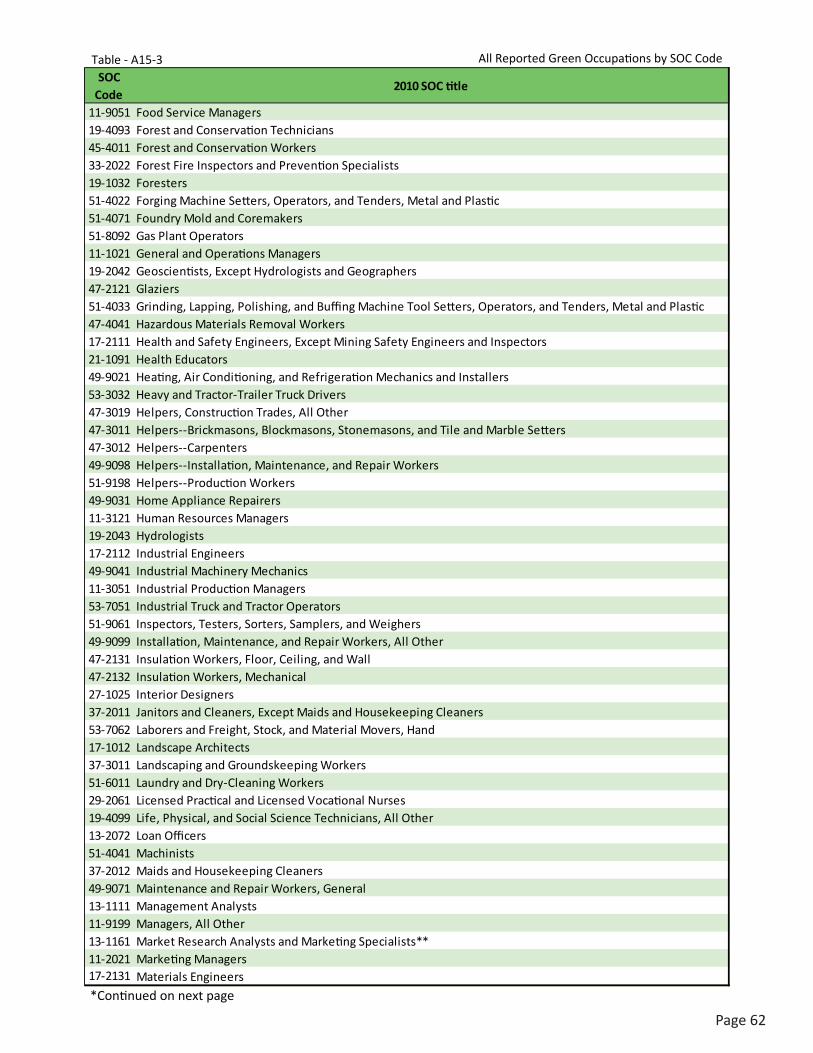
Page62
SOC Code
2010 SOC title
11-9051 Food Service Managers19-4093 Forest and Conservation Technicians45-4011 Forest and Conservation Workers33-2022 Forest Fire Inspectors and Prevention Specialists19-1032 Foresters51-4022 Forging Machine Setters, Operators, and Tenders, Metal and Plastic51-4071 Foundry Mold and Coremakers51-8092 Gas Plant Operators11-1021 General and Operations Managers19-2042 Geoscientists, Except Hydrologists and Geographers47-2121 Glaziers51-4033 Grinding, Lapping, Polishing, and Buffing Machine Tool Setters, Operators, and Tenders, Metal and Plastic47-4041 Hazardous Materials Removal Workers17-2111 Health and Safety Engineers, Except Mining Safety Engineers and Inspectors21-1091 Health Educators 49-9021 Heating, Air Conditioning, and Refrigeration Mechanics and Installers53-3032 Heavy and Tractor-Trailer Truck Drivers47-3019 Helpers, Construction Trades, All Other47-3011 Helpers--Brickmasons, Blockmasons, Stonemasons, and Tile and Marble Setters47-3012 Helpers--Carpenters49-9098 Helpers--Installation, Maintenance, and Repair Workers51-9198 Helpers--Production Workers49-9031 Home Appliance Repairers11-3121 Human Resources Managers19-2043 Hydrologists17-2112 Industrial Engineers49-9041 Industrial Machinery Mechanics11-3051 Industrial Production Managers53-7051 Industrial Truck and Tractor Operators51-9061 Inspectors, Testers, Sorters, Samplers, and Weighers49-9099 Installation, Maintenance, and Repair Workers, All Other47-2131 Insulation Workers, Floor, Ceiling, and Wall47-2132 Insulation Workers, Mechanical27-1025 Interior Designers37-2011 Janitors and Cleaners, Except Maids and Housekeeping Cleaners53-7062 Laborers and Freight, Stock, and Material Movers, Hand17-1012 Landscape Architects37-3011 Landscaping and Groundskeeping Workers51-6011 Laundry and Dry-Cleaning Workers29-2061 Licensed Practical and Licensed Vocational Nurses19-4099 Life, Physical, and Social Science Technicians, All Other13-2072 Loan Officers51-4041 Machinists37-2012 Maids and Housekeeping Cleaners49-9071 Maintenance and Repair Workers, General13-1111 Management Analysts11-9199 Managers, All Other13-1161 Market Research Analysts and Marketing Specialists** 11-2021 Marketing Managers17-2131 Materials Engineers
All Reported Green Occupations by SOC CodeTable - A15-3
*Continued on next page
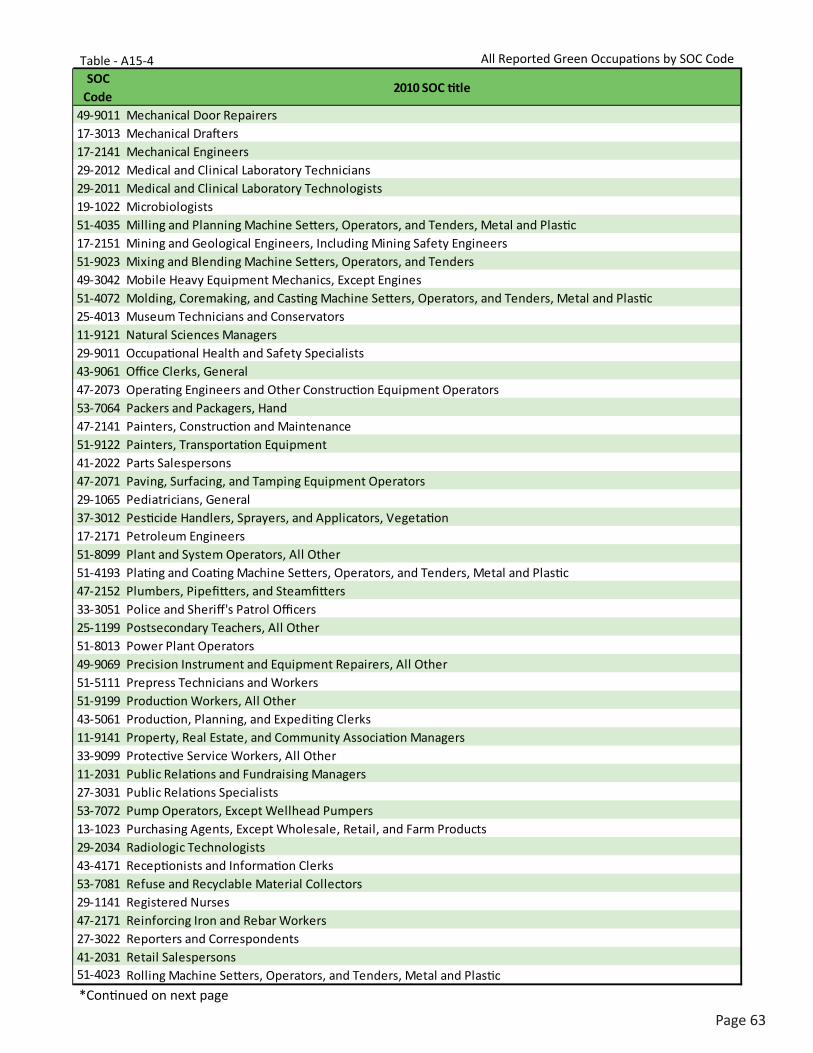
Page63
SOC Code
2010 SOC title
49-9011 Mechanical Door Repairers17-3013 Mechanical Drafters17-2141 Mechanical Engineers29-2012 Medical and Clinical Laboratory Technicians29-2011 Medical and Clinical Laboratory Technologists19-1022 Microbiologists51-4035 Milling and Planning Machine Setters, Operators, and Tenders, Metal and Plastic17-2151 Mining and Geological Engineers, Including Mining Safety Engineers51-9023 Mixing and Blending Machine Setters, Operators, and Tenders49-3042 Mobile Heavy Equipment Mechanics, Except Engines51-4072 Molding, Coremaking, and Casting Machine Setters, Operators, and Tenders, Metal and Plastic25-4013 Museum Technicians and Conservators11-9121 Natural Sciences Managers29-9011 Occupational Health and Safety Specialists43-9061 Office Clerks, General47-2073 Operating Engineers and Other Construction Equipment Operators53-7064 Packers and Packagers, Hand47-2141 Painters, Construction and Maintenance51-9122 Painters, Transportation Equipment41-2022 Parts Salespersons47-2071 Paving, Surfacing, and Tamping Equipment Operators29-1065 Pediatricians, General37-3012 Pesticide Handlers, Sprayers, and Applicators, Vegetation17-2171 Petroleum Engineers51-8099 Plant and System Operators, All Other51-4193 Plating and Coating Machine Setters, Operators, and Tenders, Metal and Plastic47-2152 Plumbers, Pipefitters, and Steamfitters33-3051 Police and Sheriff's Patrol Officers25-1199 Postsecondary Teachers, All Other51-8013 Power Plant Operators49-9069 Precision Instrument and Equipment Repairers, All Other51-5111 Prepress Technicians and Workers51-9199 Production Workers, All Other43-5061 Production, Planning, and Expediting Clerks11-9141 Property, Real Estate, and Community Association Managers33-9099 Protective Service Workers, All Other11-2031 Public Relations and Fundraising Managers27-3031 Public Relations Specialists53-7072 Pump Operators, Except Wellhead Pumpers13-1023 Purchasing Agents, Except Wholesale, Retail, and Farm Products29-2034 Radiologic Technologists 43-4171 Receptionists and Information Clerks53-7081 Refuse and Recyclable Material Collectors29-1141 Registered Nurses47-2171 Reinforcing Iron and Rebar Workers27-3022 Reporters and Correspondents41-2031 Retail Salespersons51-4023 Rolling Machine Setters, Operators, and Tenders, Metal and Plastic
All Reported Green Occupations by SOC CodeTable - A15-4
*Continued on next page
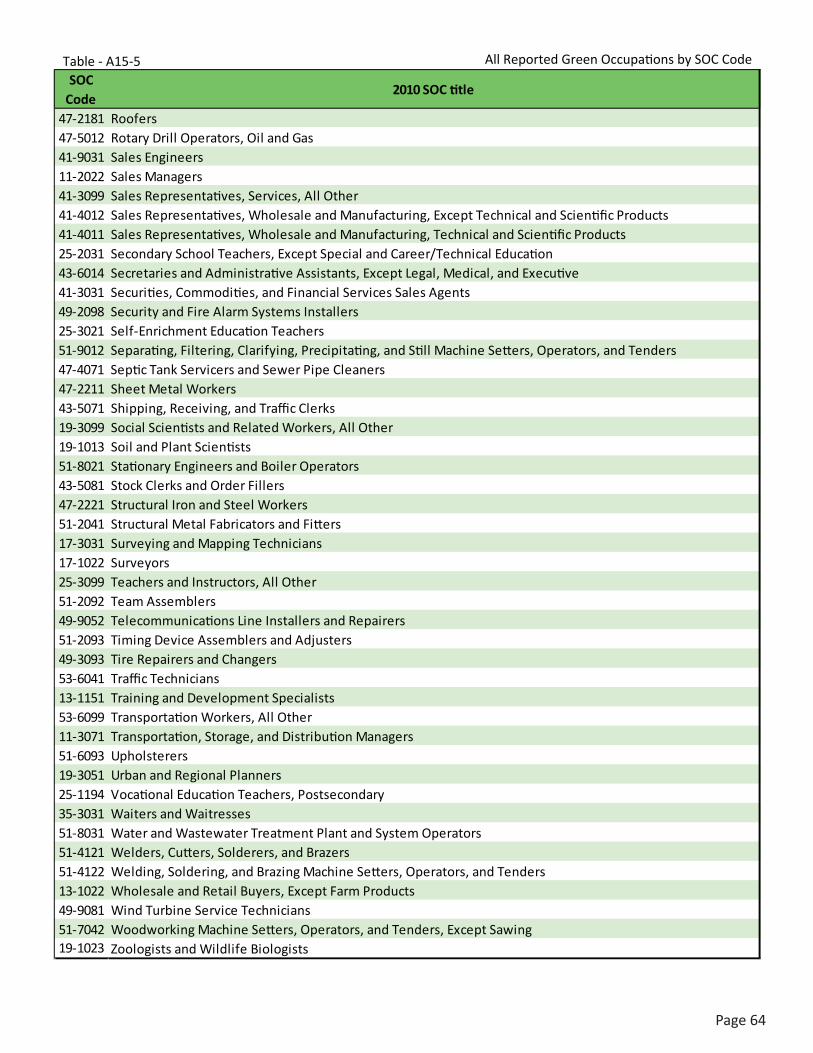
Page64
SOC Code
2010 SOC title
47-2181 Roofers47-5012 Rotary Drill Operators, Oil and Gas41-9031 Sales Engineers11-2022 Sales Managers41-3099 Sales Representatives, Services, All Other41-4012 Sales Representatives, Wholesale and Manufacturing, Except Technical and Scientific Products41-4011 Sales Representatives, Wholesale and Manufacturing, Technical and Scientific Products25-2031 Secondary School Teachers, Except Special and Career/Technical Education43-6014 Secretaries and Administrative Assistants, Except Legal, Medical, and Executive41-3031 Securities, Commodities, and Financial Services Sales Agents49-2098 Security and Fire Alarm Systems Installers25-3021 Self-Enrichment Education Teachers51-9012 Separating, Filtering, Clarifying, Precipitating, and Still Machine Setters, Operators, and Tenders47-4071 Septic Tank Servicers and Sewer Pipe Cleaners47-2211 Sheet Metal Workers43-5071 Shipping, Receiving, and Traffic Clerks19-3099 Social Scientists and Related Workers, All Other19-1013 Soil and Plant Scientists51-8021 Stationary Engineers and Boiler Operators43-5081 Stock Clerks and Order Fillers47-2221 Structural Iron and Steel Workers51-2041 Structural Metal Fabricators and Fitters17-3031 Surveying and Mapping Technicians17-1022 Surveyors25-3099 Teachers and Instructors, All Other51-2092 Team Assemblers49-9052 Telecommunications Line Installers and Repairers51-2093 Timing Device Assemblers and Adjusters49-3093 Tire Repairers and Changers53-6041 Traffic Technicians13-1151 Training and Development Specialists53-6099 Transportation Workers, All Other11-3071 Transportation, Storage, and Distribution Managers51-6093 Upholsterers19-3051 Urban and Regional Planners25-1194 Vocational Education Teachers, Postsecondary35-3031 Waiters and Waitresses51-8031 Water and Wastewater Treatment Plant and System Operators51-4121 Welders, Cutters, Solderers, and Brazers51-4122 Welding, Soldering, and Brazing Machine Setters, Operators, and Tenders13-1022 Wholesale and Retail Buyers, Except Farm Products49-9081 Wind Turbine Service Technicians51-7042 Woodworking Machine Setters, Operators, and Tenders, Except Sawing19-1023 Zoologists and Wildlife Biologists
All Reported Green Occupations by SOC CodeTable - A15-5
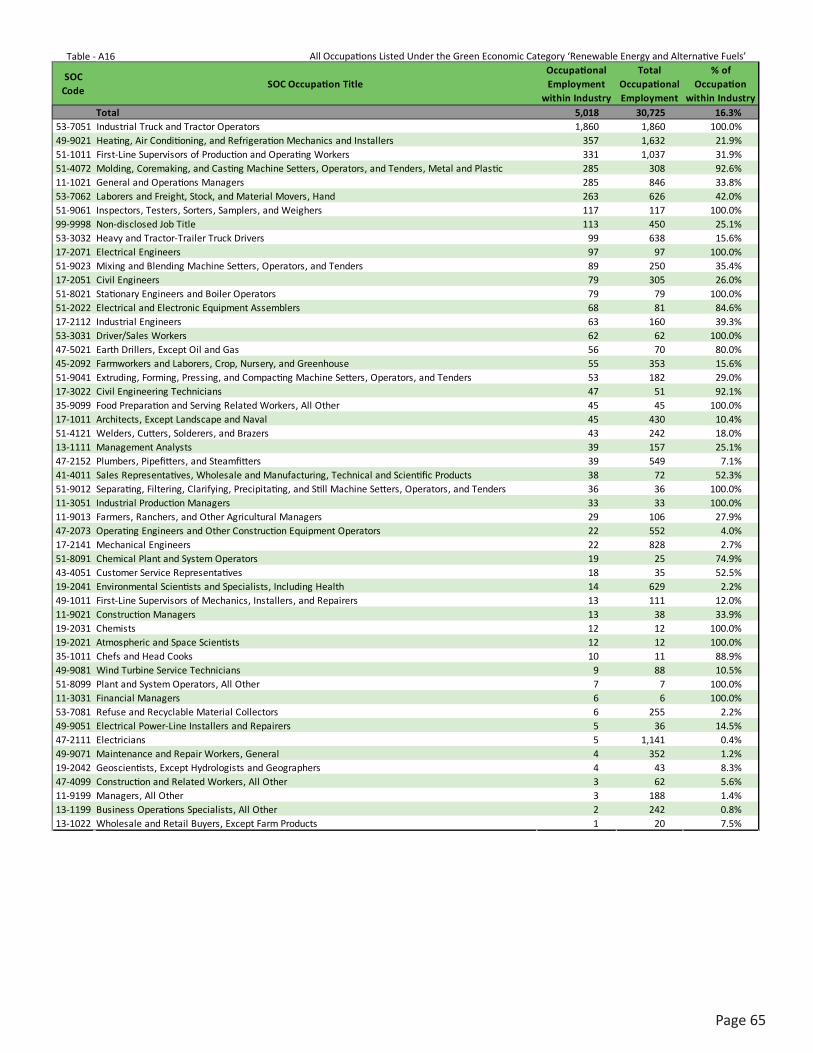
Page65
All Occupations Listed Under the Green Economic Category ‘Renewable Energy and Alternative Fuels’Table - A16
SOC Code
SOC Occupation TitleOccupational Employment
within Industry
Total Occupational Employment
% of Occupation
within Industry5,018 30,725 16.3%
53-7051 Industrial Truck and Tractor Operators 1,860 1,860 100.0%49-9021 Heating, Air Conditioning, and Refrigeration Mechanics and Installers 357 1,632 21.9%51-1011 First-Line Supervisors of Production and Operating Workers 331 1,037 31.9%51-4072 Molding, Coremaking, and Casting Machine Setters, Operators, and Tenders, Metal and Plastic 285 308 92.6%11-1021 General and Operations Managers 285 846 33.8%53-7062 Laborers and Freight, Stock, and Material Movers, Hand 263 626 42.0%51-9061 Inspectors, Testers, Sorters, Samplers, and Weighers 117 117 100.0%99-9998 Non-disclosed Job Title 113 450 25.1%53-3032 Heavy and Tractor-Trailer Truck Drivers 99 638 15.6%17-2071 Electrical Engineers 97 97 100.0%51-9023 Mixing and Blending Machine Setters, Operators, and Tenders 89 250 35.4%17-2051 Civil Engineers 79 305 26.0%51-8021 Stationary Engineers and Boiler Operators 79 79 100.0%51-2022 Electrical and Electronic Equipment Assemblers 68 81 84.6%17-2112 Industrial Engineers 63 160 39.3%53-3031 Driver/Sales Workers 62 62 100.0%47-5021 Earth Drillers, Except Oil and Gas 56 70 80.0%45-2092 Farmworkers and Laborers, Crop, Nursery, and Greenhouse 55 353 15.6%51-9041 Extruding, Forming, Pressing, and Compacting Machine Setters, Operators, and Tenders 53 182 29.0%17-3022 Civil Engineering Technicians 47 51 92.1%35-9099 Food Preparation and Serving Related Workers, All Other 45 45 100.0%17-1011 Architects, Except Landscape and Naval 45 430 10.4%51-4121 Welders, Cutters, Solderers, and Brazers 43 242 18.0%13-1111 Management Analysts 39 157 25.1%47-2152 Plumbers, Pipefitters, and Steamfitters 39 549 7.1%41-4011 Sales Representatives, Wholesale and Manufacturing, Technical and Scientific Products 38 72 52.3%51-9012 Separating, Filtering, Clarifying, Precipitating, and Still Machine Setters, Operators, and Tenders 36 36 100.0%11-3051 Industrial Production Managers 33 33 100.0%11-9013 Farmers, Ranchers, and Other Agricultural Managers 29 106 27.9%47-2073 Operating Engineers and Other Construction Equipment Operators 22 552 4.0%17-2141 Mechanical Engineers 22 828 2.7%51-8091 Chemical Plant and System Operators 19 25 74.9%43-4051 Customer Service Representatives 18 35 52.5%19-2041 Environmental Scientists and Specialists, Including Health 14 629 2.2%49-1011 First-Line Supervisors of Mechanics, Installers, and Repairers 13 111 12.0%11-9021 Construction Managers 13 38 33.9%19-2031 Chemists 12 12 100.0%19-2021 Atmospheric and Space Scientists 12 12 100.0%35-1011 Chefs and Head Cooks 10 11 88.9%49-9081 Wind Turbine Service Technicians 9 88 10.5%51-8099 Plant and System Operators, All Other 7 7 100.0%11-3031 Financial Managers 6 6 100.0%53-7081 Refuse and Recyclable Material Collectors 6 255 2.2%49-9051 Electrical Power-Line Installers and Repairers 5 36 14.5%47-2111 Electricians 5 1,141 0.4%49-9071 Maintenance and Repair Workers, General 4 352 1.2%19-2042 Geoscientists, Except Hydrologists and Geographers 4 43 8.3%47-4099 Construction and Related Workers, All Other 3 62 5.6%11-9199 Managers, All Other 3 188 1.4%13-1199 Business Operations Specialists, All Other 2 242 0.8%13-1022 Wholesale and Retail Buyers, Except Farm Products 1 20 7.5%
Total
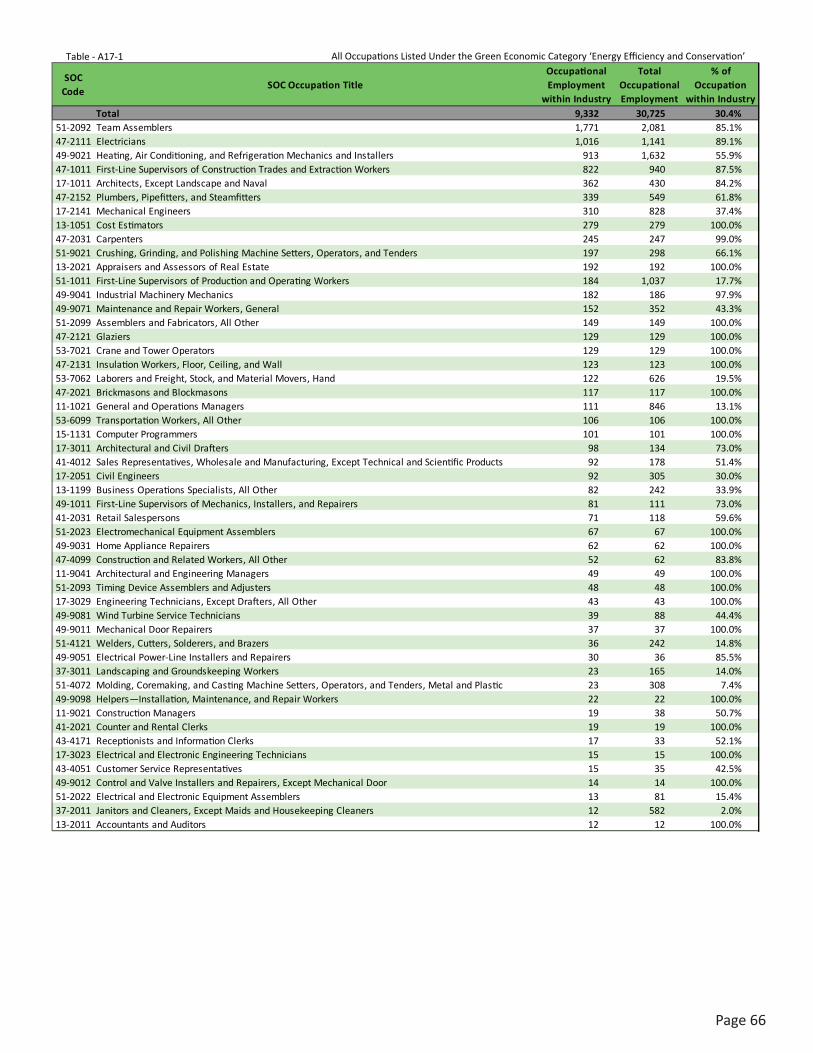
Page66
All Occupations Listed Under the Green Economic Category ‘Energy Efficiency and Conservation’Table - A17-1
SOC Code
SOC Occupation TitleOccupational Employment
within Industry
Total Occupational Employment
% of Occupation
within Industry9,332 30,725 30.4%
51-2092 Team Assemblers 1,771 2,081 85.1%47-2111 Electricians 1,016 1,141 89.1%49-9021 Heating, Air Conditioning, and Refrigeration Mechanics and Installers 913 1,632 55.9%47-1011 First-Line Supervisors of Construction Trades and Extraction Workers 822 940 87.5%17-1011 Architects, Except Landscape and Naval 362 430 84.2%47-2152 Plumbers, Pipefitters, and Steamfitters 339 549 61.8%17-2141 Mechanical Engineers 310 828 37.4%13-1051 Cost Estimators 279 279 100.0%47-2031 Carpenters 245 247 99.0%51-9021 Crushing, Grinding, and Polishing Machine Setters, Operators, and Tenders 197 298 66.1%13-2021 Appraisers and Assessors of Real Estate 192 192 100.0%51-1011 First-Line Supervisors of Production and Operating Workers 184 1,037 17.7%49-9041 Industrial Machinery Mechanics 182 186 97.9%49-9071 Maintenance and Repair Workers, General 152 352 43.3%51-2099 Assemblers and Fabricators, All Other 149 149 100.0%47-2121 Glaziers 129 129 100.0%53-7021 Crane and Tower Operators 129 129 100.0%47-2131 Insulation Workers, Floor, Ceiling, and Wall 123 123 100.0%53-7062 Laborers and Freight, Stock, and Material Movers, Hand 122 626 19.5%47-2021 Brickmasons and Blockmasons 117 117 100.0%11-1021 General and Operations Managers 111 846 13.1%53-6099 Transportation Workers, All Other 106 106 100.0%15-1131 Computer Programmers 101 101 100.0%17-3011 Architectural and Civil Drafters 98 134 73.0%41-4012 Sales Representatives, Wholesale and Manufacturing, Except Technical and Scientific Products 92 178 51.4%17-2051 Civil Engineers 92 305 30.0%13-1199 Business Operations Specialists, All Other 82 242 33.9%49-1011 First-Line Supervisors of Mechanics, Installers, and Repairers 81 111 73.0%41-2031 Retail Salespersons 71 118 59.6%51-2023 Electromechanical Equipment Assemblers 67 67 100.0%49-9031 Home Appliance Repairers 62 62 100.0%47-4099 Construction and Related Workers, All Other 52 62 83.8%11-9041 Architectural and Engineering Managers 49 49 100.0%51-2093 Timing Device Assemblers and Adjusters 48 48 100.0%17-3029 Engineering Technicians, Except Drafters, All Other 43 43 100.0%49-9081 Wind Turbine Service Technicians 39 88 44.4%49-9011 Mechanical Door Repairers 37 37 100.0%51-4121 Welders, Cutters, Solderers, and Brazers 36 242 14.8%49-9051 Electrical Power-Line Installers and Repairers 30 36 85.5%37-3011 Landscaping and Groundskeeping Workers 23 165 14.0%51-4072 Molding, Coremaking, and Casting Machine Setters, Operators, and Tenders, Metal and Plastic 23 308 7.4%49-9098 Helpers―Installation, Maintenance, and Repair Workers 22 22 100.0%11-9021 Construction Managers 19 38 50.7%41-2021 Counter and Rental Clerks 19 19 100.0%43-4171 Receptionists and Information Clerks 17 33 52.1%17-3023 Electrical and Electronic Engineering Technicians 15 15 100.0%43-4051 Customer Service Representatives 15 35 42.5%49-9012 Control and Valve Installers and Repairers, Except Mechanical Door 14 14 100.0%51-2022 Electrical and Electronic Equipment Assemblers 13 81 15.4%37-2011 Janitors and Cleaners, Except Maids and Housekeeping Cleaners 12 582 2.0%13-2011 Accountants and Auditors 12 12 100.0%
Total
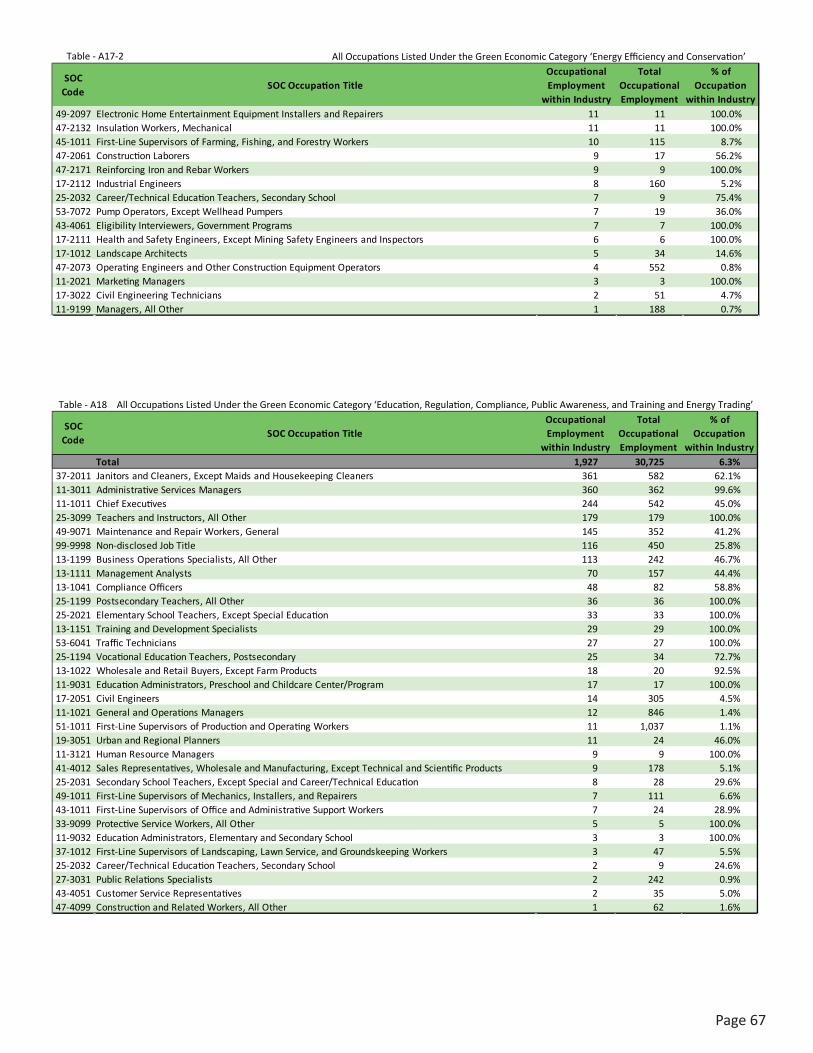
Page67
All Occupations Listed Under the Green Economic Category ‘Energy Efficiency and Conservation’Table - A17-2
SOC Code
SOC Occupation TitleOccupational Employment
within Industry
Total Occupational Employment
% of Occupation
within Industry49-2097 Electronic Home Entertainment Equipment Installers and Repairers 11 11 100.0%47-2132 Insulation Workers, Mechanical 11 11 100.0%45-1011 First-Line Supervisors of Farming, Fishing, and Forestry Workers 10 115 8.7%47-2061 Construction Laborers 9 17 56.2%47-2171 Reinforcing Iron and Rebar Workers 9 9 100.0%17-2112 Industrial Engineers 8 160 5.2%25-2032 Career/Technical Education Teachers, Secondary School 7 9 75.4%53-7072 Pump Operators, Except Wellhead Pumpers 7 19 36.0%43-4061 Eligibility Interviewers, Government Programs 7 7 100.0%17-2111 Health and Safety Engineers, Except Mining Safety Engineers and Inspectors 6 6 100.0%17-1012 Landscape Architects 5 34 14.6%47-2073 Operating Engineers and Other Construction Equipment Operators 4 552 0.8%11-2021 Marketing Managers 3 3 100.0%17-3022 Civil Engineering Technicians 2 51 4.7%11-9199 Managers, All Other 1 188 0.7%
All Occupations Listed Under the Green Economic Category ‘Education, Regulation, Compliance, Public Awareness, and Training and Energy Trading’Table - A18
SOC Code
SOC Occupation TitleOccupational Employment
within Industry
Total Occupational Employment
% of Occupation
within Industry1,927 30,725 6.3%
37-2011 Janitors and Cleaners, Except Maids and Housekeeping Cleaners 361 582 62.1%11-3011 Administrative Services Managers 360 362 99.6%11-1011 Chief Executives 244 542 45.0%25-3099 Teachers and Instructors, All Other 179 179 100.0%49-9071 Maintenance and Repair Workers, General 145 352 41.2%99-9998 Non-disclosed Job Title 116 450 25.8%13-1199 Business Operations Specialists, All Other 113 242 46.7%13-1111 Management Analysts 70 157 44.4%13-1041 Compliance Officers 48 82 58.8%25-1199 Postsecondary Teachers, All Other 36 36 100.0%25-2021 Elementary School Teachers, Except Special Education 33 33 100.0%13-1151 Training and Development Specialists 29 29 100.0%53-6041 Traffic Technicians 27 27 100.0%25-1194 Vocational Education Teachers, Postsecondary 25 34 72.7%13-1022 Wholesale and Retail Buyers, Except Farm Products 18 20 92.5%11-9031 Education Administrators, Preschool and Childcare Center/Program 17 17 100.0%17-2051 Civil Engineers 14 305 4.5%11-1021 General and Operations Managers 12 846 1.4%51-1011 First-Line Supervisors of Production and Operating Workers 11 1,037 1.1%19-3051 Urban and Regional Planners 11 24 46.0%11-3121 Human Resource Managers 9 9 100.0%41-4012 Sales Representatives, Wholesale and Manufacturing, Except Technical and Scientific Products 9 178 5.1%25-2031 Secondary School Teachers, Except Special and Career/Technical Education 8 28 29.6%49-1011 First-Line Supervisors of Mechanics, Installers, and Repairers 7 111 6.6%43-1011 First-Line Supervisors of Office and Administrative Support Workers 7 24 28.9%33-9099 Protective Service Workers, All Other 5 5 100.0%11-9032 Education Administrators, Elementary and Secondary School 3 3 100.0%37-1012 First-Line Supervisors of Landscaping, Lawn Service, and Groundskeeping Workers 3 47 5.5%25-2032 Career/Technical Education Teachers, Secondary School 2 9 24.6%27-3031 Public Relations Specialists 2 242 0.9%43-4051 Customer Service Representatives 2 35 5.0%47-4099 Construction and Related Workers, All Other 1 62 1.6%
Total
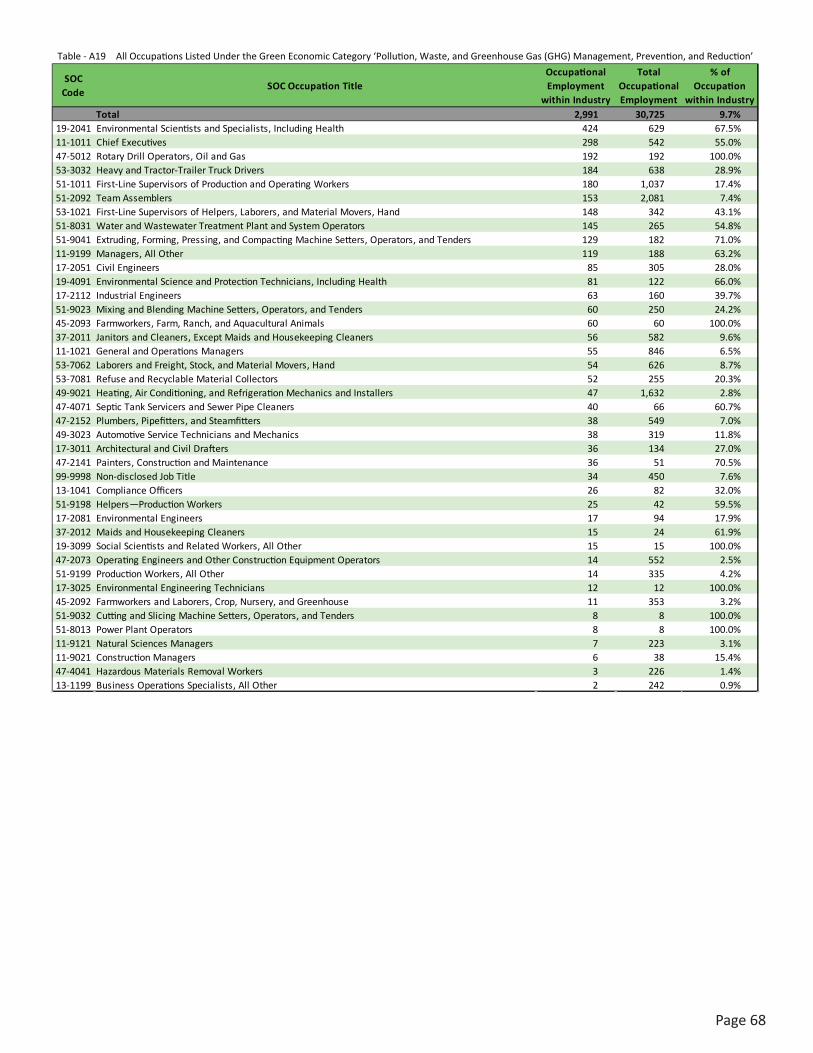
Page68
All Occupations Listed Under the Green Economic Category ‘Pollution, Waste, and Greenhouse Gas (GHG) Management, Prevention, and Reduction’Table - A19
SOC Code
SOC Occupation TitleOccupational Employment
within Industry
Total Occupational Employment
% of Occupation
within Industry2,991 30,725 9.7%
19-2041 Environmental Scientists and Specialists, Including Health 424 629 67.5%11-1011 Chief Executives 298 542 55.0%47-5012 Rotary Drill Operators, Oil and Gas 192 192 100.0%53-3032 Heavy and Tractor-Trailer Truck Drivers 184 638 28.9%51-1011 First-Line Supervisors of Production and Operating Workers 180 1,037 17.4%51-2092 Team Assemblers 153 2,081 7.4%53-1021 First-Line Supervisors of Helpers, Laborers, and Material Movers, Hand 148 342 43.1%51-8031 Water and Wastewater Treatment Plant and System Operators 145 265 54.8%51-9041 Extruding, Forming, Pressing, and Compacting Machine Setters, Operators, and Tenders 129 182 71.0%11-9199 Managers, All Other 119 188 63.2%17-2051 Civil Engineers 85 305 28.0%19-4091 Environmental Science and Protection Technicians, Including Health 81 122 66.0%17-2112 Industrial Engineers 63 160 39.7%51-9023 Mixing and Blending Machine Setters, Operators, and Tenders 60 250 24.2%45-2093 Farmworkers, Farm, Ranch, and Aquacultural Animals 60 60 100.0%37-2011 Janitors and Cleaners, Except Maids and Housekeeping Cleaners 56 582 9.6%11-1021 General and Operations Managers 55 846 6.5%53-7062 Laborers and Freight, Stock, and Material Movers, Hand 54 626 8.7%53-7081 Refuse and Recyclable Material Collectors 52 255 20.3%49-9021 Heating, Air Conditioning, and Refrigeration Mechanics and Installers 47 1,632 2.8%47-4071 Septic Tank Servicers and Sewer Pipe Cleaners 40 66 60.7%47-2152 Plumbers, Pipefitters, and Steamfitters 38 549 7.0%49-3023 Automotive Service Technicians and Mechanics 38 319 11.8%17-3011 Architectural and Civil Drafters 36 134 27.0%47-2141 Painters, Construction and Maintenance 36 51 70.5%99-9998 Non-disclosed Job Title 34 450 7.6%13-1041 Compliance Officers 26 82 32.0%51-9198 Helpers―Production Workers 25 42 59.5%17-2081 Environmental Engineers 17 94 17.9%37-2012 Maids and Housekeeping Cleaners 15 24 61.9%19-3099 Social Scientists and Related Workers, All Other 15 15 100.0%47-2073 Operating Engineers and Other Construction Equipment Operators 14 552 2.5%51-9199 Production Workers, All Other 14 335 4.2%17-3025 Environmental Engineering Technicians 12 12 100.0%45-2092 Farmworkers and Laborers, Crop, Nursery, and Greenhouse 11 353 3.2%51-9032 Cutting and Slicing Machine Setters, Operators, and Tenders 8 8 100.0%51-8013 Power Plant Operators 8 8 100.0%11-9121 Natural Sciences Managers 7 223 3.1%11-9021 Construction Managers 6 38 15.4%47-4041 Hazardous Materials Removal Workers 3 226 1.4%13-1199 Business Operations Specialists, All Other 2 242 0.9%
Total
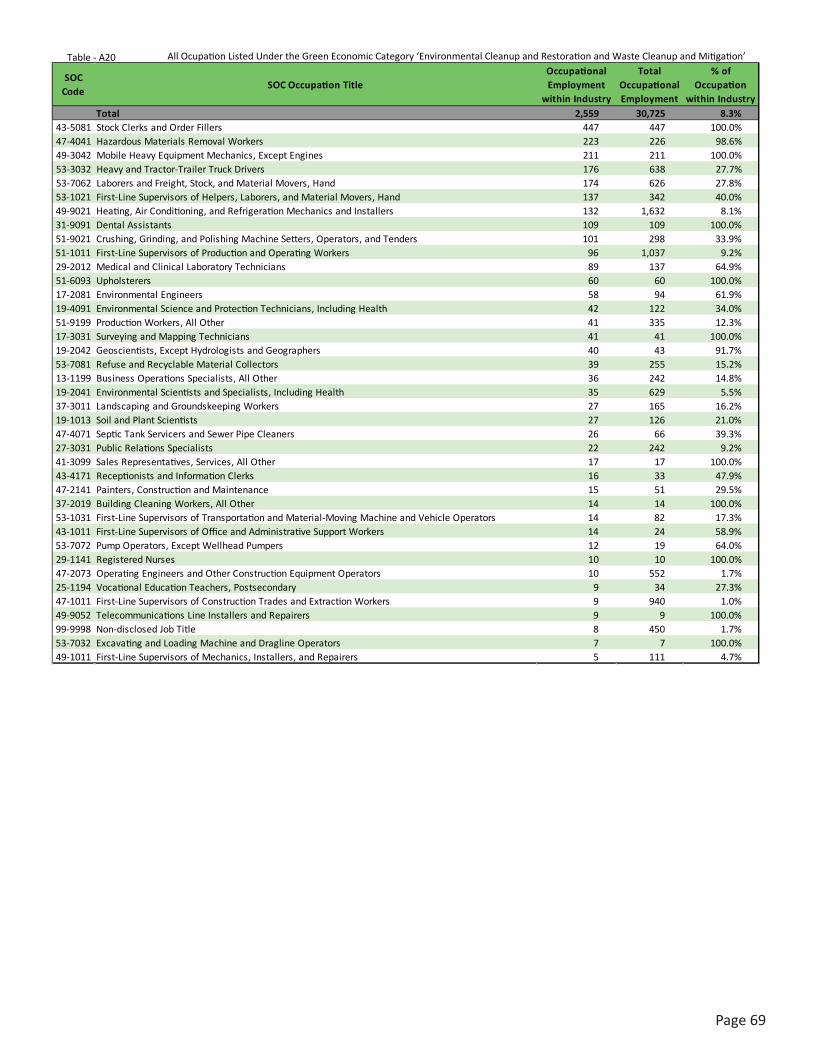
Page69
All Ocupation Listed Under the Green Economic Category ‘Environmental Cleanup and Restoration and Waste Cleanup and Mitigation’Table - A20
SOC Code
SOC Occupation TitleOccupational Employment
within Industry
Total Occupational Employment
% of Occupation
within Industry2,559 30,725 8.3%
43-5081 Stock Clerks and Order Fillers 447 447 100.0%47-4041 Hazardous Materials Removal Workers 223 226 98.6%49-3042 Mobile Heavy Equipment Mechanics, Except Engines 211 211 100.0%53-3032 Heavy and Tractor-Trailer Truck Drivers 176 638 27.7%53-7062 Laborers and Freight, Stock, and Material Movers, Hand 174 626 27.8%53-1021 First-Line Supervisors of Helpers, Laborers, and Material Movers, Hand 137 342 40.0%49-9021 Heating, Air Conditioning, and Refrigeration Mechanics and Installers 132 1,632 8.1%31-9091 Dental Assistants 109 109 100.0%51-9021 Crushing, Grinding, and Polishing Machine Setters, Operators, and Tenders 101 298 33.9%51-1011 First-Line Supervisors of Production and Operating Workers 96 1,037 9.2%29-2012 Medical and Clinical Laboratory Technicians 89 137 64.9%51-6093 Upholsterers 60 60 100.0%17-2081 Environmental Engineers 58 94 61.9%19-4091 Environmental Science and Protection Technicians, Including Health 42 122 34.0%51-9199 Production Workers, All Other 41 335 12.3%17-3031 Surveying and Mapping Technicians 41 41 100.0%19-2042 Geoscientists, Except Hydrologists and Geographers 40 43 91.7%53-7081 Refuse and Recyclable Material Collectors 39 255 15.2%13-1199 Business Operations Specialists, All Other 36 242 14.8%19-2041 Environmental Scientists and Specialists, Including Health 35 629 5.5%37-3011 Landscaping and Groundskeeping Workers 27 165 16.2%19-1013 Soil and Plant Scientists 27 126 21.0%47-4071 Septic Tank Servicers and Sewer Pipe Cleaners 26 66 39.3%27-3031 Public Relations Specialists 22 242 9.2%41-3099 Sales Representatives, Services, All Other 17 17 100.0%43-4171 Receptionists and Information Clerks 16 33 47.9%47-2141 Painters, Construction and Maintenance 15 51 29.5%37-2019 Building Cleaning Workers, All Other 14 14 100.0%53-1031 First-Line Supervisors of Transportation and Material-Moving Machine and Vehicle Operators 14 82 17.3%43-1011 First-Line Supervisors of Office and Administrative Support Workers 14 24 58.9%53-7072 Pump Operators, Except Wellhead Pumpers 12 19 64.0%29-1141 Registered Nurses 10 10 100.0%47-2073 Operating Engineers and Other Construction Equipment Operators 10 552 1.7%25-1194 Vocational Education Teachers, Postsecondary 9 34 27.3%47-1011 First-Line Supervisors of Construction Trades and Extraction Workers 9 940 1.0%49-9052 Telecommunications Line Installers and Repairers 9 9 100.0%99-9998 Non-disclosed Job Title 8 450 1.7%53-7032 Excavating and Loading Machine and Dragline Operators 7 7 100.0%49-1011 First-Line Supervisors of Mechanics, Installers, and Repairers 5 111 4.7%
Total
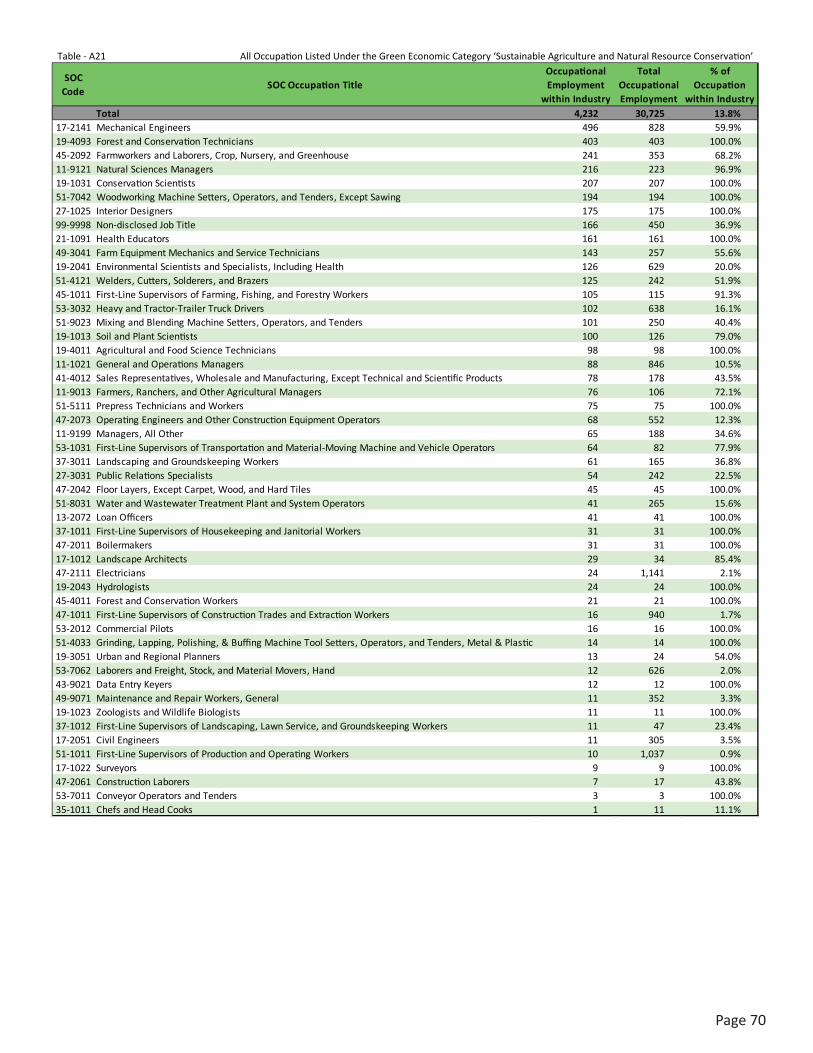
Page70
All Occupation Listed Under the Green Economic Category ‘Sustainable Agriculture and Natural Resource Conservation’Table - A21
SOC Code
SOC Occupation TitleOccupational Employment
within Industry
Total Occupational Employment
% of Occupation
within Industry4,232 30,725 13.8%
17-2141 Mechanical Engineers 496 828 59.9%19-4093 Forest and Conservation Technicians 403 403 100.0%45-2092 Farmworkers and Laborers, Crop, Nursery, and Greenhouse 241 353 68.2%11-9121 Natural Sciences Managers 216 223 96.9%19-1031 Conservation Scientists 207 207 100.0%51-7042 Woodworking Machine Setters, Operators, and Tenders, Except Sawing 194 194 100.0%27-1025 Interior Designers 175 175 100.0%99-9998 Non-disclosed Job Title 166 450 36.9%21-1091 Health Educators 161 161 100.0%49-3041 Farm Equipment Mechanics and Service Technicians 143 257 55.6%19-2041 Environmental Scientists and Specialists, Including Health 126 629 20.0%51-4121 Welders, Cutters, Solderers, and Brazers 125 242 51.9%45-1011 First-Line Supervisors of Farming, Fishing, and Forestry Workers 105 115 91.3%53-3032 Heavy and Tractor-Trailer Truck Drivers 102 638 16.1%51-9023 Mixing and Blending Machine Setters, Operators, and Tenders 101 250 40.4%19-1013 Soil and Plant Scientists 100 126 79.0%19-4011 Agricultural and Food Science Technicians 98 98 100.0%11-1021 General and Operations Managers 88 846 10.5%41-4012 Sales Representatives, Wholesale and Manufacturing, Except Technical and Scientific Products 78 178 43.5%11-9013 Farmers, Ranchers, and Other Agricultural Managers 76 106 72.1%51-5111 Prepress Technicians and Workers 75 75 100.0%47-2073 Operating Engineers and Other Construction Equipment Operators 68 552 12.3%11-9199 Managers, All Other 65 188 34.6%53-1031 First-Line Supervisors of Transportation and Material-Moving Machine and Vehicle Operators 64 82 77.9%37-3011 Landscaping and Groundskeeping Workers 61 165 36.8%27-3031 Public Relations Specialists 54 242 22.5%47-2042 Floor Layers, Except Carpet, Wood, and Hard Tiles 45 45 100.0%51-8031 Water and Wastewater Treatment Plant and System Operators 41 265 15.6%13-2072 Loan Officers 41 41 100.0%37-1011 First-Line Supervisors of Housekeeping and Janitorial Workers 31 31 100.0%47-2011 Boilermakers 31 31 100.0%17-1012 Landscape Architects 29 34 85.4%47-2111 Electricians 24 1,141 2.1%19-2043 Hydrologists 24 24 100.0%45-4011 Forest and Conservation Workers 21 21 100.0%47-1011 First-Line Supervisors of Construction Trades and Extraction Workers 16 940 1.7%53-2012 Commercial Pilots 16 16 100.0%51-4033 Grinding, Lapping, Polishing, & Buffing Machine Tool Setters, Operators, and Tenders, Metal & Plastic 14 14 100.0%19-3051 Urban and Regional Planners 13 24 54.0%53-7062 Laborers and Freight, Stock, and Material Movers, Hand 12 626 2.0%43-9021 Data Entry Keyers 12 12 100.0%49-9071 Maintenance and Repair Workers, General 11 352 3.3%19-1023 Zoologists and Wildlife Biologists 11 11 100.0%37-1012 First-Line Supervisors of Landscaping, Lawn Service, and Groundskeeping Workers 11 47 23.4%17-2051 Civil Engineers 11 305 3.5%51-1011 First-Line Supervisors of Production and Operating Workers 10 1,037 0.9%17-1022 Surveyors 9 9 100.0%47-2061 Construction Laborers 7 17 43.8%53-7011 Conveyor Operators and Tenders 3 3 100.0%35-1011 Chefs and Head Cooks 1 11 11.1%
Total
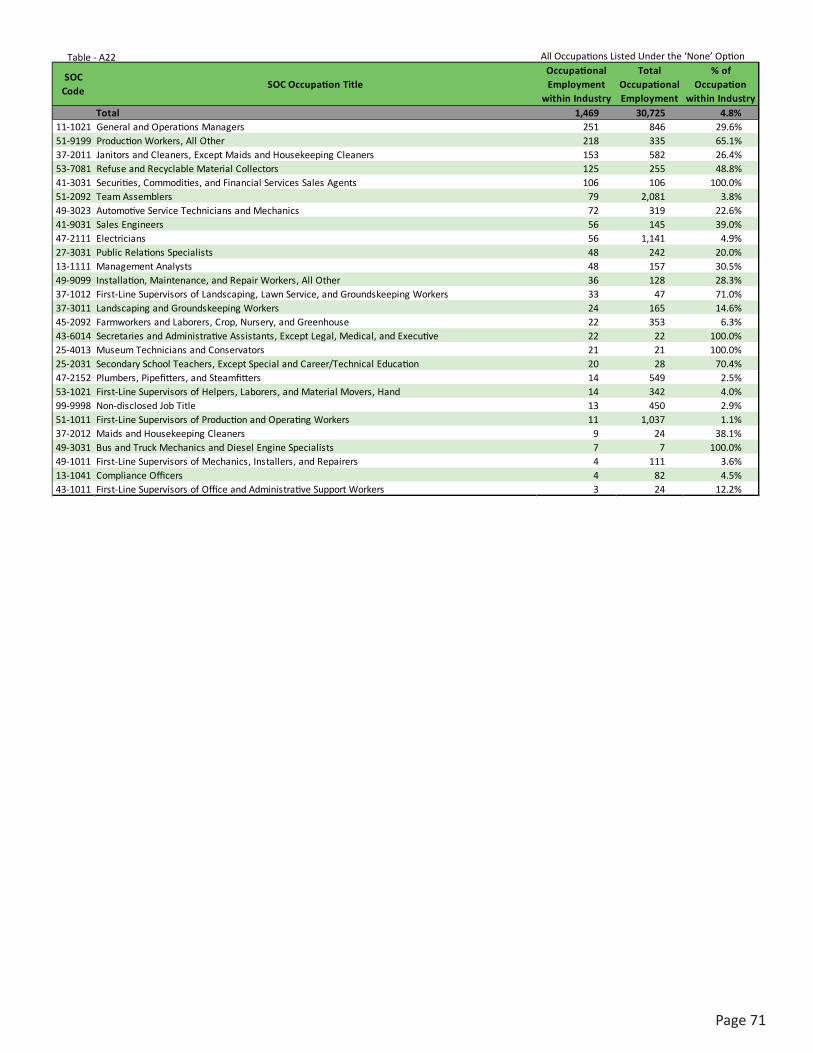
Page71
All Occupations Listed Under the ‘None’ OptionTable - A22
SOC Code
SOC Occupation TitleOccupational Employment
within Industry
Total Occupational Employment
% of Occupation
within Industry1,469 30,725 4.8%
11-1021 General and Operations Managers 251 846 29.6%51-9199 Production Workers, All Other 218 335 65.1%37-2011 Janitors and Cleaners, Except Maids and Housekeeping Cleaners 153 582 26.4%53-7081 Refuse and Recyclable Material Collectors 125 255 48.8%41-3031 Securities, Commodities, and Financial Services Sales Agents 106 106 100.0%51-2092 Team Assemblers 79 2,081 3.8%49-3023 Automotive Service Technicians and Mechanics 72 319 22.6%41-9031 Sales Engineers 56 145 39.0%47-2111 Electricians 56 1,141 4.9%27-3031 Public Relations Specialists 48 242 20.0%13-1111 Management Analysts 48 157 30.5%49-9099 Installation, Maintenance, and Repair Workers, All Other 36 128 28.3%37-1012 First-Line Supervisors of Landscaping, Lawn Service, and Groundskeeping Workers 33 47 71.0%37-3011 Landscaping and Groundskeeping Workers 24 165 14.6%45-2092 Farmworkers and Laborers, Crop, Nursery, and Greenhouse 22 353 6.3%43-6014 Secretaries and Administrative Assistants, Except Legal, Medical, and Executive 22 22 100.0%25-4013 Museum Technicians and Conservators 21 21 100.0%25-2031 Secondary School Teachers, Except Special and Career/Technical Education 20 28 70.4%47-2152 Plumbers, Pipefitters, and Steamfitters 14 549 2.5%53-1021 First-Line Supervisors of Helpers, Laborers, and Material Movers, Hand 14 342 4.0%99-9998 Non-disclosed Job Title 13 450 2.9%51-1011 First-Line Supervisors of Production and Operating Workers 11 1,037 1.1%37-2012 Maids and Housekeeping Cleaners 9 24 38.1%49-3031 Bus and Truck Mechanics and Diesel Engine Specialists 7 7 100.0%49-1011 First-Line Supervisors of Mechanics, Installers, and Repairers 4 111 3.6%13-1041 Compliance Officers 4 82 4.5%43-1011 First-Line Supervisors of Office and Administrative Support Workers 3 24 12.2%
Total
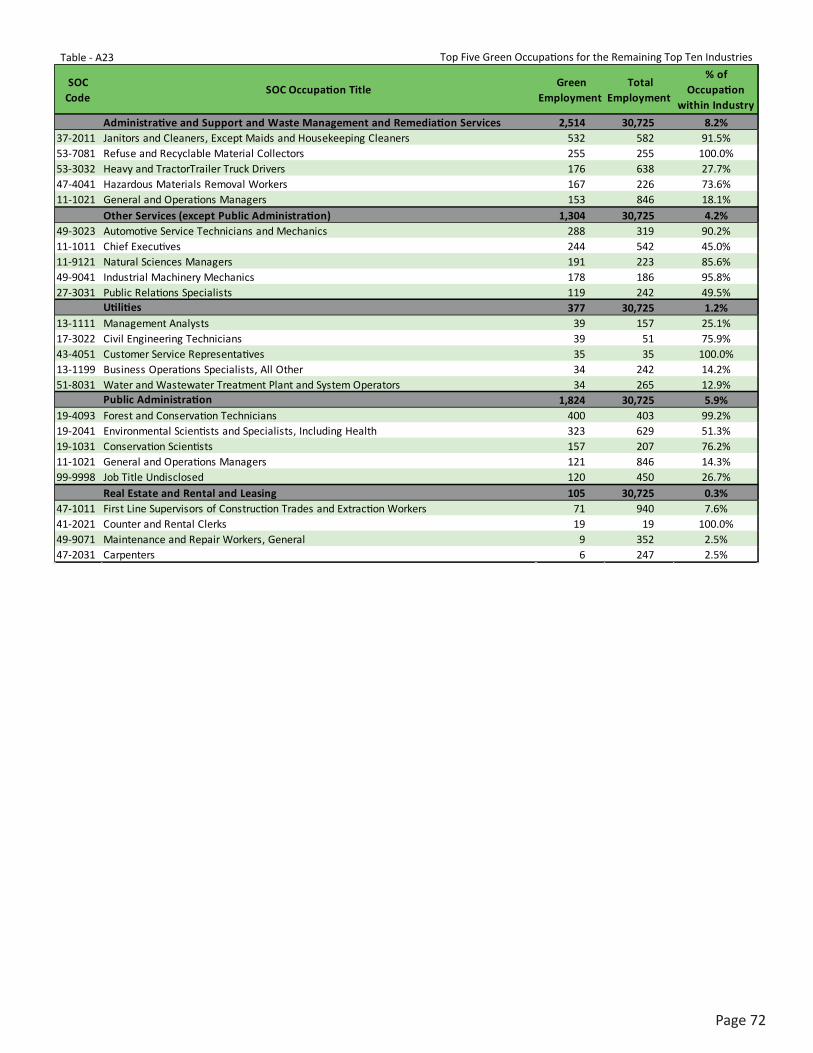
Page72
Table - A23 Top Five Green Occupations for the Remaining Top Ten Industries
SOC Code
SOC Occupation Title Green
Employment Total
Employment
% of Occupation
within Industry
2,514 30,725 8.2%37-2011 Janitors and Cleaners, Except Maids and Housekeeping Cleaners 532 582 91.5%53-7081 Refuse and Recyclable Material Collectors 255 255 100.0%53-3032 Heavy and TractorTrailer Truck Drivers 176 638 27.7%47-4041 Hazardous Materials Removal Workers 167 226 73.6%11-1021 General and Operations Managers 153 846 18.1%
1,304 30,725 4.2%49-3023 Automotive Service Technicians and Mechanics 288 319 90.2%11-1011 Chief Executives 244 542 45.0%11-9121 Natural Sciences Managers 191 223 85.6%49-9041 Industrial Machinery Mechanics 178 186 95.8%27-3031 Public Relations Specialists 119 242 49.5%
377 30,725 1.2%13-1111 Management Analysts 39 157 25.1%17-3022 Civil Engineering Technicians 39 51 75.9%43-4051 Customer Service Representatives 35 35 100.0%13-1199 Business Operations Specialists, All Other 34 242 14.2%51-8031 Water and Wastewater Treatment Plant and System Operators 34 265 12.9%
1,824 30,725 5.9%19-4093 Forest and Conservation Technicians 400 403 99.2%19-2041 Environmental Scientists and Specialists, Including Health 323 629 51.3%19-1031 Conservation Scientists 157 207 76.2%11-1021 General and Operations Managers 121 846 14.3%99-9998 Job Title Undisclosed 120 450 26.7%
105 30,725 0.3%47-1011 First Line Supervisors of Construction Trades and Extraction Workers 71 940 7.6%41-2021 Counter and Rental Clerks 19 19 100.0%49-9071 Maintenance and Repair Workers, General 9 352 2.5%47-2031 Carpenters 6 247 2.5%
Real Estate and Rental and Leasing
Public Administration
Utilities
Other Services (except Public Administration)
Administrative and Support and Waste Management and Remediation Services
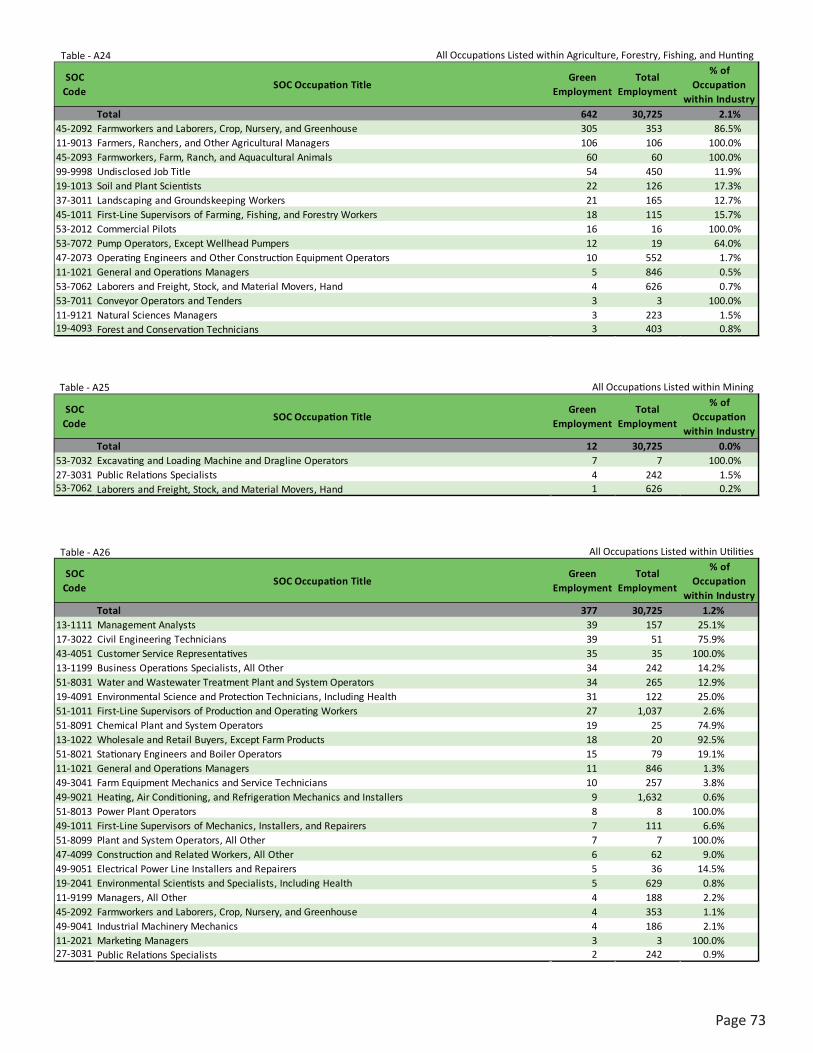
Page73
SOC Code
SOC Occupation TitleGreen
EmploymentTotal
Employment
% of Occupation
within Industry377 30,725 1.2%
13-1111 Management Analysts 39 157 25.1%17-3022 Civil Engineering Technicians 39 51 75.9%43-4051 Customer Service Representatives 35 35 100.0%13-1199 Business Operations Specialists, All Other 34 242 14.2%51-8031 Water and Wastewater Treatment Plant and System Operators 34 265 12.9%19-4091 Environmental Science and Protection Technicians, Including Health 31 122 25.0%51-1011 First-Line Supervisors of Production and Operating Workers 27 1,037 2.6%51-8091 Chemical Plant and System Operators 19 25 74.9%13-1022 Wholesale and Retail Buyers, Except Farm Products 18 20 92.5%51-8021 Stationary Engineers and Boiler Operators 15 79 19.1%11-1021 General and Operations Managers 11 846 1.3%49-3041 Farm Equipment Mechanics and Service Technicians 10 257 3.8%49-9021 Heating, Air Conditioning, and Refrigeration Mechanics and Installers 9 1,632 0.6%51-8013 Power Plant Operators 8 8 100.0%49-1011 First-Line Supervisors of Mechanics, Installers, and Repairers 7 111 6.6%51-8099 Plant and System Operators, All Other 7 7 100.0%47-4099 Construction and Related Workers, All Other 6 62 9.0%49-9051 Electrical Power Line Installers and Repairers 5 36 14.5%19-2041 Environmental Scientists and Specialists, Including Health 5 629 0.8%11-9199 Managers, All Other 4 188 2.2%45-2092 Farmworkers and Laborers, Crop, Nursery, and Greenhouse 4 353 1.1%49-9041 Industrial Machinery Mechanics 4 186 2.1%11-2021 Marketing Managers 3 3 100.0%27-3031 Public Relations Specialists 2 242 0.9%
Total
All Occupations Listed within UtilitiesTable - A26
All Occupations Listed within Agriculture, Forestry, Fishing, and HuntingTable - A24
SOC Code
SOC Occupation TitleGreen
EmploymentTotal
Employment
% of Occupation
within Industry642 30,725 2.1%
45-2092 Farmworkers and Laborers, Crop, Nursery, and Greenhouse 305 353 86.5%11-9013 Farmers, Ranchers, and Other Agricultural Managers 106 106 100.0%45-2093 Farmworkers, Farm, Ranch, and Aquacultural Animals 60 60 100.0%99-9998 Undisclosed Job Title 54 450 11.9%19-1013 Soil and Plant Scientists 22 126 17.3%37-3011 Landscaping and Groundskeeping Workers 21 165 12.7%45-1011 First-Line Supervisors of Farming, Fishing, and Forestry Workers 18 115 15.7%53-2012 Commercial Pilots 16 16 100.0%53-7072 Pump Operators, Except Wellhead Pumpers 12 19 64.0%47-2073 Operating Engineers and Other Construction Equipment Operators 10 552 1.7%11-1021 General and Operations Managers 5 846 0.5%53-7062 Laborers and Freight, Stock, and Material Movers, Hand 4 626 0.7%53-7011 Conveyor Operators and Tenders 3 3 100.0%11-9121 Natural Sciences Managers 3 223 1.5%19-4093 Forest and Conservation Technicians 3 403 0.8%
Total
Table - A25 All Occupations Listed within Mining
SOC Code
SOC Occupation TitleGreen
EmploymentTotal
Employment
% of Occupation
within Industry12 30,725 0.0%
53-7032 Excavating and Loading Machine and Dragline Operators 7 7 100.0%27-3031 Public Relations Specialists 4 242 1.5%53-7062 Laborers and Freight, Stock, and Material Movers, Hand 1 626 0.2%
Total
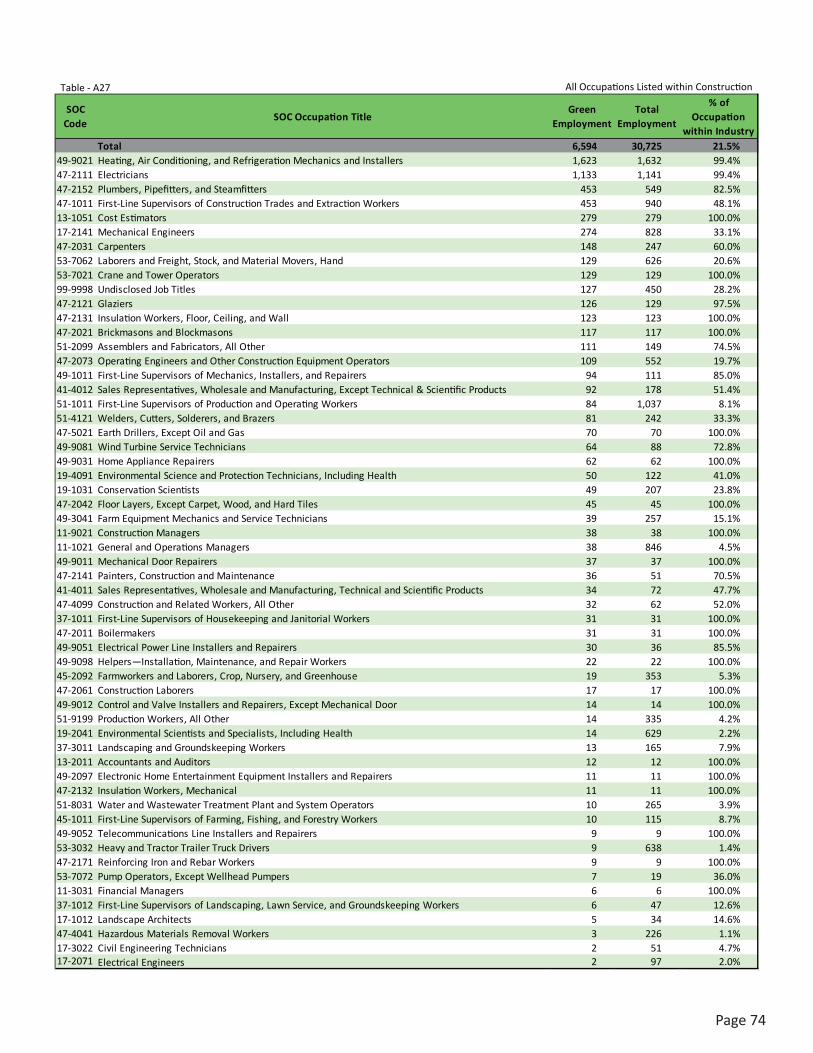
Page74
SOC Code
SOC Occupation TitleGreen
EmploymentTotal
Employment
% of Occupation
within Industry6,594 30,725 21.5%
49-9021 Heating, Air Conditioning, and Refrigeration Mechanics and Installers 1,623 1,632 99.4%47-2111 Electricians 1,133 1,141 99.4%47-2152 Plumbers, Pipefitters, and Steamfitters 453 549 82.5%47-1011 First-Line Supervisors of Construction Trades and Extraction Workers 453 940 48.1%13-1051 Cost Estimators 279 279 100.0%17-2141 Mechanical Engineers 274 828 33.1%47-2031 Carpenters 148 247 60.0%53-7062 Laborers and Freight, Stock, and Material Movers, Hand 129 626 20.6%53-7021 Crane and Tower Operators 129 129 100.0%99-9998 Undisclosed Job Titles 127 450 28.2%47-2121 Glaziers 126 129 97.5%47-2131 Insulation Workers, Floor, Ceiling, and Wall 123 123 100.0%47-2021 Brickmasons and Blockmasons 117 117 100.0%51-2099 Assemblers and Fabricators, All Other 111 149 74.5%47-2073 Operating Engineers and Other Construction Equipment Operators 109 552 19.7%49-1011 First-Line Supervisors of Mechanics, Installers, and Repairers 94 111 85.0%41-4012 Sales Representatives, Wholesale and Manufacturing, Except Technical & Scientific Products 92 178 51.4%51-1011 First-Line Supervisors of Production and Operating Workers 84 1,037 8.1%51-4121 Welders, Cutters, Solderers, and Brazers 81 242 33.3%47-5021 Earth Drillers, Except Oil and Gas 70 70 100.0%49-9081 Wind Turbine Service Technicians 64 88 72.8%49-9031 Home Appliance Repairers 62 62 100.0%19-4091 Environmental Science and Protection Technicians, Including Health 50 122 41.0%19-1031 Conservation Scientists 49 207 23.8%47-2042 Floor Layers, Except Carpet, Wood, and Hard Tiles 45 45 100.0%49-3041 Farm Equipment Mechanics and Service Technicians 39 257 15.1%11-9021 Construction Managers 38 38 100.0%11-1021 General and Operations Managers 38 846 4.5%49-9011 Mechanical Door Repairers 37 37 100.0%47-2141 Painters, Construction and Maintenance 36 51 70.5%41-4011 Sales Representatives, Wholesale and Manufacturing, Technical and Scientific Products 34 72 47.7%47-4099 Construction and Related Workers, All Other 32 62 52.0%37-1011 First-Line Supervisors of Housekeeping and Janitorial Workers 31 31 100.0%47-2011 Boilermakers 31 31 100.0%49-9051 Electrical Power Line Installers and Repairers 30 36 85.5%49-9098 Helpers―Installation, Maintenance, and Repair Workers 22 22 100.0%45-2092 Farmworkers and Laborers, Crop, Nursery, and Greenhouse 19 353 5.3%47-2061 Construction Laborers 17 17 100.0%49-9012 Control and Valve Installers and Repairers, Except Mechanical Door 14 14 100.0%51-9199 Production Workers, All Other 14 335 4.2%19-2041 Environmental Scientists and Specialists, Including Health 14 629 2.2%37-3011 Landscaping and Groundskeeping Workers 13 165 7.9%13-2011 Accountants and Auditors 12 12 100.0%49-2097 Electronic Home Entertainment Equipment Installers and Repairers 11 11 100.0%47-2132 Insulation Workers, Mechanical 11 11 100.0%51-8031 Water and Wastewater Treatment Plant and System Operators 10 265 3.9%45-1011 First-Line Supervisors of Farming, Fishing, and Forestry Workers 10 115 8.7%49-9052 Telecommunications Line Installers and Repairers 9 9 100.0%53-3032 Heavy and Tractor Trailer Truck Drivers 9 638 1.4%47-2171 Reinforcing Iron and Rebar Workers 9 9 100.0%53-7072 Pump Operators, Except Wellhead Pumpers 7 19 36.0%11-3031 Financial Managers 6 6 100.0%37-1012 First-Line Supervisors of Landscaping, Lawn Service, and Groundskeeping Workers 6 47 12.6%17-1012 Landscape Architects 5 34 14.6%47-4041 Hazardous Materials Removal Workers 3 226 1.1%17-3022 Civil Engineering Technicians 2 51 4.7%17-2071 Electrical Engineers 2 97 2.0%
Total
All Occupations Listed within ConstructionTable - A27
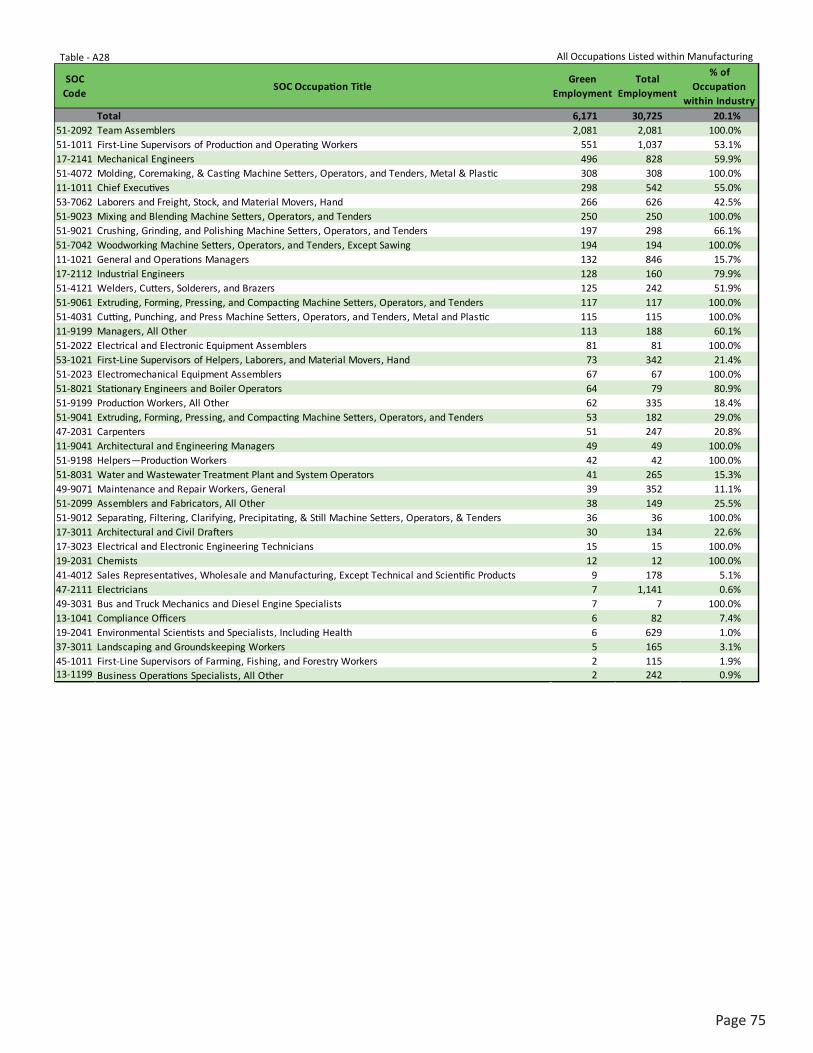
Page75
SOC Code
SOC Occupation TitleGreen
EmploymentTotal
Employment
% of Occupation
within Industry6,171 30,725 20.1%
51-2092 Team Assemblers 2,081 2,081 100.0%51-1011 First-Line Supervisors of Production and Operating Workers 551 1,037 53.1%17-2141 Mechanical Engineers 496 828 59.9%51-4072 Molding, Coremaking, & Casting Machine Setters, Operators, and Tenders, Metal & Plastic 308 308 100.0%11-1011 Chief Executives 298 542 55.0%53-7062 Laborers and Freight, Stock, and Material Movers, Hand 266 626 42.5%51-9023 Mixing and Blending Machine Setters, Operators, and Tenders 250 250 100.0%51-9021 Crushing, Grinding, and Polishing Machine Setters, Operators, and Tenders 197 298 66.1%51-7042 Woodworking Machine Setters, Operators, and Tenders, Except Sawing 194 194 100.0%11-1021 General and Operations Managers 132 846 15.7%17-2112 Industrial Engineers 128 160 79.9%51-4121 Welders, Cutters, Solderers, and Brazers 125 242 51.9%51-9061 Extruding, Forming, Pressing, and Compacting Machine Setters, Operators, and Tenders 117 117 100.0%51-4031 Cutting, Punching, and Press Machine Setters, Operators, and Tenders, Metal and Plastic 115 115 100.0%11-9199 Managers, All Other 113 188 60.1%51-2022 Electrical and Electronic Equipment Assemblers 81 81 100.0%53-1021 First-Line Supervisors of Helpers, Laborers, and Material Movers, Hand 73 342 21.4%51-2023 Electromechanical Equipment Assemblers 67 67 100.0%51-8021 Stationary Engineers and Boiler Operators 64 79 80.9%51-9199 Production Workers, All Other 62 335 18.4%51-9041 Extruding, Forming, Pressing, and Compacting Machine Setters, Operators, and Tenders 53 182 29.0%47-2031 Carpenters 51 247 20.8%11-9041 Architectural and Engineering Managers 49 49 100.0%51-9198 Helpers―Production Workers 42 42 100.0%51-8031 Water and Wastewater Treatment Plant and System Operators 41 265 15.3%49-9071 Maintenance and Repair Workers, General 39 352 11.1%51-2099 Assemblers and Fabricators, All Other 38 149 25.5%51-9012 Separating, Filtering, Clarifying, Precipitating, & Still Machine Setters, Operators, & Tenders 36 36 100.0%17-3011 Architectural and Civil Drafters 30 134 22.6%17-3023 Electrical and Electronic Engineering Technicians 15 15 100.0%19-2031 Chemists 12 12 100.0%41-4012 Sales Representatives, Wholesale and Manufacturing, Except Technical and Scientific Products 9 178 5.1%47-2111 Electricians 7 1,141 0.6%49-3031 Bus and Truck Mechanics and Diesel Engine Specialists 7 7 100.0%13-1041 Compliance Officers 6 82 7.4%19-2041 Environmental Scientists and Specialists, Including Health 6 629 1.0%37-3011 Landscaping and Groundskeeping Workers 5 165 3.1%45-1011 First-Line Supervisors of Farming, Fishing, and Forestry Workers 2 115 1.9%13-1199 Business Operations Specialists, All Other 2 242 0.9%
Total
Table - A28 All Occupations Listed within Manufacturing
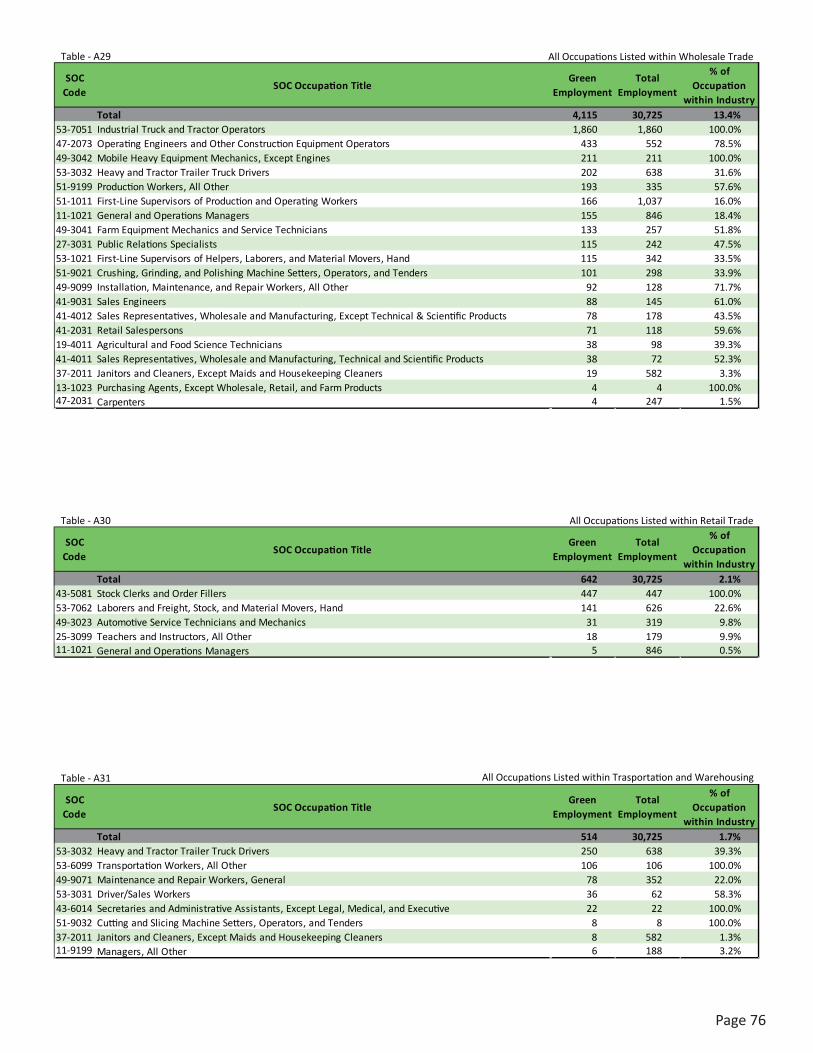
Page76
SOC Code
SOC Occupation TitleGreen
EmploymentTotal
Employment
% of Occupation
within Industry4,115 30,725 13.4%
53-7051 Industrial Truck and Tractor Operators 1,860 1,860 100.0%47-2073 Operating Engineers and Other Construction Equipment Operators 433 552 78.5%49-3042 Mobile Heavy Equipment Mechanics, Except Engines 211 211 100.0%53-3032 Heavy and Tractor Trailer Truck Drivers 202 638 31.6%51-9199 Production Workers, All Other 193 335 57.6%51-1011 First-Line Supervisors of Production and Operating Workers 166 1,037 16.0%11-1021 General and Operations Managers 155 846 18.4%49-3041 Farm Equipment Mechanics and Service Technicians 133 257 51.8%27-3031 Public Relations Specialists 115 242 47.5%53-1021 First-Line Supervisors of Helpers, Laborers, and Material Movers, Hand 115 342 33.5%51-9021 Crushing, Grinding, and Polishing Machine Setters, Operators, and Tenders 101 298 33.9%49-9099 Installation, Maintenance, and Repair Workers, All Other 92 128 71.7%41-9031 Sales Engineers 88 145 61.0%41-4012 Sales Representatives, Wholesale and Manufacturing, Except Technical & Scientific Products 78 178 43.5%41-2031 Retail Salespersons 71 118 59.6%19-4011 Agricultural and Food Science Technicians 38 98 39.3%41-4011 Sales Representatives, Wholesale and Manufacturing, Technical and Scientific Products 38 72 52.3%37-2011 Janitors and Cleaners, Except Maids and Housekeeping Cleaners 19 582 3.3%13-1023 Purchasing Agents, Except Wholesale, Retail, and Farm Products 4 4 100.0%47-2031 Carpenters 4 247 1.5%
Total
Table - A29 All Occupations Listed within Wholesale Trade
SOC Code
SOC Occupation TitleGreen
EmploymentTotal
Employment
% of Occupation
within Industry642 30,725 2.1%
43-5081 Stock Clerks and Order Fillers 447 447 100.0%53-7062 Laborers and Freight, Stock, and Material Movers, Hand 141 626 22.6%49-3023 Automotive Service Technicians and Mechanics 31 319 9.8%25-3099 Teachers and Instructors, All Other 18 179 9.9%11-1021 General and Operations Managers 5 846 0.5%
Total
Table - A30 All Occupations Listed within Retail Trade
SOC Code
SOC Occupation TitleGreen
EmploymentTotal
Employment
% of Occupation
within Industry514 30,725 1.7%
53-3032 Heavy and Tractor Trailer Truck Drivers 250 638 39.3%53-6099 Transportation Workers, All Other 106 106 100.0%49-9071 Maintenance and Repair Workers, General 78 352 22.0%53-3031 Driver/Sales Workers 36 62 58.3%43-6014 Secretaries and Administrative Assistants, Except Legal, Medical, and Executive 22 22 100.0%51-9032 Cutting and Slicing Machine Setters, Operators, and Tenders 8 8 100.0%37-2011 Janitors and Cleaners, Except Maids and Housekeeping Cleaners 8 582 1.3%11-9199 Managers, All Other 6 188 3.2%
Total
Table - A31 All Occupations Listed within Trasportation and Warehousing
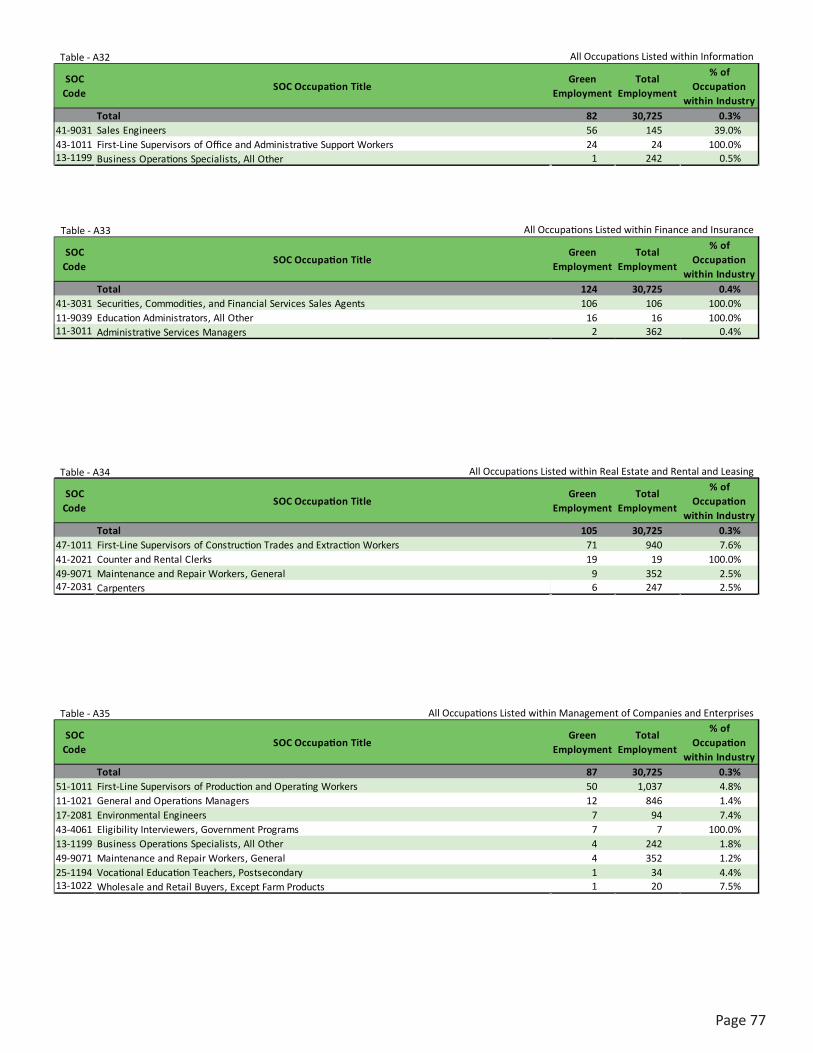
Page77
SOC Code
SOC Occupation TitleGreen
EmploymentTotal
Employment
% of Occupation
within Industry124 30,725 0.4%
41-3031 Securities, Commodities, and Financial Services Sales Agents 106 106 100.0%11-9039 Education Administrators, All Other 16 16 100.0%11-3011 Administrative Services Managers 2 362 0.4%
Total
Table - A33 All Occupations Listed within Finance and Insurance
SOC Code
SOC Occupation TitleGreen
EmploymentTotal
Employment
% of Occupation
within Industry105 30,725 0.3%
47-1011 First-Line Supervisors of Construction Trades and Extraction Workers 71 940 7.6%41-2021 Counter and Rental Clerks 19 19 100.0%49-9071 Maintenance and Repair Workers, General 9 352 2.5%47-2031 Carpenters 6 247 2.5%
Total
Table - A34 All Occupations Listed within Real Estate and Rental and Leasing
SOC Code
SOC Occupation TitleGreen
EmploymentTotal
Employment
% of Occupation
within Industry87 30,725 0.3%
51-1011 First-Line Supervisors of Production and Operating Workers 50 1,037 4.8%11-1021 General and Operations Managers 12 846 1.4%17-2081 Environmental Engineers 7 94 7.4%43-4061 Eligibility Interviewers, Government Programs 7 7 100.0%13-1199 Business Operations Specialists, All Other 4 242 1.8%49-9071 Maintenance and Repair Workers, General 4 352 1.2%25-1194 Vocational Education Teachers, Postsecondary 1 34 4.4%13-1022 Wholesale and Retail Buyers, Except Farm Products 1 20 7.5%
Total
Table - A35 All Occupations Listed within Management of Companies and Enterprises
SOC Code
SOC Occupation TitleGreen
EmploymentTotal
Employment
% of Occupation
within Industry82 30,725 0.3%
41-9031 Sales Engineers 56 145 39.0%43-1011 First-Line Supervisors of Office and Administrative Support Workers 24 24 100.0%13-1199 Business Operations Specialists, All Other 1 242 0.5%
Total
Table - A32 All Occupations Listed within Information
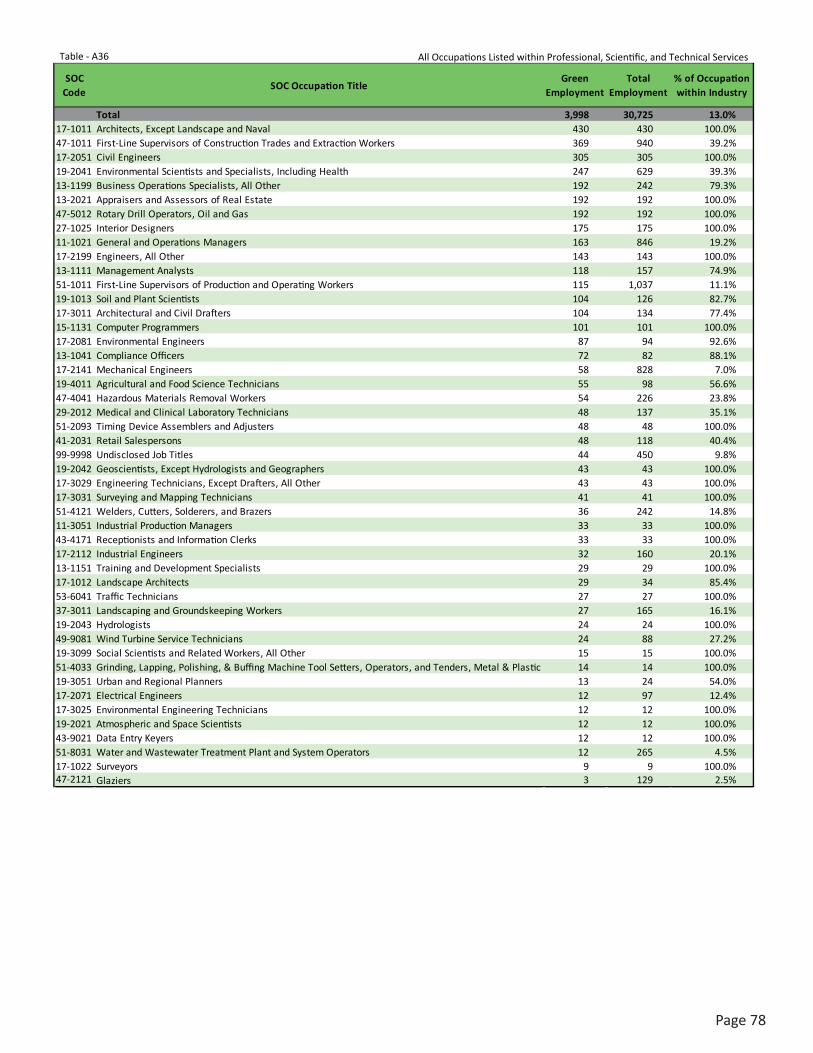
Page78
SOC Code
SOC Occupation TitleGreen
EmploymentTotal
Employment% of Occupation within Industry
3,998 30,725 13.0%17-1011 Architects, Except Landscape and Naval 430 430 100.0%47-1011 First-Line Supervisors of Construction Trades and Extraction Workers 369 940 39.2%17-2051 Civil Engineers 305 305 100.0%19-2041 Environmental Scientists and Specialists, Including Health 247 629 39.3%13-1199 Business Operations Specialists, All Other 192 242 79.3%13-2021 Appraisers and Assessors of Real Estate 192 192 100.0%47-5012 Rotary Drill Operators, Oil and Gas 192 192 100.0%27-1025 Interior Designers 175 175 100.0%11-1021 General and Operations Managers 163 846 19.2%17-2199 Engineers, All Other 143 143 100.0%13-1111 Management Analysts 118 157 74.9%51-1011 First-Line Supervisors of Production and Operating Workers 115 1,037 11.1%19-1013 Soil and Plant Scientists 104 126 82.7%17-3011 Architectural and Civil Drafters 104 134 77.4%15-1131 Computer Programmers 101 101 100.0%17-2081 Environmental Engineers 87 94 92.6%13-1041 Compliance Officers 72 82 88.1%17-2141 Mechanical Engineers 58 828 7.0%19-4011 Agricultural and Food Science Technicians 55 98 56.6%47-4041 Hazardous Materials Removal Workers 54 226 23.8%29-2012 Medical and Clinical Laboratory Technicians 48 137 35.1%51-2093 Timing Device Assemblers and Adjusters 48 48 100.0%41-2031 Retail Salespersons 48 118 40.4%99-9998 Undisclosed Job Titles 44 450 9.8%19-2042 Geoscientists, Except Hydrologists and Geographers 43 43 100.0%17-3029 Engineering Technicians, Except Drafters, All Other 43 43 100.0%17-3031 Surveying and Mapping Technicians 41 41 100.0%51-4121 Welders, Cutters, Solderers, and Brazers 36 242 14.8%11-3051 Industrial Production Managers 33 33 100.0%43-4171 Receptionists and Information Clerks 33 33 100.0%17-2112 Industrial Engineers 32 160 20.1%13-1151 Training and Development Specialists 29 29 100.0%17-1012 Landscape Architects 29 34 85.4%53-6041 Traffic Technicians 27 27 100.0%37-3011 Landscaping and Groundskeeping Workers 27 165 16.1%19-2043 Hydrologists 24 24 100.0%49-9081 Wind Turbine Service Technicians 24 88 27.2%19-3099 Social Scientists and Related Workers, All Other 15 15 100.0%51-4033 Grinding, Lapping, Polishing, & Buffing Machine Tool Setters, Operators, and Tenders, Metal & Plastic 14 14 100.0%19-3051 Urban and Regional Planners 13 24 54.0%17-2071 Electrical Engineers 12 97 12.4%17-3025 Environmental Engineering Technicians 12 12 100.0%19-2021 Atmospheric and Space Scientists 12 12 100.0%43-9021 Data Entry Keyers 12 12 100.0%51-8031 Water and Wastewater Treatment Plant and System Operators 12 265 4.5%17-1022 Surveyors 9 9 100.0%47-2121 Glaziers 3 129 2.5%
Total
Table - A36 All Occupations Listed within Professional, Scientific, and Technical Services
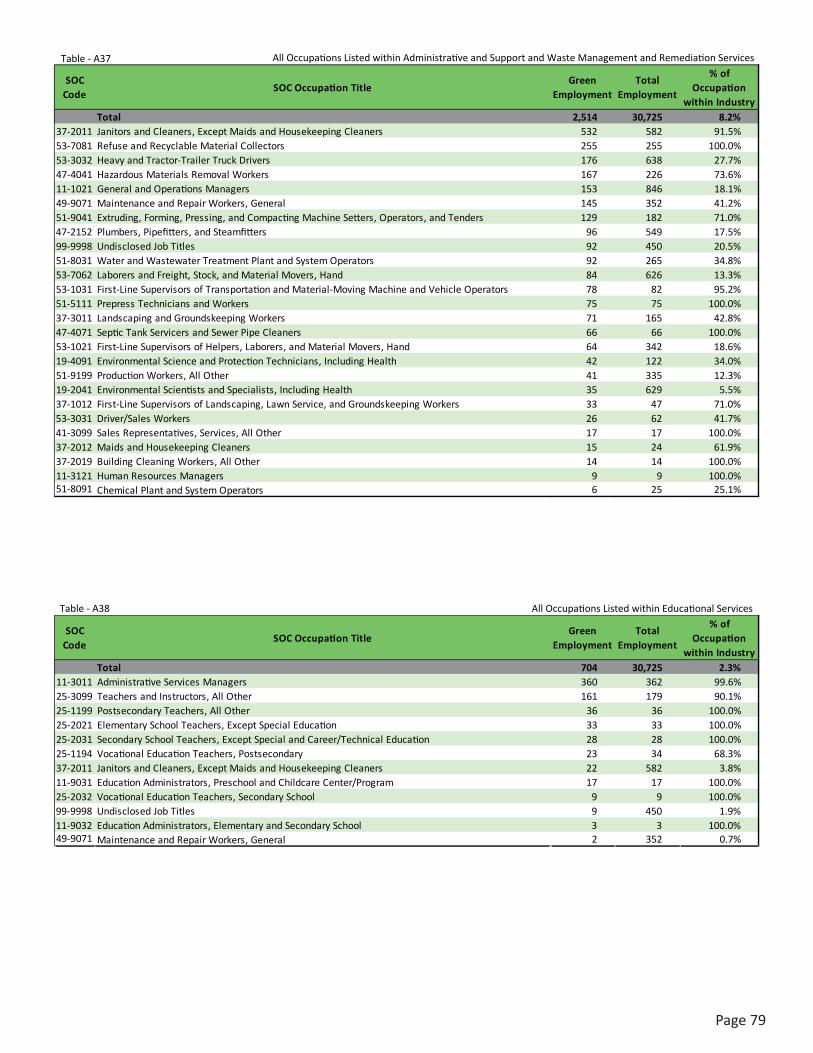
Page79
SOC Code
SOC Occupation TitleGreen
EmploymentTotal
Employment
% of Occupation
within Industry2,514 30,725 8.2%
37-2011 Janitors and Cleaners, Except Maids and Housekeeping Cleaners 532 582 91.5%53-7081 Refuse and Recyclable Material Collectors 255 255 100.0%53-3032 Heavy and Tractor-Trailer Truck Drivers 176 638 27.7%47-4041 Hazardous Materials Removal Workers 167 226 73.6%11-1021 General and Operations Managers 153 846 18.1%49-9071 Maintenance and Repair Workers, General 145 352 41.2%51-9041 Extruding, Forming, Pressing, and Compacting Machine Setters, Operators, and Tenders 129 182 71.0%47-2152 Plumbers, Pipefitters, and Steamfitters 96 549 17.5%99-9998 Undisclosed Job Titles 92 450 20.5%51-8031 Water and Wastewater Treatment Plant and System Operators 92 265 34.8%53-7062 Laborers and Freight, Stock, and Material Movers, Hand 84 626 13.3%53-1031 First-Line Supervisors of Transportation and Material-Moving Machine and Vehicle Operators 78 82 95.2%51-5111 Prepress Technicians and Workers 75 75 100.0%37-3011 Landscaping and Groundskeeping Workers 71 165 42.8%47-4071 Septic Tank Servicers and Sewer Pipe Cleaners 66 66 100.0%53-1021 First-Line Supervisors of Helpers, Laborers, and Material Movers, Hand 64 342 18.6%19-4091 Environmental Science and Protection Technicians, Including Health 42 122 34.0%51-9199 Production Workers, All Other 41 335 12.3%19-2041 Environmental Scientists and Specialists, Including Health 35 629 5.5%37-1012 First-Line Supervisors of Landscaping, Lawn Service, and Groundskeeping Workers 33 47 71.0%53-3031 Driver/Sales Workers 26 62 41.7%41-3099 Sales Representatives, Services, All Other 17 17 100.0%37-2012 Maids and Housekeeping Cleaners 15 24 61.9%37-2019 Building Cleaning Workers, All Other 14 14 100.0%11-3121 Human Resources Managers 9 9 100.0%51-8091 Chemical Plant and System Operators 6 25 25.1%
Total
Table - A37 All Occupations Listed within Administrative and Support and Waste Management and Remediation Services
Table - A38 All Occupations Listed within Educational Services
SOC Code
SOC Occupation TitleGreen
EmploymentTotal
Employment
% of Occupation
within Industry704 30,725 2.3%
11-3011 Administrative Services Managers 360 362 99.6%25-3099 Teachers and Instructors, All Other 161 179 90.1%25-1199 Postsecondary Teachers, All Other 36 36 100.0%25-2021 Elementary School Teachers, Except Special Education 33 33 100.0%25-2031 Secondary School Teachers, Except Special and Career/Technical Education 28 28 100.0%25-1194 Vocational Education Teachers, Postsecondary 23 34 68.3%37-2011 Janitors and Cleaners, Except Maids and Housekeeping Cleaners 22 582 3.8%11-9031 Education Administrators, Preschool and Childcare Center/Program 17 17 100.0%25-2032 Vocational Education Teachers, Secondary School 9 9 100.0%99-9998 Undisclosed Job Titles 9 450 1.9%11-9032 Education Administrators, Elementary and Secondary School 3 3 100.0%49-9071 Maintenance and Repair Workers, General 2 352 0.7%
Total
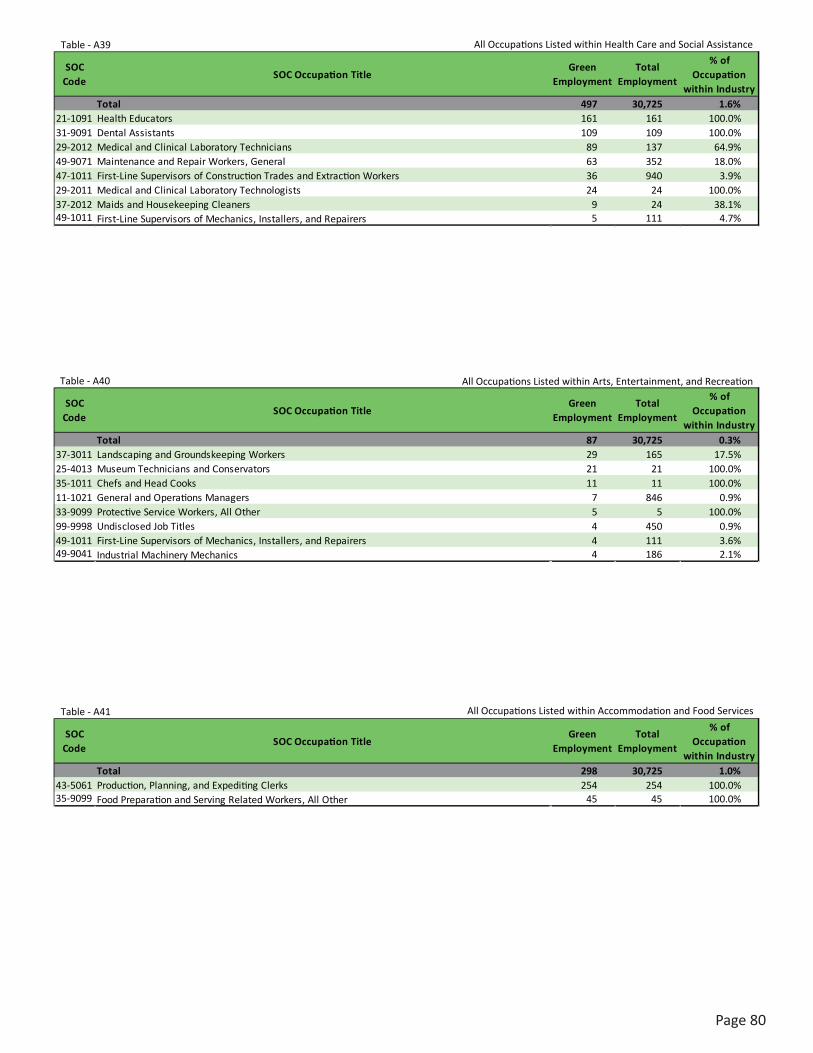
Page80
SOC Code
SOC Occupation TitleGreen
EmploymentTotal
Employment
% of Occupation
within Industry497 30,725 1.6%
21-1091 Health Educators 161 161 100.0%31-9091 Dental Assistants 109 109 100.0%29-2012 Medical and Clinical Laboratory Technicians 89 137 64.9%49-9071 Maintenance and Repair Workers, General 63 352 18.0%47-1011 First-Line Supervisors of Construction Trades and Extraction Workers 36 940 3.9%29-2011 Medical and Clinical Laboratory Technologists 24 24 100.0%37-2012 Maids and Housekeeping Cleaners 9 24 38.1%49-1011 First-Line Supervisors of Mechanics, Installers, and Repairers 5 111 4.7%
Total
Table - A39 All Occupations Listed within Health Care and Social Assistance
SOC Code
SOC Occupation TitleGreen
EmploymentTotal
Employment
% of Occupation
within Industry87 30,725 0.3%
37-3011 Landscaping and Groundskeeping Workers 29 165 17.5%25-4013 Museum Technicians and Conservators 21 21 100.0%35-1011 Chefs and Head Cooks 11 11 100.0%11-1021 General and Operations Managers 7 846 0.9%33-9099 Protective Service Workers, All Other 5 5 100.0%99-9998 Undisclosed Job Titles 4 450 0.9%49-1011 First-Line Supervisors of Mechanics, Installers, and Repairers 4 111 3.6%49-9041 Industrial Machinery Mechanics 4 186 2.1%
Total
Table - A40 All Occupations Listed within Arts, Entertainment, and Recreation
SOC Code
SOC Occupation TitleGreen
EmploymentTotal
Employment
% of Occupation
within Industry298 30,725 1.0%
43-5061 Production, Planning, and Expediting Clerks 254 254 100.0%35-9099 Food Preparation and Serving Related Workers, All Other 45 45 100.0%
Total
Table - A41 All Occupations Listed within Accommodation and Food Services
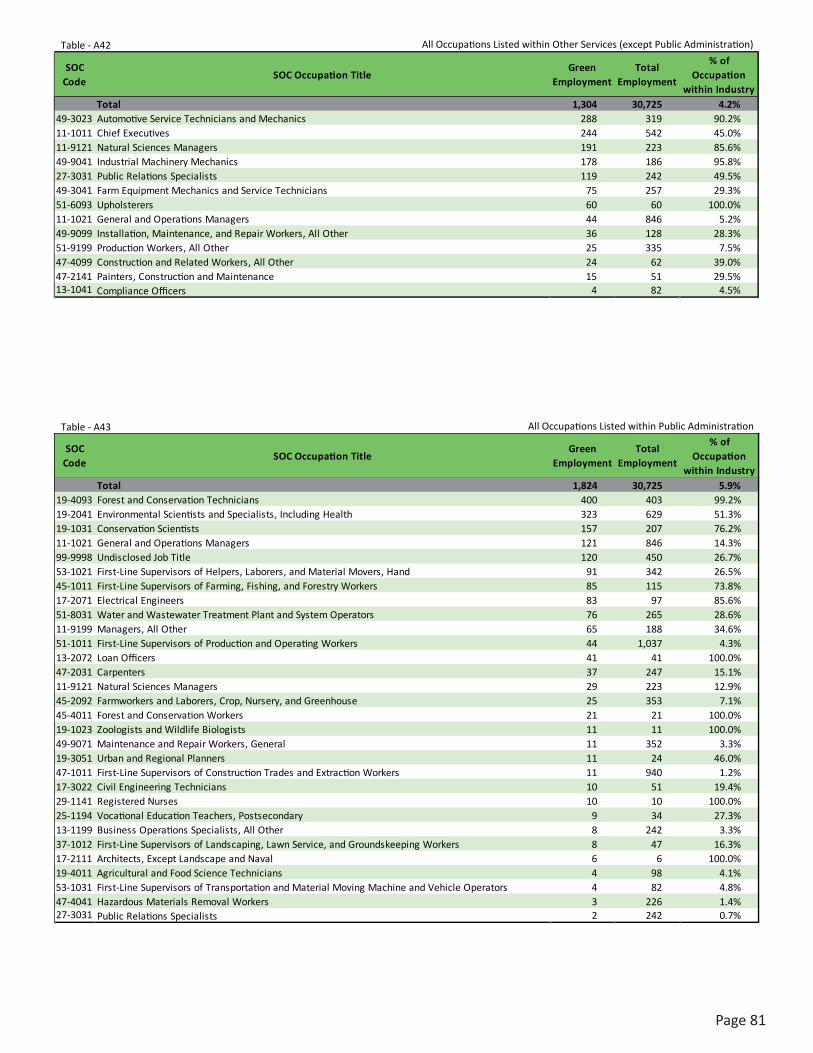
Page81
SOC Code
SOC Occupation TitleGreen
EmploymentTotal
Employment
% of Occupation
within Industry1,304 30,725 4.2%
49-3023 Automotive Service Technicians and Mechanics 288 319 90.2%11-1011 Chief Executives 244 542 45.0%11-9121 Natural Sciences Managers 191 223 85.6%49-9041 Industrial Machinery Mechanics 178 186 95.8%27-3031 Public Relations Specialists 119 242 49.5%49-3041 Farm Equipment Mechanics and Service Technicians 75 257 29.3%51-6093 Upholsterers 60 60 100.0%11-1021 General and Operations Managers 44 846 5.2%49-9099 Installation, Maintenance, and Repair Workers, All Other 36 128 28.3%51-9199 Production Workers, All Other 25 335 7.5%47-4099 Construction and Related Workers, All Other 24 62 39.0%47-2141 Painters, Construction and Maintenance 15 51 29.5%13-1041 Compliance Officers 4 82 4.5%
Total
Table - A42 All Occupations Listed within Other Services (except Public Administration)
SOC Code
SOC Occupation TitleGreen
EmploymentTotal
Employment
% of Occupation
within Industry1,824 30,725 5.9%
19-4093 Forest and Conservation Technicians 400 403 99.2%19-2041 Environmental Scientists and Specialists, Including Health 323 629 51.3%19-1031 Conservation Scientists 157 207 76.2%11-1021 General and Operations Managers 121 846 14.3%99-9998 Undisclosed Job Title 120 450 26.7%53-1021 First-Line Supervisors of Helpers, Laborers, and Material Movers, Hand 91 342 26.5%45-1011 First-Line Supervisors of Farming, Fishing, and Forestry Workers 85 115 73.8%17-2071 Electrical Engineers 83 97 85.6%51-8031 Water and Wastewater Treatment Plant and System Operators 76 265 28.6%11-9199 Managers, All Other 65 188 34.6%51-1011 First-Line Supervisors of Production and Operating Workers 44 1,037 4.3%13-2072 Loan Officers 41 41 100.0%47-2031 Carpenters 37 247 15.1%11-9121 Natural Sciences Managers 29 223 12.9%45-2092 Farmworkers and Laborers, Crop, Nursery, and Greenhouse 25 353 7.1%45-4011 Forest and Conservation Workers 21 21 100.0%19-1023 Zoologists and Wildlife Biologists 11 11 100.0%49-9071 Maintenance and Repair Workers, General 11 352 3.3%19-3051 Urban and Regional Planners 11 24 46.0%47-1011 First-Line Supervisors of Construction Trades and Extraction Workers 11 940 1.2%17-3022 Civil Engineering Technicians 10 51 19.4%29-1141 Registered Nurses 10 10 100.0%25-1194 Vocational Education Teachers, Postsecondary 9 34 27.3%13-1199 Business Operations Specialists, All Other 8 242 3.3%37-1012 First-Line Supervisors of Landscaping, Lawn Service, and Groundskeeping Workers 8 47 16.3%17-2111 Architects, Except Landscape and Naval 6 6 100.0%19-4011 Agricultural and Food Science Technicians 4 98 4.1%53-1031 First-Line Supervisors of Transportation and Material Moving Machine and Vehicle Operators 4 82 4.8%47-4041 Hazardous Materials Removal Workers 3 226 1.4%27-3031 Public Relations Specialists 2 242 0.7%
Total
Table - A43 All Occupations Listed within Public Administration
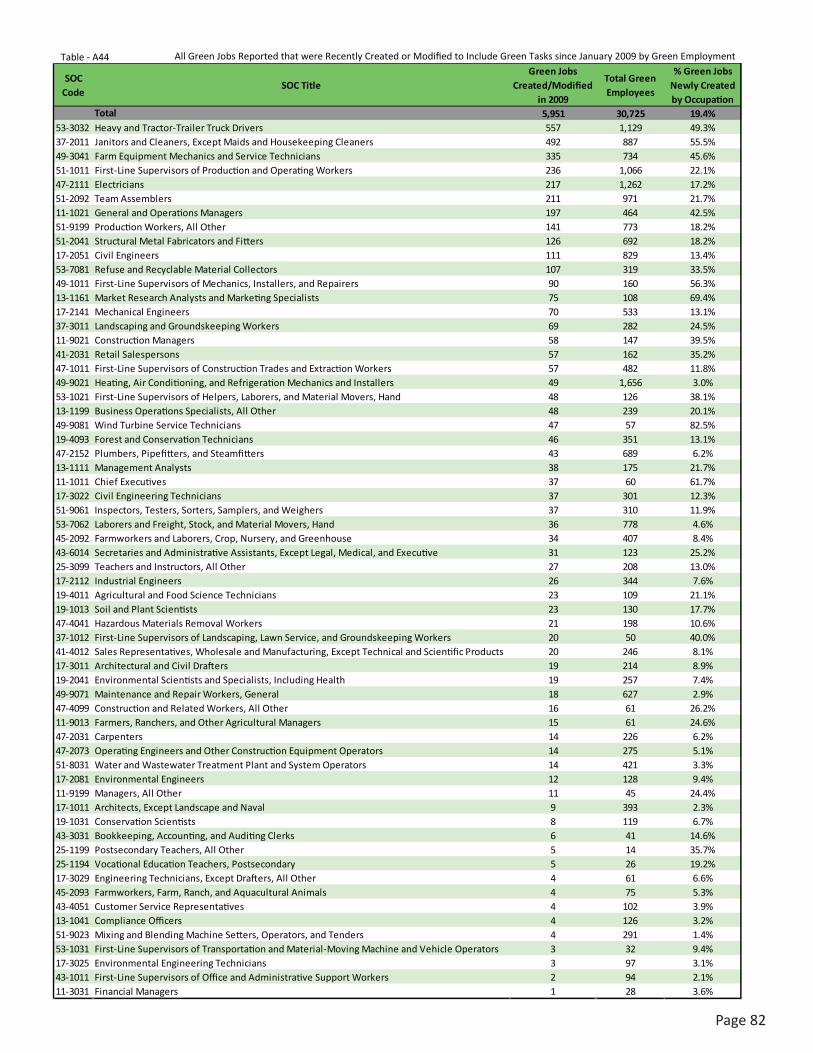
Page82
SOC Code
SOC TitleGreen Jobs
Created/Modified in 2009
Total Green Employees
% Green Jobs Newly Created by Occupation
5,951 30,725 19.4%53-3032 Heavy and Tractor-Trailer Truck Drivers 557 1,129 49.3%37-2011 Janitors and Cleaners, Except Maids and Housekeeping Cleaners 492 887 55.5%49-3041 Farm Equipment Mechanics and Service Technicians 335 734 45.6%51-1011 First-Line Supervisors of Production and Operating Workers 236 1,066 22.1%47-2111 Electricians 217 1,262 17.2%51-2092 Team Assemblers 211 971 21.7%11-1021 General and Operations Managers 197 464 42.5%51-9199 Production Workers, All Other 141 773 18.2%51-2041 Structural Metal Fabricators and Fitters 126 692 18.2%17-2051 Civil Engineers 111 829 13.4%53-7081 Refuse and Recyclable Material Collectors 107 319 33.5%49-1011 First-Line Supervisors of Mechanics, Installers, and Repairers 90 160 56.3%13-1161 Market Research Analysts and Marketing Specialists 75 108 69.4%17-2141 Mechanical Engineers 70 533 13.1%37-3011 Landscaping and Groundskeeping Workers 69 282 24.5%11-9021 Construction Managers 58 147 39.5%41-2031 Retail Salespersons 57 162 35.2%47-1011 First-Line Supervisors of Construction Trades and Extraction Workers 57 482 11.8%49-9021 Heating, Air Conditioning, and Refrigeration Mechanics and Installers 49 1,656 3.0%53-1021 First-Line Supervisors of Helpers, Laborers, and Material Movers, Hand 48 126 38.1%13-1199 Business Operations Specialists, All Other 48 239 20.1%49-9081 Wind Turbine Service Technicians 47 57 82.5%19-4093 Forest and Conservation Technicians 46 351 13.1%47-2152 Plumbers, Pipefitters, and Steamfitters 43 689 6.2%13-1111 Management Analysts 38 175 21.7%11-1011 Chief Executives 37 60 61.7%17-3022 Civil Engineering Technicians 37 301 12.3%51-9061 Inspectors, Testers, Sorters, Samplers, and Weighers 37 310 11.9%53-7062 Laborers and Freight, Stock, and Material Movers, Hand 36 778 4.6%45-2092 Farmworkers and Laborers, Crop, Nursery, and Greenhouse 34 407 8.4%43-6014 Secretaries and Administrative Assistants, Except Legal, Medical, and Executive 31 123 25.2%25-3099 Teachers and Instructors, All Other 27 208 13.0%17-2112 Industrial Engineers 26 344 7.6%19-4011 Agricultural and Food Science Technicians 23 109 21.1%19-1013 Soil and Plant Scientists 23 130 17.7%47-4041 Hazardous Materials Removal Workers 21 198 10.6%37-1012 First-Line Supervisors of Landscaping, Lawn Service, and Groundskeeping Workers 20 50 40.0%41-4012 Sales Representatives, Wholesale and Manufacturing, Except Technical and Scientific Products 20 246 8.1%17-3011 Architectural and Civil Drafters 19 214 8.9%19-2041 Environmental Scientists and Specialists, Including Health 19 257 7.4%49-9071 Maintenance and Repair Workers, General 18 627 2.9%47-4099 Construction and Related Workers, All Other 16 61 26.2%11-9013 Farmers, Ranchers, and Other Agricultural Managers 15 61 24.6%47-2031 Carpenters 14 226 6.2%47-2073 Operating Engineers and Other Construction Equipment Operators 14 275 5.1%51-8031 Water and Wastewater Treatment Plant and System Operators 14 421 3.3%17-2081 Environmental Engineers 12 128 9.4%11-9199 Managers, All Other 11 45 24.4%17-1011 Architects, Except Landscape and Naval 9 393 2.3%19-1031 Conservation Scientists 8 119 6.7%43-3031 Bookkeeping, Accounting, and Auditing Clerks 6 41 14.6%25-1199 Postsecondary Teachers, All Other 5 14 35.7%25-1194 Vocational Education Teachers, Postsecondary 5 26 19.2%17-3029 Engineering Technicians, Except Drafters, All Other 4 61 6.6%45-2093 Farmworkers, Farm, Ranch, and Aquacultural Animals 4 75 5.3%43-4051 Customer Service Representatives 4 102 3.9%13-1041 Compliance Officers 4 126 3.2%51-9023 Mixing and Blending Machine Setters, Operators, and Tenders 4 291 1.4%53-1031 First-Line Supervisors of Transportation and Material-Moving Machine and Vehicle Operators 3 32 9.4%17-3025 Environmental Engineering Technicians 3 97 3.1%43-1011 First-Line Supervisors of Office and Administrative Support Workers 2 94 2.1%11-3031 Financial Managers 1 28 3.6%
Total
All Green Jobs Reported that were Recently Created or Modified to Include Green Tasks since January 2009 by Green EmploymentTable - A44
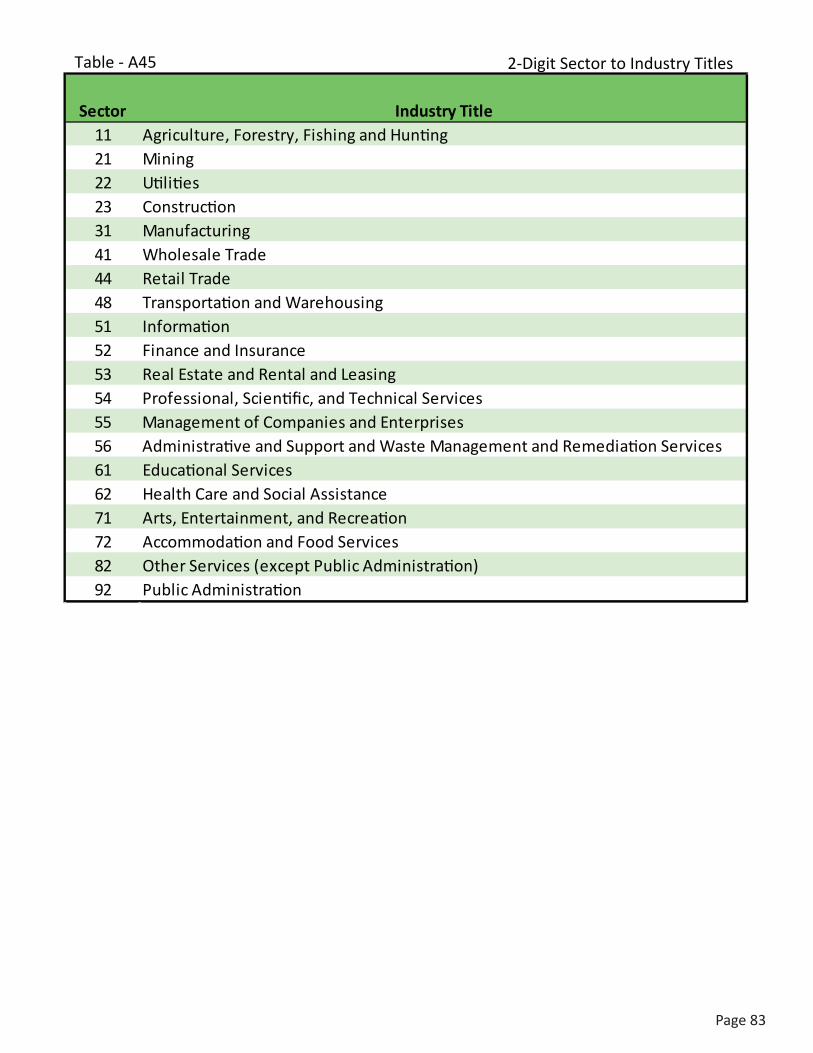
Page83
Sector Industry Title11 Agriculture, Forestry, Fishing and Hunting21 Mining22 Utilities23 Construction31 Manufacturing41 Wholesale Trade44 Retail Trade48 Transportation and Warehousing51 Information52 Finance and Insurance53 Real Estate and Rental and Leasing54 Professional, Scientific, and Technical Services55 Management of Companies and Enterprises56 Administrative and Support and Waste Management and Remediation Services61 Educational Services62 Health Care and Social Assistance71 Arts, Entertainment, and Recreation72 Accommodation and Food Services82 Other Services (except Public Administration)92 Public Administration
Table - A45 2-Digit Sector to Industry Titles
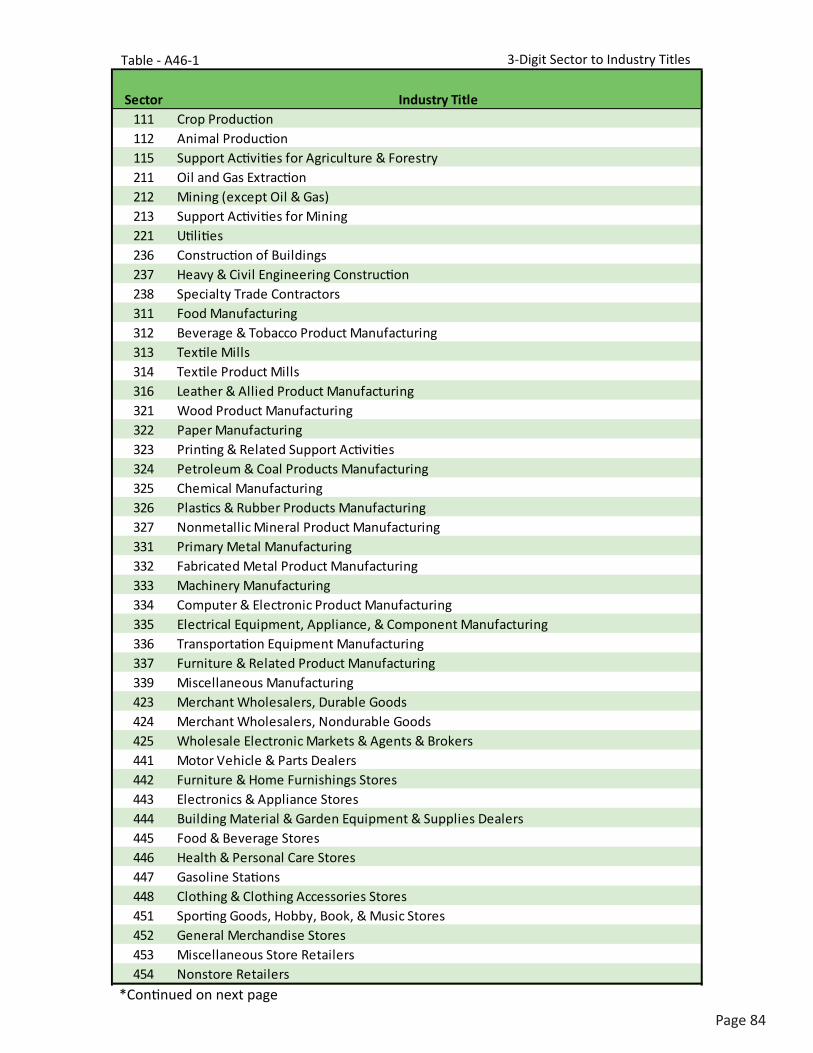
Page84
Sector Industry Title111 Crop Production112 Animal Production115 Support Activities for Agriculture & Forestry211 Oil and Gas Extraction212 Mining (except Oil & Gas)213 Support Activities for Mining221 Utilities236 Construction of Buildings237 Heavy & Civil Engineering Construction238 Specialty Trade Contractors311 Food Manufacturing312 Beverage & Tobacco Product Manufacturing313 Textile Mills314 Textile Product Mills316 Leather & Allied Product Manufacturing321 Wood Product Manufacturing322 Paper Manufacturing323 Printing & Related Support Activities324 Petroleum & Coal Products Manufacturing325 Chemical Manufacturing326 Plastics & Rubber Products Manufacturing327 Nonmetallic Mineral Product Manufacturing331 Primary Metal Manufacturing332 Fabricated Metal Product Manufacturing333 Machinery Manufacturing334 Computer & Electronic Product Manufacturing335 Electrical Equipment, Appliance, & Component Manufacturing336 Transportation Equipment Manufacturing337 Furniture & Related Product Manufacturing339 Miscellaneous Manufacturing423 Merchant Wholesalers, Durable Goods424 Merchant Wholesalers, Nondurable Goods425 Wholesale Electronic Markets & Agents & Brokers441 Motor Vehicle & Parts Dealers442 Furniture & Home Furnishings Stores443 Electronics & Appliance Stores444 Building Material & Garden Equipment & Supplies Dealers445 Food & Beverage Stores446 Health & Personal Care Stores447 Gasoline Stations448 Clothing & Clothing Accessories Stores451 Sporting Goods, Hobby, Book, & Music Stores452 General Merchandise Stores453 Miscellaneous Store Retailers454 Nonstore Retailers
Table - A46-1 3-Digit Sector to Industry Titles
*Continued on next page
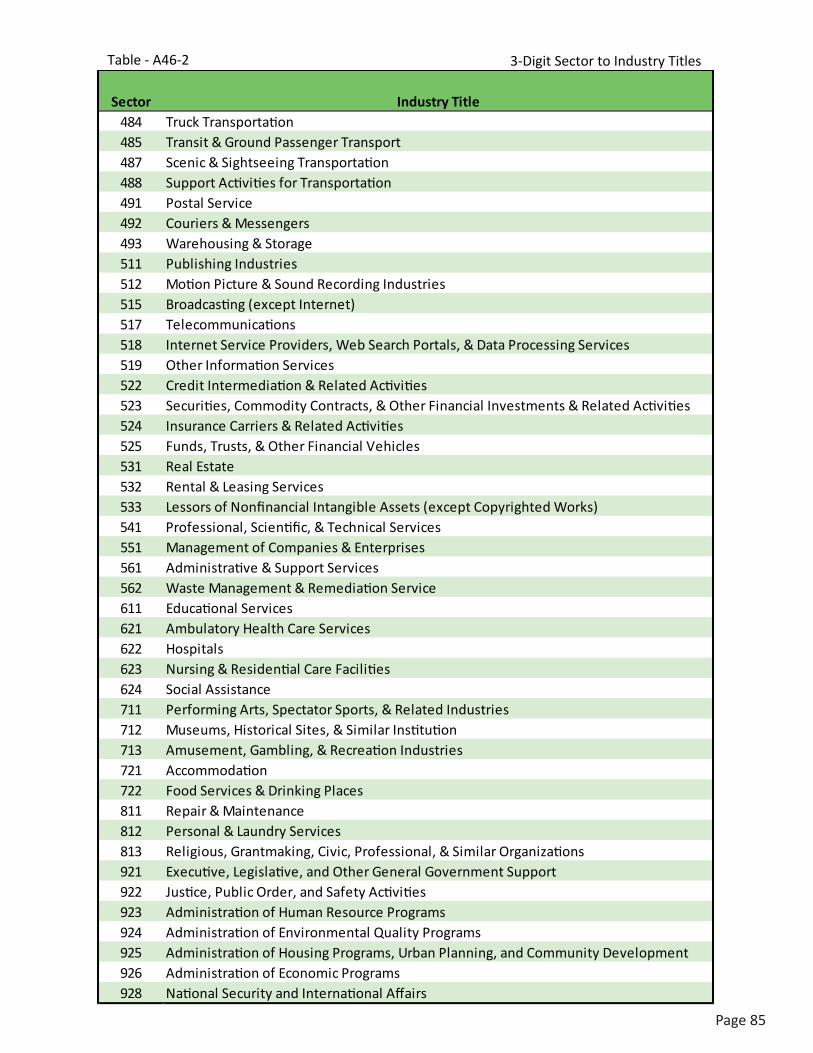
Page85
Sector Industry Title484 Truck Transportation485 Transit & Ground Passenger Transport487 Scenic & Sightseeing Transportation488 Support Activities for Transportation491 Postal Service492 Couriers & Messengers493 Warehousing & Storage511 Publishing Industries512 Motion Picture & Sound Recording Industries515 Broadcasting (except Internet)517 Telecommunications518 Internet Service Providers, Web Search Portals, & Data Processing Services519 Other Information Services522 Credit Intermediation & Related Activities523 Securities, Commodity Contracts, & Other Financial Investments & Related Activities524 Insurance Carriers & Related Activities525 Funds, Trusts, & Other Financial Vehicles531 Real Estate532 Rental & Leasing Services533 Lessors of Nonfinancial Intangible Assets (except Copyrighted Works)541 Professional, Scientific, & Technical Services551 Management of Companies & Enterprises561 Administrative & Support Services562 Waste Management & Remediation Service611 Educational Services621 Ambulatory Health Care Services622 Hospitals623 Nursing & Residential Care Facilities624 Social Assistance711 Performing Arts, Spectator Sports, & Related Industries712 Museums, Historical Sites, & Similar Institution713 Amusement, Gambling, & Recreation Industries721 Accommodation722 Food Services & Drinking Places811 Repair & Maintenance812 Personal & Laundry Services813 Religious, Grantmaking, Civic, Professional, & Similar Organizations921 Executive, Legislative, and Other General Government Support922 Justice, Public Order, and Safety Activities923 Administration of Human Resource Programs924 Administration of Environmental Quality Programs925 Administration of Housing Programs, Urban Planning, and Community Development926 Administration of Economic Programs928 National Security and International Affairs
Table - A46-2 3-Digit Sector to Industry Titles

PageNumber
AlloftheinformationcontainedinthisreportwascompiledbytheNebraskaDepartmentofLabor,OfficeofLaborMarketInformation.
CurrentInformationcanbeobtainedandprintedbyvisiting:
NEworks.nebraska.gov
Andcanbefoundunderthe‘Publications’section.ForquestionsaboutNebraska’sGreenJobsReportpleasecontacttheLaborMarket
InformationCenter.
NebraskaWorkforceDevelopment–DepartmentofLabor
OfficeofLaborMarketInformation
NEworks.nebraska.gov;ClickonLaborMarketInformation
402.471.2600or800.876.1377
D EPARTMENT OF L ABOR
ThisworkforcesolutionwasfundedbyagrantawardedbytheU.S.DepartmentofLabor’sEmploymentandTrainingAdministration.ThesolutionwascreatedbythegranteeanddoesnotnecessarilyreflecttheofficialpositionoftheU.S.DepartmentofLabor.TheDe-partmentofLabormakesnoguarantees,warranties,orassurancesofanykind,expressorimplied,withrespecttosuchinformation,includinganyinformationonlinkedsitesandincluding,butnotlimitedto,accuracyoftheinformationoritscompleteness,timeliness,usefulness,adequacy,continuedavailability,orownership.Thissolutioniscopyrightedbytheinstitutionthatcreatedit.Internalusebyanorganizationand/orpersonalusebyanindividualfornon-commercialpurposesispermissible.Allotherusesrequiretheprior
authorizationofthecopyrightowner.


![Combined Metro Labor study6-17-15 - NEworks · PDF filepublic information officer, nebraska department of labor grace johnson graphic designers, ... ndol lmi ana-o\]hg uhvxowv dqg](https://img.pdfslide.us/doc/110x75/5abe8bd17f8b9ac0598d40db/combined-metro-labor-study6-17-15-neworks-public-information-officer-nebraska.jpg)