Embed Size (px)
Citation preview
University of Nebraska-Lincoln Department of Agricultural Economics
Nebraska Farm Real Estate Market Highlights
2016-2017
Jim Jansen
Page ii
Nebraska Farm Real Estate Market Highlights 2016-2017
By
Jim Jansen*
* Agricultural Economist, Northeast District, Eastern Nebraska Research and Extension Center, University of Nebraska–Lincoln. Phone: (402) 261-7572; email: [email protected]
Sincere appreciation goes to the panel members for their participation in the UNL 2017 Nebraska Farm Real Estate Market Survey. Without their valuable input, much of the information within this report would not exist. Special appreciation also goes to Dr. Bruce Johnson who conducted the UNL Nebraska Farm Real Estate Developments Survey from 1978 until his retirement in 2013. His advice and insight have been critical to the success of the survey and report. Recognition is also extended to Linda Tesch, Wei Wei Heselton, and Roger Wilson for their significant contributions throughout the survey, report analysis, and publication process. NOTE: This report is available at agecon.unl.edu/realestate If electronic copies are not accessible, hard copies of these highlights can be purchased for $7.00 per copy from: Department of Agricultural Economics University of Nebraska–Lincoln Attn: Real Estate Report 207 Filley Hall Lincoln, NE 68583-0922 It is the policy of the University of Nebraska–Lincoln not to discriminate based upon age, race, ethnicity, color, national origin, gender-identity, sex, pregnancy, disability, sexual orientation, genetic information, veteran’s status, marital status, religion or political affiliation.
Page iii
Disclaimer
The Nebraska Farm Real Estate Market Highlights 2016-2017 publication was created for educational purposes to provide insight on recent trends in agricultural land values and rental rates across Nebraska. Agricultural land values and rental rates in the report represent averages for different regions of the State. Actual agricultural land values or rental rates for an individual parcel in Nebraska will vary from reported figures depending on quality attributes and local market forces of the area. Agricultural land values and rental rates for this publication were obtained by surveying expert panel members engaged in agricultural land and rental markets throughout Nebraska. The panel member’s validity relies on their expertise and accuracy and the authors do not make any guarantees as to their qualifications or the reliability of their responses. While survey responses were examined to eliminate data that was obviously erroneous, no further effort was made to independently verify or corroborate the data. Physical attributes such as location, soil type, topography, or depth to water may affect the value of a given real property causing the value to deviate substantially from what may be considered normal for the area. Also, local market forces such as the competitive nature of an area and local government policies such as restrictions on the use of water all have the ability to greatly impact agricultural land values or rental rates. In addition, variations exist within reporting Districts that may cause real estate values and rental rates to differ substantially within the region. As an example, the North reporting district spans almost 200 miles from east to west. Precipitation in Nebraska decreases on average an inch every 25 miles a person travels westward resulting in a possible decline of eight inches from the eastern side of this district to the west. An eight-inch difference in precipitation for a semi-arid region will substantially change the value and rental rates for crop and range ground. Due to the inherent limitations of this survey, some of which are listed above, information in this report should not be used to set a specific rental rate or value a particular parcel of real property for sale or property taxes, security for a loan, and other related legal matters.

Page v
Table of Contents Table of Contents ........................................................................................................................................................ v
List of Figures .............................................................................................................................................................vi
Introduction ................................................................................................................................................................ 1
2017 Nebraska Agricultural Land Values ................................................................................................................ 3
Table 1. Average Reported Value of Nebraska Farmland for Different Land Types by Agricultural Statistics District, February 1, 2017 ................................................................................4
Table 2. 2017 Values and Recent Trends by Area of the State .........................................................................6
Table 3. 2017 Values and Recent Trends by Land Class in Nebraska .............................................................6
2017 Land Values Ranges .......................................................................................................................................... 7
Table 4. Average Reported Value Per Acre of Nebraska Farmland for Different Types and Grades of Land in Nebraska by Agricultural Statistics District, February 1, 2017 ........................7
2017 Net Rates of Return to Agricultural Land ...................................................................................................... 8
Table 5. Estimated Annual Net Rates of Return by Type of Land and Agricultural Statistics District, Selected Years 2013-2017 .......................................................................................................8
Factors Influencing Current Agricultural Land Markets ....................................................................................10
Characteristics of 2016 Land Market Transactions..............................................................................................11
Table 6. Land Characteristics of 2016 Agricultural Real Estate Transactions, by Agricultural Statistics District in Nebraska ............................................................................................................ 11
Table 7. Types of Financing Associated with 2016 Agricultural Real Estate Sales, by Agricultural Statistics District in Nebraska ...................................................................................... 12
Table 8. Percent Distribution of Agricultural Real Estate Transactions in 2016 by Buyer Type, by Agricultural Statistics District in Nebraska ................................................................................. 12
Table 9. Percent Distribution of Agricultural Real Estate Transactions in 2016 by Seller Type, by Agricultural Statistics District in Nebraska ................................................................................. 13
2017 Cash Rental Rates ............................................................................................................................................14
Table 10. Reported Cash Rental Rates for Various Types of Nebraska Farmland and Pasture: 2017 Averages, Percent Change from 2016 and Quality Ranges by Agricultural Statistics District ................................................................................................................................ 14
Table 11. Reported Cash Rental Rates for Pasture on a Monthly Rate Basis for 2017: Averages and Ranges by Agricultural Statistics District ............................................................................... 15
Special Feature: 2017 Crop Share Leasing Trends in Nebraska .........................................................................16
Table 12. 2017 Production Expenses Paid by the Landlord to the Tenant for Common Crop Share Lease Arrangements in Nebraska ......................................................................................... 16
Page vi
Table of Contents (continued)
Statistical Appendix ..................................................................................................................................................18
Appendix Table 1. Farm Real Estate Values in Nebraska, USDA Historical Series, 1860-2017 .............. 19
Appendix Table 2. Deflated USDA Farmland Values and Percent Changes for Nebraska, 1930 to 2017 ....................................................................................................................... 22
Appendix Table 3. Nominal and Deflated Agricultural Land Values by Selected Types of Land in Nebraska, 1978 to 2017 ................................................................................................ 25
Appendix Table 4. Average Reported Value of Nebraska Farmland for Different Types of Land by Agricultural Statistics District, 1978-2017 ................................................................ 27
Appendix Table 5. Historical Per Acre Value Range for Different Types and Quality Grades of Land in Nebraska by Agricultural Statistics District, 2013-2017 ................................ 43
Appendix Table 6. Estimated Annual Net Rates of Return to Nebraska Farmland for Different Types of Land by Agricultural Statistics District, 1990-2017 ...................................... 45
Appendix Table 7. Historical Average Cash Rental Rates of Nebraska Farmland for Different Types of Land by Agricultural Statistics District, 1981-2017 ...................................... 48
List of Figures
Figure 1. Nebraska Agricultural Statistics Districts ..............................................................................................2 Figure 2. Average Value of Nebraska Farmland, February 1, 2017 and Percent Change
From Year Earlier .....................................................................................................................................3 Figure 3. Historical Nebraska All Land Average Value per Acre and Marketing Year Average
Price of Corn, Selected Years 1978-2017 ...............................................................................................5 Figure 4. Historical Estimated Annual Net Rates of Return by Land Type in Nebraska,
Selected Years 1990-2017 .........................................................................................................................9 Figure 5. Reporters’ Rating of Factors Influencing Agricultural Land Values in Their Areas
of Nebraska, February 2017 .................................................................................................................. 10 Figure 6. Prevalence of Common Crop Share Lease Arrangements for Landlords and
Tenants in Nebraska .............................................................................................................................. 17 Figure 7. Marketer of Landlords Portion of Commodity Produced as Part of Crop Share
Lease Arrangement in Nebraska .......................................................................................................... 17
Nebraska Farm Real Estate Market Developments 2016-2017 Page 1
Introduction The Nebraska Farm Real Estate Market Highlights 2016-2017 report represents the 39th edition to the annual series. These reports provide an important insight on agricultural land market dynamics for stakeholders across Nebraska. In today’s market, where market transactions exceeding a million dollars are the norm, objective market information and analysis is more critical than ever. The focus of the report continues to provide unbiased information on agricultural land values and rental rates so industry participants can make educated and informed decisions. This year, the February 2017 survey of nearly 150 expert-panel members from across the state provided current information and insight regarding the agricultural land market conditions in their areas. The panel members have been selected on the basis of being actively engaged in agricultural land markets as certified agricultural appraisers, professional farm managers, agricultural lenders primarily focused on agricultural land transactions, and other professionals engaged in the Nebraska agricultural land industry due to the inherit nature of their positions. The majority of panelists participating in the survey have reported annually for a considerable number of years which provides valuable historical consistency and context to the agricultural land values and rental rates provided. Based on their knowledge of market activity, reporters provide point-in-time estimates of current agricultural land values and cash rental rates for a variety of land types and classes. Comparing these current measures against previous years’ results provides important trend analysis. The appendix in this report includes: the historical UNL data series for Nebraska agricultural land values dating back to 1978, the agricultural cash rental rate series dating back to 1981, and the USDA historical all-land value series. In addition to the point-in-time estimates, panel members provide details regarding actual sales transactions which have occurred over the previous 12 months. This year the panel provided information on 433 sales that were considered representative of the recent agricultural land market. This gives insight into the characteristics of recent sales as well as benchmark indicators for studying trends. Changes in the nature of market participants engaged in land transactions from year-to-year may also be ascertained from evaluating this information.
Nebraska Farm Real Estate Market Developments 2016-2017 Page 2
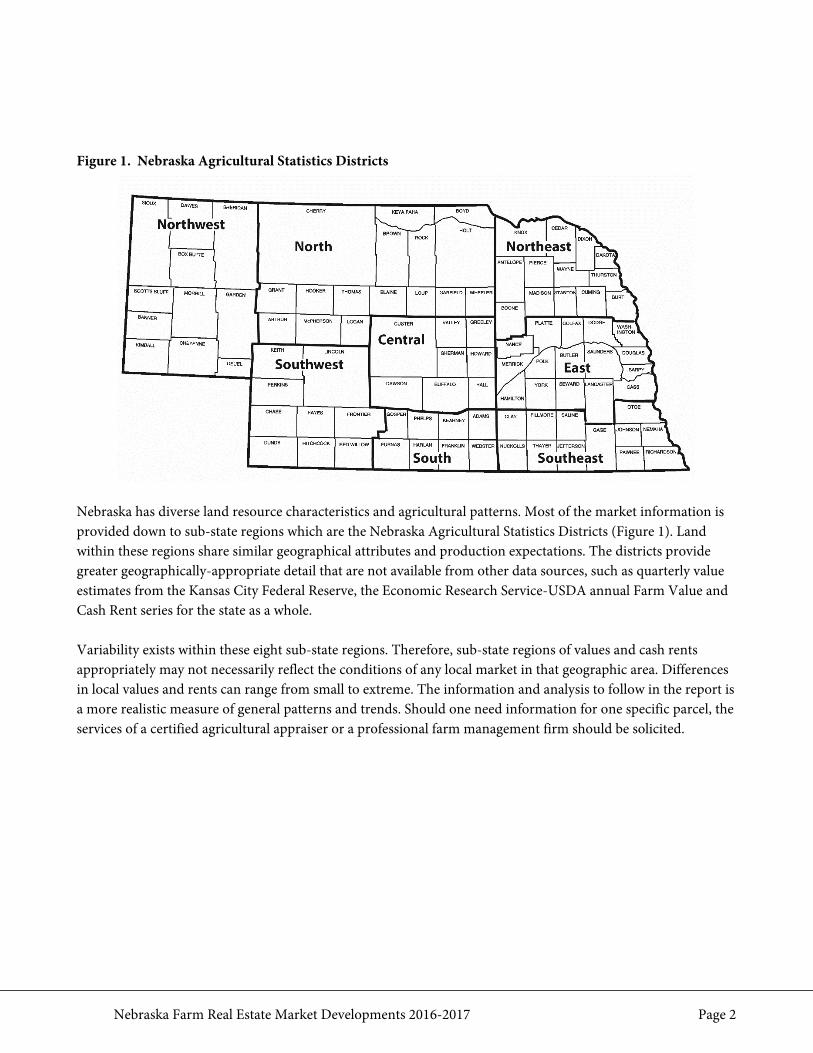
Figure 1. Nebraska Agricultural Statistics Districts
Nebraska has diverse land resource characteristics and agricultural patterns. Most of the market information is provided down to sub-state regions which are the Nebraska Agricultural Statistics Districts (Figure 1). Land within these regions share similar geographical attributes and production expectations. The districts provide greater geographically-appropriate detail that are not available from other data sources, such as quarterly value estimates from the Kansas City Federal Reserve, the Economic Research Service-USDA annual Farm Value and Cash Rent series for the state as a whole. Variability exists within these eight sub-state regions. Therefore, sub-state regions of values and cash rents appropriately may not necessarily reflect the conditions of any local market in that geographic area. Differences in local values and rents can range from small to extreme. The information and analysis to follow in the report is a more realistic measure of general patterns and trends. Should one need information for one specific parcel, the services of a certified agricultural appraiser or a professional farm management firm should be solicited.
Nebraska Farm Real Estate Market Developments 2016-2017 Page 3
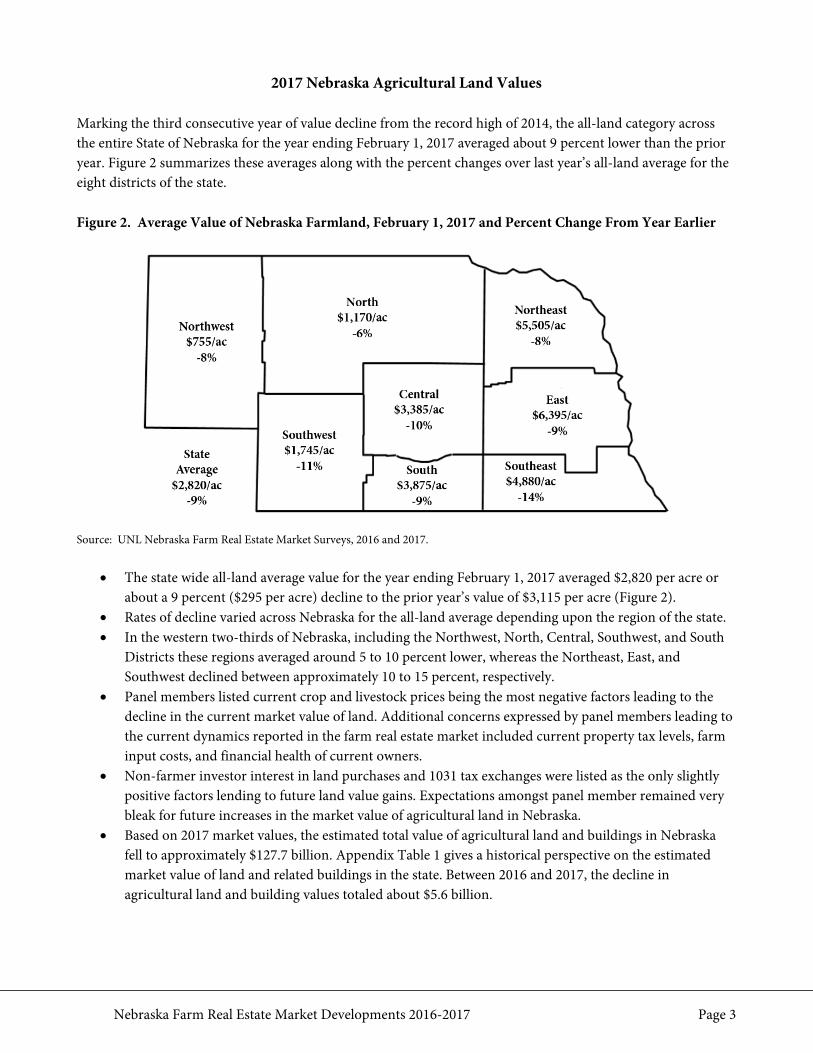
2017 Nebraska Agricultural Land Values Marking the third consecutive year of value decline from the record high of 2014, the all-land category across the entire State of Nebraska for the year ending February 1, 2017 averaged about 9 percent lower than the prior year. Figure 2 summarizes these averages along with the percent changes over last year’s all-land average for the eight districts of the state. Figure 2. Average Value of Nebraska Farmland, February 1, 2017 and Percent Change From Year Earlier
Source: UNL Nebraska Farm Real Estate Market Surveys, 2016 and 2017.
• The state wide all-land average value for the year ending February 1, 2017 averaged $2,820 per acre or about a 9 percent ($295 per acre) decline to the prior year’s value of $3,115 per acre (Figure 2).
• Rates of decline varied across Nebraska for the all-land average depending upon the region of the state. • In the western two-thirds of Nebraska, including the Northwest, North, Central, Southwest, and South
Districts these regions averaged around 5 to 10 percent lower, whereas the Northeast, East, and Southwest declined between approximately 10 to 15 percent, respectively.
• Panel members listed current crop and livestock prices being the most negative factors leading to the decline in the current market value of land. Additional concerns expressed by panel members leading to the current dynamics reported in the farm real estate market included current property tax levels, farm input costs, and financial health of current owners.
• Non-farmer investor interest in land purchases and 1031 tax exchanges were listed as the only slightly positive factors lending to future land value gains. Expectations amongst panel member remained very bleak for future increases in the market value of agricultural land in Nebraska.
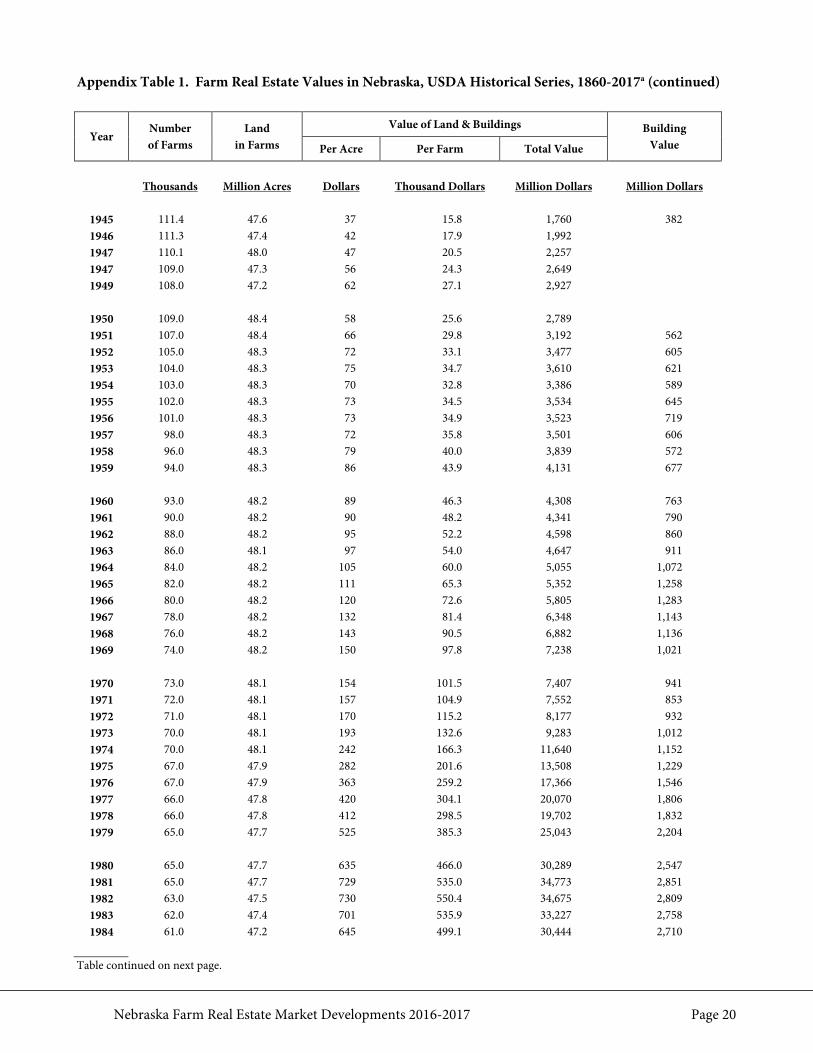
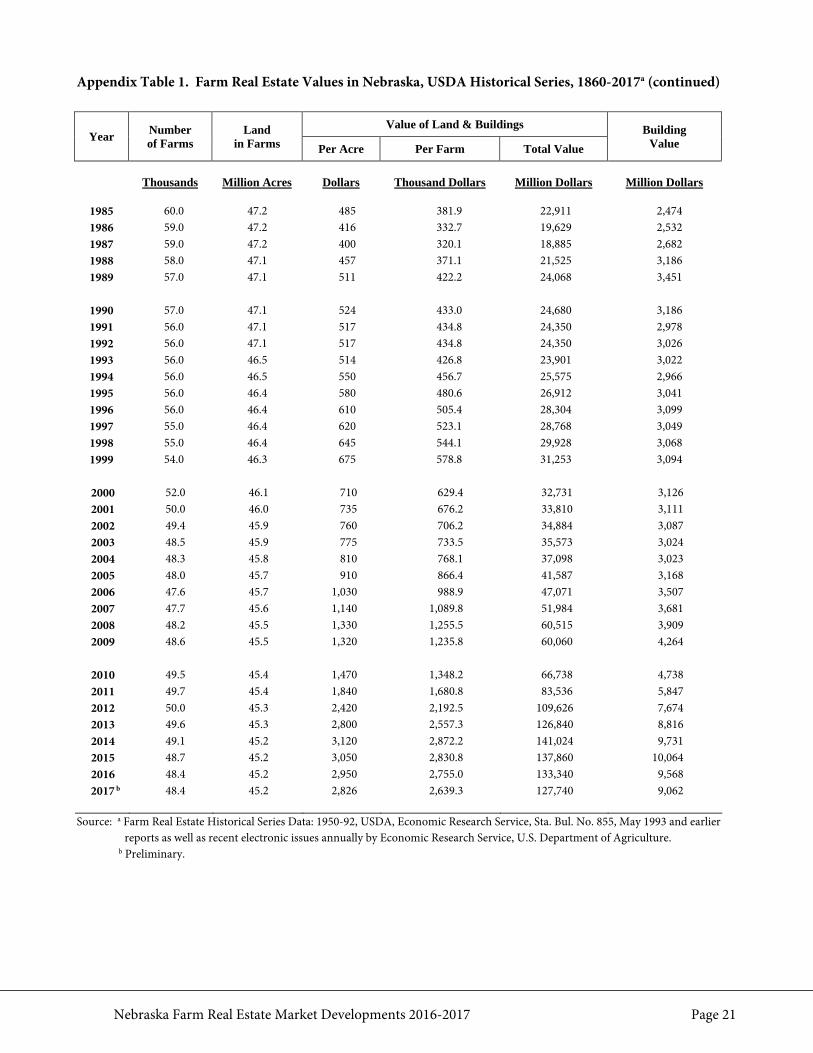
• Based on 2017 market values, the estimated total value of agricultural land and buildings in Nebraska fell to approximately $127.7 billion. Appendix Table 1 gives a historical perspective on the estimated market value of land and related buildings in the state. Between 2016 and 2017, the decline in agricultural land and building values totaled about $5.6 billion.
Nebraska Farm Real Estate Market Developments 2016-2017 Page 4
Table 1. Average Reported Value of Nebraska Farmland for Different Land Types by Agricultural Statistics District, February 1, 2017a
Type of Land
and Year Agricultural Statistics District
Northwest North Northeast Central East Southwest South Southeast Statec - - - - - - - - - - - - - - - - - - - - - - - - - - - - - Dollars Per Acre - - - - - - - - - - - - - - - - - - - - - - - - - - - Dryland Cropland (No Irrigation Potential)
$/acre 715 1,560 5,410 2,785 5,790 1,710 3,045 4,285 3,145 % change -4 -5 -6 -14 -9 -13 -15 -12 -9
Dryland Cropland (Irrigation Potential) $/acre 765 2,110 5,980 3,220 6,455 1,720 3,750 5,390 4,225 % change -3 -2 -11 -16 -10 -5 -13 -16 -12
Grazing Land (Tillable) $/acre 530 1,170 3,665 2,155 3,765 975 2,040 2,780 1,335 % change -6 -12 -7 -12 -14 -9 -9 -13 -11
Grazing Land (Nontillable) $/acre 465 705 2,230 1,685 2,495 820 1,500 2,005 895 % change -3 -5 -10 -12 -11 -10 -11 -9 -8
Hayland $/acre 795 1,370 3,295 2,170 3,090 1,485 2,160 2,680 1,815 % change -11 -6 -4 -16 -3 -13 -8 -4 -8
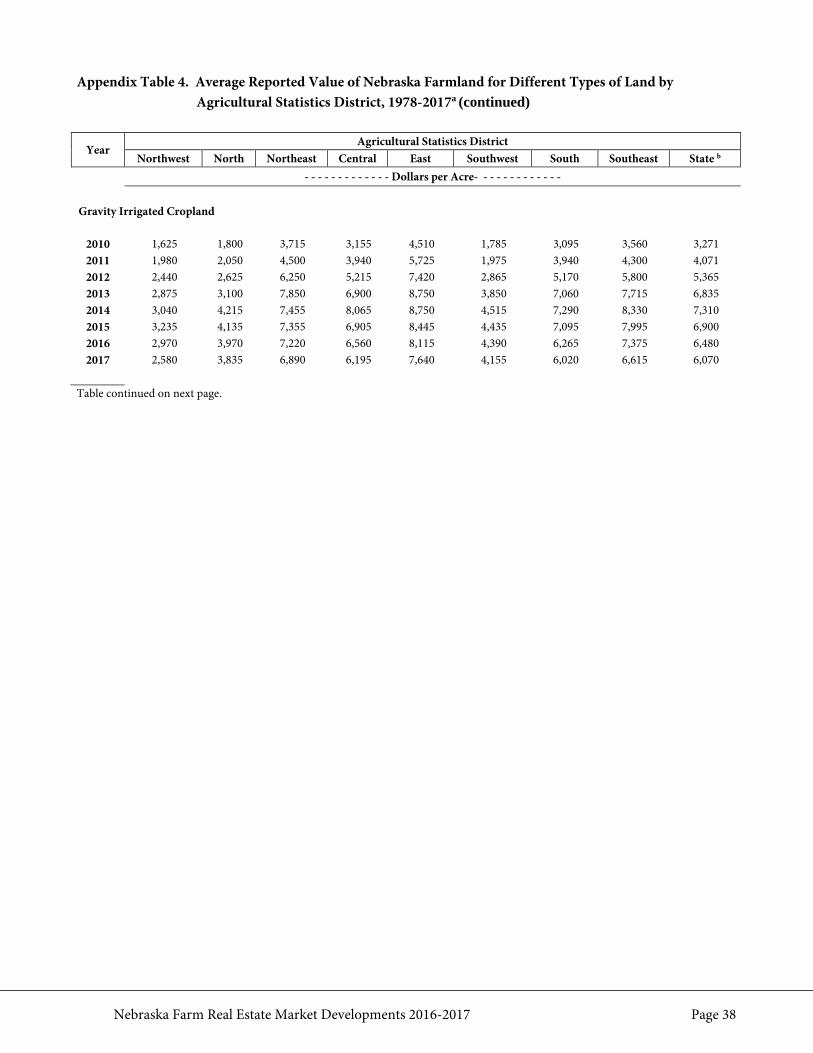
Gravity Irrigated Cropland $/acre 2,580 3,835 6,890 6,195 7,640 4,155 6,020 6,615 6,070 % change -13 -3 -5 -6 -6 -5 -4 -10 -6
Center Pivot Irrigated Croplandb $/acre 2,815 4,150 7,445 6,885 8,700 4,510 6,700 7,820 6,295 % change -14 -5 -6 -9 -8 -15 -7 -15 -9
All Land Averagec $/acre 755 1,170 5,505 3,385 6,395 1,745 3,875 4,880 2,820 % change -8 -6 -8 -10 -9 -11 -9 -14 -9
Source: a UNL Nebraska Farm Real Estate Market Surveys, 2016 and 2017. b Value of pivot not included in per acre value. c Weighted averages.
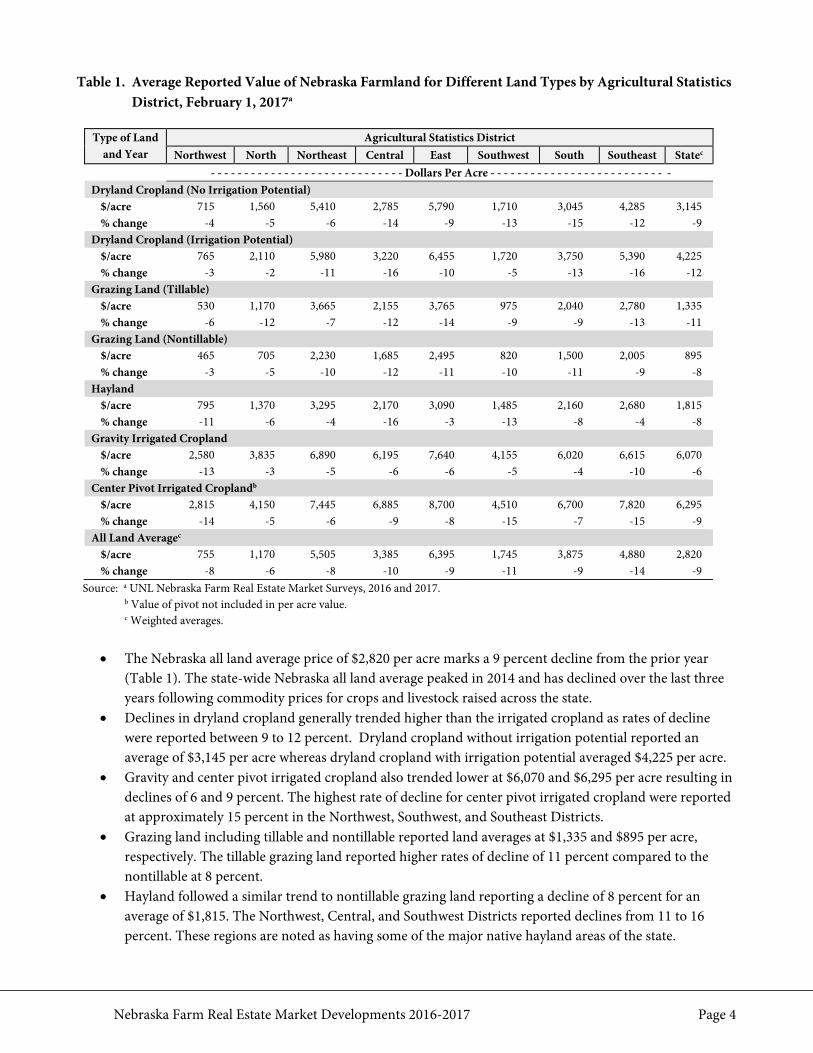
• The Nebraska all land average price of $2,820 per acre marks a 9 percent decline from the prior year
(Table 1). The state-wide Nebraska all land average peaked in 2014 and has declined over the last three years following commodity prices for crops and livestock raised across the state.
• Declines in dryland cropland generally trended higher than the irrigated cropland as rates of decline were reported between 9 to 12 percent. Dryland cropland without irrigation potential reported an average of $3,145 per acre whereas dryland cropland with irrigation potential averaged $4,225 per acre.
• Gravity and center pivot irrigated cropland also trended lower at $6,070 and $6,295 per acre resulting in declines of 6 and 9 percent. The highest rate of decline for center pivot irrigated cropland were reported at approximately 15 percent in the Northwest, Southwest, and Southeast Districts.
• Grazing land including tillable and nontillable reported land averages at $1,335 and $895 per acre, respectively. The tillable grazing land reported higher rates of decline of 11 percent compared to the nontillable at 8 percent.
• Hayland followed a similar trend to nontillable grazing land reporting a decline of 8 percent for an average of $1,815. The Northwest, Central, and Southwest Districts reported declines from 11 to 16 percent. These regions are noted as having some of the major native hayland areas of the state.
Nebraska Farm Real Estate Market Developments 2016-2017 Page 5
Figure 3. Historical Nebraska All Land Average Value per Acre and Marketing Year Average Price of Corn, Selected Years 1978-2017ab
Source: a UNL Nebraska Farm Real Estate Market Surveys, 1978-2017.
b World Agricultural Supply and Demand Estimates (WASDE), Office of the Chief Economist, USDA, 1978-2017. Preliminary Marketing Year Average price estimates for corn in 2016 and 2017.
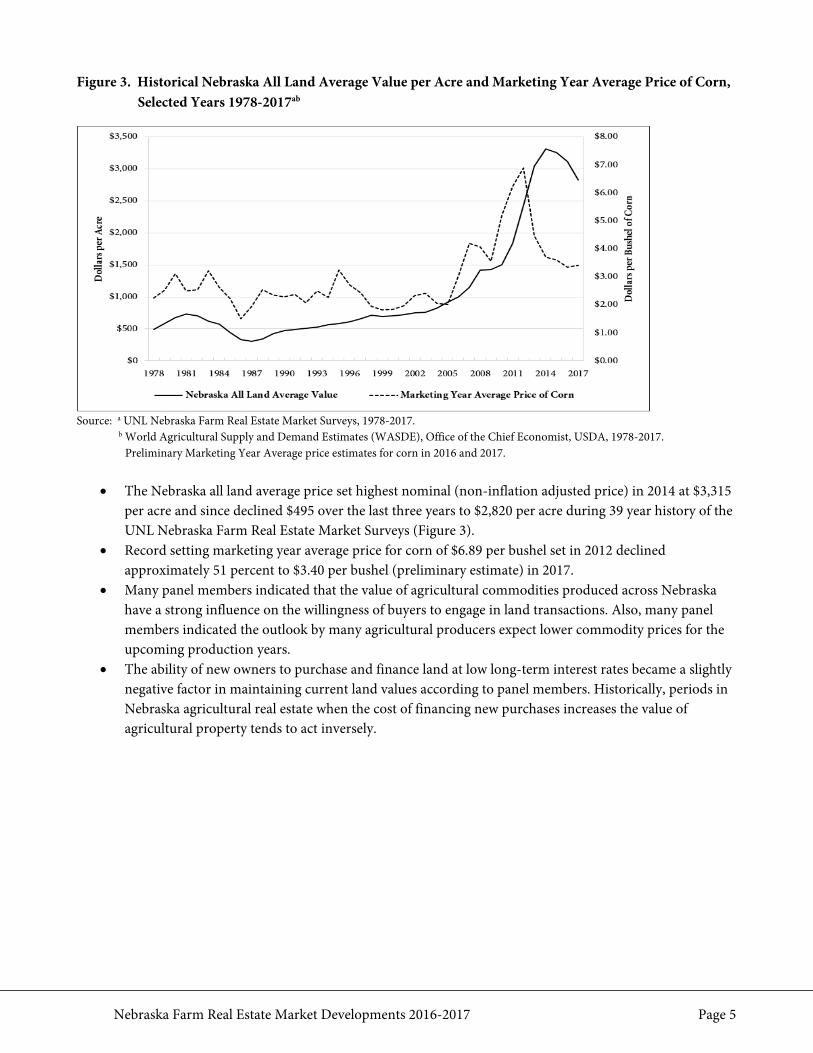
• The Nebraska all land average price set highest nominal (non-inflation adjusted price) in 2014 at $3,315
per acre and since declined $495 over the last three years to $2,820 per acre during 39 year history of the UNL Nebraska Farm Real Estate Market Surveys (Figure 3).
• Record setting marketing year average price for corn of $6.89 per bushel set in 2012 declined approximately 51 percent to $3.40 per bushel (preliminary estimate) in 2017.
• Many panel members indicated that the value of agricultural commodities produced across Nebraska have a strong influence on the willingness of buyers to engage in land transactions. Also, many panel members indicated the outlook by many agricultural producers expect lower commodity prices for the upcoming production years.
• The ability of new owners to purchase and finance land at low long-term interest rates became a slightly negative factor in maintaining current land values according to panel members. Historically, periods in Nebraska agricultural real estate when the cost of financing new purchases increases the value of agricultural property tends to act inversely.
Nebraska Farm Real Estate Market Developments 2016-2017 Page 6
Table 2. 2017 Values and Recent Trends by Area of the Statea
Agricultural Statistics District
2017 All Land Average Value
1-Year Change 3-Year Change 5-Year Change
Dollars/Acre -------------------------- Percent Change -------------------------- Northwest 755 -8 -12 19 North 1,170 -6 -4 34 Northeast 5,505 -8 -15 11 Central 3,385 -10 -19 15 East 6,395 -9 -12 5 Southwest 1,745 -11 -12 31 South 3,875 -9 -20 15 Southeast 4,880 -14 -21 14 Entire State 2,820 -9 -15 16
Source: a UNL Nebraska Farm Real Estate Market Surveys, 2012, 2014, 2016, and 2017.
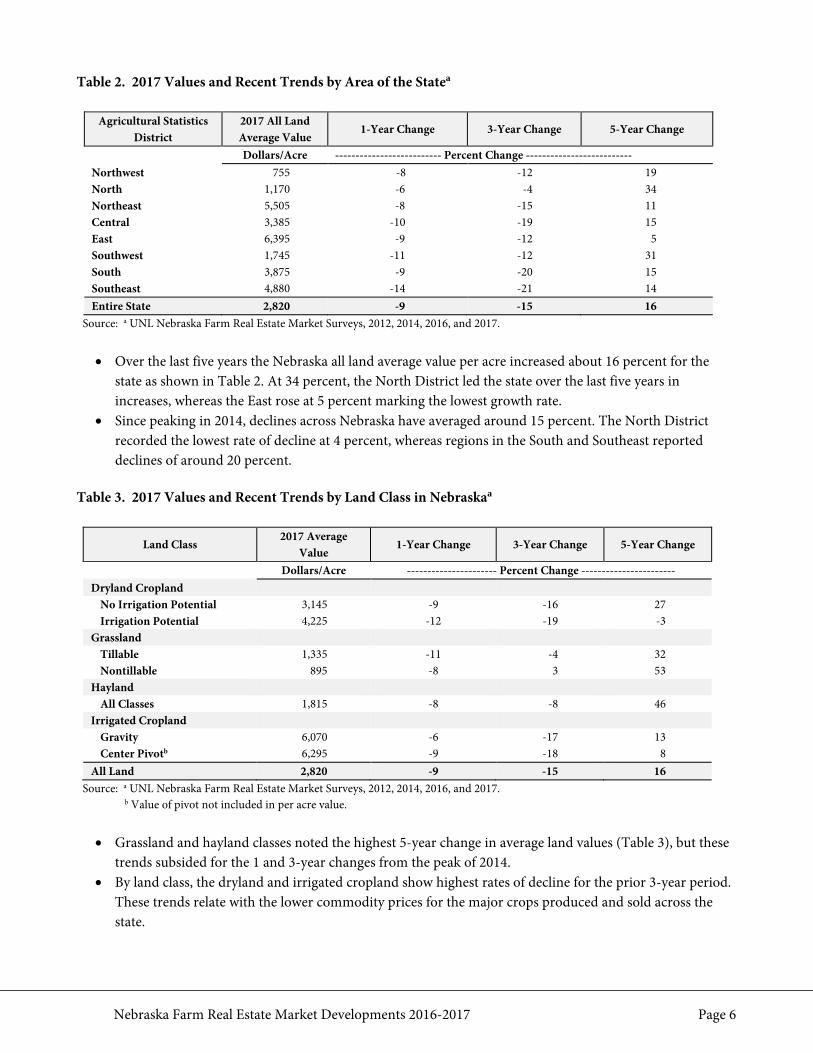
• Over the last five years the Nebraska all land average value per acre increased about 16 percent for the state as shown in Table 2. At 34 percent, the North District led the state over the last five years in increases, whereas the East rose at 5 percent marking the lowest growth rate.
• Since peaking in 2014, declines across Nebraska have averaged around 15 percent. The North District recorded the lowest rate of decline at 4 percent, whereas regions in the South and Southeast reported declines of around 20 percent.
Table 3. 2017 Values and Recent Trends by Land Class in Nebraskaa
Land Class 2017 Average
Value 1-Year Change 3-Year Change 5-Year Change
Dollars/Acre ---------------------- Percent Change ----------------------- Dryland Cropland
No Irrigation Potential 3,145 -9 -16 27 Irrigation Potential 4,225 -12 -19 -3
Grassland Tillable 1,335 -11 -4 32 Nontillable 895 -8 3 53
Hayland All Classes 1,815 -8 -8 46
Irrigated Cropland Gravity 6,070 -6 -17 13 Center Pivotb 6,295 -9 -18 8
All Land 2,820 -9 -15 16 Source: a UNL Nebraska Farm Real Estate Market Surveys, 2012, 2014, 2016, and 2017.
b Value of pivot not included in per acre value.
• Grassland and hayland classes noted the highest 5-year change in average land values (Table 3), but these trends subsided for the 1 and 3-year changes from the peak of 2014.
• By land class, the dryland and irrigated cropland show highest rates of decline for the prior 3-year period. These trends relate with the lower commodity prices for the major crops produced and sold across the state.
Nebraska Farm Real Estate Market Developments 2016-2017 Page 7
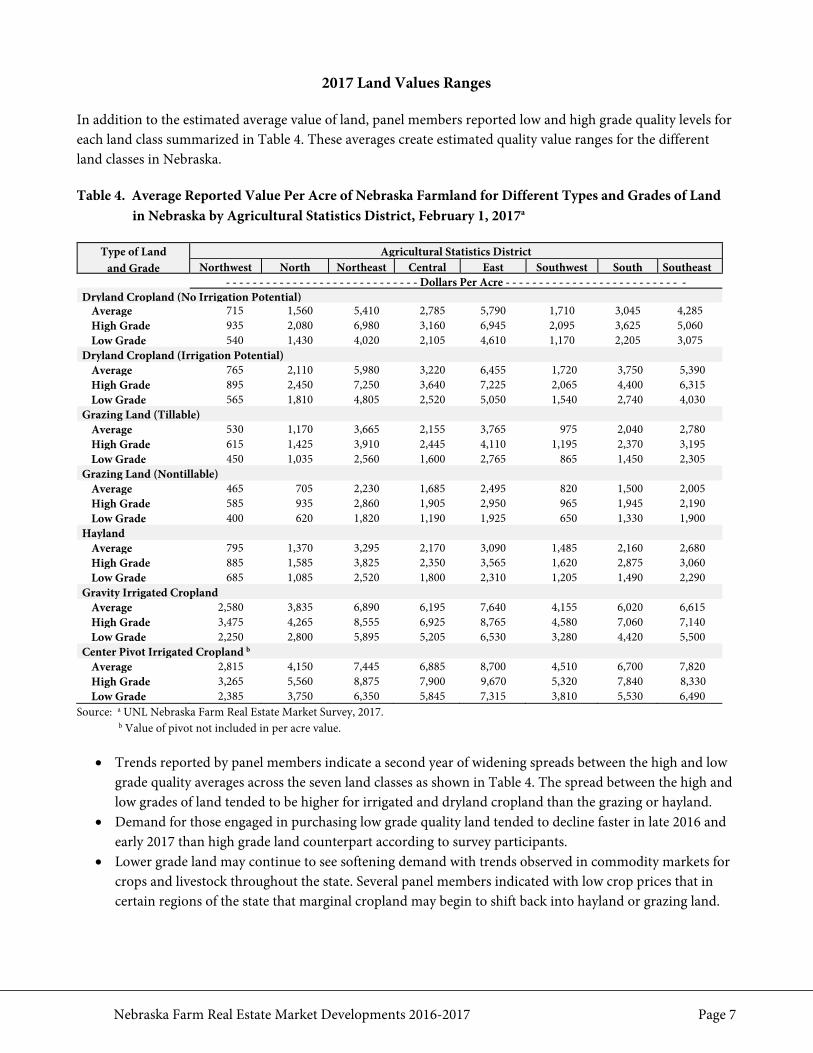
2017 Land Values Ranges In addition to the estimated average value of land, panel members reported low and high grade quality levels for each land class summarized in Table 4. These averages create estimated quality value ranges for the different land classes in Nebraska. Table 4. Average Reported Value Per Acre of Nebraska Farmland for Different Types and Grades of Land
in Nebraska by Agricultural Statistics District, February 1, 2017a
Source: a UNL Nebraska Farm Real Estate Market Survey, 2017. b Value of pivot not included in per acre value.
• Trends reported by panel members indicate a second year of widening spreads between the high and low
grade quality averages across the seven land classes as shown in Table 4. The spread between the high and low grades of land tended to be higher for irrigated and dryland cropland than the grazing or hayland.
• Demand for those engaged in purchasing low grade quality land tended to decline faster in late 2016 and early 2017 than high grade land counterpart according to survey participants.
• Lower grade land may continue to see softening demand with trends observed in commodity markets for crops and livestock throughout the state. Several panel members indicated with low crop prices that in certain regions of the state that marginal cropland may begin to shift back into hayland or grazing land.
Type of Land and Grade
Agricultural Statistics District Northwest North Northeast Central East Southwest South Southeast
- - - - - - - - - - - - - - - - - - - - - - - - - - - - - Dollars Per Acre - - - - - - - - - - - - - - - - - - - - - - - - - - - Dryland Cropland (No Irrigation Potential)
Average 715 1,560 5,410 2,785 5,790 1,710 3,045 4,285 High Grade 935 2,080 6,980 3,160 6,945 2,095 3,625 5,060 Low Grade 540 1,430 4,020 2,105 4,610 1,170 2,205 3,075
Dryland Cropland (Irrigation Potential) Average 765 2,110 5,980 3,220 6,455 1,720 3,750 5,390 High Grade 895 2,450 7,250 3,640 7,225 2,065 4,400 6,315 Low Grade 565 1,810 4,805 2,520 5,050 1,540 2,740 4,030
Grazing Land (Tillable) Average 530 1,170 3,665 2,155 3,765 975 2,040 2,780 High Grade 615 1,425 3,910 2,445 4,110 1,195 2,370 3,195 Low Grade 450 1,035 2,560 1,600 2,765 865 1,450 2,305
Grazing Land (Nontillable) Average 465 705 2,230 1,685 2,495 820 1,500 2,005 High Grade 585 935 2,860 1,905 2,950 965 1,945 2,190 Low Grade 400 620 1,820 1,190 1,925 650 1,330 1,900
Hayland Average 795 1,370 3,295 2,170 3,090 1,485 2,160 2,680 High Grade 885 1,585 3,825 2,350 3,565 1,620 2,875 3,060 Low Grade 685 1,085 2,520 1,800 2,310 1,205 1,490 2,290
Gravity Irrigated Cropland Average 2,580 3,835 6,890 6,195 7,640 4,155 6,020 6,615 High Grade 3,475 4,265 8,555 6,925 8,765 4,580 7,060 7,140 Low Grade 2,250 2,800 5,895 5,205 6,530 3,280 4,420 5,500
Center Pivot Irrigated Cropland b Average 2,815 4,150 7,445 6,885 8,700 4,510 6,700 7,820 High Grade 3,265 5,560 8,875 7,900 9,670 5,320 7,840 8,330 Low Grade 2,385 3,750 6,350 5,845 7,315 3,810 5,530 6,490
Nebraska Farm Real Estate Market Developments 2016-2017 Page 8
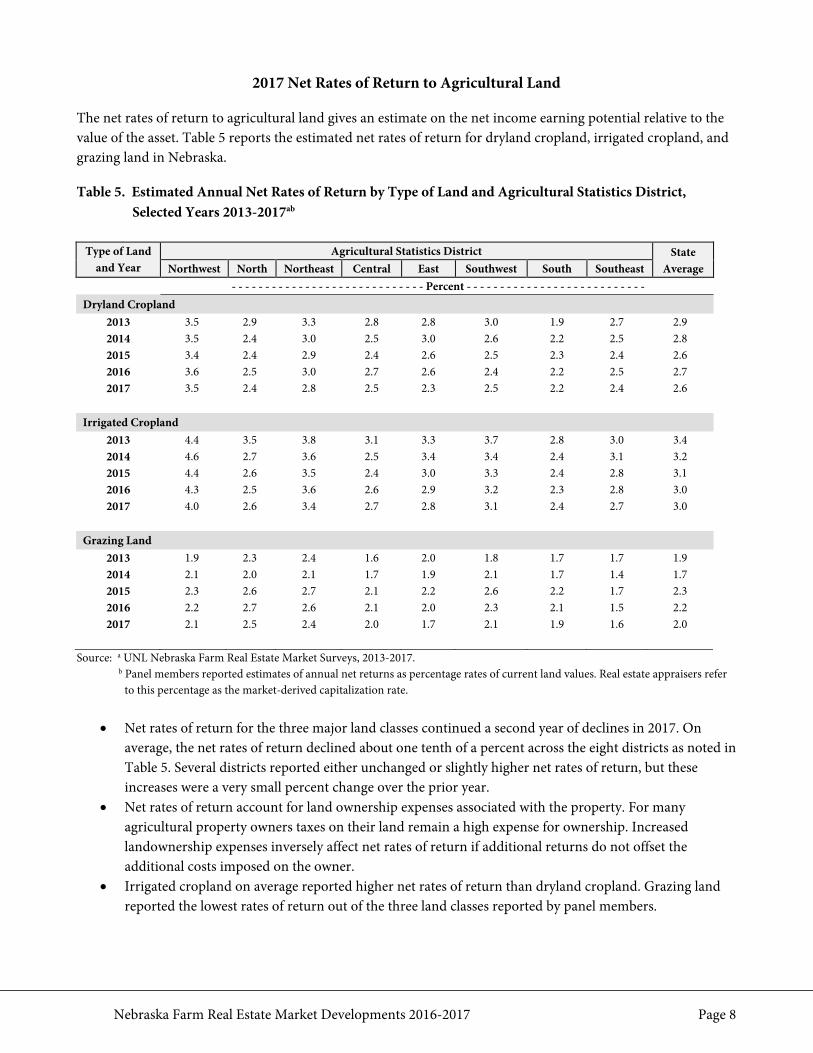
2017 Net Rates of Return to Agricultural Land
The net rates of return to agricultural land gives an estimate on the net income earning potential relative to the value of the asset. Table 5 reports the estimated net rates of return for dryland cropland, irrigated cropland, and grazing land in Nebraska.
Table 5. Estimated Annual Net Rates of Return by Type of Land and Agricultural Statistics District, Selected Years 2013-2017ab
Type of Land
and Year Agricultural Statistics District State
Average Northwest North Northeast Central East Southwest South Southeast - - - - - - - - - - - - - - - - - - - - - - - - - - - - - Percent - - - - - - - - - - - - - - - - - - - - - - - - - - - Dryland Cropland
2013 3.5 2.9 3.3 2.8 2.8 3.0 1.9 2.7 2.9 2014 3.5 2.4 3.0 2.5 3.0 2.6 2.2 2.5 2.8 2015 3.4 2.4 2.9 2.4 2.6 2.5 2.3 2.4 2.6 2016 3.6 2.5 3.0 2.7 2.6 2.4 2.2 2.5 2.7 2017 3.5 2.4 2.8 2.5 2.3 2.5 2.2 2.4 2.6
Irrigated Cropland
2013 4.4 3.5 3.8 3.1 3.3 3.7 2.8 3.0 3.4 2014 4.6 2.7 3.6 2.5 3.4 3.4 2.4 3.1 3.2 2015 4.4 2.6 3.5 2.4 3.0 3.3 2.4 2.8 3.1 2016 4.3 2.5 3.6 2.6 2.9 3.2 2.3 2.8 3.0 2017 4.0 2.6 3.4 2.7 2.8 3.1 2.4 2.7 3.0
Grazing Land
2013 1.9 2.3 2.4 1.6 2.0 1.8 1.7 1.7 1.9 2014 2.1 2.0 2.1 1.7 1.9 2.1 1.7 1.4 1.7 2015 2.3 2.6 2.7 2.1 2.2 2.6 2.2 1.7 2.3 2016 2.2 2.7 2.6 2.1 2.0 2.3 2.1 1.5 2.2 2017 2.1 2.5 2.4 2.0 1.7 2.1 1.9 1.6 2.0
Source: a UNL Nebraska Farm Real Estate Market Surveys, 2013-2017.
b Panel members reported estimates of annual net returns as percentage rates of current land values. Real estate appraisers refer to this percentage as the market-derived capitalization rate.
• Net rates of return for the three major land classes continued a second year of declines in 2017. On
average, the net rates of return declined about one tenth of a percent across the eight districts as noted in Table 5. Several districts reported either unchanged or slightly higher net rates of return, but these increases were a very small percent change over the prior year.
• Net rates of return account for land ownership expenses associated with the property. For many agricultural property owners taxes on their land remain a high expense for ownership. Increased landownership expenses inversely affect net rates of return if additional returns do not offset the additional costs imposed on the owner.
• Irrigated cropland on average reported higher net rates of return than dryland cropland. Grazing land reported the lowest rates of return out of the three land classes reported by panel members.
Nebraska Farm Real Estate Market Developments 2016-2017 Page 9
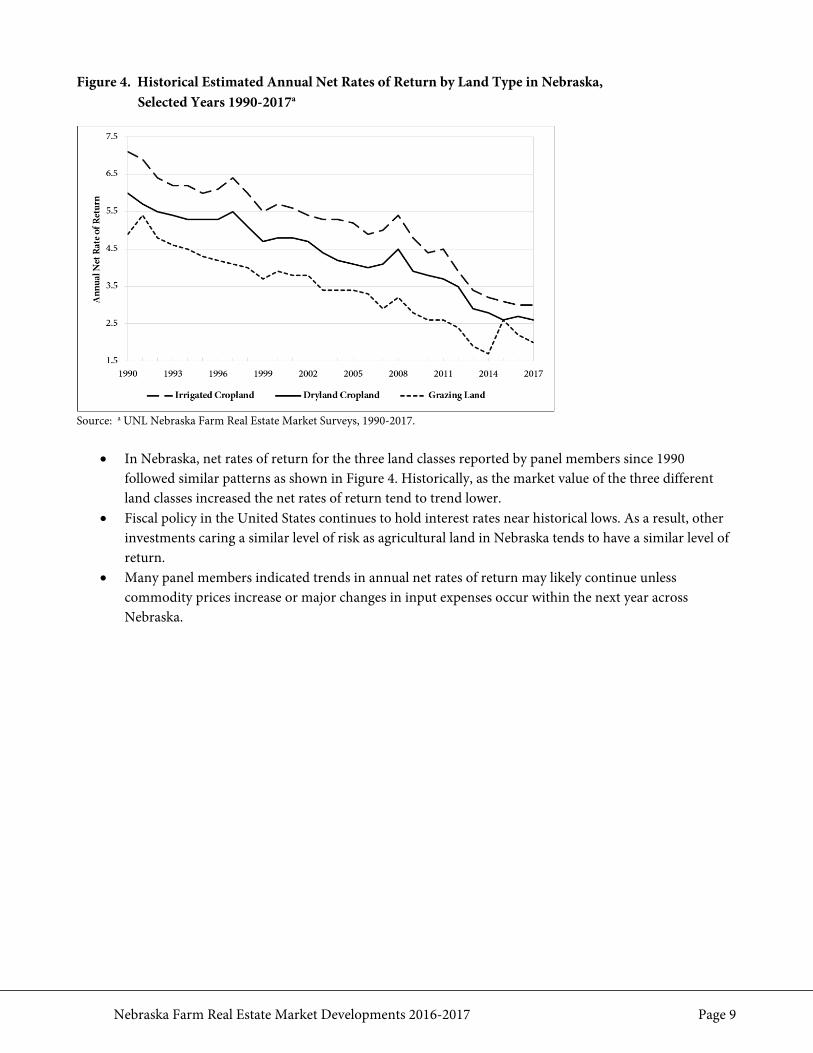
Figure 4. Historical Estimated Annual Net Rates of Return by Land Type in Nebraska, Selected Years 1990-2017a
Source: a UNL Nebraska Farm Real Estate Market Surveys, 1990-2017.
• In Nebraska, net rates of return for the three land classes reported by panel members since 1990 followed similar patterns as shown in Figure 4. Historically, as the market value of the three different land classes increased the net rates of return tend to trend lower.
• Fiscal policy in the United States continues to hold interest rates near historical lows. As a result, other investments caring a similar level of risk as agricultural land in Nebraska tends to have a similar level of return.
• Many panel members indicated trends in annual net rates of return may likely continue unless commodity prices increase or major changes in input expenses occur within the next year across Nebraska.
Nebraska Farm Real Estate Market Developments 2016-2017 Page 10
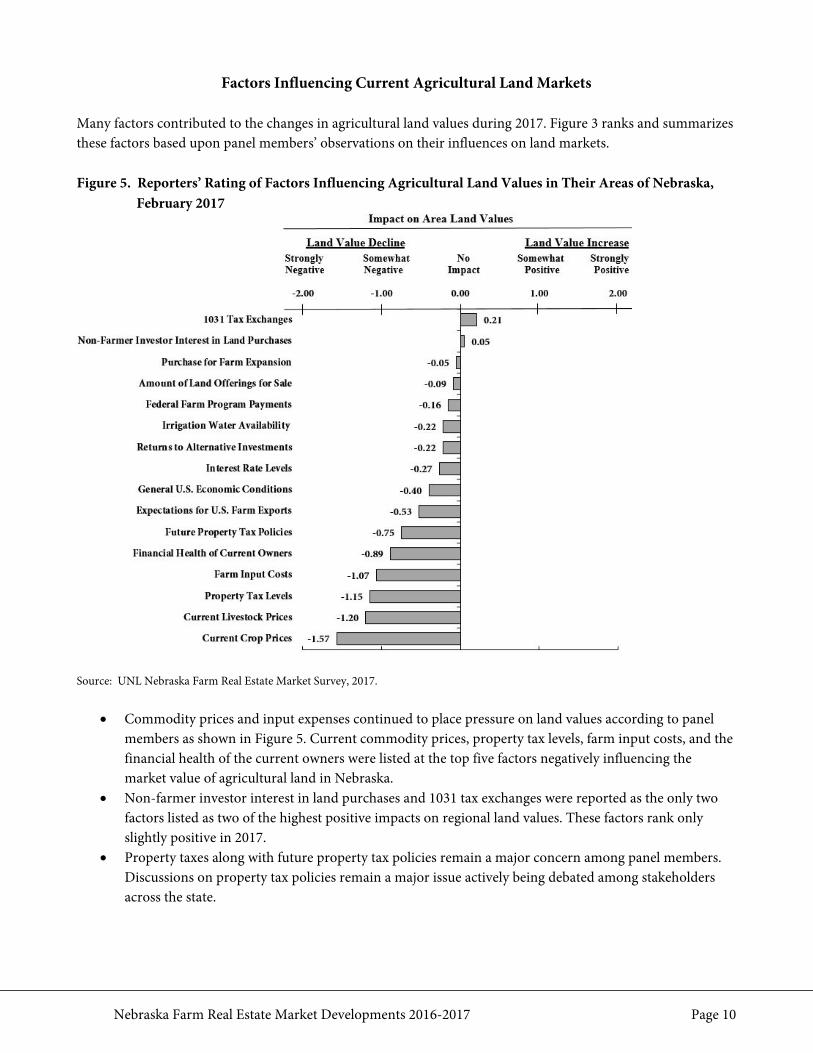
Factors Influencing Current Agricultural Land Markets Many factors contributed to the changes in agricultural land values during 2017. Figure 3 ranks and summarizes these factors based upon panel members’ observations on their influences on land markets. Figure 5. Reporters’ Rating of Factors Influencing Agricultural Land Values in Their Areas of Nebraska,
February 2017
Source: UNL Nebraska Farm Real Estate Market Survey, 2017.
• Commodity prices and input expenses continued to place pressure on land values according to panel members as shown in Figure 5. Current commodity prices, property tax levels, farm input costs, and the financial health of the current owners were listed at the top five factors negatively influencing the market value of agricultural land in Nebraska.
• Non-farmer investor interest in land purchases and 1031 tax exchanges were reported as the only two factors listed as two of the highest positive impacts on regional land values. These factors rank only slightly positive in 2017.
• Property taxes along with future property tax policies remain a major concern among panel members. Discussions on property tax policies remain a major issue actively being debated among stakeholders across the state.
Nebraska Farm Real Estate Market Developments 2016-2017 Page 11
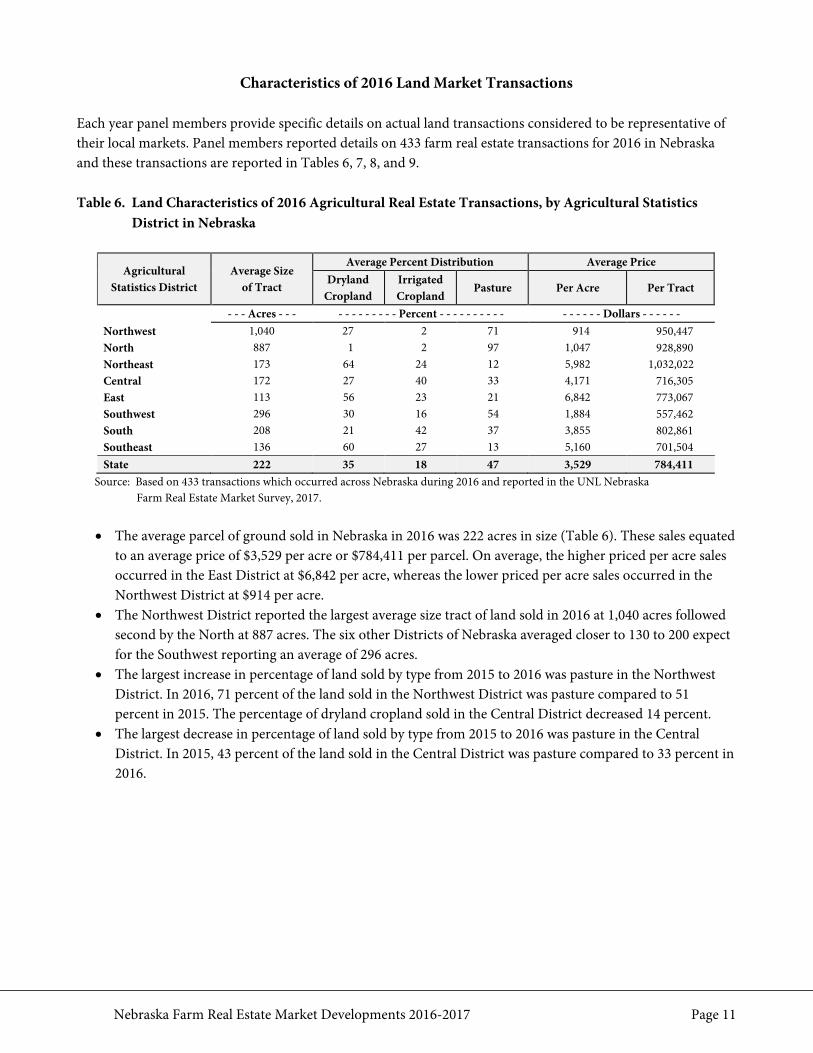
Characteristics of 2016 Land Market Transactions Each year panel members provide specific details on actual land transactions considered to be representative of their local markets. Panel members reported details on 433 farm real estate transactions for 2016 in Nebraska and these transactions are reported in Tables 6, 7, 8, and 9. Table 6. Land Characteristics of 2016 Agricultural Real Estate Transactions, by Agricultural Statistics
District in Nebraska
Source: Based on 433 transactions which occurred across Nebraska during 2016 and reported in the UNL Nebraska Farm Real Estate Market Survey, 2017.
• The average parcel of ground sold in Nebraska in 2016 was 222 acres in size (Table 6). These sales equated
to an average price of $3,529 per acre or $784,411 per parcel. On average, the higher priced per acre sales occurred in the East District at $6,842 per acre, whereas the lower priced per acre sales occurred in the Northwest District at $914 per acre.
• The Northwest District reported the largest average size tract of land sold in 2016 at 1,040 acres followed second by the North at 887 acres. The six other Districts of Nebraska averaged closer to 130 to 200 expect for the Southwest reporting an average of 296 acres.
• The largest increase in percentage of land sold by type from 2015 to 2016 was pasture in the Northwest District. In 2016, 71 percent of the land sold in the Northwest District was pasture compared to 51 percent in 2015. The percentage of dryland cropland sold in the Central District decreased 14 percent.
• The largest decrease in percentage of land sold by type from 2015 to 2016 was pasture in the Central District. In 2015, 43 percent of the land sold in the Central District was pasture compared to 33 percent in 2016.
Agricultural Statistics District
Average Size of Tract
Average Percent Distribution Average Price Dryland
Cropland Irrigated Cropland
Pasture Per Acre Per Tract
- - - Acres - - - - - - - - - - - - Percent - - - - - - - - - - - - - - - - Dollars - - - - - - Northwest 1,040 27 2 71 914 950,447 North 887 1 2 97 1,047 928,890 Northeast 173 64 24 12 5,982 1,032,022 Central 172 27 40 33 4,171 716,305 East 113 56 23 21 6,842 773,067 Southwest 296 30 16 54 1,884 557,462 South 208 21 42 37 3,855 802,861 Southeast 136 60 27 13 5,160 701,504 State 222 35 18 47 3,529 784,411
Nebraska Farm Real Estate Market Developments 2016-2017 Page 12
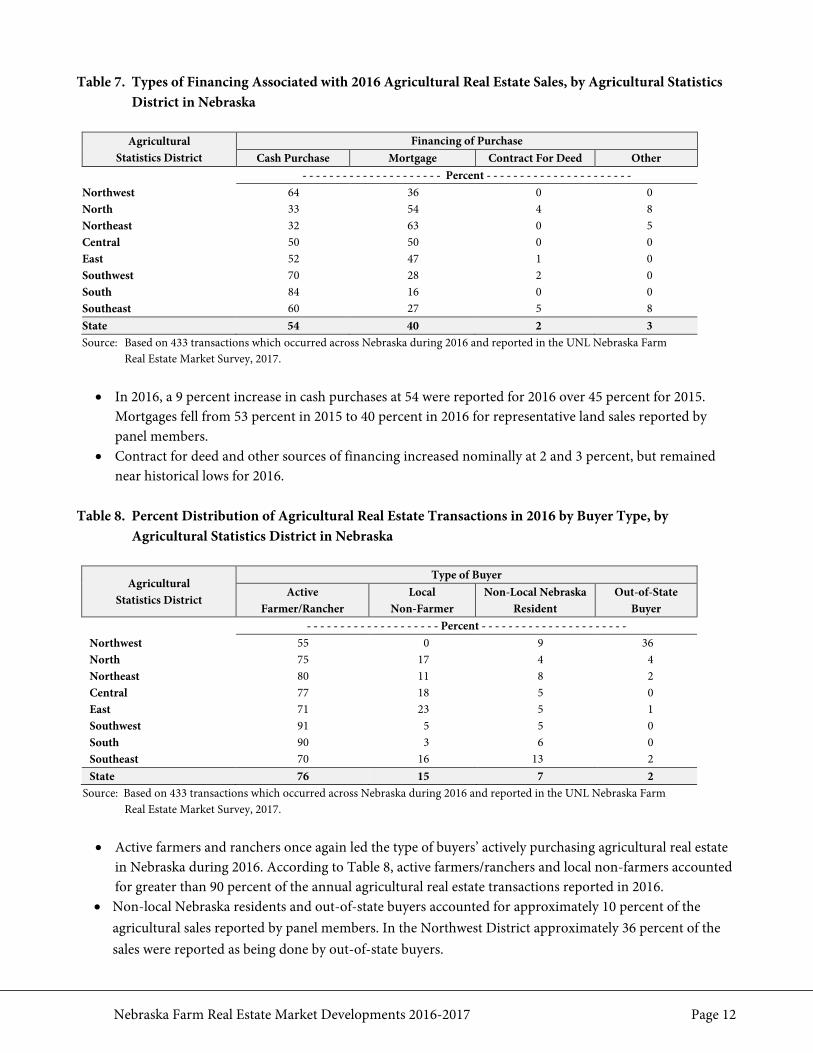
Table 7. Types of Financing Associated with 2016 Agricultural Real Estate Sales, by Agricultural Statistics District in Nebraska
Agricultural
Statistics District Financing of Purchase
Cash Purchase Mortgage Contract For Deed Other - - - - - - - - - - - - - - - - - - - - - Percent - - - - - - - - - - - - - - - - - - - - - - Northwest 64 36 0 0 North 33 54 4 8 Northeast 32 63 0 5 Central 50 50 0 0 East 52 47 1 0 Southwest 70 28 2 0 South 84 16 0 0 Southeast 60 27 5 8 State 54 40 2 3
Source: Based on 433 transactions which occurred across Nebraska during 2016 and reported in the UNL Nebraska Farm Real Estate Market Survey, 2017.
• In 2016, a 9 percent increase in cash purchases at 54 were reported for 2016 over 45 percent for 2015.
Mortgages fell from 53 percent in 2015 to 40 percent in 2016 for representative land sales reported by panel members.
• Contract for deed and other sources of financing increased nominally at 2 and 3 percent, but remained near historical lows for 2016.
Table 8. Percent Distribution of Agricultural Real Estate Transactions in 2016 by Buyer Type, by Agricultural Statistics District in Nebraska
Agricultural Statistics District
Type of Buyer Active
Farmer/Rancher Local
Non-Farmer Non-Local Nebraska
Resident Out-of-State
Buyer - - - - - - - - - - - - - - - - - - - - Percent - - - - - - - - - - - - - - - - - - - - - - Northwest 55 0 9 36 North 75 17 4 4 Northeast 80 11 8 2 Central 77 18 5 0 East 71 23 5 1 Southwest 91 5 5 0 South 90 3 6 0 Southeast 70 16 13 2 State 76 15 7 2
Source: Based on 433 transactions which occurred across Nebraska during 2016 and reported in the UNL Nebraska Farm Real Estate Market Survey, 2017.
• Active farmers and ranchers once again led the type of buyers’ actively purchasing agricultural real estate
in Nebraska during 2016. According to Table 8, active farmers/ranchers and local non-farmers accounted for greater than 90 percent of the annual agricultural real estate transactions reported in 2016.
• Non-local Nebraska residents and out-of-state buyers accounted for approximately 10 percent of the agricultural sales reported by panel members. In the Northwest District approximately 36 percent of the sales were reported as being done by out-of-state buyers.
Nebraska Farm Real Estate Market Developments 2016-2017 Page 13
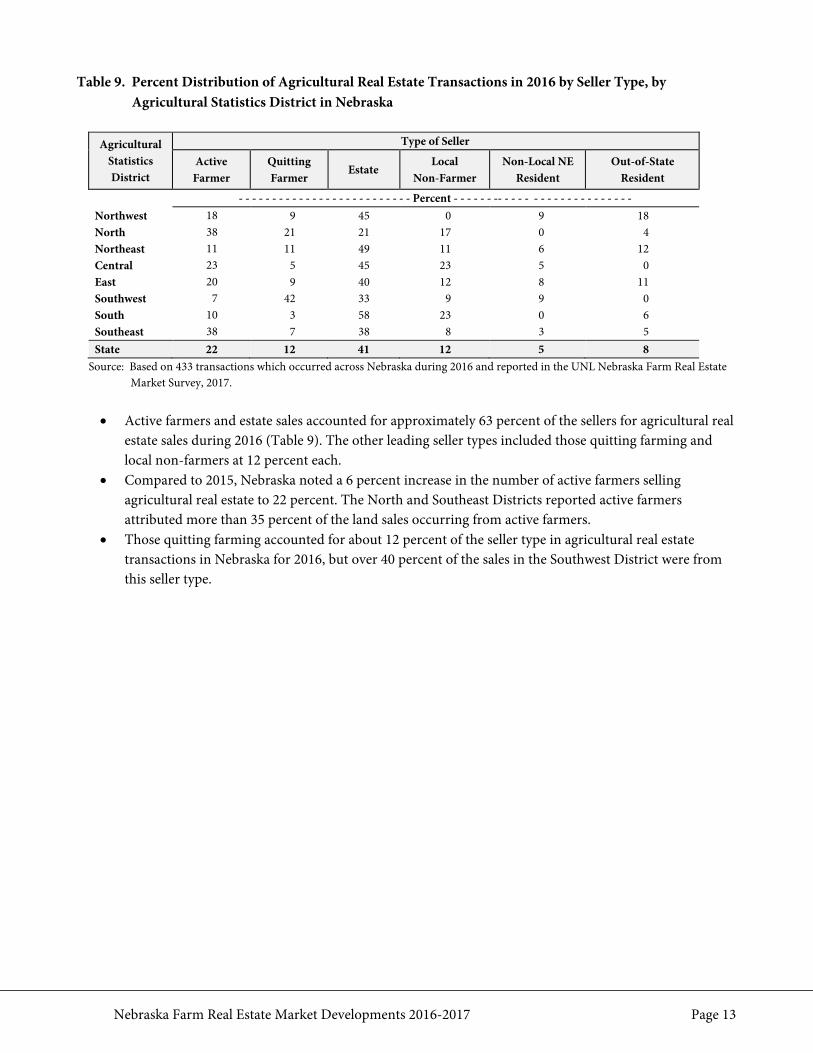
Table 9. Percent Distribution of Agricultural Real Estate Transactions in 2016 by Seller Type, by Agricultural Statistics District in Nebraska
Agricultural
Statistics District
Type of Seller
Active Farmer
Quitting Farmer
Estate Local
Non-Farmer Non-Local NE
Resident Out-of-State
Resident
- - - - - - - - - - - - - - - - - - - - - - - - - - Percent - - - - - - -- - - - - - - - - - - - - - - - - - - - Northwest 18 9 45 0 9 18 North 38 21 21 17 0 4 Northeast 11 11 49 11 6 12 Central 23 5 45 23 5 0 East 20 9 40 12 8 11 Southwest 7 42 33 9 9 0 South 10 3 58 23 0 6 Southeast 38 7 38 8 3 5 State 22 12 41 12 5 8
Source: Based on 433 transactions which occurred across Nebraska during 2016 and reported in the UNL Nebraska Farm Real Estate Market Survey, 2017.
• Active farmers and estate sales accounted for approximately 63 percent of the sellers for agricultural real
estate sales during 2016 (Table 9). The other leading seller types included those quitting farming and local non-farmers at 12 percent each.
• Compared to 2015, Nebraska noted a 6 percent increase in the number of active farmers selling agricultural real estate to 22 percent. The North and Southeast Districts reported active farmers attributed more than 35 percent of the land sales occurring from active farmers.
• Those quitting farming accounted for about 12 percent of the seller type in agricultural real estate transactions in Nebraska for 2016, but over 40 percent of the sales in the Southwest District were from this seller type.
Nebraska Farm Real Estate Market Developments 2016-2017 Page 14
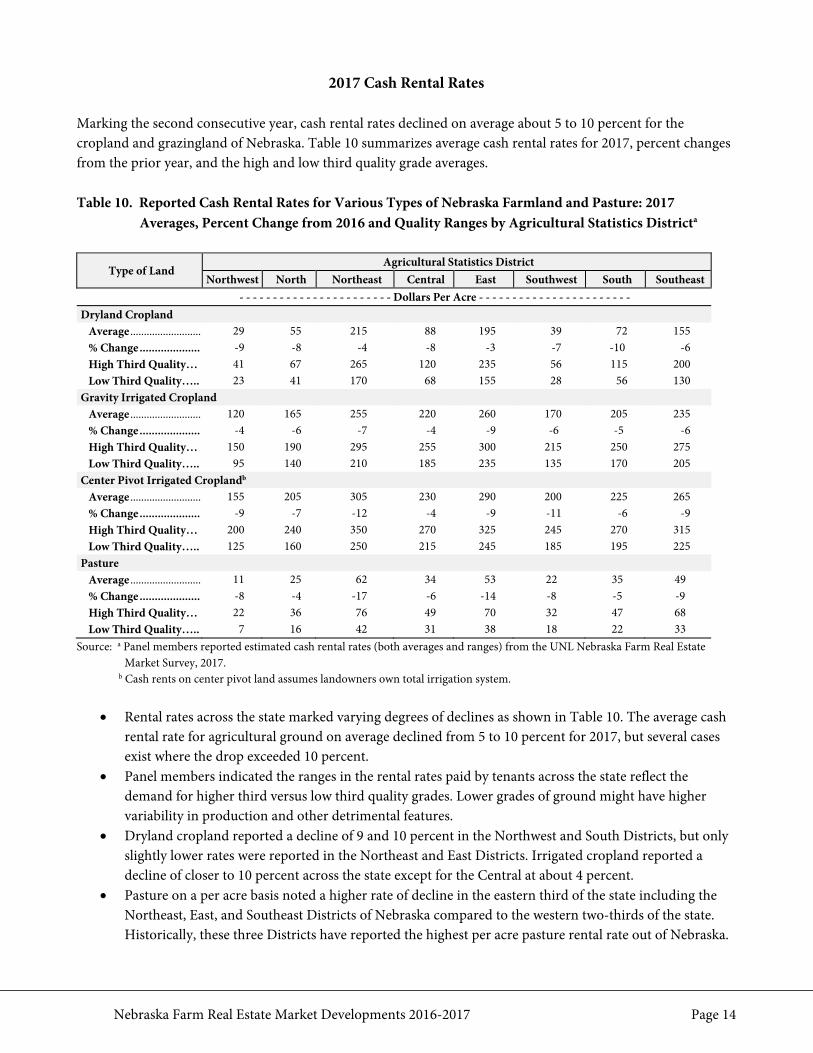
2017 Cash Rental Rates Marking the second consecutive year, cash rental rates declined on average about 5 to 10 percent for the cropland and grazingland of Nebraska. Table 10 summarizes average cash rental rates for 2017, percent changes from the prior year, and the high and low third quality grade averages. Table 10. Reported Cash Rental Rates for Various Types of Nebraska Farmland and Pasture: 2017
Averages, Percent Change from 2016 and Quality Ranges by Agricultural Statistics Districta
Type of Land Agricultural Statistics District
Northwest North Northeast Central East Southwest South Southeast - - - - - - - - - - - - - - - - - - - - - - - Dollars Per Acre - - - - - - - - - - - - - - - - - - - - - - -
Dryland Cropland Average .......................... 29 55 215 88 195 39 72 155 % Change .................... -9 -8 -4 -8 -3 -7 -10 -6 High Third Quality… 41 67 265 120 235 56 115 200 Low Third Quality….. 23 41 170 68 155 28 56 130 Gravity Irrigated Cropland Average .......................... 120 165 255 220 260 170 205 235 % Change .................... -4 -6 -7 -4 -9 -6 -5 -6 High Third Quality… 150 190 295 255 300 215 250 275 Low Third Quality….. 95 140 210 185 235 135 170 205 Center Pivot Irrigated Croplandb Average .......................... 155 205 305 230 290 200 225 265 % Change .................... -9 -7 -12 -4 -9 -11 -6 -9 High Third Quality… 200 240 350 270 325 245 270 315 Low Third Quality….. 125 160 250 215 245 185 195 225 Pasture Average .......................... 11 25 62 34 53 22 35 49 % Change .................... -8 -4 -17 -6 -14 -8 -5 -9 High Third Quality… 22 36 76 49 70 32 47 68 Low Third Quality….. 7 16 42 31 38 18 22 33
Source: a Panel members reported estimated cash rental rates (both averages and ranges) from the UNL Nebraska Farm Real Estate Market Survey, 2017.
b Cash rents on center pivot land assumes landowners own total irrigation system.
• Rental rates across the state marked varying degrees of declines as shown in Table 10. The average cash rental rate for agricultural ground on average declined from 5 to 10 percent for 2017, but several cases exist where the drop exceeded 10 percent.
• Panel members indicated the ranges in the rental rates paid by tenants across the state reflect the demand for higher third versus low third quality grades. Lower grades of ground might have higher variability in production and other detrimental features.
• Dryland cropland reported a decline of 9 and 10 percent in the Northwest and South Districts, but only slightly lower rates were reported in the Northeast and East Districts. Irrigated cropland reported a decline of closer to 10 percent across the state except for the Central at about 4 percent.
• Pasture on a per acre basis noted a higher rate of decline in the eastern third of the state including the Northeast, East, and Southeast Districts of Nebraska compared to the western two-thirds of the state. Historically, these three Districts have reported the highest per acre pasture rental rate out of Nebraska.
Nebraska Farm Real Estate Market Developments 2016-2017 Page 15
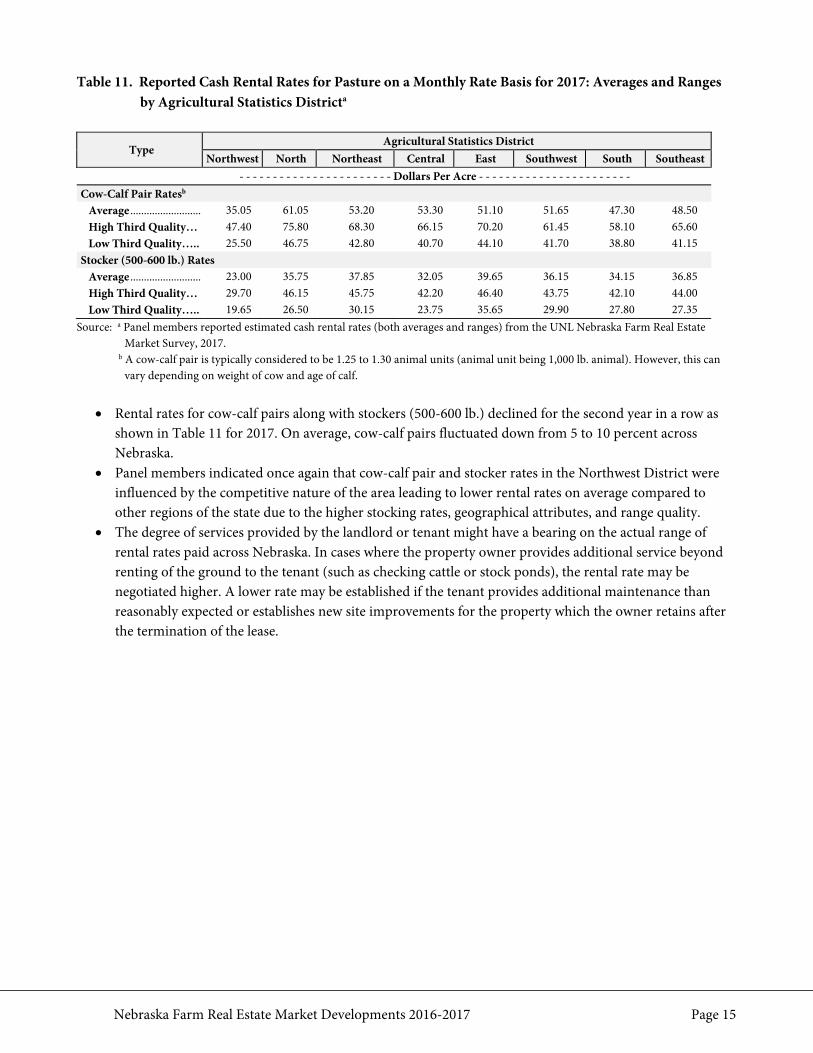
Table 11. Reported Cash Rental Rates for Pasture on a Monthly Rate Basis for 2017: Averages and Ranges by Agricultural Statistics Districta
Type Agricultural Statistics District
Northwest North Northeast Central East Southwest South Southeast - - - - - - - - - - - - - - - - - - - - - - - Dollars Per Acre - - - - - - - - - - - - - - - - - - - - - - -
Cow-Calf Pair Ratesb Average .......................... 35.05 61.05 53.20 53.30 51.10 51.65 47.30 48.50 High Third Quality… 47.40 75.80 68.30 66.15 70.20 61.45 58.10 65.60 Low Third Quality….. 25.50 46.75 42.80 40.70 44.10 41.70 38.80 41.15 Stocker (500-600 lb.) Rates Average .......................... 23.00 35.75 37.85 32.05 39.65 36.15 34.15 36.85 High Third Quality… 29.70 46.15 45.75 42.20 46.40 43.75 42.10 44.00 Low Third Quality….. 19.65 26.50 30.15 23.75 35.65 29.90 27.80 27.35
Source: a Panel members reported estimated cash rental rates (both averages and ranges) from the UNL Nebraska Farm Real Estate Market Survey, 2017.
b A cow-calf pair is typically considered to be 1.25 to 1.30 animal units (animal unit being 1,000 lb. animal). However, this can vary depending on weight of cow and age of calf.
• Rental rates for cow-calf pairs along with stockers (500-600 lb.) declined for the second year in a row as
shown in Table 11 for 2017. On average, cow-calf pairs fluctuated down from 5 to 10 percent across Nebraska.
• Panel members indicated once again that cow-calf pair and stocker rates in the Northwest District were influenced by the competitive nature of the area leading to lower rental rates on average compared to other regions of the state due to the higher stocking rates, geographical attributes, and range quality.
• The degree of services provided by the landlord or tenant might have a bearing on the actual range of rental rates paid across Nebraska. In cases where the property owner provides additional service beyond renting of the ground to the tenant (such as checking cattle or stock ponds), the rental rate may be negotiated higher. A lower rate may be established if the tenant provides additional maintenance than reasonably expected or establishes new site improvements for the property which the owner retains after the termination of the lease.
Nebraska Farm Real Estate Market Developments 2016-2017 Page 16
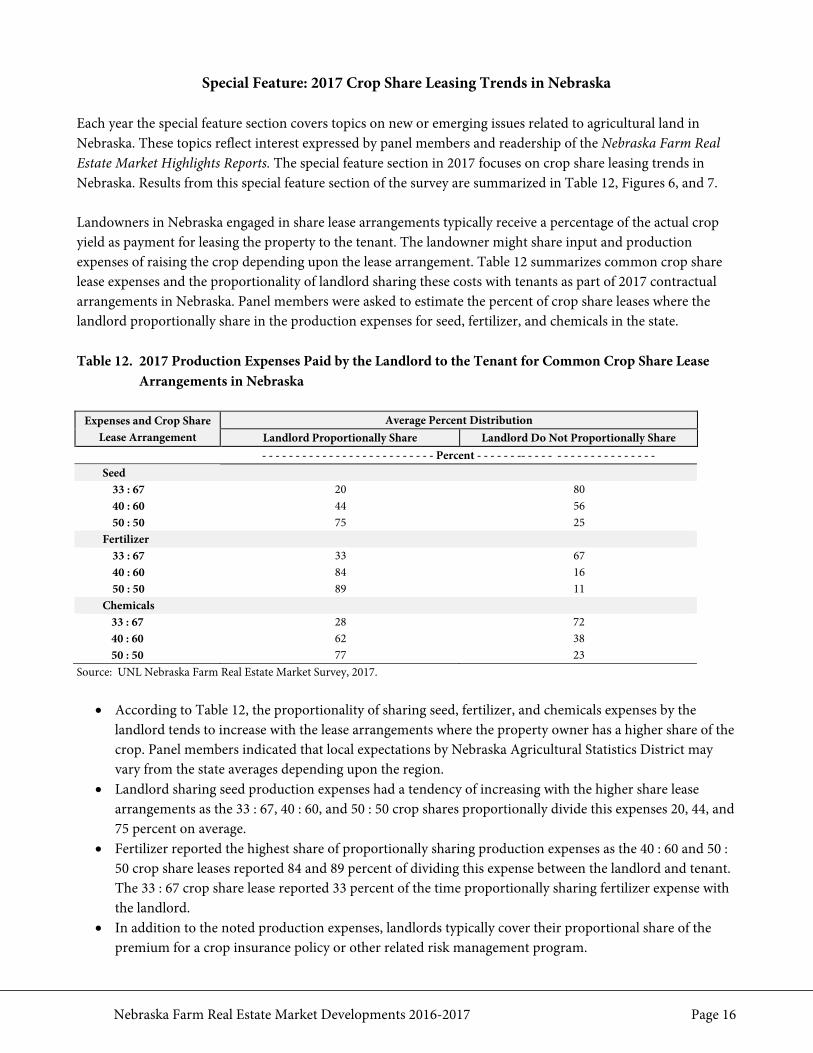
Special Feature: 2017 Crop Share Leasing Trends in Nebraska Each year the special feature section covers topics on new or emerging issues related to agricultural land in Nebraska. These topics reflect interest expressed by panel members and readership of the Nebraska Farm Real Estate Market Highlights Reports. The special feature section in 2017 focuses on crop share leasing trends in Nebraska. Results from this special feature section of the survey are summarized in Table 12, Figures 6, and 7. Landowners in Nebraska engaged in share lease arrangements typically receive a percentage of the actual crop yield as payment for leasing the property to the tenant. The landowner might share input and production expenses of raising the crop depending upon the lease arrangement. Table 12 summarizes common crop share lease expenses and the proportionality of landlord sharing these costs with tenants as part of 2017 contractual arrangements in Nebraska. Panel members were asked to estimate the percent of crop share leases where the landlord proportionally share in the production expenses for seed, fertilizer, and chemicals in the state. Table 12. 2017 Production Expenses Paid by the Landlord to the Tenant for Common Crop Share Lease
Arrangements in Nebraska
Expenses and Crop Share Lease Arrangement
Average Percent Distribution Landlord Proportionally Share Landlord Do Not Proportionally Share
- - - - - - - - - - - - - - - - - - - - - - - - - - Percent - - - - - - -- - - - - - - - - - - - - - - - - - - - Seed
33 : 67 20 80 40 : 60 44 56 50 : 50 75 25
Fertilizer 33 : 67 33 67 40 : 60 84 16 50 : 50 89 11
Chemicals 33 : 67 28 72 40 : 60 62 38 50 : 50 77 23
Source: UNL Nebraska Farm Real Estate Market Survey, 2017.
• According to Table 12, the proportionality of sharing seed, fertilizer, and chemicals expenses by the landlord tends to increase with the lease arrangements where the property owner has a higher share of the crop. Panel members indicated that local expectations by Nebraska Agricultural Statistics District may vary from the state averages depending upon the region.
• Landlord sharing seed production expenses had a tendency of increasing with the higher share lease arrangements as the 33 : 67, 40 : 60, and 50 : 50 crop shares proportionally divide this expenses 20, 44, and 75 percent on average.
• Fertilizer reported the highest share of proportionally sharing production expenses as the 40 : 60 and 50 : 50 crop share leases reported 84 and 89 percent of dividing this expense between the landlord and tenant. The 33 : 67 crop share lease reported 33 percent of the time proportionally sharing fertilizer expense with the landlord.
• In addition to the noted production expenses, landlords typically cover their proportional share of the premium for a crop insurance policy or other related risk management program.
Nebraska Farm Real Estate Market Developments 2016-2017 Page 17
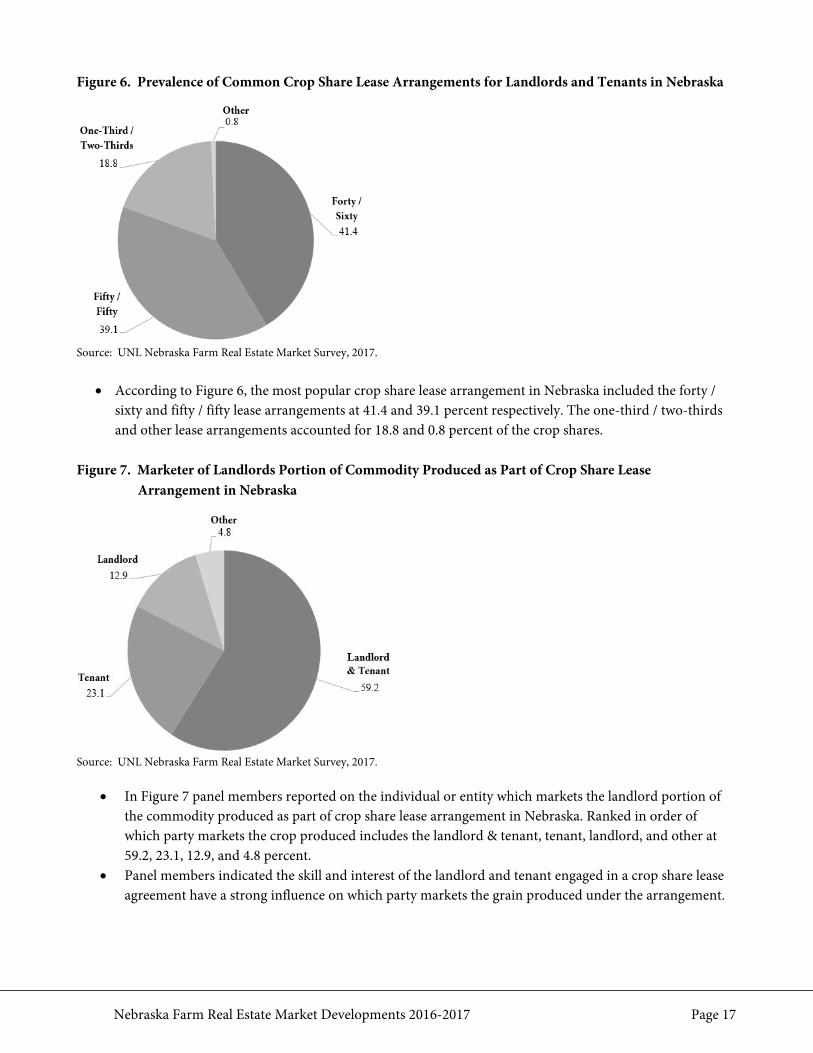
Figure 6. Prevalence of Common Crop Share Lease Arrangements for Landlords and Tenants in Nebraska
Source: UNL Nebraska Farm Real Estate Market Survey, 2017.
• According to Figure 6, the most popular crop share lease arrangement in Nebraska included the forty / sixty and fifty / fifty lease arrangements at 41.4 and 39.1 percent respectively. The one-third / two-thirds and other lease arrangements accounted for 18.8 and 0.8 percent of the crop shares.
Figure 7. Marketer of Landlords Portion of Commodity Produced as Part of Crop Share Lease
Arrangement in Nebraska
Source: UNL Nebraska Farm Real Estate Market Survey, 2017.
• In Figure 7 panel members reported on the individual or entity which markets the landlord portion of the commodity produced as part of crop share lease arrangement in Nebraska. Ranked in order of which party markets the crop produced includes the landlord & tenant, tenant, landlord, and other at 59.2, 23.1, 12.9, and 4.8 percent.
• Panel members indicated the skill and interest of the landlord and tenant engaged in a crop share lease agreement have a strong influence on which party markets the grain produced under the arrangement.
Nebraska Farm Real Estate Market Developments 2016-2017 Page 18
Statistical Appendix
Nebraska Farm Real Estate Market Developments 2016-2017 Page 19
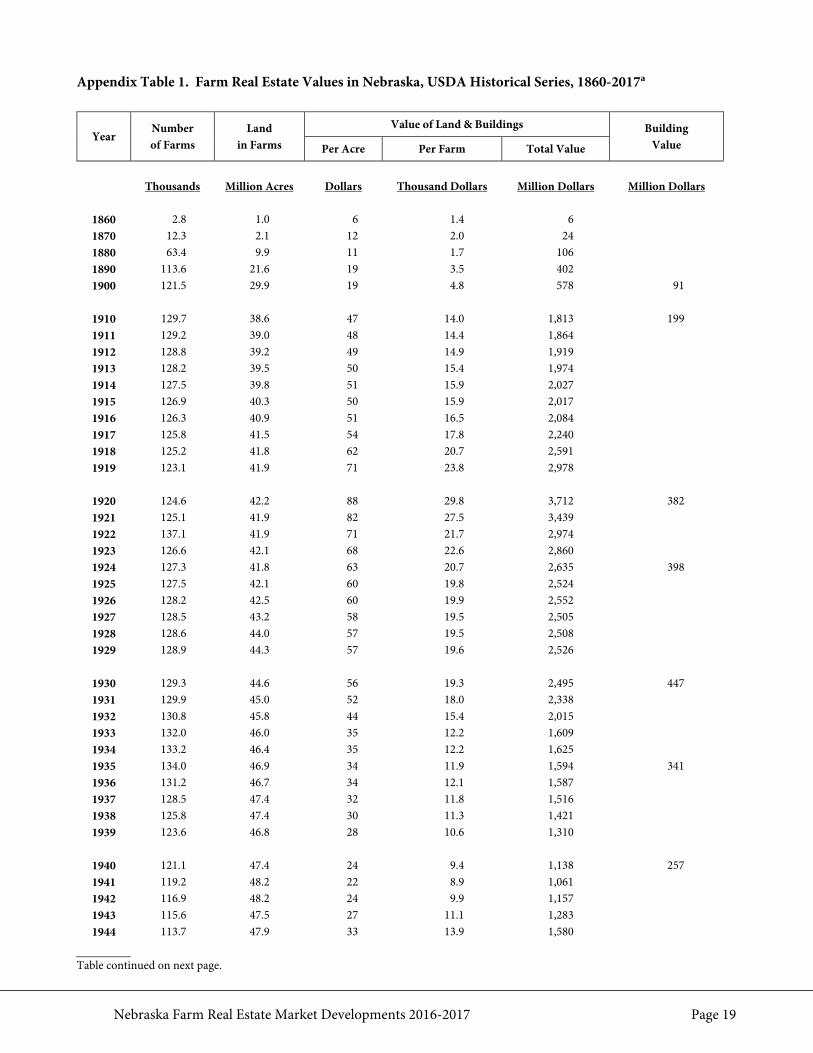
Appendix Table 1. Farm Real Estate Values in Nebraska, USDA Historical Series, 1860-2017a
Year Number of Farms
Land in Farms
Value of Land & Buildings Building Value Per Acre Per Farm Total Value
Thousands Million Acres Dollars Thousand Dollars Million Dollars Million Dollars
1860 2.8 1.0 6 1.4 6 1870 12.3 2.1 12 2.0 24 1880 63.4 9.9 11 1.7 106 1890 113.6 21.6 19 3.5 402 1900 121.5 29.9 19 4.8 578 91
1910 129.7 38.6 47 14.0 1,813 199 1911 129.2 39.0 48 14.4 1,864 1912 128.8 39.2 49 14.9 1,919 1913 128.2 39.5 50 15.4 1,974 1914 127.5 39.8 51 15.9 2,027 1915 126.9 40.3 50 15.9 2,017 1916 126.3 40.9 51 16.5 2,084 1917 125.8 41.5 54 17.8 2,240 1918 125.2 41.8 62 20.7 2,591 1919 123.1 41.9 71 23.8 2,978
1920 124.6 42.2 88 29.8 3,712 382 1921 125.1 41.9 82 27.5 3,439 1922 137.1 41.9 71 21.7 2,974 1923 126.6 42.1 68 22.6 2,860 1924 127.3 41.8 63 20.7 2,635 398 1925 127.5 42.1 60 19.8 2,524 1926 128.2 42.5 60 19.9 2,552 1927 128.5 43.2 58 19.5 2,505 1928 128.6 44.0 57 19.5 2,508 1929 128.9 44.3 57 19.6 2,526
1930 129.3 44.6 56 19.3 2,495 447 1931 129.9 45.0 52 18.0 2,338 1932 130.8 45.8 44 15.4 2,015 1933 132.0 46.0 35 12.2 1,609 1934 133.2 46.4 35 12.2 1,625 1935 134.0 46.9 34 11.9 1,594 341 1936 131.2 46.7 34 12.1 1,587 1937 128.5 47.4 32 11.8 1,516 1938 125.8 47.4 30 11.3 1,421 1939 123.6 46.8 28 10.6 1,310
1940 121.1 47.4 24 9.4 1,138 257 1941 119.2 48.2 22 8.9 1,061 1942 116.9 48.2 24 9.9 1,157 1943 115.6 47.5 27 11.1 1,283 1944 113.7 47.9 33 13.9 1,580
Table continued on next page.
Nebraska Farm Real Estate Market Developments 2016-2017 Page 20
Appendix Table 1. Farm Real Estate Values in Nebraska, USDA Historical Series, 1860-2017a (continued)
Year Number of Farms
Land in Farms
Value of Land & Buildings Building Value Per Acre Per Farm Total Value
Thousands Million Acres Dollars Thousand Dollars Million Dollars Million Dollars
1945 111.4 47.6 37 15.8 1,760 382 1946 111.3 47.4 42 17.9 1,992 1947 110.1 48.0 47 20.5 2,257 1947 109.0 47.3 56 24.3 2,649 1949 108.0 47.2 62 27.1 2,927
1950 109.0 48.4 58 25.6 2,789 1951 107.0 48.4 66 29.8 3,192 562 1952 105.0 48.3 72 33.1 3,477 605 1953 104.0 48.3 75 34.7 3,610 621 1954 103.0 48.3 70 32.8 3,386 589 1955 102.0 48.3 73 34.5 3,534 645 1956 101.0 48.3 73 34.9 3,523 719 1957 98.0 48.3 72 35.8 3,501 606 1958 96.0 48.3 79 40.0 3,839 572 1959 94.0 48.3 86 43.9 4,131 677
1960 93.0 48.2 89 46.3 4,308 763 1961 90.0 48.2 90 48.2 4,341 790 1962 88.0 48.2 95 52.2 4,598 860 1963 86.0 48.1 97 54.0 4,647 911 1964 84.0 48.2 105 60.0 5,055 1,072 1965 82.0 48.2 111 65.3 5,352 1,258 1966 80.0 48.2 120 72.6 5,805 1,283 1967 78.0 48.2 132 81.4 6,348 1,143 1968 76.0 48.2 143 90.5 6,882 1,136 1969 74.0 48.2 150 97.8 7,238 1,021
1970 73.0 48.1 154 101.5 7,407 941 1971 72.0 48.1 157 104.9 7,552 853 1972 71.0 48.1 170 115.2 8,177 932 1973 70.0 48.1 193 132.6 9,283 1,012 1974 70.0 48.1 242 166.3 11,640 1,152 1975 67.0 47.9 282 201.6 13,508 1,229 1976 67.0 47.9 363 259.2 17,366 1,546 1977 66.0 47.8 420 304.1 20,070 1,806 1978 66.0 47.8 412 298.5 19,702 1,832 1979 65.0 47.7 525 385.3 25,043 2,204
1980 65.0 47.7 635 466.0 30,289 2,547 1981 65.0 47.7 729 535.0 34,773 2,851 1982 63.0 47.5 730 550.4 34,675 2,809 1983 62.0 47.4 701 535.9 33,227 2,758 1984 61.0 47.2 645 499.1 30,444 2,710
Table continued on next page.
Nebraska Farm Real Estate Market Developments 2016-2017 Page 21
Appendix Table 1. Farm Real Estate Values in Nebraska, USDA Historical Series, 1860-2017a (continued)
Year Number of Farms
Land in Farms
Value of Land & Buildings Building Value Per Acre Per Farm Total Value
Thousands Million Acres Dollars Thousand Dollars Million Dollars Million Dollars
1985 60.0 47.2 485 381.9 22,911 2,474 1986 59.0 47.2 416 332.7 19,629 2,532 1987 59.0 47.2 400 320.1 18,885 2,682 1988 58.0 47.1 457 371.1 21,525 3,186 1989 57.0 47.1 511 422.2 24,068 3,451
1990 57.0 47.1 524 433.0 24,680 3,186 1991 56.0 47.1 517 434.8 24,350 2,978 1992 56.0 47.1 517 434.8 24,350 3,026 1993 56.0 46.5 514 426.8 23,901 3,022 1994 56.0 46.5 550 456.7 25,575 2,966 1995 56.0 46.4 580 480.6 26,912 3,041 1996 56.0 46.4 610 505.4 28,304 3,099 1997 55.0 46.4 620 523.1 28,768 3,049 1998 55.0 46.4 645 544.1 29,928 3,068 1999 54.0 46.3 675 578.8 31,253 3,094
2000 52.0 46.1 710 629.4 32,731 3,126 2001 50.0 46.0 735 676.2 33,810 3,111 2002 49.4 45.9 760 706.2 34,884 3,087 2003 48.5 45.9 775 733.5 35,573 3,024 2004 48.3 45.8 810 768.1 37,098 3,023 2005 48.0 45.7 910 866.4 41,587 3,168 2006 47.6 45.7 1,030 988.9 47,071 3,507 2007 47.7 45.6 1,140 1,089.8 51,984 3,681 2008 48.2 45.5 1,330 1,255.5 60,515 3,909 2009 48.6 45.5 1,320 1,235.8 60,060 4,264
2010 49.5 45.4 1,470 1,348.2 66,738 4,738 2011 49.7 45.4 1,840 1,680.8 83,536 5,847 2012 50.0 45.3 2,420 2,192.5 109,626 7,674 2013 49.6 45.3 2,800 2,557.3 126,840 8,816 2014 49.1 45.2 3,120 2,872.2 141,024 9,731 2015 48.7 45.2 3,050 2,830.8 137,860 10,064 2016 48.4 45.2 2,950 2,755.0 133,340 9,568
2017 b 48.4 45.2 2,826 2,639.3 127,740 9,062
Source: a Farm Real Estate Historical Series Data: 1950-92, USDA, Economic Research Service, Sta. Bul. No. 855, May 1993 and earlier reports as well as recent electronic issues annually by Economic Research Service, U.S. Department of Agriculture.
b Preliminary.
Nebraska Farm Real Estate Market Developments 2016-2017 Page 22
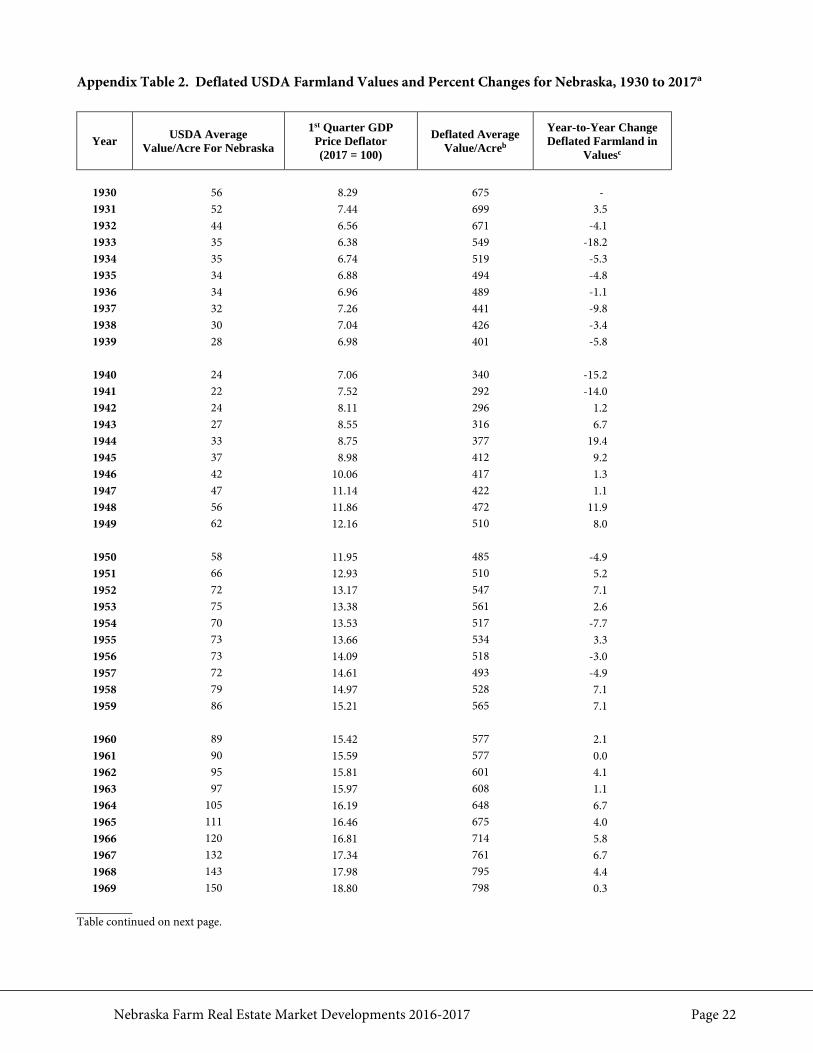
Appendix Table 2. Deflated USDA Farmland Values and Percent Changes for Nebraska, 1930 to 2017a
Year USDA Average Value/Acre For Nebraska
1st Quarter GDP Price Deflator (2017 = 100)
Deflated Average Value/Acreb
Year-to-Year Change Deflated Farmland in
Valuesc
1930 56 8.29 675 - 1931 52 7.44 699 3.5 1932 44 6.56 671 -4.1 1933 35 6.38 549 -18.2 1934 35 6.74 519 -5.3 1935 34 6.88 494 -4.8 1936 34 6.96 489 -1.1 1937 32 7.26 441 -9.8 1938 30 7.04 426 -3.4 1939 28 6.98 401 -5.8
1940 24 7.06 340 -15.2 1941 22 7.52 292 -14.0 1942 24 8.11 296 1.2 1943 27 8.55 316 6.7 1944 33 8.75 377 19.4 1945 37 8.98 412 9.2 1946 42 10.06 417 1.3 1947 47 11.14 422 1.1 1948 56 11.86 472 11.9 1949 62 12.16 510 8.0
1950 58 11.95 485 -4.9 1951 66 12.93 510 5.2 1952 72 13.17 547 7.1 1953 75 13.38 561 2.6 1954 70 13.53 517 -7.7 1955 73 13.66 534 3.3 1956 73 14.09 518 -3.0 1957 72 14.61 493 -4.9 1958 79 14.97 528 7.1 1959 86 15.21 565 7.1
1960 89 15.42 577 2.1 1961 90 15.59 577 0.0 1962 95 15.81 601 4.1 1963 97 15.97 608 1.1 1964 105 16.19 648 6.7 1965 111 16.46 675 4.0 1966 120 16.81 714 5.8 1967 132 17.34 761 6.7 1968 143 17.98 795 4.4 1969 150 18.80 798 0.3
Table continued on next page.
Nebraska Farm Real Estate Market Developments 2016-2017 Page 23
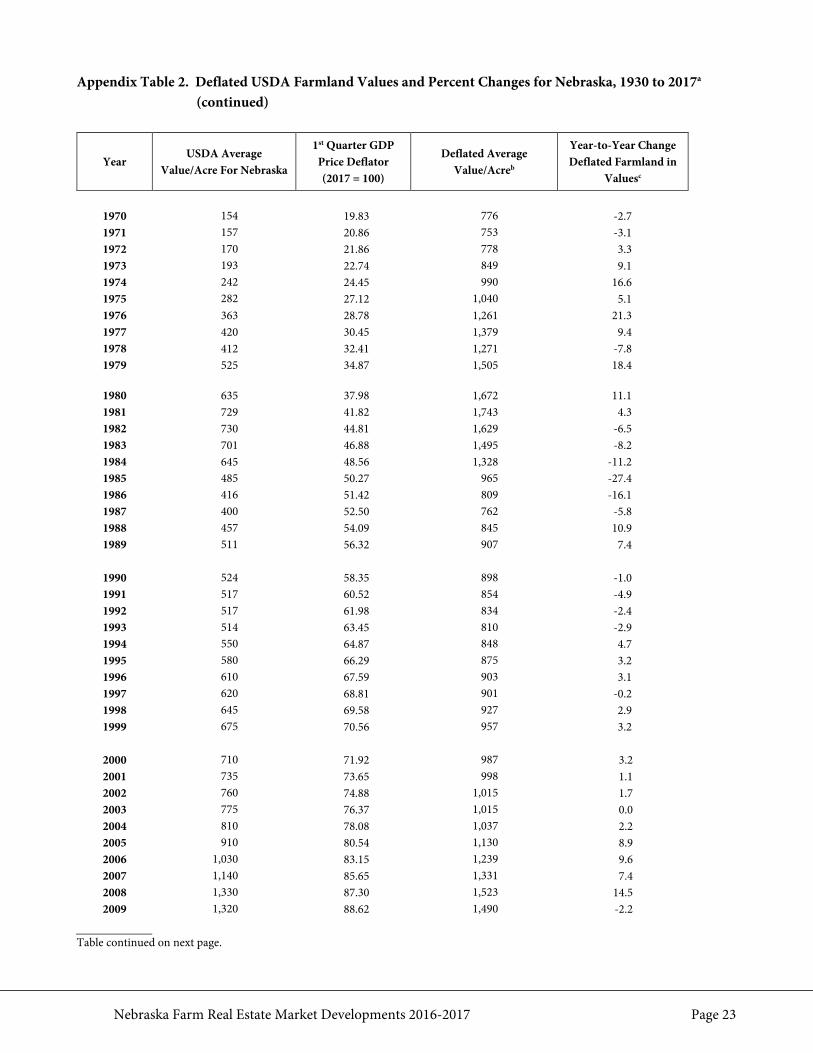
Appendix Table 2. Deflated USDA Farmland Values and Percent Changes for Nebraska, 1930 to 2017a (continued)
Year USDA Average
Value/Acre For Nebraska
1st Quarter GDP Price Deflator (2017 = 100)
Deflated Average Value/Acreb
Year-to-Year Change Deflated Farmland in
Valuesc
1970 154 19.83 776 -2.7 1971 157 20.86 753 -3.1 1972 170 21.86 778 3.3 1973 193 22.74 849 9.1 1974 242 24.45 990 16.6 1975 282 27.12 1,040 5.1 1976 363 28.78 1,261 21.3 1977 420 30.45 1,379 9.4 1978 412 32.41 1,271 -7.8 1979 525 34.87 1,505 18.4
1980 635 37.98 1,672 11.1 1981 729 41.82 1,743 4.3 1982 730 44.81 1,629 -6.5 1983 701 46.88 1,495 -8.2 1984 645 48.56 1,328 -11.2 1985 485 50.27 965 -27.4 1986 416 51.42 809 -16.1 1987 400 52.50 762 -5.8 1988 457 54.09 845 10.9 1989 511 56.32 907 7.4
1990 524 58.35 898 -1.0 1991 517 60.52 854 -4.9 1992 517 61.98 834 -2.4 1993 514 63.45 810 -2.9 1994 550 64.87 848 4.7 1995 580 66.29 875 3.2 1996 610 67.59 903 3.1 1997 620 68.81 901 -0.2 1998 645 69.58 927 2.9 1999 675 70.56 957 3.2
2000 710 71.92 987 3.2 2001 735 73.65 998 1.1 2002 760 74.88 1,015 1.7 2003 775 76.37 1,015 0.0 2004 810 78.08 1,037 2.2 2005 910 80.54 1,130 8.9 2006 1,030 83.15 1,239 9.6 2007 1,140 85.65 1,331 7.4 2008 1,330 87.30 1,523 14.5 2009 1,320 88.62 1,490 -2.2
Table continued on next page.
Nebraska Farm Real Estate Market Developments 2016-2017 Page 24
Appendix Table 2. Deflated USDA Farmland Values and Percent Changes for Nebraska, 1930 to 2017a (continued)
Year USDA Average
Value/Acre For Nebraska
1st Quarter GDP Price Deflator (2017 = 100)
Deflated Average Value/Acreb
Year-to-Year Change Deflated Farmland in
Valuesc
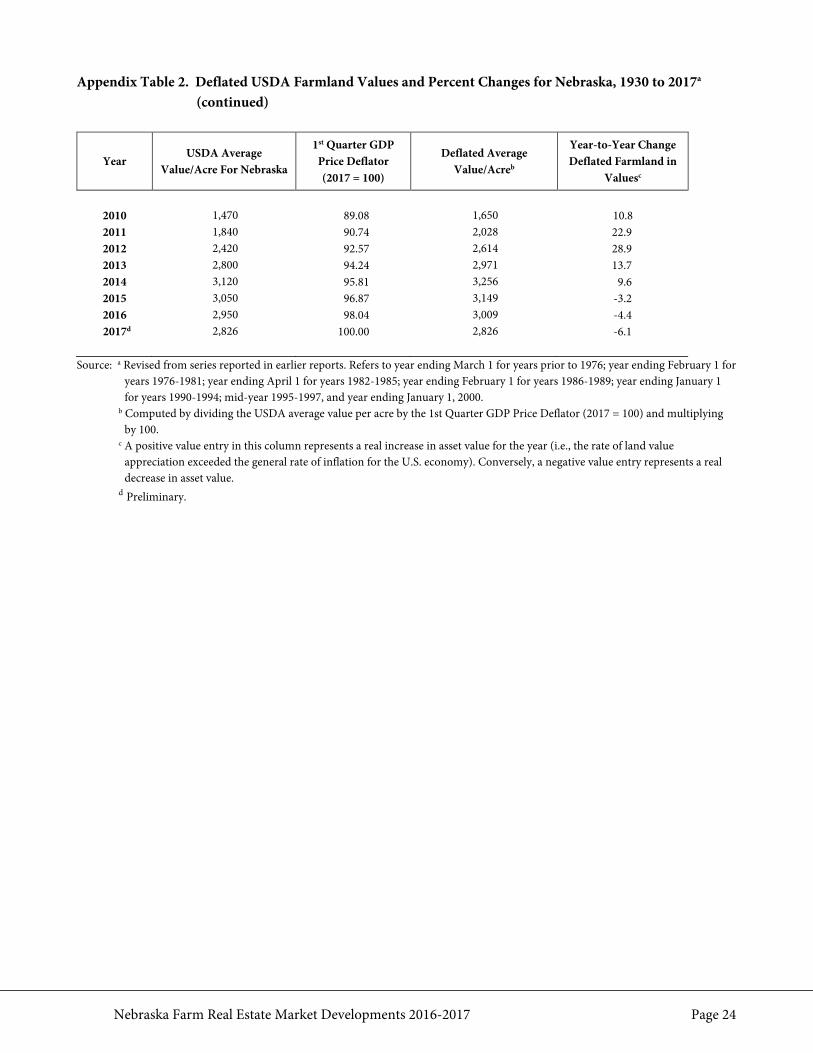
2010 1,470 89.08 1,650 10.8 2011 1,840 90.74 2,028 22.9 2012 2,420 92.57 2,614 28.9 2013 2,800 94.24 2,971 13.7 2014 3,120 95.81 3,256 9.6 2015 3,050 96.87 3,149 -3.2 2016 2,950 98.04 3,009 -4.4 2017d 2,826 100.00 2,826 -6.1
Source: a Revised from series reported in earlier reports. Refers to year ending March 1 for years prior to 1976; year ending February 1 for
years 1976-1981; year ending April 1 for years 1982-1985; year ending February 1 for years 1986-1989; year ending January 1 for years 1990-1994; mid-year 1995-1997, and year ending January 1, 2000.
b Computed by dividing the USDA average value per acre by the 1st Quarter GDP Price Deflator (2017 = 100) and multiplying by 100.
c A positive value entry in this column represents a real increase in asset value for the year (i.e., the rate of land value appreciation exceeded the general rate of inflation for the U.S. economy). Conversely, a negative value entry represents a real decrease in asset value.
d Preliminary.
Nebraska Farm Real Estate Market Developments 2016-2017 Page 25
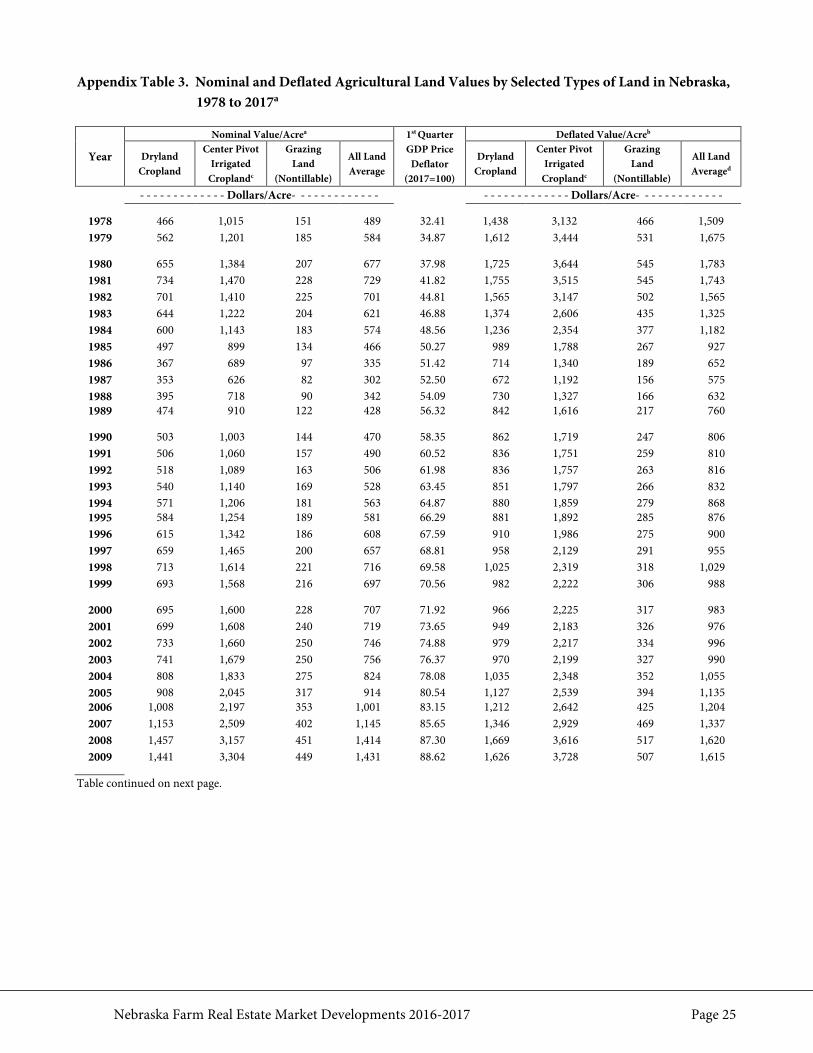
Appendix Table 3. Nominal and Deflated Agricultural Land Values by Selected Types of Land in Nebraska, 1978 to 2017a
Year
Nominal Value/Acrea 1st Quarter GDP Price
Deflator (2017=100)
Deflated Value/Acreb
Dryland Cropland
Center Pivot Irrigated
Croplandc
Grazing Land
(Nontillable)
All Land Average
Dryland Cropland
Center Pivot Irrigated
Croplandc
Grazing Land
(Nontillable)
All Land Averaged
- - - - - - - - - - - - - Dollars/Acre- - - - - - - - - - - - - - - - - - - - - - - - - - Dollars/Acre- - - - - - - - - - - - -
1978 466 1,015 151 489 32.41 1,438 3,132 466 1,509 1979 562 1,201 185 584 34.87 1,612 3,444 531 1,675
1980 655 1,384 207 677 37.98 1,725 3,644 545 1,783 1981 734 1,470 228 729 41.82 1,755 3,515 545 1,743 1982 701 1,410 225 701 44.81 1,565 3,147 502 1,565 1983 644 1,222 204 621 46.88 1,374 2,606 435 1,325 1984 600 1,143 183 574 48.56 1,236 2,354 377 1,182 1985 497 899 134 466 50.27 989 1,788 267 927 1986 367 689 97 335 51.42 714 1,340 189 652 1987 353 626 82 302 52.50 672 1,192 156 575 1988 395 718 90 342 54.09 730 1,327 166 632 1989 474 910 122 428 56.32 842 1,616 217 760
1990 503 1,003 144 470 58.35 862 1,719 247 806 1991 506 1,060 157 490 60.52 836 1,751 259 810 1992 518 1,089 163 506 61.98 836 1,757 263 816 1993 540 1,140 169 528 63.45 851 1,797 266 832 1994 571 1,206 181 563 64.87 880 1,859 279 868 1995 584 1,254 189 581 66.29 881 1,892 285 876 1996 615 1,342 186 608 67.59 910 1,986 275 900 1997 659 1,465 200 657 68.81 958 2,129 291 955 1998 713 1,614 221 716 69.58 1,025 2,319 318 1,029 1999 693 1,568 216 697 70.56 982 2,222 306 988
2000 695 1,600 228 707 71.92 966 2,225 317 983 2001 699 1,608 240 719 73.65 949 2,183 326 976 2002 733 1,660 250 746 74.88 979 2,217 334 996 2003 741 1,679 250 756 76.37 970 2,199 327 990 2004 808 1,833 275 824 78.08 1,035 2,348 352 1,055 2005 908 2,045 317 914 80.54 1,127 2,539 394 1,135 2006 1,008 2,197 353 1,001 83.15 1,212 2,642 425 1,204 2007 1,153 2,509 402 1,145 85.65 1,346 2,929 469 1,337 2008 1,457 3,157 451 1,414 87.30 1,669 3,616 517 1,620 2009 1,441 3,304 449 1,431 88.62 1,626 3,728 507 1,615
Table continued on next page.
Nebraska Farm Real Estate Market Developments 2016-2017 Page 26
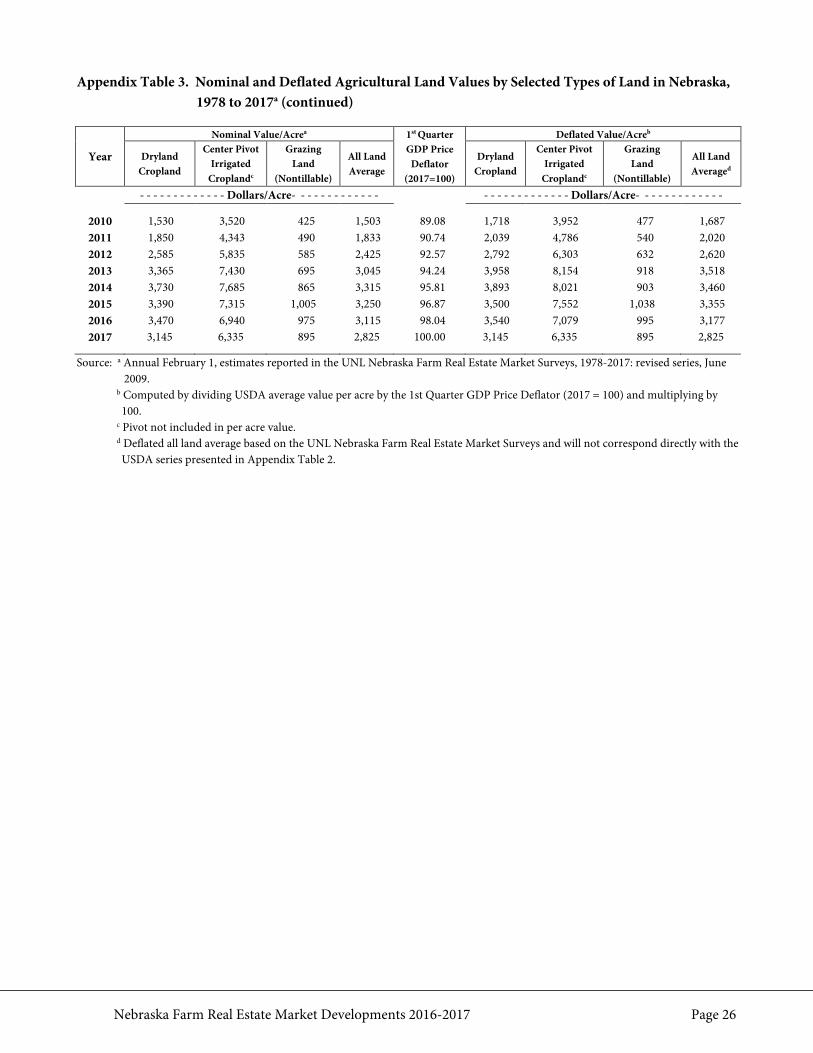
Appendix Table 3. Nominal and Deflated Agricultural Land Values by Selected Types of Land in Nebraska, 1978 to 2017a (continued)
Year
Nominal Value/Acrea 1st Quarter GDP Price
Deflator (2017=100)
Deflated Value/Acreb
Dryland Cropland
Center Pivot Irrigated
Croplandc
Grazing Land
(Nontillable)
All Land Average
Dryland Cropland
Center Pivot Irrigated
Croplandc
Grazing Land
(Nontillable)
All Land Averaged
- - - - - - - - - - - - - Dollars/Acre- - - - - - - - - - - - - - - - - - - - - - - - - - Dollars/Acre- - - - - - - - - - - - -
2010 1,530 3,520 425 1,503 89.08 1,718 3,952 477 1,687 2011 1,850 4,343 490 1,833 90.74 2,039 4,786 540 2,020 2012 2,585 5,835 585 2,425 92.57 2,792 6,303 632 2,620 2013 3,365 7,430 695 3,045 94.24 3,958 8,154 918 3,518 2014 3,730 7,685 865 3,315 95.81 3,893 8,021 903 3,460 2015 3,390 7,315 1,005 3,250 96.87 3,500 7,552 1,038 3,355 2016 3,470 6,940 975 3,115 98.04 3,540 7,079 995 3,177 2017 3,145 6,335 895 2,825 100.00 3,145 6,335 895 2,825
Source: a Annual February 1, estimates reported in the UNL Nebraska Farm Real Estate Market Surveys, 1978-2017: revised series, June
2009. b Computed by dividing USDA average value per acre by the 1st Quarter GDP Price Deflator (2017 = 100) and multiplying by 100.
c Pivot not included in per acre value. d Deflated all land average based on the UNL Nebraska Farm Real Estate Market Surveys and will not correspond directly with the USDA series presented in Appendix Table 2.
Nebraska Farm Real Estate Market Developments 2016-2017 Page 27
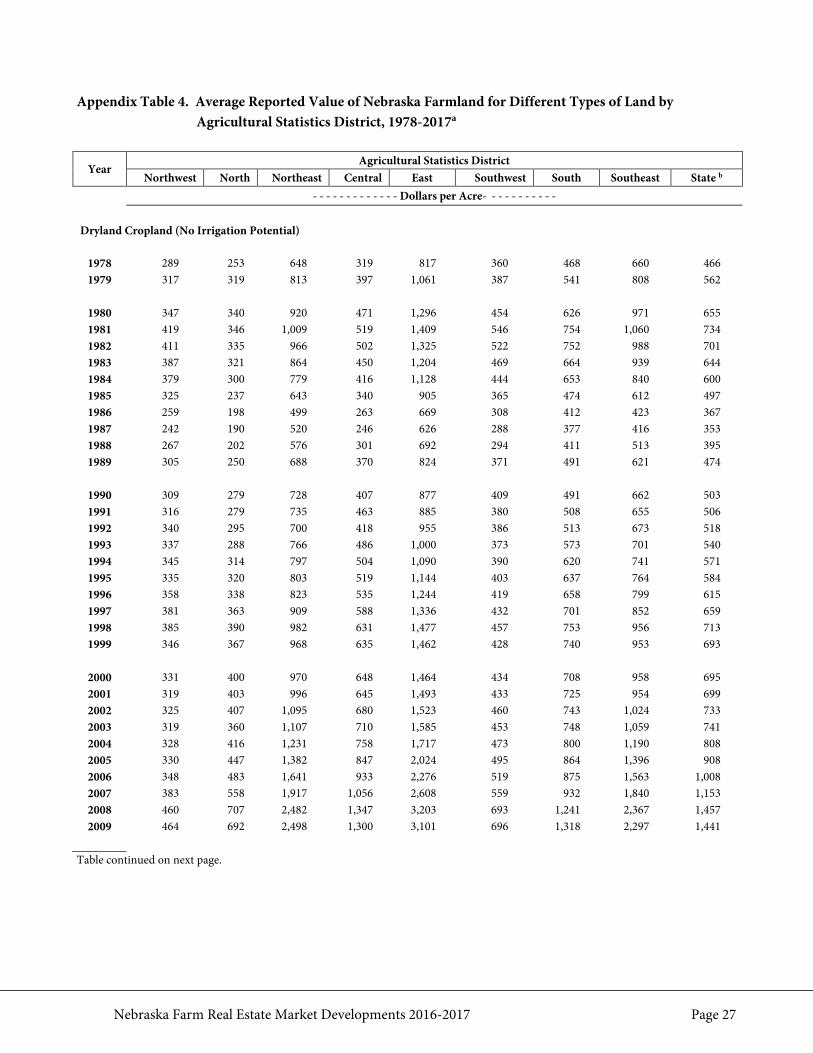
Appendix Table 4. Average Reported Value of Nebraska Farmland for Different Types of Land by
Agricultural Statistics District, 1978-2017a
Year Agricultural Statistics District
Northwest North Northeast Central East Southwest South Southeast State b - - - - - - - - - - - - - Dollars per Acre- - - - - - - - - - -
Dryland Cropland (No Irrigation Potential)
1978 289 253 648 319 817 360 468 660 466 1979 317 319 813 397 1,061 387 541 808 562
1980 347 340 920 471 1,296 454 626 971 655 1981 419 346 1,009 519 1,409 546 754 1,060 734 1982 411 335 966 502 1,325 522 752 988 701 1983 387 321 864 450 1,204 469 664 939 644 1984 379 300 779 416 1,128 444 653 840 600 1985 325 237 643 340 905 365 474 612 497 1986 259 198 499 263 669 308 412 423 367 1987 242 190 520 246 626 288 377 416 353 1988 267 202 576 301 692 294 411 513 395 1989 305 250 688 370 824 371 491 621 474
1990 309 279 728 407 877 409 491 662 503 1991 316 279 735 463 885 380 508 655 506 1992 340 295 700 418 955 386 513 673 518 1993 337 288 766 486 1,000 373 573 701 540 1994 345 314 797 504 1,090 390 620 741 571 1995 335 320 803 519 1,144 403 637 764 584 1996 358 338 823 535 1,244 419 658 799 615 1997 381 363 909 588 1,336 432 701 852 659 1998 385 390 982 631 1,477 457 753 956 713 1999 346 367 968 635 1,462 428 740 953 693
2000 331 400 970 648 1,464 434 708 958 695 2001 319 403 996 645 1,493 433 725 954 699 2002 325 407 1,095 680 1,523 460 743 1,024 733 2003 319 360 1,107 710 1,585 453 748 1,059 741 2004 328 416 1,231 758 1,717 473 800 1,190 808 2005 330 447 1,382 847 2,024 495 864 1,396 908 2006 348 483 1,641 933 2,276 519 875 1,563 1,008 2007 383 558 1,917 1,056 2,608 559 932 1,840 1,153 2008 460 707 2,482 1,347 3,203 693 1,241 2,367 1,457 2009 464 692 2,498 1,300 3,101 696 1,318 2,297 1,441
Table continued on next page.

Nebraska Farm Real Estate Market Developments 2016-2017 Page 28
Appendix Table 4. Average Reported Value of Nebraska Farmland for Different Types of Land by Agricultural Statistics District, 1978-2017a (continued)
Year Agricultural Statistics District
Northwest North Northeast Central East Southwest South Southeast State b - - - - - - - - - - - - - Dollars per Acre- - - - - - - - - - -
Dryland Cropland (No Irrigation Potential)
2010 475 715 2,740 1,365 3,330 735 1,380 2,410 1,530 2011 545 800 3,450 1,605 3,995 875 1,738 2,925 1,850 2012 660 1,050 4,740 2,170 5,385 1,250 2,250 3,800 2,485 2013 700 1,155 5,995 2,625 6,730 1,530 3,240 4,925 3,010 2014 845 1,720 6,430 3,490 6,575 1,965 3,490 5,425 3,730 2015 730 1,580 5,645 3,115 5,980 1,855 3,340 5,060 3,390 2016 745 1,650 5,760 3,235 6,360 1,955 3,575 4,845 3,470 2017 715 1,560 5,410 2,785 5,790 1,710 3,045 4,285 3,145
Table continued on next page.
Nebraska Farm Real Estate Market Developments 2016-2017 Page 29
Appendix Table 4. Average Reported Value of Nebraska Farmland for Different Types of Land by Agricultural Statistics District, 1978-2017a (continued)
Year Agricultural Statistics District
Northwest North Northeast Central East Southwest South Southeast State b - - - - - - - - - - - - - Dollars per Acre- - - - - - - - - - - - -
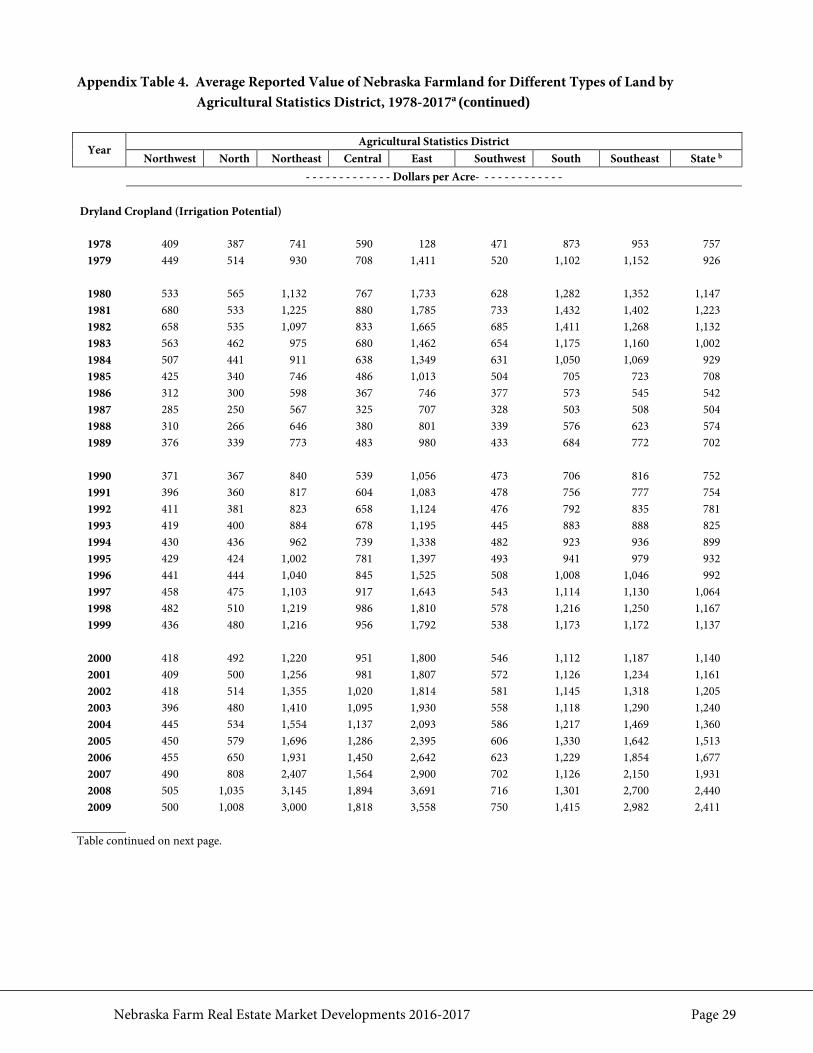
Dryland Cropland (Irrigation Potential)
1978 409 387 741 590 128 471 873 953 757 1979 449 514 930 708 1,411 520 1,102 1,152 926
1980 533 565 1,132 767 1,733 628 1,282 1,352 1,147 1981 680 533 1,225 880 1,785 733 1,432 1,402 1,223 1982 658 535 1,097 833 1,665 685 1,411 1,268 1,132 1983 563 462 975 680 1,462 654 1,175 1,160 1,002 1984 507 441 911 638 1,349 631 1,050 1,069 929 1985 425 340 746 486 1,013 504 705 723 708 1986 312 300 598 367 746 377 573 545 542 1987 285 250 567 325 707 328 503 508 504 1988 310 266 646 380 801 339 576 623 574 1989 376 339 773 483 980 433 684 772 702
1990 371 367 840 539 1,056 473 706 816 752 1991 396 360 817 604 1,083 478 756 777 754 1992 411 381 823 658 1,124 476 792 835 781 1993 419 400 884 678 1,195 445 883 888 825 1994 430 436 962 739 1,338 482 923 936 899 1995 429 424 1,002 781 1,397 493 941 979 932 1996 441 444 1,040 845 1,525 508 1,008 1,046 992 1997 458 475 1,103 917 1,643 543 1,114 1,130 1,064 1998 482 510 1,219 986 1,810 578 1,216 1,250 1,167 1999 436 480 1,216 956 1,792 538 1,173 1,172 1,137
2000 418 492 1,220 951 1,800 546 1,112 1,187 1,140 2001 409 500 1,256 981 1,807 572 1,126 1,234 1,161 2002 418 514 1,355 1,020 1,814 581 1,145 1,318 1,205 2003 396 480 1,410 1,095 1,930 558 1,118 1,290 1,240 2004 445 534 1,554 1,137 2,093 586 1,217 1,469 1,360 2005 450 579 1,696 1,286 2,395 606 1,330 1,642 1,513 2006 455 650 1,931 1,450 2,642 623 1,229 1,854 1,677 2007 490 808 2,407 1,564 2,900 702 1,126 2,150 1,931 2008 505 1,035 3,145 1,894 3,691 716 1,301 2,700 2,440 2009 500 1,008 3,000 1,818 3,558 750 1,415 2,982 2,411
Table continued on next page.
Nebraska Farm Real Estate Market Developments 2016-2017 Page 30
Appendix Table 4. Average Reported Value of Nebraska Farmland for Different Types of Land by Agricultural Statistics District, 1978-2017a (continued)
Year Agricultural Statistics District
Northwest North Northeast Central East Southwest South Southeast State b - - - - - - - - - - - - - Dollars per Acre- - - - - - - - - - - - -
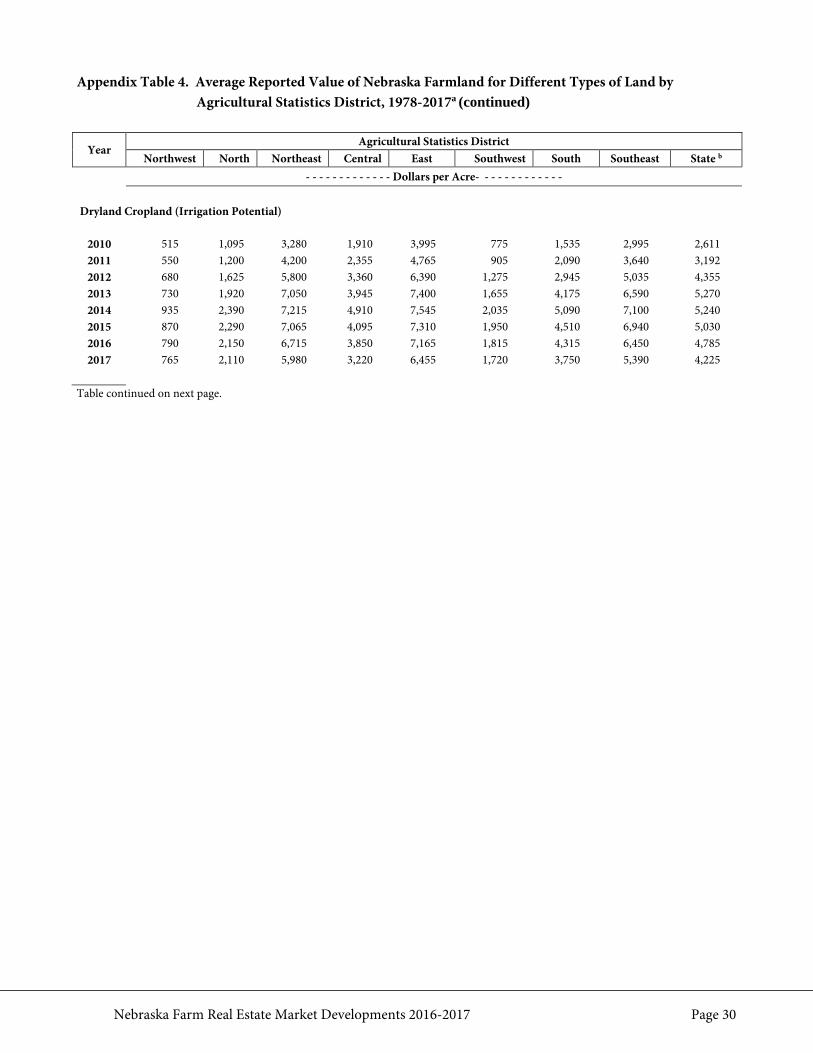
Dryland Cropland (Irrigation Potential)
2010 515 1,095 3,280 1,910 3,995 775 1,535 2,995 2,611 2011 550 1,200 4,200 2,355 4,765 905 2,090 3,640 3,192 2012 680 1,625 5,800 3,360 6,390 1,275 2,945 5,035 4,355 2013 730 1,920 7,050 3,945 7,400 1,655 4,175 6,590 5,270 2014 935 2,390 7,215 4,910 7,545 2,035 5,090 7,100 5,240 2015 870 2,290 7,065 4,095 7,310 1,950 4,510 6,940 5,030 2016 790 2,150 6,715 3,850 7,165 1,815 4,315 6,450 4,785 2017 765 2,110 5,980 3,220 6,455 1,720 3,750 5,390 4,225
Table continued on next page.
Nebraska Farm Real Estate Market Developments 2016-2017 Page 31
Appendix Table 4. Average Reported Value of Nebraska Farmland for Different Types of Land by Agricultural Statistics District, 1978-2017a (continued)
Year Agricultural Statistics District
Northwest North Northeast Central East Southwest South Southeast State b - - - - - - - - - - - - - Dollars per Acre- - - - - - - - - - - - -
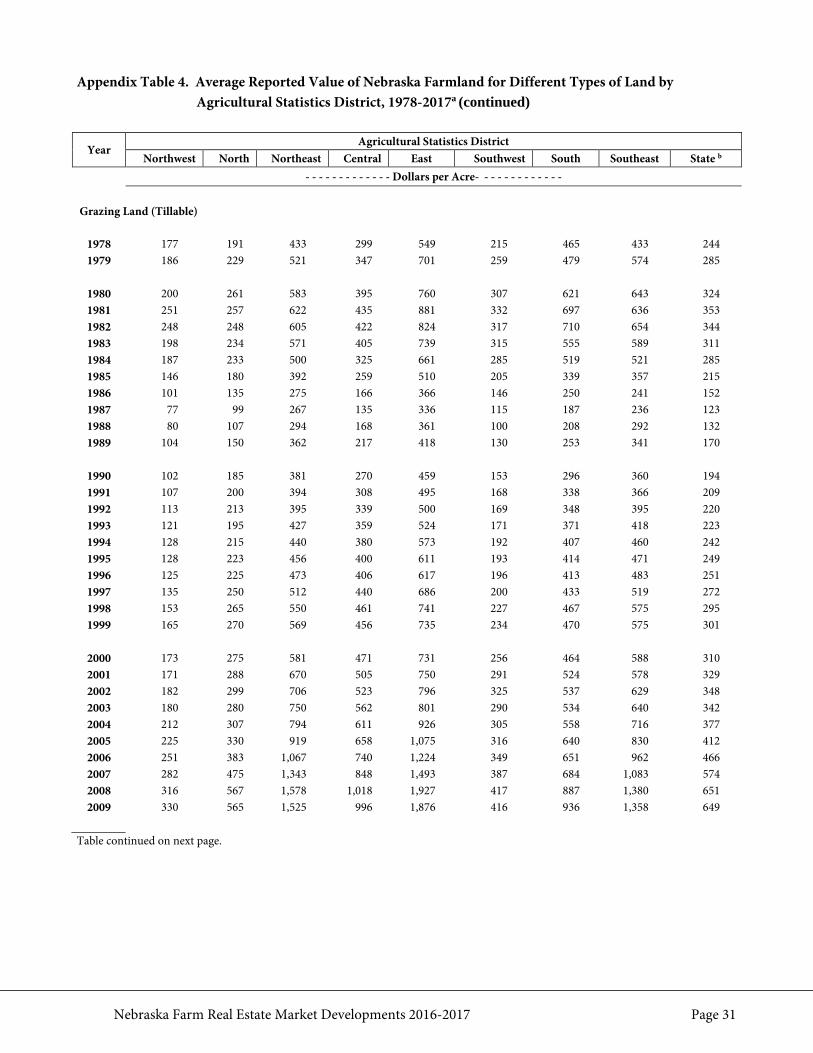
Grazing Land (Tillable)
1978 177 191 433 299 549 215 465 433 244 1979 186 229 521 347 701 259 479 574 285
1980 200 261 583 395 760 307 621 643 324 1981 251 257 622 435 881 332 697 636 353 1982 248 248 605 422 824 317 710 654 344 1983 198 234 571 405 739 315 555 589 311 1984 187 233 500 325 661 285 519 521 285 1985 146 180 392 259 510 205 339 357 215 1986 101 135 275 166 366 146 250 241 152 1987 77 99 267 135 336 115 187 236 123 1988 80 107 294 168 361 100 208 292 132 1989 104 150 362 217 418 130 253 341 170
1990 102 185 381 270 459 153 296 360 194 1991 107 200 394 308 495 168 338 366 209 1992 113 213 395 339 500 169 348 395 220 1993 121 195 427 359 524 171 371 418 223 1994 128 215 440 380 573 192 407 460 242 1995 128 223 456 400 611 193 414 471 249 1996 125 225 473 406 617 196 413 483 251 1997 135 250 512 440 686 200 433 519 272 1998 153 265 550 461 741 227 467 575 295 1999 165 270 569 456 735 234 470 575 301
2000 173 275 581 471 731 256 464 588 310 2001 171 288 670 505 750 291 524 578 329 2002 182 299 706 523 796 325 537 629 348 2003 180 280 750 562 801 290 534 640 342 2004 212 307 794 611 926 305 558 716 377 2005 225 330 919 658 1,075 316 640 830 412 2006 251 383 1,067 740 1,224 349 651 962 466 2007 282 475 1,343 848 1,493 387 684 1,083 574 2008 316 567 1,578 1,018 1,927 417 887 1,380 651 2009 330 565 1,525 996 1,876 416 936 1,358 649
Table continued on next page.

Nebraska Farm Real Estate Market Developments 2016-2017 Page 32
Appendix Table 4. Average Reported Value of Nebraska Farmland for Different Types of Land by Agricultural Statistics District, 1978-2017a (continued)
Year Agricultural Statistics District
Northwest North Northeast Central East Southwest South Southeast State b - - - - - - - - - - - - - Dollars per Acre- - - - - - - - - - - - -
Grazing Land (Tillable)
2010 320 595 1,640 990 1,965 435 960 1,430 669 2011 340 740 2,090 1,145 2,365 490 1,100 1,795 797 2012 410 880 2,690 1,670 2,965 590 1,500 2,400 1,010 2013 425 1,050 3,575 2,075 3,390 665 2,075 3,195 1,230 2014 550 1,150 4,075 2,300 3,620 890 2,430 3,285 1,390 2015 535 1,395 3,695 2,615 4,205 1,135 2,350 3,035 1,515 2016 565 1,325 3,955 2,460 4,370 1,070 2,240 3,200 1,495 2017 530 1,170 3,665 2,155 3,765 975 2,040 2,780 1,335
Table continued on next page.
Nebraska Farm Real Estate Market Developments 2016-2017 Page 33
Appendix Table 4. Average Reported Value of Nebraska Farmland for Different Types of Land by Agricultural Statistics District, 1978-2017a (continued)
Year Agricultural Statistics District
Northwest North Northeast Central East Southwest South Southeast State b - - - - - - - - - - - - - Dollars per Acre- - - - - - - - - - - - -
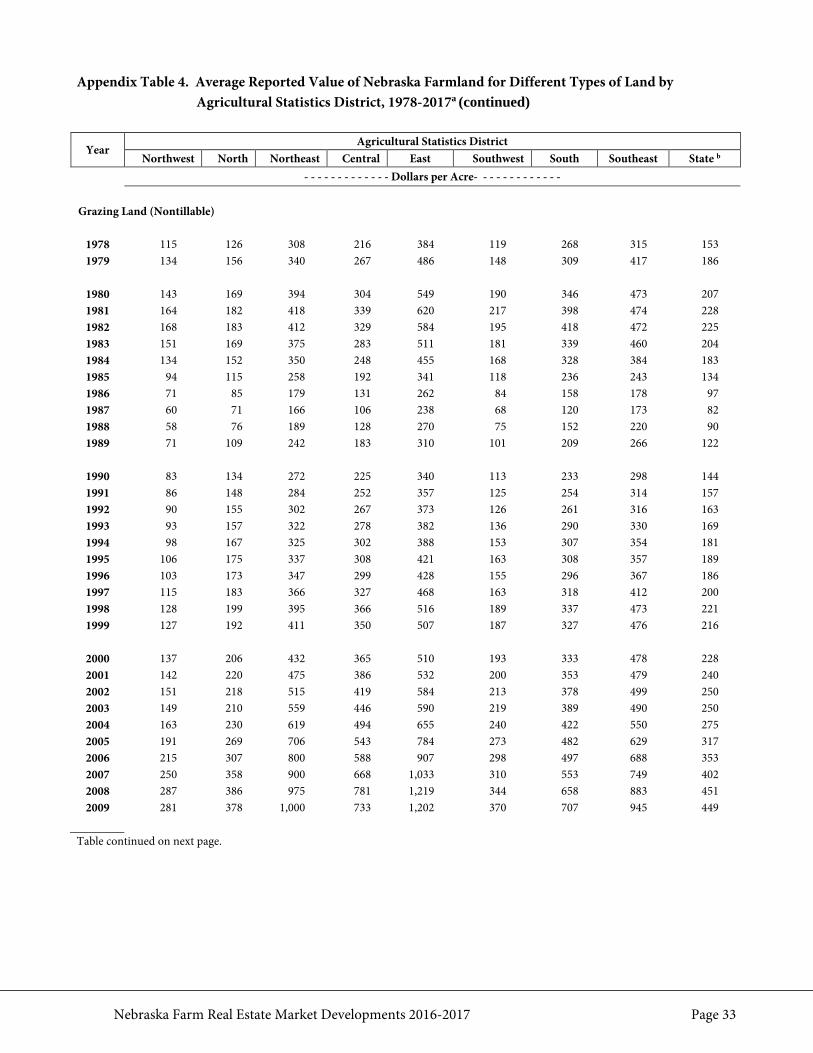
Grazing Land (Nontillable)
1978 115 126 308 216 384 119 268 315 153 1979 134 156 340 267 486 148 309 417 186
1980 143 169 394 304 549 190 346 473 207 1981 164 182 418 339 620 217 398 474 228 1982 168 183 412 329 584 195 418 472 225 1983 151 169 375 283 511 181 339 460 204 1984 134 152 350 248 455 168 328 384 183 1985 94 115 258 192 341 118 236 243 134 1986 71 85 179 131 262 84 158 178 97 1987 60 71 166 106 238 68 120 173 82 1988 58 76 189 128 270 75 152 220 90 1989 71 109 242 183 310 101 209 266 122
1990 83 134 272 225 340 113 233 298 144 1991 86 148 284 252 357 125 254 314 157 1992 90 155 302 267 373 126 261 316 163 1993 93 157 322 278 382 136 290 330 169 1994 98 167 325 302 388 153 307 354 181 1995 106 175 337 308 421 163 308 357 189 1996 103 173 347 299 428 155 296 367 186 1997 115 183 366 327 468 163 318 412 200 1998 128 199 395 366 516 189 337 473 221 1999 127 192 411 350 507 187 327 476 216
2000 137 206 432 365 510 193 333 478 228 2001 142 220 475 386 532 200 353 479 240 2002 151 218 515 419 584 213 378 499 250 2003 149 210 559 446 590 219 389 490 250 2004 163 230 619 494 655 240 422 550 275 2005 191 269 706 543 784 273 482 629 317 2006 215 307 800 588 907 298 497 688 353 2007 250 358 900 668 1,033 310 553 749 402 2008 287 386 975 781 1,219 344 658 883 451 2009 281 378 1,000 733 1,202 370 707 945 449
Table continued on next page.
Nebraska Farm Real Estate Market Developments 2016-2017 Page 34
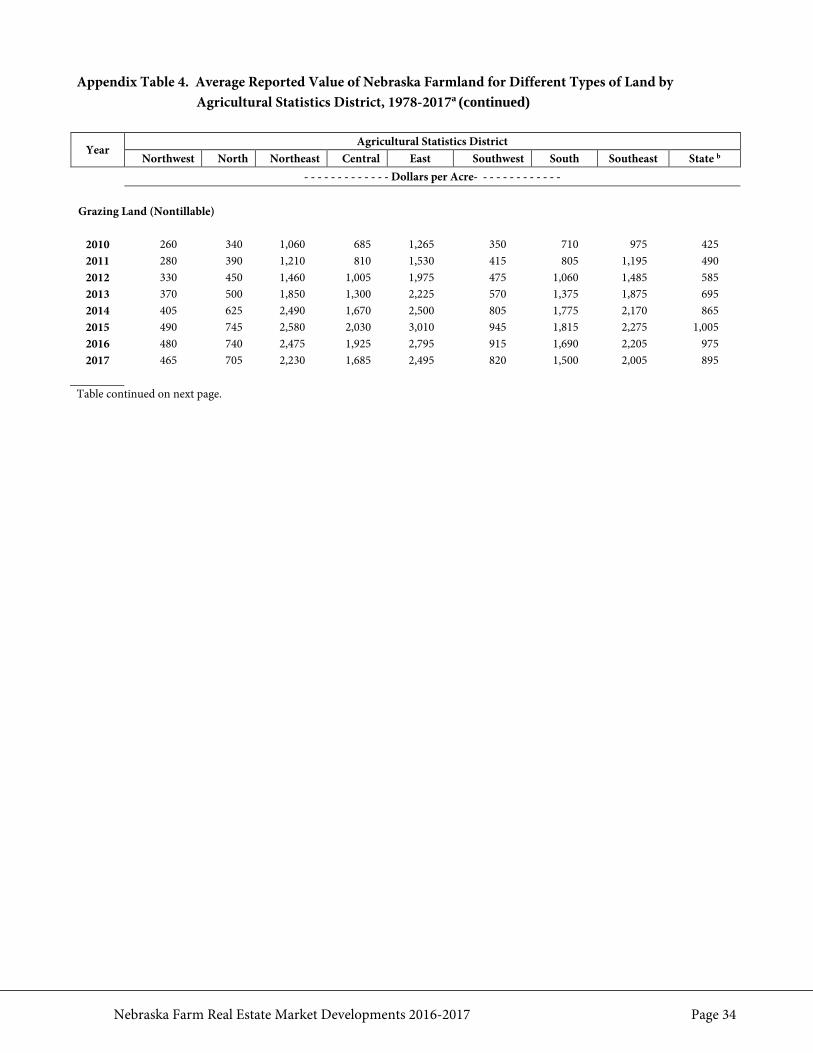
Appendix Table 4. Average Reported Value of Nebraska Farmland for Different Types of Land by Agricultural Statistics District, 1978-2017a (continued)
Year Agricultural Statistics District
Northwest North Northeast Central East Southwest South Southeast State b - - - - - - - - - - - - - Dollars per Acre- - - - - - - - - - - - -
Grazing Land (Nontillable)
2010 260 340 1,060 685 1,265 350 710 975 425 2011 280 390 1,210 810 1,530 415 805 1,195 490 2012 330 450 1,460 1,005 1,975 475 1,060 1,485 585 2013 370 500 1,850 1,300 2,225 570 1,375 1,875 695 2014 405 625 2,490 1,670 2,500 805 1,775 2,170 865 2015 490 745 2,580 2,030 3,010 945 1,815 2,275 1,005 2016 480 740 2,475 1,925 2,795 915 1,690 2,205 975 2017 465 705 2,230 1,685 2,495 820 1,500 2,005 895
Table continued on next page.
Nebraska Farm Real Estate Market Developments 2016-2017 Page 35
Appendix Table 4. Average Reported Value of Nebraska Farmland for Different Types of Land by Agricultural Statistics District, 1978-2017a (continued)
Year Agricultural Statistics District
Northwest North Northeast Central East Southwest South Southeast State b - - - - - - - - - - - - - Dollars per Acre- - - - - - - - - - - - -
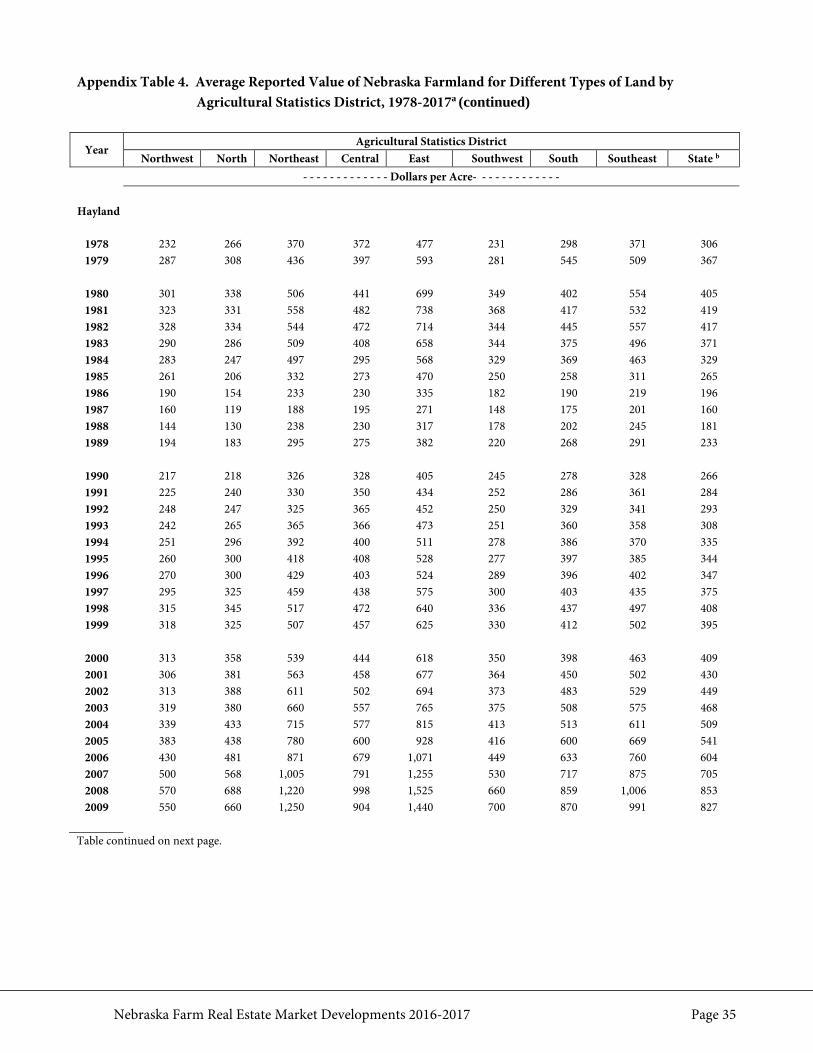
Hayland
1978 232 266 370 372 477 231 298 371 306 1979 287 308 436 397 593 281 545 509 367
1980 301 338 506 441 699 349 402 554 405 1981 323 331 558 482 738 368 417 532 419 1982 328 334 544 472 714 344 445 557 417 1983 290 286 509 408 658 344 375 496 371 1984 283 247 497 295 568 329 369 463 329 1985 261 206 332 273 470 250 258 311 265 1986 190 154 233 230 335 182 190 219 196 1987 160 119 188 195 271 148 175 201 160 1988 144 130 238 230 317 178 202 245 181 1989 194 183 295 275 382 220 268 291 233
1990 217 218 326 328 405 245 278 328 266 1991 225 240 330 350 434 252 286 361 284 1992 248 247 325 365 452 250 329 341 293 1993 242 265 365 366 473 251 360 358 308 1994 251 296 392 400 511 278 386 370 335 1995 260 300 418 408 528 277 397 385 344 1996 270 300 429 403 524 289 396 402 347 1997 295 325 459 438 575 300 403 435 375 1998 315 345 517 472 640 336 437 497 408 1999 318 325 507 457 625 330 412 502 395
2000 313 358 539 444 618 350 398 463 409 2001 306 381 563 458 677 364 450 502 430 2002 313 388 611 502 694 373 483 529 449 2003 319 380 660 557 765 375 508 575 468 2004 339 433 715 577 815 413 513 611 509 2005 383 438 780 600 928 416 600 669 541 2006 430 481 871 679 1,071 449 633 760 604 2007 500 568 1,005 791 1,255 530 717 875 705 2008 570 688 1,220 998 1,525 660 859 1,006 853 2009 550 660 1,250 904 1,440 700 870 991 827
Table continued on next page.
Nebraska Farm Real Estate Market Developments 2016-2017 Page 36
Appendix Table 4. Average Reported Value of Nebraska Farmland for Different Types of Land by Agricultural Statistics District, 1978-2017a (continued)
Year Agricultural Statistics District
Northwest North Northeast Central East Southwest South Southeast State b - - - - - - - - - - - - - Dollars per Acre- - - - - - - - - - - - -
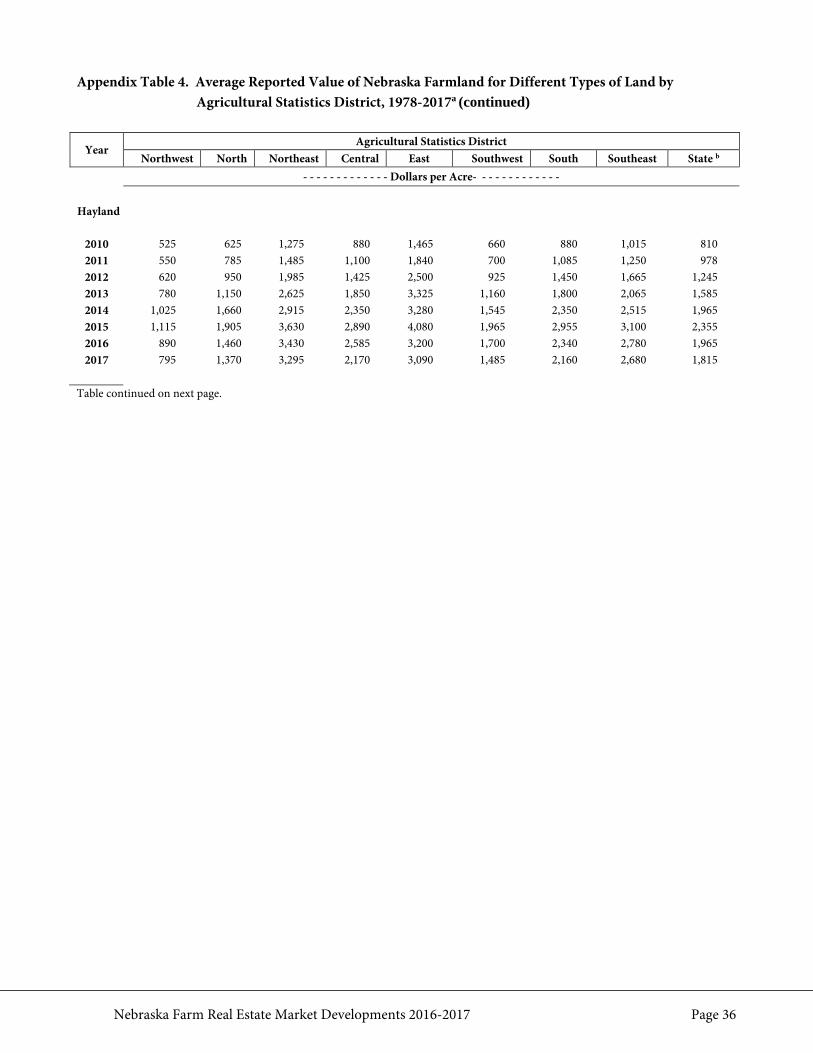
Hayland
2010 525 625 1,275 880 1,465 660 880 1,015 810 2011 550 785 1,485 1,100 1,840 700 1,085 1,250 978 2012 620 950 1,985 1,425 2,500 925 1,450 1,665 1,245 2013 780 1,150 2,625 1,850 3,325 1,160 1,800 2,065 1,585 2014 1,025 1,660 2,915 2,350 3,280 1,545 2,350 2,515 1,965 2015 1,115 1,905 3,630 2,890 4,080 1,965 2,955 3,100 2,355 2016 890 1,460 3,430 2,585 3,200 1,700 2,340 2,780 1,965 2017 795 1,370 3,295 2,170 3,090 1,485 2,160 2,680 1,815
Table continued on next page.
Nebraska Farm Real Estate Market Developments 2016-2017 Page 37
Appendix Table 4. Average Reported Value of Nebraska Farmland for Different Types of Land by Agricultural Statistics District, 1978-2017a (continued)
Year Agricultural Statistics District
Northwest North Northeast Central East Southwest South Southeast State b - - - - - - - - - - - - - Dollars per Acre- - - - - - - - - - - - -
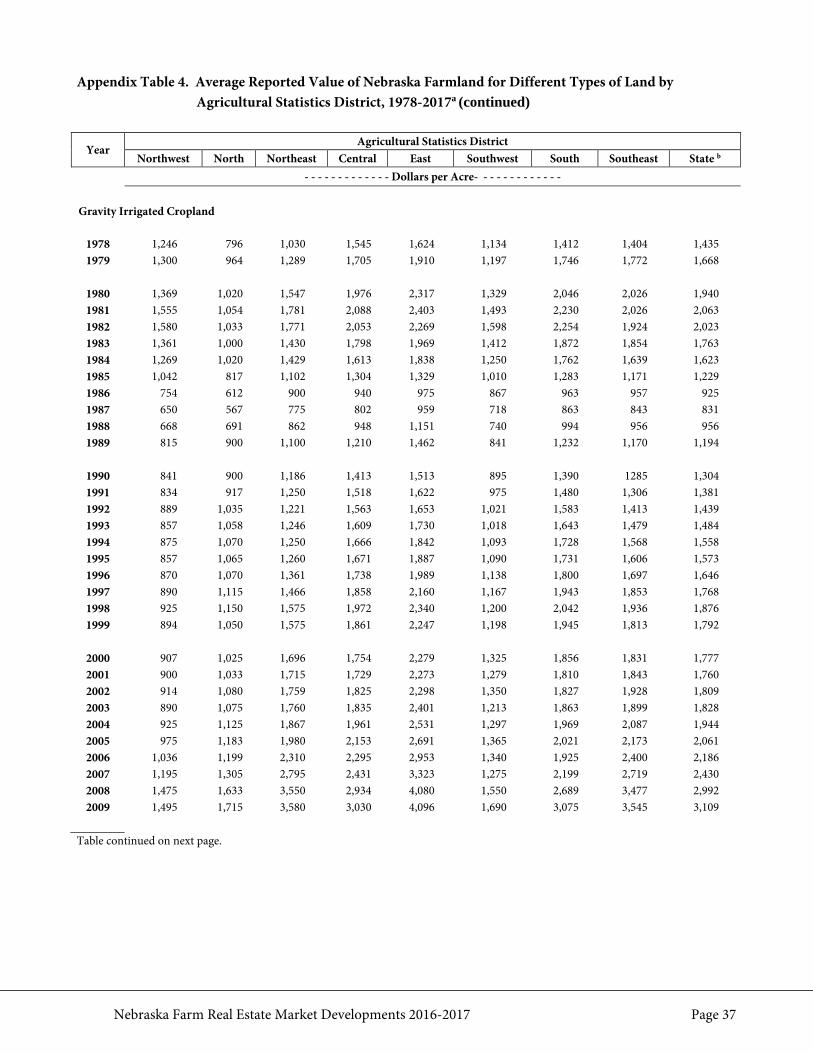
Gravity Irrigated Cropland
1978 1,246 796 1,030 1,545 1,624 1,134 1,412 1,404 1,435 1979 1,300 964 1,289 1,705 1,910 1,197 1,746 1,772 1,668
1980 1,369 1,020 1,547 1,976 2,317 1,329 2,046 2,026 1,940 1981 1,555 1,054 1,781 2,088 2,403 1,493 2,230 2,026 2,063 1982 1,580 1,033 1,771 2,053 2,269 1,598 2,254 1,924 2,023 1983 1,361 1,000 1,430 1,798 1,969 1,412 1,872 1,854 1,763 1984 1,269 1,020 1,429 1,613 1,838 1,250 1,762 1,639 1,623 1985 1,042 817 1,102 1,304 1,329 1,010 1,283 1,171 1,229 1986 754 612 900 940 975 867 963 957 925 1987 650 567 775 802 959 718 863 843 831 1988 668 691 862 948 1,151 740 994 956 956 1989 815 900 1,100 1,210 1,462 841 1,232 1,170 1,194
1990 841 900 1,186 1,413 1,513 895 1,390 1285 1,304 1991 834 917 1,250 1,518 1,622 975 1,480 1,306 1,381 1992 889 1,035 1,221 1,563 1,653 1,021 1,583 1,413 1,439 1993 857 1,058 1,246 1,609 1,730 1,018 1,643 1,479 1,484 1994 875 1,070 1,250 1,666 1,842 1,093 1,728 1,568 1,558 1995 857 1,065 1,260 1,671 1,887 1,090 1,731 1,606 1,573 1996 870 1,070 1,361 1,738 1,989 1,138 1,800 1,697 1,646 1997 890 1,115 1,466 1,858 2,160 1,167 1,943 1,853 1,768 1998 925 1,150 1,575 1,972 2,340 1,200 2,042 1,936 1,876 1999 894 1,050 1,575 1,861 2,247 1,198 1,945 1,813 1,792
2000 907 1,025 1,696 1,754 2,279 1,325 1,856 1,831 1,777 2001 900 1,033 1,715 1,729 2,273 1,279 1,810 1,843 1,760 2002 914 1,080 1,759 1,825 2,298 1,350 1,827 1,928 1,809 2003 890 1,075 1,760 1,835 2,401 1,213 1,863 1,899 1,828 2004 925 1,125 1,867 1,961 2,531 1,297 1,969 2,087 1,944 2005 975 1,183 1,980 2,153 2,691 1,365 2,021 2,173 2,061 2006 1,036 1,199 2,310 2,295 2,953 1,340 1,925 2,400 2,186 2007 1,195 1,305 2,795 2,431 3,323 1,275 2,199 2,719 2,430 2008 1,475 1,633 3,550 2,934 4,080 1,550 2,689 3,477 2,992 2009 1,495 1,715 3,580 3,030 4,096 1,690 3,075 3,545 3,109
Table continued on next page.
Nebraska Farm Real Estate Market Developments 2016-2017 Page 38
Appendix Table 4. Average Reported Value of Nebraska Farmland for Different Types of Land by Agricultural Statistics District, 1978-2017a (continued)
Year Agricultural Statistics District
Northwest North Northeast Central East Southwest South Southeast State b - - - - - - - - - - - - - Dollars per Acre- - - - - - - - - - - - -
Gravity Irrigated Cropland
2010 1,625 1,800 3,715 3,155 4,510 1,785 3,095 3,560 3,271 2011 1,980 2,050 4,500 3,940 5,725 1,975 3,940 4,300 4,071 2012 2,440 2,625 6,250 5,215 7,420 2,865 5,170 5,800 5,365 2013 2,875 3,100 7,850 6,900 8,750 3,850 7,060 7,715 6,835 2014 3,040 4,215 7,455 8,065 8,750 4,515 7,290 8,330 7,310 2015 3,235 4,135 7,355 6,905 8,445 4,435 7,095 7,995 6,900 2016 2,970 3,970 7,220 6,560 8,115 4,390 6,265 7,375 6,480 2017 2,580 3,835 6,890 6,195 7,640 4,155 6,020 6,615 6,070
Table continued on next page.
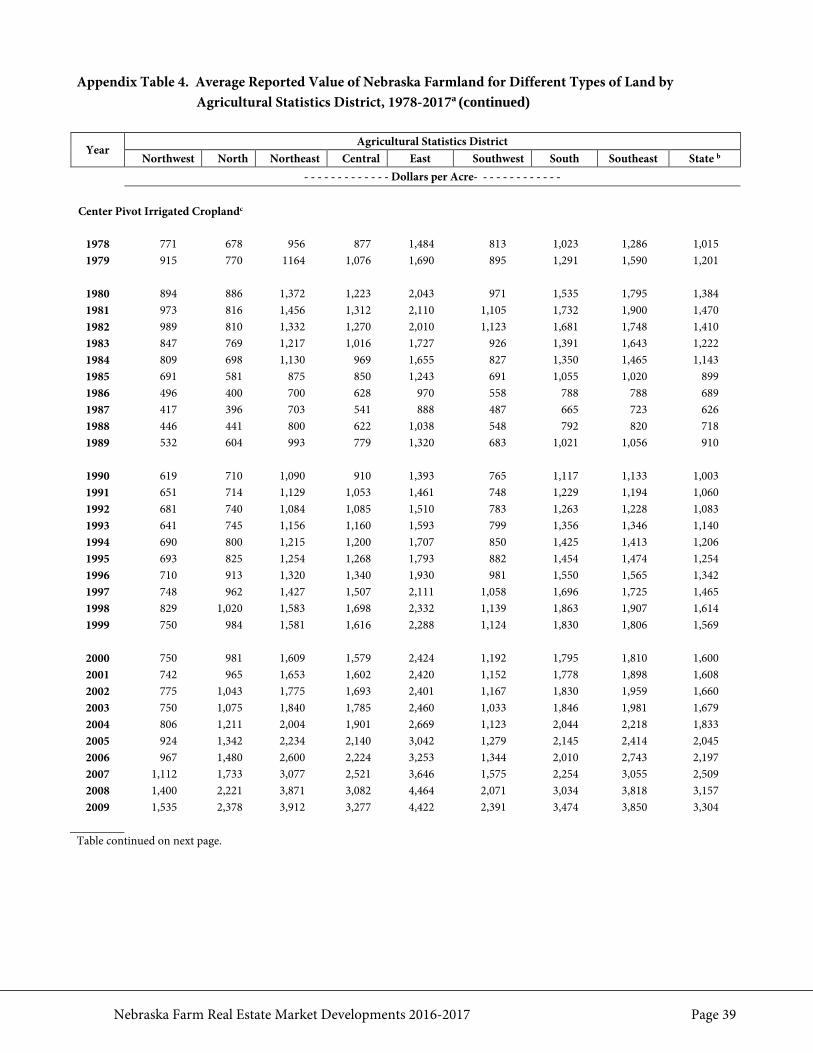
Nebraska Farm Real Estate Market Developments 2016-2017 Page 39
Appendix Table 4. Average Reported Value of Nebraska Farmland for Different Types of Land by Agricultural Statistics District, 1978-2017a (continued)
Year Agricultural Statistics District
Northwest North Northeast Central East Southwest South Southeast State b - - - - - - - - - - - - - Dollars per Acre- - - - - - - - - - - - -
Center Pivot Irrigated Croplandc
1978 771 678 956 877 1,484 813 1,023 1,286 1,015 1979 915 770 1164 1,076 1,690 895 1,291 1,590 1,201
1980 894 886 1,372 1,223 2,043 971 1,535 1,795 1,384 1981 973 816 1,456 1,312 2,110 1,105 1,732 1,900 1,470 1982 989 810 1,332 1,270 2,010 1,123 1,681 1,748 1,410 1983 847 769 1,217 1,016 1,727 926 1,391 1,643 1,222 1984 809 698 1,130 969 1,655 827 1,350 1,465 1,143 1985 691 581 875 850 1,243 691 1,055 1,020 899 1986 496 400 700 628 970 558 788 788 689 1987 417 396 703 541 888 487 665 723 626 1988 446 441 800 622 1,038 548 792 820 718 1989 532 604 993 779 1,320 683 1,021 1,056 910
1990 619 710 1,090 910 1,393 765 1,117 1,133 1,003 1991 651 714 1,129 1,053 1,461 748 1,229 1,194 1,060 1992 681 740 1,084 1,085 1,510 783 1,263 1,228 1,083 1993 641 745 1,156 1,160 1,593 799 1,356 1,346 1,140 1994 690 800 1,215 1,200 1,707 850 1,425 1,413 1,206 1995 693 825 1,254 1,268 1,793 882 1,454 1,474 1,254 1996 710 913 1,320 1,340 1,930 981 1,550 1,565 1,342 1997 748 962 1,427 1,507 2,111 1,058 1,696 1,725 1,465 1998 829 1,020 1,583 1,698 2,332 1,139 1,863 1,907 1,614 1999 750 984 1,581 1,616 2,288 1,124 1,830 1,806 1,569
2000 750 981 1,609 1,579 2,424 1,192 1,795 1,810 1,600 2001 742 965 1,653 1,602 2,420 1,152 1,778 1,898 1,608 2002 775 1,043 1,775 1,693 2,401 1,167 1,830 1,959 1,660 2003 750 1,075 1,840 1,785 2,460 1,033 1,846 1,981 1,679 2004 806 1,211 2,004 1,901 2,669 1,123 2,044 2,218 1,833 2005 924 1,342 2,234 2,140 3,042 1,279 2,145 2,414 2,045 2006 967 1,480 2,600 2,224 3,253 1,344 2,010 2,743 2,197 2007 1,112 1,733 3,077 2,521 3,646 1,575 2,254 3,055 2,509 2008 1,400 2,221 3,871 3,082 4,464 2,071 3,034 3,818 3,157 2009 1,535 2,378 3,912 3,277 4,422 2,391 3,474 3,850 3,304
Table continued on next page.

Nebraska Farm Real Estate Market Developments 2016-2017 Page 40
Appendix Table 4. Average Reported Value of Nebraska Farmland for Different Types of Land by Agricultural Statistics District, 1978-2017a (continued)
Year Agricultural Statistics District
Northwest North Northeast Central East Southwest South Southeast State b - - - - - - - - - - - - - Dollars per Acre- - - - - - - - - - - - -
Center Pivot Irrigated Croplandc
2010 1,650 2,485 4,140 3,470 4,890 2,475 3,575 4,125 3,520 2011 1,975 2,955 5,100 4,530 6,175 2,760 4,470 5,020 4,343 2012 2,535 3,970 7,100 6,190 7,950 3,830 5,925 6,820 5,835 2013 3,115 5,225 8,715 8,120 10,025 5,200 8,350 9,400 7,590 2014 3,700 4,985 8,855 8,940 9,860 5,750 8,440 9,760 7,685 2015 3,625 4,835 8,150 7,825 9,575 5,790 8,270 9,425 7,315 2016 3,290 4,350 7,880 7,530 9,410 5,330 7,240 9,185 6,940 2017 2,815 4,150 7,445 6,885 8,700 4,510 6,700 7,820 6,295
Table continued on next page.
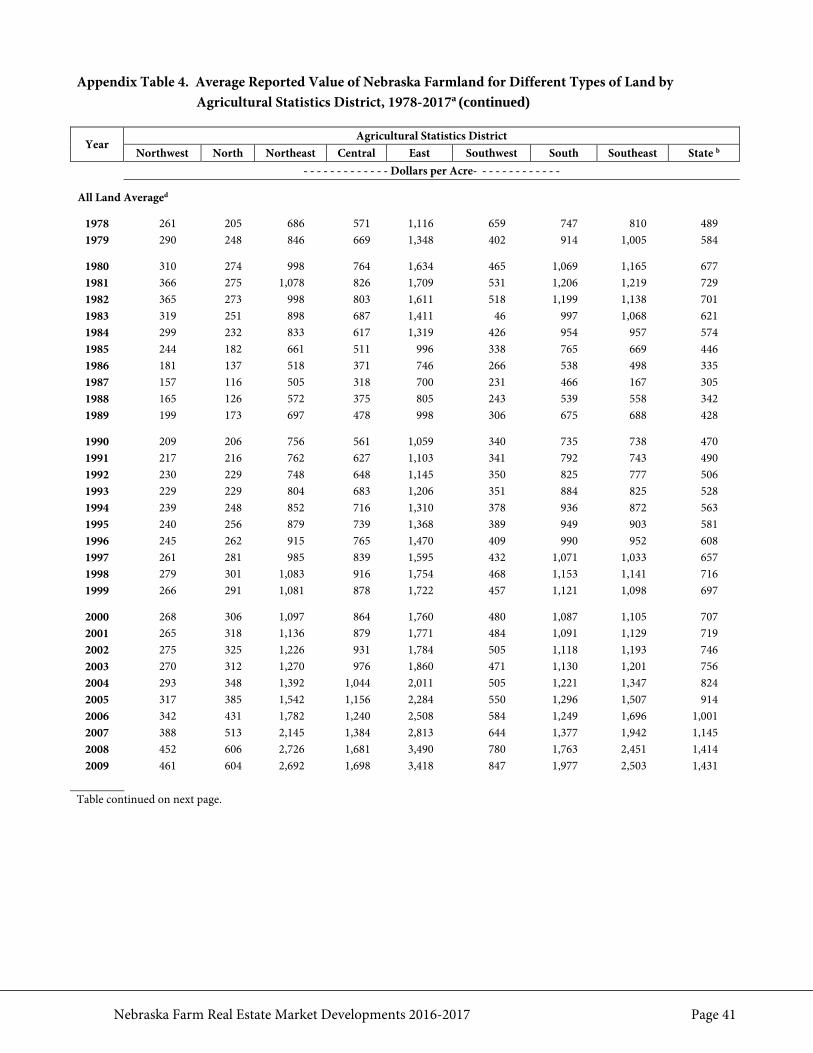
Nebraska Farm Real Estate Market Developments 2016-2017 Page 41
Appendix Table 4. Average Reported Value of Nebraska Farmland for Different Types of Land by Agricultural Statistics District, 1978-2017a (continued)
Year Agricultural Statistics District
Northwest North Northeast Central East Southwest South Southeast State b - - - - - - - - - - - - - Dollars per Acre- - - - - - - - - - - - -
All Land Averaged
1978 261 205 686 571 1,116 659 747 810 489 1979 290 248 846 669 1,348 402 914 1,005 584
1980 310 274 998 764 1,634 465 1,069 1,165 677 1981 366 275 1,078 826 1,709 531 1,206 1,219 729 1982 365 273 998 803 1,611 518 1,199 1,138 701 1983 319 251 898 687 1,411 46 997 1,068 621 1984 299 232 833 617 1,319 426 954 957 574 1985 244 182 661 511 996 338 765 669 446 1986 181 137 518 371 746 266 538 498 335 1987 157 116 505 318 700 231 466 167 305 1988 165 126 572 375 805 243 539 558 342 1989 199 173 697 478 998 306 675 688 428
1990 209 206 756 561 1,059 340 735 738 470 1991 217 216 762 627 1,103 341 792 743 490 1992 230 229 748 648 1,145 350 825 777 506 1993 229 229 804 683 1,206 351 884 825 528 1994 239 248 852 716 1,310 378 936 872 563 1995 240 256 879 739 1,368 389 949 903 581 1996 245 262 915 765 1,470 409 990 952 608 1997 261 281 985 839 1,595 432 1,071 1,033 657 1998 279 301 1,083 916 1,754 468 1,153 1,141 716 1999 266 291 1,081 878 1,722 457 1,121 1,098 697
2000 268 306 1,097 864 1,760 480 1,087 1,105 707 2001 265 318 1,136 879 1,771 484 1,091 1,129 719 2002 275 325 1,226 931 1,784 505 1,118 1,193 746 2003 270 312 1,270 976 1,860 471 1,130 1,201 756 2004 293 348 1,392 1,044 2,011 505 1,221 1,347 824 2005 317 385 1,542 1,156 2,284 550 1,296 1,507 914 2006 342 431 1,782 1,240 2,508 584 1,249 1,696 1,001 2007 388 513 2,145 1,384 2,813 644 1,377 1,942 1,145 2008 452 606 2,726 1,681 3,490 780 1,763 2,451 1,414 2009 461 604 2,692 1,698 3,418 847 1,977 2,503 1,431
Table continued on next page.
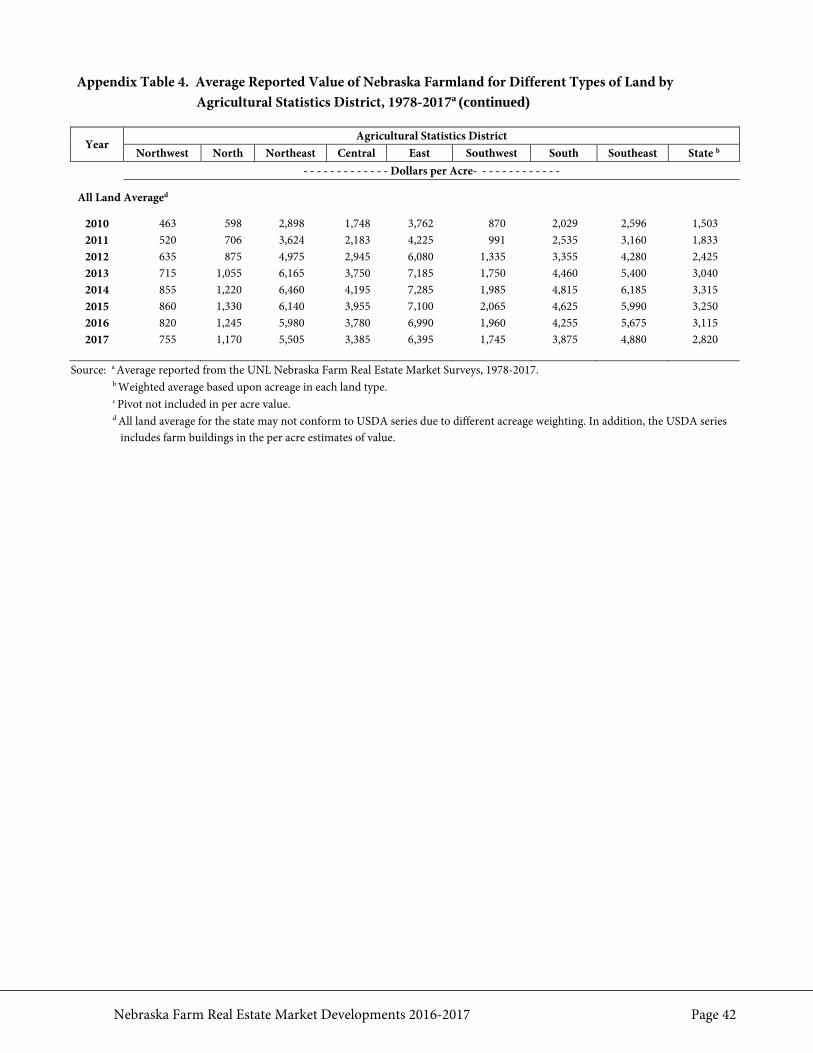
Nebraska Farm Real Estate Market Developments 2016-2017 Page 42
Appendix Table 4. Average Reported Value of Nebraska Farmland for Different Types of Land by Agricultural Statistics District, 1978-2017a (continued)
Year Agricultural Statistics District
Northwest North Northeast Central East Southwest South Southeast State b - - - - - - - - - - - - - Dollars per Acre- - - - - - - - - - - - -
All Land Averaged
2010 463 598 2,898 1,748 3,762 870 2,029 2,596 1,503 2011 520 706 3,624 2,183 4,225 991 2,535 3,160 1,833 2012 635 875 4,975 2,945 6,080 1,335 3,355 4,280 2,425 2013 715 1,055 6,165 3,750 7,185 1,750 4,460 5,400 3,040 2014 855 1,220 6,460 4,195 7,285 1,985 4,815 6,185 3,315 2015 860 1,330 6,140 3,955 7,100 2,065 4,625 5,990 3,250 2016 820 1,245 5,980 3,780 6,990 1,960 4,255 5,675 3,115 2017 755 1,170 5,505 3,385 6,395 1,745 3,875 4,880 2,820
Source: a Average reported from the UNL Nebraska Farm Real Estate Market Surveys, 1978-2017. b Weighted average based upon acreage in each land type. c Pivot not included in per acre value. d All land average for the state may not conform to USDA series due to different acreage weighting. In addition, the USDA series
includes farm buildings in the per acre estimates of value.
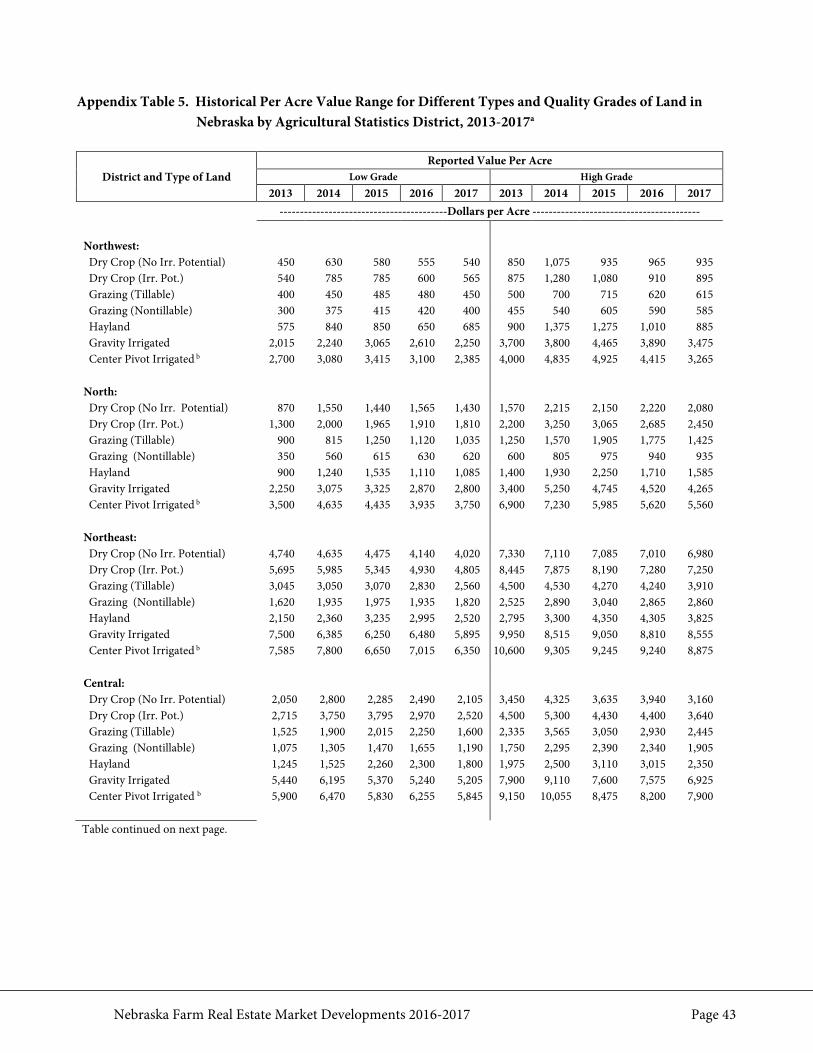
Nebraska Farm Real Estate Market Developments 2016-2017 Page 43
Appendix Table 5. Historical Per Acre Value Range for Different Types and Quality Grades of Land in
Nebraska by Agricultural Statistics District, 2013-2017a
District and Type of Land Reported Value Per Acre
Low Grade High Grade 2013 2014 2015 2016 2017 2013 2014 2015 2016 2017
-----------------------------------------Dollars per Acre ----------------------------------------- Northwest: Dry Crop (No Irr. Potential) 450 630 580 555 540 850 1,075 935 965 935 Dry Crop (Irr. Pot.) 540 785 785 600 565 875 1,280 1,080 910 895 Grazing (Tillable) 400 450 485 480 450 500 700 715 620 615 Grazing (Nontillable) 300 375 415 420 400 455 540 605 590 585 Hayland 575 840 850 650 685 900 1,375 1,275 1,010 885 Gravity Irrigated 2,015 2,240 3,065 2,610 2,250 3,700 3,800 4,465 3,890 3,475 Center Pivot Irrigated b 2,700 3,080 3,415 3,100 2,385 4,000 4,835 4,925 4,415 3,265 North: Dry Crop (No Irr. Potential) 870 1,550 1,440 1,565 1,430 1,570 2,215 2,150 2,220 2,080 Dry Crop (Irr. Pot.) 1,300 2,000 1,965 1,910 1,810 2,200 3,250 3,065 2,685 2,450 Grazing (Tillable) 900 815 1,250 1,120 1,035 1,250 1,570 1,905 1,775 1,425 Grazing (Nontillable) 350 560 615 630 620 600 805 975 940 935 Hayland 900 1,240 1,535 1,110 1,085 1,400 1,930 2,250 1,710 1,585 Gravity Irrigated 2,250 3,075 3,325 2,870 2,800 3,400 5,250 4,745 4,520 4,265 Center Pivot Irrigated b 3,500 4,635 4,435 3,935 3,750 6,900 7,230 5,985 5,620 5,560 Northeast: Dry Crop (No Irr. Potential) 4,740 4,635 4,475 4,140 4,020 7,330 7,110 7,085 7,010 6,980 Dry Crop (Irr. Pot.) 5,695 5,985 5,345 4,930 4,805 8,445 7,875 8,190 7,280 7,250 Grazing (Tillable) 3,045 3,050 3,070 2,830 2,560 4,500 4,530 4,270 4,240 3,910 Grazing (Nontillable) 1,620 1,935 1,975 1,935 1,820 2,525 2,890 3,040 2,865 2,860 Hayland 2,150 2,360 3,235 2,995 2,520 2,795 3,300 4,350 4,305 3,825 Gravity Irrigated 7,500 6,385 6,250 6,480 5,895 9,950 8,515 9,050 8,810 8,555 Center Pivot Irrigated b 7,585 7,800 6,650 7,015 6,350 10,600 9,305 9,245 9,240 8,875 Central: Dry Crop (No Irr. Potential) 2,050 2,800 2,285 2,490 2,105 3,450 4,325 3,635 3,940 3,160 Dry Crop (Irr. Pot.) 2,715 3,750 3,795 2,970 2,520 4,500 5,300 4,430 4,400 3,640 Grazing (Tillable) 1,525 1,900 2,015 2,250 1,600 2,335 3,565 3,050 2,930 2,445 Grazing (Nontillable) 1,075 1,305 1,470 1,655 1,190 1,750 2,295 2,390 2,340 1,905 Hayland 1,245 1,525 2,260 2,300 1,800 1,975 2,500 3,110 3,015 2,350 Gravity Irrigated 5,440 6,195 5,370 5,240 5,205 7,900 9,110 7,600 7,575 6,925 Center Pivot Irrigated b 5,900 6,470 5,830 6,255 5,845 9,150 10,055 8,475 8,200 7,900
Table continued on next page.
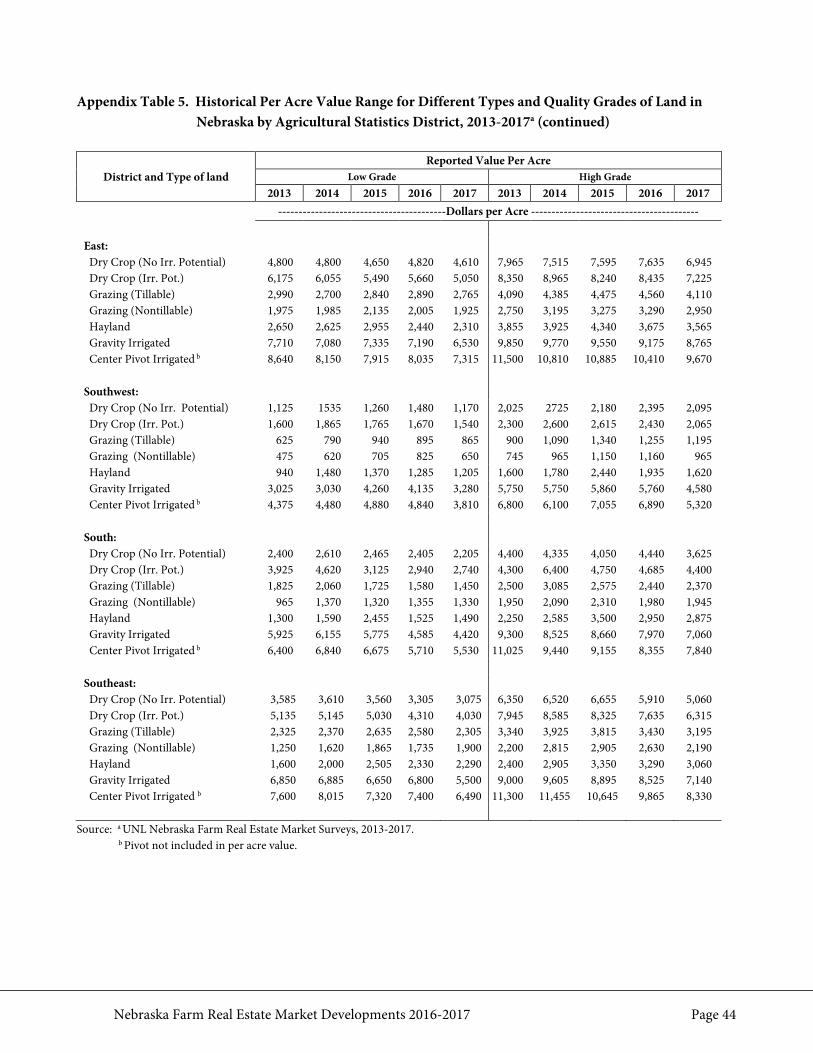
Nebraska Farm Real Estate Market Developments 2016-2017 Page 44
Appendix Table 5. Historical Per Acre Value Range for Different Types and Quality Grades of Land in
Nebraska by Agricultural Statistics District, 2013-2017a (continued)
District and Type of land Reported Value Per Acre
Low Grade High Grade 2013 2014 2015 2016 2017 2013 2014 2015 2016 2017
-----------------------------------------Dollars per Acre ----------------------------------------- East: Dry Crop (No Irr. Potential) 4,800 4,800 4,650 4,820 4,610 7,965 7,515 7,595 7,635 6,945 Dry Crop (Irr. Pot.) 6,175 6,055 5,490 5,660 5,050 8,350 8,965 8,240 8,435 7,225 Grazing (Tillable) 2,990 2,700 2,840 2,890 2,765 4,090 4,385 4,475 4,560 4,110 Grazing (Nontillable) 1,975 1,985 2,135 2,005 1,925 2,750 3,195 3,275 3,290 2,950 Hayland 2,650 2,625 2,955 2,440 2,310 3,855 3,925 4,340 3,675 3,565 Gravity Irrigated 7,710 7,080 7,335 7,190 6,530 9,850 9,770 9,550 9,175 8,765 Center Pivot Irrigated b 8,640 8,150 7,915 8,035 7,315 11,500 10,810 10,885 10,410 9,670 Southwest: Dry Crop (No Irr. Potential) 1,125 1535 1,260 1,480 1,170 2,025 2725 2,180 2,395 2,095 Dry Crop (Irr. Pot.) 1,600 1,865 1,765 1,670 1,540 2,300 2,600 2,615 2,430 2,065 Grazing (Tillable) 625 790 940 895 865 900 1,090 1,340 1,255 1,195 Grazing (Nontillable) 475 620 705 825 650 745 965 1,150 1,160 965 Hayland 940 1,480 1,370 1,285 1,205 1,600 1,780 2,440 1,935 1,620 Gravity Irrigated 3,025 3,030 4,260 4,135 3,280 5,750 5,750 5,860 5,760 4,580 Center Pivot Irrigated b 4,375 4,480 4,880 4,840 3,810 6,800 6,100 7,055 6,890 5,320 South: Dry Crop (No Irr. Potential) 2,400 2,610 2,465 2,405 2,205 4,400 4,335 4,050 4,440 3,625 Dry Crop (Irr. Pot.) 3,925 4,620 3,125 2,940 2,740 4,300 6,400 4,750 4,685 4,400 Grazing (Tillable) 1,825 2,060 1,725 1,580 1,450 2,500 3,085 2,575 2,440 2,370 Grazing (Nontillable) 965 1,370 1,320 1,355 1,330 1,950 2,090 2,310 1,980 1,945 Hayland 1,300 1,590 2,455 1,525 1,490 2,250 2,585 3,500 2,950 2,875 Gravity Irrigated 5,925 6,155 5,775 4,585 4,420 9,300 8,525 8,660 7,970 7,060 Center Pivot Irrigated b 6,400 6,840 6,675 5,710 5,530 11,025 9,440 9,155 8,355 7,840 Southeast: Dry Crop (No Irr. Potential) 3,585 3,610 3,560 3,305 3,075 6,350 6,520 6,655 5,910 5,060 Dry Crop (Irr. Pot.) 5,135 5,145 5,030 4,310 4,030 7,945 8,585 8,325 7,635 6,315 Grazing (Tillable) 2,325 2,370 2,635 2,580 2,305 3,340 3,925 3,815 3,430 3,195 Grazing (Nontillable) 1,250 1,620 1,865 1,735 1,900 2,200 2,815 2,905 2,630 2,190 Hayland 1,600 2,000 2,505 2,330 2,290 2,400 2,905 3,350 3,290 3,060 Gravity Irrigated 6,850 6,885 6,650 6,800 5,500 9,000 9,605 8,895 8,525 7,140 Center Pivot Irrigated b 7,600 8,015 7,320 7,400 6,490 11,300 11,455 10,645 9,865 8,330
Source: a UNL Nebraska Farm Real Estate Market Surveys, 2013-2017. b Pivot not included in per acre value.
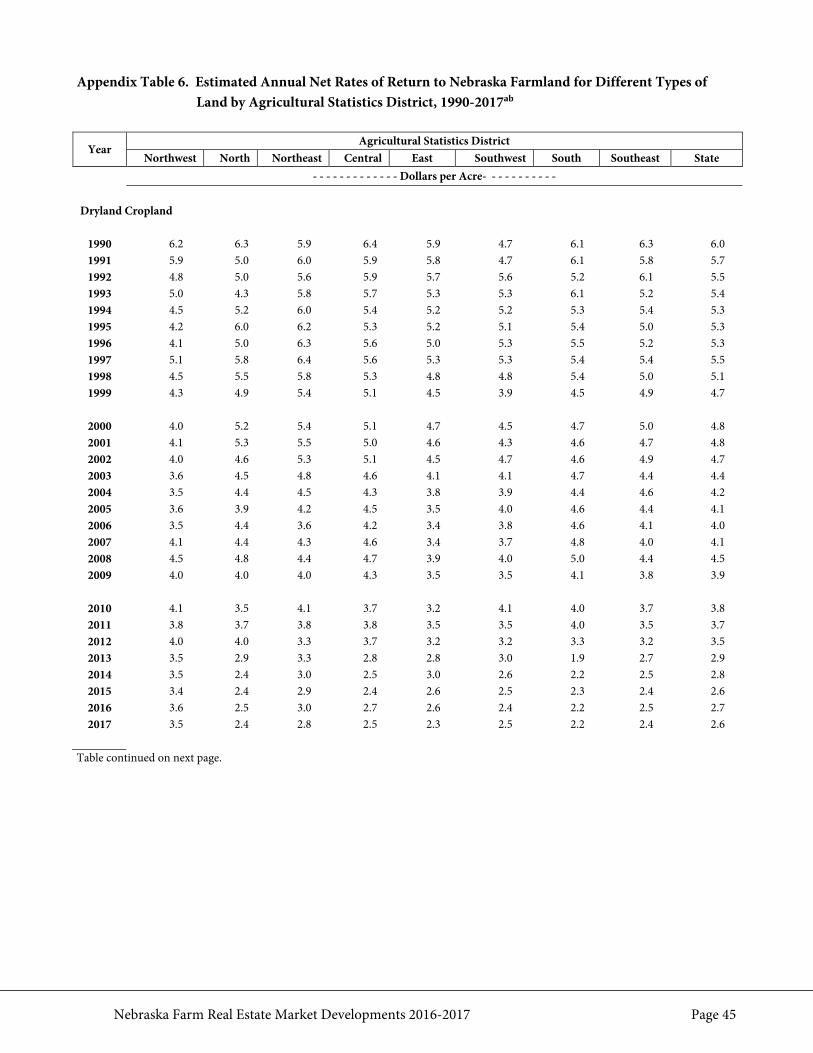
Nebraska Farm Real Estate Market Developments 2016-2017 Page 45
Appendix Table 6. Estimated Annual Net Rates of Return to Nebraska Farmland for Different Types of Land by Agricultural Statistics District, 1990-2017ab
Year Agricultural Statistics District
Northwest North Northeast Central East Southwest South Southeast State - - - - - - - - - - - - - Dollars per Acre- - - - - - - - - - -
Dryland Cropland
1990 6.2 6.3 5.9 6.4 5.9 4.7 6.1 6.3 6.0 1991 5.9 5.0 6.0 5.9 5.8 4.7 6.1 5.8 5.7 1992 4.8 5.0 5.6 5.9 5.7 5.6 5.2 6.1 5.5 1993 5.0 4.3 5.8 5.7 5.3 5.3 6.1 5.2 5.4 1994 4.5 5.2 6.0 5.4 5.2 5.2 5.3 5.4 5.3 1995 4.2 6.0 6.2 5.3 5.2 5.1 5.4 5.0 5.3 1996 4.1 5.0 6.3 5.6 5.0 5.3 5.5 5.2 5.3 1997 5.1 5.8 6.4 5.6 5.3 5.3 5.4 5.4 5.5 1998 4.5 5.5 5.8 5.3 4.8 4.8 5.4 5.0 5.1 1999 4.3 4.9 5.4 5.1 4.5 3.9 4.5 4.9 4.7
2000 4.0 5.2 5.4 5.1 4.7 4.5 4.7 5.0 4.8 2001 4.1 5.3 5.5 5.0 4.6 4.3 4.6 4.7 4.8 2002 4.0 4.6 5.3 5.1 4.5 4.7 4.6 4.9 4.7 2003 3.6 4.5 4.8 4.6 4.1 4.1 4.7 4.4 4.4 2004 3.5 4.4 4.5 4.3 3.8 3.9 4.4 4.6 4.2 2005 3.6 3.9 4.2 4.5 3.5 4.0 4.6 4.4 4.1 2006 3.5 4.4 3.6 4.2 3.4 3.8 4.6 4.1 4.0 2007 4.1 4.4 4.3 4.6 3.4 3.7 4.8 4.0 4.1 2008 4.5 4.8 4.4 4.7 3.9 4.0 5.0 4.4 4.5 2009 4.0 4.0 4.0 4.3 3.5 3.5 4.1 3.8 3.9
2010 4.1 3.5 4.1 3.7 3.2 4.1 4.0 3.7 3.8 2011 3.8 3.7 3.8 3.8 3.5 3.5 4.0 3.5 3.7 2012 4.0 4.0 3.3 3.7 3.2 3.2 3.3 3.2 3.5 2013 3.5 2.9 3.3 2.8 2.8 3.0 1.9 2.7 2.9 2014 3.5 2.4 3.0 2.5 3.0 2.6 2.2 2.5 2.8 2015 3.4 2.4 2.9 2.4 2.6 2.5 2.3 2.4 2.6 2016 3.6 2.5 3.0 2.7 2.6 2.4 2.2 2.5 2.7 2017 3.5 2.4 2.8 2.5 2.3 2.5 2.2 2.4 2.6
Table continued on next page.
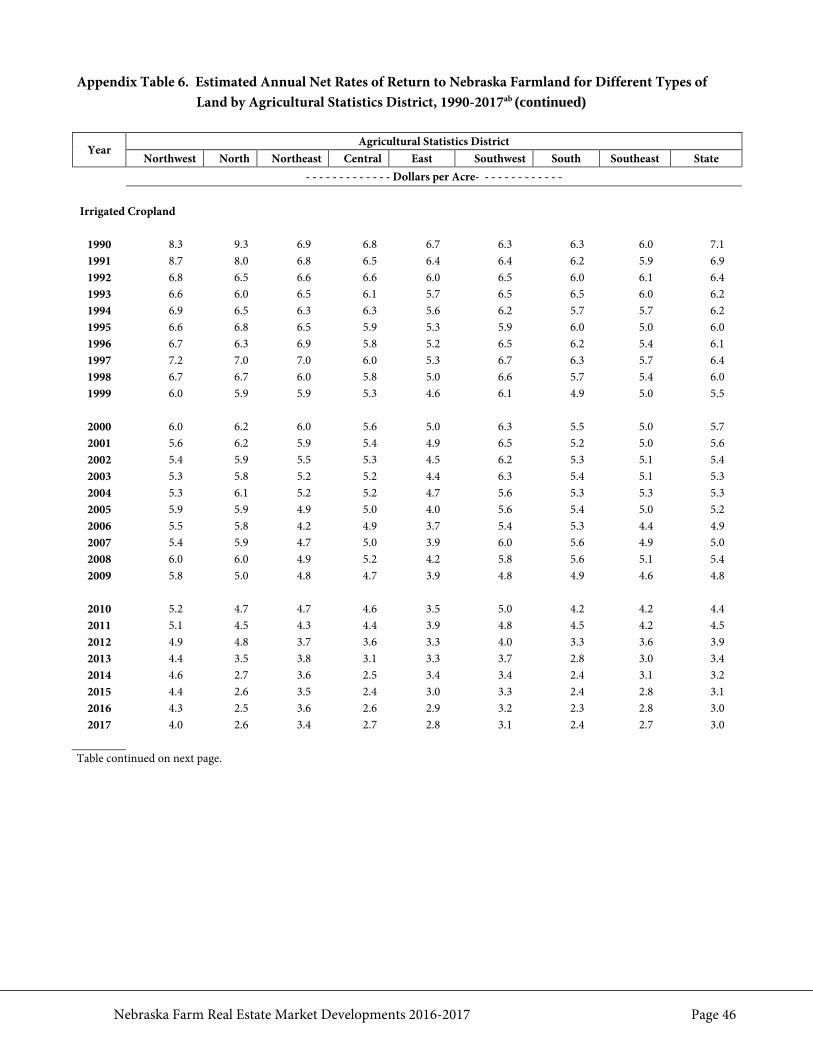
Nebraska Farm Real Estate Market Developments 2016-2017 Page 46
Appendix Table 6. Estimated Annual Net Rates of Return to Nebraska Farmland for Different Types of Land by Agricultural Statistics District, 1990-2017ab (continued)
Year Agricultural Statistics District
Northwest North Northeast Central East Southwest South Southeast State - - - - - - - - - - - - - Dollars per Acre- - - - - - - - - - - - -
Irrigated Cropland
1990 8.3 9.3 6.9 6.8 6.7 6.3 6.3 6.0 7.1 1991 8.7 8.0 6.8 6.5 6.4 6.4 6.2 5.9 6.9 1992 6.8 6.5 6.6 6.6 6.0 6.5 6.0 6.1 6.4 1993 6.6 6.0 6.5 6.1 5.7 6.5 6.5 6.0 6.2 1994 6.9 6.5 6.3 6.3 5.6 6.2 5.7 5.7 6.2 1995 6.6 6.8 6.5 5.9 5.3 5.9 6.0 5.0 6.0 1996 6.7 6.3 6.9 5.8 5.2 6.5 6.2 5.4 6.1 1997 7.2 7.0 7.0 6.0 5.3 6.7 6.3 5.7 6.4 1998 6.7 6.7 6.0 5.8 5.0 6.6 5.7 5.4 6.0 1999 6.0 5.9 5.9 5.3 4.6 6.1 4.9 5.0 5.5
2000 6.0 6.2 6.0 5.6 5.0 6.3 5.5 5.0 5.7 2001 5.6 6.2 5.9 5.4 4.9 6.5 5.2 5.0 5.6 2002 5.4 5.9 5.5 5.3 4.5 6.2 5.3 5.1 5.4 2003 5.3 5.8 5.2 5.2 4.4 6.3 5.4 5.1 5.3 2004 5.3 6.1 5.2 5.2 4.7 5.6 5.3 5.3 5.3 2005 5.9 5.9 4.9 5.0 4.0 5.6 5.4 5.0 5.2 2006 5.5 5.8 4.2 4.9 3.7 5.4 5.3 4.4 4.9 2007 5.4 5.9 4.7 5.0 3.9 6.0 5.6 4.9 5.0 2008 6.0 6.0 4.9 5.2 4.2 5.8 5.6 5.1 5.4 2009 5.8 5.0 4.8 4.7 3.9 4.8 4.9 4.6 4.8
2010 5.2 4.7 4.7 4.6 3.5 5.0 4.2 4.2 4.4 2011 5.1 4.5 4.3 4.4 3.9 4.8 4.5 4.2 4.5 2012 4.9 4.8 3.7 3.6 3.3 4.0 3.3 3.6 3.9 2013 4.4 3.5 3.8 3.1 3.3 3.7 2.8 3.0 3.4 2014 4.6 2.7 3.6 2.5 3.4 3.4 2.4 3.1 3.2 2015 4.4 2.6 3.5 2.4 3.0 3.3 2.4 2.8 3.1 2016 4.3 2.5 3.6 2.6 2.9 3.2 2.3 2.8 3.0 2017 4.0 2.6 3.4 2.7 2.8 3.1 2.4 2.7 3.0
Table continued on next page.
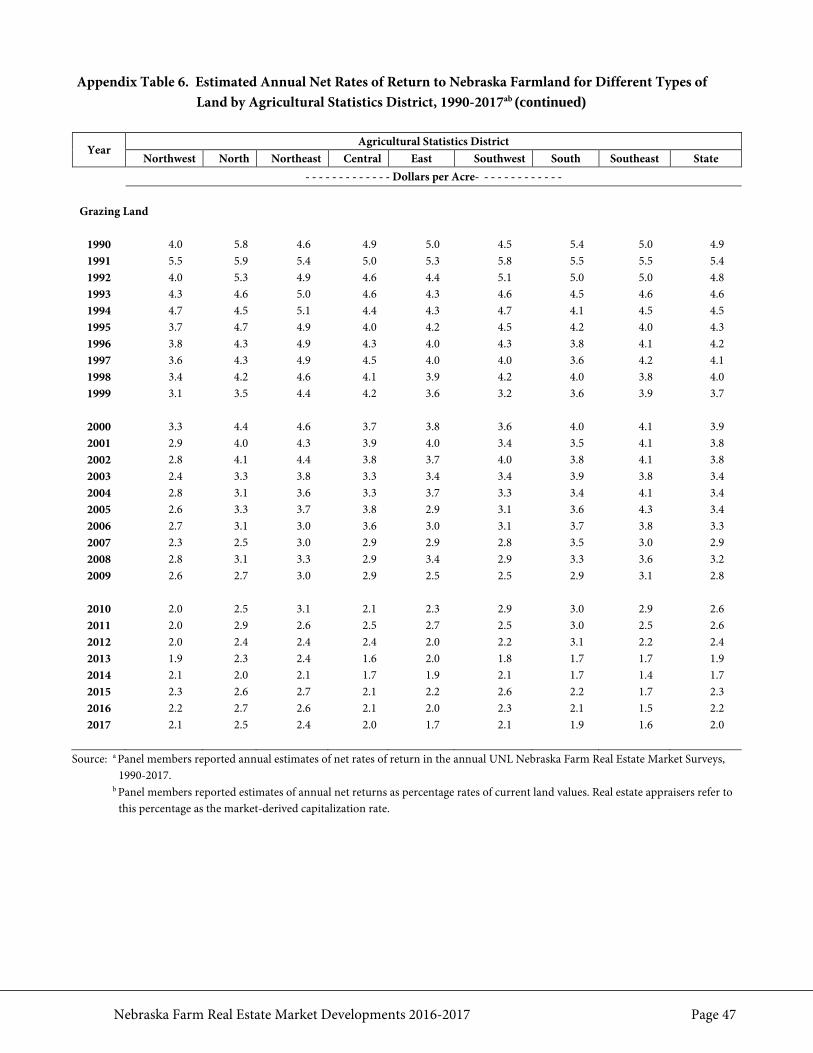
Nebraska Farm Real Estate Market Developments 2016-2017 Page 47
Appendix Table 6. Estimated Annual Net Rates of Return to Nebraska Farmland for Different Types of Land by Agricultural Statistics District, 1990-2017ab (continued)
Year Agricultural Statistics District
Northwest North Northeast Central East Southwest South Southeast State - - - - - - - - - - - - - Dollars per Acre- - - - - - - - - - - - -
Grazing Land
1990 4.0 5.8 4.6 4.9 5.0 4.5 5.4 5.0 4.9 1991 5.5 5.9 5.4 5.0 5.3 5.8 5.5 5.5 5.4 1992 4.0 5.3 4.9 4.6 4.4 5.1 5.0 5.0 4.8 1993 4.3 4.6 5.0 4.6 4.3 4.6 4.5 4.6 4.6 1994 4.7 4.5 5.1 4.4 4.3 4.7 4.1 4.5 4.5 1995 3.7 4.7 4.9 4.0 4.2 4.5 4.2 4.0 4.3 1996 3.8 4.3 4.9 4.3 4.0 4.3 3.8 4.1 4.2 1997 3.6 4.3 4.9 4.5 4.0 4.0 3.6 4.2 4.1 1998 3.4 4.2 4.6 4.1 3.9 4.2 4.0 3.8 4.0 1999 3.1 3.5 4.4 4.2 3.6 3.2 3.6 3.9 3.7
2000 3.3 4.4 4.6 3.7 3.8 3.6 4.0 4.1 3.9 2001 2.9 4.0 4.3 3.9 4.0 3.4 3.5 4.1 3.8 2002 2.8 4.1 4.4 3.8 3.7 4.0 3.8 4.1 3.8 2003 2.4 3.3 3.8 3.3 3.4 3.4 3.9 3.8 3.4 2004 2.8 3.1 3.6 3.3 3.7 3.3 3.4 4.1 3.4 2005 2.6 3.3 3.7 3.8 2.9 3.1 3.6 4.3 3.4 2006 2.7 3.1 3.0 3.6 3.0 3.1 3.7 3.8 3.3 2007 2.3 2.5 3.0 2.9 2.9 2.8 3.5 3.0 2.9 2008 2.8 3.1 3.3 2.9 3.4 2.9 3.3 3.6 3.2 2009 2.6 2.7 3.0 2.9 2.5 2.5 2.9 3.1 2.8
2010 2.0 2.5 3.1 2.1 2.3 2.9 3.0 2.9 2.6 2011 2.0 2.9 2.6 2.5 2.7 2.5 3.0 2.5 2.6 2012 2.0 2.4 2.4 2.4 2.0 2.2 3.1 2.2 2.4 2013 1.9 2.3 2.4 1.6 2.0 1.8 1.7 1.7 1.9 2014 2.1 2.0 2.1 1.7 1.9 2.1 1.7 1.4 1.7 2015 2.3 2.6 2.7 2.1 2.2 2.6 2.2 1.7 2.3 2016 2.2 2.7 2.6 2.1 2.0 2.3 2.1 1.5 2.2 2017 2.1 2.5 2.4 2.0 1.7 2.1 1.9 1.6 2.0
Source: a Panel members reported annual estimates of net rates of return in the annual UNL Nebraska Farm Real Estate Market Surveys,
1990-2017. b Panel members reported estimates of annual net returns as percentage rates of current land values. Real estate appraisers refer to
this percentage as the market-derived capitalization rate.
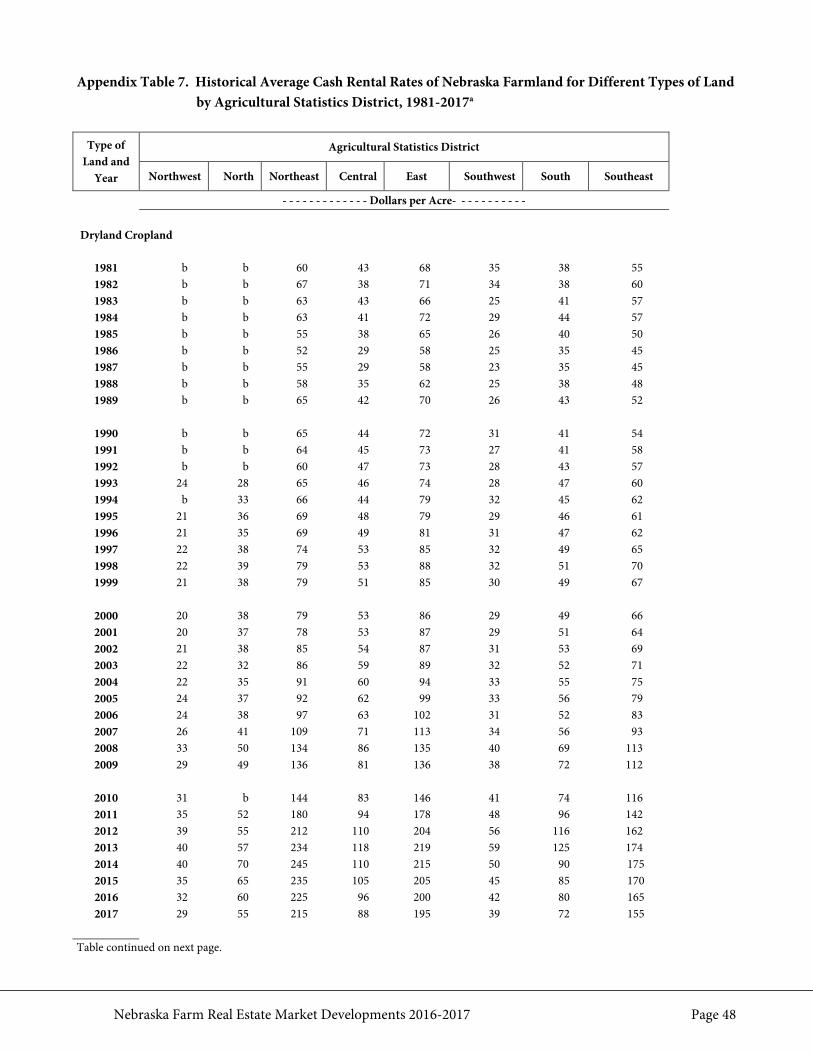
Nebraska Farm Real Estate Market Developments 2016-2017 Page 48
Appendix Table 7. Historical Average Cash Rental Rates of Nebraska Farmland for Different Types of Land by Agricultural Statistics District, 1981-2017a
Type of
Land and Year
Agricultural Statistics District
Northwest North Northeast Central East Southwest South Southeast
- - - - - - - - - - - - - Dollars per Acre- - - - - - - - - - - Dryland Cropland
1981 b b 60 43 68 35 38 55 1982 b b 67 38 71 34 38 60 1983 b b 63 43 66 25 41 57 1984 b b 63 41 72 29 44 57 1985 b b 55 38 65 26 40 50 1986 b b 52 29 58 25 35 45 1987 b b 55 29 58 23 35 45 1988 b b 58 35 62 25 38 48 1989 b b 65 42 70 26 43 52
1990 b b 65 44 72 31 41 54 1991 b b 64 45 73 27 41 58 1992 b b 60 47 73 28 43 57 1993 24 28 65 46 74 28 47 60 1994 b 33 66 44 79 32 45 62 1995 21 36 69 48 79 29 46 61 1996 21 35 69 49 81 31 47 62 1997 22 38 74 53 85 32 49 65 1998 22 39 79 53 88 32 51 70 1999 21 38 79 51 85 30 49 67
2000 20 38 79 53 86 29 49 66 2001 20 37 78 53 87 29 51 64 2002 21 38 85 54 87 31 53 69 2003 22 32 86 59 89 32 52 71 2004 22 35 91 60 94 33 55 75 2005 24 37 92 62 99 33 56 79 2006 24 38 97 63 102 31 52 83 2007 26 41 109 71 113 34 56 93 2008 33 50 134 86 135 40 69 113 2009 29 49 136 81 136 38 72 112
2010 31 b 144 83 146 41 74 116 2011 35 52 180 94 178 48 96 142 2012 39 55 212 110 204 56 116 162 2013 40 57 234 118 219 59 125 174 2014 40 70 245 110 215 50 90 175 2015 35 65 235 105 205 45 85 170 2016 32 60 225 96 200 42 80 165 2017 29 55 215 88 195 39 72 155
Table continued on next page.
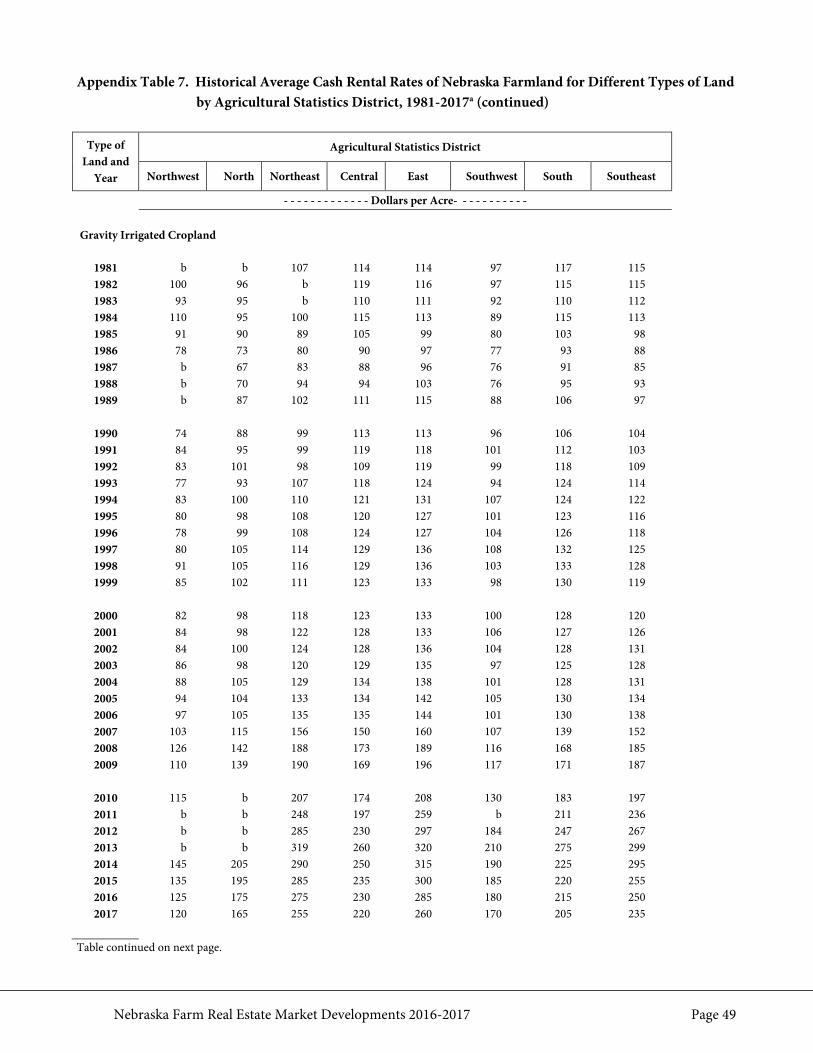
Nebraska Farm Real Estate Market Developments 2016-2017 Page 49
Appendix Table 7. Historical Average Cash Rental Rates of Nebraska Farmland for Different Types of Land by Agricultural Statistics District, 1981-2017a (continued)
Type of
Land and Year
Agricultural Statistics District
Northwest North Northeast Central East Southwest South Southeast
- - - - - - - - - - - - - Dollars per Acre- - - - - - - - - - - Gravity Irrigated Cropland
1981 b b 107 114 114 97 117 115 1982 100 96 b 119 116 97 115 115 1983 93 95 b 110 111 92 110 112 1984 110 95 100 115 113 89 115 113 1985 91 90 89 105 99 80 103 98 1986 78 73 80 90 97 77 93 88 1987 b 67 83 88 96 76 91 85 1988 b 70 94 94 103 76 95 93 1989 b 87 102 111 115 88 106 97
1990 74 88 99 113 113 96 106 104 1991 84 95 99 119 118 101 112 103 1992 83 101 98 109 119 99 118 109 1993 77 93 107 118 124 94 124 114 1994 83 100 110 121 131 107 124 122 1995 80 98 108 120 127 101 123 116 1996 78 99 108 124 127 104 126 118 1997 80 105 114 129 136 108 132 125 1998 91 105 116 129 136 103 133 128 1999 85 102 111 123 133 98 130 119
2000 82 98 118 123 133 100 128 120 2001 84 98 122 128 133 106 127 126 2002 84 100 124 128 136 104 128 131 2003 86 98 120 129 135 97 125 128 2004 88 105 129 134 138 101 128 131 2005 94 104 133 134 142 105 130 134 2006 97 105 135 135 144 101 130 138 2007 103 115 156 150 160 107 139 152 2008 126 142 188 173 189 116 168 185 2009 110 139 190 169 196 117 171 187
2010 115 b 207 174 208 130 183 197 2011 b b 248 197 259 b 211 236 2012 b b 285 230 297 184 247 267 2013 b b 319 260 320 210 275 299 2014 145 205 290 250 315 190 225 295 2015 135 195 285 235 300 185 220 255 2016 125 175 275 230 285 180 215 250 2017 120 165 255 220 260 170 205 235
Table continued on next page.
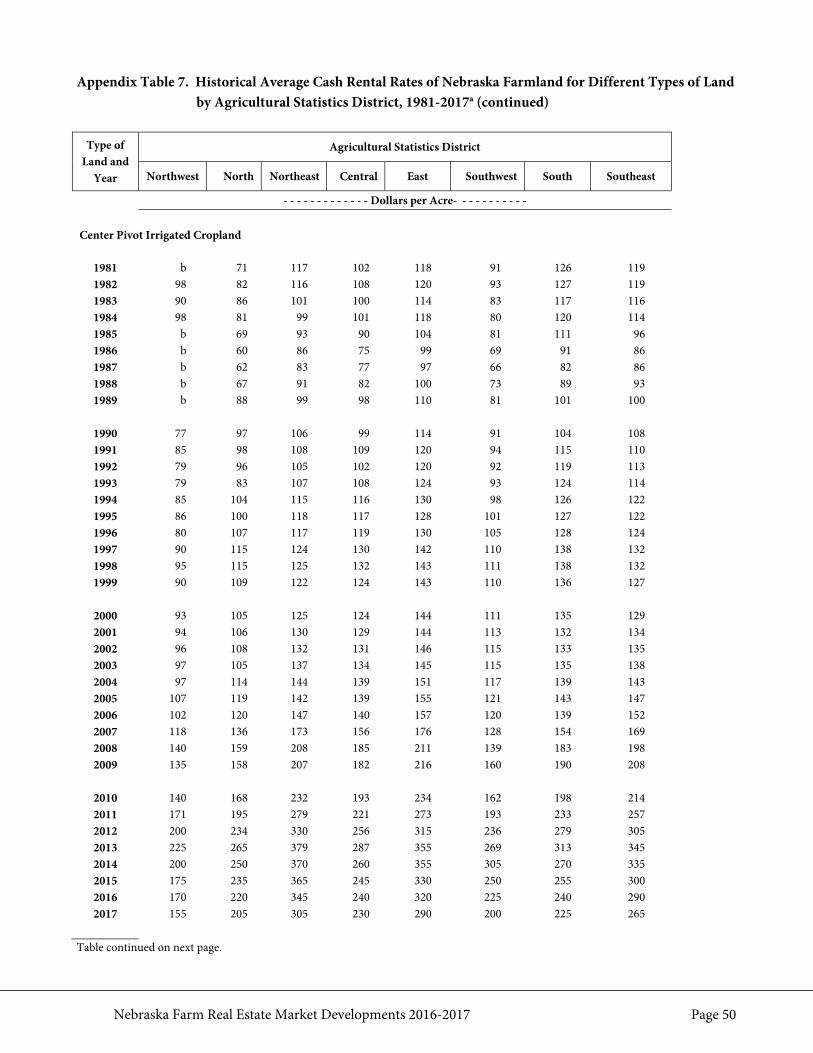
Nebraska Farm Real Estate Market Developments 2016-2017 Page 50
Appendix Table 7. Historical Average Cash Rental Rates of Nebraska Farmland for Different Types of Land by Agricultural Statistics District, 1981-2017a (continued)
Type of
Land and Year
Agricultural Statistics District
Northwest North Northeast Central East Southwest South Southeast
- - - - - - - - - - - - - Dollars per Acre- - - - - - - - - - - Center Pivot Irrigated Cropland
1981 b 71 117 102 118 91 126 119 1982 98 82 116 108 120 93 127 119 1983 90 86 101 100 114 83 117 116 1984 98 81 99 101 118 80 120 114 1985 b 69 93 90 104 81 111 96 1986 b 60 86 75 99 69 91 86 1987 b 62 83 77 97 66 82 86 1988 b 67 91 82 100 73 89 93 1989 b 88 99 98 110 81 101 100
1990 77 97 106 99 114 91 104 108 1991 85 98 108 109 120 94 115 110 1992 79 96 105 102 120 92 119 113 1993 79 83 107 108 124 93 124 114 1994 85 104 115 116 130 98 126 122 1995 86 100 118 117 128 101 127 122 1996 80 107 117 119 130 105 128 124 1997 90 115 124 130 142 110 138 132 1998 95 115 125 132 143 111 138 132 1999 90 109 122 124 143 110 136 127
2000 93 105 125 124 144 111 135 129 2001 94 106 130 129 144 113 132 134 2002 96 108 132 131 146 115 133 135 2003 97 105 137 134 145 115 135 138 2004 97 114 144 139 151 117 139 143 2005 107 119 142 139 155 121 143 147 2006 102 120 147 140 157 120 139 152 2007 118 136 173 156 176 128 154 169 2008 140 159 208 185 211 139 183 198 2009 135 158 207 182 216 160 190 208
2010 140 168 232 193 234 162 198 214 2011 171 195 279 221 273 193 233 257 2012 200 234 330 256 315 236 279 305 2013 225 265 379 287 355 269 313 345 2014 200 250 370 260 355 305 270 335 2015 175 235 365 245 330 250 255 300 2016 170 220 345 240 320 225 240 290 2017 155 205 305 230 290 200 225 265
Table continued on next page.
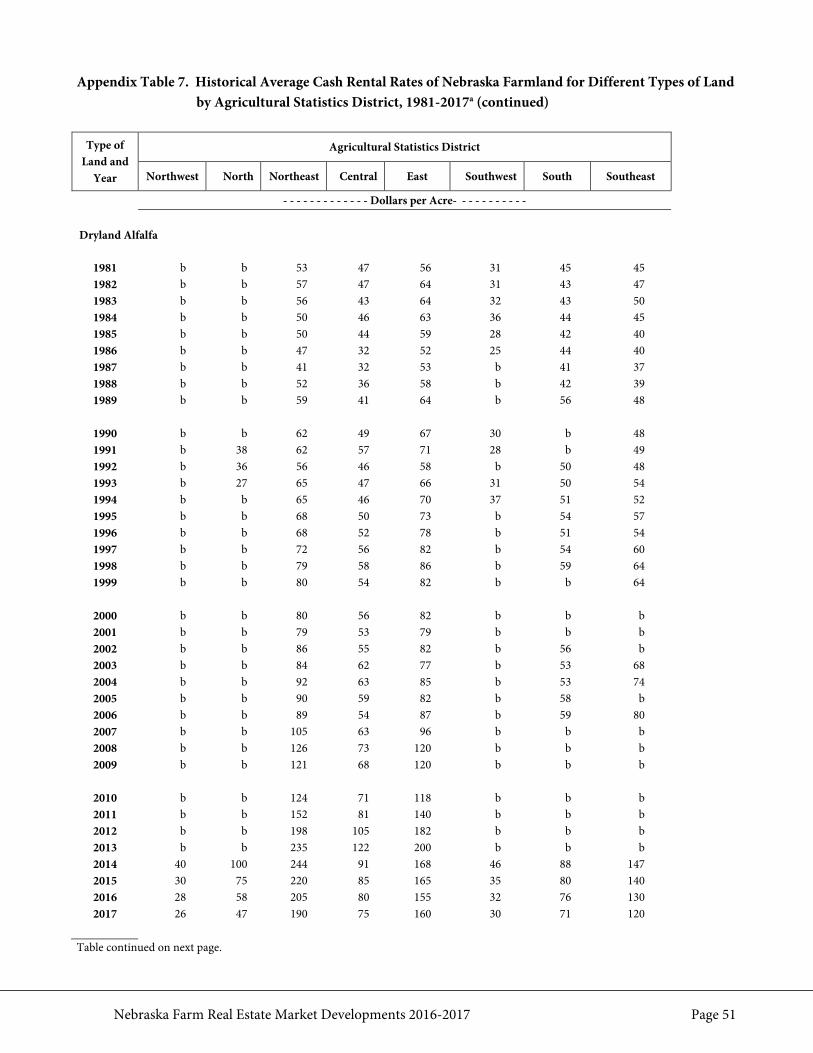
Nebraska Farm Real Estate Market Developments 2016-2017 Page 51
Appendix Table 7. Historical Average Cash Rental Rates of Nebraska Farmland for Different Types of Land by Agricultural Statistics District, 1981-2017a (continued)
Type of
Land and Year
Agricultural Statistics District
Northwest North Northeast Central East Southwest South Southeast
- - - - - - - - - - - - - Dollars per Acre- - - - - - - - - - - Dryland Alfalfa
1981 b b 53 47 56 31 45 45 1982 b b 57 47 64 31 43 47 1983 b b 56 43 64 32 43 50 1984 b b 50 46 63 36 44 45 1985 b b 50 44 59 28 42 40 1986 b b 47 32 52 25 44 40 1987 b b 41 32 53 b 41 37 1988 b b 52 36 58 b 42 39 1989 b b 59 41 64 b 56 48
1990 b b 62 49 67 30 b 48 1991 b 38 62 57 71 28 b 49 1992 b 36 56 46 58 b 50 48 1993 b 27 65 47 66 31 50 54 1994 b b 65 46 70 37 51 52 1995 b b 68 50 73 b 54 57 1996 b b 68 52 78 b 51 54 1997 b b 72 56 82 b 54 60 1998 b b 79 58 86 b 59 64 1999 b b 80 54 82 b b 64
2000 b b 80 56 82 b b b 2001 b b 79 53 79 b b b 2002 b b 86 55 82 b 56 b 2003 b b 84 62 77 b 53 68 2004 b b 92 63 85 b 53 74 2005 b b 90 59 82 b 58 b 2006 b b 89 54 87 b 59 80 2007 b b 105 63 96 b b b 2008 b b 126 73 120 b b b 2009 b b 121 68 120 b b b
2010 b b 124 71 118 b b b 2011 b b 152 81 140 b b b 2012 b b 198 105 182 b b b 2013 b b 235 122 200 b b b 2014 40 100 244 91 168 46 88 147 2015 30 75 220 85 165 35 80 140 2016 28 58 205 80 155 32 76 130 2017 26 47 190 75 160 30 71 120
Table continued on next page.
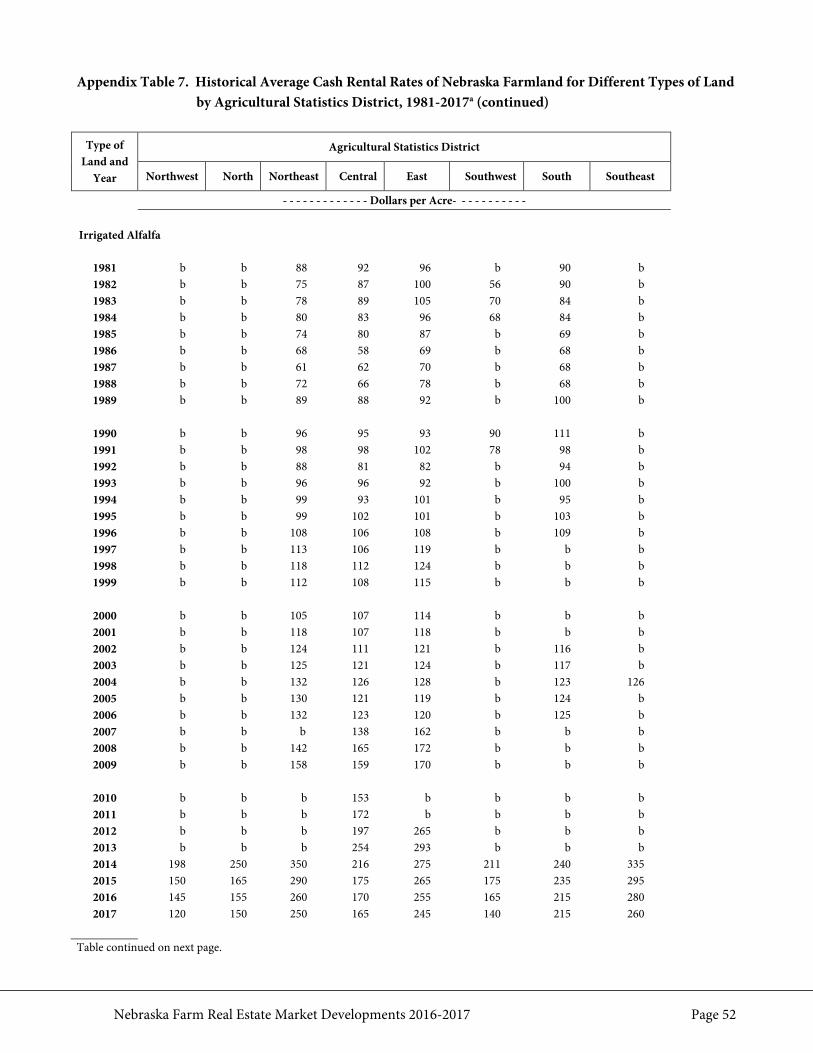
Nebraska Farm Real Estate Market Developments 2016-2017 Page 52
Appendix Table 7. Historical Average Cash Rental Rates of Nebraska Farmland for Different Types of Land by Agricultural Statistics District, 1981-2017a (continued)
Type of
Land and Year
Agricultural Statistics District
Northwest North Northeast Central East Southwest South Southeast
- - - - - - - - - - - - - Dollars per Acre- - - - - - - - - - - Irrigated Alfalfa
1981 b b 88 92 96 b 90 b 1982 b b 75 87 100 56 90 b 1983 b b 78 89 105 70 84 b 1984 b b 80 83 96 68 84 b 1985 b b 74 80 87 b 69 b 1986 b b 68 58 69 b 68 b 1987 b b 61 62 70 b 68 b 1988 b b 72 66 78 b 68 b 1989 b b 89 88 92 b 100 b
1990 b b 96 95 93 90 111 b 1991 b b 98 98 102 78 98 b 1992 b b 88 81 82 b 94 b 1993 b b 96 96 92 b 100 b 1994 b b 99 93 101 b 95 b 1995 b b 99 102 101 b 103 b 1996 b b 108 106 108 b 109 b 1997 b b 113 106 119 b b b 1998 b b 118 112 124 b b b 1999 b b 112 108 115 b b b
2000 b b 105 107 114 b b b 2001 b b 118 107 118 b b b 2002 b b 124 111 121 b 116 b 2003 b b 125 121 124 b 117 b 2004 b b 132 126 128 b 123 126 2005 b b 130 121 119 b 124 b 2006 b b 132 123 120 b 125 b 2007 b b b 138 162 b b b 2008 b b 142 165 172 b b b 2009 b b 158 159 170 b b b
2010 b b b 153 b b b b 2011 b b b 172 b b b b 2012 b b b 197 265 b b b 2013 b b b 254 293 b b b 2014 198 250 350 216 275 211 240 335 2015 150 165 290 175 265 175 235 295 2016 145 155 260 170 255 165 215 280 2017 120 150 250 165 245 140 215 260
Table continued on next page.
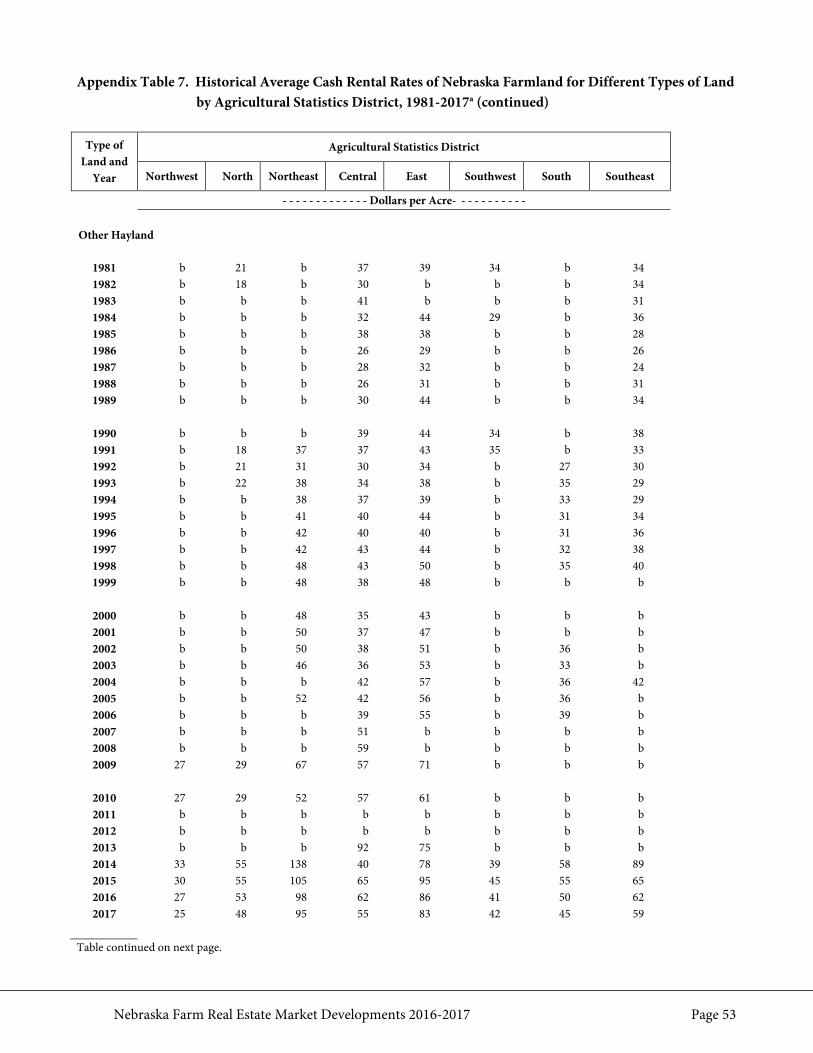
Nebraska Farm Real Estate Market Developments 2016-2017 Page 53
Appendix Table 7. Historical Average Cash Rental Rates of Nebraska Farmland for Different Types of Land by Agricultural Statistics District, 1981-2017a (continued)
Type of
Land and Year
Agricultural Statistics District
Northwest North Northeast Central East Southwest South Southeast
- - - - - - - - - - - - - Dollars per Acre- - - - - - - - - - - Other Hayland
1981 b 21 b 37 39 34 b 34 1982 b 18 b 30 b b b 34 1983 b b b 41 b b b 31 1984 b b b 32 44 29 b 36 1985 b b b 38 38 b b 28 1986 b b b 26 29 b b 26 1987 b b b 28 32 b b 24 1988 b b b 26 31 b b 31 1989 b b b 30 44 b b 34
1990 b b b 39 44 34 b 38 1991 b 18 37 37 43 35 b 33 1992 b 21 31 30 34 b 27 30 1993 b 22 38 34 38 b 35 29 1994 b b 38 37 39 b 33 29 1995 b b 41 40 44 b 31 34 1996 b b 42 40 40 b 31 36 1997 b b 42 43 44 b 32 38 1998 b b 48 43 50 b 35 40 1999 b b 48 38 48 b b b
2000 b b 48 35 43 b b b 2001 b b 50 37 47 b b b 2002 b b 50 38 51 b 36 b 2003 b b 46 36 53 b 33 b 2004 b b b 42 57 b 36 42 2005 b b 52 42 56 b 36 b 2006 b b b 39 55 b 39 b 2007 b b b 51 b b b b 2008 b b b 59 b b b b 2009 27 29 67 57 71 b b b
2010 27 29 52 57 61 b b b 2011 b b b b b b b b 2012 b b b b b b b b 2013 b b b 92 75 b b b 2014 33 55 138 40 78 39 58 89 2015 30 55 105 65 95 45 55 65 2016 27 53 98 62 86 41 50 62 2017 25 48 95 55 83 42 45 59
Table continued on next page.
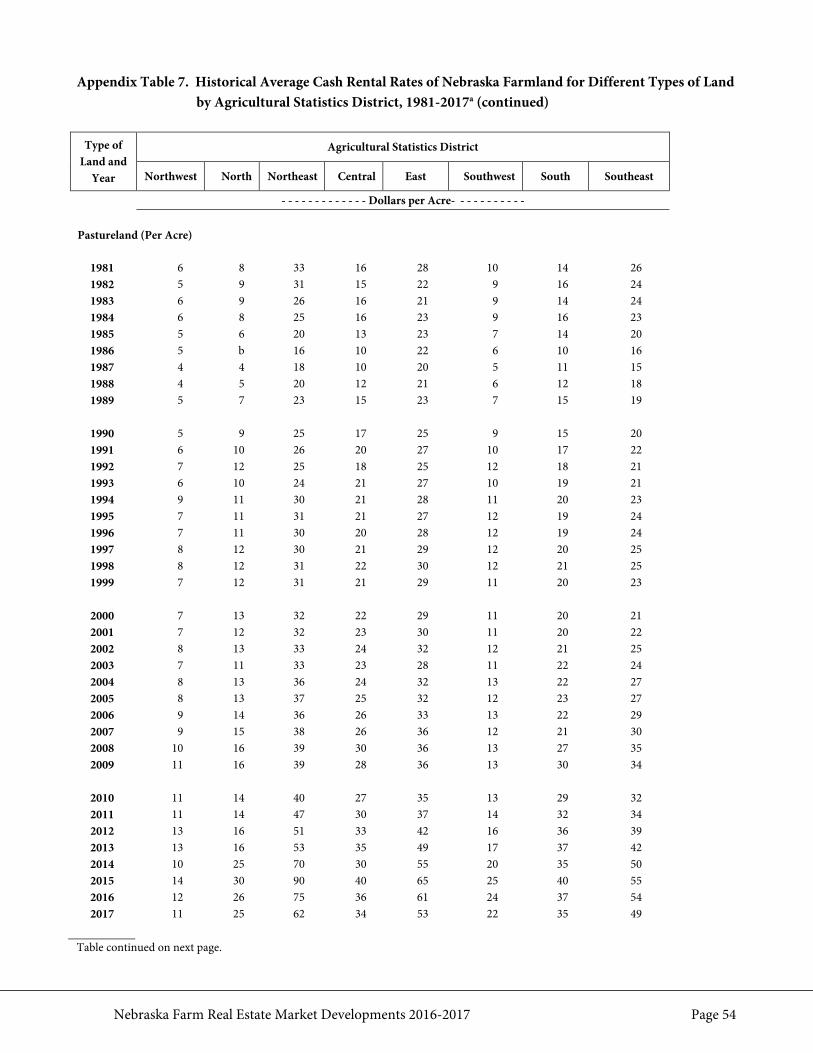
Nebraska Farm Real Estate Market Developments 2016-2017 Page 54
Appendix Table 7. Historical Average Cash Rental Rates of Nebraska Farmland for Different Types of Land by Agricultural Statistics District, 1981-2017a (continued)
Type of
Land and Year
Agricultural Statistics District
Northwest North Northeast Central East Southwest South Southeast
- - - - - - - - - - - - - Dollars per Acre- - - - - - - - - - - Pastureland (Per Acre)
1981 6 8 33 16 28 10 14 26 1982 5 9 31 15 22 9 16 24 1983 6 9 26 16 21 9 14 24 1984 6 8 25 16 23 9 16 23 1985 5 6 20 13 23 7 14 20 1986 5 b 16 10 22 6 10 16 1987 4 4 18 10 20 5 11 15 1988 4 5 20 12 21 6 12 18 1989 5 7 23 15 23 7 15 19
1990 5 9 25 17 25 9 15 20 1991 6 10 26 20 27 10 17 22 1992 7 12 25 18 25 12 18 21 1993 6 10 24 21 27 10 19 21 1994 9 11 30 21 28 11 20 23 1995 7 11 31 21 27 12 19 24 1996 7 11 30 20 28 12 19 24 1997 8 12 30 21 29 12 20 25 1998 8 12 31 22 30 12 21 25 1999 7 12 31 21 29 11 20 23
2000 7 13 32 22 29 11 20 21 2001 7 12 32 23 30 11 20 22 2002 8 13 33 24 32 12 21 25 2003 7 11 33 23 28 11 22 24 2004 8 13 36 24 32 13 22 27 2005 8 13 37 25 32 12 23 27 2006 9 14 36 26 33 13 22 29 2007 9 15 38 26 36 12 21 30 2008 10 16 39 30 36 13 27 35 2009 11 16 39 28 36 13 30 34
2010 11 14 40 27 35 13 29 32 2011 11 14 47 30 37 14 32 34 2012 13 16 51 33 42 16 36 39 2013 13 16 53 35 49 17 37 42 2014 10 25 70 30 55 20 35 50 2015 14 30 90 40 65 25 40 55 2016 12 26 75 36 61 24 37 54 2017 11 25 62 34 53 22 35 49
Table continued on next page.
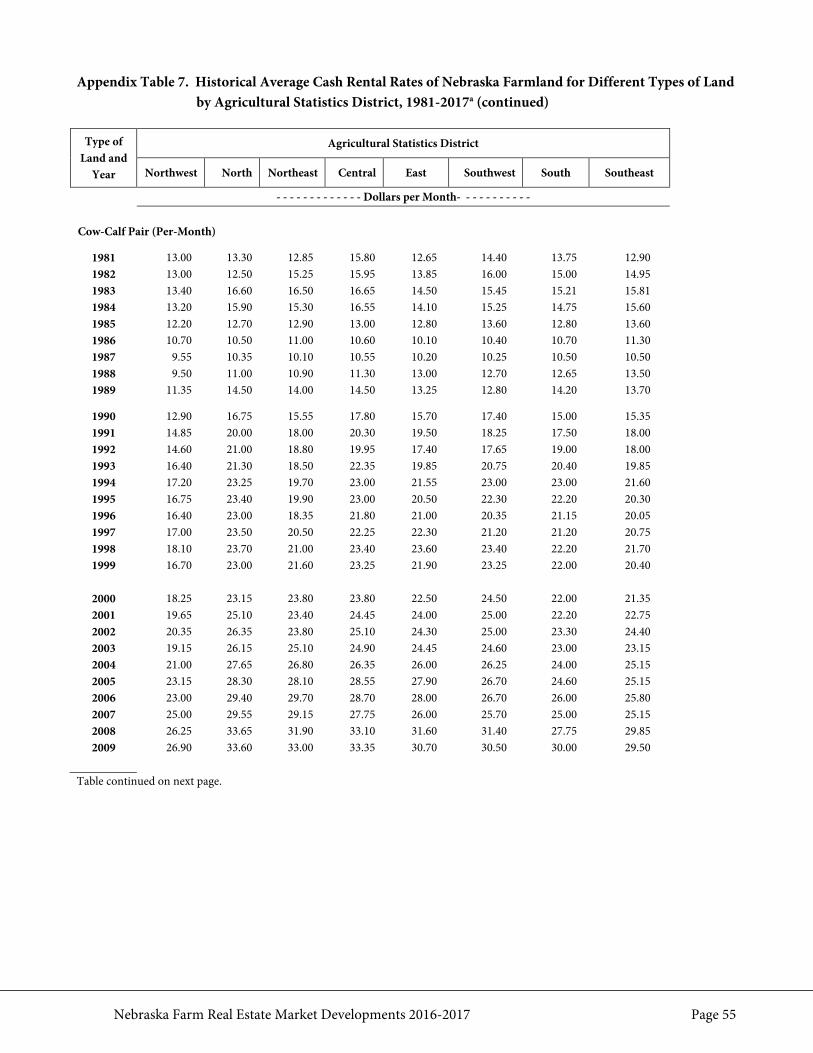
Nebraska Farm Real Estate Market Developments 2016-2017 Page 55
Appendix Table 7. Historical Average Cash Rental Rates of Nebraska Farmland for Different Types of Land by Agricultural Statistics District, 1981-2017a (continued)
Type of Land and
Year
Agricultural Statistics District
Northwest North Northeast Central East Southwest South Southeast
- - - - - - - - - - - - - Dollars per Month- - - - - - - - - - - Cow-Calf Pair (Per-Month)
1981 13.00 13.30 12.85 15.80 12.65 14.40 13.75 12.90 1982 13.00 12.50 15.25 15.95 13.85 16.00 15.00 14.95 1983 13.40 16.60 16.50 16.65 14.50 15.45 15.21 15.81 1984 13.20 15.90 15.30 16.55 14.10 15.25 14.75 15.60 1985 12.20 12.70 12.90 13.00 12.80 13.60 12.80 13.60 1986 10.70 10.50 11.00 10.60 10.10 10.40 10.70 11.30 1987 9.55 10.35 10.10 10.55 10.20 10.25 10.50 10.50 1988 9.50 11.00 10.90 11.30 13.00 12.70 12.65 13.50 1989 11.35 14.50 14.00 14.50 13.25 12.80 14.20 13.70
1990 12.90 16.75 15.55 17.80 15.70 17.40 15.00 15.35 1991 14.85 20.00 18.00 20.30 19.50 18.25 17.50 18.00 1992 14.60 21.00 18.80 19.95 17.40 17.65 19.00 18.00 1993 16.40 21.30 18.50 22.35 19.85 20.75 20.40 19.85 1994 17.20 23.25 19.70 23.00 21.55 23.00 23.00 21.60 1995 16.75 23.40 19.90 23.00 20.50 22.30 22.20 20.30 1996 16.40 23.00 18.35 21.80 21.00 20.35 21.15 20.05 1997 17.00 23.50 20.50 22.25 22.30 21.20 21.20 20.75 1998 18.10 23.70 21.00 23.40 23.60 23.40 22.20 21.70 1999 16.70 23.00 21.60 23.25 21.90 23.25 22.00 20.40
2000 18.25 23.15 23.80 23.80 22.50 24.50 22.00 21.35 2001 19.65 25.10 23.40 24.45 24.00 25.00 22.20 22.75 2002 20.35 26.35 23.80 25.10 24.30 25.00 23.30 24.40 2003 19.15 26.15 25.10 24.90 24.45 24.60 23.00 23.15 2004 21.00 27.65 26.80 26.35 26.00 26.25 24.00 25.15 2005 23.15 28.30 28.10 28.55 27.90 26.70 24.60 25.15 2006 23.00 29.40 29.70 28.70 28.00 26.70 26.00 25.80 2007 25.00 29.55 29.15 27.75 26.00 25.70 25.00 25.15 2008 26.25 33.65 31.90 33.10 31.60 31.40 27.75 29.85 2009 26.90 33.60 33.00 33.35 30.70 30.50 30.00 29.50
Table continued on next page.
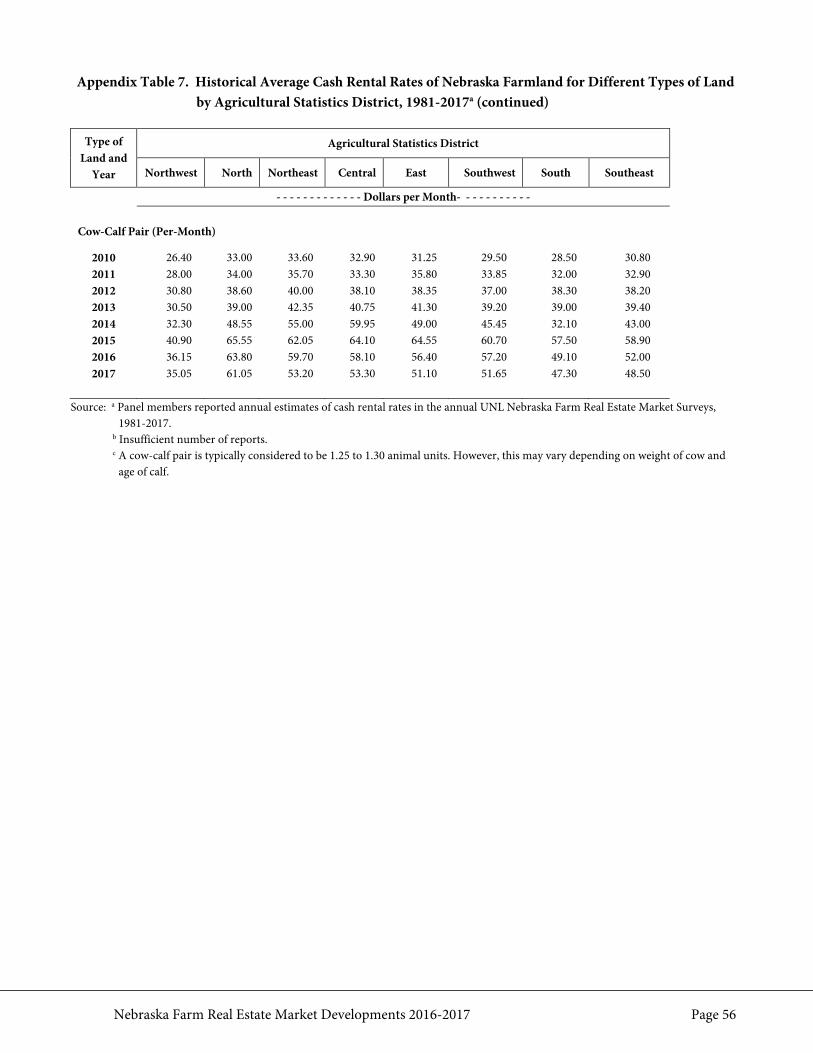
Nebraska Farm Real Estate Market Developments 2016-2017 Page 56
Appendix Table 7. Historical Average Cash Rental Rates of Nebraska Farmland for Different Types of Land by Agricultural Statistics District, 1981-2017a (continued)
Type of Land and
Year
Agricultural Statistics District
Northwest North Northeast Central East Southwest South Southeast
- - - - - - - - - - - - - Dollars per Month- - - - - - - - - - - Cow-Calf Pair (Per-Month)
2010 26.40 33.00 33.60 32.90 31.25 29.50 28.50 30.80 2011 28.00 34.00 35.70 33.30 35.80 33.85 32.00 32.90 2012 30.80 38.60 40.00 38.10 38.35 37.00 38.30 38.20 2013 30.50 39.00 42.35 40.75 41.30 39.20 39.00 39.40 2014 32.30 48.55 55.00 59.95 49.00 45.45 32.10 43.00 2015 40.90 65.55 62.05 64.10 64.55 60.70 57.50 58.90 2016 36.15 63.80 59.70 58.10 56.40 57.20 49.10 52.00 2017 35.05 61.05 53.20 53.30 51.10 51.65 47.30 48.50
Source: a Panel members reported annual estimates of cash rental rates in the annual UNL Nebraska Farm Real Estate Market Surveys,
1981-2017. b Insufficient number of reports. c A cow-calf pair is typically considered to be 1.25 to 1.30 animal units. However, this may vary depending on weight of cow and
age of calf.