Embed Size (px)
DESCRIPTION
Nebraska Department of Education STATE OF THE SCHOOLS REPORT. Roger D. Breed, Ed.D. Commissioner of Education November 20, 2012. STATE OF THE SCHOOLS REPORT. http://reportcard.education.ne.gov/. NePAS: Purpose. School district accountability To inform state and federal policy-makers - PowerPoint PPT Presentation
Citation preview
Nebraska Department of Education
STATE OF THE SCHOOLS REPORT
Roger D. Breed, Ed.D.Commissioner of Education
November 20, 2012
STATE OF THE SCHOOLS REPORT
http://reportcard.education.ne.gov/
NePAS: Purpose
•School district accountability
•To inform state and federal policy-makers
•To inform instruction
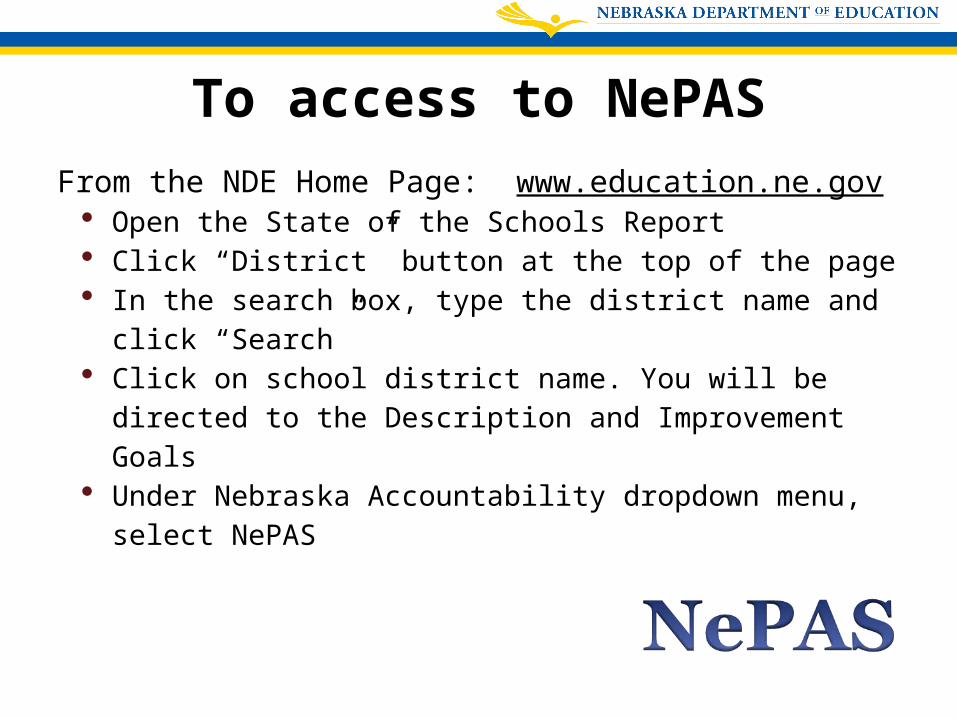
To access to NePAS
From the NDE Home Page: www.education.ne.gov
Open the State of the Schools Report Click “District” button at the top of the page In the search box, type the district name and
click “Search” Click on school district name. You will be
directed to the Description and Improvement Goals
Under Nebraska Accountability dropdown menu, select NePAS
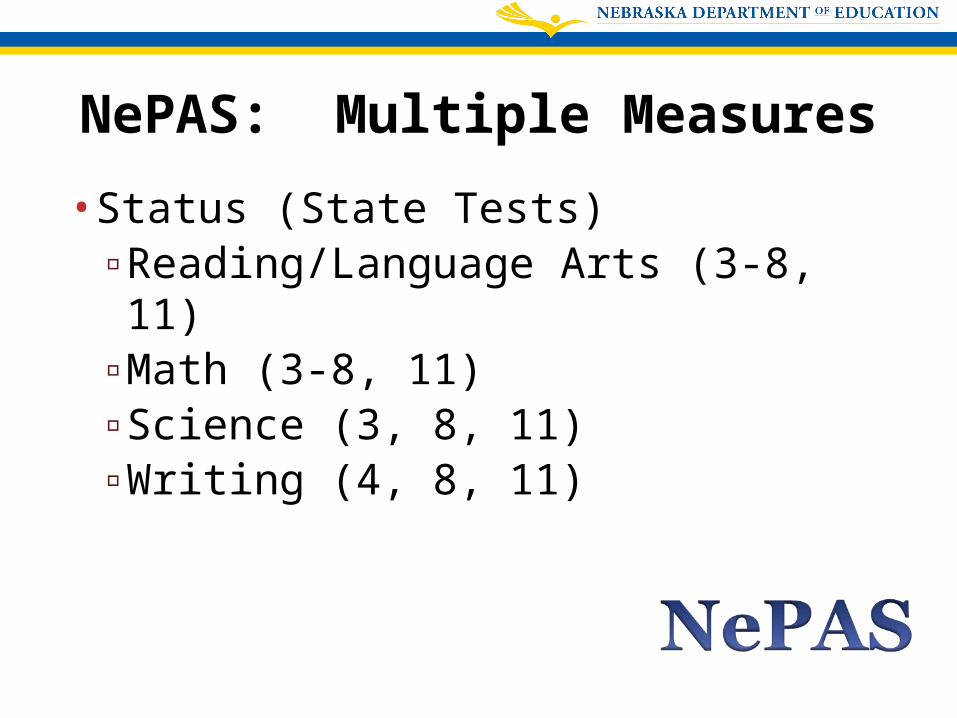
NePAS: Multiple Measures
•Status (State Tests)▫Reading/Language Arts (3-8, 11)▫Math (3-8, 11)▫Science (3, 8, 11)▫Writing (4, 8, 11)
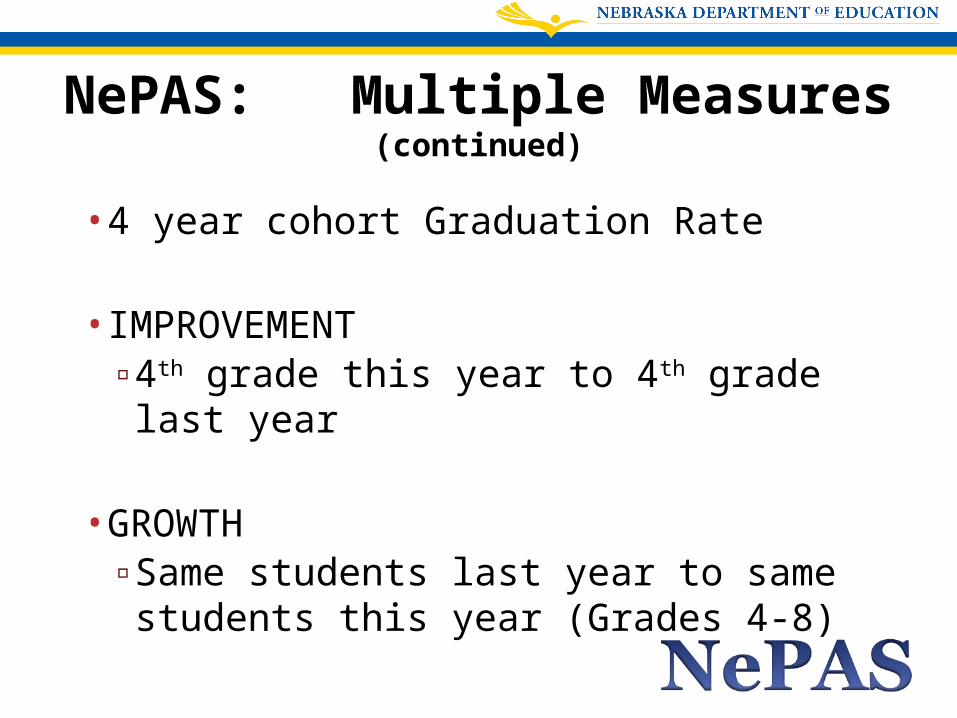
NePAS: Multiple Measures (continued)
•4 year cohort Graduation Rate
•IMPROVEMENT▫4th grade this year to 4th grade last year
•GROWTH▫Same students last year to same students this year (Grades 4-8)
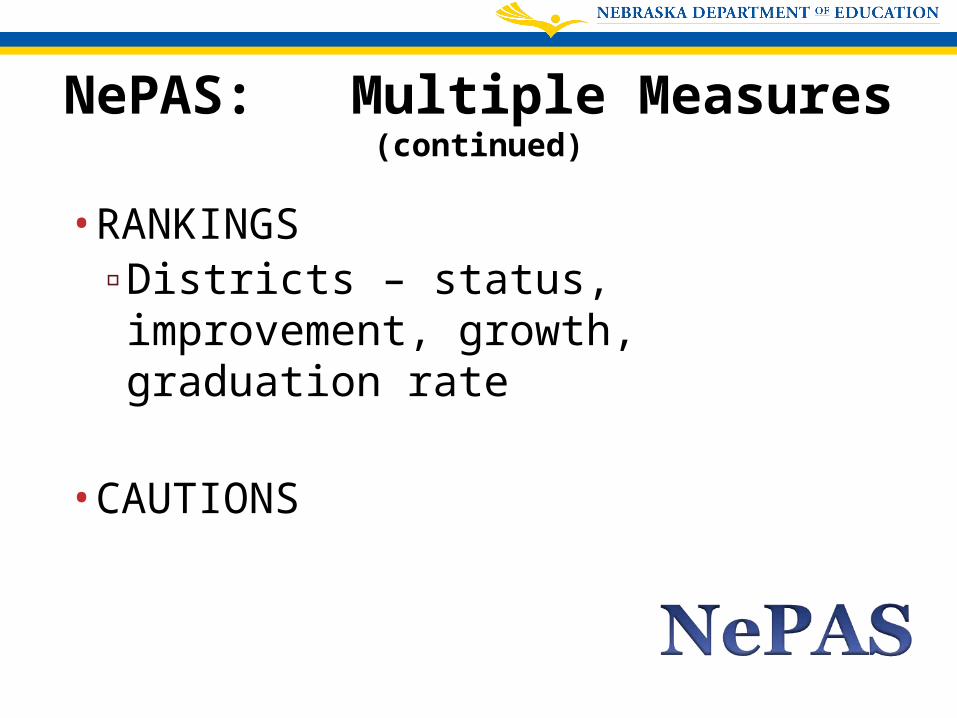
NePAS: Multiple Measures (continued)
•RANKINGS▫Districts – status, improvement, growth, graduation rate
•CAUTIONS
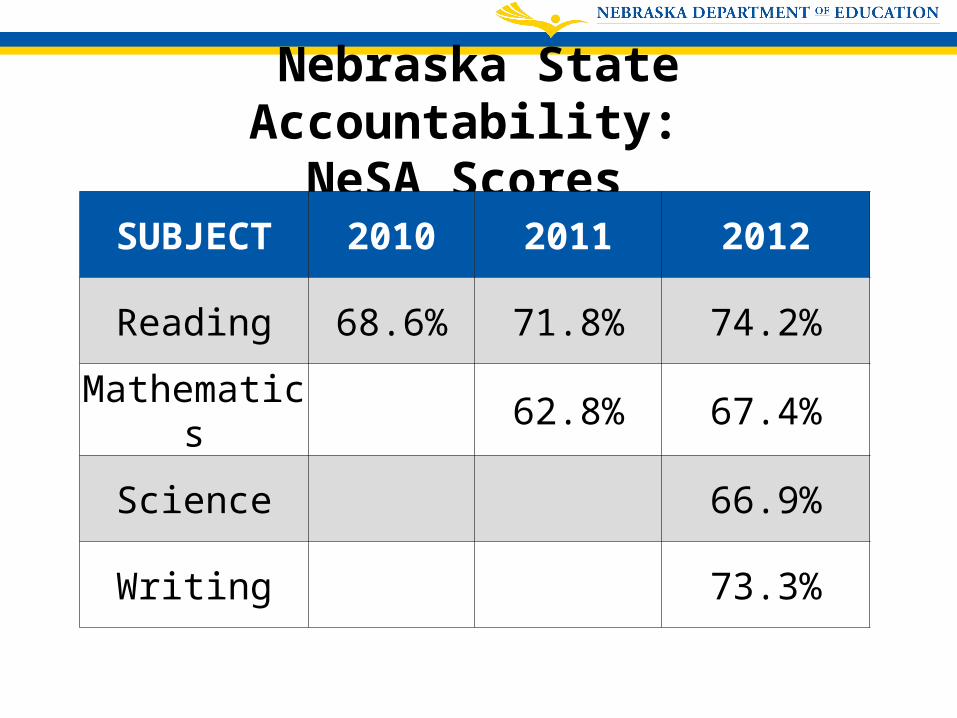
Nebraska State Accountability:
NeSA Scores SUBJECT 2010 2011 2012
Reading 68.6% 71.8% 74.2%
Mathematics 62.8% 67.4%
Science 66.9%
Writing 73.3%
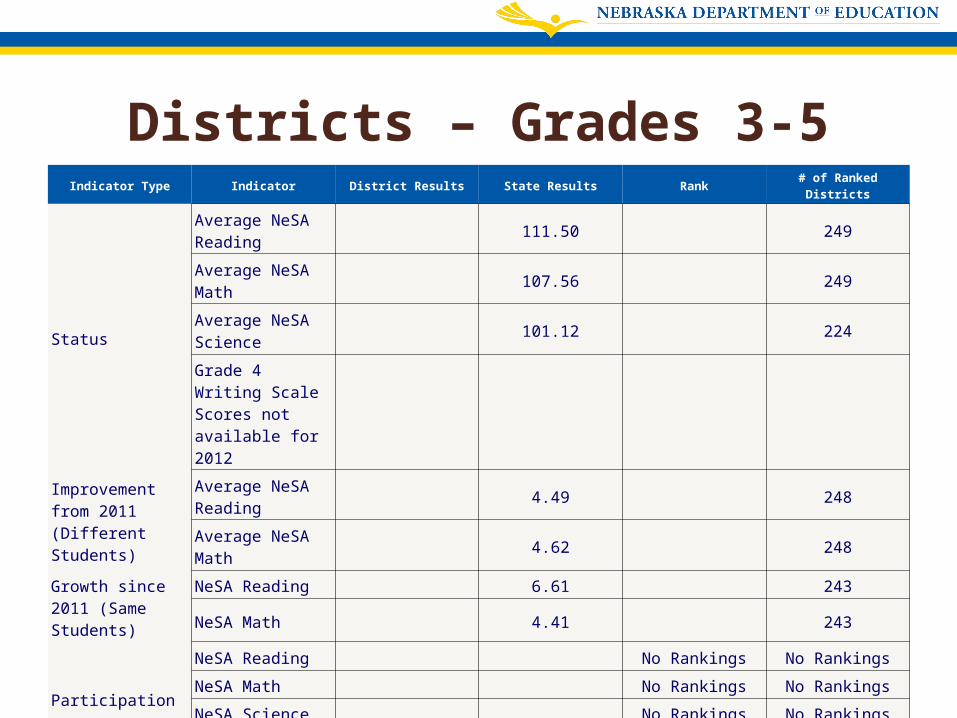
Districts – Grades 3-5Indicator Type Indicator District Results State Results Rank
# of Ranked Districts
Status
Average NeSA Reading
111.50 249
Average NeSA Math
107.56 249
Average NeSA Science
101.12 224
Grade 4 Writing Scale Scores not available for 2012
Improvement from 2011 (Different Students)
Average NeSA Reading
4.49 248
Average NeSA Math
4.62 248
Growth since 2011 (Same Students)
NeSA Reading 6.61 243
NeSA Math 4.41 243
Participation
NeSA Reading No Rankings No Rankings
NeSA Math No Rankings No Rankings
NeSA Science No Rankings No Rankings
NeSA Writing No Rankings No Rankings
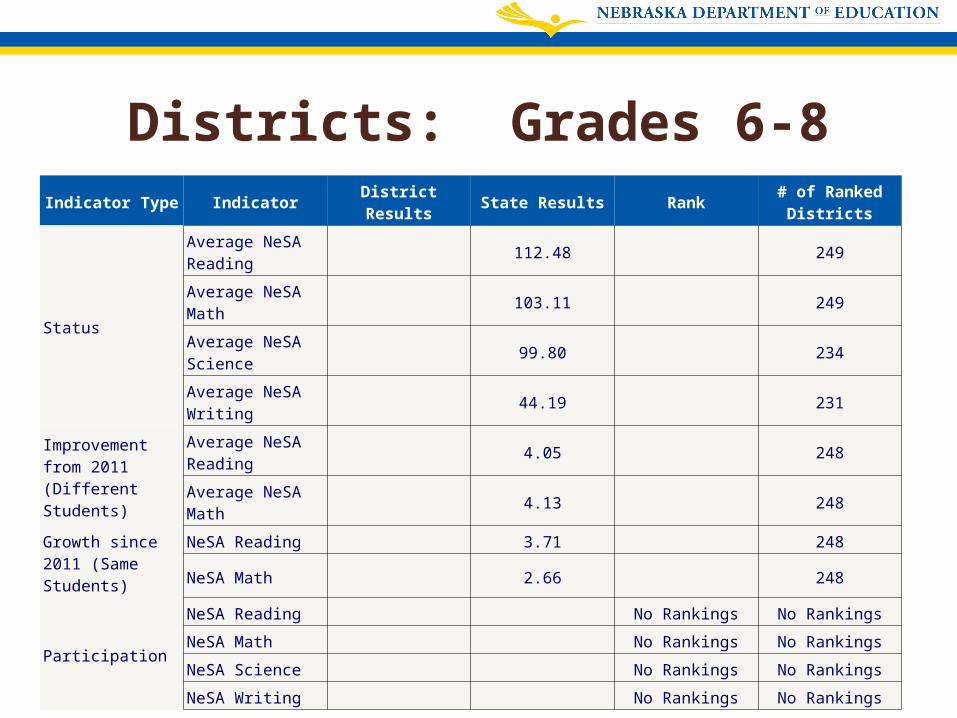
Districts: Grades 6-8Indicator Type Indicator
District Results
State Results Rank# of Ranked
Districts
Status
Average NeSA Reading
112.48 249
Average NeSA Math
103.11 249
Average NeSA Science
99.80 234
Average NeSA Writing
44.19 231
Improvement from 2011 (Different Students)
Average NeSA Reading
4.05 248
Average NeSA Math
4.13 248
Growth since 2011 (Same Students)
NeSA Reading 3.71 248
NeSA Math 2.66 248
Participation
NeSA Reading No Rankings No Rankings
NeSA Math No Rankings No Rankings
NeSA Science No Rankings No Rankings
NeSA Writing No Rankings No Rankings
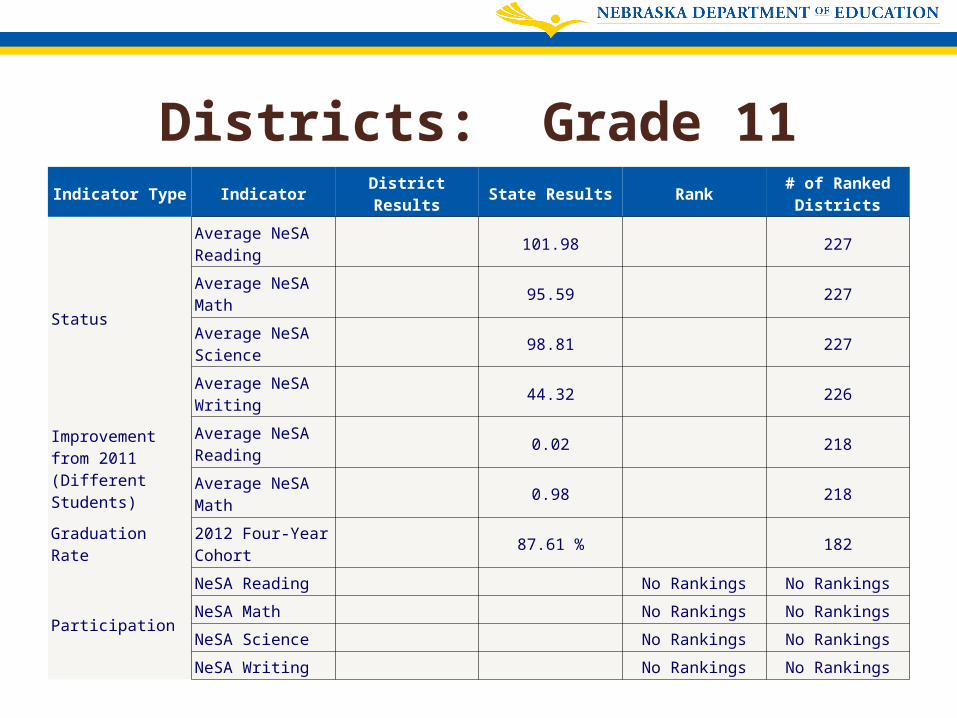
Districts: Grade 11Indicator Type Indicator
District Results
State Results Rank# of Ranked
Districts
Status
Average NeSA Reading
101.98 227
Average NeSA Math
95.59 227
Average NeSA Science
98.81 227
Average NeSA Writing
44.32 226
Improvement from 2011 (Different Students)
Average NeSA Reading
0.02 218
Average NeSA Math
0.98 218
Graduation Rate2012 Four-Year Cohort
87.61 % 182
Participation
NeSA Reading No Rankings No Rankings
NeSA Math No Rankings No Rankings
NeSA Science No Rankings No Rankings
NeSA Writing No Rankings No Rankings
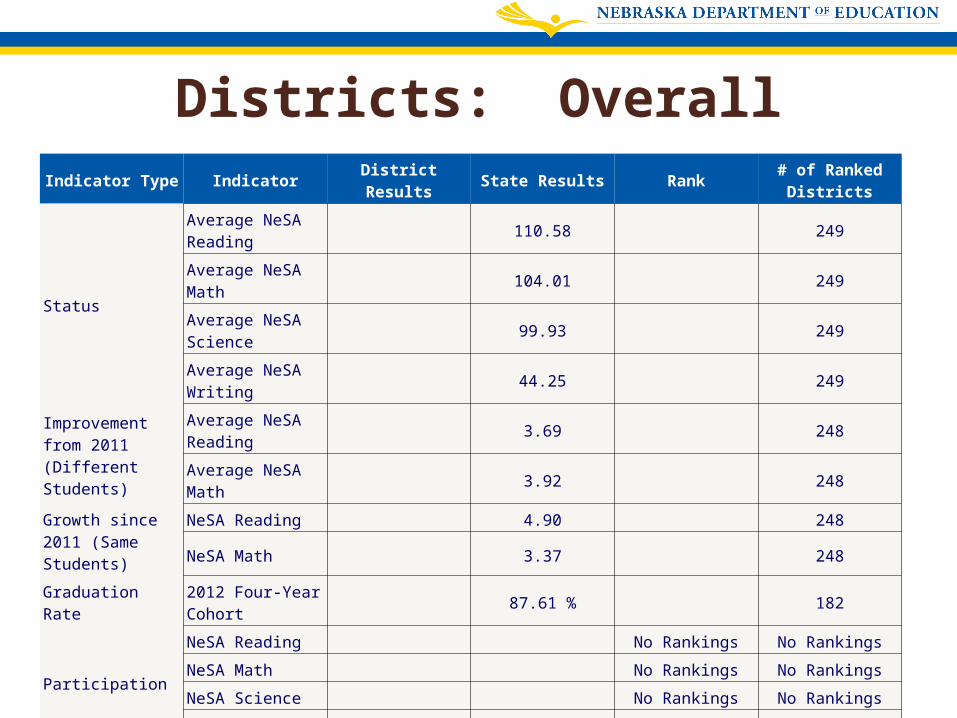
Districts: OverallIndicator Type Indicator
District Results
State Results Rank# of Ranked
Districts
Status
Average NeSA Reading
110.58 249
Average NeSA Math
104.01 249
Average NeSA Science
99.93 249
Average NeSA Writing
44.25 249
Improvement from 2011 (Different Students)
Average NeSA Reading
3.69 248
Average NeSA Math
3.92 248
Growth since 2011 (Same Students)
NeSA Reading 4.90 248
NeSA Math 3.37 248
Graduation Rate2012 Four-Year Cohort
87.61 % 182
Participation
NeSA Reading No Rankings No Rankings
NeSA Math No Rankings No Rankings
NeSA Science No Rankings No Rankings
NeSA Writing No Rankings No Rankings
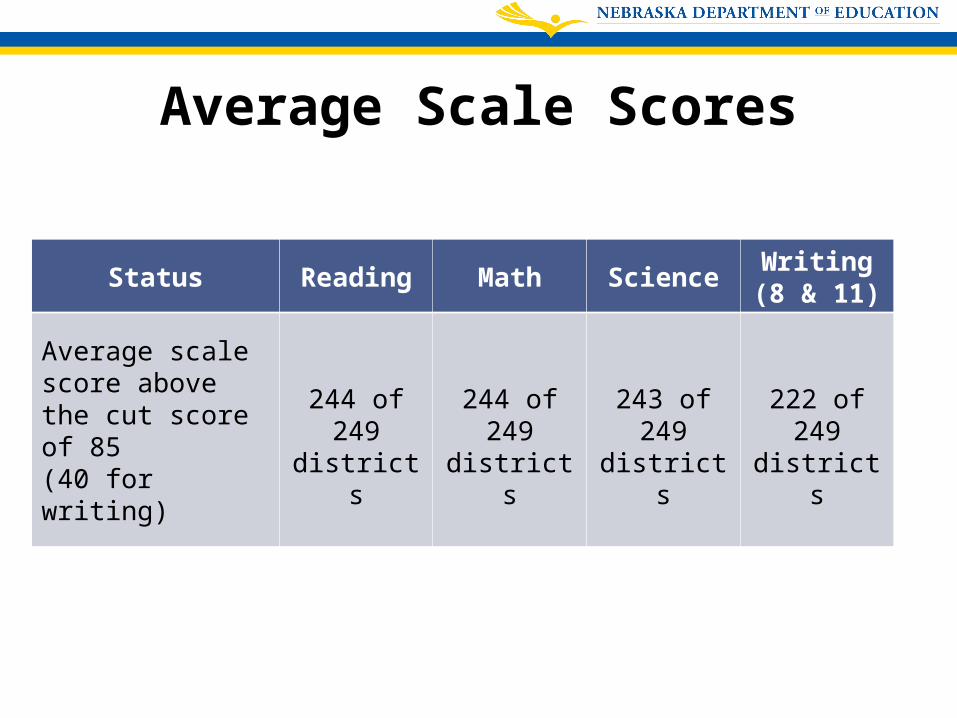
Average Scale Scores
Status Reading Math ScienceWriting(8 & 11)
Average scale score above the cut score of 85 (40 for writing)
244 of 249
districts
244 of 249
districts
243 of 249
districts
222 of 249
districts
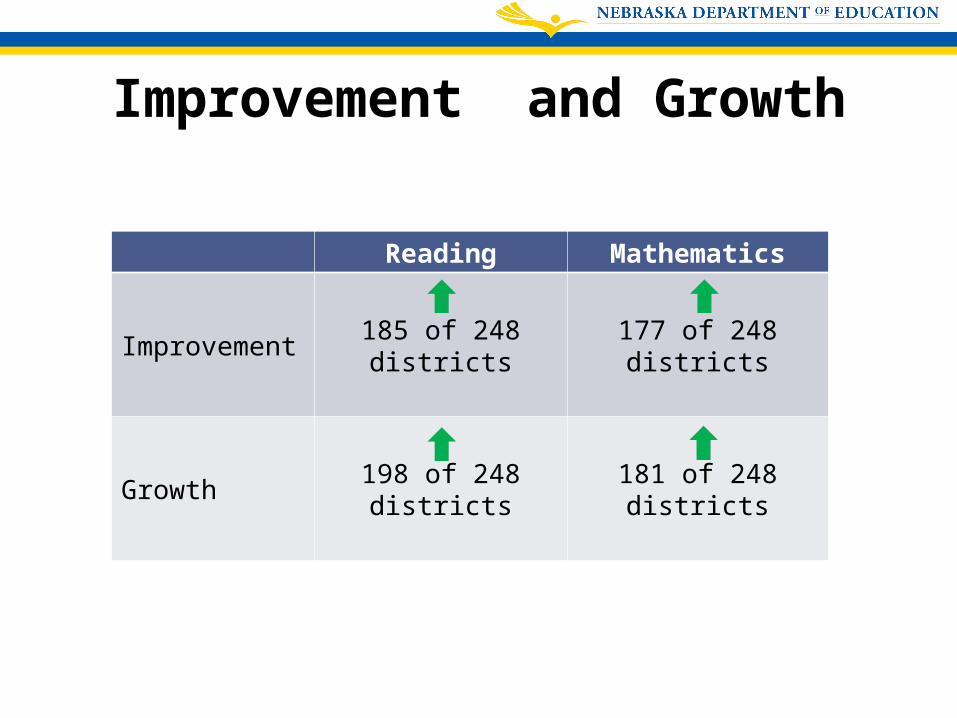
Improvement and Growth
Reading Mathematics
Improvement185 of 248
districts177 of 248
districts
Growth198 of 248
districts181 of 248
districts
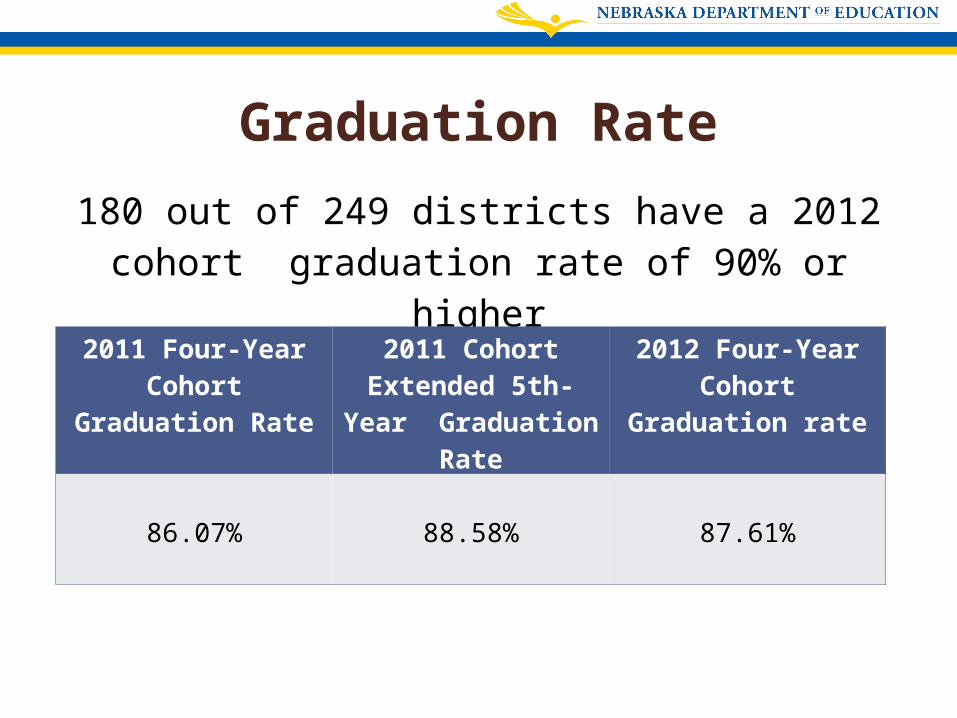
Graduation Rate
180 out of 249 districts have a 2012 cohort graduation rate of 90% or higher
2011 Four-Year Cohort
Graduation Rate
2011 Cohort Extended 5th-
Year Graduation Rate
2012 Four-Year Cohort
Graduation rate
86.07% 88.58% 87.61%
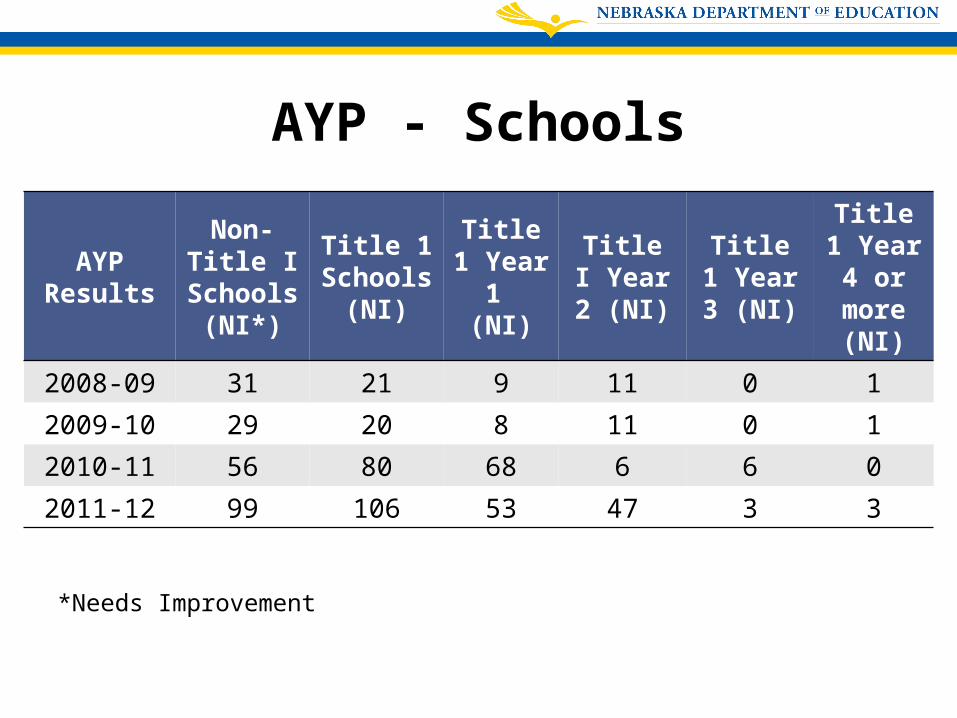
AYP - Schools
AYP Results
Non-Title I School
s(NI*)
Title 1 School
s(NI)
Title 1 Year
1 (NI)
Title I Year 2 (NI)
Title 1 Year 3 (NI)
Title 1 Year 4
or more (NI)
2008-09 31 21 9 11 0 1
2009-10 29 20 8 11 0 1
2010-11 56 80 68 6 6 0
2011-12 99 106 53 47 3 3
*Needs Improvement
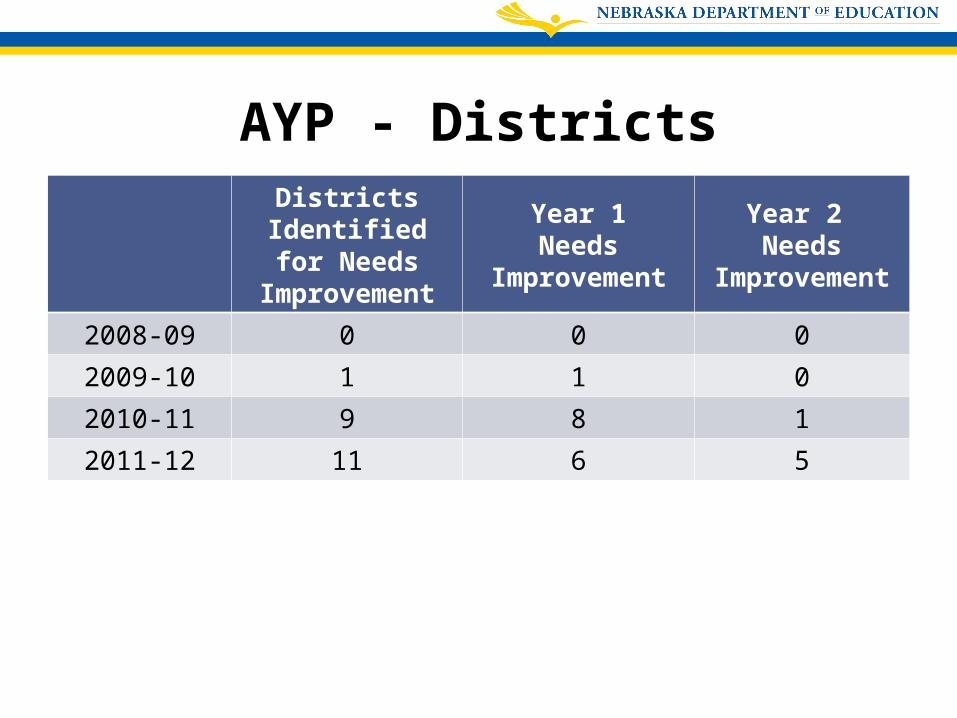
AYP - DistrictsDistricts
Identified for Needs
Improvement
Year 1Needs
Improvement
Year 2 Needs
Improvement
2008-09 0 0 0
2009-10 1 1 0
2010-11 9 8 1
2011-12 11 6 5
Mission Statement:
To lead and support the preparation of all Nebraskans for learning, earning and living.
Questions?