Embed Size (px)
Citation preview
Several recent studies have demonstrated the ability to mea-sure the effects of shear-wave (S-wave) birefringence usingmode-converted (PS) waves. Standard PS-wave processingrelies on the assumption that the subsurface is horizontallyisotropic. The two horizontal components are typically rotated(about the vertical axis) to a direction that is oriented radialand transverse to the source receiver geometry. In the pres-ence of azimuthal anisotropy in the subsurface geology, theupcoming S-wave will split into two—one polarized in thefast direction (S1) and the other in the slow direction (S2). IfS-wave birefringence is ignored, then the radial componentwill be comprised of a mixture of both fast and slow shear-wave energy. This mixing will result in a degradation of res-olution and S/N ratio by destructive interference between thefast and slow S-wave arrivals.
Recent developments in PS-wave processing have madeit possible to resolve these fast and slow directions and thetraveltime lag between them. The measured traveltime dif-ferences provide useful information regarding the magnitudeof anisotropy, and the measured azimuth provides furtherinsight into the orientation of stress fields and/or fracture direc-tions.
In September 2002, a 2D/4C test line was acquired atEkofisk Field in the southern North Sea. This test line con-sisted of 40 four-component (4C) receivers and a 3D grid ofsources. Subsequent analysis of the PS-wave data, primarilyin the near surface, indicated the presence of significant bire-fringence. The measured birefringence correlates well with thelocal seafloor subsidence that has been induced by compactionwithin the underlying chalk reservoir at a depth of approxi-mately 3 km. These results provide new information usefulfor characterizing fracturing and stress fields attributed toseafloor subsidence at Ekofisk.
Additionally, the magnitude of the S-wave birefringence(time shift between S1 and S2) correlates very closely with therelative change in the S-wave static corrections that werederived during 2D processing of the radial component data—indicating that an important link exists between them atEkofisk. This correlation suggests that the calculated PSreceiver statics are related to both azimuthal anisotropy andnear surface S-wave velocity variations. Such observations pro-vide further evidence that the effects of S-wave birefringenceshould be considered when imaging shear-wave seismic data,and that corrections begin with statics.
Survey background. Ekofisk Field was discovered in 1969 andhas been producing since 1971. The reservoir is trapped withina large anticline structure consisting of a high porosity chalk.Estimated initial oil in place is 6.7 billion STB of oil and approx-imately 1.9 billion STB of oil have already been produced.Approximately one third of the reservoir is seismicallyobscured on existing P-wave seismic data due to the presenceof free gas and overpressured shales within the overburden.
The 2D/4C OBC test data were acquired by Fugro andTerra Seismic Services using a prototype cable designed andmanufactured by Input/Output. The test was conducted overthe western edge of the seismically obscured area (SOA) withhalf of the cable positioned over the gas cloud and half out-side of it. The cable itself consisted of 40 nongimbaled 4C detec-
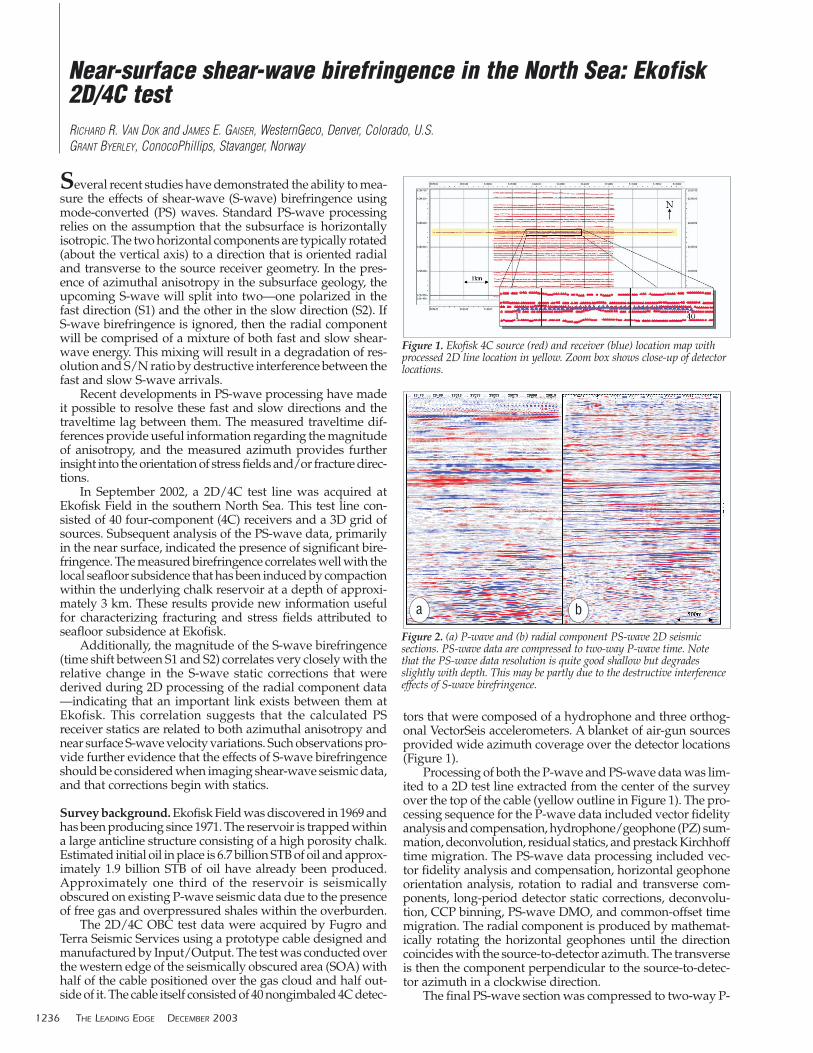
tors that were composed of a hydrophone and three orthog-onal VectorSeis accelerometers. A blanket of air-gun sourcesprovided wide azimuth coverage over the detector locations(Figure 1).
Processing of both the P-wave and PS-wave data was lim-ited to a 2D test line extracted from the center of the surveyover the top of the cable (yellow outline in Figure 1). The pro-cessing sequence for the P-wave data included vector fidelityanalysis and compensation, hydrophone/geophone (PZ) sum-mation, deconvolution, residual statics, and prestack Kirchhofftime migration. The PS-wave data processing included vec-tor fidelity analysis and compensation, horizontal geophoneorientation analysis, rotation to radial and transverse com-ponents, long-period detector static corrections, deconvolu-tion, CCP binning, PS-wave DMO, and common-offset timemigration. The radial component is produced by mathemat-ically rotating the horizontal geophones until the directioncoincides with the source-to-detector azimuth. The transverseis then the component perpendicular to the source-to-detec-tor azimuth in a clockwise direction.
The final PS-wave section was compressed to two-way P-
1236 THE LEADING EDGE DECEMBER 2003
Near-surface shear-wave birefringence in the North Sea: Ekofisk2D/4C testRICHARD R. VAN DOK and JAMES E. GAISER, WesternGeco, Denver, Colorado, U.S.GRANT BYERLEY, ConocoPhillips, Stavanger, Norway
Figure 1. Ekofisk 4C source (red) and receiver (blue) location map withprocessed 2D line location in yellow. Zoom box shows close-up of detectorlocations.
Figure 2. (a) P-wave and (b) radial component PS-wave 2D seismicsections. PS-wave data are compressed to two-way P-wave time. Notethat the PS-wave data resolution is quite good shallow but degradesslightly with depth. This may be partly due to the destructive interferenceeffects of S-wave birefringence.
a b
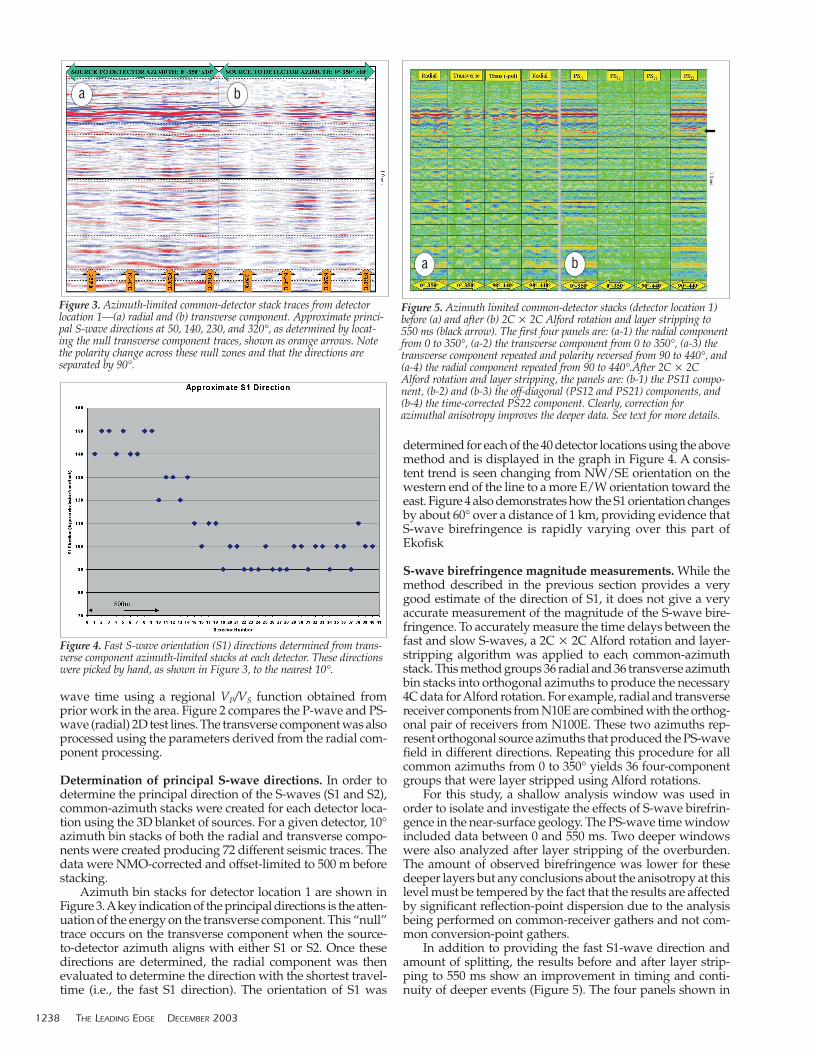
wave time using a regional VP/VS function obtained fromprior work in the area. Figure 2 compares the P-wave and PS-wave (radial) 2D test lines. The transverse component was alsoprocessed using the parameters derived from the radial com-ponent processing.
Determination of principal S-wave directions. In order todetermine the principal direction of the S-waves (S1 and S2),common-azimuth stacks were created for each detector loca-tion using the 3D blanket of sources. For a given detector, 10°azimuth bin stacks of both the radial and transverse compo-nents were created producing 72 different seismic traces. Thedata were NMO-corrected and offset-limited to 500 m beforestacking.
Azimuth bin stacks for detector location 1 are shown inFigure 3. Akey indication of the principal directions is the atten-uation of the energy on the transverse component. This “null”trace occurs on the transverse component when the source-to-detector azimuth aligns with either S1 or S2. Once thesedirections are determined, the radial component was thenevaluated to determine the direction with the shortest travel-time (i.e., the fast S1 direction). The orientation of S1 was
determined for each of the 40 detector locations using the abovemethod and is displayed in the graph in Figure 4. A consis-tent trend is seen changing from NW/SE orientation on thewestern end of the line to a more E/W orientation toward theeast. Figure 4 also demonstrates how the S1 orientation changesby about 60° over a distance of 1 km, providing evidence thatS-wave birefringence is rapidly varying over this part ofEkofisk
S-wave birefringence magnitude measurements. While themethod described in the previous section provides a verygood estimate of the direction of S1, it does not give a veryaccurate measurement of the magnitude of the S-wave bire-fringence. To accurately measure the time delays between thefast and slow S-waves, a 2C � 2C Alford rotation and layer-stripping algorithm was applied to each common-azimuthstack. This method groups 36 radial and 36 transverse azimuthbin stacks into orthogonal azimuths to produce the necessary4C data for Alford rotation. For example, radial and transversereceiver components from N10E are combined with the orthog-onal pair of receivers from N100E. These two azimuths rep-resent orthogonal source azimuths that produced the PS-wavefield in different directions. Repeating this procedure for allcommon azimuths from 0 to 350° yields 36 four-componentgroups that were layer stripped using Alford rotations.
For this study, a shallow analysis window was used inorder to isolate and investigate the effects of S-wave birefrin-gence in the near-surface geology. The PS-wave time windowincluded data between 0 and 550 ms. Two deeper windowswere also analyzed after layer stripping of the overburden.The amount of observed birefringence was lower for thesedeeper layers but any conclusions about the anisotropy at thislevel must be tempered by the fact that the results are affectedby significant reflection-point dispersion due to the analysisbeing performed on common-receiver gathers and not com-mon conversion-point gathers.
In addition to providing the fast S1-wave direction andamount of splitting, the results before and after layer strip-ping to 550 ms show an improvement in timing and conti-nuity of deeper events (Figure 5). The four panels shown in
1238 THE LEADING EDGE DECEMBER 2003
Figure 3. Azimuth-limited common-detector stack traces from detectorlocation 1—(a) radial and (b) transverse component. Approximate princi-pal S-wave directions at 50, 140, 230, and 320°, as determined by locat-ing the null transverse component traces, shown as orange arrows. Notethe polarity change across these null zones and that the directions areseparated by 90°.
a b
Figure 4. Fast S-wave orientation (S1) directions determined from trans-verse component azimuth-limited stacks at each detector. These directionswere picked by hand, as shown in Figure 3, to the nearest 10°.
Figure 5. Azimuth limited common-detector stacks (detector location 1)before (a) and after (b) 2C � 2C Alford rotation and layer stripping to550 ms (black arrow). The first four panels are: (a-1) the radial componentfrom 0 to 350°, (a-2) the transverse component from 0 to 350°, (a-3) thetransverse component repeated and polarity reversed from 90 to 440°, and(a-4) the radial component repeated from 90 to 440°.After 2C � 2CAlford rotation and layer stripping, the panels are: (b-1) the PS11 compo-nent, (b-2) and (b-3) the off-diagonal (PS12 and PS21) components, and(b-4) the time-corrected PS22 component. Clearly, correction forazimuthal anisotropy improves the deeper data. See text for more details.
a b
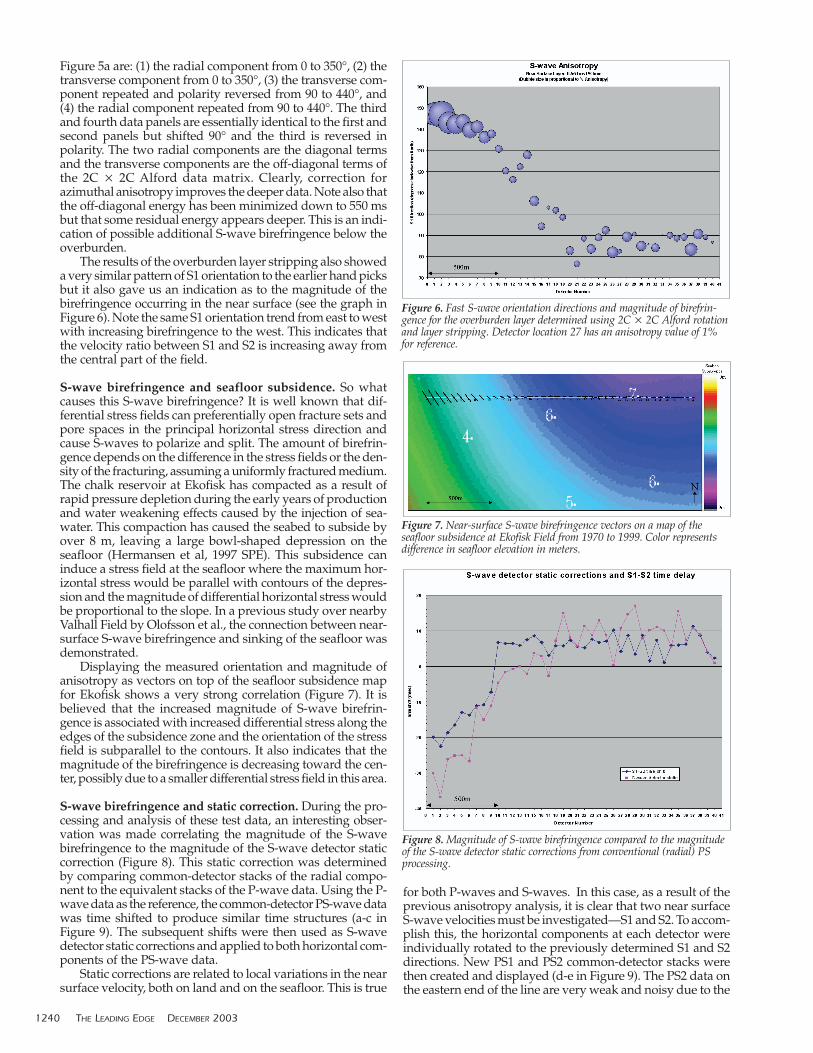
Figure 5a are: (1) the radial component from 0 to 350°, (2) thetransverse component from 0 to 350°, (3) the transverse com-ponent repeated and polarity reversed from 90 to 440°, and(4) the radial component repeated from 90 to 440°. The thirdand fourth data panels are essentially identical to the first andsecond panels but shifted 90° and the third is reversed inpolarity. The two radial components are the diagonal termsand the transverse components are the off-diagonal terms ofthe 2C � 2C Alford data matrix. Clearly, correction forazimuthal anisotropy improves the deeper data. Note also thatthe off-diagonal energy has been minimized down to 550 msbut that some residual energy appears deeper. This is an indi-cation of possible additional S-wave birefringence below theoverburden.
The results of the overburden layer stripping also showeda very similar pattern of S1 orientation to the earlier hand picksbut it also gave us an indication as to the magnitude of thebirefringence occurring in the near surface (see the graph inFigure 6). Note the same S1 orientation trend from east to westwith increasing birefringence to the west. This indicates thatthe velocity ratio between S1 and S2 is increasing away fromthe central part of the field.
S-wave birefringence and seafloor subsidence. So whatcauses this S-wave birefringence? It is well known that dif-ferential stress fields can preferentially open fracture sets andpore spaces in the principal horizontal stress direction andcause S-waves to polarize and split. The amount of birefrin-gence depends on the difference in the stress fields or the den-sity of the fracturing, assuming a uniformly fractured medium.The chalk reservoir at Ekofisk has compacted as a result ofrapid pressure depletion during the early years of productionand water weakening effects caused by the injection of sea-water. This compaction has caused the seabed to subside byover 8 m, leaving a large bowl-shaped depression on theseafloor (Hermansen et al, 1997 SPE). This subsidence caninduce a stress field at the seafloor where the maximum hor-izontal stress would be parallel with contours of the depres-sion and the magnitude of differential horizontal stress wouldbe proportional to the slope. In a previous study over nearbyValhall Field by Olofsson et al., the connection between near-surface S-wave birefringence and sinking of the seafloor wasdemonstrated.
Displaying the measured orientation and magnitude ofanisotropy as vectors on top of the seafloor subsidence mapfor Ekofisk shows a very strong correlation (Figure 7). It isbelieved that the increased magnitude of S-wave birefrin-gence is associated with increased differential stress along theedges of the subsidence zone and the orientation of the stressfield is subparallel to the contours. It also indicates that themagnitude of the birefringence is decreasing toward the cen-ter, possibly due to a smaller differential stress field in this area.
S-wave birefringence and static correction. During the pro-cessing and analysis of these test data, an interesting obser-vation was made correlating the magnitude of the S-wavebirefringence to the magnitude of the S-wave detector staticcorrection (Figure 8). This static correction was determinedby comparing common-detector stacks of the radial compo-nent to the equivalent stacks of the P-wave data. Using the P-wave data as the reference, the common-detector PS-wave datawas time shifted to produce similar time structures (a-c inFigure 9). The subsequent shifts were then used as S-wavedetector static corrections and applied to both horizontal com-ponents of the PS-wave data.
Static corrections are related to local variations in the nearsurface velocity, both on land and on the seafloor. This is true
for both P-waves and S-waves. In this case, as a result of theprevious anisotropy analysis, it is clear that two near surfaceS-wave velocities must be investigated—S1 and S2. To accom-plish this, the horizontal components at each detector wereindividually rotated to the previously determined S1 and S2directions. New PS1 and PS2 common-detector stacks werethen created and displayed (d-e in Figure 9). The PS2 data onthe eastern end of the line are very weak and noisy due to the
1240 THE LEADING EDGE DECEMBER 2003
Figure 6. Fast S-wave orientation directions and magnitude of birefrin-gence for the overburden layer determined using 2C � 2C Alford rotationand layer stripping. Detector location 27 has an anisotropy value of 1%for reference.
Figure 7. Near-surface S-wave birefringence vectors on a map of theseafloor subsidence at Ekofisk Field from 1970 to 1999. Color representsdifference in seafloor elevation in meters.
Figure 8. Magnitude of S-wave birefringence compared to the magnitudeof the S-wave detector static corrections from conventional (radial) PSprocessing.
relatively small amount of birefringence observed and thealignment of the source-to-detector propagation directionazimuths with the fast S1 direction. Computing the time shiftsrequired to match both the PS1 and PS2 data to the P-wavedata (over the western end of the line) gives the graph in Figure10. These results show that the correction computed using theradial component, while correcting the longer period trend,does not compensate for the differences between PS1 and PS2.
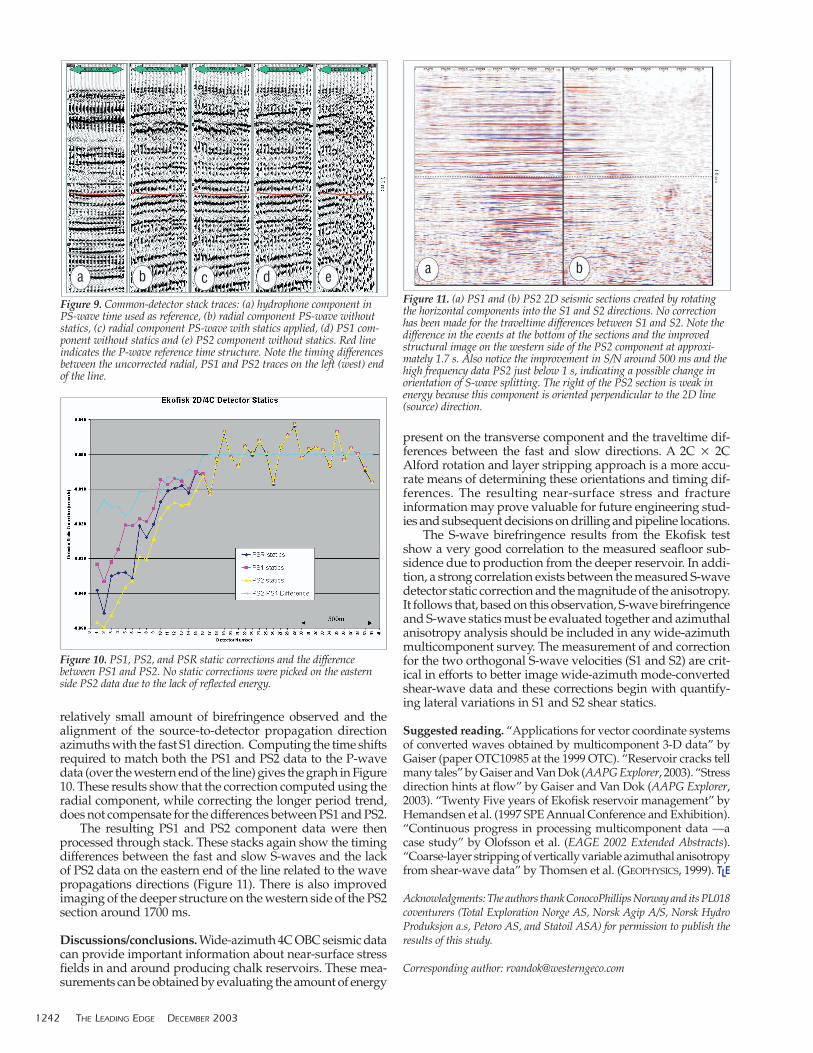
The resulting PS1 and PS2 component data were thenprocessed through stack. These stacks again show the timingdifferences between the fast and slow S-waves and the lackof PS2 data on the eastern end of the line related to the wavepropagations directions (Figure 11). There is also improvedimaging of the deeper structure on the western side of the PS2section around 1700 ms.
Discussions/conclusions. Wide-azimuth 4C OBC seismic datacan provide important information about near-surface stressfields in and around producing chalk reservoirs. These mea-surements can be obtained by evaluating the amount of energy
present on the transverse component and the traveltime dif-ferences between the fast and slow directions. A 2C � 2CAlford rotation and layer stripping approach is a more accu-rate means of determining these orientations and timing dif-ferences. The resulting near-surface stress and fractureinformation may prove valuable for future engineering stud-ies and subsequent decisions on drilling and pipeline locations.
The S-wave birefringence results from the Ekofisk testshow a very good correlation to the measured seafloor sub-sidence due to production from the deeper reservoir. In addi-tion, a strong correlation exists between the measured S-wavedetector static correction and the magnitude of the anisotropy.It follows that, based on this observation, S-wave birefringenceand S-wave statics must be evaluated together and azimuthalanisotropy analysis should be included in any wide-azimuthmulticomponent survey. The measurement of and correctionfor the two orthogonal S-wave velocities (S1 and S2) are crit-ical in efforts to better image wide-azimuth mode-convertedshear-wave data and these corrections begin with quantify-ing lateral variations in S1 and S2 shear statics.
Suggested reading. “Applications for vector coordinate systemsof converted waves obtained by multicomponent 3-D data” byGaiser (paper OTC10985 at the 1999 OTC). “Reservoir cracks tellmany tales” by Gaiser and Van Dok (AAPG Explorer, 2003). “Stressdirection hints at flow” by Gaiser and Van Dok (AAPG Explorer,2003). “Twenty Five years of Ekofisk reservoir management” byHemandsen et al. (1997 SPE Annual Conference and Exhibition).“Continuous progress in processing multicomponent data —acase study” by Olofsson et al. (EAGE 2002 Extended Abstracts).“Coarse-layer stripping of vertically variable azimuthal anisotropyfrom shear-wave data” by Thomsen et al. (GEOPHYSICS, 1999). TLE
Acknowledgments: The authors thank ConocoPhillips Norway and its PL018coventurers (Total Exploration Norge AS, Norsk Agip A/S, Norsk HydroProduksjon a.s, Petoro AS, and Statoil ASA) for permission to publish theresults of this study.
Corresponding author: [email protected]
1242 THE LEADING EDGE DECEMBER 2003
Figure 9. Common-detector stack traces: (a) hydrophone component inPS-wave time used as reference, (b) radial component PS-wave withoutstatics, (c) radial component PS-wave with statics applied, (d) PS1 com-ponent without statics and (e) PS2 component without statics. Red lineindicates the P-wave reference time structure. Note the timing differencesbetween the uncorrected radial, PS1 and PS2 traces on the left (west) endof the line.
Figure 10. PS1, PS2, and PSR static corrections and the differencebetween PS1 and PS2. No static corrections were picked on the easternside PS2 data due to the lack of reflected energy.
Figure 11. (a) PS1 and (b) PS2 2D seismic sections created by rotatingthe horizontal components into the S1 and S2 directions. No correctionhas been made for the traveltime differences between S1 and S2. Note thedifference in the events at the bottom of the sections and the improvedstructural image on the western side of the PS2 component at approxi-mately 1.7 s. Also notice the improvement in S/N around 500 ms and thehigh frequency data PS2 just below 1 s, indicating a possible change inorientation of S-wave splitting. The right of the PS2 section is weak inenergy because this component is oriented perpendicular to the 2D line(source) direction.
a b c d e a b