Embed Size (px)
Citation preview
Near-Miss Event Reporting: Optimizing the Power / Weight Ratio
SHOT/NBTC Educational Update Meeting 20 November 2006
London, UK 11/20/06
H S KaplanColumbia University
“The simplest way to achieve simplicity is through thoughtful reduction” 1
• “When in doubt – just remove.
• But be careful of what you remove.” 1
1.1. Maeda, J. : The Laws of SimplicityMaeda, J. : The Laws of Simplicity
Safety and Reliability are Dynamic Non-Events
• They are not static nonevents
• Safety and reliability have to be re-accomplished over and over.
• “Safety Is Not Bankable”
WeickWeick KK
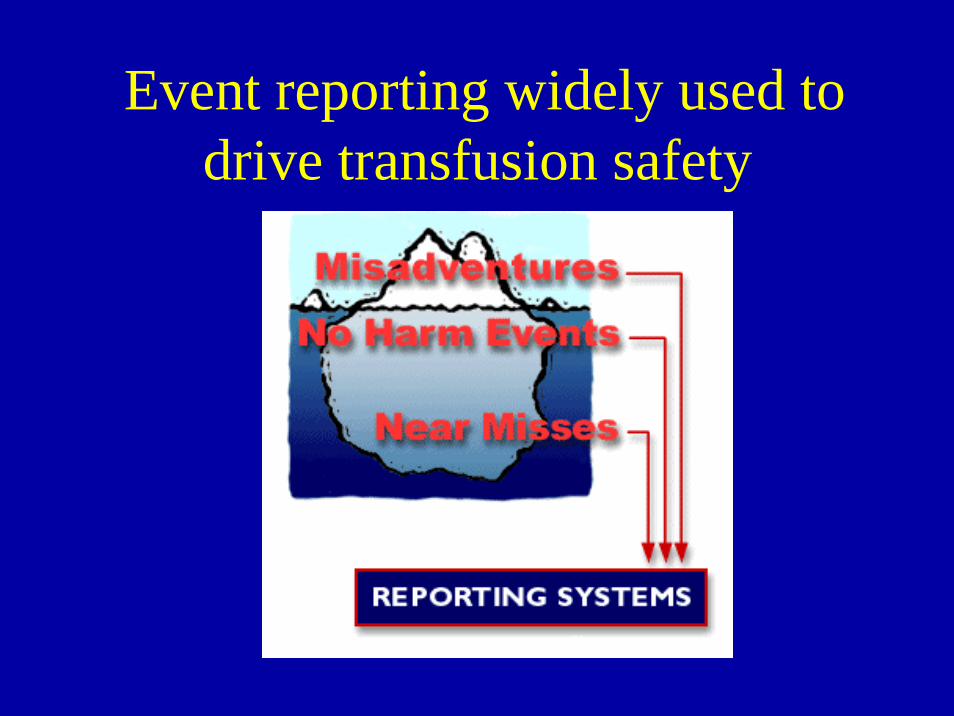
Event reporting widely used to drive transfusion safety
Event reporting criticized for being solely reactive
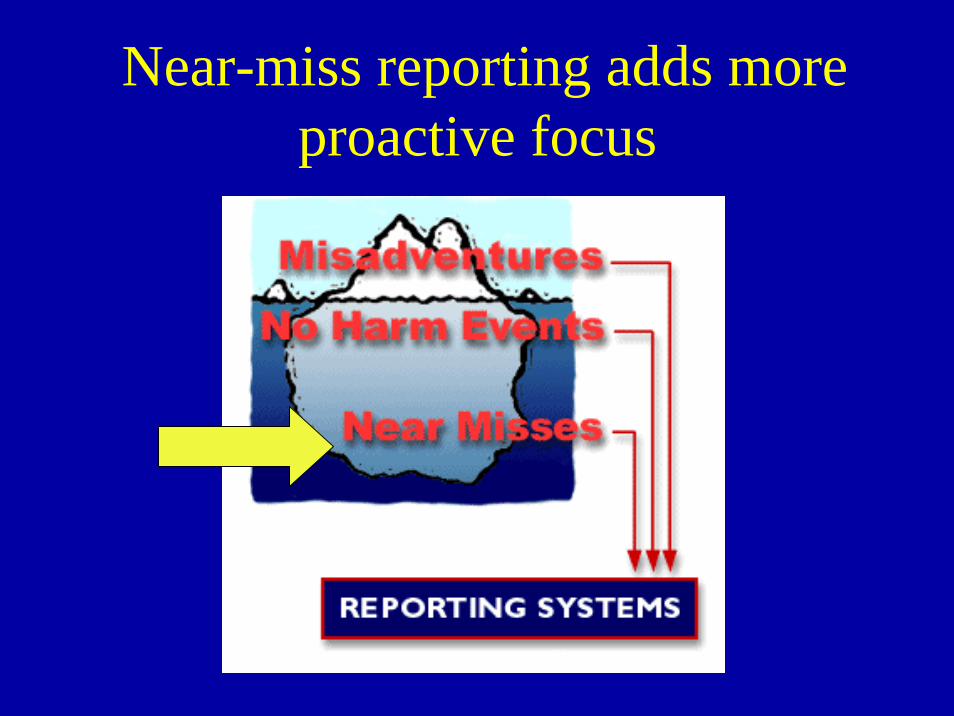
Near-miss reporting adds more proactive focus
SHOT definition near-miss event
• Any error which, if undetected, could result in the determination of a wrong blood group, or issue, collection or administration of an incorrect, inappropriate or unsuitable component, but which was recognized before transfusion took place.
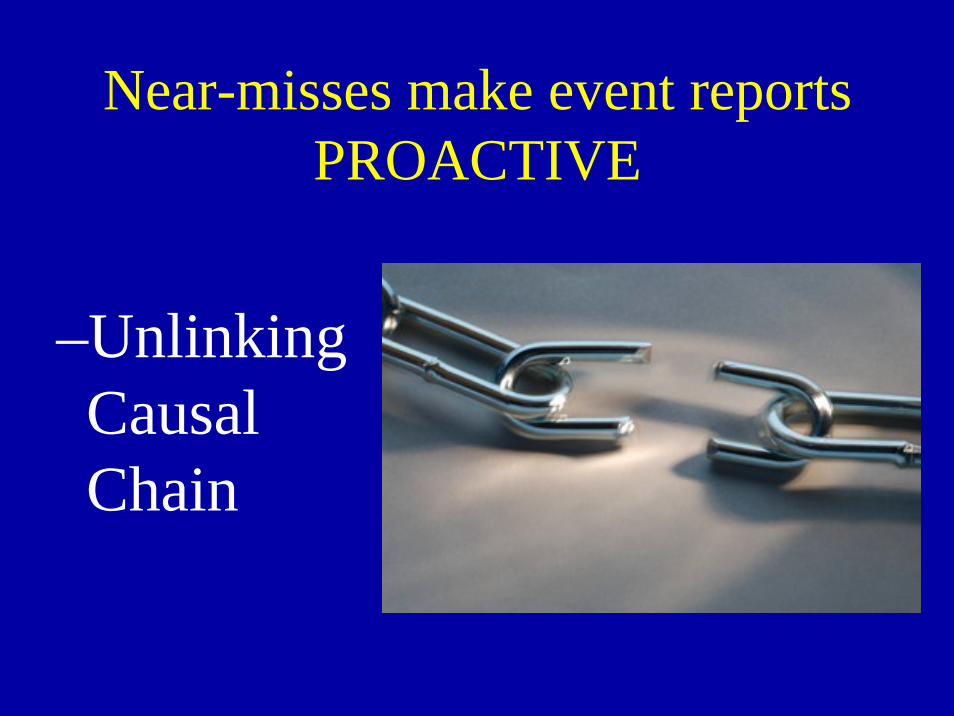
Near-misses make event reports PROACTIVE
–Unlinking Causal Chain
Near-miss reporting has numerous advantages
• Greater numbers provide better insight.
• No burden of patient harm.
• Mindfulness - directly engage staff in safety
• Study recovery – planned or not
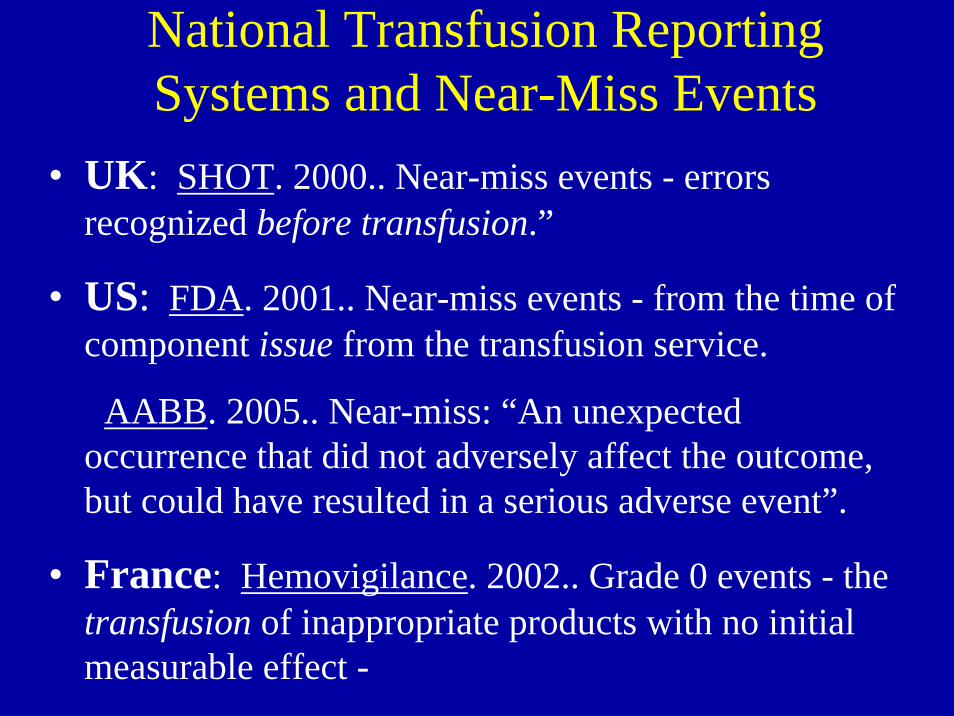
National Transfusion Reporting Systems and Near-Miss Events
• UK: SHOT. 2000.. Near-miss events - errors recognized before transfusion.”
• US: FDA. 2001.. Near-miss events - from the time of component issue from the transfusion service.
AABB. 2005.. Near-miss: “An unexpected occurrence that did not adversely affect the outcome, but could have resulted in a serious adverse event”.
• France: Hemovigilance. 2002.. Grade 0 events - the transfusion of inappropriate products with no initial measurable effect -
Classification of Events in MERS-TM
• Event with Harm – Misadventure
• Event Without Harm• Near-Miss Event
– planned or unplanned recovery
• Dangerous Situation
Our Definitions Define What We See
• We disregard events not classified
• Compliance often limits visibility
Tamuz M.
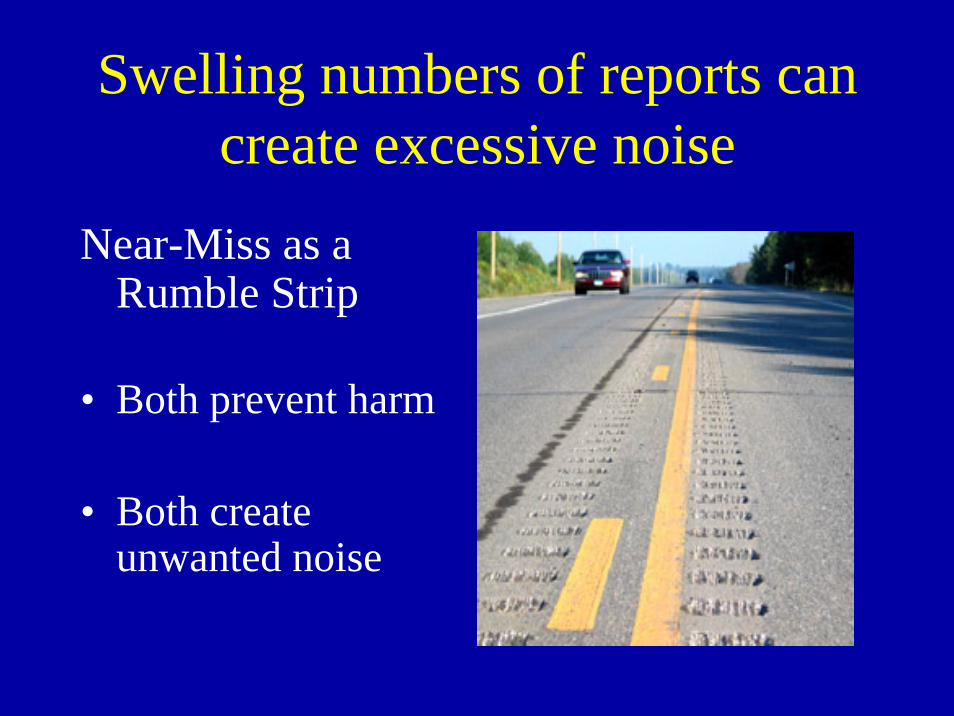
Swelling numbers of reports can create excessive noise
Near-Miss as a Rumble Strip
• Both prevent harm
• Both create unwanted noise
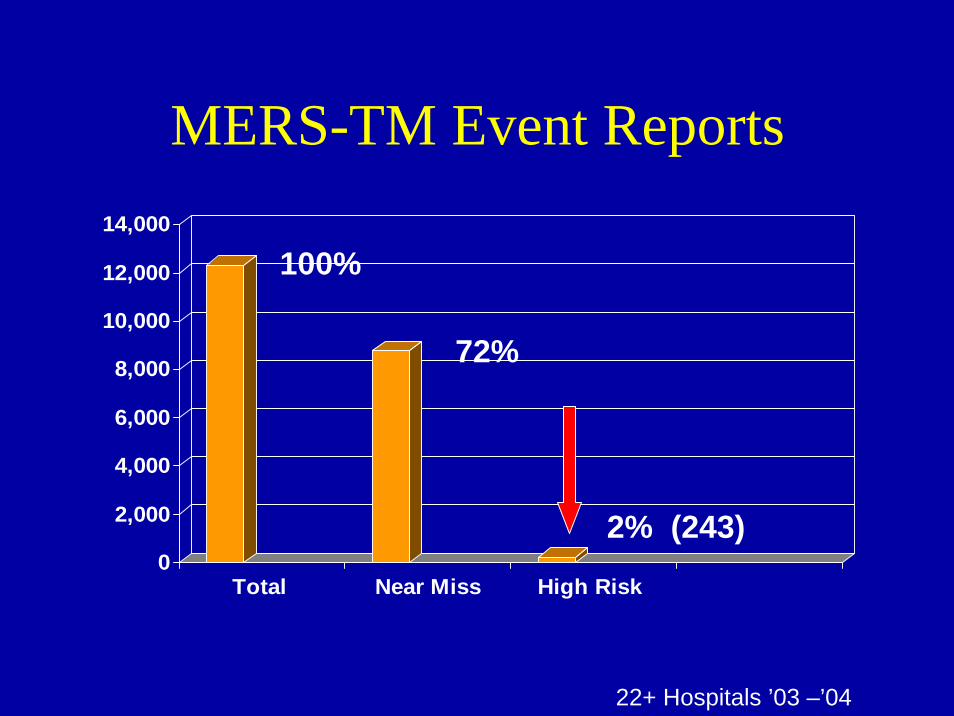
MERS-TM Event Reports
0
2,000
4,000
6,000
8,000
10,000
12,000
14,000
Total Near Miss High Risk
72%
2% (243)
100%
22+ Hospitals ’03 –’04
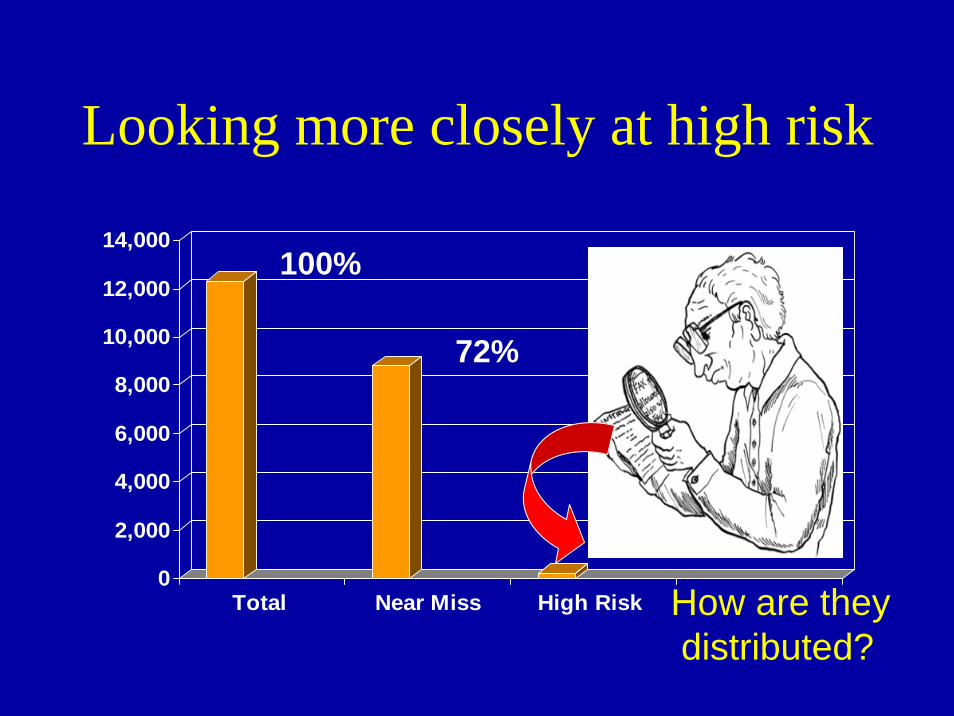
Looking more closely at high risk
0
2,000
4,000
6,000
8,000
10,000
12,000
14,000
Total Near Miss High Risk
72%
2% (243)
100%
How are theydistributed?
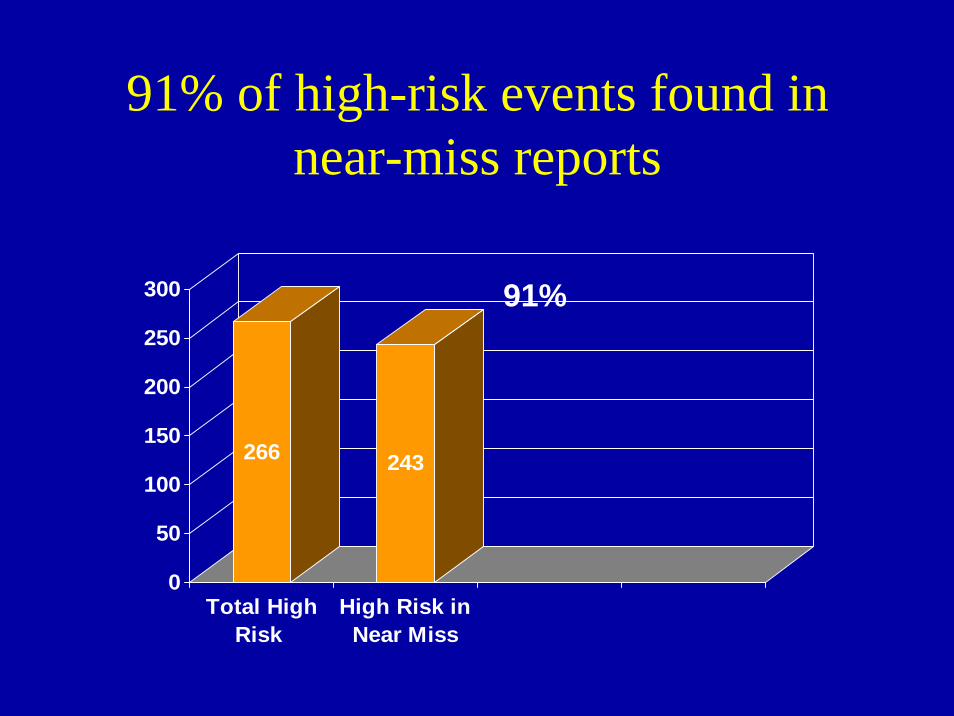
91% of high-risk events found in near-miss reports
266 243
0
50
100
150
200
250
300
Total HighRisk
High Risk inNear Miss
91%
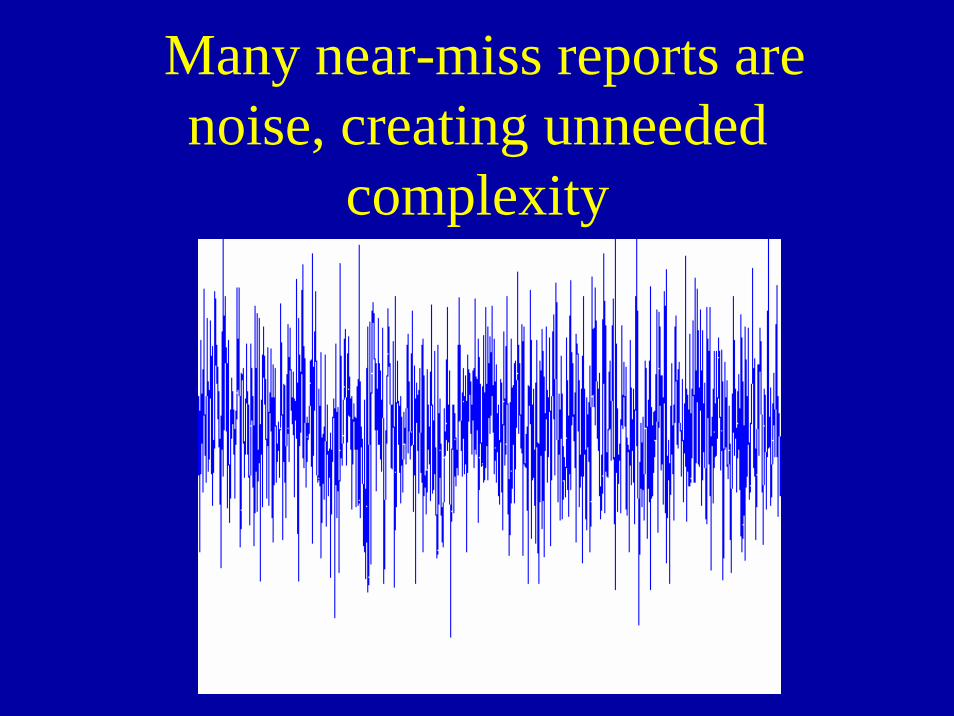
Many near-miss reports are noise, creating unneeded
complexity
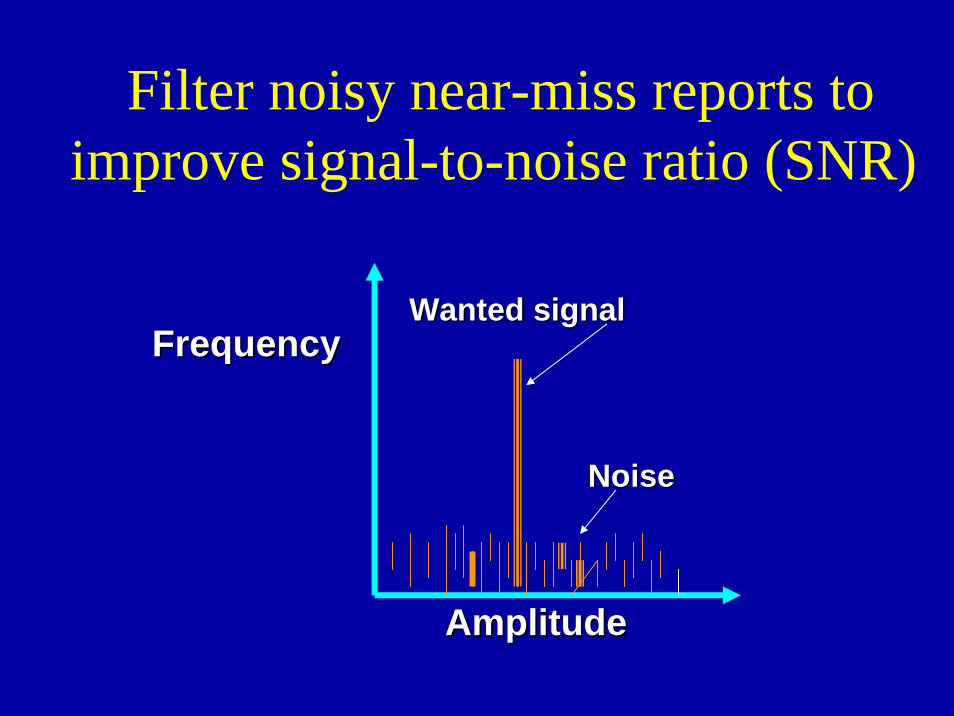
Filter noisy near-miss reports to improve signal-to-noise ratio (SNR)
Wanted signalWanted signal
NoiseNoise
AmplitudeAmplitude
FrequencyFrequency
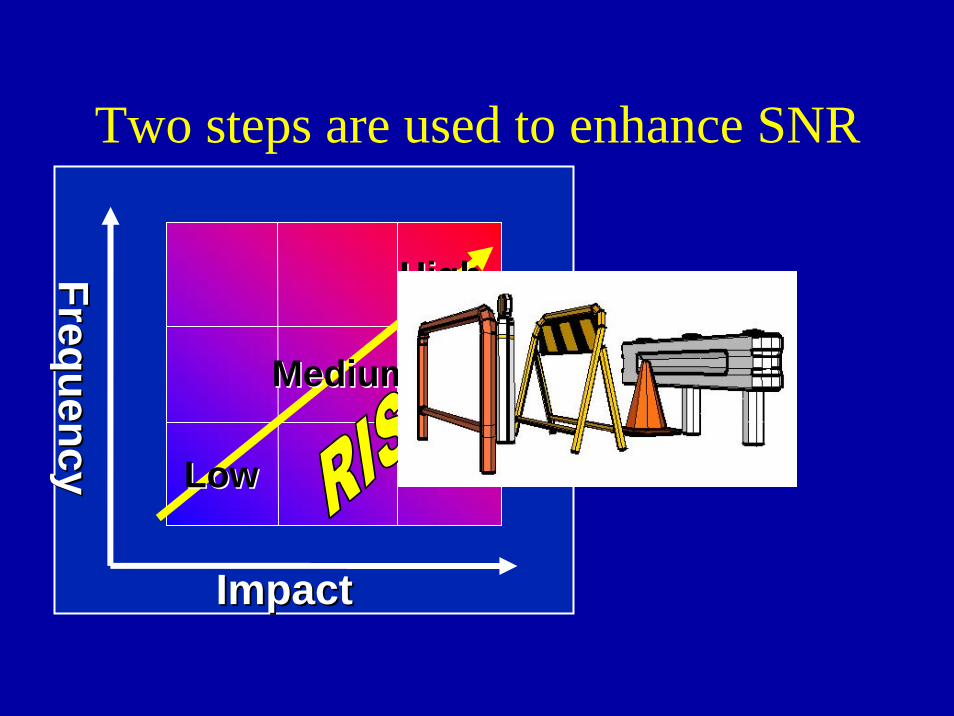
Two steps are used to enhance SNR
ImpactImpact
FrequencyFrequency LowLow
HighHigh
MediumMedium
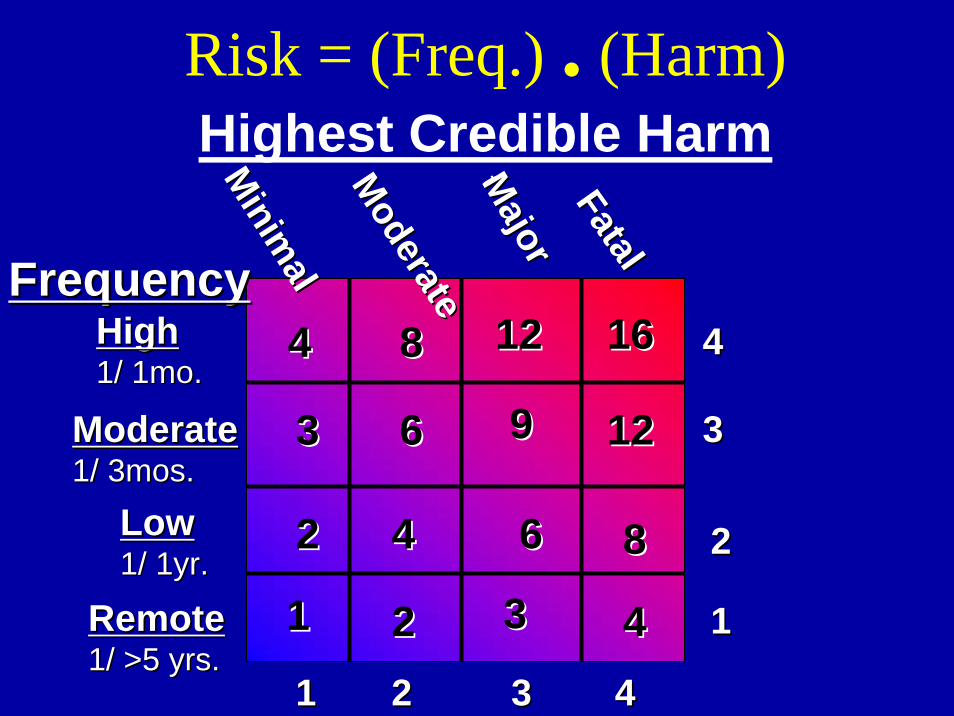
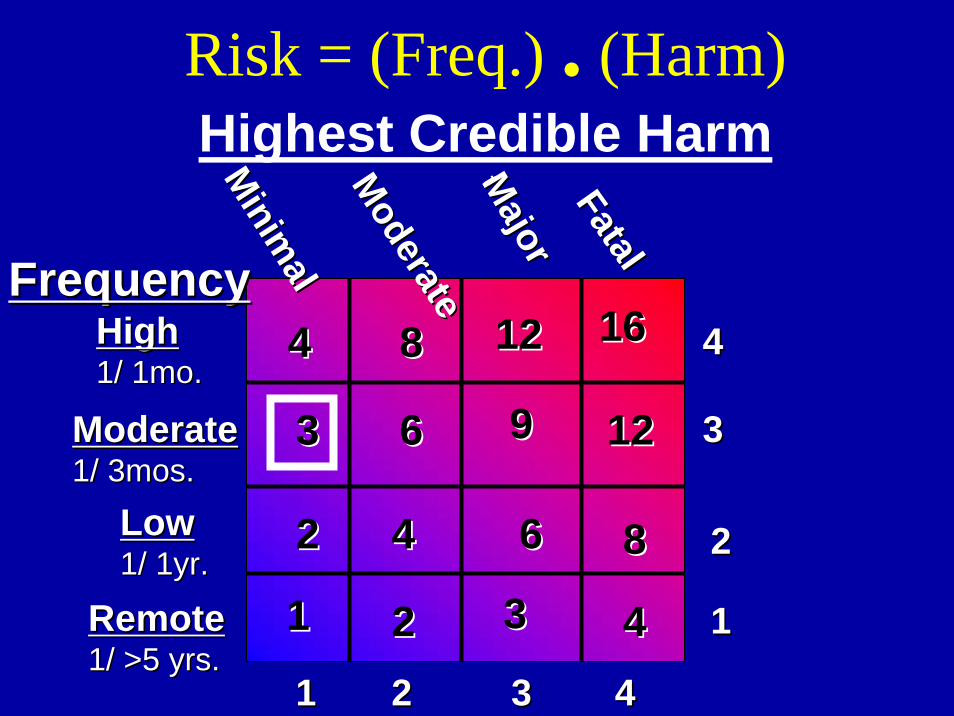
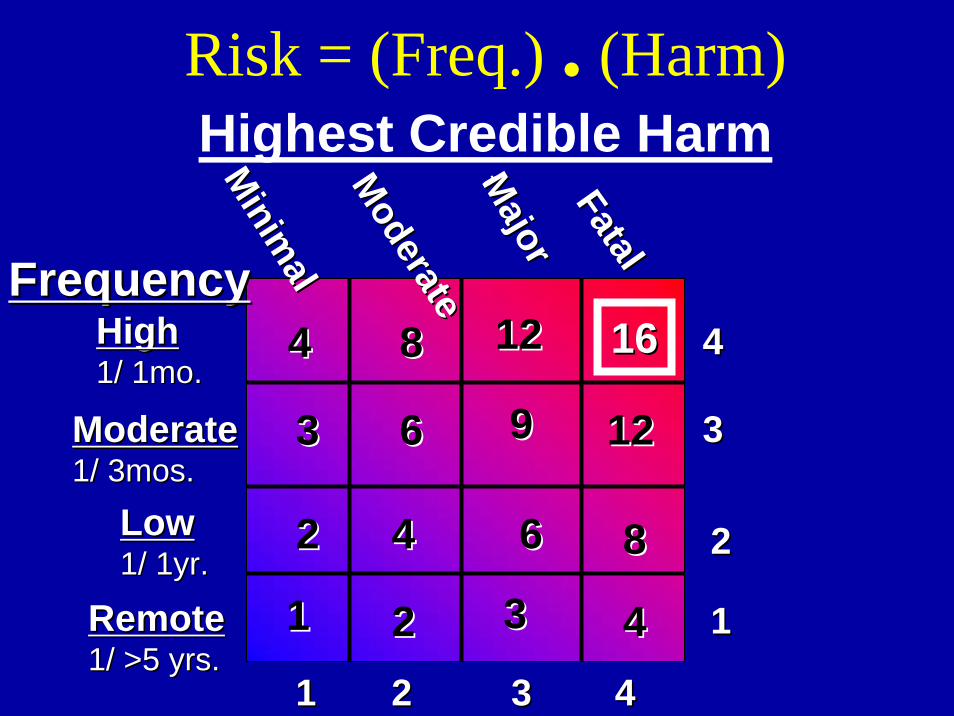
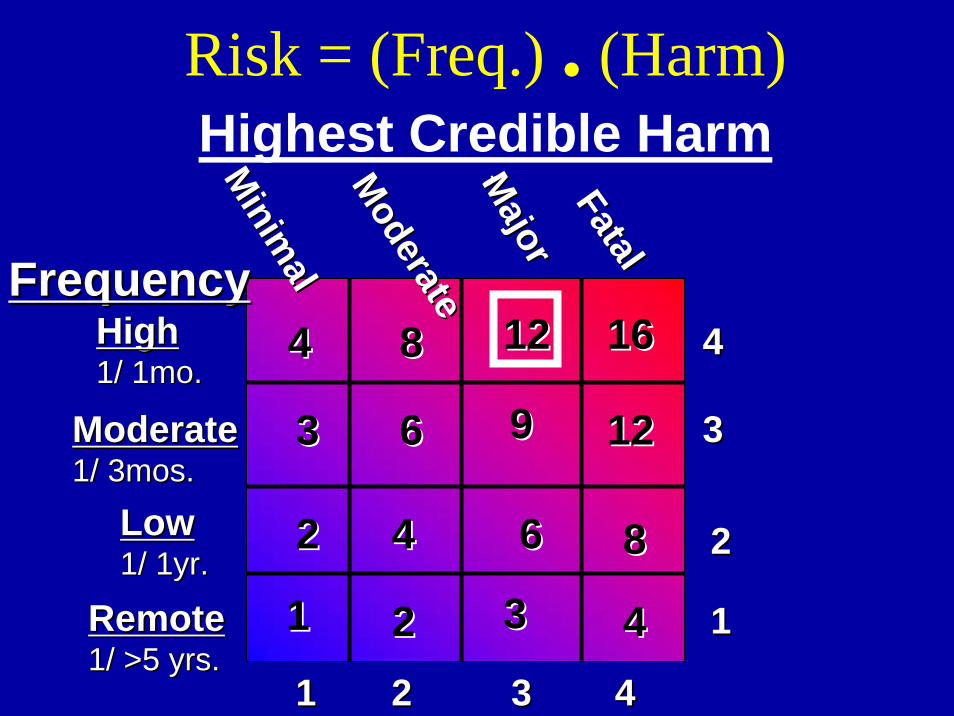
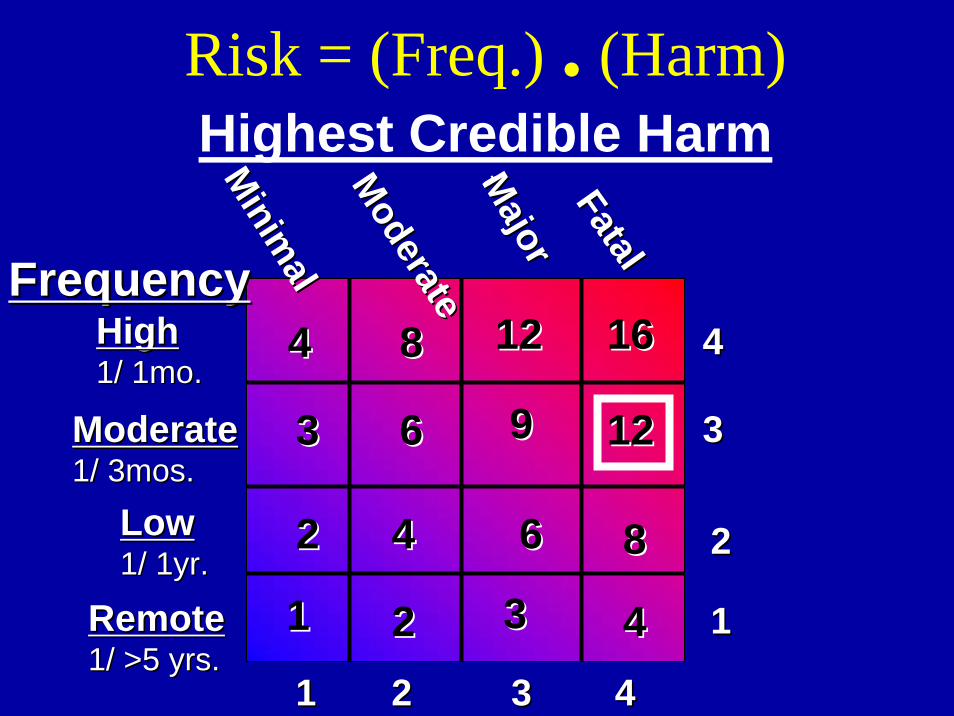
Risk = (Freq.) . (Harm)Highest Credible Harm
11
22
33
44
11 22 33 44
FrequencyFrequency
tt
RemoteRemote1/ >5 yrs.1/ >5 yrs.
LowLow1/ 1yr.1/ 1yr.
ModerateModerate1/ 3mos.1/ 3mos.
HighHigh1/ 1mo.1/ 1mo.
16161212
1212
88
99
88
44
66
66
44
33
44
3322
22
11
Minim
al
Minim
alModerate
ModerateM
ajorM
ajorFatalFatal
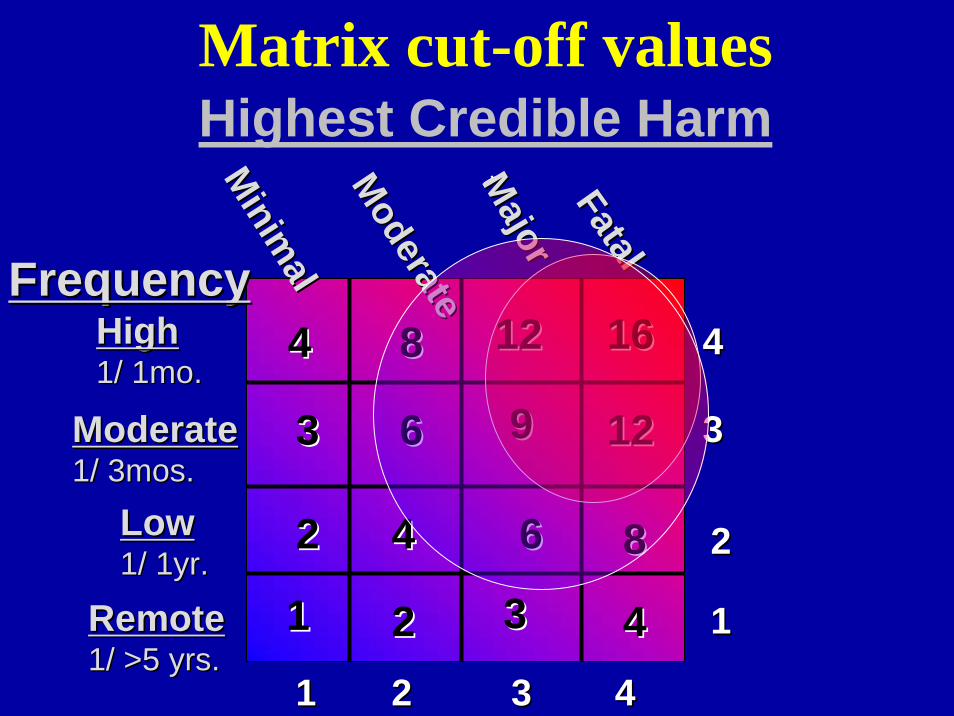
Matrix cut-off valuesHighest Credible Harm
11
22
33
44
11 22 33 44
FrequencyFrequency
tt
RemoteRemote1/ >5 yrs.1/ >5 yrs.
LowLow1/ 1yr.1/ 1yr.
ModerateModerate1/ 3mos.1/ 3mos.
HighHigh1/ 1mo.1/ 1mo.
16161212
1212
88
99
88
44
66
66
44
33
44
3322
22
11
Minim
al
Minim
alModerate
ModerateM
ajorM
ajorFatalFatal
Use barrier analysis to further enhance signal-to-noise ratio
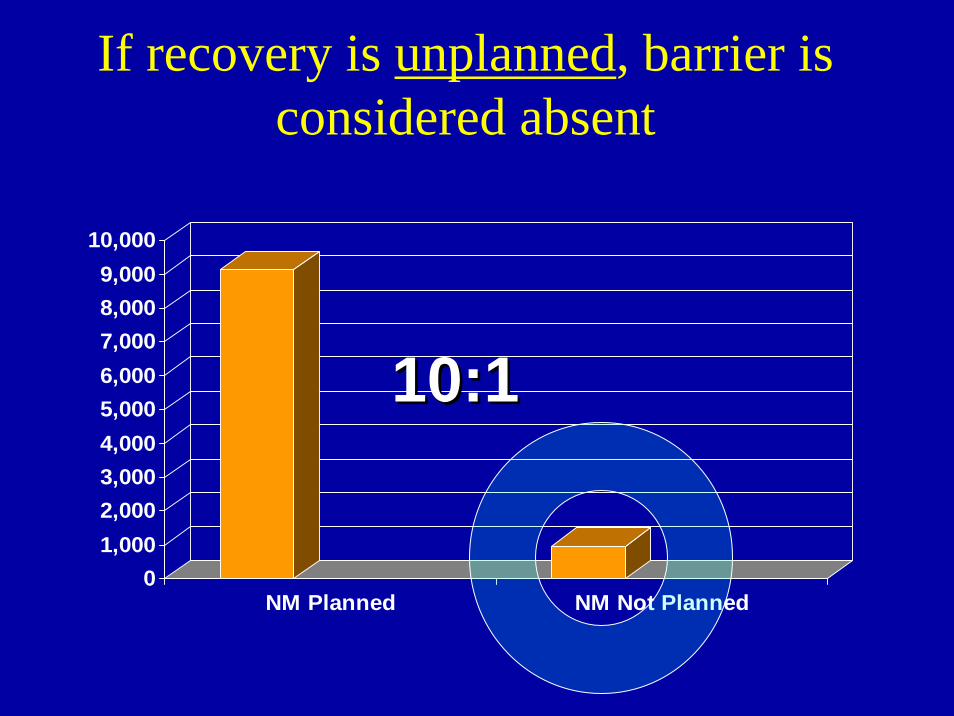
If recovery is unplanned, barrier is considered absent
01,0002,0003,0004,0005,0006,0007,0008,0009,000
10,000
NM Planned NM Not Planned
10:110:1
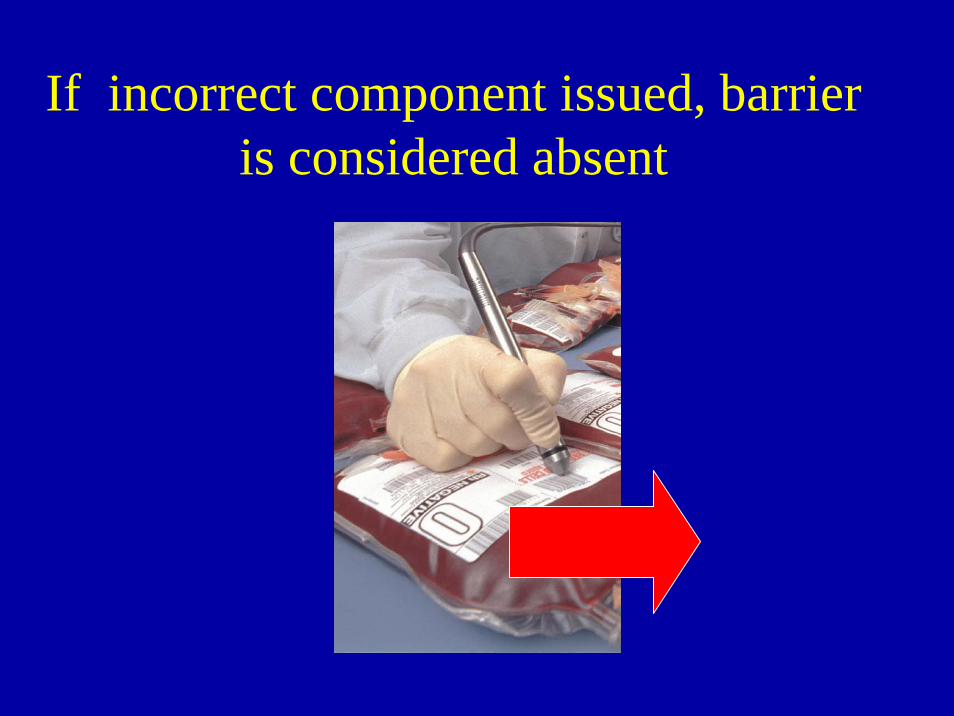
If incorrect component issued, barrier is considered absent
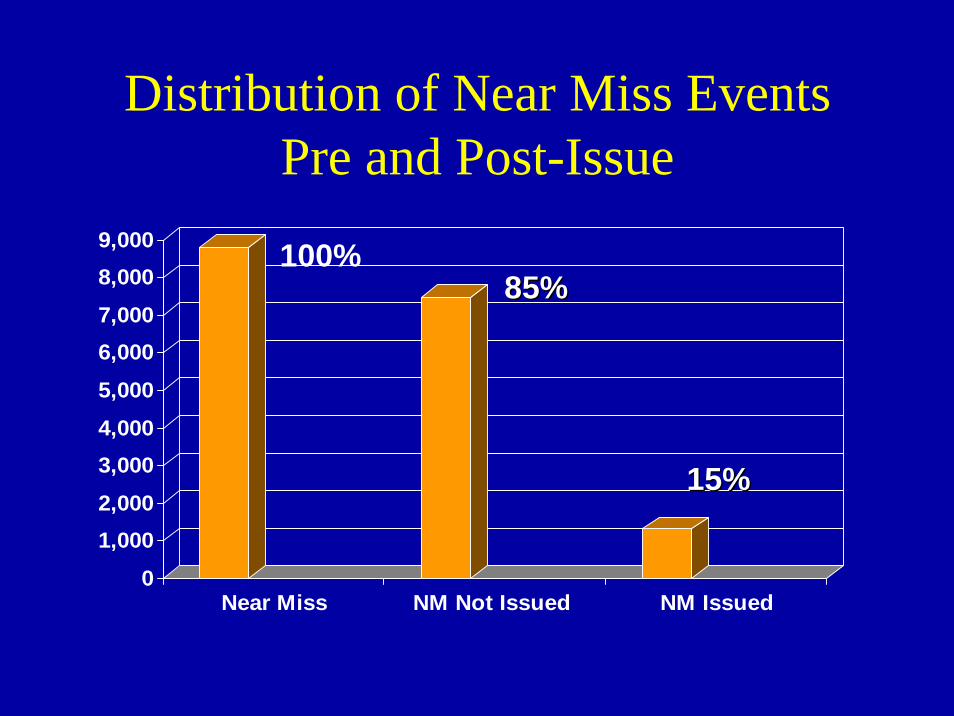
Distribution of Near Miss Events Pre and Post-Issue
0
1,0002,000
3,0004,000
5,000
6,0007,000
8,0009,000
Near Miss NM Not Issued NM Issued
100%85%85%
15%15%
Barrier Characteristics are another useful sorting means
• Conditional on another variable?
• Dependant on single human performance?
• If computer supported, is it readily over-ridden?
• Failure readily detected?
How do we track all reports including the filtered ones?
• Similarity “Fuzzy” Matching (“HAWK”)
• Statistical Process Control (SPC)
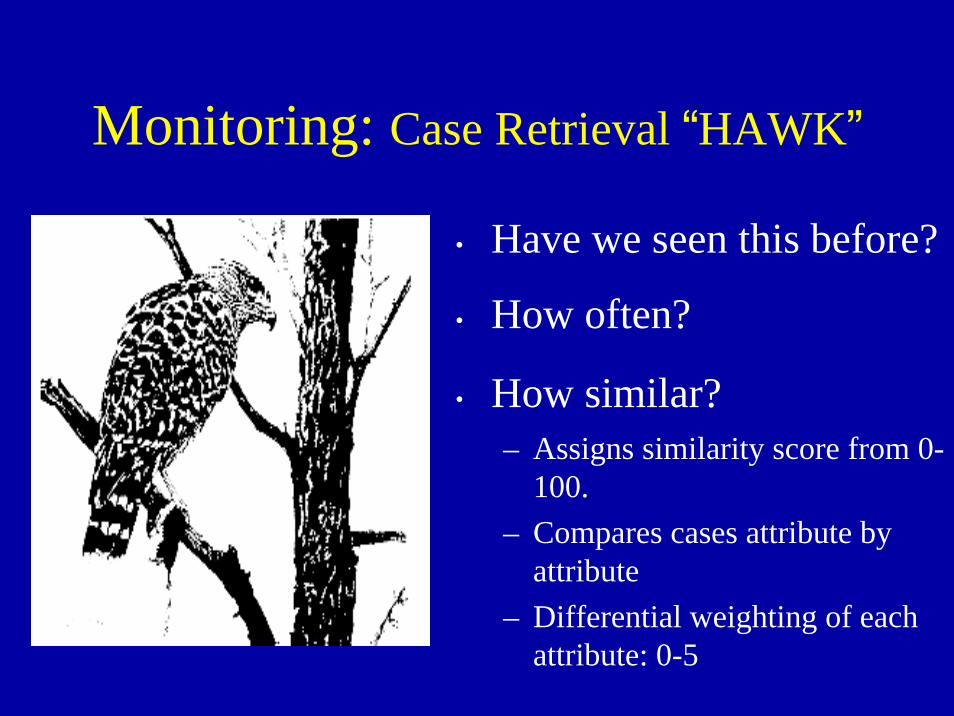
• Have we seen this before?
• How often?
• How similar?– Assigns similarity score from 0-
100.– Compares cases attribute by
attribute– Differential weighting of each
attribute: 0-5
Monitoring: Case Retrieval “HAWK”
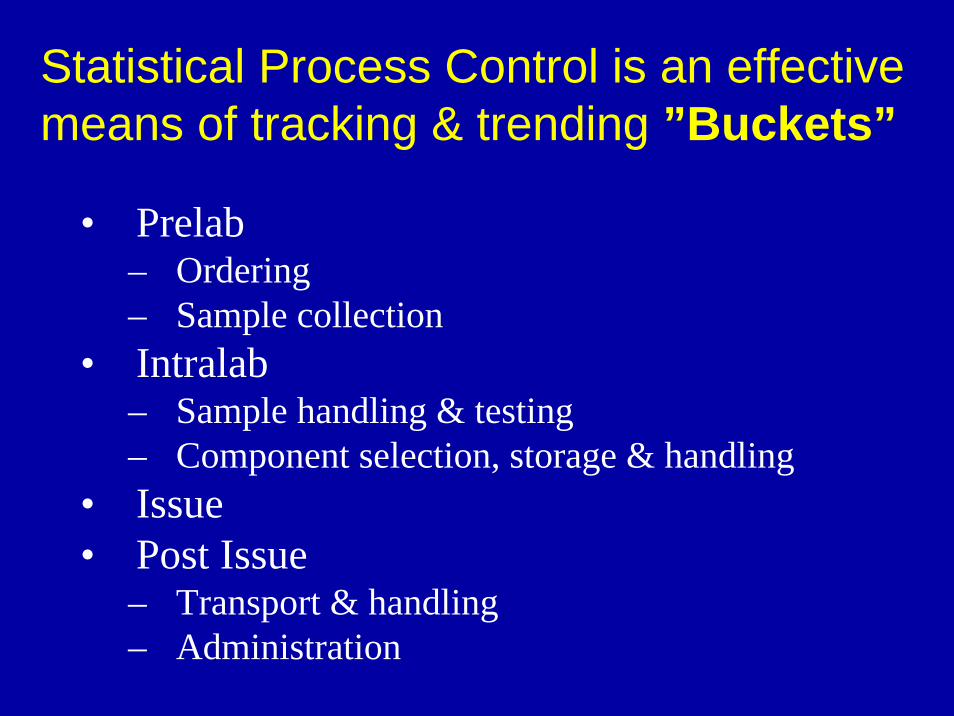
• Prelab– Ordering– Sample collection
• Intralab– Sample handling & testing – Component selection, storage & handling
• Issue• Post Issue
– Transport & handling– Administration
Statistical Process Control is an effective means of tracking & trending ”Buckets”
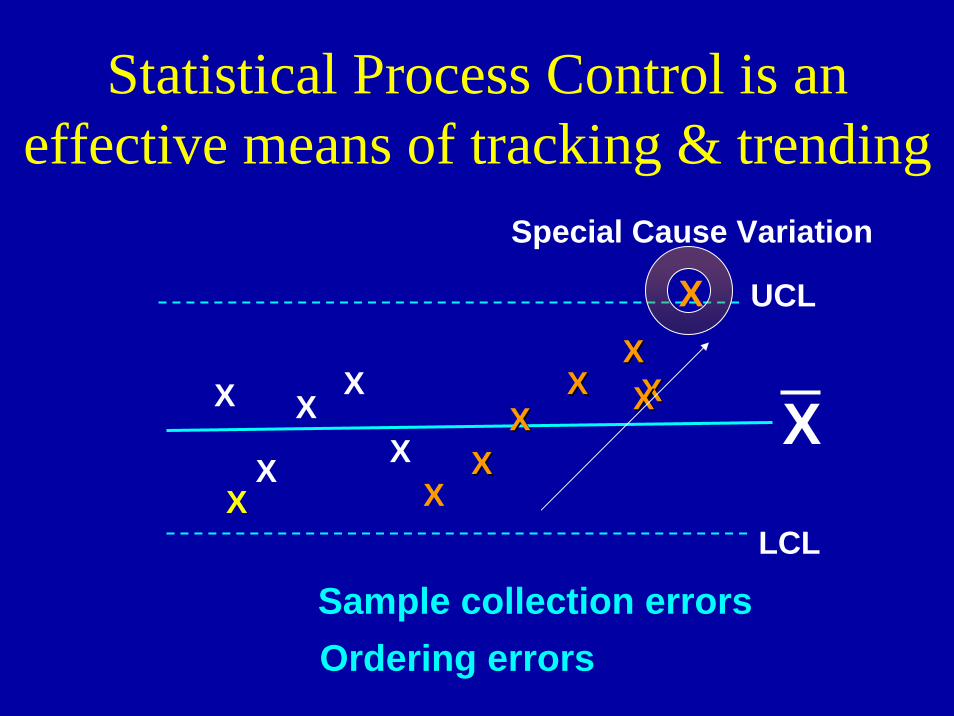
Statistical Process Control is an effective means of tracking & trending
X
UCL
LCLX
X
XX
XXXX
XXXXXX
X
XX
X
X
X
Special Cause Variation
Sample collection errorsOrdering errors
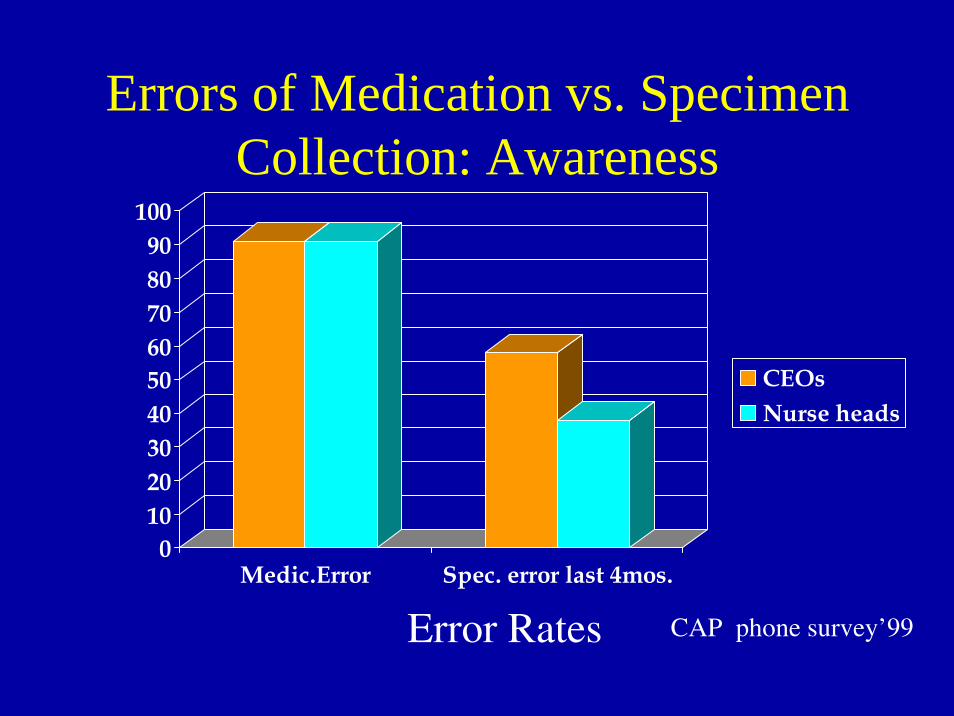
Errors of Medication vs. Specimen Collection: Awareness
0102030405060708090
100
Medic.Error Spec. error last 4mos.
CEOsNurse heads
Error Rates CAP phone survey’99
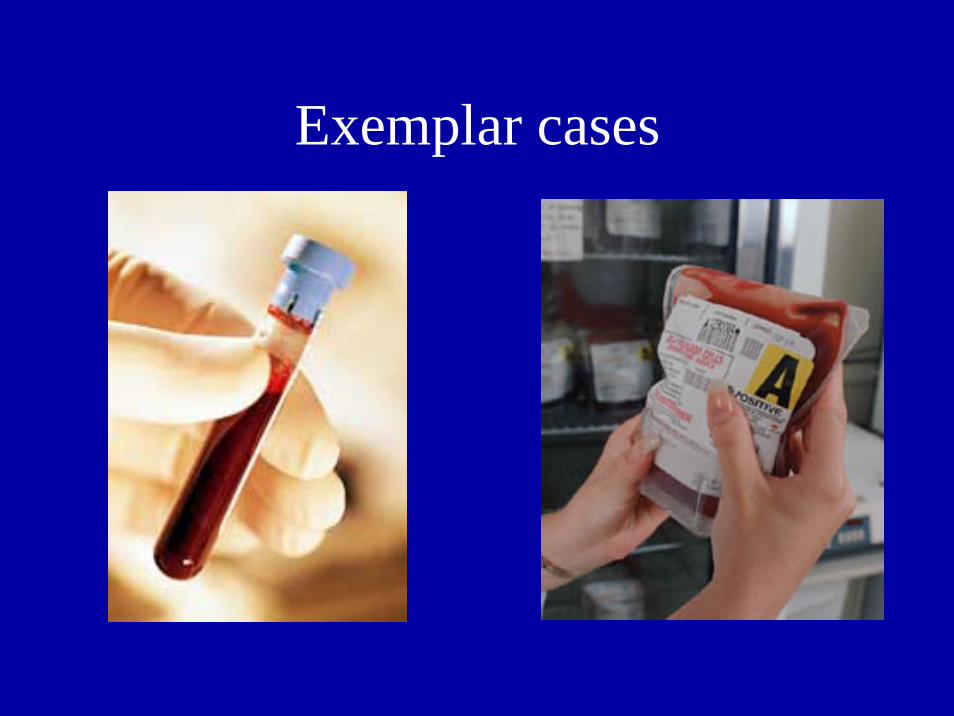
Exemplar cases
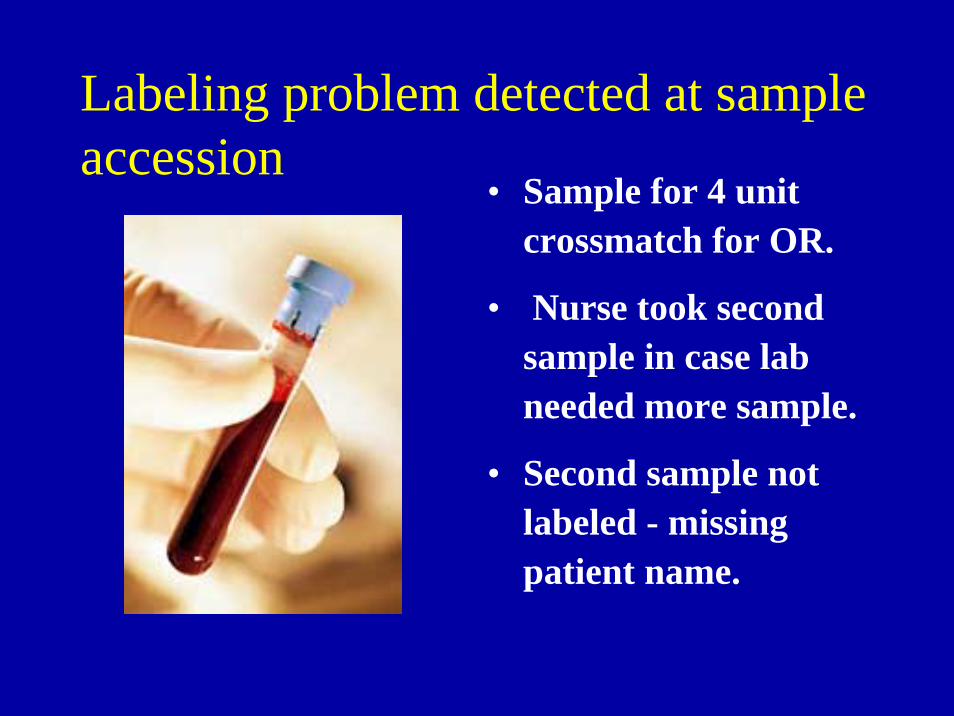
Labeling problem detected at sample accession
• Sample for 4 unit crossmatch for OR.
• Nurse took second sample in case lab needed more sample.
• Second sample not labeled - missing patient name.
Risk = (Freq.) . (Harm)Highest Credible Harm
11
22
33
44
11 22 33 44
FrequencyFrequency
tt
RemoteRemote1/ >5 yrs.1/ >5 yrs.
LowLow1/ 1yr.1/ 1yr.
ModerateModerate1/ 3mos.1/ 3mos.
HighHigh1/ 1mo.1/ 1mo.
1212
1212
88
99
88
44
66
66
44
33
44
3322
22
11
Minim
al
Minim
alModerate
ModerateM
ajorM
ajorFatalFatal
1616
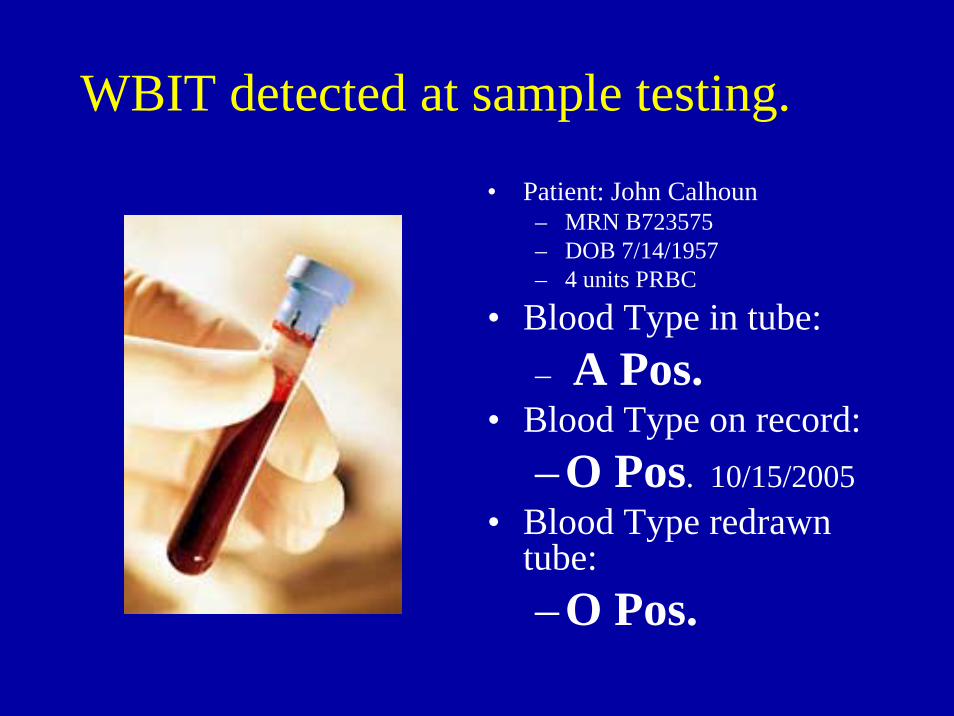
WBIT detected at sample testing.
• Patient: John Calhoun– MRN B723575– DOB 7/14/1957– 4 units PRBC
• Blood Type in tube:– A Pos.
• Blood Type on record:–O Pos. 10/15/2005
• Blood Type redrawn tube:–O Pos.
Risk = (Freq.) . (Harm)Highest Credible Harm
11
22
33
44
11 22 33 44
FrequencyFrequency
tt
RemoteRemote1/ >5 yrs.1/ >5 yrs.
LowLow1/ 1yr.1/ 1yr.
ModerateModerate1/ 3mos.1/ 3mos.
HighHigh1/ 1mo.1/ 1mo.
16161212
1212
88
99
88
44
66
66
44
33
44
3322
22
11
Minim
al
Minim
alModerate
ModerateM
ajorM
ajorFatalFatal
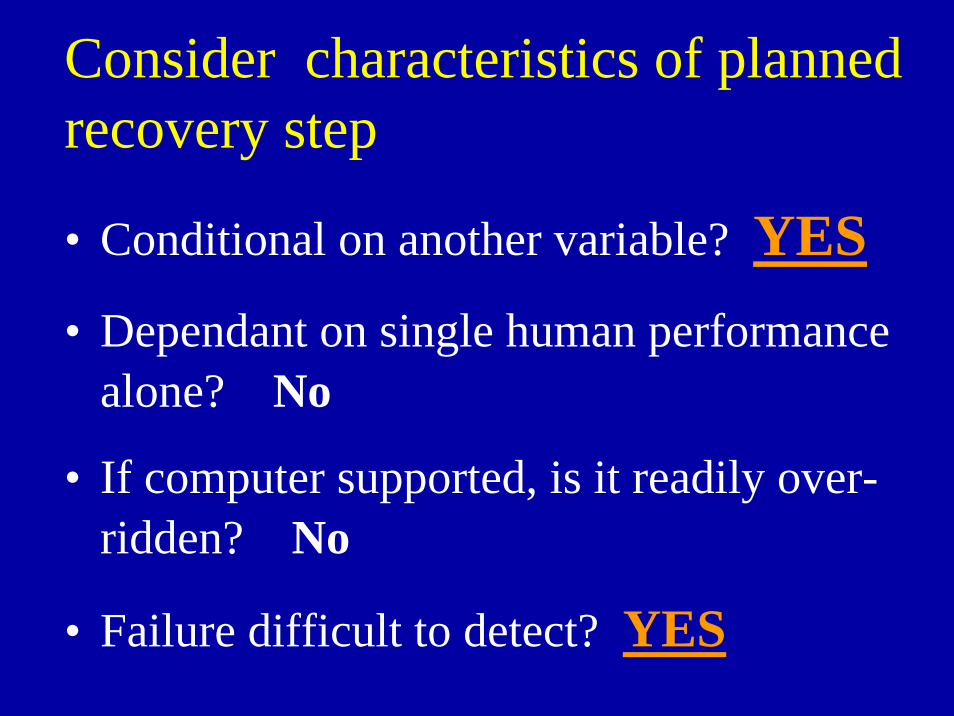
Consider characteristics of planned recovery step
• Conditional on another variable? YES• Dependant on single human performance
alone? No
• If computer supported, is it readily over-ridden? No
• Failure difficult to detect? YES
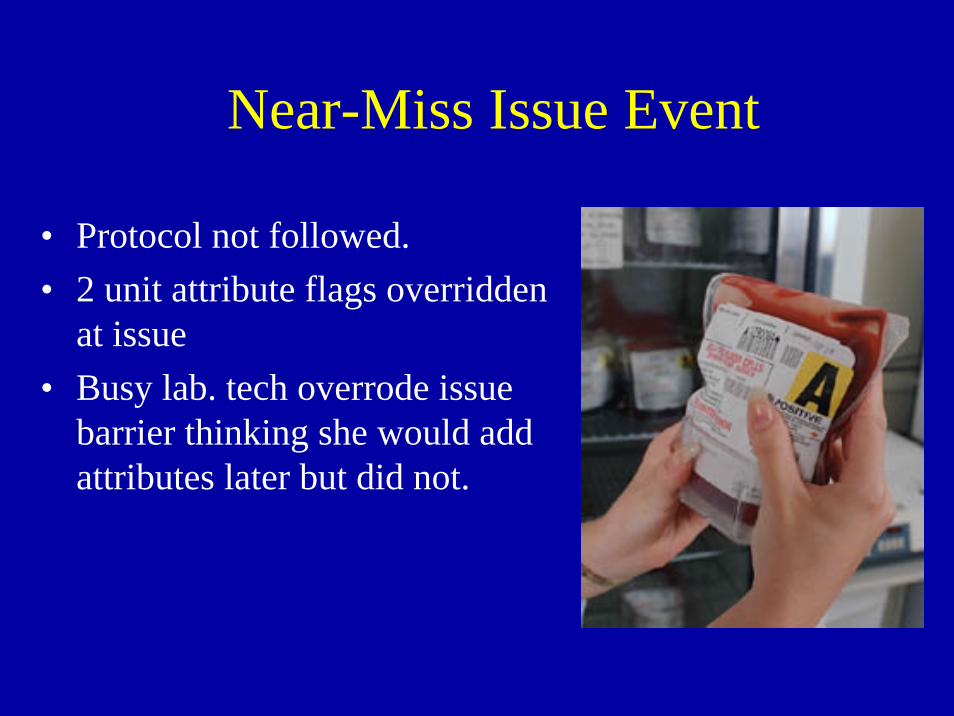
Near-Miss Issue Event
• Protocol not followed.• 2 unit attribute flags overridden
at issue• Busy lab. tech overrode issue
barrier thinking she would add attributes later but did not.
Risk = (Freq.) . (Harm)Highest Credible Harm
11
22
33
44
11 22 33 44
FrequencyFrequency
tt
RemoteRemote1/ >5 yrs.1/ >5 yrs.
LowLow1/ 1yr.1/ 1yr.
ModerateModerate1/ 3mos.1/ 3mos.
HighHigh1/ 1mo.1/ 1mo.
1212
1212
88
99
88
44
66
66
44
33
44
3322
22
11
Minim
al
Minim
alModerate
ModerateM
ajorM
ajorFatalFatal
1616
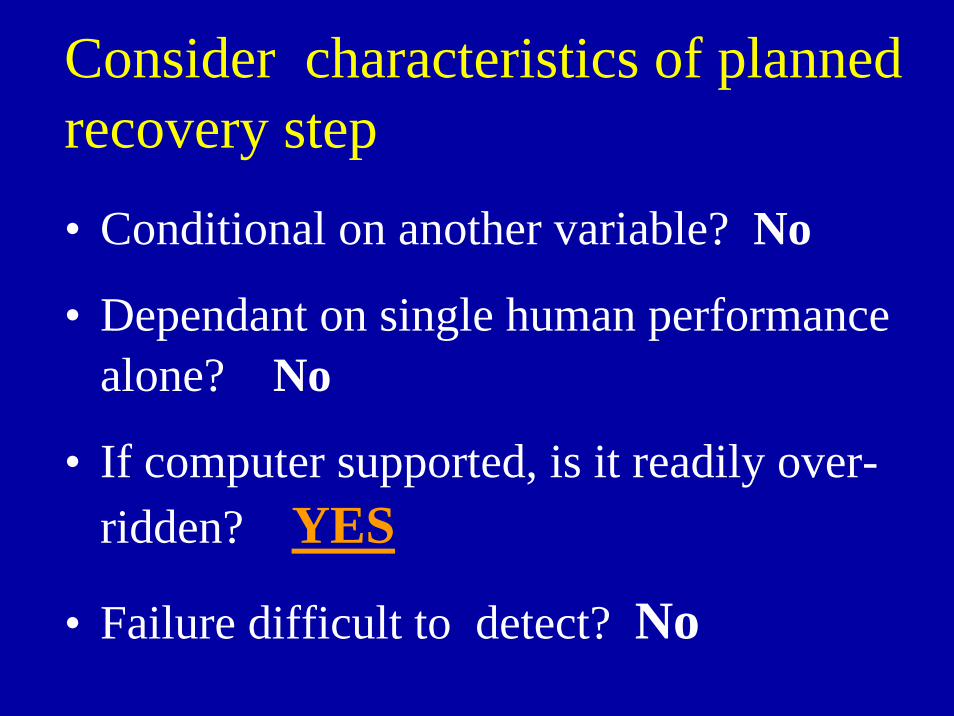
Consider characteristics of planned recovery step
• Conditional on another variable? No
• Dependant on single human performance alone? No
• If computer supported, is it readily over-ridden? YES
• Failure difficult to detect? No
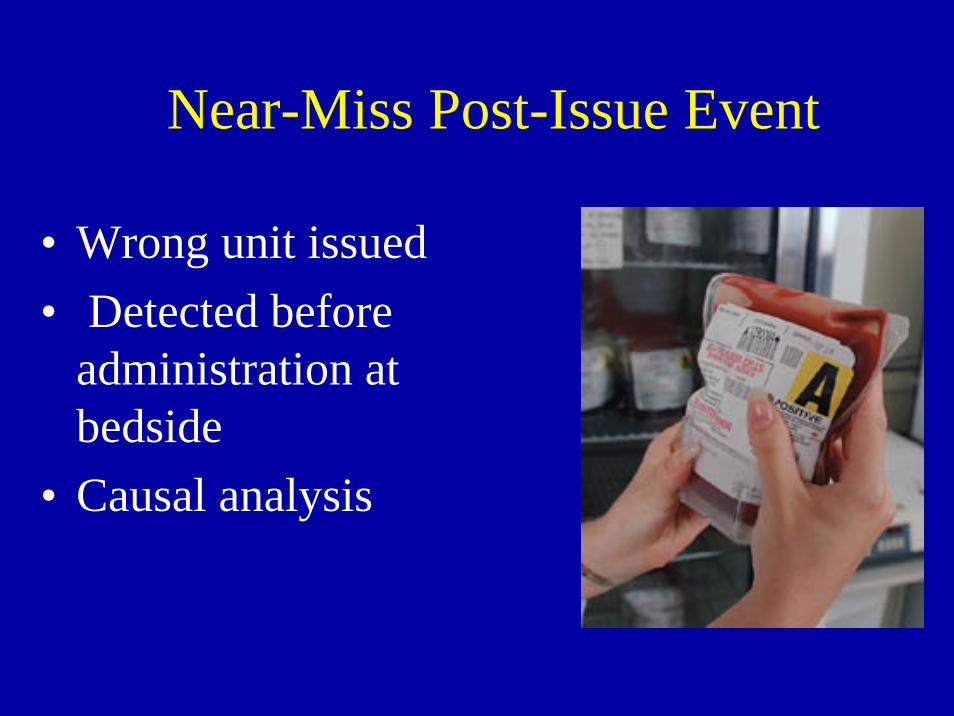
Near-Miss Post-Issue Event
• Wrong unit issued• Detected before
administration at bedside
• Causal analysis
Risk = (Freq.) . (Harm)Highest Credible Harm
11
22
33
44
11 22 33 44
FrequencyFrequency
tt
RemoteRemote1/ >5 yrs.1/ >5 yrs.
LowLow1/ 1yr.1/ 1yr.
ModerateModerate1/ 3mos.1/ 3mos.
HighHigh1/ 1mo.1/ 1mo.
1212
1212
88
99
88
44
66
66
44
33
44
3322
22
11
Minim
al
Minim
alModerate
ModerateM
ajorM
ajorFatalFatal
1616
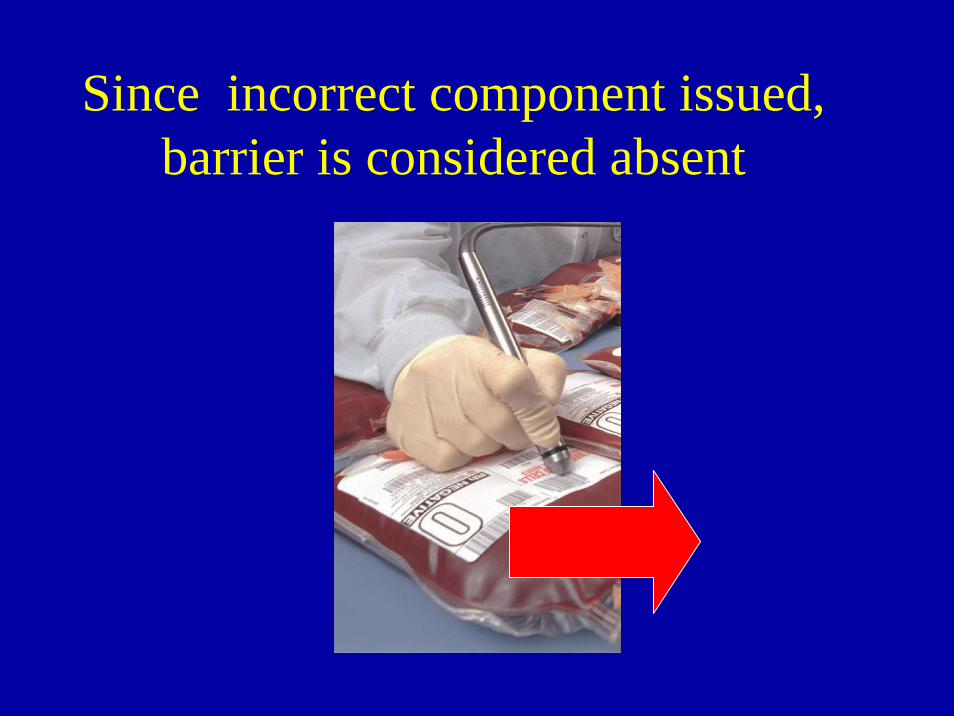
Since incorrect component issued, barrier is considered absent
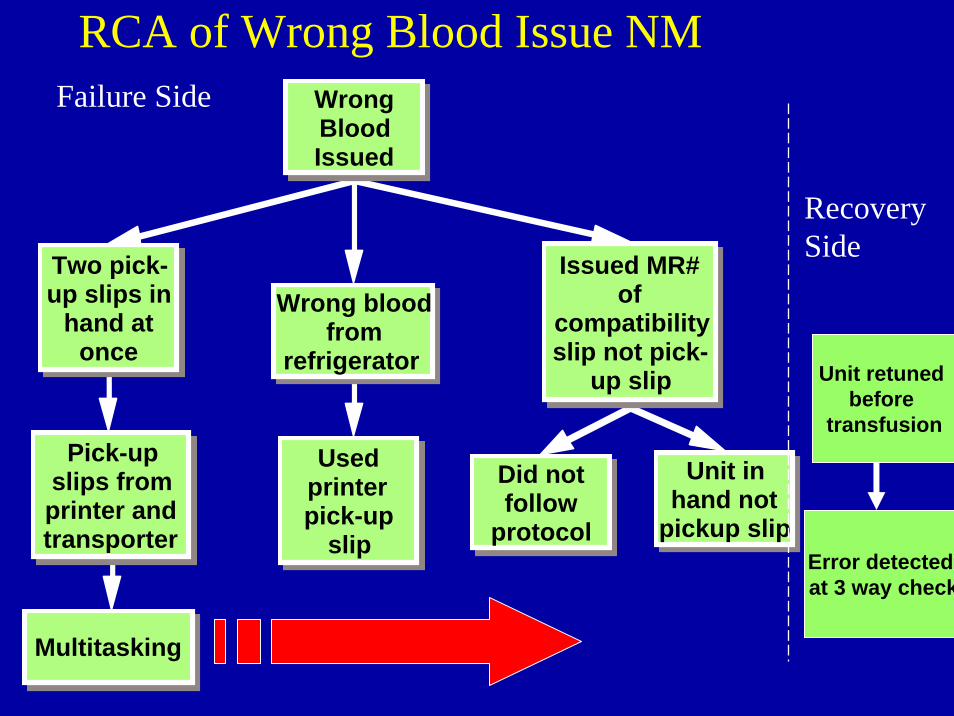
Wrong Blood Issued
Two pick-up slips in
hand at once
Pick-up slips from printer and transporter
Multitasking
Wrong blood from
refrigerator
Used printer pick-up
slip
Issued MR# of
compatibility slip not pick-
up slip
Did not follow
protocol
Unit in hand not
pickup slip
Unit retuned before
transfusion
Error detectedat 3 way check
Failure Side
RecoverySide
RCA of Wrong Blood Issue NM
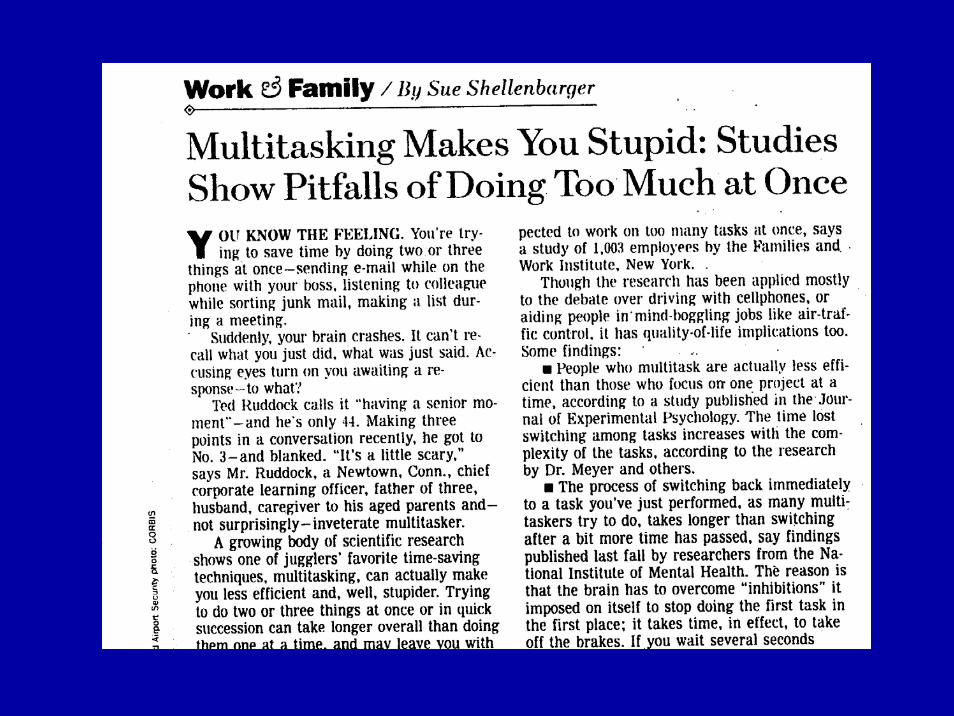
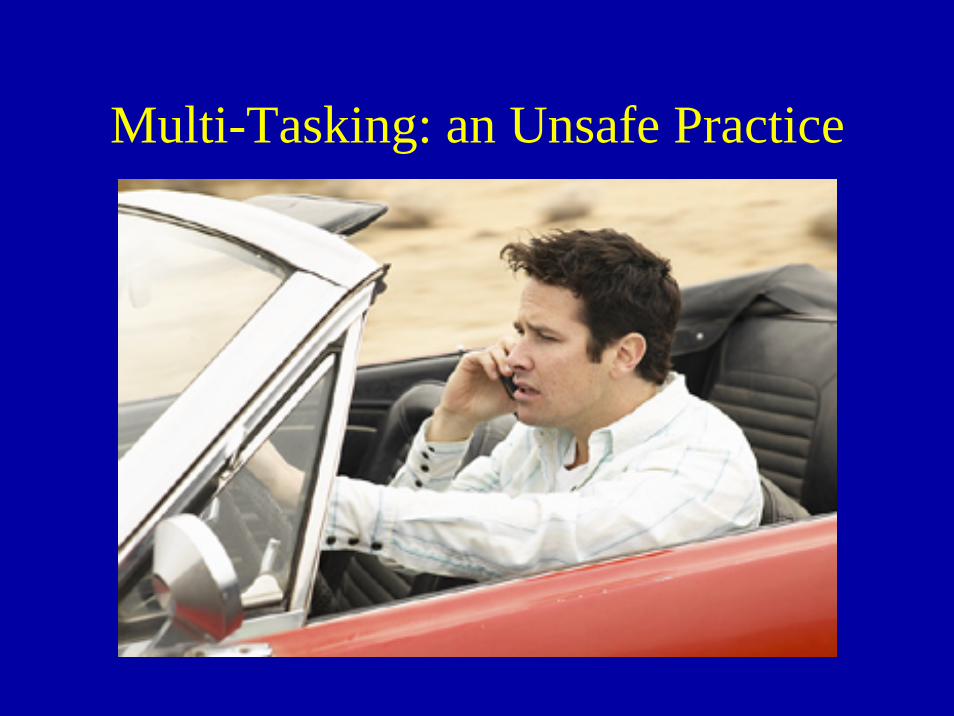
Multi-Tasking: an Unsafe Practice
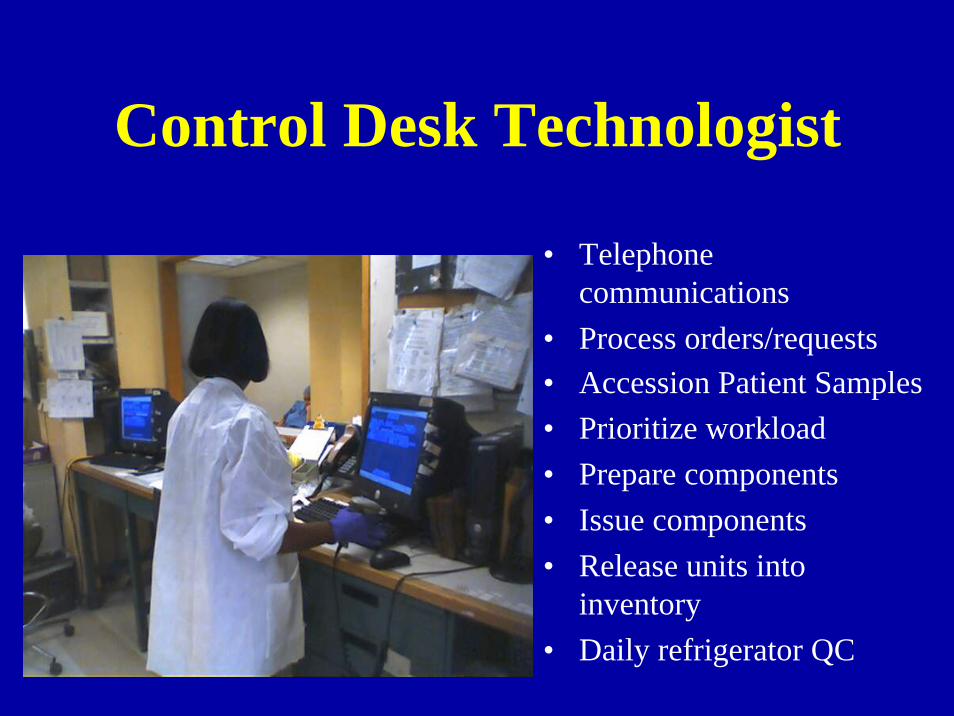
Control Desk Technologist
• Telephone communications
• Process orders/requests• Accession Patient Samples• Prioritize workload• Prepare components• Issue components• Release units into
inventory• Daily refrigerator QC
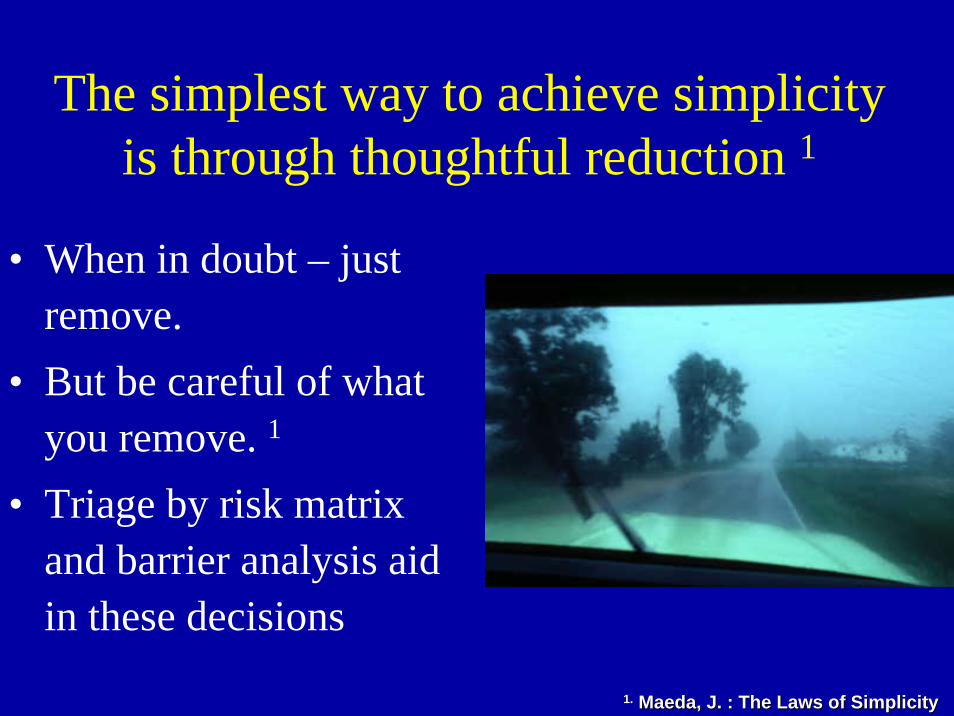
The simplest way to achieve simplicity is through thoughtful reduction 1
• When in doubt – just remove.
• But be careful of what you remove. 1
• Triage by risk matrix and barrier analysis aid in these decisions
1.1. Maeda, J. : The Laws of SimplicityMaeda, J. : The Laws of Simplicity