Embed Size (px)
Citation preview

nature materials | VOL 8 | APRIL 2009 | www.nature.com/naturematerials 281
insight | review articlesPublished online: 24 march 2009 | doi: 10.1038/nmat2399
Without contrast, any inherent spatial resolution of a microscope is useless. It is thus the contrast mechanism that often imparts unique capabilities to a
microscopy technique. Such uniqueness can be provided by the specific interaction of soft X-rays with matter. Most fruitful is the exploitation of the absorption process of a soft X-ray photon near an absorption edge, that is, near-edge X-ray absorption fine-structure (NEXAFS) spectroscopy, as the detailed dependence of absorption on photon energy reveals much of the electronic structure — core and unoccupied valence states — of the material investigated1,2. This provides excellent quantitative elemental and functional sensitivity3 and, if coupled to the polarization state of the photons, can also characterize bond orientation4 and magnetic domain structure5. Pump–probe-type experiments even allow for very high time resolution and the investigation of magnetic-domain dynamics6,7.
NEXAFS microscopy, and soft X-ray microscopy in general, is a comparatively young discipline that is still rapidly evolving and developing. The field is in the transition to an ‘industrial stage’, in which commercial companies emerge to provide for the needs of a wide range of users. This led to the very recent decision at the Ninth International Conference for X-ray Microscopy (Zurich, 20–25 July 2008) to shorten the conference cycle of this series from three years to two. In this Review, we seek to provide a flavour of this growing field, illustrate capabilities and applications with soft X-rays, and speculate on some future developments. A short historical context is provided, the physics underlying the contrast mechanism is discussed, and a few applications are selected to illustrate some of the capabilities. Throughout, the focus will be on characterizing materials with NEXAFS microscopy, most notably organic and magnetic materials.
historical notesThe development of modern, high-spatial-resolution soft X-ray microscopes based on zone-plate technology is about three decades old8,9. Although initially envisioned and developed with the goal of imaging live biological samples in their natural, that is, hydrated, unfixed and unfrozen, state with suboptical resolution8,9, radia-tion damage during exposure necessitated the development of cryofixation techniques for biological applications10. Unsurpris-ingly, the technology developed has proved to be very useful over the past 15 years in characterizing a much wider range of materials than biological samples3,4,11,12. A similar evolutionary broadening
near-edge X-ray absorption fine-structure microscopy of organic and magnetic materialsharald ade1* and herman stoll2
Many high-performance materials and novel devices consist of multiple components and are naturally or intentionally nano-structured for optimal properties and performance. To understand their structure–property relationships fully, quantitative compositional analysis at length scales below 100 nm is required, a need that is often uniquely addressed using soft X-ray microscopy. Similarly, the interaction of X-rays with magnetic materials provides unique element-specific contrast that allows the determination of magnetic properties in multi-element antiferromagnetic and ferromagnetic materials. Pump–probe-type experiments can even investigate magnetic domain dynamics. Here we review and exemplify the ability of soft X-ray micro-scopy to provide information that is otherwise inaccessible, and discuss a perspective on future developments.
from bio applications to materials characterization occurred for photoelectron emission microscopy (PEEM)5,13–15. The main step towards materials characterization was the combination of soft X-ray absorption spectroscopy techniques with transmission and surface instruments3,15. The resulting NEXAFS microscopy provides a unique combination of contrast mechanism, inter action cross-section, spatial resolution and relatively low sample damage3,15,16.
contrast mechanism and instrument parametersExamples of NEXAFS spectroscopy that illustrate its ability to characterize composition and magnetic properties are displayed in Fig. 1. NEXAFS spectroscopy is particularly rich in spectral features when acquired from organic materials1,17,18 and is especially reveal-ing for magnetic materials when photon polarization effects and element specificity are used2. In organic materials, NEXAFS shows very detailed correlations with specific chemical moieties that can often be understood quite well from theoretical calculations or through use of molecular analogues. In conjunction with the polari-zation state of the X-rays, the element-specific NEXAFS of magnetic domains shows pronounced dichroism that can be used to infer the domain orientation as well as the specific contribution of an ele-ment to the magnetization. In addition, NEXAFS is sensitive to the orientation of specific chemical orbitals in organic materials1,4,19.
Zone-plate-based microscopes are of two main types: scanning transmission X-ray microscopes (STXMs) and transmission X-ray microscopes (TXMs). The basic operating principles are similar to the optical or electron microscopy analogues. In the STXM, the sample is mechanically raster-scanned through the focal spot pro-vided by a zone plate. In the TXM, a zone plate magnifies the sample onto a two-dimensional detector. STXMs are routinely operated on grazing-incidence grating monochromators at synchrotron facili-ties, and the implementation of NEXAFS microscopy was relatively easy even though zone plates are highly chromatic3,4. Special acqui-sition or analysis tools were developed to avoid potential degrada-tion of the spatial resolution caused by the need to re focus during changes in energy20,21. Historically, TXMs have been installed on inflexible zone-plate-based monochromators, and NEXAFS micro-scopy applications have been much more limited. In a PEEM, implementation of NEXAFS microscopy is straight forward as only the photon energy needs to be scanned5,15. Scanning instru-ments have also been developed to perform spatially resolved X-ray photo emission spectroscopy (XPS) from surfaces 22,23. XPS
1Department of Physics, NCSU, Raleigh, North Carolina 27695, USA; 2Max-Planck-Institut für Metallforschung, Heisenbergstraβe 3, 70569 Stuttgart, Germany. *e-mail: [email protected]
nmat_2399_APR09.indd 281 13/3/09 11:54:35
© 2009 Macmillan Publishers Limited. All rights reserved
282 nature materials | VOL 8 | APRIL 2009 | www.nature.com/naturematerials
review articles | insight NaTure MaTerialS doi: 10.1038/nmat2399
micro scopy can also be accomplished in a PEEM24. Generally, XPS microscopy has been little used for the characterization of organic and magnetic materials.
For organic matter, soft X-rays not only provide excellent com-positional contrast, but are also about three orders of magnitude less damaging than electron energy-loss spectroscopy in trans-mission electron microscopes16. Not surprisingly, a large number of X-ray microscopy applications involve organic matter in some form or another. Similarly, numerous magnetic materials have been investigated as a result of the special contrast mechanism of element-specific linear and circular dichroism, and the possibility of studying dynamical phenomena. Material classes, such as tradi-tional semiconductors or superconductors and other oxides, have not been investigated extensively with NEXAFS microscopy so far.
organics in aqueous environmentsSome of the most challenging materials to characterize are organic materials suspended or dispersed in the hydrated, unfrozen state.
They are particularly radiation sensitive (chemical changes and mass loss) owing to the ability of damaging radicals to diffuse rapidly. Thus, these materials are an area of application where NEXAFS microscopy has unique advantages when suboptical resolution is required. The first direct, real-space characterization of a new type of polyvinyl-alcohol-based micro-balloon in aqueous environment (Fig. 2) is a good example25. A six-month-old suspension of the micro-balloons that contained at least partially degraded balloons was investigated. Imaging below and above the oxygen K edge, as well as complete NEXAFS analysis of individual micro-balloons, could provide unique information on the composition of the micro-balloons in water. From the oxygen NEXAFS of the micro-balloon interiors, a distinction between water- and air-filled particles could be made unambiguously. For example, the NEXAFS spectrum of micro-balloon A in Fig. 2a showed only the resonances typical for the telechelic polyvinyl-alcohol shell, strongly suggesting that micro-balloon A is air filled. Furthermore, the micro-balloons A, B and C shown in Fig. 2a had total shell thicknesses of 0.38 μm,
E
X-ray magnetic linear dichroismAntiferromagnets
720 722 724
Photon energy (eV)
4
1
2
3
LaFeO3
L2
Nor
mal
ized
ele
ctro
n yi
eld
I cos2Ѳ
Ѳ
X-ray magnetic circular dichroismFerromagnets
700 720 7400
4
8
Photon energy (eV)
FeL3
L2
Abs
orpt
ion
coef
ficie
nt
I cosѲ
Ѳ
Photon energy (eV)
Polyvinyl-methylketone
Nylon-6
Polymethyl-methacrylate
Polyurea
Polyurethane
Polycarbonate
C-H
Inte
nsity
284 286 288 290 292
nCO
O O
CH3
CH3
nCH2
CH3
H3C
C
OOC
nCC
O
N* *
H
n
CH3 HH
O
C NN
nC
O
OC
O
ONH
NH CH3
CH2
CH3
nCH
C O
C
O
C C
N C
O
C
CO
O
C
NC
O
N
NCO
O
CO
O
ON
O
Functional group
X,Y = C,N,O
X
O
C Y
a
b c
Figure 1 | illustration of compositional, linear and circular magnetic dichroic contrast mechanisms using NeXaFS spectroscopy. a, NEXAFS spectral features corresponding to the carbonyl group (shown in red) as function of progressive functional group environment (ketone to carbonate) show a systematic shift towards higher energies for a more electronegative environment18. b, Linearly polarized X-rays produce spectral differences, that is, linear dichroism, for parallel or perpendicularly aligned antiferromagnetic domains. c, Circularly polarized light produces spectral differences, that is, circular dichroism, for parallel, perpendicular and antiparallel aligned ferromagnetic domains. Figure courtesy of J. Stöhr.
nmat_2399_APR09.indd 282 13/3/09 11:54:35
© 2009 Macmillan Publishers Limited. All rights reserved

nature materials | VOL 8 | APRIL 2009 | www.nature.com/naturematerials 283
insight | review articlesNaTure MaTerialS doi: 10.1038/nmat2399
0.56 μm and 0.63 μm, respectively. The difference between these results and the shell thickness of 0.90 μm derived from confocal laser scanning microscopy was explained by the limited resolution of about 180 nm for this technique, compared with 40-nm reso-lution for X-rays. Closer inspection of the shells revealed further details (Fig. 2c). The increase of the shell thickness is correlated with the appearance of a fuzzy contour around the polymeric shell and the loss of air content. Degradation of the polymeric micro-balloons upon aging leads to leakage of the gas filling and is asso-ciated with an increase of the shell thickness. The appearance of a fuzzy contour around the polymeric shell of the corrupted micro-balloons is presumably the result of the partial destruction of the polymeric network, but further investigations are needed to reveal the degradation mechanism definitively. The X-ray microscopy results directly showed that the particular micro-balloon system investigated has remarkably high stability. These balloons are able to contain gases for six months, which makes them well suited to biomedical applications.
As complex materials often have three-dimensional (3D) morph-ologies, a number of new methods have been developed recently to perform 3D chemical mapping26–28 or 3D morphological mapping of thick, frozen biological samples29. However, of these methods, only NEXAFS tomography has high spectroscopic resolution and sensitivity, and the ability to analyse wet specimens28. To illustrate the present state of the art (achieved with a STXM), the 3D chemical composition of structured, hollow latex spheres in an aqueous solu-tion is presented in Fig. 2d. A NEXAFS feature of the acrylate com-ponent just below the onset of the oxygen 1s edge of water was used to provide selective contrast between the acrylate, the styrene and
water, and each component could be selectively mapped in 3D. As there is no inefficient X-ray optics between the sample and the detec-tor in a STXM, the dose used to acquire the STXM tomographs was only ~200 MGy, which is considerably lower than the dose required for TXM tomography (typically 1–10 GGy). Even so, tomography is a relatively high-dose method and the ultimate spatial resolution might be limited by damage. Unfortunately, cryogenic methods only prevent mass loss and the spectroscopic changes due to chemi-cal damage are essentially unmitigated by cryogenic techniques30.
Other studies of hydrated soft matter include the in situ, real-space determination of the charge state in stimulus-responsive micro-gels31, the determination of crosslink density in super-absorbent polymers32, density determinations of polyelectrolyte assemblies33,34 and the correlation of metal distributions in organic biofilms35,36. The studies of microgels, crosslink density in super-absorbent polymers, and biofilms made explicit use of NEXAFS spectral differences and features, whereas the studies of the polyelectrolyte assemblies relied primarily on the ‘water-window contrast’ (at fixed photon energy) due to the elemental differences in the cross-sections of carbon and oxygen.
organic electronic materialsOwing to their processability from solvents, organic electronic materials may yield cheap light-emitting diodes and photovoltaic devices. Furthermore, flexible devices can be constructed. Organic devices are thus extensively studied by a large number of research groups around the world. Generally, devices are composed of donor and acceptor materials that are used in layered thin-film geometries that often include one or more buffer layers and the electrodes.
a
c
2 µm
A
B
C
1 µm 1 µm 1 µm
A B C
400 nm
–3 –2 –1 0 1 2 3
Distance (µm)
A
B
C
Tran
smitt
ance
b
d
Figure 2 | NeXaFS imaging of latex particles and microballoons dispersed in water. a, STXM transmission image of microballoons recorded at 520 eV, that is, below the oxygen absorption edge. b, Radial transmittance profiles of micro-balloons A, B and C, labelled as in a. c, Expanded views of micro-balloon shells. d, Three-dimensional representations of the polyacrylate (green) and polystyrene (greyscale) distributions of water-suspended latex particles. Figures reproduced with permission from: a-c, ref. 25 © 2008 RSC; d, ref. 28 © 2007 IUCr.
nmat_2399_APR09.indd 283 13/3/09 11:54:37
© 2009 Macmillan Publishers Limited. All rights reserved

284 nature materials | VOL 8 | APRIL 2009 | www.nature.com/naturematerials
review articles | insight NaTure MaTerialS doi: 10.1038/nmat2399
Frequently, devices contain an active layer that is composed of complex non-equilibrium structures of a two-component donor–acceptor blend that shows phase separation on multiple length scales, created during spin-casting and subsequent processing37,38. The influence of local composition and distribution on device per-formance is of particular interest, both for light-emitting diodes39 and for ‘bulk heterojunction technology’ in photovoltaic devices40. Owing to the small exciton diffusion length in conjugated polymers
(typically less than 10 nm), efficient photovoltaic devices require an intimately mixed morphology with phase separation on the scale of 10 nm, yet at the same time have a bi-continuous network or perco-lation pathways for efficient charge collection.
Mixtures of the donor polymer poly(9,9′-dioctylfluorene-co-bis-N,N′-(4,butylphenyl)-bis-N,N′-phenyl-1,4-phenylene-diamine) (PFB) with the acceptor polymer poly(9,9′-dioctylfluorene-co-benzothiadiazole) (F8BT) have been used as an all-polymer model system for the study of morphology effects41 and charge generation and transport dynamics42. Blends of PFB and F8BT spin-cast from a low-boiling-point solvent, such as chloroform, show a smooth surface topography41. Films spin-cast from a high-boiling-point solvent, such as xylene, show a more complicated morphology and surface topog-raphy characterized by micrometre-size domains41. Understanding the charge generation mechanism within these domains requires mapping the composition of these blend structures. Although an array of advanced techniques has been used to probe the chemistry and structure of PFB:F8BT blends, only NEXAFS microscopy has the required high chemical sensitivity and spatial resolution (<1 μm). This capability has been exploited to characterize PFB:F8BT blends cast from xylene43 and chloroform44. Quantitative compositional maps of xylene-cast PFB:F8BT blends with different composition ratios are shown in Fig. 3. The micro metre-scale domains contain significant proportions of both polymers. In particular, the minor-ity phases of 1:5 and 5:1 PFB:F8BT xylene-blend films can contain each polymer in a proportion up to 50%. By analysing the quantita-tive composition, the superior photovoltaic performance of the 1:5 PFB:F8BT blend over the 5:1 blend could be explained: a higher pro-portion of the area of the 1:5 PFB:F8BT film has the optimum blend composition of 60 to 80 wt% F8BT. The local composition and its distribution in 1:1 PFB:F8BT films, however, was unable to explain the lower photovoltaic performance of the 1:1 PFB:F8BT blend. This was attributed to a presumed vertical structure that is difficult to characterize at present. Overall, the lower performance of xylene-processed films relative to chloroform-processed films could not be accounted for by the local blend composition at length scales above the resolution limit of ~45 nm and a nanoscale phase separation at a length scale below the spatial resolution has been postulated.
Similarly, compositional and morphological analysis of PFB:F8BT blends cast from chloroform provided much insight into the nano-scale morphological evolution of these blends upon annealing44. The coarsening and evolution towards purer domains has been quantified for the more aggressively annealed films. However, the comparison with photoluminescence data of as-cast or minimally annealed samples suggested the presence of a nanomorphology that was below the resolution limit of the X-ray microscope used. Char-acterization of PFB:F8BT blends thus simultaneously illustrates the power of compositional imaging using NEXAFS microscopy and the need to improve the spatial resolution further. Given that the complex morphology is in many cases most probably 3D in nature, optimal characterization would require NEXAFS tomography28 at higher spatial resolution than has been possible so far.
biofibresBiofibres are some of nature’s most remarkable materials. Some fibres can achieve combinations of strength and toughness that are still unmatched by high-performance synthetic fibres. One of the fibres produced by spiders, dragline silk, is such a fibre, with an un usual combination of stiffness and extensibility. Numerous mod-els to explain the fibres’ properties exist. They are thought to be due to alternating alanine-rich hard segments containing β-sheets and glycine-rich soft segments, but the fundamental structure–property relationships in spider silk are not yet fully understood. They are of intrinsic scientific interest, but improved knowledge would also aid industrial efforts to produce biomimetic synthetic fibres.
Figure 3 | NeXaFS compositional mapping applied to two-component organic electronic devices that show macroscopic phase separation. Quantitative (wt%) F8BT (a, d, g) and PFB (b, e, h) composition maps and AFM images (c, f, i) of PFB–F8BT blend films of variable composition. a, b, c, 1:1 PFB:F8BT; d, e, f, 5:1 PFB:F8BT; g, h, i, 1:5 PFB:F8BT. j, Chemical structures of both polymers and their respective NEXAFS spectra, which provide the basis of the quantitative analysis. Figure reproduced with permission from ref. 43 © 2007 ACS.
NS
N
N N n
PFB
F8BT
n[
[
[
[j
Mas
s ab
sorp
tion
coef
ficie
nt (
cm–2
g)
F8BTFBT
283 284 285 286 287
1.2 × 10⁻⁵
1.0 × 10⁻⁵
8.0 × 10⁻⁴
6.0 × 10⁻⁴
4.0 × 10⁻⁴
2.0 × 10⁻⁴
0.0280 285 290 295 300 305 310 315 320
Energy (eV)
0 nm
15 nm
1:5 PFB:F8BT
0 nm
50 nm
0 nm
50 nm
5:1 PFB:F8BT
i
f
c
1:1 PFB:F8BT
0
50
wt%
50
90
wt%
h
e
b
0 wt%
100
g
d
a
60
100
wt%
0 wt%
100
0
50
wt%
1 um
1 um
1 um
PFB percentage composition
HeightF8BT percentage composition
nmat_2399_APR09.indd 284 13/3/09 11:54:37
© 2009 Macmillan Publishers Limited. All rights reserved

nature materials | VOL 8 | APRIL 2009 | www.nature.com/naturematerials 285
insight | review articlesNaTure MaTerialS doi: 10.1038/nmat2399
The microstructure of the silk filament is controlled in part by the conditions under which the fibre is spun and in part by the block copolymer structure determined by its amino-acid sequence. The alignment of the β-sheets and the size of the crystallites and crys-talline regions within the fibre are thought to be important factors responsible for the tensile strength of dragline silk. This alignment and the fibre texture can be characterized using NEXAFS micro-scopy and systematic quantitative maps of the orientation of the β-sheets in dragline silk of the spider Nephila clavipes have been produced and compared with the Bombyx mori cocoon fibre45. New discoveries that help explain why spider silk has such noteworthy mechanical properties include the observation that the previously observed skin has enhanced orientation. An apparently random distribution of more-oriented β-sheet crystallites interspersed with amorphous regions was also observed. This type of stiff reinforce-ment within a flexible matrix is a common feature of high-strength, yet flexible, materials.
The properties of spider dragline silk are known to depend strongly on moisture levels, with the initial stiffness dropping by three orders of magnitude upon immersion of unsupported fibres in water46,47. Very recent initial results on the effects of moisture on the microstructure of the fibre are shown in Fig. 4, where we com-pare the orientation maps of the carbonyl groups for a N. clavipes fibre in dry and wet states (Fig. 4a). The order parameter used ⟨P2⟩ is equal to 1 for perfect parallel orientation, −0.5 for perfect per-pendicular orientation and 0 for random orientation. The dry fibre shows moderately oriented domains and a homogeneous micro-structure of small domains. The influence of water strongly affects the microstructure of the fibre, resulting in a much coarser texture and a broader range of ⟨P2⟩ values (Fig. 4b). Both ⟨P2⟩ distributions displayed in Fig. 4b have an approximately Gaussian shape and are centred at a ⟨P2⟩ value of about −0.1, but the distribution is much broader for the fibre in the wet, and hence low-stiffness, state.
The first linear X-ray dichroic measurements on fibres revealed the qualitative radial alignment of various functional groups in Kevlar fibres4, and a quantitative comparison of the carbon 1s and nitrogen 1s signals from different Kevlar fibre grades provided a quantitative comparison of the degrees of orientation in the different fibre grades19.
magnetic soft X-ray microscopyMagnetism in confined structures48 has become an important topic for theoretical and experimental studies as well as
technological application such as sensor technology (for example, giant-magnetoresistance and magnetic-tunnel-junction reading heads) and magnetic data storage devices (for example, magnetic random-access memory). The X-ray magnetic circular dichroism (XMCD)49 shown in Fig. 1 can be used as a contrast mechanism in PEEM5, full-field50 and scanning51 X-ray microscopes and for magnetic investigations with coherent scattering52. In comparison with magneto-optical Kerr microscopy53, the synchrotron-based techniques show element-specific contrast (by tuning the X-ray energy to the absorption edges of the magnetically relevant ele-ments) and lateral resolutions of ~25 nm, which is an improvement of about one order of magnitude. Although the X-ray techniques cannot achieve the atomic resolution possible with the spin-polarized scanning tunnelling microscope54,55, the unique advan-tages of soft X-ray microscopy for studying magnetic micro- and nanostructures are the element specificity of the XMCD contrast mechanism and its direct correlation with local spin and orbital moments, which can even be separated by applying magneto-optical sum rules56,57. In addition to using the XMCD effect for investigation of ferromagnetic samples, linearly polarized light in conjunction with X-ray magnetic linear dichroism has been used in X-ray microscopy for the study of antiferromagnetic systems58–61. The unique contrast mechanism of NEXAFS microscopy allowed ferromagnetic domains to be correlated with antiferromagnetic domains in a number of complex magnetic thin films. For example, the domains of a bilayer of 1.0 nm of platinum on 1.2 nm of cobalt on a LaFeO3(100) substrate are shown in Fig. 5 (ref. 59). The con-tributions of the various elements to the magnetic properties could be distinguished because each element has its absorption edge at a different photon energy and the anti ferromagnetic domains of the substrate could be clearly correlated with the cobalt-specific ferro-magnetic domains above it. In effect, the element-specific NEXAFS provided layer-specific depth resolution. Similar experiments allowed the details of ferromagnetic–antiferromagnetic coupling to be investigated in a number of systems60,61.
As the incoming and outgoing photons are not influenced by magnetic fields, transmission X-ray microscopy allows the study of magnetic properties on small length scales as a function of applied field; for example, local hysteresis loops and magnetization profiles of cobalt–platinum multilayers deposited on self-assembled arrays of polystyrene nanospheres could be assessed on the 100-nm scale62. Furthermore, XMCD is very sensitive, as was demonstrated by studying magnetic carbon63.
Dry
Wet
–0.3 –0.2 –0.1 0.0 0.1
P2
Frac
tion
of p
ixel
s (×
100
)
10
5
0
Dry
Wet 1 μm
0.1
–0.3
a b
Figure 4 | NeXaFS orientational maps for spider silk in the dry and wet states. a, Maps (3 μm × 7 μm) of the order parameter ⟨P2⟩ of N. clavipes in thin sections of dragline silk in the dry and wet states. b, ⟨P2⟩ distribution for the maps shown in a. Figure reproduced with permission from ref. 46, courtesy of A.P. Hitchcock and M. Pézolet.
nmat_2399_APR09.indd 285 13/3/09 11:54:38
© 2009 Macmillan Publishers Limited. All rights reserved

286 nature materials | VOL 8 | APRIL 2009 | www.nature.com/naturematerials
review articles | insight NaTure MaTerialS doi: 10.1038/nmat2399
subnanosecond time-resolved neXaFs microscopyBy taking advantage of the inherent time structure of the synchro-tron, which produces X-ray flashes about 50–70 ps in duration, stroboscopic magnetic studies became feasible. In this way, lateral resolution of about 25 nm was combined with time resolution of about 100 ps. Subnanosecond time-resolved NEXAFS microscopy measurements were performed for the first time using a pump–probe technique at the Advanced Light Source, Lawrence Berkeley National Laboratory, using full-field6 and photoemission electron microscopes64. Ferromagnetic micrometre-size elements were excited using a microcoil6, producing out-of-plane magnetic field pulses perpendicular to the sample plane, or using a stripline64 for in-plane excitation.
Complementary to the pump–probe technique, a spatially resolved ferromagnetic resonance technique has been developed65 in which the sample is excited by a continuous a.c. magnetic field. Roughly speaking, the pump–probe technique excites all mag-netic modes of motion in the sample, whereas this comple mentary technique selectively allows observation of those modes with an eigenfrequency close to the frequency of the a.c. excitation. By taking advantage of the element specificity of the XMCD contrast mechanism, vortex dynamics could be separately observed in the permalloy (Ni80Fe20) and cobalt layers of permalloy–copper–cobalt trilayers66. A 180° phase shift was measured in the gyrotropic motion of both layers.
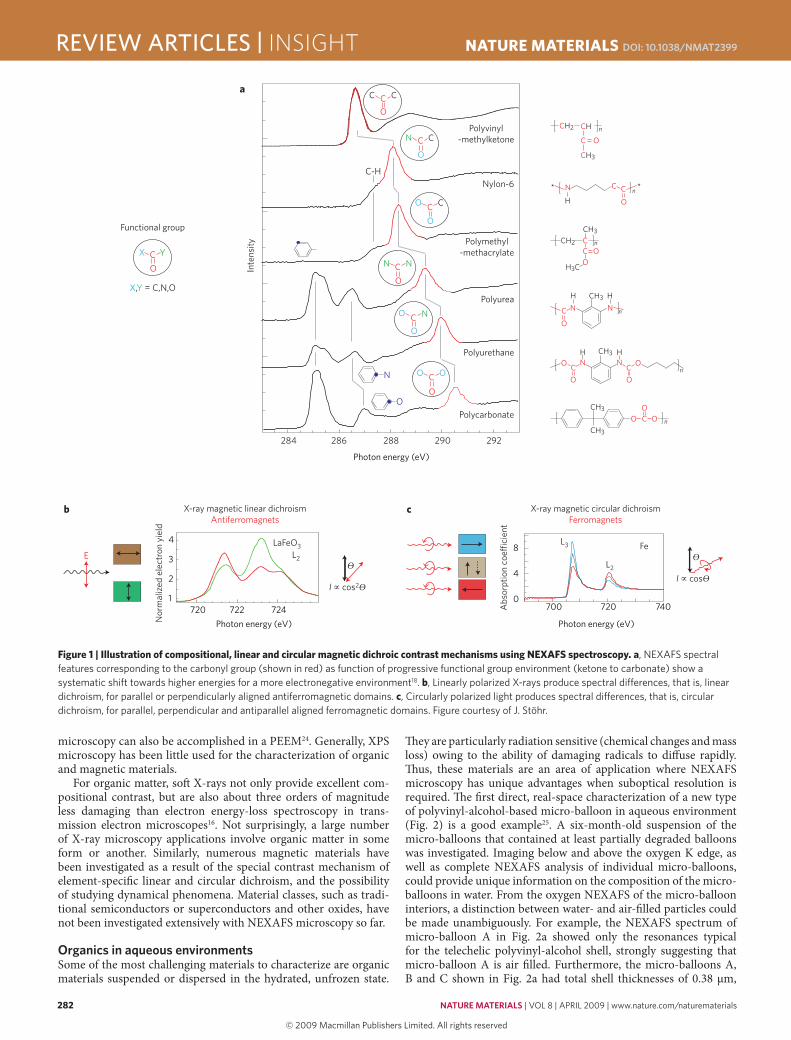
imaging of spin-transfer switching and domain wall motionThe discovery that magnetization in submicrometre patterned ferro-magnetic elements can be excited and reversed not only using magnetic fields but also spin-polarized currents67,68 opened new possibilities and technologies called ‘spin transport electronics’ or ‘spintronics’, which exploit the intrinsic spin of the electron and its associated magnetic moment. Related effects were extensively investigated in transport measurements. However, these give a spatially integrated signal about the magnetization. Time-resolved X-ray imaging of the spin-torque-induced magnetization switching process in nanopillars69,70 revealed that magnetization switching was observed by lateral motion of a magnetic vortex across a 110 × 180 nm² element (Fig. 6). In addi-tion, domain wall motion in nanowires has been studied by applying magnetic fields71 or electrical current pulses72. The high spatial resolu-tion allows accurate comparison with micromagnetic models.
Vortex dynamicsThe magnetic vortex is a well-known ground-state configuration of magnetization in micrometre- and nanometre-size magnetic patterns, as such patterns can minimize their stray field energy by forming an in-plane curling magnetization, either anticlock-wise (vortex circulation, c = +1) or clockwise (c = −1). To avoid a singularity, the magnetization in the centre of the vortex turns out-of-plane, either up (vortex polarization, p = +1) or down (p = −1), forming the vortex core, which has a radius of about 5–15 nm.
The vortex core has a key role in vortex dynamics. In particular, the vortex shows a fundamental gyration mode, typically in the sub-gigahertz frequency range, when excited by an in-plane magnetic field pulse or a resonant alternating magnetic field, as observed experimentally more than 20 years ago73. According to equations of motion derived in ref. 74 and applied to vortex structures in ref. 75, the sense of rotation of this gyrotropic magnetic vortex motion only depends on the vortex polarizations: anticlockwise for p = +1 and clockwise for p = −1.
The vortex was studied extensively in theory, simulations and experiments and was found to be a very stable configuration. Out-of-plane magnetic fields as large as ~0.5 T (refs 76, 77) are needed to switch the vortex core polarization.
Surprisingly, dynamic X-ray microscopy experiments78 revealed (Fig. 7) that the vortex core can be toggled up and down using in-plane magnetic bursts of one period with a peak amplitude as low as 1.5 mT (in contrast with the 500 mT mentioned above). The physi-cal mechanism was also explained. The vortex core reversal occurs in three steps, as derived from micromagnetic simulations78: (1) excitation-induced gyration leads to a deformation of the out-of-plane core profile (that is, a region with opposite magnetization is formed near the original vortex core); (2) when the deformation reaches full out-of-plane magnetization, a vortex–antivortex pair is nucleated; (3) the antivortex quickly annihilates with the original vortex, dissipating the excess energy in spin waves, leaving only the vortex with opposite polarization.
This vortex–antivortex model for vortex core switching has been confirmed in micromagnetic simulations by several groups and studied in detail79–81, not only for excitation with magnetic fields but also with spin-polarized electrons (spin torque)82,83. It was demon-strated by direct X-ray imaging that a rotating field can be used to switch the vortex core either ‘up’ or ‘down’ depending on the sense of rotation of the external field84. Unlike linear magnetic fields or spin-polarized currents, which excite both vortex core polarizations and therefore switch the vortex core back and forth, an in-plane rotating field selectively excites only one of the polarization states85–87. One of the future challenges of magnetic X-ray microscopy will be to resolve details of vortex dynamics in space and time. Time-resolved STXM imaging of spin-torque-driven vortex gyration has recently been published88.
a b Co layer
10 Å Pt
12 Å Co
LaFeO3(100)
LaFeO3 layer
705 710 715 720 725 730 770 775 780 785 790 795 800
Nor
mal
ized
inte
nsity
(a.u
.)
Nor
mal
ized
inte
nsity
(a.u
.)
Dark Dark
Light
Light
2 μm
Medium
Photon energy (eV) Photon energy (eV)
Figure 5 | Domain structures in a platinum–cobalt bilayer on an antiferromagnetic laFeO3 substrate observed in a PeeM. a,b,The antiferromagnetic domains (a) and the cobalt domains (b) in the same region of the sample. The spectra shown illustrate the origin of the intensity contrast in the images. Normalized intensity given in arbitrary units (a.u.). Comparison of the images shows that the cobalt domains align with the antiferromagnetic domains (light and dark regions inside outlined areas). Figure courtesy of J. Stöhr.
nmat_2399_APR09.indd 286 13/3/09 11:54:39
© 2009 Macmillan Publishers Limited. All rights reserved
nature materials | VOL 8 | APRIL 2009 | www.nature.com/naturematerials 287
insight | review articlesNaTure MaTerialS doi: 10.1038/nmat2399
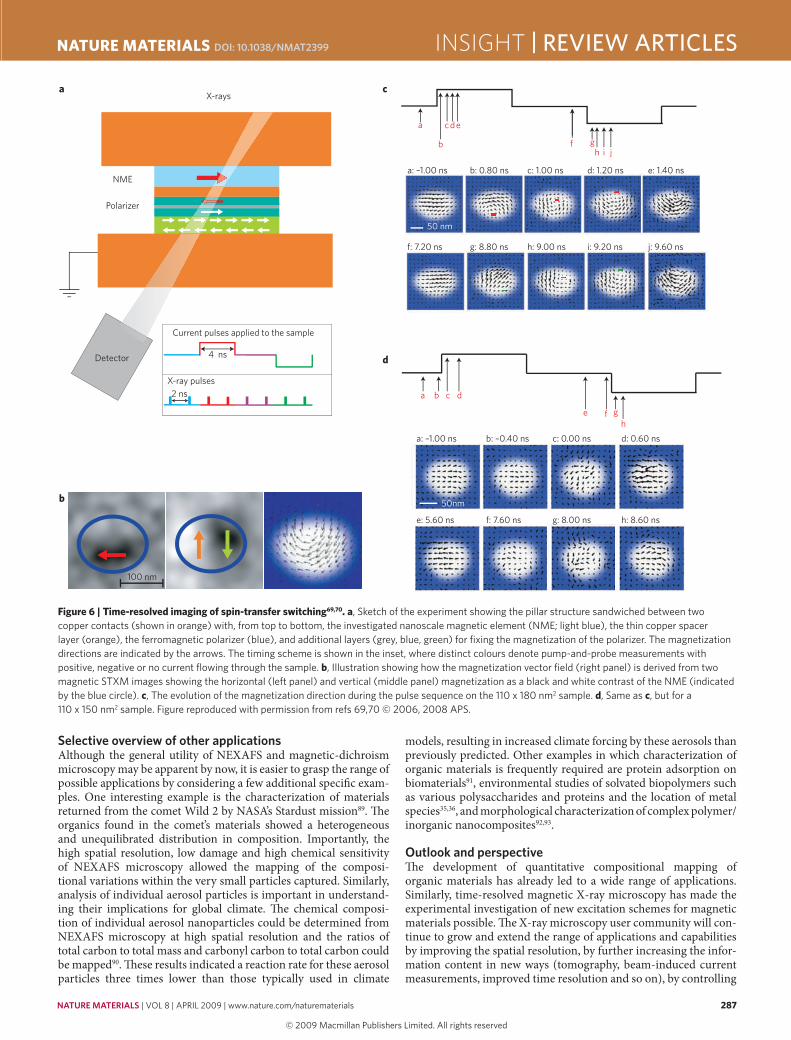
selective overview of other applicationsAlthough the general utility of NEXAFS and magnetic-dichroism microscopy may be apparent by now, it is easier to grasp the range of possible applications by considering a few additional specific exam-ples. One interesting example is the characterization of materials returned from the comet Wild 2 by NASA’s Stardust mission89. The organics found in the comet’s materials showed a heterogeneous and unequilibrated distribution in composition. Importantly, the high spatial resolution, low damage and high chemical sensitivity of NEXAFS microscopy allowed the mapping of the composi-tional variations within the very small particles captured. Similarly, analysis of individual aerosol particles is important in understand-ing their implications for global climate. The chemical composi-tion of individual aerosol nanoparticles could be determined from NEXAFS microscopy at high spatial resolution and the ratios of total carbon to total mass and carbonyl carbon to total carbon could be mapped90. These results indicated a reaction rate for these aerosol particles three times lower than those typically used in climate
models, resulting in increased climate forcing by these aerosols than previously predicted. Other examples in which characterization of organic materials is frequently required are protein adsorption on biomaterials91, environmental studies of solvated biopolymers such as various polysaccharides and proteins and the location of metal species35,36, and morphological characterization of complex polymer/ inorganic nanocomposites92,93.
outlook and perspectiveThe development of quantitative compositional mapping of organic materials has already led to a wide range of applications. Similarly, time-resolved magnetic X-ray microscopy has made the experimental investigation of new excitation schemes for magnetic materials possible. The X-ray microscopy user community will con-tinue to grow and extend the range of applications and capabilities by improving the spatial resolution, by further increasing the infor-mation content in new ways (tomography, beam-induced current measurements, improved time resolution and so on), by controlling
a
b
d
X-ray pulses
X-rays
Detector
NME
Polarizer
2 ns
4 ns
c
Current pulses applied to the sample
100 nm
a b c
f gh
d
e
50nm
a: –1.00 ns b: –0.40 ns c: 0.00 ns d: 0.60 ns
e: 5.60 ns f: 7.60 ns g: 8.00 ns h: 8.60 ns
a
b
c
f gh
d e
i j
50 nm
a: –1.00 ns b: 0.80 ns c: 1.00 ns d: 1.20 ns e: 1.40 ns
f: 7.20 ns g: 8.80 ns h: 9.00 ns i: 9.20 ns j: 9.60 ns
Figure 6 | Time-resolved imaging of spin-transfer switching69,70. a, Sketch of the experiment showing the pillar structure sandwiched between two copper contacts (shown in orange) with, from top to bottom, the investigated nanoscale magnetic element (NME; light blue), the thin copper spacer layer (orange), the ferromagnetic polarizer (blue), and additional layers (grey, blue, green) for fixing the magnetization of the polarizer. The magnetization directions are indicated by the arrows. The timing scheme is shown in the inset, where distinct colours denote pump-and-probe measurements with positive, negative or no current flowing through the sample. b, Illustration showing how the magnetization vector field (right panel) is derived from two magnetic STXM images showing the horizontal (left panel) and vertical (middle panel) magnetization as a black and white contrast of the NME (indicated by the blue circle). c, The evolution of the magnetization direction during the pulse sequence on the 110 x 180 nm2 sample. d, Same as c, but for a 110 x 150 nm2 sample. Figure reproduced with permission from refs 69,70 © 2006, 2008 APS.
nmat_2399_APR09.indd 287 13/3/09 11:54:43
© 2009 Macmillan Publishers Limited. All rights reserved

288 nature materials | VOL 8 | APRIL 2009 | www.nature.com/naturematerials
review articles | insight NaTure MaTerialS doi: 10.1038/nmat2399
the sample environment and by making the instrumentation more accessible. The relative simplicity and non-ultrahigh vacuum char-acter of a STXM is particularly well suited to in situ experiments that require control of magnetic and electric fields, pH, tempera-ture, solvation or gas exposure.
Regarding spatial resolution, two new approaches promise to solve the problem of diminishing improvements in spatial resolu-tion over the past two decades. A two-step process interleaving the fabrication of alternating zones promises to overcome the present limitations to create small, high-aspect-ratio zones94. Similarly, zone doubling through atomic layer deposition of high-Z materials on a relatively low-Z substrate template has the potential to result in very high-resolution zone plates95. Given these developments, zone-plate resolution for use in STXM and TXM has now reached 15 nm and is approaching 10 nm. Considerable resources and efforts of the X-ray microscopy community are also spent on new techniques and imag-ing modalities other than the traditional STXM, TXM and PEEM technologies. Coherent diffraction imaging96 and ‘lensless’ imag-ing52 are two such methods. The latter is a variation of previously developed Fourier transform holography97. Many of these efforts are undertaken with an eye to eventual use with free-electron-laser facilities such as the FLASH facility at DESY, Hamburg, the LCLS at the Stanford Synchrotron Radiation Laboratory, and the SCSS facility at Spring8, Japan, for single-pulse, femtosecond imaging98–100.
A method that might provide the most immediate practical improvement for actual characterization of materials is scan-ning diffraction microscopy, or X-ray ptychography. This method was originally developed for the scanning electron microscope. In a very recent implementation with X-rays101, diffraction pat-terns were recorded in a STXM at each point along the specimen. If the pattern is recorded to sufficiently high scattering angles, it can reveal information from features that are much smaller than the beam size. When using diffraction patterns from overlap-ping spots (Fig. 8), the phase problem of the reconstruction of the diffraction pattern can be overcome and the information from the
diffraction pattern corresponding to high spatial resolution can be recovered. An improvement in spatial resolution by a factor of four was achieved.
In contrast to lensless diffractive imaging methods, X-ray ptychography offers to be a method generally well suited to the characterization of materials, as images can be obtained in minutes rather than hours and it offers the flexibility of being able to zoom into regions of interest or to build up large fields of view of the specimen102. The pixellated detector required for X-ray ptycho-graphy could most likely be added relatively easily to most existing and future STXMs. A complementary approach that requires com-paratively simple technology yet affords high spatial resolution and compositional information is resonant soft-X-ray scattering103–105. This retains the compositional sensitivity of NEXAFS by acquiring scattering and reflectivity data sets at selected photon energies or over an energy range near absorption edges. The acquired informa-tion can have spatial resolution as high as a few nanometres, but only from ensemble averages. These, however, can still be very use-ful as stand-alone information or in correlation with complemen-tary microscopy information103.
As described, soft-X-ray microscopy is an evolving field that has unique attributes and is expanding in a number of new and excit-ing directions. This growth and diversification is also exemplified by the increased availability of the required instrumentation. There are now existing or planned soft X-ray microscopes at almost every synchrotron facility that operates in this energy range. In addition, commercial stand-alone and laboratory-based STXM and TXM instruments are now available (for example from ACCEL Instru-ments (http://www.accel.de/) and Xradia (http://www.xradia.com/)), a number of which have been delivered or ordered. The cost of these instruments is comparable to a mid-range electron micro-scope. At the same time, rapid progress is being made in new imag-ing modalities that will not only exploit existing X-ray sources, but are explicitly geared to take advantage of the capabilities offered, and to be offered, at existing free-electron-laser facilities and other
420 nm
0.1 mT
1.5 mT
CW ACW
In-plane magnetic field (250 MHz)
Figure 7 | Sketch of switching of the vortex core polarization by an in-plane magnetic field pulse of 1.5 mT as revealed by time-resolved X-ray microscopy78. Excitation by a small in-plane alternating field (amplitude, 0.1 mT) verified that switching occurred, as the sense of the gyrotropic motion, which depends only on the vortex core polarization, has changed. CW, clockwise; ACW, anticlockwise. Figure reproduced with permission from ref. 78, © 2006 NPG.
nmat_2399_APR09.indd 288 13/3/09 11:54:47
© 2009 Macmillan Publishers Limited. All rights reserved

nature materials | VOL 8 | APRIL 2009 | www.nature.com/naturematerials 289
insight | review articlesNaTure MaTerialS doi: 10.1038/nmat2399
planned fourth-generation light sources. Given the unique contrast mechanism and time resolution, X-ray microscopy will remain a very useful characterization method for a wide range of materials.
references1. Stöhr, J. NEXAFS Spectroscopy (Springer, 1992).2. Stöhr, J. & Siegmann, H. C. Magnetism (Springer, 2006).3. Ade, H. et al. Chemical contrast in X-ray microscopy and spatially resolved
XANES spectroscopy of organic specimens. Science 258, 972–975 (1992).4. Ade, H. & Hsiao, B. X-ray linear dichroism microscopy. Science
262, 1427–1429 (1993).5. Stöhr, J. et al. Element-specific magnetic microscopy with circularly polarized
X-rays. Science 259, 658–661 (1993).6. Stoll, H. et al. High-resolution imaging of fast magnetization dynamics in
magnetic nanostructures. Appl. Phys. Lett. 84, 3328–3330 (2004).7. Vogel, J. et al. Time-resolved magnetic domain imaging by X-ray
photoemission electron microscopy. Appl. Phys. Lett. 82, 2299–2301 (2003).8. Schmahl, G., Rudolph, D., Niemann, B. & Christ, O. Zone-plate X-ray
microscopy. Q. Rev. Biophys. 13, 297–315 (1980).9. Kirz, J., Jacobsen, C. & Howells, M. Soft X-ray microscopes and their
biological applications. Q. Rev. Biophys. 28, 33–130 (1995).10. Schneider, G. Cryo X-ray microscopy with high spatial resolution in
amplitude and phase contrast. Ultramicroscopy 75, 85–104 (1998).11. Ade, H. & Hitchcock, A. P. NEXAFS microscopy, resonant scattering and
resonant reflectivity: composition and orientation probed in real and reciprocal space. Polymer 49, 643–675 (2008).
12. Bluhm, H. et al. Soft X-ray microscopy and spectroscopy at the molecular environmental science beamline at the Advanced Light Source. J. Electron Spectrosc. Relat. Phenom. 150, 86–104 (2006).
13. Birrell, G. B., Hedberg, K. K., Habliston, D. L. & Griffith, O. H. Biological applications of photoelectron imaging: A practical perspective. Ultramicroscopy 36, 235–251 (1991).
14. Griffith, O. H. & Rempfer, G. F. Photoelectron imaging in cell biology. Annu. Rev. Biophys. Biophys. Chem. 14, 113–130 (1985).
15. Tonner, B. & Harp, G. R. Photoelectron microscopy with synchrotron radiation. Rev. Sci. Instrum. 59, 853–858 (1988).
16. Rightor, E. G. et al. Spectromicroscopy of poly(ethylene terephthalate): Comparison of spectra and radiation damage rates in X-ray absorption and electron energy loss. J. Phys. Chem. B 101, 1950–1960 (1997).
17. Dhez, O., Ade, H. & Urquhart, S. Calibrated NEXAFS spectra of some common polymers. J. Electron Spectrosc. Relat. Phenom. 128, 85–96 (2003).
18. Urquhart, S. G. & Ade, H. Trends in the carbonyl core (C 1s, O 1s) → π*C=O transition in the near edge X-ray absorption fine structure spectra of organic molecules. J. Phys. Chem. B 106, 8531–8538 (2002).
19. Smith, A. P. & Ade, H. Quantitative orientational analysis of a polymeric material (Kevlar fiber) with X-ray microspectroscopy. Appl. Phys. Lett. 69, 3833–3835 (1996).
20. Kilcoyne, A. L. D. et al. Interferometer-controlled scanning transmission X-ray microscopes at the Advanced Light Source. J. Synchrotron Radiat. 10, 125–136 (2003).
21. Jacobsen, C., Wirick, S., Flynn, G. & Zimba, C. Soft X-ray spectroscopy from image sequences with sub-100 nm spatial resolution. J. Microsc. 197, 173–184 (2000).
22. Ade, H. et al. X-ray spectromicroscopy with a zone plate generated microprobe. Appl. Phys. Lett. 56, 1841–1843 (1990).
23. Gunther, S., Kaulich, B., Gregoratti, L. & Kiskinova, M. Photoelectron microscopy and applications in surface and materials science. Prog. Surf. Sci. 70, 187–260 (2002).
24. Locatelli, A., Aballe, L., Mentes, T. O., Kiskinova, M. & Bauer, E. Photoemission electron microscopy with chemical sensitivity: SPELEEM methods and applications. Surf. Interface Anal. 38, 1554–1557 (2006).
25. Tzvetkov, G. et al. In situ characterization of gas-filled microballoons using soft X-ray microspectroscopy. Soft Matter 4, 510–514 (2008).
26. Iwata, N. et al. Chemical component mapping of pulverized toner by scanning transmission X-ray microscopy. Micron 37, 290–295 (2006).
27. Mobus, G. & Inkson, B. J. Three-dimensional reconstruction of buried nanoparticles by element-sensitive tomography based on inelastically scattered electrons. Appl. Phys. Lett. 79, 1369–1371 (2001).
28. Johansson, G. A., Tyliszczak, T., Mitchell, G. E., Keefe, M. H. & Hitchcock, A. P. Three-dimensional chemical mapping by scanning transmission X-ray spectromicroscopy. J. Synchrotron Radiat. 14, 395–402 (2007).
29. Weiss, D. et al. Computed tomography of cryogenic biological specimens based on X-ray microscopic images. Ultramicroscopy 84, 185–197 (2000).
30. Beetz, T. & Jacobsen, C. Soft X-ray radiation-damage studies in PMMA using a cryo-STXM. J. Synchrotron Radiat. 10, 280–283 (2003).
31. Fujii, S., Armes, S. P., Araki, T. & Ade, H. Direct imaging and spectroscopic characterization of stimulus-responsive microgels. J. Am. Chem. Soc. 127, 16808–16809 (2005).
32. Mitchell, G. E. et al. Quantitative characterization of microscopic variations in the cross-link density of gels. Macromolecules 35, 1336–1341 (2002).
33. Köhler, K. et al. Soft X-ray Microscopy to characterize polyelectrolyte assemblies. J. Phys. Chem. B 111, 8388–8393 (2007).
34. Déjugnat, C. et al. Membrane densification of heated polyelectrolyte multilayer capsules characterized by soft X-ray microscopy. Adv. Mater. 19, 1331–1336 (2007).
35. Dynes, J. J. et al. Speciation and quantitative mapping of metal species in microbial biofilms using scanning transmission X-ray microscopy. Environ. Sci. Technol. 40, 1556–1565 (2006).
36. Lawrence, J. R. et al. Mapping of metal species in biofilms using scanning transmission X-ray microscopy. Geochim. Cosmochim. Acta 69, A600 (2005).
37. Halls, J. J. M. et al. Efficient photodiodes from interpenetrating polymer networks. Nature 376, 498–500 (1995).
38. Yu, G., Gao, J., Hummelen, J. C., Wudl, F. & Heeger, A. J. Polymer photovoltaic cells - Enhanced efficiencies via a network of internal donor-acceptor heterojunctions. Science 270, 1789–1791 (1995).
39. McNeill, C. R. et al. Nanoscale quantitative chemical mapping of conjugated polymer blends. Nano Lett. 6, 1202–1206 (2006).
40. Hoppe, H. & Sariciftci, N. S. Morphology of polymer/fullerene bulk heterojunction solar cells. J. Mater. Chem. 16, 45–61 (2006).
41. Arias, A. C. et al. Photovoltaic performance and morphology of polyfluorene blends: A combined microscopic and photovoltaic investigation. Macromolecules 34, 6005–6013 (2001).
Transmission image
Diffraction pattern
Scanned specimen
Zone-plate lens
With diffraction
a
b c
Figure 8 | illustration of X-ray ptychography. a, Image creation in a STXM with a pixellated detector. b,c, Simulated images when the angularly resolved transmitted diffraction pattern is used (c) and total transmission plotted as a function of beam position (b). The circles in b and c represent the nominal spatial resolution without the diffraction enhancement. Figure reproduced with permission from ref. 102 © 2008 AAAS
nmat_2399_APR09.indd 289 13/3/09 11:54:49
© 2009 Macmillan Publishers Limited. All rights reserved

290 nature materials | VOL 8 | APRIL 2009 | www.nature.com/naturematerials
review articles | insight NaTure MaTerialS doi: 10.1038/nmat2399
42. Morteani, A. C., Sreearunothai, P., Herz, L. M., Friend, R. H. & Silva, C. Exciton regeneration at polymeric semiconductor heterojunctions. Phys. Rev. Lett. 92, 247402 (2004).
43. McNeill, C. R. et al. X-ray microscopy of photovoltaic polyfluorene blends: Relating the nanomorphology to device performance. Macromolecules 40, 3263–3270 (2007).
44. McNeill, C. R. et al. Evolution of the nanomorphology of photovoltaic polyfluorene blends: Sub-100 nm resolution with X-ray spectromicroscopy. Nanotechnology 19, 424015 (2008).
45. Rousseau, M. E., Hernández Cruz, D., West, M. M., Hitchcock, A. P. & Pezolet, M. Nephila clavipes spider dragline silk microstructure studied by scanning transmission X-ray microscopy. J. Am. Chem. Soc. 129, 3897–3905 (2007).
46. Pézolet, M. et al. Mapping Protein Orientation in Spider Silk by STXM — The Effect of Water. 2007 Activity Report, 118–119 (Canadian Light Source, 2007).
47. Gosline, J. M., Guerette, P. A., Ortlepp, C. S. & Savage, K. N. The mechanical design of spider silks: From fibroin sequence to mechanical function. J. Exp. Biol. 202, 3295–3303 (1999).
48. Bader, S. D. Magnetism in low dimensionality. Surf. Sci. 500, 172–188 (2002).49. Schütz, G. et al. Absorption of circularly polarized X-Rays in iron.
Phys. Rev. Lett. 58, 737–740 (1987).50. Fischer, P. et al. Imaging of magnetic domains by transmission X-ray
microscopy. J. Phys. D 31, 649–655 (1998).51. Warwick, T. et al. A scanning transmission X-ray microscope for materials
science spectromicroscopy at the Advanced Light Source. Rev. Sci. Instrum. 69, 2964–2973 (1998).
52. Eisebitt, S. et al. Lensless imaging of magnetic nanostructures by X-ray spectro-holography. Nature 432, 885–888 (2004).
53. Hubert, A. & Schäfer, R. Magnetic Domains — The Analysis of Magnetic Microstructures (Springer, 1998).
54. Bode, M. Spin-polarized scanning tunnelling microscopy. Rep. Prog. Phys. 66, 523–582 (2003).
55. Wachowiak, A. et al. Direct observation of internal spin structure of magnetic vortex cores. Science 298, 577–580 (2002).
56. Carra, P., Thole, B. T., Altarelli, M. & Wang, X. D. X-ray circular-dichroism and local magnetic-fields. Phys. Rev. Lett. 70, 694–697 (1993).
57. Thole, B. T., Carra, P., Sette, F. & Van der Laan, G. X-ray circular-dichroism as a probe of orbital magnetization. Phys. Rev. Lett. 68, 1943–1946 (1992).
58. Scholl, A. et al. Observation of antiferromagnetic domains in epitaxial thin films. Science 287, 1014–1016 (2000).
59. Nolting, F. et al. Direct observation of the alignment of ferromagnetic spins by antiferromagnetic spins. Nature 405, 767–769 (2000).
60. Ohldag, H. et al. Spectroscopic identification and direct imaging of interfacial magnetic spins. Phys. Rev. Lett. 87, 247201 (2001).
61. Hillebrecht, F. U. et al. Magnetic moments at the surface of antiferromagnetic NiO(100). Phys. Rev. Lett. 86, 3419–3422 (2001).
62. Eimüller, T. et al. Spin-reorientation transition in Co/Pt multilayers on nanospheres. Phys. Rev. B 77, 134415 (2008).
63. Ohldag, H. et al. pi-Electron ferromagnetism in metal-free carbon probed by soft X-ray dichroism. Phys. Rev. Lett. 98, 187204 (2007).
64. Choe, S. B. et al. Vortex core-driven magnetization dynamics. Science 304, 420–422 (2004).
65. Puzic, A. et al. Spatially resolved ferromagnetic resonance: Imaging of ferromagnetic eigenmodes. J. Appl. Phys. 97, 10E704 (2005).
66. Chou, K. W. et al. Vortex dynamics in coupled ferromagnetic multilayer structures. J. Appl. Phys. 99, 08F305 (2006).
67. Slonczewski, J. C. Current-driven excitation of magnetic multilayers. J. Magn. Magn. Mater. 159, L1–L7 (1996).
68. Berger, L. Emission of spin waves by a magnetic multilayer traversed by a current. Phys. Rev. B 54, 9353–9358 (1996).
69. Acremann, Y. et al. Time-resolved imaging of spin transfer switching: Beyond the macrospin concept. Phys. Rev. Lett. 96, 217202 (2006).
70. Strachan, J. P. et al. Direct observation of spin-torque driven magnetization reversal through nonuniform modes. Phys. Rev. Lett. 100, 247201 (2008).
71. Bryan, M. T., Fry, P. W., Fischer, P. J. & Allwood, D. A. Observation of field-induced domain wall propagation in magnetic nanowires by magnetic transmission X-ray microscopy. J. Appl. Phys. 103, 07D909 (2008).
72. Meier, G. et al. Direct imaging of stochastic domain-wall motion driven by nanosecond current pulses. Phys. Rev. Lett. 98, 187202 (2007).
73. Argyle, B. E., Terrenzio, E. & Slonczewski, J. C. Magnetic vortex dynamics using the optical Cotton-Mouton effect. Phys. Rev. Lett. 53, 190–193 (1984).
74. Thiele, A. A. Steady-state motion of magnetic domains. Phys. Rev. Lett. 30, 230–233 (1973).
75. Huber, D. L. Equation of motion of a spin vortex in a two-dimensional planar magnet. J. Appl. Phys. 53, 1899–1900 (1982).
76. Okuno, T., Shigeto, K., Ono, T., Mibu, K. & Shinjo, T. MFM study of magnetic vortex cores in circular permalloy dots: behavior in external field. J. Magn. Magn. Mater. 240, 1–6 (2002).
77. Thiaville, A., Garcia, J. M., Dittrich, R., Miltat, J. & Schrefl, T. Micromagnetic study of Bloch-point-mediated vortex core reversal. Phys. Rev. B 67, 094410 (2003).
78. Van Waeyenberge, B. et al. Magnetic vortex core reversal by excitation with short bursts of an alternating field. Nature 444, 461–464 (2006).
79. Xiao, Q. F., Rudge, J., Choi, B. C., Hong, Y. K. & Donohoe, G. Dynamics of vortex core switching in ferromagnetic nanodisks. Appl. Phys. Lett. 89, 262507 (2006).
80. Hertel, R., Gliga, S., Fähnle, M. & Schneider, C. M. Ultrafast nanomagnetic toggle switching of vortex cores. Phys. Rev. Lett. 98, 117201 (2007).
81. Lee, K. S., Guslienko, K. Y., Lee, J. Y. & Kim, S. K. Ultrafast vortex-core reversal dynamics in ferromagnetic nanodots. Phys. Rev. B 76, 174410 (2007).
82. Yamada, K. et al. Electrical switching of the vortex core in a magnetic disk. Nature Mater. 6, 269–273 (2007).
83. Kim, S. K., Choi, Y. S., Lee, K. S., Guslienko, K. Y. & Jeong, D. E. Electric-current-driven vortex-core reversal in soft magnetic nanodots. Appl. Phys. Lett. 91, 082506 (2007).
84. Curcic, M. et al. Polarisation selective magnetic vortex dynamics and core reversal in rotating magnetic fields. Phys. Rev. Lett. 101, 197204 (2008).
85. Zagorodny, J. P., Gaididei, Y., Mertens, F. G. & Bishop, A. R. Switching of vortex polarization in 2D easy-plane magnets by magnetic fields. Eur. Phys. J. B 31, 471–487 (2003).
86. Kravchuk, V. P., Sheka, D. D., Gaididei, Y. & Mertens, F. G. Controlled vortex core switching in a magnetic nanodisk by a rotating field. J. Appl. Phys. 102, 043908 (2007).
87. Kim, S. K., Lee, K. S., Yu, Y. S. & Choi, Y. S. Reliable low-power control of ultrafast vortex-core switching with the selectivity in an array of vortex states by in-plane circular-rotational magnetic fields and spin-polarized currents. Appl. Phys. Lett. 92, 022509 (2008).
88. Bolte, M. et al. Time-resolved X-ray microscopy of spin-torque-induced magnetic vortex gyration. Phys. Rev. Lett. 100, 176601 (2008).
89. Sandford, S. A. et al. Organics captured from comet 81P/Wild 2 by the Stardust spacecraft. Science 314, 1720–1724 (2006).
90. Maria, S. F., Russell, L. M., Gilles, M. K. & Myneni, S. C. B. Organic aerosol growth mechanisms and their climate-forcing implications. Science 306, 1921–1924 (2004).
91. Li, L. et al. X-ray microscopy studies of protein adsorption on a phase segregated polystyrene/polymethylmethacrylate surface. 2. Effect of pH on site preference. J. Phys. Chem. B 112, 2150–2158 (2008).
92. Si, M. et al. Compatibilizing bulk polymer blends by using organoclays. Macromolecules 39, 4793–4801 (2006).
93. Zhang, W. H. et al. Effect of methyl methacrylate/polyhedral oligomeric silsesquioxane random copolymers in compatibilization of polystyrene and poly(methyl methacrylate) blends. Macromolecules 35, 8029–8038 (2002).
94. Chao, W. L., Harteneck, B. D., Liddle, J. A., Anderson, E. H. & Attwood, D. T. Soft X-ray microscopy at a spatial resolution better than 15 nm. Nature 435, 1210–1213 (2005).
95. Jefimovs, K. et al. Zone-doubling technique to produce ultrahigh-resolution x-ray optics. Phys. Rev. Lett. 99, 264801 (2007).
96. Miao, J. W., Charalambous, P., Kirz, J. & Sayre, D. Extending the methodology of X-ray crystallography to allow imaging of micrometre-sized non-crystalline specimens. Nature 400, 342–344 (1999).
97. McNulty, I., Kirz, J. & Jacobsen, C. High resolution imaging by Fourier transform X-ray holography. Science 256, 1009–1012 (1992).
98. Neutze, R., Wouts, R., van der Spoel, D., Weckert, E. & Hajdu, J. Potential for biomolecular imaging with femtosecond X-ray pulses. Nature 406, 752–757 (2000).
99. Chapman, H. N. et al. Femtosecond diffractive imaging with a soft-X-ray free-electron laser. Nature Phys. 2, 839–843 (2006).
100. Feldhaus, J., Arthur, J. & Hastings, J. B. X-ray free-electron lasers. J. Phys. B 38, S799–S819 (2005).
101. Thibault, P. et al. High-resolution scanning X-ray diffraction microscopy. Science 321, 379–382 (2008).
102. Chapman, H. N. Focus on X-ray diffraction. Science 321, 352–353 (2008).103. Araki, T. et al. Soft X-ray resonant scattering of structured polymer
nanoparticles. Appl. Phys. Lett. 89, 124106 (2006).104. Wang, C., Araki, T. & Ade, H. Soft X-ray resonant reflectivity of low Z material
thin films. Appl. Phys. Lett. 87, 214109 (2005).105. Wang, C. et al. Resonant soft X-ray reflectivity of organic thin films:
Capabilities and limitations. J. Vac. Sci. Technol. A 25, 575–586 (2007).
acknowledgementsWe are grateful to J. Stöhr, R. Fink, A. P. Hitchcock, M. Pézolet, C. McNeill, Y. Acremann and H. Chapman for providing us with figures and A. P. Hitchcock for commenting on a draft document. H.A. is supported by the US Department of Energy under contract DE-FG02-98ER45737.
nmat_2399_APR09.indd 290 13/3/09 11:54:49
© 2009 Macmillan Publishers Limited. All rights reserved