Embed Size (px)
Citation preview


September 2017 | COAG Disability Reform Council Quarterly Report 2
Executive Summary
Introduction
This report is provided in accordance with Section 174 of the National Disability Insurance
Scheme Act 2013, which requires that:
The Board members must prepare a report on operations of the Agency for each period of 3 months
starting on 1 July, 1 October, 1 January or 1 April; and give the report to the Ministerial Council within
one month after the end of the period to which the report relates.
National statistics and findings are presented in the body of this report with separate
appendices for each State/Territory. Findings are presented for:
Participants and plans
Committed support and payments
Providers and markets
Information, linkages and capacity building
Mainstream interface
Financial sustainability.
This report is the fifth quarterly report during the NDIS Transition period, which commenced on
1 July 2016. The executive summary focuses on the growth in the NDIS, as well as its financial
sustainability.
NDIS continues to grow
Overall, the report shows that the number of participants in the Scheme continues to grow with
112,785 participants with an approved plan at 30 September 2017. A further 6,716 children
have been supported in the ECEI gateway.

September 2017 | COAG Disability Reform Council Quarterly Report 3
Figure 1 Number of participants with approved plans by quarter1
Significant growth occurred in the number of participants and providers over the past quarter.
Participants
A total of 22,151 participants received plans in this quarter. This is higher than the average
number of plans approved per quarter in 2016-17, which was 15,088.
The 22,151 participants with approved plans in the quarter represents an increase of 24%
in the total number of participants with approved plans.
6,716 children were in the ECEI gateway at 30 September 2017. Of these, 3,611 were
previously confirmed as ECEI at 30 June 2017 and an additional 3,105 entered the gateway
this quarter. Overall, the number of participants with an approved plan (including ECEI)
represents 87% of the bilateral estimate for the quarter (when ECEI is included).
During the transition period to date, a total of 82,504 participants entered the Scheme and
received an approved plan, and 6,716 children were in the ECEI gateway. This represented
82% of the transition bilateral estimate to 30 September 2017 (the total including trial
participants represented 84% of the cumulative bilateral estimate). The NDIS continues to
work with State/Territory and Commonwealth governments to obtain data on participants
transitioning into the Scheme. The NDIA is also working to bring participants into the
Scheme who did not previously receive support.
1 Small adjustments to the number of participants in each of the 2016-17 quarters have been made to reflect more up-to-date data.
988 2,5865,414
7,316 8,88011,029
13,61017,303
19,75822,281
24,86630,281
37,863
61,200
75,556
90,634
112,785
0
20,000
40,000
60,000
80,000
100,000
120,000T
ota
l part
icip
ants
Quarter Date
2013-14 2014-15 2015-16 2016-17 2017-18

September 2017 | COAG Disability Reform Council Quarterly Report 4
Table 1 outlines the number of participant plan approvals as at the end of September 2017,
including plan approvals by State/Territory.
Table 1 Plan approvals compared to estimates2
Prior
Quarters 2017-18 Q1
Total excluding
ECEI
Total including
ECEI
Bilateral estimates
NSW 43,934 14,433 58,367 63,293 72,485
VIC 15,433 3,393 18,826 19,506 23,875
QLD 7,188 2,049 9,237 9,733 18,464
WA 3,782 200 3,982 3,982 5,301
SA 11,632 1,359 12,991 13,223 13,968
TAS 2,229 305 2,534 2,915 2,852
ACT 6,048 253 6,301 6,301 5,075
NT 388 159 547 547 899
Total 90,634 22,151 112,785 119,501 142,919
The NDIS is helping participants across different life domains. The NDIS outcomes
framework collects information on participants and their families/carers when participants
enter the Scheme and when their plans are reviewed. Of the participants aged 25+ years
who entered the Scheme in the first quarter of 2016-17 and had their plan reviewed in the
first quarter of 2017-18:
o 75% indicated that the NDIS had helped them with activities of daily living
o 71% indicated that the NDIS had helped them with choice and control
o 63% indicated that the NDIS had helped them with social, community & civic
participation.
The satisfaction rating remained high with 84% of participants surveyed in the quarter rating
their satisfaction with the Agency planning process as either good or very good. The overall
average satisfaction rating since the Scheme began is 91%. At the same time, challenges
facing implementation of the Scheme are recognised and work is proceeding apace on
improving the participant and provider experience. A new pathway has been designed for
participants and providers from their first interaction to their ongoing engagement with the
NDIS. This new pathway includes face-to-face engagement, a consistent point of contact,
clearer information, and a stronger focus on outcomes and goals during the planning
discussion. The new pathway will be progressively piloted and tested over the coming
months before being rolled out nationally.
Provision of Support
As at 30 September 2017, 10,507 service providers were approved to deliver disability
supports to NDIS participants in at least one registration group.
Nationally, the number of approved service providers has increased by 21% from 8,698 at
30 June 2017 to 10,507 at 30 September 2017.
2 Note: bilateral estimates are split between State/Territory and New/Commonwealth. Appendix B includes this breakdown for each State/Territory.

September 2017 | COAG Disability Reform Council Quarterly Report 5
In the first quarter of 2017-18, 52% of the 10,507 service providers are not yet active (that
is, 52% of providers are not yet supporting participants). Many service providers have
registered for the NDIS in anticipation of the Scheme rolling-out across the country.
On average, participants active in the first quarter of 2017-18 are supported by 1.55 service
providers.
The top 25% of active service providers receive between 80-90% of the dollar value of
payments made by the NDIA for participant supports.
Figure 2 demonstrates the growth in the number of approved service providers by State and Territory since 1 July 2016. Not unexpectedly, New South Wales and Victoria have the highest number of approved service providers, with 5,251 and 3,101 service providers respectively as at 30 September 2017.3
Figure 2 Number of approved service providers by State/Territory
Financial sustainability
As at 30 September 2017, since 1 July 2013, $9.5 billion of support has been committed to
112,785 participants who have had at least one approved plan.4 This includes $1.6 billion of
support in respect of the trial years, $3.2 billion in respect of 2016-17, $4.5 billion in respect
of 2017-18, and $0.3 billion for later years.5
3 Given providers can be registered to provide services in more than one State/Territory, the total number of approved service providers nationally will not necessarily equal the sum of approved service providers in each State/Territory. 4 Note: this excludes children supported in the ECEI gateway. 5 Note: the $0.3 billion committed in future years is due to current plans in place that have an end date past 30 June 2018 and the $4.5 billion in respect of 2017-18 only includes approved plans to date, and not all of these plans cover the full 2017-18 year.
1,467 1,5472,365
3,3224,301
5,251
896 1,001
1,476
1,935
2,532
3,101
139 230
628
1,046
1,484
1,875
255332
509
632
756
850
522591
776
947
1,153
1,331
260324
511
616
730
821
261321
535
687
814
942
273
336
383
414
As at 30 Jun 2016 As at 30 Sep 2016 As at 31 Dec 2016 As at 31 Mar 2017 As at 30 Jun 2017 As at 30 September2017
NSW VIC QLD WA SA TAS ACT NT
3,696
5,110
6,814
10,507
3,519
8,698
5%
38%
33%
28%
21%

September 2017 | COAG Disability Reform Council Quarterly Report 6
The insurance approach allows pressures on the Scheme to be identified early, so that the
Agency can respond in the most appropriate way.
Consistent with previous quarterly reports, this report acknowledges pressures which
require monitoring, such as higher than expected number of children approaching the
Scheme, and a degree of committed support in participant plans increasing above
indexation.
Specific strategies include:
o The introduction of the Early Childhood Early Intervention (ECEI) gateway which
aims to support children within mainstream services and the community, with only
the children requiring an individual support package gaining entry to the Scheme.
o The introduction of typical support packages which establish a benchmark amount
of support for participants with specific characteristics.
o Increased risk-based quality assurance at access and plan approval.
o Increased staff training.
The Agency continues to closely monitor any adverse pressures, and has mechanisms in
place to oversee the development of initiatives to address identified pressures.
Currently, the best estimate of the longer-term cost of a well-managed NDIS is $22 billion a
year at full scheme. The Productivity Commission’s report on NDIS Costs, released on 19
October 2017, indicates that this remains appropriate and is consistent with the Commission’s
own 2011 modelling after accounting for wage and population growth. Ongoing actuarial work
is continuing to verify the longer-term cost of the NDIS based on scheme experience to date.

September 2017 | COAG Disability Reform Council Quarterly Report 7
Key Definitions
Aboriginal and/or Torres Strait Islander
Response of:
Aboriginal but not Torres Strait Islander; or
Australian Aboriginal; or
Torres Strait Islander
Access request A formal request by an individual for a determination of eligibility to access the Scheme.
Active participant Those who have been determined eligible and have not exited the Scheme.
Administrative Appeals Tribunal
An independent body that conducts reviews of administrative decisions made under Commonwealth laws.
Bilateral agreement An agreement between the Commonwealth and a State or Territory that formalises the commitments of each party during the Scheme rollout.
Culturally and Linguistically Diverse (CALD)
Country of birth is not Australia, New Zealand, the United Kingdom, the United States of America, Canada or South Africa, or primary language spoken at home is not English.
Committed support The cost of supports that are contained within a participant’s plan, approved to be provided to support a participant’s needs. This amount is annualised to allow for like-for-like comparison in some sections of the report.
In-kind Existing Commonwealth or State/Territory government programs delivered under existing block grant funding arrangements.
Initial plan A participant’s first support plan, determined after a participant has been deemed eligible for the Scheme and following their initial planning meeting.
Payment Made to providers, participants or their nominees for supports received as part of a participant’s plan.
Participant An individual whose access request has been determined ‘eligible’. Note: a participant can be made eligible under the permanent disability criteria of the NDIS Act (section 24) or the early intervention criteria of the NDIS Act (section 25). Further, if a participant is in a “defined” program, they

September 2017 | COAG Disability Reform Council Quarterly Report 8
automatically meet the access criteria. This is because the program that the person is currently receiving is deemed to have eligilbity criteria in line with the access criteria in the NDIS Act.
Revenue The amount received from both States/Territories and the Commonwealth governments for participant supports as outlined in the bilateral agreements. This includes both cash and in-kind amounts.

September 2017 | COAG Disability Reform Council Quarterly Report 9
Contents
Executive Summary .............................................................................................................. 2
Key Definitions ...................................................................................................................... 7
Contents ............................................................................................................................... 9
Part 1. Participants and Plans .......................................................................................... 16
1.1 Quarterly intake .................................................................................................... 18
1.2 Plan reviews ......................................................................................................... 19
1.3 Quarterly exits ....................................................................................................... 19
1.4 Cumulative position ............................................................................................... 20
1.5 Participant profile .................................................................................................. 21
1.6 Plan management and support coordination ......................................................... 24
1.7 Plan activation ...................................................................................................... 25
1.8 Outcomes for participants and their families/carers ............................................... 26
1.9 Participant satisfaction .......................................................................................... 33
1.10 Scheme assurance ............................................................................................... 34
Part 2. Committed supports and payments ....................................................................... 38
2.1 Committed supports .............................................................................................. 38
2.2 Payments .............................................................................................................. 43
Part 3. Providers and markets .......................................................................................... 46
Part 4. Information, linkages and capacity building ........................................................... 50
Part 5. Mainstream interface ............................................................................................ 51
Part 6. Financial sustainability .......................................................................................... 52
Appendix A: Outcomes Framework Population Benchmarks .......................................... 54
Appendix B: Comparison of plan approvals to bilateral estimates ................................... 55
Appendix C: New South Wales ....................................................................................... 57
Appendix D: Victoria ....................................................................................................... 74
Appendix E: Queensland ................................................................................................ 91
Appendix F: Western Australia ..................................................................................... 108
Appendix G: South Australia ......................................................................................... 126
Appendix H: Tasmania ................................................................................................. 143
Appendix I: Australian Capital Territory ....................................................................... 161
Appendix J: Northern Territory ..................................................................................... 178

September 2017 | COAG Disability Reform Council Quarterly Report 10
Introduction
A legislative requirement of the National Disability Insurance Agency (NDIA) in the National
Disability Insurance Scheme (NDIS) Act 2013 (Section 174) is:
The Board members must prepare a report on operations of the Agency for each period of 3
months starting on 1 July, 1 October, 1 January or 1 April; and give the report to the
Ministerial Council within one month after the end of the period to which the report relates.
National statistics and findings are presented in the body of this report with separate
appendices for each State/Territory.
This report is the fifth quarterly report during the NDIS Transition period which commenced
on 1 July 2016.
Some current limitations continue to exist in the data available for this report. Specifically,
data is not available to report on:
Participants exiting the Early Childhood Early Intervention (ECEI) gateway.
Decision reviews.
Ongoing enhancements to the Customer Relationship Management (CRM) system, data
warehouse and business practices will address these issues in future reports.
Sections of this report
The sections of this report are as follows:
An introduction to the NDIS and the rollout of the Scheme to date
30 September 2017 performance, reported at a national level, split into the following six areas:
o Participants and plans
o Committed supports and payments
o Providers and markets
o Information, linkages and capacity building
o Mainstream interface
o Financial sustainability
Appendices for each State/Territory.

September 2017 | COAG Disability Reform Council Quarterly Report 11
National Disability Insurance Scheme locations
The National Disability Insurance Scheme (NDIS) Act received Royal Assent on
28 March 2013, and the NDIS became fully operational on 1 July 2013 with the
commencement of NDIS trial sites.
At the conclusion of trial (30 June 2016), the NDIS was operational in nine locations:
Table 2 NDIS trial sites
Trial site name Local government areas Age groups Commencement
date
Hunter trial site – NSW Newcastle, Lake Macquarie, Maitland
All 1 July 2013
Tasmania trial site 15-24 year olds 1 July 2013
Barwon trial site – VIC Greater Geelong, Surf Coast, Queenscliff, Colac-Otway
All 1 July 2013
South Australia trial site 0-14 year olds 1 July 2013
Australian Capital Territory
All 1 July 2014
Perth Hills trial site – WA Swan, Kalamunda, Mundaring All 1 July 2014
Barkly region – NT All 1 July 2014
Nepean Blue Mountains site – NSW
Blue Mountains, Hawkesbury, Lithgow, Penrith
0-17 year olds 1 July 2015
North Queensland site – QLD
Townsville, Charters Towers 0-17 year olds 1 April 2016
Palm Island 0-64 year olds
On 1 July 2016 the NDIS commenced transitioning to full scheme. As at 30 September
2017, the NDIS was operational in the following additional locations:

September 2017 | COAG Disability Reform Council Quarterly Report 12
Table 3 NDIS transition locations – 30 September 2017
State/Territory Service districts Start date
New South Wales
Central Coast, New England, North Sydney, South Western Sydney, Southern NSW, Western Sydney, and the remainder of the Hunter and Nepean Blue Mountains regions
1 July 2016
Far West, Illawarra Shoalhaven, Mid North Coast, Murrumbidgee, Northern NSW, South Eastern Sydney, Sydney and Western NSW
1 July 2017
Victoria
North East Melbourne 1 July 2016
Central Highlands 1 January 2017
Loddon 1 May 2017
Queensland
Townsville – all ages 1 October 2016
Mackay 1 November 2016
Toowoomba 1 January 2017
Ipswich 26 May 2017
Bundaberg 1 September
2017
Northern Territory
Darwin Urban (eligible clients in supported accommodation) and East Arnhem
1 January 2017
Alice Springs LGA (eligible clients in supported accommodation), Katherine and Darwin Remote
1 July 2017
Tasmania
Expanded to include 12-24 year olds 1 July 2016
Expanded to include 25-28 year olds 1 January 2017
Expanded to include 4-11 year olds 1 July 2017
South Australia
Expanded to include 15-17 year olds 1 January 2017
Expanded to include 18+ year olds for Barossa, Light and Lower North; and Playford, Salisbury and Port Adelaide Enfield (East) LGAs
1 July 2017
Western Australia
Bayswater, Bassendean, Chittering, Toodyay, York and Northam LGAs
1 January 2017
Figure 3 below graphically shows the areas of roll-out.
September 2017 | COAG Disability Reform Council Quarterly Report 13
Figure 3 NDIS locations – 30 September 2017
September 2017 | COAG Disability Reform Council Quarterly Report 14
Improving the participant and provider experience
The National Disability Insurance Agency (NDIA) has released details of a new National
Disability Insurance Scheme (NDIS) ‘pathway’ designed to significantly improve the
experience people and organisations have with the ground-breaking NDIS.
The pathway refers to the experience participants and providers have from their first
interaction to their ongoing engagement with the NDIS.
Central to the new participant pathway is the delivery of face-to-face engagement for all
NDIS plan development, based on the individual’s preference. This improvement has
already resulted in a substantial increase in the number of plans being developed in person.
Having learned from the past, the new pathway will now be progressively piloted and tested
over the coming months before being rolled out nationally. The NDIA will continue to engage
with stakeholders on the testing and implementation of the new pathway.
The new pathway will include:
A consistent point of contact, who plays a key role in empowering participants to achieve
outcomes
Planning being undertaken with a skilled Local Area Coordinator or NDIA planner who
will spend time understanding the unique needs of each participant
A stronger focus on the broader system of supports for people with disability, including
other government services such as health, education and transport, to promote greater
inclusion and a sense of community for people with disability
Communication which emphasises the objectives of the NDIS, with a clear focus on
outcomes and goals during planning discussions
Information that is clear, consistent and available in accessible formats, such as plain
English and braille
An improved NDIS portal and tools, combined with more straightforward processes that
will reduce the administrative cost for providers.
The new pathway is the result of a collaborative review the NDIA undertook in response to
feedback from participants and providers that their experience was not meeting expected
standards.
The NDIA is committed to ensuring people with disability, their families, carers and providers
are confident to engage with and navigate the NDIS.
Further, the NDIA recognises the need for a strong and vibrant provider market that
contributes to improving outcomes for participants.
As part of the new provider pathway, the NDIA will provide better information and insights to
support business decisions and make it easier for providers to transact with the Scheme and
connect with participants.
Implementing all improvements will take time, but the NDIA is committed to responding as
quickly as possible to the feedback. It is important to get the new pathway experience right
before implementing all the improvements across Australia. To that end, the NDIA will be
proceeding to pilot the new pathway before it is rolled out nationally.
September 2017 | COAG Disability Reform Council Quarterly Report 15
Work is also underway to develop tailored pathways to ensure the NDIA has the right
response for all participants, including people with psychosocial disability, children, people
from Aboriginal and Torres Strait Islander communities, those from culturally and
linguistically diverse backgrounds and people with more complex needs.
Independent price review
In addition to the participant and provider pathway review, the NDIA has commissioned an
independent pricing review, which will be undertaken by McKinsey and Company, and
completed by December 2017.
While price controls will be in place for some participant supports during the rapid ramp-up of
the NDIS, as the market matures in size, quality and innovation, it is envisaged that prices
will be gradually deregulated and determined by market forces.
The aim of the independent pricing review is to assist with the provision of a strong and
vibrant provider market. The review will examine the effectiveness of pricing arrangements;
the approach used to set prices; the adequacy of provider returns; the role of pricing in
managing thin and undersupplied markets; and, a glide path towards price deregulation in
mature sub-markets.

September 2017 | COAG Disability Reform Council Quarterly Report 16
Part 1. Participants and Plans
Introduction
This section outlines information in relation to:
Intake and plans
Reviews
Scheme exits
Participant demographics
Plan implementation
Outcomes
Scheme assurance.
Key points
The key points relating to participants and plans are as follows:
A total of 22,151 plans were approved this quarter. This is higher than the average
number of plans approved per quarter in 2016-17, which was 15,088.
The 22,151 participants with approved plans in the quarter represents an increase of
24% in the total number of participants with approved plans.
6,716 children were in the ECEI gateway at 30 September 2017. Of these, 3,611 were
previously confirmed as ECEI at 30 June 2017 and an additional 3,105 entered the
gateway this quarter. Overall, the number of participants with an approved plan
(including ECEI) represents 87% of the bilateral estimate for the quarter (when ECEI is
included).
13,533 plans were reviewed in the quarter compared to 13,316 in the previous quarter.
As at 30 September 2017, 1,597 participants with approved plans have exited the
Scheme.
During the transition period to date, a total of 82,504 participants entered the Scheme
and received an approved plan, and 6,716 children were in the ECEI gateway. This
represented 82% of the transition bilateral estimate to 30 September 2017.
The cumulative total number of participants receiving support, at the end of the quarter,
was 119,501 (including 6,716 ECEI participants). This represented 84% of the
cumulative bilateral estimate. In addition, 24,002 participants had met the access
requirements and were awaiting a plan as at 30 September 2017.
Of the participants who entered the Scheme in the quarter, a high proportion were aged
7-14. Intellectual disability and autism were the most common disability groups for
participants with an approved plan. Around 28% of active participants had a relatively
high level of function, 43% of active participants had a relatively moderate level of
PART 1

September 2017 | COAG Disability Reform Council Quarterly Report 17
function, and 29% had a relatively low level of function. These relativities are within the
NDIS participant population, and not comparable to the general population.
Approximately 63% of active participants who entered the Scheme in this quarter were
male.
The proportion of participants who were fully or partly self-managing their plan was
slightly higher in the first quarter of 2017-18 (18%) compared with 2016-17 (17%), and
38% of participants who have had a plan approved in the first quarter of 2017-18 had
support coordination in their plan.
Around 71% of plans approved during 2016-17 were activated within 90 days of plan
approval.6
Baseline measures (against which outcomes will be measured in the future) were
collected on 97% of participants receiving their initial plan during the transition period. On
the whole, participants wanted more choice and control in their life, had low levels of
employment, and had low levels of community participation. Participation rates for
mainstream education, training and skill development were also low. Most participants
were happy with their current home.
Baseline outcomes were also collected on families and carers. Many reported that they
would like to work more than they do and also see family and friends more often.
The NDIS is helping participants across different life domains. The NDIS outcomes
framework collects information on participants and their families/carers when participants
enter the Scheme and when their plans are reviewed. Of the participants aged 25+ years
who entered the Scheme in the first quarter of 2016-17 and had their plan reviewed in
the first quarter of 2017-18:
- 75% indicated that the NDIS had helped them with activities of daily living
- 71% indicated that the NDIS had helped them with choice and control
- 63% indicated that the NDIS had helped them with social, community & civic
participation.
84% of participants rated their overall satisfaction with the Agency planning process as
either good or very good in the current quarter. This has remained the same as the
previous quarter. Since the Scheme began, 91% of participants rated their satisfaction
with the Agency planning process as either good or very good. This is consistent with the
need identified by the NDIA to undertake the Participant and Provider Pathway Review.
Since scheme inception there have been 406 access, planning, and plan review related
AAT appeals (0.26% of all access decisions) and 8,664 complaints made (equivalent to
10.3% of all participants with an approved plan). The Participant and Provider Pathway
Review is aiming to improve the participant and provider experience.
6 In-kind supports have not been included. However, if in-kind supports were included more plans would be activated sooner than stated.

September 2017 | COAG Disability Reform Council Quarterly Report 18
1.1 Quarterly intake
22,151 participants received an approved plan in the first quarter of 2017-18. In addition
6,716 children were in the ECEI gateway at 30 September 2017. Of these, 3,611 were
previously confirmed as ECEI at 30 June 2017 and an additional 3,105 entered the gateway
this quarter. The number of participants who received a plan in this quarter was higher than
the previous quarter (15,078 participants with an approved plan).
1.1.1 Background
Between 1 July 2016 and 30 June 2019, people with disability will transition from existing
State/Territory and Commonwealth funded programs to the NDIS.
The NDIS is transitioning to full-scheme in line with phasing schedules bilaterally agreed by
State/Territory and Commonwealth governments.
Access requests are assessed against the criteria of s.24 of the NDIS Act 2013 to become a
participant, or s.25 of the NDIS Act 2013 to be granted interim status as a participant
receiving early intervention support.7
The intention of early intervention under s.25 of the Act is to alleviate the impact of a
person's impairment upon their functional capacity by providing support at the earliest
possible stage. Early intervention support is also intended to benefit a person by reducing
their future needs for supports.
Through the Early Childhood Early Intervention (ECEI) approach, families of children aged
0-6 years with developmental delay or disability will be offered the support of NDIS Early
Childhood Partners to access specialist early childhood supports and services. This
approach is being rolled out as the Scheme is phased in across Australia.
1.1.2 Quarterly intake
Eighty-four percent (84%) of decisions determined during the first quarter of 2017-18 met the
criteria of the Act (referred to as an ‘eligible’ decision).
Sixty-five percent (65%) of participants determined ‘eligible’ in this quarter had transitioned
from an existing State/Territory program. Overall, since 1 July 2013, there have been
156,625 access decisions, and 119,501 participants have received an approved plan
(including children in the ECEI gateway).
7 Where an individual has had to provide evidence of permanent and significant disability to access existing State/Territory or Commonwealth programs (referred to as ‘defined’ programs), the individual is predetermined to have met the disability criteria of the NDIS Act.

September 2017 | COAG Disability Reform Council Quarterly Report 19
Table 1.1 Quarterly intake (national), split by plan and entry type, since 1 July 2013
Prior Quarters 2017-18 Q1 Total
Access decisions 131,710 24,915 156,625
Access Met 122,006 20,907 142,913
State 75,142 13,671 88,813
New 37,326 4,910 42,236
Commonwealth 9,538 2,326 11,864
Total Participant Plans 96,768 28,867 119,501
Early Intervention (s25) plans
21,467 2,931 24,398
Permanent Disability (s24) plans
69,167 19,220 88,387
ECEI8 6,134 6,716 6,716
1.2 Plan reviews
13,533 plans were reviewed in the quarter compared to 13,316 in the previous quarter.
1.2.1 Background
Following successful implementation of a plan, participants will generally commence an
ongoing plan review cycle, which is between six to 24 months.
1.2.2 Reviews by quarter
Table 1.2 below depicts the number of plan reviews conducted since the commencement of
transition.
Table 1.2 Plan reviews (national) conducted per quarter9
Prior Quarters
(Transition only)
2017-18 Q1 Transition
Total
Total plan reviews 36,913 13,533 50,446
Early intervention plans 10,871 3,333 14,204
Permanent disability plans 26,042 10,200 36,242
1.3 Quarterly exits
The majority of participants who have exited the Scheme had a s.24 plan. Overall the
percentage of people exiting the Scheme is lower than expected.
8 The number of children supported in the ECEI gateway cannot be summed across quarters as they can transition to NDIS plans, hence the ECEI figure shown is cumulative. 9 Plans less than 30 days in duration have been excluded from this tabulation, as these reviews are more likely to represent corrections to the plan rather than a new plan review to address a change in circumstance.

September 2017 | COAG Disability Reform Council Quarterly Report 20
1.3.1 Background
Exits are an important part of the outcomes focus of the Scheme, as well as important to the
sustainability of the Scheme by ensuring that only participants who continue to meet the
access criteria of the Act receive individualised funding. Continued eligibility is reviewed
periodically and when participant circumstances change.
1.3.2 Quarterly exits
Table 1.3 below depicts the total number of participants with approved plans who have
exited from the Scheme for s.25 and s.24 participants.10
Table 1.3 Exits from the Scheme since 1 July 2013 as at 30 September 2017
Exits
Total plan exits 1,597
Early Intervention plans 468
Permanent disability plans 1,129
Note: exits from the ECEI gateway will be reported in future reports.
1.4 Cumulative position
By the end of the quarter, the cumulative total number of participants receiving support was
119,501 (including 6,716 children supported through the ECEI gateway). In addition, 24,002
eligible participants who had received access decisions were awaiting a plan at 30
September 2017.
1.4.1 Background
Cumulative position reporting is inclusive of trial participants for the reported period and
represents participants who have or have had an approved plan.
1.4.2 Cumulative position by quarterly period
Table 1.4 below presents the cumulative number of participants with a plan by entry point
(i.e. whether participants were previously receiving State/Territory or Commonwealth
disability services or are new). A cumulative total of 119,501 participants were receiving
support, with 24,002 participants awaiting a plan. Further, in the transition period to date
alone, an additional 89,220 participants received support.
10 Note: participants exit the scheme due to death, entry to residential aged care, or because they no longer meet the access early intervention requirements.

September 2017 | COAG Disability Reform Council Quarterly Report 21
Table 1.4 Cumulative position by services previously received11
Participant cohort Bilateral estimate
% of estimate
Awaiting a plan
State Commonwealth New ECEI Total
Trial 13,995 1,679 14,607 30,281 34,545 88%
End of 2016-17 53,308 5,687 31,639 6,134 96,768 116,555 83%
End of 2017-18 Q1 67,353 8,505 36,927 6,716 119,501 142,919 84% 24,002
Table 1.5 below presents the cumulative number of participants with a plan by scheme
cohort (i.e. ECEI, EI s.25, PD s.24). A cumulative total of 119,501 participants were receiving
support, with 24,002 participants awaiting a plan.
Table 1.5 Cumulative position by entry into the Scheme
Participant cohort Bilateral estimate
% of estimate
Awaiting a plan
EI (s25) plan PD (s24) plan ECEI Total
Trial 12,198 18,083 30,281 34,545 88%
End of 2016-17 21,467 69,167 6,134 96,768 116,555 83%
End of 2017-18 Q1 24,398 88,387 6,716 119,501 142,919 84% 24,002
As 1,597 participants with approved plans have exited the Scheme, the number of active
participants with approved plans is 111,188 (excluding children supported through the ECEI
gateway). Information on active participants is presented in the following sections.
1.5 Participant profile
A high proportion of children aged 7-14 years entered the Scheme in the quarter, with
intellectual disability and autism being the most common disability groups for participants
with an approved plan. Around 28% of active participants had a relatively high level of
function, 43% of active participants had a relatively moderate level of function, and 29% had
a relatively low level of function. These relativities are within the NDIS participant population,
and not comparable to the general population. Sixty-three per cent (63%) of participants who
entered this quarter are male.
1.5.1 Background
The characteristics of participants entering the Scheme each quarter can vary based on the
phasing schedule in each State/Territory which is based on existing programs and age
groups. Hence, the results should not be considered to be representative of full scheme.
As mentioned above, the participant profiles are shown only for active participants (i.e.
excluding participants who have exited the Scheme). Over time, some participants will exit
the Scheme as others will enter and this section of the report shows the profile of
participants who currently meet the access criteria of the Act and have an approved plan.
11 Each quarter, updated lists of clients are provided by State/Territory and Commonwealth governments. This results in some participants being retrospectively reclassified from New to Existing.

September 2017 | COAG Disability Reform Council Quarterly Report 22
1.5.2 Quarterly profile
The tables below (Table 1.6 to Table 1.12) present the number of active participants with an
approved plan in the Scheme for the first quarter of 2017-18 and prior quarters by the
following participant characteristics:
Disability group
Level of function
Age group
Gender
Aboriginal and Torres Strait Islander status
Culturally and Linguistically Diverse (CALD) status
Young Person in Residential Aged Care (YPIRAC) status.
Two disability groups dominate the current participant profile, with 58% of active participants
having a primary disability of intellectual disability or autism. Considering quarter-on-quarter
changes, the proportion of participants with autism and intellectual disability have remained
consistent. Since the previous report the disability groups Developmental Delay and Global
Developmental Delay have been separated from the Intellectual Disability group.
Table 1.6 Active participants with approved plans per quarter by disability group
Prior Quarters 2017-18 Q1 Total
Disability N % N % N %
Intellectual Disability 25,332 28% 6,990 32% 32,322 29%
Autism 25,751 29% 6,020 27% 31,771 29%
Psychosocial disability 6,103 7% 1,399 6% 7,502 7%
Cerebral Palsy 4,448 5% 1,293 6% 5,741 5%
Developmental Delay 4,397 5% 804 4% 5,201 5%
Other Neurological 4,021 5% 1,010 5% 5,031 5%
Other Physical 3,818 4% 885 4% 4,703 4%
Acquired Brain Injury 2,576 3% 900 4% 3,476 3%
Hearing Impairment 2,491 3% 657 3% 3,148 3%
Other Sensory/Speech 2,405 3% 245 1% 2,650 2%
Visual Impairment 2,030 2% 612 3% 2,642 2%
Multiple Sclerosis 1,741 2% 464 2% 2,205 2%
Global Developmental Delay
1,339 2% 220 1% 1,559 1%
Spinal Cord Injury 909 1% 381 2% 1,290 1%
Stroke 999 1% 217 1% 1,216 1%
Other 698 1% 33 0% 731 1%
Total 89,058 100% 22,130 100% 111,188 100%
As shown in Table 1.7, about 28% of active participants in the current quarter had a
relatively high level of function, 43% of active participants had a relatively moderate level of
function, and 29% had a relatively low level of function. These relativities are within the NDIS
participant population, and not comparable to the general population.

September 2017 | COAG Disability Reform Council Quarterly Report 23
Table 1.7 Active participants with approved plan per quarter by level of function12
Prior Quarters 2017-18 Q1 Total
Level of Function N % N % N %
1 (High Function) 343 0% 106 0% 449 0%
2 (High Function) 234 0% 49 0% 283 0%
3 (High Function) 4,673 5% 1,090 5% 5,763 5%
4 (High Function) 7,602 9% 1,655 7% 9,257 9%
5 (High Function) 18,299 22% 3,392 15% 21,691 20%
6 (Moderate Function) 11,853 14% 3,252 15% 15,105 14%
7 (Moderate Function) 7,724 9% 1,667 8% 9,391 9%
8 (Moderate Function) 5,794 7% 1,840 8% 7,634 7%
9 (Moderate Function) 452 1% 131 1% 583 1%
10 (Moderate Function) 7,497 9% 2,520 11% 10,017 9%
11 (Low Function) 4,909 6% 1,071 5% 5,980 6%
12 (Low Function) 9,554 11% 3,694 17% 13,248 12%
13 (Low Function) 4,044 5% 976 4% 5,020 5%
14 (Low Function) 2,058 2% 677 3% 2,735 3%
15 (Low Function) 26 0% 10 0% 36 0%
Missing 3,996 0 3,996
Total 89,058 100% 22,130 100% 111,188 100%
A high proportion of active participants are currently in the 0 to 6 years and 7 to 14 years age
group (Table 1.8 below), with 12% and 21% of participants entering the Scheme in the
current quarter within these age groups respectively. These proportions can be impacted by
phasing schedules and are lower than prior quarters.
Table 1.8 Active participant profile per quarter by age group
Prior Quarters 2017-18 Q1 Total
Age Group N % N % N %
0 to 6 11,357 13% 2,704 12% 14,061 13%
7 to 14 25,185 28% 4,650 21% 29,835 27%
15 to 18 7,983 9% 1,748 8% 9,731 9%
19 to 24 8,580 10% 2,198 10% 10,778 10%
25 to 34 8,229 9% 2,511 11% 10,740 10%
35 to 44 7,522 8% 2,497 11% 10,019 9%
45 to 54 9,300 10% 2,850 13% 12,150 11%
55 to 64 9,389 11% 2,834 13% 12,223 11%
65+ 1,513 2% 138 1% 1,651 1%
Total 89,058 100% 22,130 100% 111,188 100%
The higher proportion of active male participants with a plan (63%) is consistent with prior
quarters (see Table 1.9).
Table 1.9 Active participant profile per quarter by gender
Prior Quarters 2017-18 Q1 Total
Gender N % N % N %
Male 56,087 63% 13,905 63% 69,992 63%
Female 32,584 37% 8,067 36% 40,651 37%
Indeterminate 387 0% 158 1% 545 0%
Total 89,058 100% 22,130 100% 111,188 100%
As depicted in Table 1.10 below, 4.9% of active participants with an approved plan who
12 The distributions are calculated excluding active participants with a missing level of function.

September 2017 | COAG Disability Reform Council Quarterly Report 24
entered in the first quarter of 2017-18 identified as Aboriginal and Torres Strait Islander, with
2.2% of participants uncategorised. In prior quarters, 5.0% of active participants with an
approved plan identified as Aboriginal and Torres Strait Islander, with the data not captured
for 4.5% of participants.
Table 1.10 Active participant profile per quarter by Aboriginal and Torres Strait islander status
Prior Quarters 2017-18 Q1 Total
Participant profile N % N % N %
Aboriginal and Torres Strait Islander
4,492 5.0% 1,079 4.9% 5,571 5.0%
Not Aboriginal and Torres Strait Islander
80,563 90.5% 20,575 93.0% 101,138 91.0%
Not Stated 4,003 4.5% 476 2.2% 4,479 4.0%
Total 89,058 100% 22,130 100% 111,188 100%
As shown in Table 1.11, 6.7% of active participants with an approved plan who entered in
the first quarter of 2017-18 have a culturally and linguistically diverse status. In prior
quarters, 5.6% of active participants with an approved plan were culturally and linguistically
diverse, with the data not captured for 1.3% of participants.
Table 1.11 Participant profile per quarter by culturally and linguistically diverse (CALD) status
Prior Quarters 2017-18 Q1 Total
Participant profile N % N % N %
CALD 5,013 5.6% 1,485 6.7% 6,498 5.8%
Not CALD 82,863 93.0% 20,638 93.3% 103,501 93.1%
Not Stated 1,182 1.3% 7 0.0% 1,189 1.1%
Total 89,058 100% 22,130 100% 111,188 100%
An additional 206 active participants with an approved plan entered the Scheme from
residential aged care (YPIRAC) in the first quarter of 2017-18. The NDIA has an action plan
in place to prioritise young people in residential aged care entering the Scheme. This
involves working with State/Territory and Commonwealth governments where required.
Table 1.12 Active participant profile per quarter by Young people in Residential aged care (YPIRAC) status
Prior Quarters 2017-18 Q1 Total
Participant profile N % N % N %
YPIRAC 662 0.7% 206 0.9% 868 0.8%
Not YPIRAC 88,396 99.3% 21,924 99.1% 110,320 99.2%
Total 89,058 100% 22,130 100% 111,188 100%
1.6 Plan management and support coordination
The proportion of participants who are fully or partly self-managing their plan was slightly
higher in the first quarter of 2017-18 (18%) compared with 2016-17 (17%), and 38% of
participants who have had a plan approved in the first quarter of 2017-18 have support
coordination in their plan.
1.6.1 Background
Participants can use different methods to manage their funding. More than one method
can be used in any one plan.

September 2017 | COAG Disability Reform Council Quarterly Report 25
Support co-ordination is a capacity building support in participant plans.
1.6.2 Quarterly plan management and support coordination
The tables below present the number of participants with an approved plan supported
under various models of financial plan management and plan implementation methods.
Table 1.13 Distribution of active participants by method of Financial Plan Management and quarter of plan approval13,14
Prior Quarters
(Transition Only) 2017-18 Q1 Total
Self-managed fully 7% 8% 7%
Self-managed partly 9% 10% 10%
Plan managed 11% 14% 12%
Agency managed 72% 68% 71%
Total 100% 100% 100%
Table 1.14 Distribution of active participants by support coordination and quarter of plan approval15
Prior Quarters
(Transition Only) 2017-18 Q1 Total
Support coordination 47% 38% 44%
1.7 Plan activation
Approximately 71% of plans approved in 2016-17 have been activated within 90 days of plan
approval.
1.7.1 Background
The period for plan activation refers to the length of time between plan approval and the
commencement of support.16
1.7.2 Quarterly plan activation
Table 1.15 below depicts the number of days to plan activation for participants with initial
plan approvals in 2016-17. Given that plans approved in Quarter 1 of 2017-18 are relatively
new, it would be too early to examine the duration to plan activation for these plans and
hence these have been excluded in this table. In Quarter 1, 76% of plans approved were
activated within 90 days of approval. In Quarter 2, 69% of plans approved were activated
within 90 days of approval, and this proportion is 74% and 69% respectively for plans
approved in Quarter 3 and Quarter 4. More plans than reported in this table will have been
activated. This is because some plans include in-kind support which is not included in the
analysis, and because there is a delay between when support is provided and when it is
13 Participants can use more than one method to manage their funding. This table is a hierarchy therefore each participant is only captured once. The hierarchy is: (1) self-managed fully, (2) self-managed partly (regardless of other methods being used), (3) anyone who does not fall into ‘self-managed partly’ and has a plan manager, and (4) anyone else. 14 Trial participants are not included. 15 Trial participants are not included. 16 This is measured using data on payments.

September 2017 | COAG Disability Reform Council Quarterly Report 26
invoiced. Invoices are required to understand when support commenced being provided to
the participant. As part of the Participant Pathway Review, work is being undertaken with a
view to accelerating plan activations.
Table 1.15 Duration to plan activation by quarter of initial plan approval for active participants
2016-17 Q1 2016-17 Q2 2016-17 Q3 2016-17 Q4
Plan activation N % N % N % N %
Less than 30 days 4,374 59% 10,757 46% 7,640 54% 6,831 45%
30 to 59 days 899 12% 3,361 15% 1,959 14% 2,450 16%
60 to 89 days 417 6% 1,949 8% 974 7% 1,117 7%
Activated within 90 days
5,690 76% 16,067 69% 10,573 74% 10,398 69%
90 to 119 days 183 2% 1,286 6% 588 4% 438 3%
120 days and over 667 9% 2,129 9% 717 5% 84 1%
Activated between 90 and 180 days
850 11% 3,415 15% 1,305 9% 522 3%
No payments 922 12% 3,672 16% 2,382 17% 4,117 27%
Total plans approved 7,462 100% 23,154 100% 14,260 100% 15,037 100%
1.8 Outcomes for participants and their families/carers
Baseline measures (for assessing future outcomes) were collected on 97% of participants
receiving their initial plan since 1 July 201617. On the whole, participants want more choice
and control in their life, have low levels of employment, and have low levels of community
participation. Participation rates for mainstream education, training and skill development
were also low. Most participants were happy with their current home.
Baseline outcomes were also collected on families and carers. Many reported that they
would like to work more than they do and also see family and friends more often.
1.8.1 Background
The NDIS outcomes framework is used as the basis for this reporting, and is described
below. The NDIS outcomes framework will be collected on participants over time.
The NDIS Outcomes Framework collects information from participants and families/carers
on how they are progressing in different areas (domains) of their lives. Building on research
undertaken by the Independent Advisory Council, the outcomes framework adopts a lifespan
approach to measuring outcomes, recognising that different outcomes will be important at
different stages of life. Questionnaires have been developed for four different participant age
groups. There are also three different family/carer questionnaires, depending on the age of
the participant.
This report includes results from the short-form outcomes framework (SFOF) questionnaires
collected during 2016-17 and the first quarter of 2017-18. Active participants with an initial
plan approved during the period 1 July 2016 to 30 September 2017 are included.
17 The percentage has reduced from 98% at the previous quarterly report to 97% for the current report. The reduction is due to revised methodology which excludes questionnaires completed without participant input.

September 2017 | COAG Disability Reform Council Quarterly Report 27
1.8.2 Baseline data
Table 1.16 shows the numbers of questionnaires completed during the transition period, by
SFOF version.
Table 1.16 Number of questionnaires completed by SFOF version18
Version Number of questionnaires
collected 2016-17 Number of questionnaires
collected Q1 2017-18 Number of questionnaires
Participant 0 to school 8,160 2,777 10,937
Participant school to 14 14,540 4,252 18,792
Participant 15 to 24 9,760 3,125 12,885
Participant 25 and over 25,750 9,291 35,041
Total Participant 58,210 19,445 77,655
Family 0 to 14 21,370 7,395 28,765
Family 15 to 24 2,809 1,658 4,467
Family 25 and over 941 1,626 2,567
Total Family 25,120 10,679 35,799
Total 83,330 30,124 113,454
Table 1.17 to Table 1.20 summarise results for the key indicators, for each of the seven
SFOF versions. Aggregate results for all active participants with an initial plan approved in
the period 1 July 2016 to 30 September 2017 are shown in these tables. In general the
results have not changed substantially since the previous quarterly report.
18 The numbers of questionnaires included in the analysis for 2016-17 has reduced since the previous quarterly report. The main reason for the change is the revised methodology mentioned above, which excludes questionnaires completed without participant input. Small changes are also caused by time lags in receiving information in the ICT system, and some participants no longer being active.

September 2017 | COAG Disability Reform Council Quarterly Report 28
Table 1.17 Selected key indicators for participants – Daily Living (DL) and Choice and Control (CC)
Indicator 0 to before
school School to
14 15 to 24
25 and over
DL
% with concerns in 6 or more of the areas: gross motor skills, fine motor skills, self-care, eating, social interaction, communication, cognitive development, sensory processing
62%
CC % who say their child is able to tell them what he/she wants
78%
DL % developing functional, learning and coping skills appropriate to their ability and circumstances
31%
DL % who say their child is becoming more independent
42%
CC % of children who have a genuine say in decisions about themselves
66%
CC % who are happy with the level of independence/control they have now
40%
CC % who choose who supports them 33% 52%
CC % who choose what they do each day 44% 61%
CC % who had been given the opportunity to participate in a self-advocacy group meeting
22% 29%
CC % who want more choice and control in their life
74% 67%
Table 1.18 Selected key indicators for participants – Relationships (REL) and Social/ Community Participation (S/CP)
Indicator 0 to before
school School to
14 15 to 24
25 and over
REL % of children who can make friends with people outside the family
66% 62%
S/CP % of children who participate in age appropriate community, cultural or religious activities
57%
REL % of children who spend time after school and on weekends with friends and/or in mainstream programs
35%
REL Of these, % who are welcomed or actively included
63% 78%
REL % of children who spend time with friends without an adult present
14%
REL % with no friends other than family or paid staff
28% 25%
S/CP % who have been actively involved in a community, cultural or religious group in the last 12 months
31% 36%

September 2017 | COAG Disability Reform Council Quarterly Report 29
Table 1.19 Selected key indicators for participants – Lifelong Learning (LL), Work (WK), Home (HM) and Health and
Wellbeing (HW)
Indicator 0 to before
school School to
14 15 to 24
25 and over
LL % of children attending school in a mainstream class
52%
HM % who are happy with their home 82% 78%
HM % who feel safe or very safe in their home
86% 78%
HW % who rate their health as good, very good or excellent
69% 50%
HW % who did not have any difficulties accessing health services
69% 68%
LL % who currently attend or previously attended school in a mainstream class
27%
LL % who participate in education, training or skill development
13%
LL Of those who participate, % who do so in mainstream settings
50%
LL % unable to do a course or training they wanted to do in the last 12 months
33%
WK % who have a paid job 18% 27%
WK % who volunteer 13% 13%

September 2017 | COAG Disability Reform Council Quarterly Report 30
Table 1.20 Selected key indicators for families/ carers of participants
Indicator 0 to 14 15 to 24 25 and over
% receiving Carer Payment 25% 28% 16%
% receiving Carer Allowance 55% 49% 21%
% working in a paid job 45% 46% 25%
Of those in a paid job, % in permanent employment
74% 73% 77%
Of those in a paid job, % working 15 hours or more
78% 83% 84%
% who say they (and their partner) are able to work as much as they want
42% 47% 57%
Of those unable to work as much as they want, % who say the situation of their child/family member with disability is a barrier to working more
87% 89% 85%
Of those unable to work as much as they want, % who say insufficient flexibility of jobs is a barrier to working more
39% 35% 28%
% able to advocate for their child/family member
78% 73% 70%
% who have friends and family they see as often as they like
45% 44% 37%
% who feel very confident or somewhat confident in supporting their child's development
86%
% who know what their family can do to enable their family member with disability to become as independent as possible
45%
% who feel in control selecting services 42% 47%
% who have made plans (or begun to make plans) for when they are no longer able to care for their family member with disability
37%
% who rate their health as good, very good or excellent
72% 63% 59%
From 1 July 2017, some transition participants started to accumulate one or more years of
experience with the Scheme. For active participants who entered the Scheme in the first
quarter of 2016-17, and had their plan reviewed in the first quarter of 2017-18, questions on
whether the NDIS has helped across the different outcomes domains were asked.
This report includes initial results for these questions. Table 1.21 to Table 1.24 summarise
the percentages responding “Yes” (excluding those in their first plan), by questionnaire
version19.
19 Due to small numbers for family/carers of participants ages 15 to 24, and 25 and over, results for these two versions have been combined in Table 1.24.

September 2017 | COAG Disability Reform Council Quarterly Report 31
Table 1.21 Results for “Has the NDIS helped?” questions answered at review, for SFOF version ‘Participant 0 to
school’ (n=381)
Question Yes
DL Has the NDIS improved your child's development? 93%
DL Has the NDIS improved your child's access to specialist services? 93%
CC Has the NDIS helped increase your child's ability to communicate what they want?
87%
REL Has the NDIS improved how your child fits into family life? 78%
S/CP Has the NDIS improved how your child fits into community life? 65%
Table 1.22 Results for “Has the NDIS helped?” questions answered at review, for SFOF version ‘Participant school to
14’ (n=511)
Question Yes
DL Has the NDIS helped your child to become more independent? 58%
LL Has the NDIS improved your child's access to education? 39%
REL Has the NDIS improved your child's relationships with family and friends?
50%
S/CP Has the NDIS improved your child's social and recreational life? 48%
Table 1.23 Results for “Has the NDIS helped?” questions answered at review, for SFOF versions ‘Participant 15 to 24’
(n=412) and ‘Participant 25 and over’ (n=1,612)
Question 15 to 24 % Yes
25+ % Yes
CC Has the NDIS helped you have more choices and more control over your life?
64% 71%
DL Has the NDIS helped you with daily living activities? 61% 75%
REL Has the NDIS helped you to meet more people? 50% 52%
HM Has your involvement with the NDIS helped you to choose a home that's right for you?
26% 34%
HW Has your involvement with the NDIS improved your health and wellbeing?
44% 57%
LL Had your involvement with the NDIS helped you to learn things you want to learn or to take courses you want to take?
39% 34%
WK Has your involvement with the NDIS helped you find a job that's right for you?
17% 20%
S/CP Has the NDIS helped you be more involved? 53% 63%

September 2017 | COAG Disability Reform Council Quarterly Report 32
Table 1.24 Results for “Has the NDIS helped?” questions answered at review, for SFOF version ‘Family 0 to 14’
(n=858); and for SFOF versions ‘Family 15 to 24’ and ‘Family 25 and over’ combined (n=136)
Question 0 to 14 % Yes
15+ % Yes
Has the NDIS improved your capacity to advocate (stand up) for your child? / Has the NDIS helped you to know your rights and advocate effectively?
56% 48%
Has the NDIS improved the level of support for your family? 71% 56%
Has the NDIS improved your access to services, programs and activities in the community?
74% 59%
Has the NDIS improved your ability/capacity to help your child develop and learn?
77%
Has the NDIS improved your health and wellbeing? 48% 41%
Table 1.21 to Table 1.24 reveal that the NDIS has helped more in some areas than others.
For participants from birth to before starting school, the highest percentages of positive
responses were for “Daily living”, where 93% thought that the NDIS had helped with their
child’s development and with access to specialist services. The lowest percentage was for
“Social, community and civic participation”, where 65% thought the NDIS had helped.
For participants from starting school to age 14, “Daily living” also had the highest
percentage, at 58%. “Lifelong learning” had the lowest percentage, at 39%. Percentages
were generally lower than for the youngest participant age group.
For the two adult age groups, percentages of positive responses were highest for the
“Choice and control” and “Daily activities” domains (61% to 75%), and lowest for “Work”
(17% and 20%).
For families/carers of participants aged 0 to 14, the highest percentage was for
“Development and learning”, where 77% thought that the NDIS had improved their capacity
to help their child develop and learn. The lowest percentage was for “Health and wellbeing”
(48%).
For families/carers of participants aged 15 and over, the highest percentage was for “Access
to services”, where 59% thought that the NDIS had helped. The lowest percentage was
again for “Health and wellbeing” (41%).

September 2017 | COAG Disability Reform Council Quarterly Report 33
1.9 Participant satisfaction
84% of participants rated their experience with the Agency planning process as either good
or very good in the current quarter. This is the same as the last quarter (84%). Since scheme
inception, 91% of participants rated their satisfaction with the Agency planning process as
either good or very good. This is consistent with the need identified by the NDIA to
undertake the Participant and Provider Pathway Review.
1.9.1 Background
The agency conducts participant surveys at a site level. Participants are asked to rate their
agreement with eight statements (see Table 1.25) as well as being asked to rate their overall
experience with the planning process. The overall Agency satisfaction rating is calculated as
an average of the overall experience ratings of each participant surveyed. Participants are
contacted by a member of the engagement team, after their plan is agreed with their
planner. Not all participants choose to complete and submit their survey, and the participant
responses remain anonymous to the NDIA.
As mentioned above, the NDIA is also currently reviewing the adequacy of the participant
and provider pathways. Part of this review is considering quality and compliance. In the
interim, data is presented on the participant’s experience in the planning process.
1.9.2 Quarter
Participant satisfaction continues to be high, but has dropped during transition, compared
with the experience during trial.
Figure 1.1 Proportion of participants describing experience with the Agency planning process as good or very good –
by quarter
For the first quarter of 2017-18, participant responses to statements about the planning
process suggest that satisfaction varies across the different aspects of the process. On the
whole, responses of ‘Agree’ and ‘Strongly Agree’ were high, ranging between 72% and 93%
across all questions about the planning process.
94% 96%98%
93%100%
95%
85% 84%88%
84% 84%
0%
10%
20%
30%
40%
50%
60%
70%
80%
90%
100%
Q3 14-15 Q4 14-15 Q1 15-16 Q2 15-16 Q3 15-16 Q4 15-16 Q1 16-17 Q2 16-17 Q3 16-17 Q4 16-17 Q1 17-18
Pro
po
rtio
n o
f P
art
icip
ants
%
Quarter

September 2017 | COAG Disability Reform Council Quarterly Report 34
Table 1.25 Proportion of Participants rating their level of agreement as strongly agree, agree, neutral, disagree or
strongly disagree in response to statements about the planning process
Strongly
Agree Agree Neutral Disagree
Strongly Disagree
The planner listened to me 53% 40% 4% 2% 1%
I had enough time to tell my story and say what support I need
50% 40% 4% 5% 1%
The planner knows what I can do well 31% 47% 13% 8% 2%
The planner had some good ideas for my plan 35% 45% 11% 7% 2%
I know what is in my plan 26% 46% 18% 9% 1%
The planner helped me think about my future 34% 46% 12% 6% 1%
I think my plan will make my life better 45% 34% 16% 3% 1%
The planning meeting went well 46% 43% 6% 4% 1%
1.10 Scheme assurance
Since inception there have been 406 AAT appeals (0.26% of all access decisions) and 8,664
complaints made (equivalent to 10.3% of all participants with an approved plan).
1.10.1 Background
This section summaries the following:
Complaints made to the Agency during the quarter
Scheduled and unscheduled plan reviews
Appeals to the AAT.
1.10.2 Complaints
At 30 September 2017, 8,664 complaints had been submitted to the Agency. 20 This number
is equivalent to 10.3% of all participants with an approved plan.
Table 1.26 Complaints by quarter21
Prior Quarters
(Transition only)
2017-18 Q1 Transition
Total
Complaints about Service Providers 257 146 403
Complaints about the Agency 4,755 2,587 7,342
Unclassified 691 228 919
Total 5,703 2,961 8,664
% of all participants with an approved plan
9.7% 11.6% 10.3%
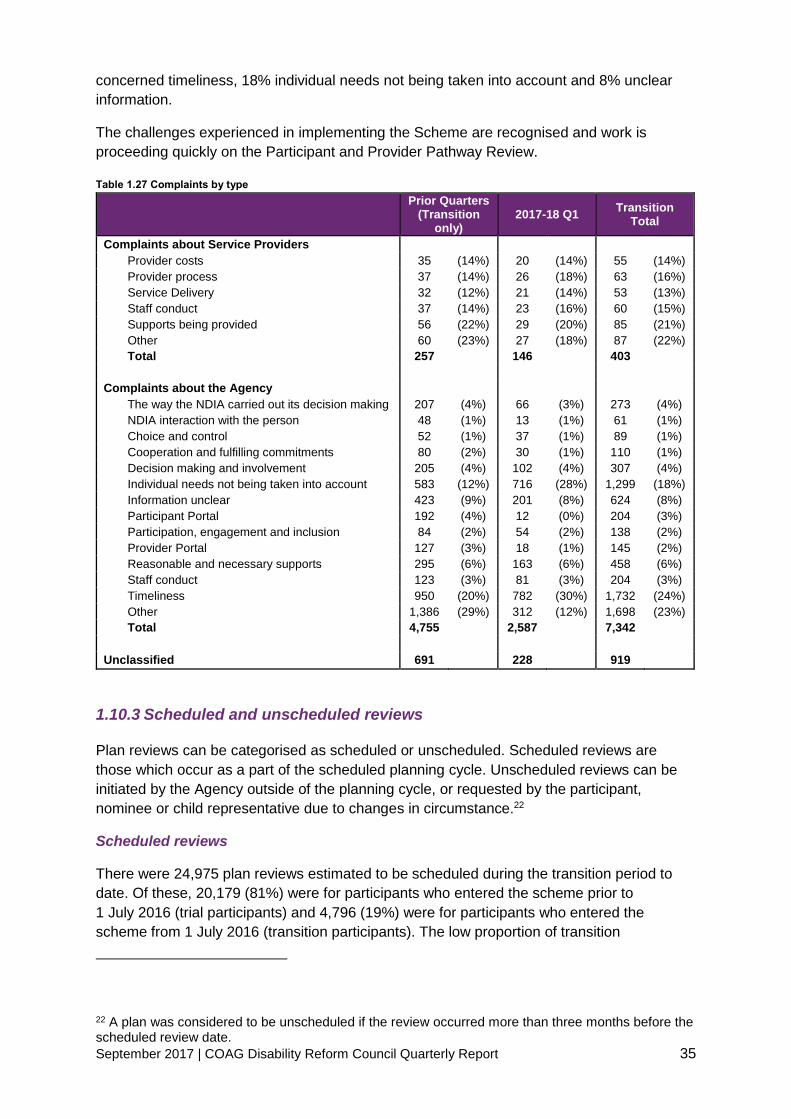
Table 1.27 shows the complaints by type. Of the 403 total complaints about service
providers since transition, 21% were about supports being provided, 16% provider process
and 15% staff. Of the 7,342 total complaints made about the Agency since transition, 24%
20 The complaints presented are complaints to the Agency and not complaints to community partners. 21 The number of participants used in the calculation considers the length of time the participants have been in the Scheme.
September 2017 | COAG Disability Reform Council Quarterly Report 35
concerned timeliness, 18% individual needs not being taken into account and 8% unclear
information.
The challenges experienced in implementing the Scheme are recognised and work is
proceeding quickly on the Participant and Provider Pathway Review.
Table 1.27 Complaints by type
Prior Quarters
(Transition only)
2017-18 Q1 Transition
Total
Complaints about Service Providers
Provider costs 35 (14%) 20 (14%) 55 (14%)
Provider process 37 (14%) 26 (18%) 63 (16%)
Service Delivery 32 (12%) 21 (14%) 53 (13%)
Staff conduct 37 (14%) 23 (16%) 60 (15%)
Supports being provided 56 (22%) 29 (20%) 85 (21%)
Other 60 (23%) 27 (18%) 87 (22%)
Total 257 146 403
Complaints about the Agency
The way the NDIA carried out its decision making 207 (4%) 66 (3%) 273 (4%)
NDIA interaction with the person 48 (1%) 13 (1%) 61 (1%)
Choice and control 52 (1%) 37 (1%) 89 (1%)
Cooperation and fulfilling commitments 80 (2%) 30 (1%) 110 (1%)
Decision making and involvement 205 (4%) 102 (4%) 307 (4%)
Individual needs not being taken into account 583 (12%) 716 (28%) 1,299 (18%)
Information unclear 423 (9%) 201 (8%) 624 (8%)
Participant Portal 192 (4%) 12 (0%) 204 (3%)
Participation, engagement and inclusion 84 (2%) 54 (2%) 138 (2%)
Provider Portal 127 (3%) 18 (1%) 145 (2%)
Reasonable and necessary supports 295 (6%) 163 (6%) 458 (6%)
Staff conduct 123 (3%) 81 (3%) 204 (3%)
Timeliness 950 (20%) 782 (30%) 1,732 (24%)
Other 1,386 (29%) 312 (12%) 1,698 (23%)
Total 4,755 2,587 7,342
Unclassified 691 228 919
1.10.3 Scheduled and unscheduled reviews
Plan reviews can be categorised as scheduled or unscheduled. Scheduled reviews are
those which occur as a part of the scheduled planning cycle. Unscheduled reviews can be
initiated by the Agency outside of the planning cycle, or requested by the participant,
nominee or child representative due to changes in circumstance.22
Scheduled reviews
There were 24,975 plan reviews estimated to be scheduled during the transition period to
date. Of these, 20,179 (81%) were for participants who entered the scheme prior to
1 July 2016 (trial participants) and 4,796 (19%) were for participants who entered the
scheme from 1 July 2016 (transition participants). The low proportion of transition
22 A plan was considered to be unscheduled if the review occurred more than three months before the scheduled review date.

September 2017 | COAG Disability Reform Council Quarterly Report 36
participants with estimated scheduled plan reviews in prior quarters is disproportionate as
there were few transition participants due for a scheduled plan review.
Table 1.28 Plan reviews conducted by quarter – excluding plans less than 30 days
Prior Quarters (Transition only)
2017-18 Q1 Transition Total
Total scheduled plan reviews 15,986 8,989 24,975
Trial participants 15,807 4,372 20,179
Transition participants 179 4,617 4,796
Unscheduled reviews
There were 25,471 plan reviews estimated to be unscheduled during the transition period to
date. Of these, 10,786 (42%) were for participants who entered the scheme prior to
1 July 2016 (trial participants) and 14,685 (58%) were for participants who entered the
scheme from 1 July 2016 (transition participants). One possible explanation for the high rate
of unscheduled reviews is the requirements for quotes for assistive technology and
supported independent living. However, this reason, along with others, are being
investigated through the participant and provider pathway review.
Table 1.29 Plan reviews conducted by quarter – excluding plans less than 30 days
Prior Quarters (Transition only)
2017-18 Q1 Transition Total
Total unscheduled plan reviews 20,927 4,544 25,471
Trial participants 9,618 1,168 10,786
Transition participants 11,309 3,376 14,685
The estimated rate of unscheduled plan reviews was 35.6% as at 30 June 2017 and has
since reduced to 30.3% as at 30 September 2017. This reduction was driven by the lower
rate of estimated unscheduled plan reviews of 17.9% in the first quarter of 2017-18.
Table 1.30 Estimated rate of unscheduled plan reviews – excluding plans less than 30 days23
Prior Quarters
(Transition only)
2017-18 Q1 Transition
Total
% unscheduled reviews 35.6% 17.9% 30.3%
1.10.4 Administrative Appeals Tribunal
To date there have been 406 appeals to the AAT relating to access and plans (0.3% of
access decisions). Of the 406 appeals, 127 have been regarding access issues, 258
regarding planning issues, and 18 regarding plan reviews (Table 1.31).
23 The number of participants used in the calculation considers the length of time the participants have been in the Scheme.

September 2017 | COAG Disability Reform Council Quarterly Report 37
Table 1.31 AAT cases by category and quarter
Prior
Quarters 2017-18 Q1 Total
AAT Cases 266 140 406
Access 68 59 127
Plan 181 77 258
Plan Review 17 1 18
Other 0 3 3
Of the 406 applications received, 170 were resolved before or at hearing at
30 September 2017. Sixty-four percent (64%) of the resolved applications confirmed the
Agency’s decision, 35% did not confirm the Agency’s decision, and 1% were pending.

September 2017 | COAG Disability Reform Council Quarterly Report 38
Part 2. Committed supports and
payments
Introduction
This section presents information on the amount committed in plans and payments to
service providers and participants.
This section also compares committed support with revenue received for each participant.
The revenue received for participants is outlined in the bilateral agreements.
Also included in this section is reporting on the assurance of payments.
Key points
The key points relating to committed supports and payments are as follows:
As at 30 September 2017, since 1 July 2013, $9.5 billion of support has been committed
to 112,785 participants who have had at least one approved plan.24 This includes
$1.6 billion of support in respect of trial, $3.2 billion in respect of 2016-17, $4.5 billion in
respect of 2017-18 and $0.3 billion for later years.25
$3.9 billion of support has been paid to providers and participants. Utilisation of
committed support is 64% in 2013-14, 74% in 2014-15, 75% in 2015-16 and 65% in
2016-17. Experience is still emerging in 2016-17 and 2017-18.
2.1 Committed supports
As at 30 September 2017, since 1 July 2013, $9.5 billion of support has been committed to
112,785 participants who have had at least one approved plan (excluding children supported
through the ECEI gateway). This includes $1.6 billion of support in respect of trial,
$3.2 billion in respect of 2016-17, $4.5 billion in respect of 2017-18 and $0.3 billion for later
years. On average, revenue received for the Scheme is below the amount of committed
support in plans. However, revenue is more in line with the amount of support being utilised
by participants, noting that not all support in plans is being utilised. The Scheme has been
within budget in its first four years, and remains on track to be within budget in 2017-18.
24 Children supported through the ECEI gateway are not included. 25 Note: The $0.3 billion committed in future years is due to current plans in place that have an end date past 30 June 2018 and the $4.5 billion in respect of 2017-18 only includes approved plans to date, and not all of these plans cover the full 2017-18 year.
PART 2
September 2017 | COAG Disability Reform Council Quarterly Report 39
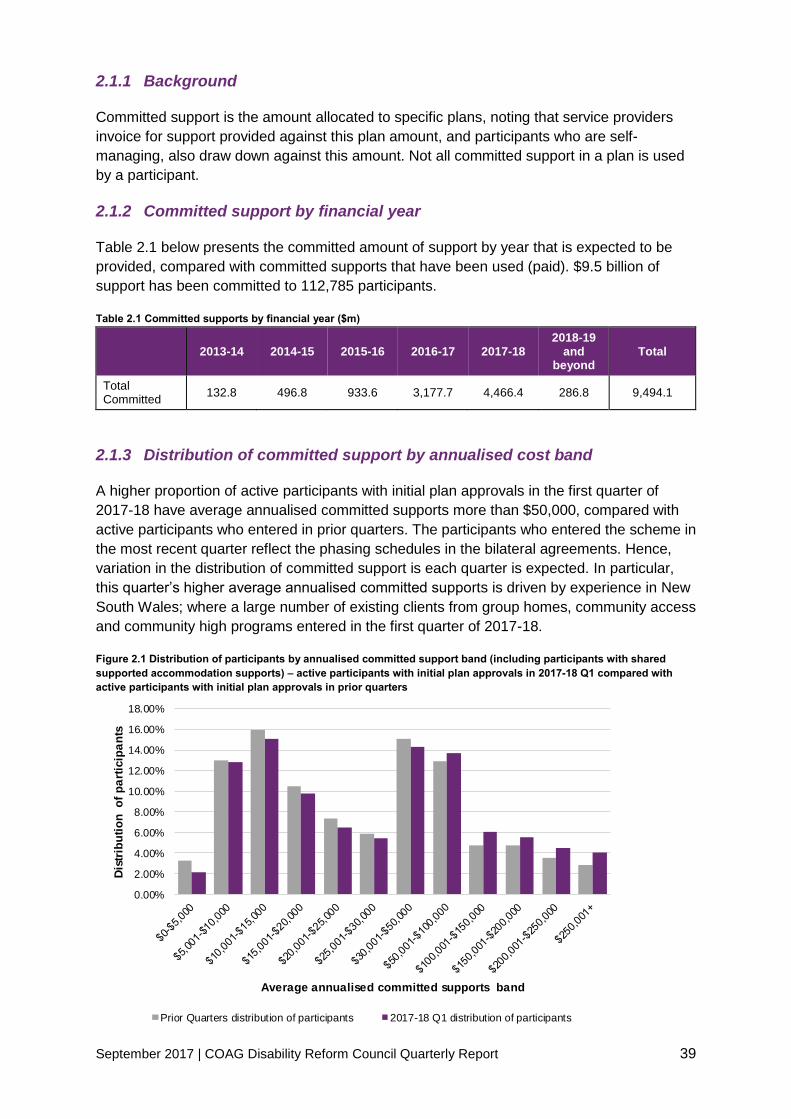
2.1.1 Background
Committed support is the amount allocated to specific plans, noting that service providers
invoice for support provided against this plan amount, and participants who are self-
managing, also draw down against this amount. Not all committed support in a plan is used
by a participant.
2.1.2 Committed support by financial year
Table 2.1 below presents the committed amount of support by year that is expected to be
provided, compared with committed supports that have been used (paid). $9.5 billion of
support has been committed to 112,785 participants.
Table 2.1 Committed supports by financial year ($m)
2013-14 2014-15 2015-16 2016-17 2017-18 2018-19
and beyond
Total
Total Committed
132.8 496.8 933.6 3,177.7 4,466.4 286.8 9,494.1
2.1.3 Distribution of committed support by annualised cost band
A higher proportion of active participants with initial plan approvals in the first quarter of
2017-18 have average annualised committed supports more than $50,000, compared with
active participants who entered in prior quarters. The participants who entered the scheme in
the most recent quarter reflect the phasing schedules in the bilateral agreements. Hence,
variation in the distribution of committed support is each quarter is expected. In particular,
this quarter’s higher average annualised committed supports is driven by experience in New
South Wales; where a large number of existing clients from group homes, community access
and community high programs entered in the first quarter of 2017-18.
Figure 2.1 Distribution of participants by annualised committed support band (including participants with shared
supported accommodation supports) – active participants with initial plan approvals in 2017-18 Q1 compared with
active participants with initial plan approvals in prior quarters
0.00%
2.00%
4.00%
6.00%
8.00%
10.00%
12.00%
14.00%
16.00%
18.00%
Dis
trib
uti
on
o
f p
art
icip
an
ts
Average annualised committed supports band
Prior Quarters distribution of participants 2017-18 Q1 distribution of participants

September 2017 | COAG Disability Reform Council Quarterly Report 40
Figure 2.2 Distribution of participants by annualised committed support band (excluding participants with shared
supported accommodation supports) – active participants with initial plan approvals in 2017-18 Q1 compared with
active participants with initial plan approvals in prior quarters
The remaining figures in this section compare the following:
Average annualised committed support in current plans for participants who entered the
Scheme prior to the commencement of Quarter 1 of 2017-18 (that is, prior to
1 July 2017).
Average annualised committed support in plans for participants who entered the Scheme
in Quarter 1 of 2017-18.
The amount of revenue received for participants in prior quarters and the current quarter.
Revenue is the amount received from both States/Territories and the Commonwealth
governments for participant supports as outlined in the bilateral agreements. This
includes both cash and in-kind amounts.
These comparisons are by age group, primary disability group, and level of function.
Revenue received under the bilateral agreements is not linked to age group, primary
disability group, and level of function, so it is not appropriate to make comparisons between
revenue and plan budgets in these charts.
2.1.4 Average annualised committed supports by age
For the purposes of interpreting Figure 2.3, Figure 2.4 and Figure 2.5, an example is
provided for children aged 0-6 years in Figure 2.3.
The average annualised committed support in the relevant participants’ latest plans is
compared between participants who entered the Scheme prior to the commencement of
Quarter 1 of 2017-18 ($16,600) and participants who entered the Scheme during Quarter 1
of 2017-18 ($13,800). A further comparison is made between the revenue received for
0.00%
2.00%
4.00%
6.00%
8.00%
10.00%
12.00%
14.00%
16.00%
18.00%
20.00%
Dis
trib
uti
on
o
f p
art
icip
an
ts
Average annualised committed supports band
Prior Quarters distribution of participants 2017-18 Q1 distribution of participants

September 2017 | COAG Disability Reform Council Quarterly Report 41
participants who entered the Scheme prior to the commencement of Quarter 1 of 2017-18
($27,900) and participants who entered the Scheme during Quarter 1 of 2017-18 ($25,900).
For active participants with initial plan approvals in the first quarter of 2017-18, average
annualised committed supports are higher for participants aged 19 years and over compared
with active participants with an initial plan approval in prior quarters.26
Actual average annualised committed supports are higher than revenue received for
participants aged 15 years and over and less than revenue received for 0-14 year olds. This
is consistent with participants who received an initial plan in prior quarters. The revenue
received is based on the bilateral agreements. Revenue is not based on a participant’s age
and hence differences between committed support and revenue are expected.
Figure 2.3 Average committed support by age group (including participants with shared supported accommodation
supports) – active participants with initial plan approvals in 2017-18 Q1 compared with active participants with initial
plan approvals in prior quarters
2.1.5 Average annualised committed supports by disability
Average annualised committed supports are higher in the first quarter of 2017-18 compared
with the active participants in prior quarters across a range of disability groups. Differences
in costs will likely reflect the varying phasing cohorts each quarter.
For active participants with autism related disorders, developmental delay, global
developmental delay and sensory/speech disabilities (including hearing and visual
impairment), actual average annualised committed supports were lower than average
revenue received. This is consistent with participants who have entered in prior quarters.
26 This is driven by experience in New South Wales; where a large number of existing clients from group homes, community access and community high programs entered in the first quarter of 2017-18.
$0
$20,000
$40,000
$60,000
$80,000
$100,000
$120,000
0 to 6 7 to 14 15 to 18 19 to 24 25 to 34 35 to 44 45 to 54 55 to 64 65+
Ave
rag
e a
nn
ua
lise
d c
om
mit
ted
su
pp
ort
s
Age group
2017-18 Q1 expected average annualised committed supports (based on revenue)
2017-18 Q1 actual average annualised committed supports
Prior Quarters expected average annualised committed supports (based on revenue)
Prior Quarters actual average annualised committed supports

September 2017 | COAG Disability Reform Council Quarterly Report 42
Revenue is not based on a participant’s disability and hence differences between committed
support and revenue are expected.
Figure 2.4 Average committed support by primary disability group (including participants with shared supported
accommodation supports) – active participants with initial plan approvals in 2017-18 Q1 compared with active
participants with initial plan approvals in prior quarters
2.1.6 Average annualised committed supports by level of function
Average annualised committed supports are lower in the first quarter of 2017-18 compared
with prior quarters for higher levels of function (i.e. 1 to 5). Actual average annualised
committed supports are higher than average revenue received for participants with moderate
to lower levels of function (9 to 14) and less than revenue received for participants with high
to moderate level of function (1 to 8). Revenue is not based on a participant’s level of
function and hence differences between committed support and revenue are expected.
$0 $20,000 $40,000 $60,000 $80,000 $100,000 $120,000 $140,000
ABI
Autism
Cerebral Palsy
Developmental Delay
Global Developmental Delay
Hearing Impairment
Intellectual Disability
Multiple Sclerosis
Psychosocial disability
Spinal Cord Injury
Stroke
Visual Impairment
Other Neurological
Other Physical
Other Sensory/Speech
Other
Average annualised committed supports
Pri
ma
ry d
isa
bil
ity
Prior Quarters actual average annualised committed supports
Prior Quarters expected average annualised committed supports (based on revenue)
2017-18 Q1 actual average annualised committed supports
2017-18 Q1 expected average annualised committed supports (based on revenue)

September 2017 | COAG Disability Reform Council Quarterly Report 43
Figure 2.5 Average committed support by level of function (including participants with shared supported
accommodation supports) – active participants with initial plan approvals in 2017-18 Q1 compared with active
participants with initial plan approvals in prior quarters27
2.2 Payments
$3.9 billion of support has been paid to providers and participants. Utilisation of committed
support is 64% in 2013-14, 74% in 2014-15, 75% in 2015-16 and 65% in 2016-17.
Experience is still emerging in 2016-17 and 2017-18. However, utilisation in 2016-17 is
trending at a lower level than 2014-15 and 2015-16.
2.2.1 Background
Payments made to providers and participants represent the amount of committed support
which is used. The proportion of the plan used is referred to as the utilisation of the plan.
2.2.2 Payments
Of the $9.5 billion that has been committed in participant plans, $3.9 billion has been paid to
date (Table 2.2). In particular, for supports provided in:
2013-14 – $85.3m has been paid
2014-15 – $370.1m has been paid
2015-16 – $700.3m has been paid
2016-17 – $2,061.7m has been paid
2017-18 – $717.4m has been paid.
27 Level of function 15 does not have sufficient data to show an average cost.
$0
$20,000
$40,000
$60,000
$80,000
$100,000
$120,000
$140,000
$160,000
$180,000
$200,000
1 2 3 4 5 6 7 8 9 10 11 12 13 14 15
Ave
rag
e a
nn
ua
lise
d c
ost
Level of function
2017-18 Q1 expected average annualised committed supports (based on revenue)
2017-18 Q1 actual average annualised committed supports
Prior Quarters expected average annualised committed supports (based on revenue)
Prior Quarters actual average annualised committed supports

September 2017 | COAG Disability Reform Council Quarterly Report 44
Table 2.2 Payments by financial year, compared to committed supports ($m)
2013-14 2014-15 2015-16 2016-17 2017-18 2018-19 and
beyond Total
Total Committed 132.8 496.8 933.6 3,177.7 4,466.4 286.8 9,494.1
Total Paid 85.3 370.1 700.3 2,061.7 717.4 - 3,934.8
% utilised to date 64% 74% 75% 65% - - 64%28
The utilisation of committed supports expected to be provided in 2013-14, 2014-15 and
2015-16 remains similar to the previous quarter. The utilisation rate for 2016-17 committed
supports has increased by six percentage points to 65%. Actuarial modelling indicates that
the 2016-17 percentage is likely to increase to approximately 67%. As there is a lag between
when support is provided and when it is paid, the 50% utilisation in 2017-18 will increase.
Figure 2.6 Utilisation of committed supports as at 30 June 2017 and 30 September 2017
2.2.3 Payment assurance compliance
As mentioned above, the NDIA is currently reviewing the participant and provider pathways.
This review will include the derivation of metrics to monitor payment assurance. Currently
the Agency tracks the rate of successful payments each day. On average, approximately
92% of payments are successful each day, with the volume of claims showing considerable
intraday variation.
28 Note: Only committed supports expected to be used to 30 September 2017 have been used to calculate the utilisation from 1 July 2013 to date.
EXPERIENCE IS STILL EMERGING
64%75%
76%
59%
64%74%
75%
65%
50%
$0m
$500m
$1,000m
$1,500m
$2,000m
$2,500m
$3,000m
$3,500m
2013-14 2014-15 2015-16 2016-17 2017-18YTD
Co
mm
itte
d s
up
po
rts
As at 30 Jun 2017: Paid As at 30 Jun 2017: Remaining
As at 30 Sep 2017: Paid As at 30 Sep 2017: Remaining

September 2017 | COAG Disability Reform Council Quarterly Report 45
Figure 2.7 Rate of successful payments per day during September 2017 29
29 The dip on one day is an outlier, caused by one service provider submitting the same request several times
September 2017 | COAG Disability Reform Council Quarterly Report 46
Part 3. Providers and markets
Introduction
This section contains information on registered service providers and the market, with key
provider and market indicators presented.
Key points
As at the current quarter (2017-18 Q1) there were 10,507 registered providers, which
represents a 21% increase in the number of registered service providers since the
previous quarter (2016-17 Q4).
41% of service providers are individual/sole traders.
Therapeutic supports has the highest number of registered service providers and has
seen a 20% increase in the number of registered providers since the previous quarter.
On average, participants are utilising the services of 1.55 providers.
52% of providers are not yet active.
The top 25% of active providers account for approximately 80-90% of the dollar value of
payments made by the NDIA for participant supports.
Providers and Markets
As at the current quarter (2017-18 Q1) there were 10,507 registered providers, which is a
21% increase in the number of registered service providers since the previous quarter
(2016-17 Q4).
3.1.1 Background
Provider registration operates under the following parameters:
A service provider is required to register and be approved by the NDIA in order to
provide supports to NDIS participants who do not self-manage. Quality and Safeguards
certification remains the responsibility of States/Territories during the transition to full
scheme and this certification is required for registration for some registration groups. A
participant who is self-managing can choose to use both registered and unregistered
providers.
Providers register with the NDIS by submitting a registration request, indicating the types
of support (registration groups) they are accredited to provide.
Providers are approved to deliver disability supports and services to participants of the
NDIS if they have at least one registration group approved.
PART 3

September 2017 | COAG Disability Reform Council Quarterly Report 47
Further, NDIS participants have the flexibility to choose the providers, and providers are paid
for disability supports and services provided to the participants.
3.1.2 Providers
As at the current quarter there were 10,507 registered providers – 4,324 individual/ sole
trader operated businesses, and 6,183 providers registered as a company/ organisation
(Table 3.1).
Table 3.1 Key national provider indicators by quarter30
Prior Quarters 2017-18 Q1 Total
Provider indicators
a) Registrations by profile
Individual/ sole trader 3,512 845 4,324
Company/ organisation 5,186 1,031 6,183
Total 8,698 1,876 10,507
b) Registration revoked 67
Table 3.2 below shows the number of providers by registration group. Therapeutic supports
has the highest number of registered service providers and has seen a 20% increase in the
number of registered providers since last quarter. The largest percentage increase in
approved providers was for the Specialised Disability Accommodation registration group in
the quarter, increasing from 255 to 372 (46%).
30 The total number of providers as at 30 September 2017 (10,507) is not the sum of the number of providers as at 31 June 2017 (8,698) and the providers registered in the first quarter of 2017-18 (1,876). This is due to 67 providers whose registration ended during the first quarter of 2017-18.

September 2017 | COAG Disability Reform Council Quarterly Report 48
Table 3.2 Cumulative number of approved providers by registration group31
Registration Group Prior
Quarters 2017-18
Q1 Total % Change
Assistance services
Accommodation / Tenancy Assistance 995 170 1,165 17%
Assistance Animals 15 6 21 40%
Assistance with daily life tasks in a group or shared living arrangement
788 79 867 10%
Assistance with travel/transport arrangements 1,797 407 2,204 23%
Daily Personal Activities 1,111 137 1,248 12%
Group and Centre Based Activities 1,016 120 1,136 12%
High Intensity Daily Personal Activities 1,041 104 1,145 10%
Household tasks 2,105 568 2,673 27%
Interpreting and translation 304 129 433 42%
Participation in community, social and civic activities 1,321 150 1,471 11%
Assistive Technology
Assistive equipment for recreation 715 165 880 23%
Assistive products for household tasks 857 227 1,084 26%
Assistance products for personal care and safety 1,293 257 1,550 20%
Communication and information equipment 670 133 803 20%
Customised Prosthetics 649 116 765 18%
Hearing Equipment 291 40 331 14%
Hearing Services 46 1 47 2%
Personal Mobility Equipment 1,100 238 1,338 22%
Specialised Hearing Services 174 2 176 1%
Vision Equipment 264 43 307 16%
Capacity Building Services
Assistance in coordinating or managing life stages, transitions and supports
1,147 141 1,288 12%
Behaviour Support 1,113 140 1,253 13%
Community nursing care for high needs 674 195 869 29%
Development of daily living and life skills 1,257 127 1,384 10%
Early Intervention supports for early childhood 1,690 285 1,975 17%
Exercise Physiology and Physical Wellbeing activities
996 206 1,202 21%
Innovative Community Participation 997 304 1,301 30%
Specialised Driving Training 397 38 435 10%
Therapeutic Supports 4,490 910 5,400 20%
Capital services
Home modification design and construction 1,121 265 1,386 24%
Specialised Disability Accommodation 255 117 372 46%
Vehicle Modifications 160 27 187 17%
Choice and control support services
Management of funding for supports in participants plan
847 156 1,003 18%
Support Coordination 981 196 1,177 20%
Employment and Education support services
Assistance to access and/or maintain employment and/or education
539 49 588 9%
Specialised Supported Employment 253 8 261 3%
Total approved providers 8,631 1,876 10,507 22%
31 The 67 providers whose registration ended during the first quarter of 2017-18 are not included in the 2016-17 Q4 and prior numbers in this table.

September 2017 | COAG Disability Reform Council Quarterly Report 49
3.1.3 Market
Table 3.3 below presents key national markets’ indicators by quarter:
On average, participants are supported by 1.55 providers.
52% of providers are not yet active. Many service providers have registered for the NDIS
in anticipation of the Scheme rolling-out across the country. This is consistent with the
previous report.
The top 25% of active providers account for approximately 80-90% of the dollar value of
payments made by the NDIA for participant supports. This is consistent with the previous
report.
Table 3.3 Key national markets indicators by quarter
Market indicators Prior Quarters 2017-18 Q1
a) Average number of providers per participant32 1.49 1.55
b) Number of providers delivering new supports 1,763 1,954
c) Change in the number of active/inactive providers:33
Active (%) 42% 43%
Not yet active (%) 54% 52%
Inactive (%) 4% 5%
d) Share of payments by support type - top 25%34
Daily Tasks/Shared Living (%) 83% 82%
Therapeutic Supports (%) 86% 87%
Participate Community (%) 83% 83%
Early Childhood Supports (%) 89% 88%
Assist Personal Activities (%) 84% 84%
32 In-kind payments are not included. However, if in-kind payments were included, the average number of providers per participant would be higher. 33 ‘Active’ service providers received a payment in the quarter; ‘not yet active’ service providers have never received a payment from the NDIA, and ‘inactive’ providers have received payments from the NDIA, but did not receive any in the quarter. 34 Note: Share of payments going to the top 25% of active providers relates to the top five registration groups by payment amount.

September 2017 | COAG Disability Reform Council Quarterly Report 50
Part 4. Information, linkages and
capacity building
The role of these community partners will be complemented by the implementation of the
ILC policy agreed by all governments. This policy can be summarised as a commitment to
connect people with disability, their families and carers to the wider community by:
1. Capacity Building - Making sure people with disability have the skills, confidence and information they need to get involved in the community
2. Community Inclusion - Building the capacity of the community to include people with disability.
Consistent with the ILC Policy, the focus of effort in ILC will be to ensure that people with
disability:
Have the information they need to make decisions and choices
Are connected to appropriate disability, community and mainstream supports
Have the skills and confidence to participate and contribute to the community and protect
their rights
Use and benefit from the same mainstream services as everyone else
Use and benefit from the same community activities as everyone else.
ILC Policy will be implemented through an open grant round in each jurisdiction as that
jurisdiction reaches full scheme. Detailed transition plans have been agreed with all
jurisdictions (excluding Western Australia) outlining funding and activities that will be
retained by the respective jurisdictions to build and align current activities to the future ILC
policy. These plans acknowledge the importance of commencing the capture of data on
demand for services, use of services and measurement of outcomes.
As the first jurisdiction to transition to ILC effective July 2017, the NDIA awarded nearly
$3 million in grant funding to deliver 22 ILC activities in the ACT. The NDIA has also funded
nearly $14 million for 39 activities in the inaugural ILC national readiness grants round to
raise community awareness and build the capacity of mainstream services to be more
inclusive.
PART 4

September 2017 | COAG Disability Reform Council Quarterly Report 51
Part 5. Mainstream interface
Introduction
This section provides information on the extent to which people with a disability are receiving
mainstream services.
Key points
Table 5.1 shows that 86% of active participants with an initial plan approved from
1 July 2016 accessed mainstream services. The proportion of participants entering in the
current quarter accessing mainstream services is 7% higher compared with prior quarters.
Participants are accessing mainstream services predominantly for health and wellbeing,
lifelong learning, and daily activities.
This information should be treated with caution as work is underway to ensure consistency in
the information collected on participants using mainstream services.
Further work is required to understand the level of engagement participants in the NDIS
have with mainstream services.
Table 5.1 Proportion of active participants with approved plans accessing mainstream supports35
Prior Quarters 2017-18 Q1 Total
Assistive technology 0% 1% 0%
Choice & Control 1% 2% 1%
Consumables 0% 0% 0%
Daily Activities 7% 8% 7%
Daily Equipment 0% 0% 0%
Employment 2% 2% 2%
Health & Wellbeing 47% 52% 49%
Home Living 1% 1% 1%
Housing & Home modifications 0% 0% 0%
Independence 2% 2% 2%
Lifelong Learning 14% 12% 13%
Relationships 2% 2% 2%
Social & Civic 2% 2% 2%
Transport 1% 1% 1%
Non-categorised 23% 26% 24%
Any mainstream service 83% 90% 86%
35 Trial participants (participants with initial plans approved prior to 1 July 2016) are not included.
PART 5

September 2017 | COAG Disability Reform Council Quarterly Report 52
Part 6. Financial sustainability
Introduction
The cost of the NDIS is dependent on the number of people who enter the Scheme, the
amount of reasonable and necessary support allocated in plans, how the amount in plans
changes over time, the utilisation of the support in each plan, and when participants exit the
Scheme.
The NDIS insurance approach allows pressures on the Scheme to be identified early and
management responses put in place to respond to these pressures. Specifically, data is
collected on participants (including the characteristics of the participants, costs and
outcomes), and this actual experience is compared with the baseline projection. This
actuarial monitoring occurs continuously and allows management to put in place strategies
as required.
Key points
Comparing actual and expected experience since 30 June 2016 highlights the following key
points relating to financial sustainability:
Higher than expected numbers of children entering the Scheme, both for 0-6 year olds
and 7-14 year olds. The prevalence of 0-6 year olds remained similar or decreased
during the transition period, but the prevalence of 7-14 year olds continued to increase.
Prevalence pressure has now emerged in some sites for 15-18 and 19-24 year olds.
Increasing package costs over and above the impacts of inflation and ageing, with
further deterioration of experience between 30 June 2016 and 31 March 2017. April to
August 2017 showed an improvement in inflation at plan review with the exception of
plan reviews in July 2017.
Higher than expected participants continuing to approach the Scheme, noting this trend
continued in several sites during the transition period, with some reduction in New South
Wales, Australian Capital Territory and Perth Hills (Western Australia).
Lower than expected participants exiting the Scheme, particularly for children. Strategies
to appropriately exit children from the Scheme who can be supported in mainstream
services is underway.
A mismatch between benchmark package costs and actual committed support, noting
that this improved since June 2016. One driver of the mismatch is participants with
moderate intellectual disability, who were not expected to receive sufficiently high levels
of funding for shared supported accommodation.
Specific strategies to address these pressures include:
PART 6
September 2017 | COAG Disability Reform Council Quarterly Report 53
o The introduction of the Early Childhood Early Intervention (ECEI) gateway which
aims to support children within mainstream services and the community, with only
the children requiring an individual support package gaining entry to the scheme.
o The introduction of typical support packages which establish a benchmark
amount of support for participants with specific characteristics.
o Increases risk-based quality assurance at access and plan approval.
o Increased staff training.
Currently, the best estimate of the longer-term cost of a well-managed NDIS is $22 billion a
year at full scheme. The Productivity Commission’s report on NDIS Costs, released on 19
October 2017, indicates that this remains appropriate and is consistent with the
Commission’s own 2011 modelling after accounting for wage and population growth.
Ongoing actuarial work is continuing to verify the longer-term cost of the NDIS based on
scheme experience to date.

September 2017 | COAG Disability Reform Council Quarterly Report 54
Appendix A: Outcomes Framework Population Benchmarks
Table A.1 Outcomes framework population benchmarks (participants 25 years and over)
Indicator Transition
period Comparator Source
% who choose what they do each day 61% 52% NCI 2014-15
% who had been given the opportunity to participate in a self-advocacy group meeting, conference, or event
29% 32% NCI 2014-15
% who want more choice and control in their life
67%
35% of people with disability don't think they have choice and control over their lives, compared to 21% of people
without disability
UK Fulfilling Potential 2014
% with no friends other than family or paid staff
25% 26% NCI 2014-15
% who are happy with their home 78% 90% (satisfied with where they
live - a further 5% said "in between")
NCI 2014-15
% who feel safe or very safe in their home
78%
83% (rarely afraid in their home - 13% said they were
sometimes afraid and 5% said they were afraid most of the
time)
NCI 2014-15
% who rate their health as good, very good or excellent
50% GSS 2014: 86%; NHS
2014/15: 87.1% GSS 2014, NHS
2014-15
% who did not have any difficulties accessing health services
68% 94.4% overall (88.6% for
people with disability, 97.2% for people without disability)
GSS 2014
% unable to do a course or training they wanted to do in the last 12 months
33%
28% (% of 18-64 who said there was either an
educational qualification or a work-related training course
they wanted to do or couldn't - 18% for education and 15% for
work)
GSS 2014
% who have a paid job 27% 77% (employment to
population ratio)
ABS Labour Force statistics
Aug 2017
% who volunteer 13% 18% (Census 2011), 31%
(GSS 2014) Census 2011,
GSS 2014
% who have been actively involved in a community, cultural or religious group in the last 12 months
36%
Overall 51.4% (Social groups), 32.9% (Community support groups), 13.5% (Civic and
political groups), being (49.1%,32.6%,13.7%) for people with disability and (52.5%,33.1%,13.3%) for people without disability
GSS 2014
Appendix A

September 2017 | COAG Disability Reform Council Quarterly Report 55
Appendix B
Appendix B: Comparison of plan approvals to bilateral estimates
Progress against bilateral estimates
The following tables compare plan approvals (including ECEI) against bilateral estimates.
The comparison is made on three different bases:
- Table B.1 compares plan approvals in 2017-18 against bilateral estimates as at 30
September 2017, split by Existing and New or Commonwealth participants.36
- Table B.2 compares plan approvals during transition (since 1 July 2016) against bilateral
estimates as at 30 September 2017, split by Existing and New or Commonwealth
participants.
- Table B.3 compares total plan approvals to date (since 1 July 2013) against bilateral
estimates, split by trial and transition.
The transition bilateral agreements have estimates split by State/Territory transitioning
participants and those who are new or from Commonwealth programs, with the exception of
Western Australia and ACT where there are no transition bilateral agreements in place. The
relative mix of State and New/Commonwealth participants estimated in the bilateral
agreements differs by jurisdiction.
Plan approvals relative to bilateral estimates have been relatively higher in 2017-18 than in
2016-17. For New South Wales, Queensland and Northern Territory, plan approvals for
existing State/Territory participants is relatively higher than for new and Commonwealth
participants. It should be noted that in Queensland, based on an agreement between
Ministers, an estimated 500 existing Queensland clients expected to transition during the
September 2017 quarter were actually prioritised for transition during the final quarter of
2016-17. This has had the effect of increasing potential plan approvals in 2016-17 and
reducing potential plan approvals in 2017-18.
Plan approvals across transition to date have been relatively higher for existing
State/Territory participants in Queensland, South Australia, Tasmania and the Northern
Territory. Plan approvals have exceeded bilateral estimates for existing State participants in
South Australia and Tasmania and for new and Commonwealth participants in New South
Wales, Victoria and South Australia.
36 ACT and WA are excluded from this table as there is no bilateral estimate for 2017-18

September 2017 | COAG Disability Reform Council Quarterly Report 56
Table B.1 Plan approvals in 2017-18 (including confirmed ECEI referrals) compared to estimates
2017-18 plans approved (incl.
ECEI) as at 30 September 2017 2017-18 Bilateral estimates as at 30
September 2017
Comparison for 2017-18 plan approvals (incl. ECEI) as at 30
September 2017 with 30 September 2017 bilateral
estimates
State/Territory Existing New/CW Total Existing New/CW Total Existing New/CW Total
NSW 10,982 4,185 15,167 11,044 6,108 17,152 99% 69% 88%
VIC 1,955 1,423 3,378 2,286 1,385 3,670 86% 103% 92%
QLD 1,352 981 2,333 1,900 1,598 3,498 71% 61% 67%
WA
SA 704 414 1,118 786 295 1,081 90% 140% 103%
TAS 245 426 671 264 346 610 93% 123% 110%
ACT
NT 143 16 159 173 180 353 83% 9% 45%
Total 15,381 7,445 22,826 16,452 9,912 26,364 93% 75% 87%
Table B.2 Plan approvals during transition (including confirmed ECEI referrals) compared to estimates
Transition to date plans approved
(incl. ECEI) as at 30 September 2017
Transition to date bilateral estimates as at 30 September 2017
Comparison for transition to date plan approvals (incl. ECEI) as at 30 September 2017 with 30
September 2017 bilateral estimates
State/Territory Existing New/CW Total Existing New/CW Total Existing New/CW Total
NSW 37,667 16,017 53,684 47,699 12,675 60,374 79% 126% 89%
VIC 8,941 5,281 14,222 13,839 4,747 18,586 65% 111% 77%
QLD 6,259 3,113 9,372 8,603 9,261 17,864 73% 34% 52%
WA 1,488 2,808 53%
SA 2,077 4,028 6,105 1,603 3,865 5,468 130% 104% 112%
TAS 766 987 1,753 716 1,011 1,727 107% 98% 101%
ACT 2,204 797 277%
NT 319 73 392 450 300 750 71% 24% 52%
Total 56,029 29,499 89,220 72,910 31,859 108,374 77% 93% 82%
Table B.3 Plan approvals to date (including confirmed ECEI referrals) compared to estimates
All plans approved (incl. ECEI) as
at 30 September 2017 Total Bilateral estimates as at 30
September 2017
Comparison for all plan approvals (incl. ECEI) as at 30
September 2017 with 30 September 2017 bilateral
estimates
State/Territory Trial Transition Total Trial Transition Total Trial Transition Total
NSW 9,609 53,684 63,293 12,111 60,374 72,485 79% 89% 87%
VIC 5,284 14,222 19,506 5,289 18,586 23,875 100% 77% 82%
QLD 361 9,372 9,733 600 17,864 18,464 60% 52% 53%
WA 2,494 1,488 3,982 2,493 2,808 5,301 100% 53% 75%
SA 7,118 6,105 13,223 8,500 5,468 13,968 84% 112% 95%
TAS 1,162 1,753 2,915 1,125 1,727 2,852 103% 101% 102%
ACT 4,098 2,203 6,301 4,278 797 5,075 96% 277% 124%
NT 155 392 547 149 750 899 104% 52% 61%
Total 30,281 89,220 119,501 34,545 108,374 142,919 88% 82% 84%

September 2017 | COAG Disability Reform Council Quarterly Report 57
Appendix C
Appendix C: New South Wales
The tables below replicate the tables in the main parts of this report for NSW only where the
data is available.
Participant Demographics
Table C.1 Plan approvals compared to estimates – NSW
Prior
Quarters 2017-18 Q1
Total excluding
ECEI
Total including
ECEI
Bilateral estimates
NSW 43,934 14,433 58,367 63,293 72,485
Table C.2 Quarterly intake split by plan and entry type since 1 July 2013 – NSW
Prior Quarters 2017-18 Q1 Total
Access decisions 66,752 10,389 77,141
Access Met 62,026 8,373 70,399
State 41,952 4,750 46,702
New 14,308 2,388 16,696
Commonwealth 5,766 1,235 7,001
Total Participant Plans 48,258 19,359 63,293
EI (s25) plans 6,794 1,383 8,177
PD (s24) plans 37,140 13,050 50,190
ECEI 4,324 4,926 4,926
Table C.3 Plan reviews conducted per quarter – NSW
Prior Quarters
(Transition only)
2017-18 Q1 Transition
Total
Total plan reviews 14,094 5,501 19,595
Early intervention plans 2,807 794 3,601
Permanent disability plans 11,287 4,707 15,994
Table C.4 Exits from the Scheme since 1 July 2013 as at 30 September 2017 – NSW
Exits
Total plan exits 595
Early Intervention plans 44
Permanent disability plans 551
Table C.5 Cumulative position by services previously received – NSW
Participant cohort Bilateral estimate
% of estimate
Awaiting a plan
State Commonwealth New ECEI Total
Trial 3,972 835 4,802 9,609 12,111 79%
End of 2016-17 28,750 3,364 11,820 4,324 48,258 55,333 87%
End of 2017-18 Q1 38,608 5,202 14,557 4,926 63,293 72,485 87% 7,320

September 2017 | COAG Disability Reform Council Quarterly Report 58
Table C.6 Cumulative position by entry into the Scheme – NSW
Participant cohort Bilateral estimate
% of estimate
Awaiting a plan
EI (s25) plan PD (s24) plan ECEI Total
Trial 3,510 6,099 9,609 12,111 79%
End of 2016-17 6,794 37,140 4,324 48,258 55,333 87%
End of 2017-18 Q1 8,177 50,190 4,926 63,293 72,485 87% 7,320
Table C.7 Active participants with approved plans per quarter by disability group - NSW37
Prior Quarters 2017-18 Q1 Total
Disability N % N % N %
Intellectual Disability 13,577 31% 4,969 34% 18,546 32%
Autism 11,589 27% 3,879 27% 15,468 27%
Psychosocial disability 2,881 7% 822 6% 3,703 6%
Cerebral Palsy 2,377 5% 910 6% 3,287 6%
Developmental Delay 1,466 3% 288 2% 1,754 3%
Other Neurological 2,153 5% 629 4% 2,782 5%
Other Physical 2,048 5% 505 4% 2,553 4%
Acquired Brain Injury 1,438 3% 566 4% 2,004 3%
Hearing Impairment 1,333 3% 442 3% 1,775 3%
Other Sensory/Speech 830 2% 128 1% 958 2%
Visual Impairment 1,206 3% 422 3% 1,628 3%
Multiple Sclerosis 919 2% 292 2% 1,211 2%
Global Developmental Delay 332 1% 101 1% 433 1%
Spinal Cord Injury 497 1% 298 2% 795 1%
Stroke 560 1% 140 1% 700 1%
Other 150 0% 25 0% 175 0%
Total 43,356 100% 14,416 100% 57,772 100%
Table C.8 Active participants with approved plan per quarter by level of function – NSW
Prior Quarters 2017-18 Q1 Total
Level of Function N % N % N %
1 (High Function) 187 0% 75 1% 262 0%
2 (High Function) 135 0% 30 0% 165 0%
3 (High Function) 2,496 6% 688 5% 3,184 6%
4 (High Function) 4,271 10% 1,121 8% 5,392 10%
5 (High Function) 6,906 17% 1,831 13% 8,737 16%
6 (Moderate Function) 6,008 14% 2,082 14% 8,090 14%
7 (Moderate Function) 3,759 9% 1,120 8% 4,879 9%
8 (Moderate Function) 3,050 7% 1,176 8% 4,226 8%
9 (Moderate Function) 248 1% 93 1% 341 1%
10 (Moderate Function) 3,997 10% 1,642 11% 5,639 10%
11 (Low Function) 2,250 5% 721 5% 2,971 5%
12 (Low Function) 5,246 13% 2,611 18% 7,857 14%
13 (Low Function) 1,923 5% 718 5% 2,641 5%
14 (Low Function) 1,136 3% 499 3% 1,635 3%
15 (Low Function) 16 0% 9 0% 25 0%
Missing 1,728 0 1,728
Total 43,356 100% 14,416 100% 57,772 100%
37 Table order based on national proportions (highest to lowest)

September 2017 | COAG Disability Reform Council Quarterly Report 59
Table C.9 Participant profile per quarter by Age group – NSW
Prior Quarters 2017-18 Q1 Total
Age Group N % N % N %
0 to 6 3,761 9% 1,254 9% 5,015 9%
7 to 14 10,697 25% 3,086 21% 13,783 24%
15 to 18 3,667 8% 1,156 8% 4,823 8%
19 to 24 5,056 12% 1,568 11% 6,624 11%
25 to 34 4,594 11% 1,756 12% 6,350 11%
35 to 44 4,162 10% 1,706 12% 5,868 10%
45 to 54 5,217 12% 1,929 13% 7,146 12%
55 to 64 5,386 12% 1,874 13% 7,260 13%
65+ 816 2% 87 1% 903 2%
Total 43,356 100% 14,416 100% 57,772 100%
Table C.10 Participant profile per quarter by Gender – NSW
Prior Quarters 2017-18 Q1 Total
Gender N % N % N %
Male 26,895 62% 9,038 63% 35,933 62%
Female 16,286 38% 5,300 37% 21,586 37%
Indeterminate 175 0% 78 1% 253 0%
Total 43,356 100% 14,416 100% 57,772 100%
Table C.11 Participant profile per quarter by Aboriginal and Torres Strait islander status – NSW
Prior Quarters 2017-18 Q1 Total
Participant profile N % N % N %
Aboriginal and Torres Strait Islander
2,057 4.7% 677 4.7% 2,734 4.7%
Not Aboriginal and Torres Strait Islander
39,491 91.1% 13,448 93.3% 52,939 91.6%
Not Stated 1,808 4.2% 291 2.0% 2,099 3.6%
Total 43,356 100% 14,416 100% 57,772 100%
Table C.12 Participant profile per quarter by culturally and linguistically diverse (CALD) status – NSW
Prior Quarters 2017-18 Q1 Total
Participant profile N % N % N %
CALD 3,085 7.1% 1,065 7.4% 4,150 7.2%
Not CALD 39,966 92.2% 13,347 92.6% 53,313 92.3%
Not Stated 305 0.7% 4 0.0% 309 0.5%
Total 43,356 100% 14,416 100% 57,772 100%
Table C.13 Participant profile per quarter by Young people in Residential aged care (YPIRAC) status – NSW
Prior Quarters 2017-18 Q1 Total
Participant profile N % N % N %
YPIRAC 381 0.9% 137 1.0% 518 0.9%
Not YPIRAC 42,975 99.1% 14,279 99.0% 57,254 99.1%
Total 43,356 100% 14,416 100% 57,772 100%
Table C.14 Distribution of active participants by method of Financial Plan Management and quarter of plan approval –
NSW
Prior Quarters
(Transition only) 2017-18 Q1 Total
Self-managed fully 7% 7% 7%
Self-managed partly 8% 8% 8%
Plan managed 9% 14% 11%
Agency managed 76% 71% 74%
Total 100% 100% 100%

September 2017 | COAG Disability Reform Council Quarterly Report 60
Table C.15 Distribution of active participants by support coordination and quarter of plan approval – NSW
Prior Quarters
(Transition only) 2017-18 Q1 Total
Support coordination 35% 38% 37%
Table C.16 Duration to plan activation by quarter of initial plan approval for active participants – NSW
2016-17 Q1 2016-17 Q2 2016-17 Q3 2016-17 Q4
Plan activation N % N % N % N %
Less than 30 days 2,804 64% 6,824 47% 3,756 52% 3,564 45%
30 to 59 days 460 10% 2,078 14% 1,087 15% 1,375 17%
60 to 89 days 226 5% 1,136 8% 516 7% 601 8%
Activated within 90 days
3,490 79% 10,038 69% 5,359 74% 5,540 70%
90 to 119 days 99 2% 798 5% 285 4% 204 3%
120 days and over 338 8% 1,353 9% 364 5% 48 1%
Activated between 90 and 180 days
437 10% 2,151 15% 649 9% 252 3%
No payments 480 11% 2,372 16% 1,216 17% 2,096 27%
Total plans approved 4,407 100% 14,561 100% 7,224 100% 7,888 100%
Table C.17 Number of questionnaires completed by SFOF version - NSW
Version Number of questionnaires
collected 2016-17 Number of questionnaires
collected Q1 2017-18 Number of questionnaires
Participant 0 to school 3,102 1,394 4,496
Participant school to 14 7,962 2,763 10,725
Participant 15 to 24 6,312 2,171 8,483
Participant 25 and over 15,739 6,297 22,036
Total Participant 33,115 12,625 45,740
Family 0 to 14 10,331 4,397 14,728
Family 15 to 24 1,496 1,111 2,607
Family 25 and over 468 1,141 1,609
Total Family 12,295 6,649 18,944
Total 45,410 19,274 64,684

September 2017 | COAG Disability Reform Council Quarterly Report 61
Table C.18 Selected key indicators for participants – Daily Living (DL) and Choice and Control (CC) - NSW
Indicator 0 to before
school School to 14
15 to 24 25 and over
DL
% with concerns in 6 or more of the areas: gross motor skills, fine motor skills, self-care, eating, social interaction, communication, cognitive development, sensory processing
69%
CC % who say their child is able to tell them what he/she wants
77%
DL % developing functional, learning and coping skills appropriate to their ability and circumstances
30%
DL % who say their child is becoming more independent
39%
CC % of children who have a genuine say in decisions about themselves
62%
CC % who are happy with the level of independence/control they have now
40%
CC % who choose who supports them 33% 51%
CC % who choose what they do each day 43% 60%
CC % who had been given the opportunity to participate in a self-advocacy group meeting
23% 29%
CC % who want more choice and control in their life
74% 68%
Table C.19 Selected key indicators for participants – Relationships (REL) and Social/ Community Participation (S/CP) -
NSW
Indicator 0 to before
school School to
14 15 to 24
25 and over
REL % of children who can make friends with people outside the family
66% 59%
S/CP % of children who participate in age appropriate community, cultural or religious activities
57%
REL % of children who spend time after school and on weekends with friends and/or in mainstream programs
32%
REL Of these, % who are welcomed or actively included
61% 78%
REL % of children who spend time with friends without an adult present
11%
REL % with no friends other than family or paid staff
27% 24%
S/CP % who have been actively involved in a community, cultural or religious group in the last 12 months
31% 36%

September 2017 | COAG Disability Reform Council Quarterly Report 62
Table C.20 Selected key indicators for participants – Lifelong Learning (LL), Work (WK), Home (HM) and Health and
Wellbeing (HW) – NSW
Indicator 0 to before
school School to
14 15 to 24
25 and over
LL % of children attending school in a mainstream class
46%
HM % who are happy with their home 83% 79%
HM % who feel safe or very safe in their home
87% 79%
HW % who rate their health as good, very good or excellent
69% 51%
HW % who did not have any difficulties accessing health services
68% 68%
LL % who currently attend or previously attended school in a mainstream class
25%
LL % who participate in education, training or skill development
13%
LL Of those who participate, % who do so in mainstream settings
50%
LL % unable to do a course or training they wanted to do in the last 12 months
32%
WK % who have a paid job 18% 29%
WK % who volunteer 12% 12%

September 2017 | COAG Disability Reform Council Quarterly Report 63
Table C.21 Selected key indicators for families/ carers of participants – NSW
Indicator 0 to 14 15 to 24 25 and over
% receiving Carer Payment 28% 27% 16%
% receiving Carer Allowance 60% 49% 22%
% working in a paid job 46% 46% 25%
Of those in a paid job, % in permanent employment
73% 73% 76%
Of those in a paid job, % working 15 hours or more
78% 85% 84%
% who say they (and their partner) are able to work as much as they want
39% 46% 55%
Of those unable to work as much as they want, % who say the situation of their child/family member with disability is a barrier to working more
89% 90% 83%
Of those unable to work as much as they want, % who say insufficient flexibility of jobs is a barrier to working more
42% 36% 27%
% able to advocate for their child/family member
78% 71% 68%
% who have friends and family they see as often as they like
43% 44% 37%
% who feel very confident or somewhat confident in supporting their child's development
85%
% who know what their family can do to enable their family member with disability to become as independent as possible
44%
% who feel in control selecting services 40% 47%
% who have made plans (or begun to make plans) for when they are no longer able to care for their family member with disability
38%
% who rate their health as good, very good or excellent
71% 63% 60%
Table C.22 Results for “Has the NDIS helped?” questions answered at review, for SFOF version ‘Participant 0 to
school’ (n=92) – NSW
Question Yes
DL Has the NDIS improved your child's development? 98%
DL Has the NDIS improved your child's access to specialist services? 99%
CC Has the NDIS helped increase your child's ability to communicate what they want?
94%
REL Has the NDIS improved how your child fits into family life? 76%
S/CP Has the NDIS improved how your child fits into community life? 65%

September 2017 | COAG Disability Reform Council Quarterly Report 64
Table C.23 Results for “Has the NDIS helped?” questions answered at review, for SFOF version ‘Participant school to
14’ (n=145) – NSW
Question Yes
DL Has the NDIS helped your child to become more independent? 58%
LL Has the NDIS improved your child's access to education? 41%
REL Has the NDIS improved your child's relationships with family and friends?
46%
S/CP Has the NDIS improved your child's social and recreational life? 44%
Table C.24 Results for “Has the NDIS helped?” questions answered at review, for SFOF versions ‘Participant 15 to 24’
(n=195) and ‘Participant 25 and over’ (n=951) – NSW
Question 15 to 24 % Yes
25+ % Yes
CC Has the NDIS helped you have more choices and more control over your life?
67% 69%
DL Has the NDIS helped you with daily living activities? 66% 76%
REL Has the NDIS helped you to meet more people? 54% 53%
HM Has your involvement with the NDIS helped you to choose a home that's right for you?
31% 41%
HW Has your involvement with the NDIS improved your health and wellbeing?
46% 58%
LL Had your involvement with the NDIS helped you to learn things you want to learn or to take courses you want to take?
42% 36%
WK Has your involvement with the NDIS helped you find a job that's right for you?
17% 22%
S/CP Has the NDIS helped you be more involved? 55% 66%
Table C.25 Results for “Has the NDIS helped?” questions answered at review, for SFOF version ‘Family 0 to 14’
(n=207); and for SFOF versions ‘Family 15 to 24’ and ‘Family 25 and over’ combined (n=46) – NSW
Question 0 to 14 % Yes
15+ % Yes
Has the NDIS improved your capacity to advocate (stand up) for your child? / Has the NDIS helped you to know your rights and advocate effectively?
55% 41%
Has the NDIS improved the level of support for your family? 67% 52%
Has the NDIS improved your access to services, programs and activities in the community?
72% 58%
Has the NDIS improved your ability/capacity to help your child develop and learn?
75%
Has the NDIS improved your health and wellbeing? 44% 28%

September 2017 | COAG Disability Reform Council Quarterly Report 65
Figure C.1 Proportion of participants describing satisfaction with the Agency planning process as good or very good –
by quarter (NSW)
Table C.26 Proportion of Participants rating their level of agreement as strongly agree, agree, neutral, disagree or
strongly disagree in response to statements about the planning process – NSW
NSW Very good
Good Neutral Poor Very Poor
Overall, how would you rate your experience with the planning process today?
51% 31% 13% 5% 0%
1. The planner listened to me 52% 39% 6% 2% 1%
2. I had enough time to tell my story and say what support I need
51% 38% 7% 4% 1%
3. The planner knows what I can do well 30% 47% 16% 7% 1%
4. The planner had some good ideas for my plan 34% 42% 14% 9% 2%
5. I know what is in my plan 22% 43% 27% 8% 1%
6. The planner helped me think about my future 35% 48% 12% 4% 1%
7. I think my plan will make my life better 47% 29% 20% 3% 1%
8. The planning meeting went well 46% 44% 6% 3% 1%
Table C.27 Plan reviews conducted by quarter – excluding plans less than 30 days – NSW
Prior Quarters (Transition only)
2017-18 Q1 Transition Total
Total scheduled plan reviews 4,019 3,473 7,492
Trial participants 3,958 1,100 5,058
Transition participants 61 2,373 2,434
Table C.28 Plan reviews conducted by quarter – excluding plans less than 30 days – NSW
Prior Quarters (Transition only)
2017-18 Q1 Transition Total
Total unscheduled plan reviews 10,075 2,028 12,103
Trial participants 2,676 309 2,985
Transition participants 7,399 1,719 9,118
94% 96% 100% 100% 100%94%
88%91% 91%
80%82%
0%
10%
20%
30%
40%
50%
60%
70%
80%
90%
100%
Q3 14-15 Q4 14-15 Q1 15-16 Q2 15-16 Q3 15-16 Q4 15-16 Q1 16-17 Q2 16-17 Q3 16-17 Q4 16-17 Q1 17-18
Pro
po
rtio
n o
f P
art
icip
ants
%
Quarter

September 2017 | COAG Disability Reform Council Quarterly Report 66
Table C.29 Estimated rate of unscheduled plan reviews – excluding plans less than 30 days – NSW38
Prior Quarters
(Transition only)
2017-18 Q1 Transition
Total
% unscheduled reviews 38.1% 15.9% 30.9%
Table C.30 AAT Cases by category – NSW
Prior
Quarters 2017-18 Q1 Total
AAT Cases 117 76 193
Access 24 33 57
Plan 83 39 122
Plan Review 10 1 11
Other 0 3 3
Committed supports and payments
Table C.31 Committed supports by financial year ($m) - NSW
2013-14 2014-15 2015-16 2016-17 2017-18 2018-19
and beyond
Total
Total Committed
50.6 184.4 347.3 1,737.0 2,558.4 175.2 5,052.9
38 The number of participants used in the calculation considers the length of time the participants have been in the Scheme.

September 2017 | COAG Disability Reform Council Quarterly Report 67
Figure C.2 Distribution of participants by annualised committed support band (including participants with shared
supported accommodation supports) – active participants with initial plan approvals 2017-18 Q1 compared with active
participants with initial plan approvals in prior quarters (NSW)
0.00%
2.00%
4.00%
6.00%
8.00%
10.00%
12.00%
14.00%
16.00%
18.00%D
istr
ibu
tio
n o
f p
art
icip
an
ts
Average annualised committed supports band
Prior Quarters distribution of participants 2017-18 Q1 distribution of participants

September 2017 | COAG Disability Reform Council Quarterly Report 68
Figure C.3 Distribution of participants by annualised committed support band (excluding participants with shared
supported accommodation supports) – active participants with initial plan approvals 2017-18 Q1 compared with active
participants with initial plan approvals in prior quarters (NSW)
Figure C.4 Average committed support by age group (including participants with shared supported accommodation
supports) – active participants with initial plan approvals 2017-18 Q1 compared with active participants with initial
plan approvals in prior quarters (NSW)
0.00%
2.00%
4.00%
6.00%
8.00%
10.00%
12.00%
14.00%
16.00%
18.00%
20.00%
Dis
trib
uti
on
o
f p
art
icip
an
ts
Average annualised committed supports band
Prior Quarters distribution of participants 2017-18 Q1 distribution of participants
$0
$20,000
$40,000
$60,000
$80,000
$100,000
$120,000
0 to 6 7 to 14 15 to 18 19 to 24 25 to 34 35 to 44 45 to 54 55 to 64 65+
Av
era
ge
an
nu
ali
se
d c
om
mit
ted
su
pp
ort
s
Age group
2017-18 Q1 expected average annualised committed supports (based on revenue)
2017-18 Q1 actual average annualised committed supports
Prior Quarters expected average annualised committed supports (based on revenue)
Prior Quarters actual average annualised committed supports

September 2017 | COAG Disability Reform Council Quarterly Report 69
Figure C.5 Average committed support by primary disability group (including participants with shared supported
accommodation supports) – active participants with initial plan approvals 2017-18 Q1 compared with active
participants with initial plan approvals in prior quarters (NSW)
$0 $20,000 $40,000 $60,000 $80,000 $100,000 $120,000 $140,000
ABI
Autism
Cerebral Palsy
Developmental Delay
Global Developmental Delay
Hearing Impairment
Intellectual Disability
Multiple Sclerosis
Psychosocial disability
Spinal Cord Injury
Stroke
Visual Impairment
Other Neurological
Other Physical
Other Sensory/Speech
Other
Average annualised committed supports
Pri
ma
ry d
isa
bil
ity
Prior Quarters actual average annualised committed supports
Prior Quarters expected average annualised committed supports (based on revenue)
2017-18 Q1 actual average annualised committed supports
2017-18 Q1 expected average annualised committed supports (based on revenue)

September 2017 | COAG Disability Reform Council Quarterly Report 70
Figure C.6 Average committed support by level of function (including participants with shared supported
accommodation supports) – active participants with initial plan approvals 2017-18 Q1 compared with active
participants with initial plan approvals in prior quarters39 (NSW)
Table C.32 Payments by financial year, compared to committed supports ($m) – NSW
2013-14 2014-15 2015-16 2016-17 2017-18 2018-19 and
beyond Total
Total Committed 50.6 184.4 347.3 1,737.0 2,558.4 175.2 5,052.9
Total Paid 37.2 141.1 255.7 1,130.0 418.4 - 1,982.4
% utilised to date 73% 76% 74% 65% - - 63%40
Figure C.7 Utilisation of committed supports as at 30 June 2017 and 30 September 2017 (NSW)
39 Average annualised committed supports are not shown where there is insufficient data in the group. Level of function 15 does not have sufficient data to show an average cost. 40 Note: Only committed supports expected to be used to 30 September 2017 have been used to calculate the utilisation from 1 July 2013 to date.
$0
$20,000
$40,000
$60,000
$80,000
$100,000
$120,000
$140,000
$160,000
$180,000
$200,000
1 2 3 4 5 6 7 8 9 10 11 12 13 14 15
Av
era
ge
an
nu
ali
se
d c
om
mit
ted
su
pp
ort
s
Level of function
2017-18 Q1 expected average annualised committed supports (based on revenue)
2017-18 Q1 actual average annualised committed supports
Prior Quarters expected average annualised committed supports (based on revenue)
Prior Quarters actual average annualised committed supports
73% 73%77% 76%
74% 74%
60%65%
51%
$0m
$200m
$400m
$600m
$800m
$1,000m
$1,200m
$1,400m
$1,600m
$1,800m
$2,000m
2013-14 2014-15 2015-16 2016-17 2017-18YTD
Co
mm
itte
d s
up
po
rts
As at 30 Jun 2017: Paid As at 30 Jun 2017: Remaining
As at 30 Sep 2017: Paid As at 30 Sep 2017: Remaining
EXPERIENCE IS STILL EMERGING

September 2017 | COAG Disability Reform Council Quarterly Report 71
Providers and markets
Table C.33 Key provider indicators by quarter - NSW
Prior Quarters 2017-18 Q1 Total
Provider indicators
a) Registrations by profile
Individual/ sole trader 1,733 457 2,170
Company/ organisation 2,568 529 3,081
Total 4,301 986 5,251
b) Registration revoked 36

September 2017 | COAG Disability Reform Council Quarterly Report 72
Table C.34 Number of approved providers by registration group - NSW41
Registration Group Prior
Quarters 2017-18
Q1 Total % Change
Assistance services
Accommodation / Tenancy Assistance 487 81 568 17%
Assistance Animals 6 3 9 50%
Assistance with daily life tasks in a group or shared living arrangement
335 29 364 9%
Assistance with travel/transport arrangements 854 177 1,031 21%
Daily Personal Activities 493 41 534 8%
Group and Centre Based Activities 441 34 475 8%
High Intensity Daily Personal Activities 446 32 478 7%
Household tasks 1,059 281 1,340 27%
Interpreting and translation 140 44 184 31%
Participation in community, social and civic activities 565 49 614 9%
Assistive Technology
Assistive equipment for recreation 388 94 482 24%
Assistive products for household tasks 437 119 556 27%
Assistance products for personal care and safety 659 146 805 22%
Communication and information equipment 361 70 431 19%
Customised Prosthetics 325 53 378 16%
Hearing Equipment 133 25 158 19%
Hearing Services 16 1 17 6%
Personal Mobility Equipment 577 137 714 24%
Specialised Hearing Services 69 1 70 1%
Vision Equipment 144 22 166 15%
Capacity Building Services
Assistance in coordinating or managing life stages, transitions and supports
472 51 523 11%
Behaviour Support 386 19 405 5%
Community nursing care for high needs 302 61 363 20%
Development of daily living and life skills 545 43 588 8%
Early Intervention supports for early childhood 708 142 850 20%
Exercise Physiology and Physical Wellbeing activities
534 105 639 20%
Innovative Community Participation 479 129 608 27%
Specialised Driving Training 191 20 211 10%
Therapeutic Supports 2,192 450 2,642 21%
Capital services
Home modification design and construction 561 129 690 23%
Specialised Disability Accommodation 101 67 168 66%
Vehicle Modifications 95 10 105 11%
Choice and control support services
Management of funding for supports in participants plan
530 103 633 19%
Support Coordination 409 56 465 14%
Employment and Education support services
Assistance to access and/or maintain employment and/or education
266 26 292 10%
Specialised Supported Employment 109 3 112 3%
Total approved providers 4,265 986 5,251 23%
41 The 36 providers whose registration ended during the first quarter of 2017-18 are not included in the 2016-17 Q4 and prior numbers in this table.

September 2017 | COAG Disability Reform Council Quarterly Report 73
Table C.35 Key markets indicators by quarter - NSW
Market indicators Prior Quarters 2017-18 Q1
a) Average number of providers per participant 1.55 1.63
b) Number of providers delivering new supports 990 1,105
c) Change in the number of active/inactive providers:
Active (%) 45% 47%
Not yet active (%) 52% 48%
Inactive (%) 3% 4%
d) Share of payments - top 25%
Daily Tasks/Shared Living (%) 83% 81%
Therapeutic Supports (%) 85% 86%
Participate Community (%) 86% 86%
Early Childhood Supports (%) 90% 90%
Assist Personal Activities (%) 85% 86%
Table C.36 Proportion of active participants with approved plans accessing mainstream supports - NSW
Prior Quarters 2017-18 Q1 Total
Assistive technology 0% 1% 0%
Choice & Control 1% 2% 1%
Consumables 0% 0% 0%
Daily Activities 5% 6% 5%
Daily Equipment 0% 0% 0%
Employment 2% 2% 2%
Health & Wellbeing 56% 57% 56%
Home Living 1% 1% 1%
Housing & Home modifications 0% 0% 0%
Independence 1% 2% 2%
Lifelong Learning 10% 9% 10%
Relationships 1% 2% 2%
Social & Civic 1% 2% 2%
Transport 1% 0% 1%
Non-categorised 20% 26% 22%
Any mainstream service 84% 90% 87%

September 2017 | COAG Disability Reform Council Quarterly Report 74
Appendix D
Appendix D: Victoria
The tables below replicate the tables in the main parts of this report for VIC only where the
data is available.
Participant Demographics
Table D.1 Plan approvals compared to estimates - VIC
Prior
Quarters 2017-18 Q1
Total excluding
ECEI
Total including
ECEI
Bilateral estimates
VIC 15,433 3,393 18,826 19,506 23,875
Table D.2 Quarterly intake split by plan and entry type since 1 July 2013 – VIC
Prior Quarters 2017-18 Q1 Total
Access decisions 23,861 6,720 30,581
Access Met 22,503 6,146 28,649
State 14,736 4,889 19,625
New 5,610 768 6,378
Commonwealth 2,157 489 2,646
Total Participant Plans 16,489 4,073 19,506
EI (s25) plans 2,701 482 3,183
PD (s24) plans 12,732 2,911 15,643
ECEI 1,056 680 680
Table D.3 Plan reviews conducted per quarter – VIC
Prior Quarters
(Transition only)
2017-18 Q1 Transition
Total
Total plan reviews 6,259 2,347 8,606
Early intervention plans 1,415 552 1,967
Permanent disability plans 4,844 1,795 6,639
Table D.4 Exits from the Scheme since 1 July 2013 as at 30 September 2017 – VIC
Exits
Total plan exits 291
Early Intervention plans 24
Permanent disability plans 267
Table D.5 Cumulative position by services previously received – VIC
Participant cohort Bilateral estimate
% of estimate
Awaiting a plan
State Commonwealth New ECEI Total
Trial 2,679 381 2,224 5,284 5,289 100%
End of 2016-17 9,626 1,214 4,593 1,056 16,489 20,205 82%
End of 2017-18 Q1 11,544 1,798 5,484 680 19,506 23,875 82% 9,165
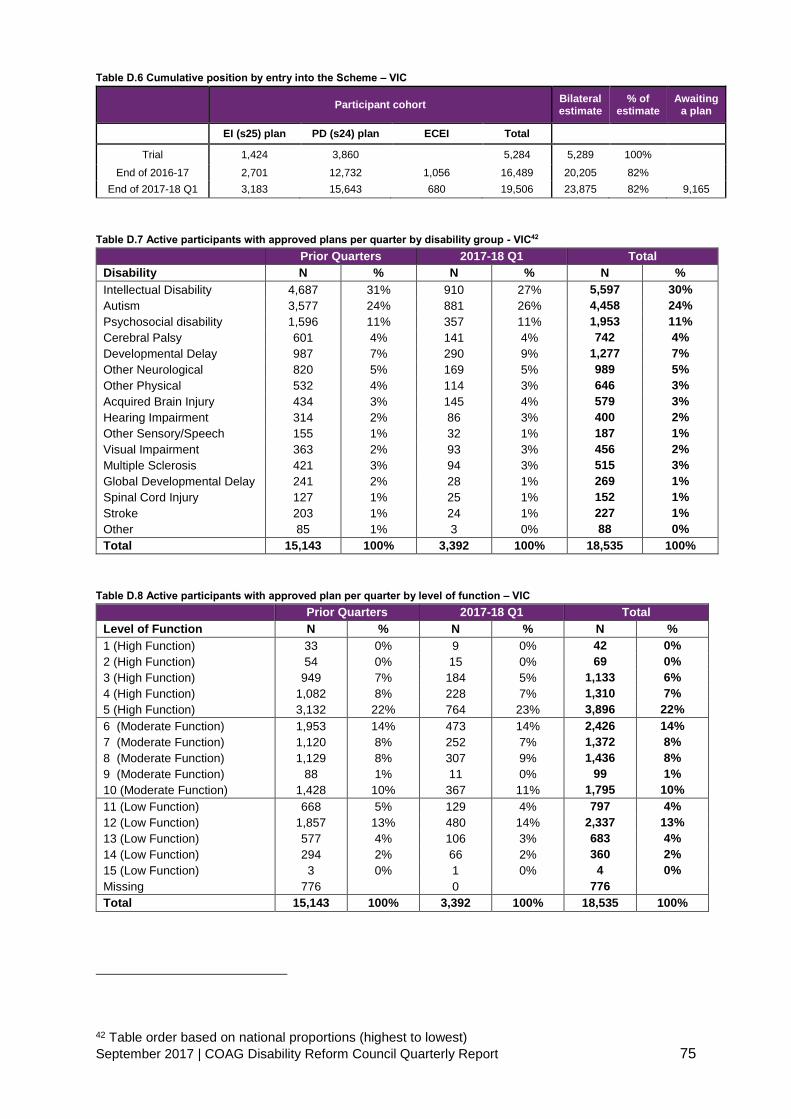
September 2017 | COAG Disability Reform Council Quarterly Report 75
Table D.6 Cumulative position by entry into the Scheme – VIC
Participant cohort Bilateral estimate
% of estimate
Awaiting a plan
EI (s25) plan PD (s24) plan ECEI Total
Trial 1,424 3,860 5,284 5,289 100%
End of 2016-17 2,701 12,732 1,056 16,489 20,205 82%
End of 2017-18 Q1 3,183 15,643 680 19,506 23,875 82% 9,165
Table D.7 Active participants with approved plans per quarter by disability group - VIC42
Prior Quarters 2017-18 Q1 Total
Disability N % N % N %
Intellectual Disability 4,687 31% 910 27% 5,597 30%
Autism 3,577 24% 881 26% 4,458 24%
Psychosocial disability 1,596 11% 357 11% 1,953 11%
Cerebral Palsy 601 4% 141 4% 742 4%
Developmental Delay 987 7% 290 9% 1,277 7%
Other Neurological 820 5% 169 5% 989 5%
Other Physical 532 4% 114 3% 646 3%
Acquired Brain Injury 434 3% 145 4% 579 3%
Hearing Impairment 314 2% 86 3% 400 2%
Other Sensory/Speech 155 1% 32 1% 187 1%
Visual Impairment 363 2% 93 3% 456 2%
Multiple Sclerosis 421 3% 94 3% 515 3%
Global Developmental Delay 241 2% 28 1% 269 1%
Spinal Cord Injury 127 1% 25 1% 152 1%
Stroke 203 1% 24 1% 227 1%
Other 85 1% 3 0% 88 0%
Total 15,143 100% 3,392 100% 18,535 100%
Table D.8 Active participants with approved plan per quarter by level of function – VIC
Prior Quarters 2017-18 Q1 Total
Level of Function N % N % N %
1 (High Function) 33 0% 9 0% 42 0%
2 (High Function) 54 0% 15 0% 69 0%
3 (High Function) 949 7% 184 5% 1,133 6%
4 (High Function) 1,082 8% 228 7% 1,310 7%
5 (High Function) 3,132 22% 764 23% 3,896 22%
6 (Moderate Function) 1,953 14% 473 14% 2,426 14%
7 (Moderate Function) 1,120 8% 252 7% 1,372 8%
8 (Moderate Function) 1,129 8% 307 9% 1,436 8%
9 (Moderate Function) 88 1% 11 0% 99 1%
10 (Moderate Function) 1,428 10% 367 11% 1,795 10%
11 (Low Function) 668 5% 129 4% 797 4%
12 (Low Function) 1,857 13% 480 14% 2,337 13%
13 (Low Function) 577 4% 106 3% 683 4%
14 (Low Function) 294 2% 66 2% 360 2%
15 (Low Function) 3 0% 1 0% 4 0%
Missing 776 0 776
Total 15,143 100% 3,392 100% 18,535 100%
42 Table order based on national proportions (highest to lowest)

September 2017 | COAG Disability Reform Council Quarterly Report 76
Table D.9 Participant profile per quarter by Age group – VIC
Prior Quarters 2017-18 Q1 Total
Age Group N % N % N %
0 to 6 2,237 15% 691 20% 2,928 16%
7 to 14 3,254 21% 615 18% 3,869 21%
15 to 18 1,052 7% 225 7% 1,277 7%
19 to 24 1,239 8% 251 7% 1,490 8%
25 to 34 1,558 10% 324 10% 1,882 10%
35 to 44 1,626 11% 375 11% 2,001 11%
45 to 54 1,978 13% 432 13% 2,410 13%
55 to 64 1,851 12% 452 13% 2,303 12%
65+ 348 2% 27 1% 375 2%
Total 15,143 100% 3,392 100% 18,535 100%
Table D.10 Participant profile per quarter by Gender – VIC
Prior Quarters 2017-18 Q1 Total
Gender N % N % N %
Male 9,210 61% 2,102 62% 11,312 61%
Female 5,873 39% 1,271 37% 7,144 39%
Indeterminate 60 0% 19 1% 79 0%
Total 15,143 100% 3,392 100% 18,535 100%
Table D.11 Participant profile per quarter by Aboriginal and Torres Strait islander status – VIC
Prior Quarters 2017-18 Q1 Total
Participant profile N % N % N %
Aboriginal and Torres Strait Islander
317 2.1% 81 2.4% 398 2.1%
Not Aboriginal and Torres Strait Islander
13,825 91.3% 3,224 95.0% 17,049 92.0%
Not Stated 1,001 6.6% 87 2.6% 1,088 5.9%
Total 15,143 100% 3,392 100% 18,535 100%
Table D.12 Participant profile per quarter by culturally and linguistically diverse (CALD) status – VIC
Prior Quarters 2017-18 Q1 Total
Participant profile N % N % N %
CALD 823 5.4% 196 5.8% 1,019 5.5%
Not CALD 14,015 92.6% 3,195 94.2% 17,210 92.9%
Not Stated 305 2.0% 1 0.0% 306 1.7%
Total 15,143 100% 3,392 100% 18,535 100%
Table D.13 Participant profile per quarter by Young people in Residential aged care (YPIRAC) status – VIC
Prior Quarters 2017-18 Q1 Total
Participant profile N % N % N %
YPIRAC 151 1.0% 64 1.9% 215 1.2%
Not YPIRAC 14,992 99.0% 3,328 98.1% 18,320 98.8%
Total 15,143 100% 3,392 100% 18,535 100%
Table D.14 Distribution of active participants by method of Financial Plan Management and quarter of plan approval –
VIC
Prior Quarters
(Transition only) 2017-18 Q1 Total
Self-managed fully 5% 8% 6%
Self-managed partly 11% 16% 13%
Plan managed 17% 13% 16%
Agency managed 67% 63% 66%
Total 100% 100% 100%
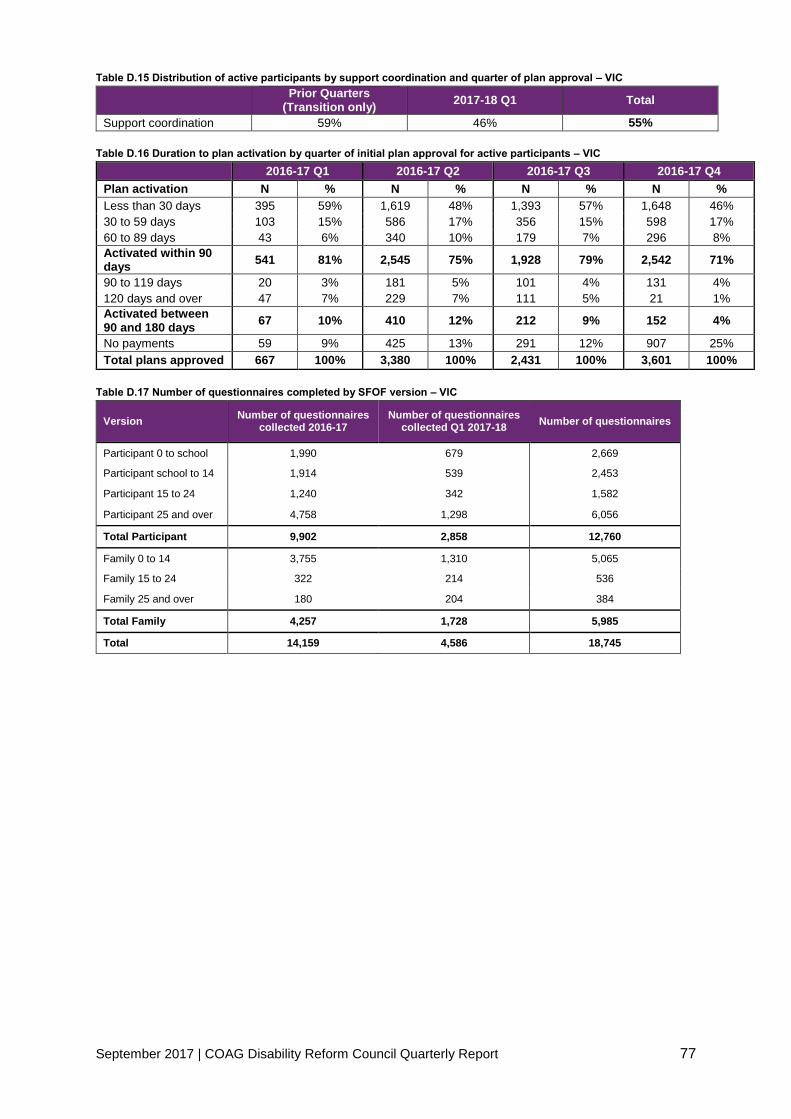
September 2017 | COAG Disability Reform Council Quarterly Report 77
Table D.15 Distribution of active participants by support coordination and quarter of plan approval – VIC
Prior Quarters
(Transition only) 2017-18 Q1 Total
Support coordination 59% 46% 55%
Table D.16 Duration to plan activation by quarter of initial plan approval for active participants – VIC
2016-17 Q1 2016-17 Q2 2016-17 Q3 2016-17 Q4
Plan activation N % N % N % N %
Less than 30 days 395 59% 1,619 48% 1,393 57% 1,648 46%
30 to 59 days 103 15% 586 17% 356 15% 598 17%
60 to 89 days 43 6% 340 10% 179 7% 296 8%
Activated within 90 days
541 81% 2,545 75% 1,928 79% 2,542 71%
90 to 119 days 20 3% 181 5% 101 4% 131 4%
120 days and over 47 7% 229 7% 111 5% 21 1%
Activated between 90 and 180 days
67 10% 410 12% 212 9% 152 4%
No payments 59 9% 425 13% 291 12% 907 25%
Total plans approved 667 100% 3,380 100% 2,431 100% 3,601 100%
Table D.17 Number of questionnaires completed by SFOF version – VIC
Version Number of questionnaires
collected 2016-17 Number of questionnaires
collected Q1 2017-18 Number of questionnaires
Participant 0 to school 1,990 679 2,669
Participant school to 14 1,914 539 2,453
Participant 15 to 24 1,240 342 1,582
Participant 25 and over 4,758 1,298 6,056
Total Participant 9,902 2,858 12,760
Family 0 to 14 3,755 1,310 5,065
Family 15 to 24 322 214 536
Family 25 and over 180 204 384
Total Family 4,257 1,728 5,985
Total 14,159 4,586 18,745

September 2017 | COAG Disability Reform Council Quarterly Report 78
Table D.18 Selected key indicators for participants – Daily Living (DL) and Choice and Control (CC) – VIC
Indicator 0 to before
school School to 14
15 to 24 25 and over
DL
% with concerns in 6 or more of the areas: gross motor skills, fine motor skills, self-care, eating, social interaction, communication, cognitive development, sensory processing
63%
CC % who say their child is able to tell them what he/she wants
78%
DL % developing functional, learning and coping skills appropriate to their ability and circumstances
27%
DL % who say their child is becoming more independent
40%
CC % of children who have a genuine say in decisions about themselves
62%
CC % who are happy with the level of independence/control they have now
34%
CC % who choose who supports them 31% 53%
CC % who choose what they do each day 39% 63%
CC % who had been given the opportunity to participate in a self-advocacy group meeting
22% 30%
CC % who want more choice and control in their life
69% 64%
Table D.19 Selected key indicators for participants – Relationships (REL) and Social/ Community Participation (S/CP) –
VIC
Indicator 0 to before
school School to
14 15 to 24
25 and over
REL % of children who can make friends with people outside the family
64% 60%
S/CP % of children who participate in age appropriate community, cultural or religious activities
54%
REL % of children who spend time after school and on weekends with friends and/or in mainstream programs
30%
REL Of these, % who are welcomed or actively included
64% 75%
REL % of children who spend time with friends without an adult present
16%
REL % with no friends other than family or paid staff
31% 26%
S/CP % who have been actively involved in a community, cultural or religious group in the last 12 months
32% 34%

September 2017 | COAG Disability Reform Council Quarterly Report 79
Table D.20 Selected key indicators for participants – Lifelong Learning (LL), Work (WK), Home (HM) and Health and
Wellbeing (HW) – VIC
Indicator 0 to before
school School to
14 15 to 24
25 and over
LL % of children attending school in a mainstream class
50%
HM % who are happy with their home 78% 77%
HM % who feel safe or very safe in their home
83% 77%
HW % who rate their health as good, very good or excellent
68% 50%
HW % who did not have any difficulties accessing health services
75% 73%
LL % who currently attend or previously attended school in a mainstream class
25%
LL % who participate in education, training or skill development
17%
LL Of those who participate, % who do so in mainstream settings
38%
LL % unable to do a course or training they wanted to do in the last 12 months
33%
WK % who have a paid job 17% 23%
WK % who volunteer 13% 13%

September 2017 | COAG Disability Reform Council Quarterly Report 80
Table D.21 Selected key indicators for families/ carers of participants – VIC
Indicator 0 to 14 15 to 24 25 and over
% receiving Carer Payment 23% 31% 18%
% receiving Carer Allowance 49% 51% 22%
% working in a paid job 43% 45% 27%
Of those in a paid job, % in permanent employment
77% 75% 77%
Of those in a paid job, % working 15 hours or more
76% 82% 84%
% who say they (and their partner) are able to work as much as they want
38% 43% 59%
Of those unable to work as much as they want, % who say the situation of their child/family member with disability is a barrier to working more
87% 92% 93%
Of those unable to work as much as they want, % who say insufficient flexibility of jobs is a barrier to working more
33% 31% 19%
% able to advocate for their child/family member
74% 70% 71%
% who have friends and family they see as often as they like
41% 40% 36%
% who feel very confident or somewhat confident in supporting their child's development
85%
% who know what their family can do to enable their family member with disability to become as independent as possible
43%
% who feel in control selecting services 42% 46%
% who have made plans (or begun to make plans) for when they are no longer able to care for their family member with disability
37%
% who rate their health as good, very good or excellent
73% 65% 63%
Table D.22 Results for “Has the NDIS helped?” questions answered at review, for SFOF version ‘Participant 0 to
school’ (n=34) – VIC
Question Yes
DL Has the NDIS improved your child's development? 83%
DL Has the NDIS improved your child's access to specialist services? 83%
CC Has the NDIS helped increase your child's ability to communicate what they want?
75%
REL Has the NDIS improved how your child fits into family life? 69%
S/CP Has the NDIS improved how your child fits into community life? 57%

September 2017 | COAG Disability Reform Council Quarterly Report 81
Table D.23 Results for “Has the NDIS helped?” questions answered at review, for SFOF version ‘Participant school to
14’ (n=32) – VIC
Question Yes
DL Has the NDIS helped your child to become more independent? 44%
LL Has the NDIS improved your child's access to education? 38%
REL Has the NDIS improved your child's relationships with family and friends?
41%
S/CP Has the NDIS improved your child's social and recreational life? 41%
Table D.24 Results for “Has the NDIS helped?” questions answered at review, for SFOF versions ‘Participant 15 to 24’
(n=41) and ‘Participant 25 and over’ (n=208) – VIC
Question 15 to 24 % Yes
25+ % Yes
CC Has the NDIS helped you have more choices and more control over your life?
65% 58%
DL Has the NDIS helped you with daily living activities? 75% 66%
REL Has the NDIS helped you to meet more people? 54% 52%
HM Has your involvement with the NDIS helped you to choose a home that's right for you?
19% 30%
HW Has your involvement with the NDIS improved your health and wellbeing?
48% 47%
LL Had your involvement with the NDIS helped you to learn things you want to learn or to take courses you want to take?
46% 37%
WK Has your involvement with the NDIS helped you find a job that's right for you?
18% 19%
S/CP Has the NDIS helped you be more involved? 69% 56%
Table D.25 Results for “Has the NDIS helped?” questions answered at review, for SFOF version ‘Family 0 to 14’ (n=84);
and for SFOF versions ‘Family 15 to 24’ and ‘Family 25 and over’ combined (n=3) – VIC
Question 0 to 14 % Yes
15+ % Yes
Has the NDIS improved your capacity to advocate (stand up) for your child? / Has the NDIS helped you to know your rights and advocate effectively?
50%
Numbers
are too
small
Has the NDIS improved the level of support for your family? 62%
Numbers
are too
small
Has the NDIS improved your access to services, programs and activities in the community?
60%
Numbers
are too
small
Has the NDIS improved your ability/capacity to help your child develop and learn?
71%
Has the NDIS improved your health and wellbeing? 41%
Numbers
are too
small

September 2017 | COAG Disability Reform Council Quarterly Report 82
Figure D.1 Proportion of participants describing satisfaction with the Agency planning process as good or very good –
by quarter (VIC)43
Table D.26 Proportion of Participants rating their level of agreement as strongly agree, agree, neutral, disagree or
strongly disagree in response to statements about the planning process – VIC
VIC Very good
Good Neutral Poor Very Poor
Overall, how would you rate your experience with the planning process today?
27% 47% 16% 5% 4%
1. The planner listened to me 26% 64% 3% 5% 3%
2. I had enough time to tell my story and say what support I need
27% 61% 3% 9% 0%
3. The planner knows what I can do well 15% 55% 14% 14% 3%
4. The planner had some good ideas for my plan
19% 55% 11% 12% 3%
5. I know what is in my plan 1% 77% 5% 16% 0%
6. The planner helped me think about my future
19% 51% 15% 14% 1%
7. I think my plan will make my life better 22% 54% 12% 7% 5%
8. The planning meeting went well 24% 62% 5% 5% 3%
Table D.27 Plan reviews conducted by quarter – excluding plans less than 30 days – VIC
Prior Quarters (Transition only)
2017-18 Q1 Transition Total
Total scheduled plan reviews 2,605 1,569 4,174
Trial participants 2,583 1,153 3,736
Transition participants 22 416 438
43 Participant satisfaction results are not shown if there is insufficient data in the group.
92%
86%
93%
82% 83%
74%
0%
10%
20%
30%
40%
50%
60%
70%
80%
90%
100%
Q3 14-15 Q4 14-15 Q1 15-16 Q2 15-16 Q3 15-16 Q4 15-16 Q1 16-17 Q2 16-17 Q3 16-17 Q4 16-17 Q1 17-18
Pro
po
rtio
n o
f P
art
icip
ants
%
Quarter
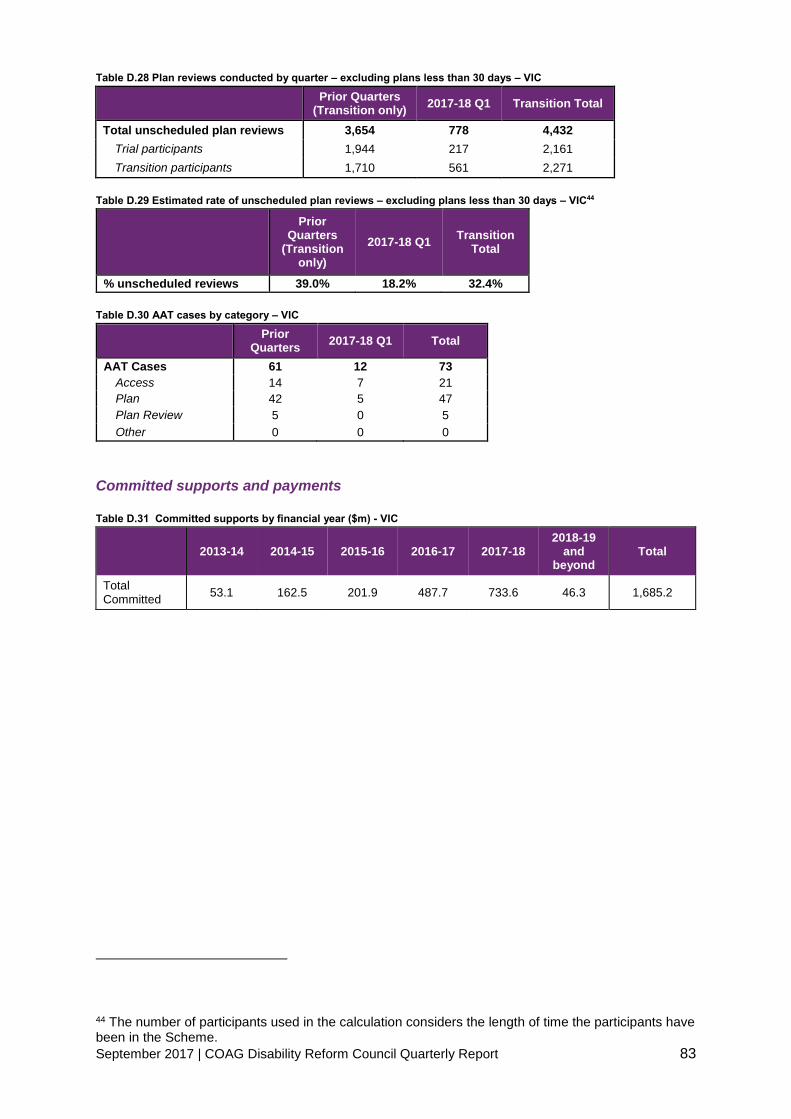
September 2017 | COAG Disability Reform Council Quarterly Report 83
Table D.28 Plan reviews conducted by quarter – excluding plans less than 30 days – VIC
Prior Quarters (Transition only)
2017-18 Q1 Transition Total
Total unscheduled plan reviews 3,654 778 4,432
Trial participants 1,944 217 2,161
Transition participants 1,710 561 2,271
Table D.29 Estimated rate of unscheduled plan reviews – excluding plans less than 30 days – VIC44
Prior Quarters
(Transition only)
2017-18 Q1 Transition
Total
% unscheduled reviews 39.0% 18.2% 32.4%
Table D.30 AAT cases by category – VIC
Prior
Quarters 2017-18 Q1 Total
AAT Cases 61 12 73
Access 14 7 21
Plan 42 5 47
Plan Review 5 0 5
Other 0 0 0
Committed supports and payments
Table D.31 Committed supports by financial year ($m) - VIC
2013-14 2014-15 2015-16 2016-17 2017-18 2018-19
and beyond
Total
Total Committed
53.1 162.5 201.9 487.7 733.6 46.3 1,685.2
44 The number of participants used in the calculation considers the length of time the participants have been in the Scheme.
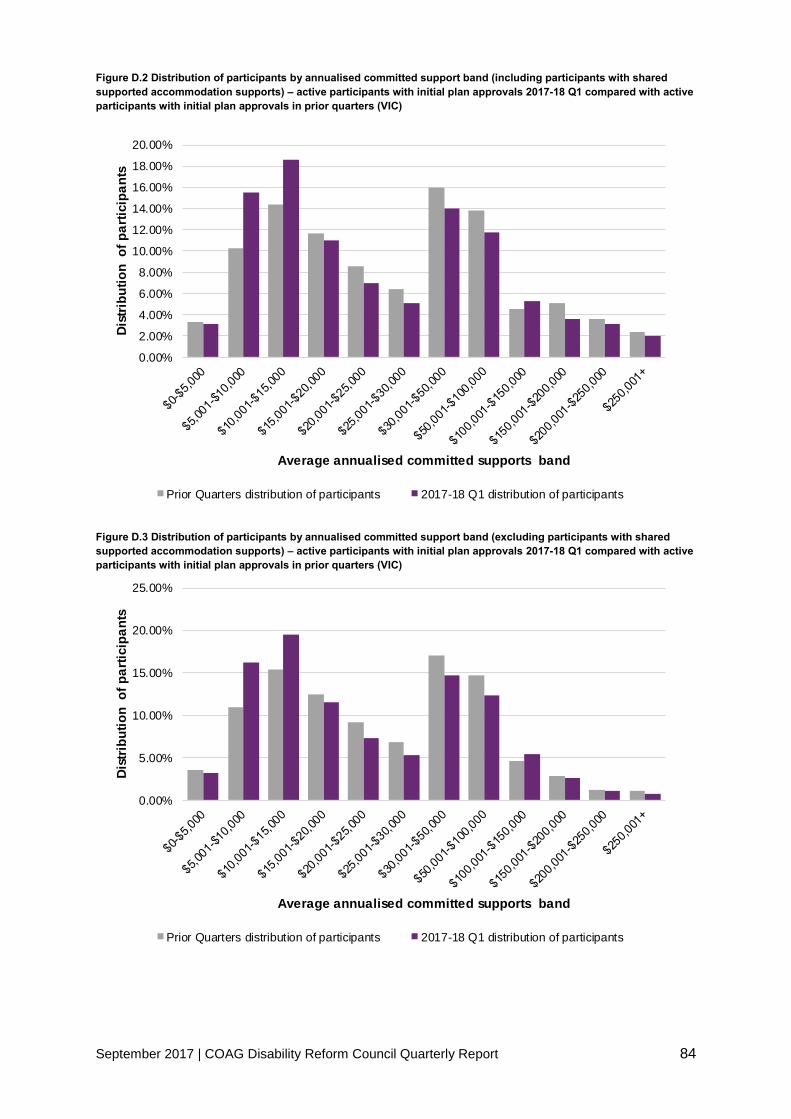
September 2017 | COAG Disability Reform Council Quarterly Report 84
Figure D.2 Distribution of participants by annualised committed support band (including participants with shared
supported accommodation supports) – active participants with initial plan approvals 2017-18 Q1 compared with active
participants with initial plan approvals in prior quarters (VIC)
Figure D.3 Distribution of participants by annualised committed support band (excluding participants with shared
supported accommodation supports) – active participants with initial plan approvals 2017-18 Q1 compared with active
participants with initial plan approvals in prior quarters (VIC)
0.00%
2.00%
4.00%
6.00%
8.00%
10.00%
12.00%
14.00%
16.00%
18.00%
20.00%
Dis
trib
uti
on
o
f p
art
icip
an
ts
Average annualised committed supports band
Prior Quarters distribution of participants 2017-18 Q1 distribution of participants
0.00%
5.00%
10.00%
15.00%
20.00%
25.00%
Dis
trib
uti
on
o
f p
art
icip
an
ts
Average annualised committed supports band
Prior Quarters distribution of participants 2017-18 Q1 distribution of participants

September 2017 | COAG Disability Reform Council Quarterly Report 85
Figure D.4 Average committed support by age group (including participants with shared supported accommodation
supports) – active participants with initial plan approvals 2017-18 Q1 compared with active participants with initial
plan approvals in prior quarters (VIC)
$0
$10,000
$20,000
$30,000
$40,000
$50,000
$60,000
$70,000
$80,000
$90,000
$100,000
0 to 6 7 to 14 15 to 18 19 to 24 25 to 34 35 to 44 45 to 54 55 to 64 65+
Av
era
ge
an
nu
ali
se
d c
om
mit
ted
su
pp
ort
s
Age group
2017-18 Q1 expected average annualised committed supports (based on revenue)
2017-18 Q1 actual average annualised committed supports
Prior Quarters expected average annualised committed supports (based on revenue)
Prior Quarters actual average annualised committed supports

September 2017 | COAG Disability Reform Council Quarterly Report 86
Figure D.5 Average committed support by primary disability group (including participants with shared supported
accommodation supports) – active participants with initial plan approvals 2017-18 Q1 compared with active
participants with initial plan approvals in prior quarters (VIC)
$0 $50,000 $100,000 $150,000 $200,000 $250,000
ABI
Autism
Cerebral Palsy
Developmental Delay
Global Developmental Delay
Hearing Impairment
Intellectual Disability
Multiple Sclerosis
Psychosocial disability
Spinal Cord Injury
Stroke
Visual Impairment
Other Neurological
Other Physical
Other Sensory/Speech
Other
Average annualised committed supports
Pri
ma
ry d
isa
bil
ity
Prior Quarters actual average annualised committed supports
Prior Quarters expected average annualised committed supports (based on revenue)
2017-18 Q1 actual average annualised committed supports
2017-18 Q1 expected average annualised committed supports (based on revenue)

September 2017 | COAG Disability Reform Council Quarterly Report 87
Figure D.6 Average committed support by level of function (including participants with shared supported
accommodation supports) – active participants with initial plan approvals 2017-18 Q1 compared with active
participants with initial plan approvals in prior quarters45 (VIC)
Table D.32 Payments by financial year, compared to committed supports ($m) – VIC
2013-14 2014-15 2015-16 2016-17 2017-18 2018-19 and
beyond Total
Total Committed 53.1 162.5 201.9 487.7 733.6 46.3 1,685.2
Total Paid 32.3 128.2 160.7 322.2 117.3 - 760.8
% utilised to date 61% 79% 80% 66% - - 67%46
Figure D.7 Utilisation of committed supports as at 30 June 2017 and 30 September 2017 (VIC)
45 Average annualised committed supports are not shown where there is insufficient data in the group. Level of function 15 does not have sufficient data to show an average cost. 46 Note: Only committed supports expected to be used to 30 September 2017 have been used to calculate the utilisation from 1 July 2013 to date.
$0
$20,000
$40,000
$60,000
$80,000
$100,000
$120,000
$140,000
$160,000
$180,000
1 2 3 4 5 6 7 8 9 10 11 12 13 14 15
Av
era
ge
an
nu
ali
se
d c
om
mit
ted
su
pp
ort
s
Level of function
2017-18 Q1 expected average annualised committed supports (based on revenue)
2017-18 Q1 actual average annualised committed supports
Prior Quarters expected average annualised committed supports (based on revenue)
Prior Quarters actual average annualised committed supports
61% 61%
79% 79%80% 80%
57%66%
50%
$0m
$100m
$200m
$300m
$400m
$500m
$600m
2013-14 2014-15 2015-16 2016-17 2017-18YTD
Co
mm
itte
d s
up
po
rts
As at 30 Jun 2017: Paid As at 30 Jun 2017: Remaining
As at 30 Sep 2017: Paid As at 30 Sep 2017: Remaining
EXPERIENCE IS STILL EMERGING

September 2017 | COAG Disability Reform Council Quarterly Report 88
Providers and markets
Table D.33 Key provider indicators by quarter - VIC
Prior Quarters 2017-18 Q1 Total
Provider indicators
a) Registrations by profile
Individual/ sole trader 931 212 1,132
Company/ organisation 1,601 383 1,969
Total 2,532 595 3,101
b) Registration revoked 26

September 2017 | COAG Disability Reform Council Quarterly Report 89
Table D.34 Number of approved providers by registration group - VIC47
Registration Group Prior
Quarters 2017-18
Q1 Total % Change
Assistance services
Accommodation / Tenancy Assistance 250 70 320 28%
Assistance Animals 2 1 3 50%
Assistance with daily life tasks in a group or shared living arrangement
132 7 139 5%
Assistance with travel/transport arrangements 496 165 661 33%
Daily Personal Activities 254 36 290 14%
Group and Centre Based Activities 262 30 292 11%
High Intensity Daily Personal Activities 251 29 280 12%
Household tasks 579 193 772 33%
Interpreting and translation 132 79 211 60%
Participation in community, social and civic activities 302 30 332 10%
Assistive Technology
Assistive equipment for recreation 236 58 294 25%
Assistive products for household tasks 284 82 366 29%
Assistance products for personal care and safety 445 97 542 22%
Communication and information equipment 193 55 248 28%
Customised Prosthetics 173 40 213 23%
Hearing Equipment 93 14 107 15%
Hearing Services 16 1 17 6%
Personal Mobility Equipment 342 90 432 26%
Specialised Hearing Services 56 1 57 2%
Vision Equipment 79 17 96 22%
Capacity Building Services
Assistance in coordinating or managing life stages, transitions and supports
280 21 301 8%
Behaviour Support 226 18 244 8%
Community nursing care for high needs 251 108 359 43%
Development of daily living and life skills 287 25 312 9%
Early Intervention supports for early childhood 246 38 284 15%
Exercise Physiology and Physical Wellbeing activities
231 60 291 26%
Innovative Community Participation 272 103 375 38%
Specialised Driving Training 103 9 112 9%
Therapeutic Supports 1,260 291 1,551 23%
Capital services
Home modification design and construction 343 83 426 24%
Specialised Disability Accommodation 76 32 108 42%
Vehicle Modifications 55 14 69 25%
Choice and control support services
Management of funding for supports in participants plan
164 24 188 15%
Support Coordination 207 37 244 18%
Employment and Education support services
Assistance to access and/or maintain employment and/or education
109 3 112 3%
Specialised Supported Employment 69 5 74 7%
Total approved providers 2,506 595 3,101 24%
47 The 26 providers whose registration ended during the first quarter of 2017-18 are not included in the 2016-17 Q4 and prior numbers in this table.

September 2017 | COAG Disability Reform Council Quarterly Report 90
Table D.35 Key markets indicators by quarter- VIC
Market indicators Prior Quarters 2017-18 Q1
a) Average number of providers per participant 1.84 1.81
b) Number of providers delivering new supports 422 475
c) Change in the number of active/inactive providers:
Active (%) 37% 39%
Not yet active (%) 58% 56%
Inactive (%) 5% 5%
d) Share of payments - top 25%
Daily Tasks/Shared Living (%) 81% 76%
Therapeutic Supports (%) 88% 88%
Participate Community (%) 83% 81%
Early Childhood Supports (%) 86% 88%
Assist Personal Activities (%) 90% 89%
Table D.36 Proportion of active participants with approved plans accessing mainstream supports – VIC
Prior Quarters 2017-18 Q1 Total
Assistive technology 0% 0% 0%
Choice & Control 1% 2% 1%
Consumables 0% 0% 0%
Daily Activities 10% 11% 10%
Daily Equipment 0% 0% 0%
Employment 2% 2% 2%
Health & Wellbeing 40% 48% 43%
Home Living 2% 2% 2%
Housing & Home modifications 0% 0% 0%
Independence 3% 3% 3%
Lifelong Learning 11% 13% 12%
Relationships 2% 3% 2%
Social & Civic 3% 4% 4%
Transport 1% 1% 1%
Non-categorised 23% 22% 23%
Any mainstream service 79% 88% 82%

September 2017 | COAG Disability Reform Council Quarterly Report 91
Appendix E
Appendix E: Queensland
The tables below replicate the tables in the main parts of this report for QLD only where the
data is available.
Participant Demographics
Table E.1 Plan approvals compared to estimates – QLD
Prior
Quarters 2017-18 Q1
Total excluding
ECEI
Total including
ECEI
Bilateral estimates
QLD 7,188 2,049 9,237 9,733 18,464
Table E.2 Quarterly intake split by plan and entry type since 1 July 2013 – QLD
Prior Quarters 2017-18 Q1 Total
Access decisions 10,046 4,075 14,121
Access Met 8,949 3,224 12,173
State 6,373 2,102 8,475
New 1,971 881 2,852
Commonwealth 605 241 846
Total Participant Plans 7,443 2,545 9,733
EI (s25) plans 1,338 466 1,804
PD (s24) plans 5,850 1,583 7,433
ECEI 255 496 496
Table E.3 Plan reviews conducted per quarter – QLD
Prior Quarters
(Transition only)
2017-18 Q1 Transition
Total
Total plan reviews 1,598 1,234 2,832
Early intervention plans 311 228 539
Permanent disability plans 1,287 1,006 2,293
Table E.4 Exits from the Scheme since 1 July 2013 as at 30 September 2017 – QLD
Exits
Total plan exits 68
Early Intervention plans 2
Permanent disability plans 66
Table E.5 Cumulative position by services previously received – QLD
Participant cohort Bilateral estimate
% of estimate
Awaiting a plan
State Commonwealth New ECEI Total
Trial 280 33 48 361 600 60%
End of 2016-17 5,146 456 1,586 255 7,443 14,966 50%
End of 2017-18 Q1 6,308 653 2,276 496 9,733 18,464 53% 2,693

September 2017 | COAG Disability Reform Council Quarterly Report 92
Table E.6 Cumulative position by entry into the Scheme – QLD
Participant cohort Bilateral estimate
% of estimate
Awaiting a plan
EI (s25) plan PD (s24) plan ECEI Total
Trial 165 196 361 600 60%
End of 2016-17 1,338 5,850 255 7,443 14,966 50%
End of 2017-18 Q1 1,804 7,433 496 9,733 18,464 53% 2,693
Table E.7 Active participants with approved plans per quarter by disability group – QLD48
Prior Quarters 2017-18 Q1 Total
Disability N % N % N %
Intellectual Disability 2,186 31% 486 24% 2,672 29%
Autism 1,768 25% 571 28% 2,339 26%
Psychosocial disability 507 7% 157 8% 664 7%
Cerebral Palsy 446 6% 121 6% 567 6%
Developmental Delay 240 3% 85 4% 325 4%
Other Neurological 334 5% 116 6% 450 5%
Other Physical 405 6% 160 8% 565 6%
Acquired Brain Injury 337 5% 77 4% 414 5%
Hearing Impairment 192 3% 79 4% 271 3%
Other Sensory/Speech 99 1% 28 1% 127 1%
Visual Impairment 123 2% 38 2% 161 2%
Multiple Sclerosis 148 2% 40 2% 188 2%
Global Developmental Delay 56 1% 20 1% 76 1%
Spinal Cord Injury 175 2% 37 2% 212 2%
Stroke 93 1% 29 1% 122 1%
Other 14 0% 2 0% 16 0%
Total 7,123 100% 2,046 100% 9,169 100%
Table E.8 Active participants with approved plan per quarter by level of function – QLD
Prior Quarters 2017-18 Q1 Total
Level of Function N % N % N %
1 (High Function) 24 0% 13 1% 37 0%
2 (High Function) 12 0% 2 0% 14 0%
3 (High Function) 276 4% 96 5% 372 4%
4 (High Function) 412 6% 160 8% 572 6%
5 (High Function) 1,206 17% 373 18% 1,579 17%
6 (Moderate Function) 843 12% 252 12% 1,095 12%
7 (Moderate Function) 540 8% 126 6% 666 7%
8 (Moderate Function) 668 9% 189 9% 857 9%
9 (Moderate Function) 50 1% 13 1% 63 1%
10 (Moderate Function) 994 14% 276 13% 1,270 14%
11 (Low Function) 431 6% 103 5% 534 6%
12 (Low Function) 1,141 16% 332 16% 1,473 16%
13 (Low Function) 267 4% 60 3% 327 4%
14 (Low Function) 251 4% 51 2% 302 3%
15 (Low Function) 5 0% 0 0% 5 0%
Missing 3 0 3
Total 7,123 100% 2,046 100% 9,169 100%
48 Table order based on national proportions (highest to lowest)

September 2017 | COAG Disability Reform Council Quarterly Report 93
Table E.9 Participant profile per quarter by Age group – QLD
Prior Quarters 2017-18 Q1 Total
Age Group N % N % N %
0 to 6 768 11% 301 15% 1,069 12%
7 to 14 1,455 20% 451 22% 1,906 21%
15 to 18 583 8% 161 8% 744 8%
19 to 24 701 10% 179 9% 880 10%
25 to 34 814 11% 205 10% 1,019 11%
35 to 44 793 11% 202 10% 995 11%
45 to 54 960 13% 243 12% 1,203 13%
55 to 64 968 14% 290 14% 1,258 14%
65+ 81 1% 14 1% 95 1%
Total 7,123 100% 2,046 100% 9,169 100%
Table E.10 Participant profile per quarter by Gender – QLD
Prior Quarters 2017-18 Q1 Total
Gender N % N % N %
Male 4,410 62% 1,297 63% 5,707 62%
Female 2,679 38% 720 35% 3,399 37%
Indeterminate 34 0% 29 1% 63 1%
Total 7,123 100% 2,046 100% 9,169 100%
Table E.11 Participant profile per quarter by Aboriginal and Torres Strait islander status – QLD
Prior Quarters 2017-18 Q1 Total
Participant profile N % N % N %
Aboriginal and Torres Strait Islander
678 9.5% 128 6.3% 806 8.8%
Not Aboriginal and Torres Strait Islander
6,354 89.2% 1,882 92.0% 8,236 89.8%
Not Stated 91 1.3% 36 1.8% 127 1.4%
Total 7,123 100% 2,046 100% 9,169 100%
Table E.12 Participant profile per quarter by culturally and linguistically diverse (CALD) status – QLD
Prior Quarters 2017-18 Q1 Total
Participant profile N % N % N %
CALD 191 2.7% 75 3.7% 266 2.9%
Not CALD 6,902 96.9% 1,971 96.3% 8,873 96.8%
Not Stated 30 0.4% 0 0.0% 30 0.3%
Total 7,123 100% 2,046 100% 9,169 100%
Table E.13 Participant profile per quarter by Young people in Residential aged care (YPIRAC) status – QLD
Prior Quarters 2017-18 Q1 Total
Participant profile N % N % N %
YPIRAC 88 1.2% 4 0.2% 92 1.0%
Not YPIRAC 7,035 98.8% 2,042 99.8% 9,077 99.0%
Total 7,123 100% 2,046 100% 9,169 100%
Table E.14 Distribution of active participants by method of Financial Plan Management and quarter of plan approval –
QLD
Prior Quarters
(Transition only) 2017-18 Q1 Total
Self-managed fully 8% 11% 9%
Self-managed partly 10% 10% 10%
Plan managed 13% 12% 13%
Agency managed 70% 68% 69%
Total 100% 100% 100%

September 2017 | COAG Disability Reform Council Quarterly Report 94
Table E.15 Distribution of active participants by support coordination and quarter of plan approval – QLD
Prior Quarters
(Transition only) 2017-18 Q1 Total
Support coordination 66% 26% 52%
Table E.16 Duration to plan activation by quarter of initial plan approval for active participants – QLD
2016-17 Q1 2016-17 Q2 2016-17 Q3 2016-17 Q4
Plan activation N % N % N % N %
Less than 30 days 207 54% 1,030 57% 1,447 59% 1,051 49%
30 to 59 days 66 17% 209 12% 268 11% 297 14%
60 to 89 days 27 7% 108 6% 151 6% 134 6%
Activated within 90 days
300 79% 1,347 75% 1,866 76% 1,482 70%
90 to 119 days 10 3% 81 5% 98 4% 71 3%
120 days and over 28 7% 136 8% 103 4% 10 0%
Activated between 90 and 180 days
38 10% 217 12% 201 8% 81 4%
No payments 42 11% 232 13% 395 16% 563 26%
Total plans approved 380 100% 1,796 100% 2,462 100% 2,126 100%
Table E.17 Number of questionnaires completed by SFOF version – QLD
Version Number of questionnaires
collected 2016-17 Number of questionnaires
collected Q1 2017-18 Number of questionnaires
Participant 0 to school 821 291 1,112
Participant school to 14 1,338 436 1,774
Participant 15 to 24 1,028 287 1,315
Participant 25 and over 3,495 874 4,369
Total Participant 6,682 1,888 8,570
Family 0 to 14 2,010 753 2,763
Family 15 to 24 264 147 411
Family 25 and over 223 167 390
Total Family 2,497 1,067 3,564
Total 9,179 2,955 12,134
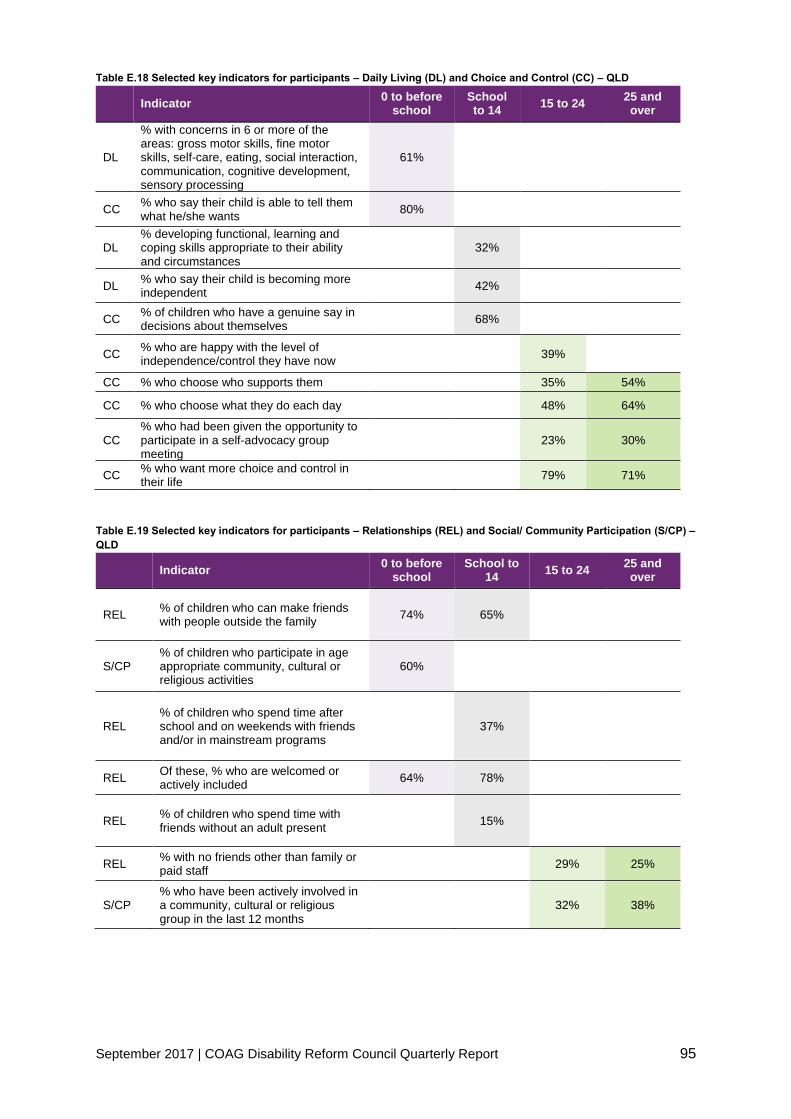
September 2017 | COAG Disability Reform Council Quarterly Report 95
Table E.18 Selected key indicators for participants – Daily Living (DL) and Choice and Control (CC) – QLD
Indicator 0 to before
school School to 14
15 to 24 25 and over
DL
% with concerns in 6 or more of the areas: gross motor skills, fine motor skills, self-care, eating, social interaction, communication, cognitive development, sensory processing
61%
CC % who say their child is able to tell them what he/she wants
80%
DL % developing functional, learning and coping skills appropriate to their ability and circumstances
32%
DL % who say their child is becoming more independent
42%
CC % of children who have a genuine say in decisions about themselves
68%
CC % who are happy with the level of independence/control they have now
39%
CC % who choose who supports them 35% 54%
CC % who choose what they do each day 48% 64%
CC % who had been given the opportunity to participate in a self-advocacy group meeting
23% 30%
CC % who want more choice and control in their life
79% 71%
Table E.19 Selected key indicators for participants – Relationships (REL) and Social/ Community Participation (S/CP) –
QLD
Indicator 0 to before
school School to
14 15 to 24
25 and over
REL % of children who can make friends with people outside the family
74% 65%
S/CP % of children who participate in age appropriate community, cultural or religious activities
60%
REL % of children who spend time after school and on weekends with friends and/or in mainstream programs
37%
REL Of these, % who are welcomed or actively included
64% 78%
REL % of children who spend time with friends without an adult present
15%
REL % with no friends other than family or paid staff
29% 25%
S/CP % who have been actively involved in a community, cultural or religious group in the last 12 months
32% 38%
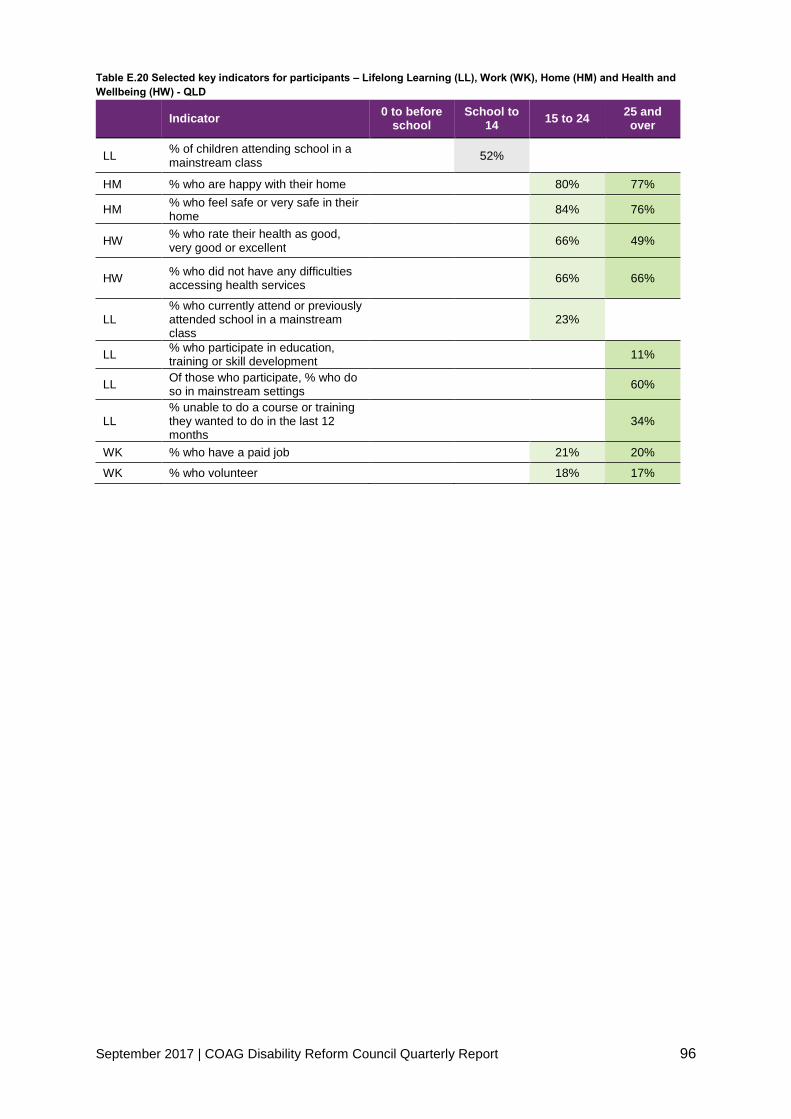
September 2017 | COAG Disability Reform Council Quarterly Report 96
Table E.20 Selected key indicators for participants – Lifelong Learning (LL), Work (WK), Home (HM) and Health and
Wellbeing (HW) - QLD
Indicator 0 to before
school School to
14 15 to 24
25 and over
LL % of children attending school in a mainstream class
52%
HM % who are happy with their home 80% 77%
HM % who feel safe or very safe in their home
84% 76%
HW % who rate their health as good, very good or excellent
66% 49%
HW % who did not have any difficulties accessing health services
66% 66%
LL % who currently attend or previously attended school in a mainstream class
23%
LL % who participate in education, training or skill development
11%
LL Of those who participate, % who do so in mainstream settings
60%
LL % unable to do a course or training they wanted to do in the last 12 months
34%
WK % who have a paid job 21% 20%
WK % who volunteer 18% 17%
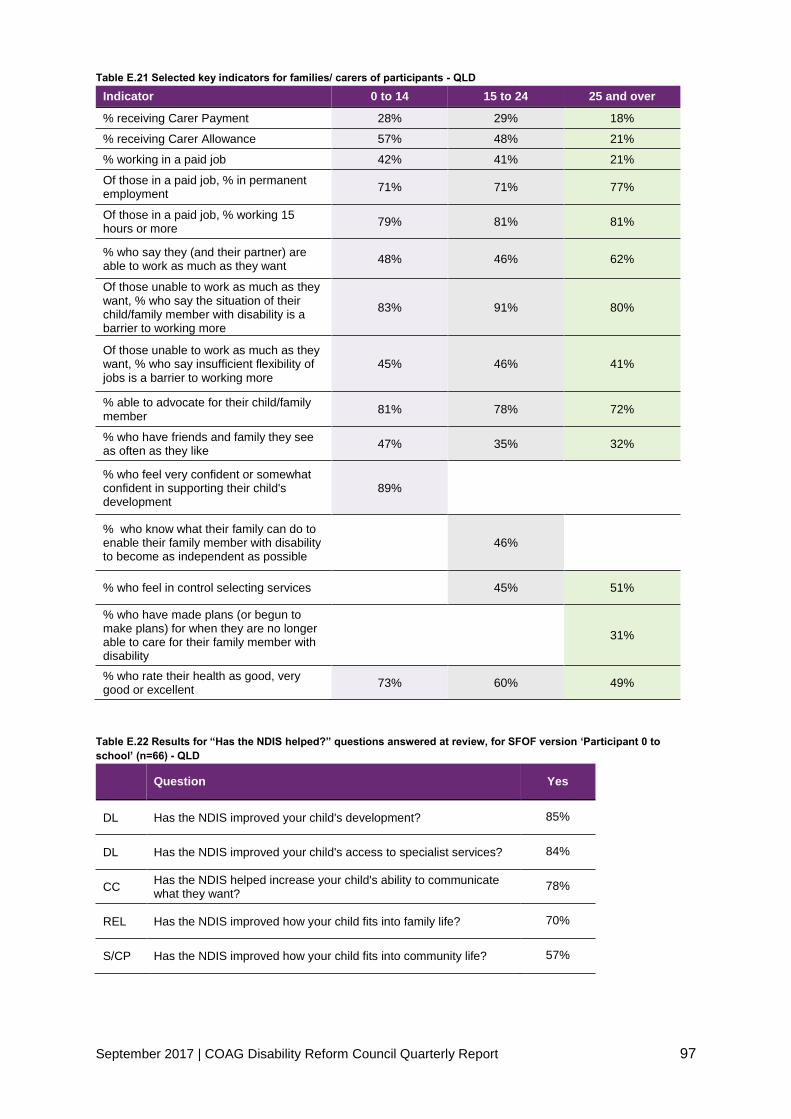
September 2017 | COAG Disability Reform Council Quarterly Report 97
Table E.21 Selected key indicators for families/ carers of participants - QLD
Indicator 0 to 14 15 to 24 25 and over
% receiving Carer Payment 28% 29% 18%
% receiving Carer Allowance 57% 48% 21%
% working in a paid job 42% 41% 21%
Of those in a paid job, % in permanent employment
71% 71% 77%
Of those in a paid job, % working 15 hours or more
79% 81% 81%
% who say they (and their partner) are able to work as much as they want
48% 46% 62%
Of those unable to work as much as they want, % who say the situation of their child/family member with disability is a barrier to working more
83% 91% 80%
Of those unable to work as much as they want, % who say insufficient flexibility of jobs is a barrier to working more
45% 46% 41%
% able to advocate for their child/family member
81% 78% 72%
% who have friends and family they see as often as they like
47% 35% 32%
% who feel very confident or somewhat confident in supporting their child's development
89%
% who know what their family can do to enable their family member with disability to become as independent as possible
46%
% who feel in control selecting services 45% 51%
% who have made plans (or begun to make plans) for when they are no longer able to care for their family member with disability
31%
% who rate their health as good, very good or excellent
73% 60% 49%
Table E.22 Results for “Has the NDIS helped?” questions answered at review, for SFOF version ‘Participant 0 to
school’ (n=66) - QLD
Question Yes
DL Has the NDIS improved your child's development? 85%
DL Has the NDIS improved your child's access to specialist services? 84%
CC Has the NDIS helped increase your child's ability to communicate what they want?
78%
REL Has the NDIS improved how your child fits into family life? 70%
S/CP Has the NDIS improved how your child fits into community life? 57%

September 2017 | COAG Disability Reform Council Quarterly Report 98
Table E.23 Results for “Has the NDIS helped?” questions answered at review, for SFOF version ‘Participant school to
14’ (n=73) - QLD
Question Yes
DL Has the NDIS helped your child to become more independent? 48%
LL Has the NDIS improved your child's access to education? 21%
REL Has the NDIS improved your child's relationships with family and friends?
42%
S/CP Has the NDIS improved your child's social and recreational life? 39%
Table E.24 Results for “Has the NDIS helped?” questions answered at review, for SFOF versions ‘Participant 15 to 24’
(n=25) and ‘Participant 25 and over’ (n=68) - QLD
Question 15 to 24 % Yes
25+ % Yes
CC Has the NDIS helped you have more choices and more control over your life?
65% 86%
DL Has the NDIS helped you with daily living activities? 67% 81%
REL Has the NDIS helped you to meet more people? 42% 66%
HM Has your involvement with the NDIS helped you to choose a home that's right for you?
32% 37%
HW Has your involvement with the NDIS improved your health and wellbeing?
40% 62%
LL Had your involvement with the NDIS helped you to learn things you want to learn or to take courses you want to take?
38% 32%
WK Has your involvement with the NDIS helped you find a job that's right for you?
25% 12%
S/CP Has the NDIS helped you be more involved? 60% 71%
Table E.25 Results for “Has the NDIS helped?” questions answered at review, for SFOF version ‘Family 0 to 14’
(n=144); and for SFOF versions ‘Family 15 to 24’ and ‘Family 25 and over’ combined (n=6) - QLD
Question 0 to 14 % Yes
15+ % Yes
Has the NDIS improved your capacity to advocate (stand up) for your child? / Has the NDIS helped you to know your rights and advocate effectively?
55%
Numbers
are too
small
Has the NDIS improved the level of support for your family? 64%
Numbers
are too
small
Has the NDIS improved your access to services, programs and activities in the community?
75%
Numbers
are too
small
Has the NDIS improved your ability/capacity to help your child develop and learn?
76%
Has the NDIS improved your health and wellbeing? 40%
Numbers
are too
small

September 2017 | COAG Disability Reform Council Quarterly Report 99
Figure E.1 Proportion of participants describing satisfaction with the Agency planning process as good or very good –
by quarter (QLD)49
Table E.26 Proportion of Participants rating their level of agreement as strongly agree, agree, neutral, disagree or
strongly disagree in response to statements about the planning process – QLD
QLD Very good
Good Neutral Poor Very Poor
Overall, how would you rate your experience with the planning process today?
69% 22% 2% 5% 2%
1. The planner listened to me 74% 22% 1% 2% 2%
2. I had enough time to tell my story and say what support I need
64% 31% 2% 2% 2%
3. The planner knows what I can do well 54% 32% 5% 6% 2%
4. The planner had some good ideas for my plan
57% 34% 5% 2% 2%
5. I know what is in my plan 49% 35% 9% 5% 2%
6. The planner helped me think about my future
53% 33% 8% 4% 2%
7. I think my plan will make my life better 61% 25% 8% 4% 2%
8. The planning meeting went well 67% 24% 4% 4% 2%
Table E.27 Plan reviews conducted by quarter – excluding plans less than 30 days – QLD
Prior Quarters (Transition only)
2017-18 Q1 Transition Total
Total scheduled plan reviews 260 526 786
Trial participants 215 49 264
Transition participants 45 477 522
49 Participant satisfaction results are not shown if there is insufficient data in the group.
91% 91%
0%
10%
20%
30%
40%
50%
60%
70%
80%
90%
100%
Q3 14-15 Q4 14-15 Q1 15-16 Q2 15-16 Q3 15-16 Q4 15-16 Q1 16-17 Q2 16-17 Q3 16-17 Q4 16-17 Q1 17-18
Pro
po
rtio
n o
f P
art
icip
ants
%
Quarter

September 2017 | COAG Disability Reform Council Quarterly Report 100
Table E.28 Plan reviews conducted by quarter – excluding plans less than 30 days – QLD
Prior Quarters (Transition only)
2017-18 Q1 Transition Total
Total unscheduled plan reviews 1,338 708 2,046
Trial participants 212 39 251
Transition participants 1,126 669 1,795
Table E.29 Estimated rate of unscheduled plan reviews – excluding plans less than 30 days – QLD50
Prior Quarters
(Transition only)
2017-18 Q1 Transition
Total
% unscheduled reviews 44.1% 34.5% 40.2%
Table E.30 AAT cases by category – QLD
Prior
Quarters 2017-18 Q1 Total
AAT Cases 8 11 19
Access 2 7 9
Plan 4 4 8
Plan Review 2 0 2
Other 0 0 0
Committed supports and payments
Table E.31 Committed supports by financial year ($m) - QLD
2013-14 2014-15 2015-16 2016-17 2017-18 2018-19
and beyond
Total
Total Committed
- - 1.0 196.9 442.5 23.1 663.4
50 The number of participants used in the calculation considers the length of time the participants have been in the Scheme.

September 2017 | COAG Disability Reform Council Quarterly Report 101
Figure E.2 Distribution of participants by annualised committed support band (including participants with shared
supported accommodation supports) – active participants with initial plan approvals 2017-18 Q1 compared with active
participants with initial plan approvals in prior quarters (QLD)
Figure E.3 Distribution of participants by annualised committed support band (excluding participants with shared
supported accommodation supports) – active participants with initial plan approvals 2017-18 Q1 compared with active
participants with initial plan approvals in prior quarters (QLD)
0.00%
2.00%
4.00%
6.00%
8.00%
10.00%
12.00%
14.00%
16.00%
18.00%
20.00%
Dis
trib
uti
on
o
f p
art
icip
an
ts
Average annualised committed supports band
Prior Quarters distribution of participants 2017-18 Q1 distribution of participants
0.00%
2.00%
4.00%
6.00%
8.00%
10.00%
12.00%
14.00%
16.00%
18.00%
20.00%
Dis
trib
uti
on
o
f p
art
icip
an
ts
Average annualised committed supports band
Prior Quarters distribution of participants 2017-18 Q1 distribution of participants
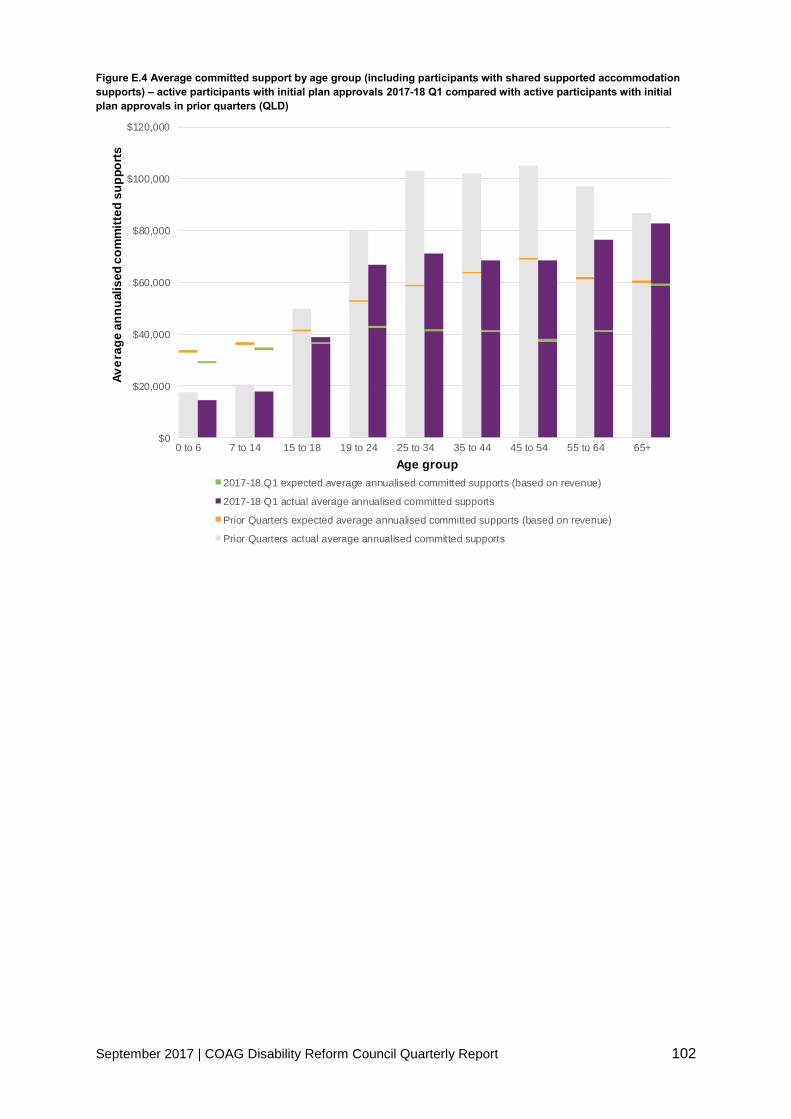
September 2017 | COAG Disability Reform Council Quarterly Report 102
Figure E.4 Average committed support by age group (including participants with shared supported accommodation
supports) – active participants with initial plan approvals 2017-18 Q1 compared with active participants with initial
plan approvals in prior quarters (QLD)
$0
$20,000
$40,000
$60,000
$80,000
$100,000
$120,000
0 to 6 7 to 14 15 to 18 19 to 24 25 to 34 35 to 44 45 to 54 55 to 64 65+
Av
era
ge
an
nu
ali
se
d c
om
mit
ted
su
pp
ort
s
Age group
2017-18 Q1 expected average annualised committed supports (based on revenue)
2017-18 Q1 actual average annualised committed supports
Prior Quarters expected average annualised committed supports (based on revenue)
Prior Quarters actual average annualised committed supports

September 2017 | COAG Disability Reform Council Quarterly Report 103
Figure E.5 Average committed support by primary disability group (including participants with shared supported
accommodation supports) – active participants with initial plan approvals 2017-18 Q1 compared with active
participants with initial plan approvals in prior quarters51 (QLD)
51 Average annualised committed supports are not shown where there is insufficient data in the group.
$0 $20,000 $40,000 $60,000 $80,000 $100,000 $120,000 $140,000 $160,000
ABI
Autism
Cerebral Palsy
Developmental Delay
Global Developmental Delay
Hearing Impairment
Intellectual Disability
Multiple Sclerosis
Psychosocial disability
Spinal Cord Injury
Stroke
Visual Impairment
Other Neurological
Other Physical
Other Sensory/Speech
Other
Average annualised committed supports
Pri
ma
ry d
isa
bil
ity
Prior Quarters actual average annualised committed supports
Prior Quarters expected average annualised committed supports (based on revenue)
2017-18 Q1 actual average annualised committed supports
2017-18 Q1 expected average annualised committed supports (based on revenue)

September 2017 | COAG Disability Reform Council Quarterly Report 104
Figure E.6 Average committed support by level of function (including participants with shared supported
accommodation supports) – active participants with initial plan approvals 2017-18 Q1 compared with active
participants with initial plan approvals in prior quarters52 (QLD)
Table E.32 Payments by financial year, compared to committed supports ($m) – QLD
2013-14 2014-15 2015-16 2016-17 2017-18 2018-19 and
beyond Total
Total Committed - - 1.0 196.9 442.5 23.1 663.4
Total Paid - - 0.3 106.6 62.7 - 169.6
% utilised to date - - 32% 54% - - 50%53
Figure E.7 Utilisation of committed supports as at 30 June 2017 and 30 September 2017 (QLD)
52 Average annualised committed supports are not shown where there is insufficient data in the group. Level of function 15 does not have sufficient data to show an average cost. 53 Note: Only committed supports expected to be used to 30 September 2017 have been used to calculate the utilisation from 1 July 2013 to date.
$0
$50,000
$100,000
$150,000
$200,000
$250,000
1 2 3 4 5 6 7 8 9 10 11 12 13 14 15
Av
era
ge
an
nu
ali
se
d c
om
mit
ted
su
pp
ort
s
Level of function
2017-18 Q1 expected average annualised committed supports (based on revenue)
2017-18 Q1 actual average annualised committed supports
Prior Quarters expected average annualised committed supports (based on revenue)
Prior Quarters actual average annualised committed supports
32% 32%
44%54%
45%
$0m
$50m
$100m
$150m
$200m
$250m
2013-14 2014-15 2015-16 2016-17 2017-18YTD
Co
mm
itte
d s
up
po
rts
As at 30 Jun 2017: Paid As at 30 Jun 2017: Remaining
As at 30 Sep 2017: Paid As at 30 Sep 2017: Remaining
EXPERIENCE IS STILL EMERGING

September 2017 | COAG Disability Reform Council Quarterly Report 105
Providers and markets
Table E.33 Key provider indicators by quarter - QLD
Prior Quarters 2017-18 Q1 Total
Provider indicators
a) Registrations by profile
Individual/ sole trader 425 150 568
Company/ organisation 1,059 258 1,307
Total 1,484 408 1,875
b) Registration revoked 17
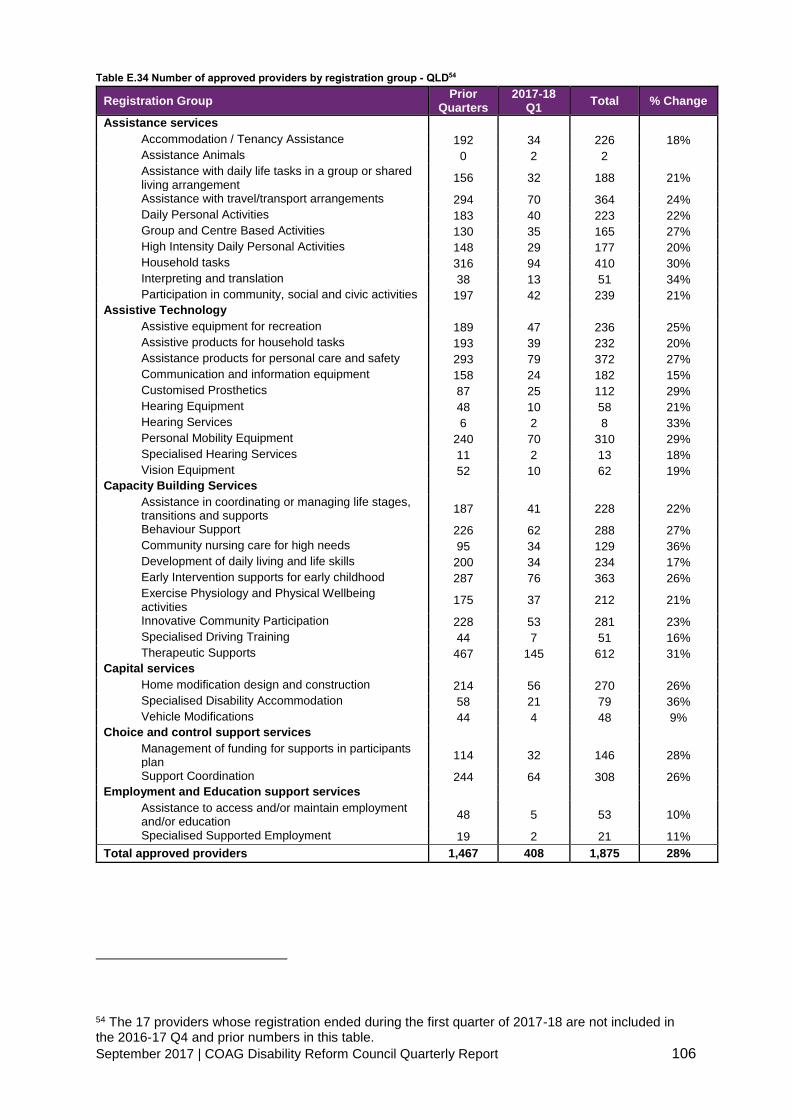
September 2017 | COAG Disability Reform Council Quarterly Report 106
Table E.34 Number of approved providers by registration group - QLD54
Registration Group Prior
Quarters 2017-18
Q1 Total % Change
Assistance services
Accommodation / Tenancy Assistance 192 34 226 18%
Assistance Animals 0 2 2
Assistance with daily life tasks in a group or shared living arrangement
156 32 188 21%
Assistance with travel/transport arrangements 294 70 364 24%
Daily Personal Activities 183 40 223 22%
Group and Centre Based Activities 130 35 165 27%
High Intensity Daily Personal Activities 148 29 177 20%
Household tasks 316 94 410 30%
Interpreting and translation 38 13 51 34%
Participation in community, social and civic activities 197 42 239 21%
Assistive Technology
Assistive equipment for recreation 189 47 236 25%
Assistive products for household tasks 193 39 232 20%
Assistance products for personal care and safety 293 79 372 27%
Communication and information equipment 158 24 182 15%
Customised Prosthetics 87 25 112 29%
Hearing Equipment 48 10 58 21%
Hearing Services 6 2 8 33%
Personal Mobility Equipment 240 70 310 29%
Specialised Hearing Services 11 2 13 18%
Vision Equipment 52 10 62 19%
Capacity Building Services
Assistance in coordinating or managing life stages, transitions and supports
187 41 228 22%
Behaviour Support 226 62 288 27%
Community nursing care for high needs 95 34 129 36%
Development of daily living and life skills 200 34 234 17%
Early Intervention supports for early childhood 287 76 363 26%
Exercise Physiology and Physical Wellbeing activities
175 37 212 21%
Innovative Community Participation 228 53 281 23%
Specialised Driving Training 44 7 51 16%
Therapeutic Supports 467 145 612 31%
Capital services
Home modification design and construction 214 56 270 26%
Specialised Disability Accommodation 58 21 79 36%
Vehicle Modifications 44 4 48 9%
Choice and control support services
Management of funding for supports in participants plan
114 32 146 28%
Support Coordination 244 64 308 26%
Employment and Education support services
Assistance to access and/or maintain employment and/or education
48 5 53 10%
Specialised Supported Employment 19 2 21 11%
Total approved providers 1,467 408 1,875 28%
54 The 17 providers whose registration ended during the first quarter of 2017-18 are not included in the 2016-17 Q4 and prior numbers in this table.

September 2017 | COAG Disability Reform Council Quarterly Report 107
Table E.35 Key markets indicators by quarter - QLD
Market indicators Prior Quarters 2017-18 Q1
a) Average number of providers per participant 1.33 1.41
b) Number of providers delivering new supports 265 329
c) Change in the number of active/inactive providers:
Active (%) 38% 41%
Not yet active (%) 61% 56%
Inactive (%) 2% 3%
d) Share of payments - top 25%
Daily Tasks/Shared Living (%) 79% 84%
Therapeutic Supports (%) 83% 83%
Participate Community (%) 79% 82%
Early Childhood Supports (%) 85% 86%
Assist Personal Activities (%) 84% 82%
Table E.36 Proportion of active participants with approved plans accessing mainstream supports - QLD
Prior Quarters 2017-18 Q1 Total
Assistive technology 1% 1% 1%
Choice & Control 2% 2% 2%
Consumables 0% 0% 0%
Daily Activities 11% 14% 12%
Daily Equipment 0% 0% 0%
Employment 2% 2% 2%
Health & Wellbeing 37% 44% 40%
Home Living 2% 2% 2%
Housing & Home modifications 0% 0% 0%
Independence 2% 3% 2%
Lifelong Learning 9% 9% 9%
Relationships 2% 2% 2%
Social & Civic 3% 2% 3%
Transport 0% 0% 0%
Non-categorised 26% 32% 28%
Any mainstream service 78% 90% 82%
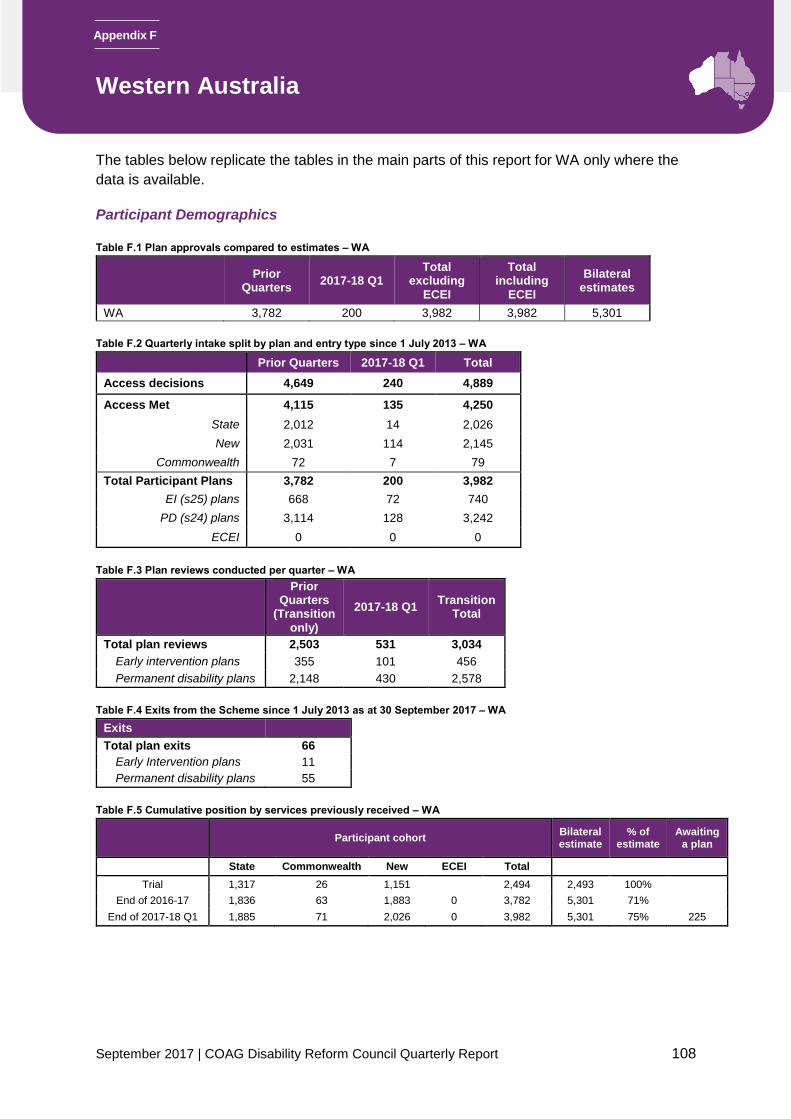
September 2017 | COAG Disability Reform Council Quarterly Report 108
Appendix F
Appendix F: Western Australia
The tables below replicate the tables in the main parts of this report for WA only where the
data is available.
Participant Demographics
Table F.1 Plan approvals compared to estimates – WA
Prior
Quarters 2017-18 Q1
Total excluding
ECEI
Total including
ECEI
Bilateral estimates
WA 3,782 200 3,982 3,982 5,301
Table F.2 Quarterly intake split by plan and entry type since 1 July 2013 – WA
Prior Quarters 2017-18 Q1 Total
Access decisions 4,649 240 4,889
Access Met 4,115 135 4,250
State 2,012 14 2,026
New 2,031 114 2,145
Commonwealth 72 7 79
Total Participant Plans 3,782 200 3,982
EI (s25) plans 668 72 740
PD (s24) plans 3,114 128 3,242
ECEI 0 0 0
Table F.3 Plan reviews conducted per quarter – WA
Prior Quarters
(Transition only)
2017-18 Q1 Transition
Total
Total plan reviews 2,503 531 3,034
Early intervention plans 355 101 456
Permanent disability plans 2,148 430 2,578
Table F.4 Exits from the Scheme since 1 July 2013 as at 30 September 2017 – WA
Exits
Total plan exits 66
Early Intervention plans 11
Permanent disability plans 55
Table F.5 Cumulative position by services previously received – WA
Participant cohort Bilateral estimate
% of estimate
Awaiting a plan
State Commonwealth New ECEI Total
Trial 1,317 26 1,151 2,494 2,493 100%
End of 2016-17 1,836 63 1,883 0 3,782 5,301 71%
End of 2017-18 Q1 1,885 71 2,026 0 3,982 5,301 75% 225

September 2017 | COAG Disability Reform Council Quarterly Report 109
Table F.6 Cumulative position by entry into the Scheme – WA
Participant cohort Bilateral estimate
% of estimate
Awaiting a plan
EI (s25) plan PD (s24) plan ECEI Total
Trial 363 2,131 2,494 2,493 100%
End of 2016-17 668 3,114 0 3,782 5,301 71%
End of 2017-18 Q1 740 3,242 0 3,982 5,301 75% 225
Table F.7 Active participants with approved plans per quarter by disability group - WA55
Prior Quarters 2017-18 Q1 Total
Disability N % N % N %
Intellectual Disability 910 24% 31 16% 941 24%
Autism 1,203 32% 62 31% 1,265 32%
Psychosocial disability 293 8% 5 3% 298 8%
Cerebral Palsy 190 5% 18 9% 208 5%
Developmental Delay 128 3% 14 7% 142 4%
Other Neurological 170 5% 6 3% 176 4%
Other Physical 161 4% 5 3% 166 4%
Acquired Brain Injury 99 3% 12 6% 111 3%
Hearing Impairment 70 2% 9 5% 79 2%
Other Sensory/Speech 77 2% 5 3% 82 2%
Visual Impairment 69 2% 4 2% 73 2%
Multiple Sclerosis 97 3% 5 3% 102 3%
Global Developmental Delay 132 4% 17 9% 149 4%
Spinal Cord Injury 46 1% 3 2% 49 1%
Stroke 42 1% 4 2% 46 1%
Other 29 1% 0 0% 29 1%
Total 3,716 100% 200 100% 3,916 100%
Table F.8 Active participants with approved plan per quarter by level of function – WA
Prior Quarters 2017-18 Q1 Total
Level of Function N % N % N %
1 (High Function) 12 0% 2 1% 14 0%
2 (High Function) 15 0% 2 1% 17 0%
3 (High Function) 245 7% 9 5% 254 7%
4 (High Function) 228 7% 18 9% 246 7%
5 (High Function) 877 25% 54 27% 931 26%
6 (Moderate Function) 447 13% 42 21% 489 13%
7 (Moderate Function) 297 9% 17 9% 314 9%
8 (Moderate Function) 249 7% 9 5% 258 7%
9 (Moderate Function) 27 1% 2 1% 29 1%
10 (Moderate Function) 309 9% 6 3% 315 9%
11 (Low Function) 178 5% 5 3% 183 5%
12 (Low Function) 292 8% 16 8% 308 8%
13 (Low Function) 194 6% 11 6% 205 6%
14 (Low Function) 72 2% 7 4% 79 2%
15 (Low Function) 0 0% 0 0% 0 0%
Missing 274 0 274
Total 3,716 100% 200 100% 3,916 100%
55 Table order based on national proportions (highest to lowest)

September 2017 | COAG Disability Reform Council Quarterly Report 110
Table F.9 Participant profile per quarter by Age group – WA
Prior Quarters 2017-18 Q1 Total
Age Group N % N % N %
0 to 6 501 13% 69 35% 570 15%
7 to 14 969 26% 41 21% 1,010 26%
15 to 18 345 9% 8 4% 353 9%
19 to 24 312 8% 7 4% 319 8%
25 to 34 378 10% 17 9% 395 10%
35 to 44 304 8% 13 7% 317 8%
45 to 54 402 11% 21 11% 423 11%
55 to 64 431 12% 22 11% 453 12%
65+ 74 2% 2 1% 76 2%
Total 3,716 100% 200 100% 3,916 100%
Table F.10 Participant profile per quarter by Gender – WA
Prior Quarters 2017-18 Q1 Total
Gender N % N % N %
Male 2,422 65% 135 68% 2,557 65%
Female 1,277 34% 62 31% 1,339 34%
Indeterminate 17 0% 3 2% 20 1%
Total 3,716 100% 200 100% 3,916 100%
Table F.11 Participant profile per quarter by Aboriginal and Torres Strait islander status – WA
Prior Quarters 2017-18 Q1 Total
Participant profile N % N % N %
Aboriginal and Torres Strait Islander
155 4.2% 9 4.5% 164 4.2%
Not Aboriginal and Torres Strait Islander
3,502 94.2% 186 93.0% 3,688 94.2%
Not Stated 59 1.6% 5 2.5% 64 1.6%
Total 3,716 100% 200 100% 3,916 100%
Table F.12 Participant profile per quarter by culturally and linguistically diverse (CALD) status – WA
Prior Quarters 2017-18 Q1 Total
Participant profile N % N % N %
CALD 186 5.0% 25 12.5% 211 5.4%
Not CALD 3,431 92.3% 175 87.5% 3,606 92.1%
Not Stated 99 2.7% 0 0.0% 99 2.5%
Total 3,716 100% 200 100% 3,916 100%
Table F.13 Participant profile per quarter by Young people in Residential aged care (YPIRAC) status – WA
Prior Quarters 2017-18 Q1 Total
Participant profile N % N % N %
YPIRAC 12 0.3% 0 0.0% 12 0.3%
Not YPIRAC 3,704 99.7% 200 100.0% 3,904 99.7%
Total 3,716 100% 200 100% 3,916 100%
Table F.14 Distribution of active participants by method of Financial Plan Management and quarter of plan approval –
WA
Prior Quarters
(Transition only) 2017-18 Q1 Total
Self-managed fully 9% 11% 9%
Self-managed partly 15% 17% 15%
Plan managed 7% 6% 7%
Agency managed 69% 66% 68%
Total 100% 100% 100%

September 2017 | COAG Disability Reform Council Quarterly Report 111
Table F.15 Distribution of active participants by support coordination and quarter of plan approval – WA
Prior Quarters
(Transition only) 2017-18 Q1 Total
Support coordination 81% 74% 79%
Table F.16 Duration to plan activation by quarter of initial plan approval for active participants – WA
2016-17 Q1 2016-17 Q2 2016-17 Q3 2016-17 Q4
Plan activation N % N % N % N %
Less than 30 days 82 52% 161 54% 295 61% 201 59%
30 to 59 days 25 16% 40 13% 50 10% 35 10%
60 to 89 days 9 6% 17 6% 35 7% 23 7%
Activated within 90 days
116 74% 218 73% 380 78% 259 76%
90 to 119 days 5 3% 20 7% 27 6% 7 2%
120 days and over 20 13% 33 11% 14 3% 0 0%
Activated between 90 and 180 days
25 16% 53 18% 41 8% 7 2%
No payments 16 10% 28 9% 64 13% 75 22%
Total plans approved 157 100% 299 100% 485 100% 341 100%
Table F.17 Number of questionnaires completed by SFOF version – WA
Version Number of questionnaires
collected 2016-17 Number of questionnaires
collected Q1 2017-18 Number of questionnaires
Participant 0 to school 308 66 374
Participant school to 14 286 43 329
Participant 15 to 24 147 12 159
Participant 25 and over 516 71 587
Total Participant 1,257 192 1,449
Family 0 to 14 574 108 682
Family 15 to 24 41 8 49
Family 25 and over 23 12 35
Total Family 638 128 766
Total 1,895 320 2,215

September 2017 | COAG Disability Reform Council Quarterly Report 112
Table F.18 Selected key indicators for participants – Daily Living (DL) and Choice and Control (CC) – WA
Indicator 0 to before
school School to 14
15 to 24 25 and over
DL
% with concerns in 6 or more of the areas: gross motor skills, fine motor skills, self-care, eating, social interaction, communication, cognitive development, sensory processing
59%
CC % who say their child is able to tell them what he/she wants
74%
DL % developing functional, learning and coping skills appropriate to their ability and circumstances
34%
DL % who say their child is becoming more independent
55%
CC % of children who have a genuine say in decisions about themselves
71%
CC % who are happy with the level of independence/control they have now
54%
CC % who choose who supports them 33% 54%
CC % who choose what they do each day 52% 69%
CC % who had been given the opportunity to participate in a self-advocacy group meeting
29% 31%
CC % who want more choice and control in their life
65% 53%
Table F.19 Selected key indicators for participants – Relationships (REL) and Social/ Community Participation (S/CP) –
WA
Indicator 0 to before
school School to
14 15 to 24
25 and over
REL % of children who can make friends with people outside the family
61% 71%
S/CP % of children who participate in age appropriate community, cultural or religious activities
43%
REL % of children who spend time after school and on weekends with friends and/or in mainstream programs
46%
REL Of these, % who are welcomed or actively included
71% 74%
REL % of children who spend time with friends without an adult present
22%
REL % with no friends other than family or paid staff
34% 32%
S/CP % who have been actively involved in a community, cultural or religious group in the last 12 months
36% 39%

September 2017 | COAG Disability Reform Council Quarterly Report 113
Table F.20 Selected key indicators for participants – Lifelong Learning (LL), Work (WK), Home (HM) and Health and
Wellbeing (HW) – WA
Indicator 0 to before
school School to
14 15 to 24
25 and over
LL % of children attending school in a mainstream class
69%
HM % who are happy with their home 83% 78%
HM % who feel safe or very safe in their home
88% 78%
HW % who rate their health as good, very good or excellent
67% 48%
HW % who did not have any difficulties accessing health services
70% 78%
LL % who currently attend or previously attended school in a mainstream class
40%
LL % who participate in education, training or skill development
12%
LL Of those who participate, % who do so in mainstream settings
66%
LL % unable to do a course or training they wanted to do in the last 12 months
34%
WK % who have a paid job 17% 27%
WK % who volunteer 19% 13%

September 2017 | COAG Disability Reform Council Quarterly Report 114
Table F.21 Selected key indicators for families/ carers of participants – WA
Indicator 0 to 14 15 to 24 25 and over
% receiving Carer Payment 16% 6% 14%
% receiving Carer Allowance 42% 31% 14%
% working in a paid job 46% 59% 26%
Of those in a paid job, % in permanent employment
77% 71% Numbers are too
small
Of those in a paid job, % working 15 hours or more
79% 75% Numbers are too
small
% who say they (and their partner) are able to work as much as they want
44% 60% 57%
Of those unable to work as much as they want, % who say the situation of their child/family member with disability is a barrier to working more
84% Numbers are too
small Numbers are too
small
Of those unable to work as much as they want, % who say insufficient flexibility of jobs is a barrier to working more
39% Numbers are too
small Numbers are too
small
% able to advocate for their child/family member
82% 72% 81%
% who have friends and family they see as often as they like
54% 65% 66%
% who feel very confident or somewhat confident in supporting their child's development
86%
% who know what their family can do to enable their family member with disability to become as independent as possible
30%
% who feel in control selecting services 38% 53%
% who have made plans (or begun to make plans) for when they are no longer able to care for their family member with disability
32%
% who rate their health as good, very good or excellent
74% 64% 67%
Table F.22 Results for “Has the NDIS helped?” questions answered at review, for SFOF version ‘Participant 0 to
school’ (n=35) – WA
Question Yes
DL Has the NDIS improved your child's development? 97%
DL Has the NDIS improved your child's access to specialist services? 97%
CC Has the NDIS helped increase your child's ability to communicate what they want?
94%
REL Has the NDIS improved how your child fits into family life? 83%
S/CP Has the NDIS improved how your child fits into community life? 70%

September 2017 | COAG Disability Reform Council Quarterly Report 115
Table F.23 Results for “Has the NDIS helped?” questions answered at review, for SFOF version ‘Participant school to
14’ (n=17) – WA
Question Yes
DL Has the NDIS helped your child to become more independent?
Numbers
are too
small
LL Has the NDIS improved your child's access to education?
Numbers
are too
small
REL Has the NDIS improved your child's relationships with family and friends?
Numbers
are too
small
S/CP Has the NDIS improved your child's social and recreational life?
Numbers
are too
small
Table F.24 Results for “Has the NDIS helped?” questions answered at review, for SFOF versions ‘Participant 15 to 24’
(n=11) and ‘Participant 25 and over’ (n=38) – WA
Question 15 to 24 % Yes
25+ % Yes
CC Has the NDIS helped you have more choices and more control over your life?
Numbers
are too
small
71%
DL Has the NDIS helped you with daily living activities?
Numbers
are too
small
71%
REL Has the NDIS helped you to meet more people?
Numbers
are too
small
37%
HM Has your involvement with the NDIS helped you to choose a home that's right for you?
Numbers
are too
small
16%
HW Has your involvement with the NDIS improved your health and wellbeing?
Numbers
are too
small
47%
LL Had your involvement with the NDIS helped you to learn things you want to learn or to take courses you want to take?
Numbers
are too
small
21%
WK Has your involvement with the NDIS helped you find a job that's right for you?
Numbers
are too
small
13%
S/CP Has the NDIS helped you be more involved?
Numbers
are too
small
66%

September 2017 | COAG Disability Reform Council Quarterly Report 116
Table F.25 Results for “Has the NDIS helped?” questions answered at review, for SFOF version ‘Family 0 to 14’ (n=52);
and for SFOF versions ‘Family 15 to 24’ and ‘Family 25 and over’ combined (n=6) – WA
Question 0 to 14 % Yes
15+ % Yes
Has the NDIS improved your capacity to advocate (stand up) for your child? / Has the NDIS helped you to know your rights and advocate effectively?
73%
Numbers
are too
small
Has the NDIS improved the level of support for your family? 94%
Numbers
are too
small
Has the NDIS improved your access to services, programs and activities in the community?
87%
Numbers
are too
small
Has the NDIS improved your ability/capacity to help your child develop and learn?
87%
Has the NDIS improved your health and wellbeing? 69%
Numbers
are too
small
Figure F.1 Proportion of participants describing satisfaction with the Agency planning process as good or very good –
by quarter (WA)56
56 Participant satisfaction results are not shown if there is insufficient data in the group.
91%95%
82%85%
93% 92%
73%
86%
0%
10%
20%
30%
40%
50%
60%
70%
80%
90%
100%
Q3 14-15 Q4 14-15 Q1 15-16 Q2 15-16 Q3 15-16 Q4 15-16 Q1 16-17 Q2 16-17 Q3 16-17 Q4 16-17 Q1 17-18
Pro
po
rtio
n o
f P
art
icip
ants
%
Quarter

September 2017 | COAG Disability Reform Council Quarterly Report 117
Table F.26 Proportion of Participants rating their level of agreement as strongly agree, agree, neutral, disagree or
strongly disagree in response to statements about the planning process – WA
WA Very good
Good Neutral Poor Very Poor
Overall, how would you rate your experience with the planning process today?
48% 38% 10% 0% 5%
1. The planner listened to me 43% 52% 0% 5% 0%
2. I had enough time to tell my story and say what support I need
52% 38% 0% 10% 0%
3. The planner knows what I can do well 29% 52% 10% 5% 5%
4. The planner had some good ideas for my plan
33% 48% 10% 5% 5%
5. I know what is in my plan 38% 38% 14% 10% 0%
6. The planner helped me think about my future
10% 43% 38% 5% 5%
7. I think my plan will make my life better 38% 38% 24% 0% 0%
8. The planning meeting went well 29% 57% 5% 5% 5%
Table F.27 Plan reviews conducted by quarter – excluding plans less than 30 days – WA
Prior Quarters (Transition only)
2017-18 Q1 Transition Total
Total scheduled plan reviews 1,636 388 2,024
Trial participants 1,621 257 1,878
Transition participants 15 131 146
Table F.28 Plan reviews conducted by quarter – excluding plans less than 30 days – WA
Prior Quarters (Transition only)
2017-18 Q1 Transition Total
Total unscheduled plan reviews 867 143 1,010
Trial participants 799 104 903
Transition participants 68 39 107
Table F.29 Estimated rate of unscheduled plan reviews – excluding plans less than 30 days – WA57
Prior Quarters
(Transition only)
2017-18 Q1 Transition
Total
% unscheduled reviews 28.5% 14.7% 25.2%
Table F.30 AAT cases by category – WA
Prior
Quarters 2017-18 Q1 Total
AAT Cases 10 5 15
Access 6 1 7
Plan 4 4 8
Plan Review 0 0 0
Other 0 0 0
57 The number of participants used in the calculation considers the length of time the participants have been in the Scheme.

September 2017 | COAG Disability Reform Council Quarterly Report 118
Committed supports and payments
Table F.31 Committed supports by financial year ($m) - WA
2013-14 2014-15 2015-16 2016-17 2017-18 2018-19
and beyond
Total
Total Committed
- 18.9 69.2 170.0 146.8 3.9 408.8

September 2017 | COAG Disability Reform Council Quarterly Report 119
Figure F.2 Distribution of participants by annualised committed support band (including participants with shared
supported accommodation supports) – active participants with initial plan approvals 2017-18 Q1 compared with active
participants with initial plan approvals in prior quarters (WA)
Figure F.3 Distribution of participants by annualised committed support band (excluding participants with shared
supported accommodation supports) – active participants with initial plan approvals 2017-18 Q1 compared with active
participants with initial plan approvals in prior quarters (WA)
0.00%
5.00%
10.00%
15.00%
20.00%
25.00%
30.00%
35.00%
Dis
trib
uti
on
o
f p
art
icip
an
ts
Average annualised committed supports band
Prior Quarters distribution of participants 2017-18 Q1 distribution of participants
0.00%
5.00%
10.00%
15.00%
20.00%
25.00%
30.00%
35.00%
40.00%
Dis
trib
uti
on
o
f p
art
icip
an
ts
Average annualised committed supports band
Prior Quarters distribution of participants 2017-18 Q1 distribution of participants
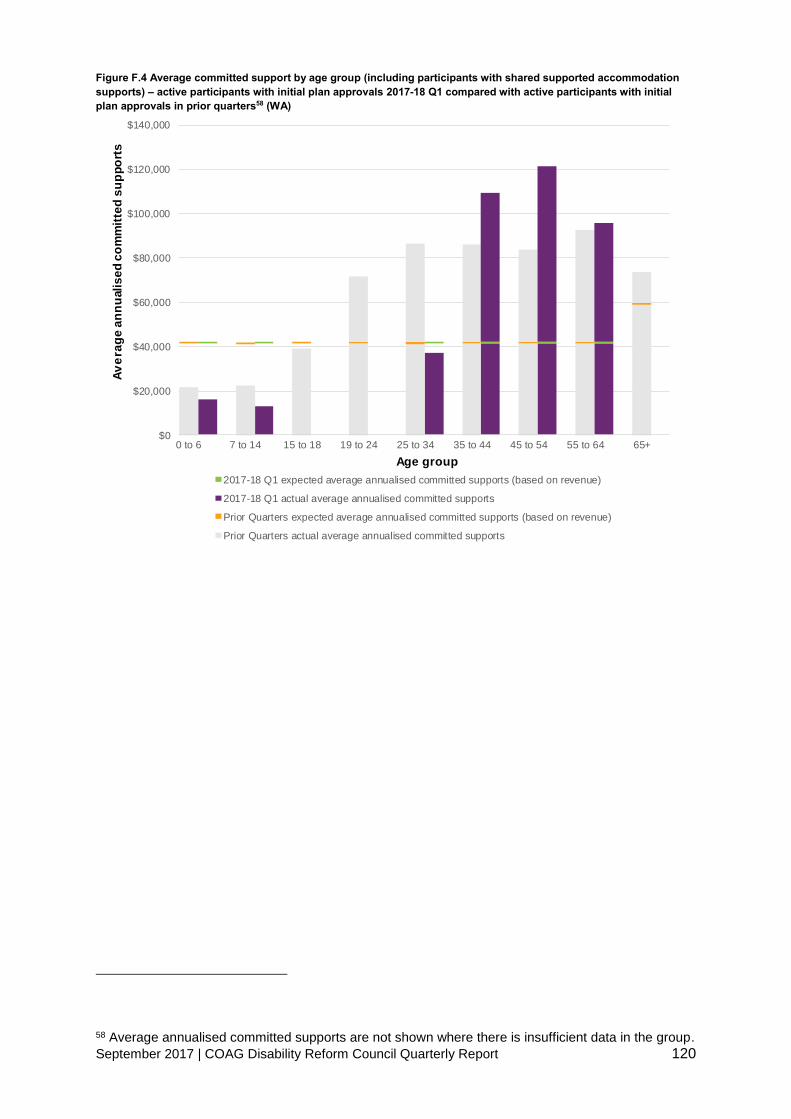
September 2017 | COAG Disability Reform Council Quarterly Report 120
Figure F.4 Average committed support by age group (including participants with shared supported accommodation
supports) – active participants with initial plan approvals 2017-18 Q1 compared with active participants with initial
plan approvals in prior quarters58 (WA)
58 Average annualised committed supports are not shown where there is insufficient data in the group.
$0
$20,000
$40,000
$60,000
$80,000
$100,000
$120,000
$140,000
0 to 6 7 to 14 15 to 18 19 to 24 25 to 34 35 to 44 45 to 54 55 to 64 65+
Av
era
ge
an
nu
ali
se
d c
om
mit
ted
su
pp
ort
s
Age group
2017-18 Q1 expected average annualised committed supports (based on revenue)
2017-18 Q1 actual average annualised committed supports
Prior Quarters expected average annualised committed supports (based on revenue)
Prior Quarters actual average annualised committed supports
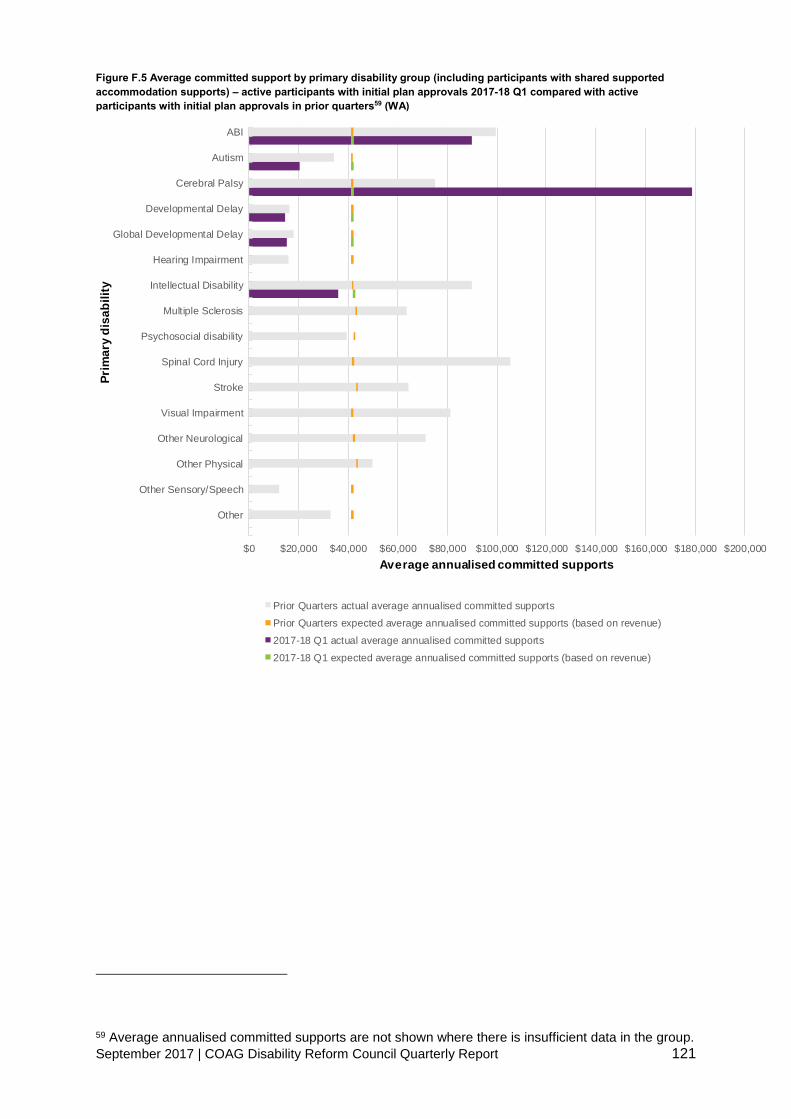
September 2017 | COAG Disability Reform Council Quarterly Report 121
Figure F.5 Average committed support by primary disability group (including participants with shared supported
accommodation supports) – active participants with initial plan approvals 2017-18 Q1 compared with active
participants with initial plan approvals in prior quarters59 (WA)
59 Average annualised committed supports are not shown where there is insufficient data in the group.
$0 $20,000 $40,000 $60,000 $80,000 $100,000 $120,000 $140,000 $160,000 $180,000 $200,000
ABI
Autism
Cerebral Palsy
Developmental Delay
Global Developmental Delay
Hearing Impairment
Intellectual Disability
Multiple Sclerosis
Psychosocial disability
Spinal Cord Injury
Stroke
Visual Impairment
Other Neurological
Other Physical
Other Sensory/Speech
Other
Average annualised committed supports
Pri
ma
ry d
isa
bil
ity
Prior Quarters actual average annualised committed supports
Prior Quarters expected average annualised committed supports (based on revenue)
2017-18 Q1 actual average annualised committed supports
2017-18 Q1 expected average annualised committed supports (based on revenue)

September 2017 | COAG Disability Reform Council Quarterly Report 122
Figure F.6 Average committed support by level of function (including participants with shared supported
accommodation supports) – active participants with initial plan approvals 2017-18 Q1 compared with active
participants with initial plan approvals in prior quarters60 (WA)
Table F.32 Payments by financial year, compared to committed supports ($m) – WA
2013-14 2014-15 2015-16 2016-17 2017-18 2018-19 and
beyond Total
Total Committed - 18.9 69.2 170.0 146.8 3.9 408.8
Total Paid - 10.9 50.9 127.0 28.5 - 217.3
% utilised to date - 58% 74% 75% - - 70%61
Figure F.7 Utilisation of committed supports as at 30 June 2017 and 30 September 2017 (WA)
60 Average annualised committed supports are not shown where there is insufficient data in the group. Level of function 15 does not have sufficient data to show an average cost. 61 Note: Only committed supports expected to be used to 30 September 2017 have been used to calculate the utilisation from 1 July 2013 to date.
$0
$20,000
$40,000
$60,000
$80,000
$100,000
$120,000
$140,000
$160,000
1 2 3 4 5 6 7 8 9 10 11 12 13 14 15
Av
era
ge
an
nu
ali
se
d c
om
mit
ted
su
pp
ort
s
Level of function
2017-18 Q1 expected average annualised committed supports (based on revenue)
2017-18 Q1 actual average annualised committed supports
Prior Quarters expected average annualised committed supports (based on revenue)
Prior Quarters actual average annualised committed supports
58% 58%
75% 74%
77% 75%
54%
$0m
$20m
$40m
$60m
$80m
$100m
$120m
$140m
$160m
$180m
2013-14 2014-15 2015-16 2016-17 2017-18YTD
Co
mm
itte
d s
up
po
rts
As at 30 Jun 2017: Paid As at 30 Jun 2017: Remaining
As at 30 Sep 2017: Paid As at 30 Sep 2017: Remaining
EXPERIENCE IS STILL EMERGING

September 2017 | COAG Disability Reform Council Quarterly Report 123
Providers and markets
Table F.33 Key provider indicators by quarter - WA
Prior Quarters 2017-18 Q1 Total
Provider indicators
a) Registrations by profile
Individual/ sole trader 161 14 169
Company/ organisation 595 93 681
Total 756 107 850
b) Registration revoked 13

September 2017 | COAG Disability Reform Council Quarterly Report 124
Table F.34 Number of approved providers by registration group - WA62
Registration Group Prior
Quarters 2017-18
Q1 Total % Change
Assistance services
Accommodation / Tenancy Assistance 70 8 78 11%
Assistance Animals 0 2 2
Assistance with daily life tasks in a group or shared living arrangement
56 3 59 5%
Assistance with travel/transport arrangements 114 18 132 16%
Daily Personal Activities 59 5 64 8%
Group and Centre Based Activities 54 1 55 2%
High Intensity Daily Personal Activities 65 3 68 5%
Household tasks 119 14 133 12%
Interpreting and translation 34 10 44 29%
Participation in community, social and civic activities 87 2 89 2%
Assistive Technology
Assistive equipment for recreation 116 27 143 23%
Assistive products for household tasks 98 19 117 19%
Assistance products for personal care and safety 204 44 248 22%
Communication and information equipment 84 14 98 17%
Customised Prosthetics 70 8 78 11%
Hearing Equipment 42 4 46 10%
Hearing Services 8 1 9 13%
Personal Mobility Equipment 165 38 203 23%
Specialised Hearing Services 17 1 18 6%
Vision Equipment 44 2 46 5%
Capacity Building Services
Assistance in coordinating or managing life stages, transitions and supports
72 5 77 7%
Behaviour Support 79 5 84 6%
Community nursing care for high needs 50 7 57 14%
Development of daily living and life skills 78 4 82 5%
Early Intervention supports for early childhood 76 5 81 7%
Exercise Physiology and Physical Wellbeing activities
64 4 68 6%
Innovative Community Participation 60 16 76 27%
Specialised Driving Training 53 0 53 0%
Therapeutic Supports 188 15 203 8%
Capital services
Home modification design and construction 96 15 111 16%
Specialised Disability Accommodation 11 4 15 36%
Vehicle Modifications 30 3 33 10%
Choice and control support services
Management of funding for supports in participants plan
34 2 36 6%
Support Coordination 45 4 49 9%
Employment and Education support services
Assistance to access and/or maintain employment and/or education
49 1 50 2%
Specialised Supported Employment 22 0 22 0%
Total approved providers 743 107 850 14%
62 The 13 providers whose registration ended during the first quarter of 2017-18 are not included in the 2016-17 Q4 and prior numbers in this table.
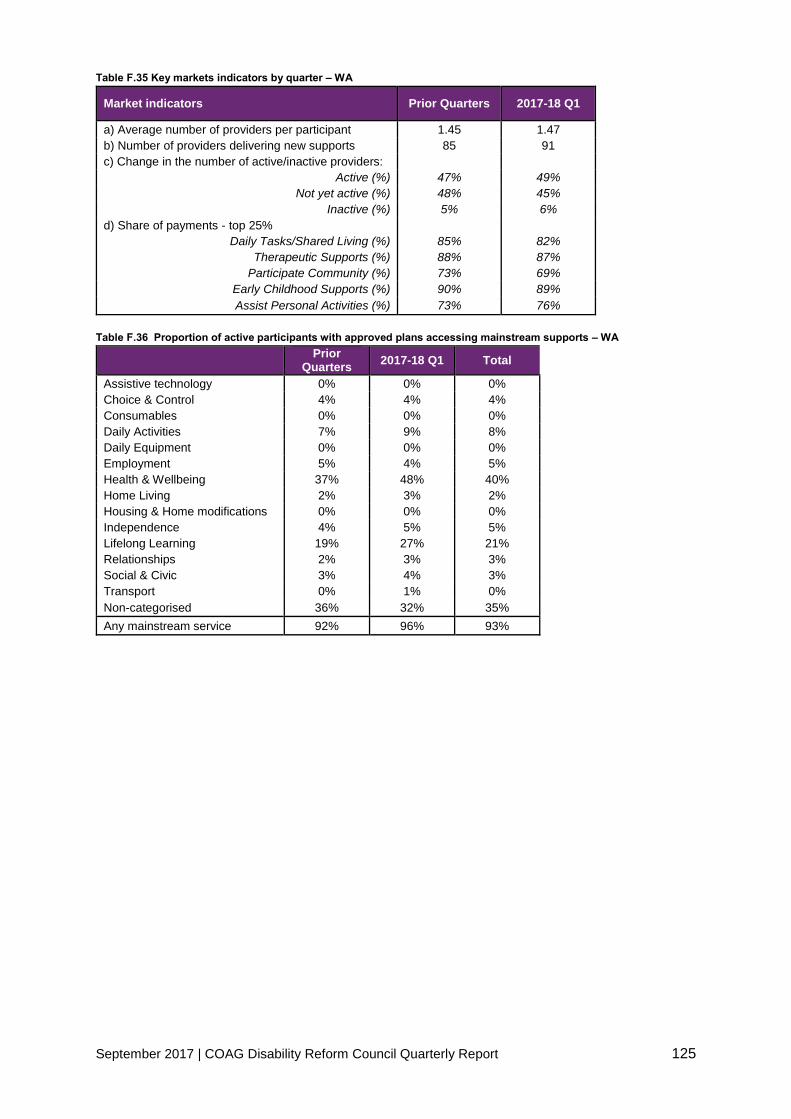
September 2017 | COAG Disability Reform Council Quarterly Report 125
Table F.35 Key markets indicators by quarter – WA
Market indicators Prior Quarters 2017-18 Q1
a) Average number of providers per participant 1.45 1.47
b) Number of providers delivering new supports 85 91
c) Change in the number of active/inactive providers:
Active (%) 47% 49%
Not yet active (%) 48% 45%
Inactive (%) 5% 6%
d) Share of payments - top 25%
Daily Tasks/Shared Living (%) 85% 82%
Therapeutic Supports (%) 88% 87%
Participate Community (%) 73% 69%
Early Childhood Supports (%) 90% 89%
Assist Personal Activities (%) 73% 76%
Table F.36 Proportion of active participants with approved plans accessing mainstream supports – WA
Prior
Quarters 2017-18 Q1 Total
Assistive technology 0% 0% 0%
Choice & Control 4% 4% 4%
Consumables 0% 0% 0%
Daily Activities 7% 9% 8%
Daily Equipment 0% 0% 0%
Employment 5% 4% 5%
Health & Wellbeing 37% 48% 40%
Home Living 2% 3% 2%
Housing & Home modifications 0% 0% 0%
Independence 4% 5% 5%
Lifelong Learning 19% 27% 21%
Relationships 2% 3% 3%
Social & Civic 3% 4% 3%
Transport 0% 1% 0%
Non-categorised 36% 32% 35%
Any mainstream service 92% 96% 93%

September 2017 | COAG Disability Reform Council Quarterly Report 126
Appendix G
Appendix G: South Australia
The tables below replicate the tables in the main parts of this report for SA only where the
data is available.
Participant Demographics
Table G.1 Plan approvals compared to estimates – SA
Prior
Quarters 2017-18 Q1
Total excluding
ECEI
Total including
ECEI
Bilateral estimates
SA 11,632 1,359 12,991 13,223 13,968
Table G.2 Quarterly intake split by plan and entry type since 1 July 2013 – SA
Prior Quarters 2017-18 Q1 Total
Access decisions 15,674 2,534 18,208
Access Met 14,843 2,259 17,102
State 5,663 1,482 7,145
New 8,579 496 9,075
Commonwealth 601 281 882
Total Participant Plans 12,112 1,591 13,223
EI (s25) plans 7,588 349 7,937
PD (s24) plans 4,044 1,010 5,054
ECEI 480 232 232
Table G.3 Plan reviews conducted per quarter – SA
Prior Quarters
(Transition only)
2017-18 Q1 Transition
Total
Total plan reviews 6,700 1,882 8,582
Early intervention plans 4,511 1,208 5,719
Permanent disability plans 2,189 674 2,863
Table G.4 Exits from the Scheme since 1 July 2013 as at 30 September 2017 – SA
Exits
Total plan exits 251
Early Intervention plans 226
Permanent disability plans 25
Table G.5 Cumulative position by services previously received – SA
Participant cohort Bilateral estimate
% of estimate
Awaiting a plan
State Commonwealth New ECEI Total
Trial 2,480 291 4,347 7,118 8,500 84%
End of 2016-17 3,844 318 7,470 480 12,112 12,887 94%
End of 2017-18 Q1 4,554 466 7,971 232 13,223 13,968 95% 3,825

September 2017 | COAG Disability Reform Council Quarterly Report 127
Table G.6 Cumulative position by entry into the Scheme – SA
Participant cohort Bilateral estimate
% of estimate
Awaiting a plan
EI (s25) plan PD (s24) plan ECEI Total
Trial 5,114 2,004 7,118 8,500 84%
End of 2016-17 7,588 4,044 480 12,112 12,887 94%
End of 2017-18 Q1 7,937 5,054 232 13,223 13,968 95% 3,825
Table G.7 Active participants with approved plans per quarter by disability group - SA63
Prior Quarters 2017-18 Q1 Total
Disability N % N % N %
Intellectual Disability 1,654 15% 383 28% 2,037 16%
Autism 5,559 49% 416 31% 5,975 47%
Psychosocial disability 29 0% 24 2% 53 0%
Cerebral Palsy 411 4% 50 4% 461 4%
Developmental Delay 1,063 9% 91 7% 1,154 9%
Other Neurological 230 2% 63 5% 293 2%
Other Physical 190 2% 73 5% 263 2%
Acquired Brain Injury 68 1% 62 5% 130 1%
Hearing Impairment 304 3% 20 1% 324 3%
Other Sensory/Speech 954 8% 44 3% 998 8%
Visual Impairment 115 1% 39 3% 154 1%
Multiple Sclerosis 4 0% 30 2% 34 0%
Global Developmental Delay 478 4% 40 3% 518 4%
Spinal Cord Injury 7 0% 9 1% 16 0%
Stroke 8 0% 13 1% 21 0%
Other 307 3% 2 0% 309 2%
Total 11,381 100% 1,359 100% 12,740 100%
Table G.8 Active participants with approved plan per quarter by level of function – SA
Prior Quarters 2017-18 Q1 Total
Level of Function N % N % N %
1 (High Function) 57 1% 4 0% 61 1%
2 (High Function) 0 0% 0 0% 0 0%
3 (High Function) 216 2% 75 6% 291 2%
4 (High Function) 931 9% 55 4% 986 8%
5 (High Function) 4,523 42% 258 19% 4,781 40%
6 (Moderate Function) 1,523 14% 310 23% 1,833 15%
7 (Moderate Function) 1,354 13% 80 6% 1,434 12%
8 (Moderate Function) 95 1% 112 8% 207 2%
9 (Moderate Function) 3 0% 9 1% 12 0%
10 (Moderate Function) 56 1% 178 13% 234 2%
11 (Low Function) 926 9% 64 5% 990 8%
12 (Low Function) 114 1% 147 11% 261 2%
13 (Low Function) 742 7% 46 3% 788 7%
14 (Low Function) 116 1% 21 2% 137 1%
15 (Low Function) 0 0% 0 0% 0 0%
Missing 725 0 725
Total 11,381 100% 1,359 100% 12,740 100%
63 Table order based on national proportions (highest to lowest)

September 2017 | COAG Disability Reform Council Quarterly Report 128
Table G.9 Participant profile per quarter by Age group – SA
Prior Quarters 2017-18 Q1 Total
Age Group N % N % N %
0 to 6 3,145 28% 305 22% 3,450 27%
7 to 14 6,875 60% 213 16% 7,088 56%
15 to 18 1,326 12% 148 11% 1,474 12%
19 to 24 4 0% 158 12% 162 1%
25 to 34 12 0% 146 11% 158 1%
35 to 44 7 0% 120 9% 127 1%
45 to 54 7 0% 133 10% 140 1%
55 to 64 4 0% 129 9% 133 1%
65+ 1 0% 7 1% 8 0%
Total 11,381 100% 1,359 100% 12,740 100%
Table G.10 Participant profile per quarter by Gender – SA
Prior Quarters 2017-18 Q1 Total
Gender N % N % N %
Male 8,073 71% 873 64% 8,946 70%
Female 3,260 29% 473 35% 3,733 29%
Indeterminate 48 0% 13 1% 61 0%
Total 11,381 100% 1,359 100% 12,740 100%
Table G.11 Participant profile per quarter by Aboriginal and Torres Strait islander status – SA
Prior Quarters 2017-18 Q1 Total
Participant profile N % N % N %
Aboriginal and Torres Strait Islander
548 4.8% 49 3.6% 597 4.7%
Not Aboriginal and Torres Strait Islander
10,063 88.4% 1,275 93.8% 11,338 89.0%
Not Stated 770 6.8% 35 2.6% 805 6.3%
Total 11,381 100% 1,359 100% 12,740 100%
Table G.12 Participant profile per quarter by culturally and linguistically diverse (CALD) status – SA
Prior Quarters 2017-18 Q1 Total
Participant profile N % N % N %
CALD 300 2.6% 97 7.1% 397 3.1%
Not CALD 10,818 95.1% 1,261 92.8% 12,079 94.8%
Not Stated 263 2.3% 1 0.1% 264 2.1%
Total 11,381 100% 1,359 100% 12,740 100%
Table G.13 Participant profile per quarter by Young people in Residential aged care (YPIRAC) status – SA
Prior Quarters 2017-18 Q1 Total
Participant profile N % N % N %
YPIRAC 0 0.0% 0 0.0% 0 0.0%
Not YPIRAC 11,381 100.0% 1,359 100.0% 12,740 100.0%
Total 11,381 100% 1,359 100% 12,740 100%

September 2017 | COAG Disability Reform Council Quarterly Report 129
Table G.14 Distribution of active participants by method of Financial Plan Management and quarter of plan approval –
SA
Prior Quarters
(Transition only) 2017-18 Q1 Total
Self-managed fully 12% 11% 12%
Self-managed partly 15% 14% 15%
Plan managed 10% 11% 11%
Agency managed 63% 64% 63%
Total 100% 100% 100%
Table G.15 Distribution of active participants by support coordination and quarter of plan approval – SA
Prior Quarters
(Transition only) 2017-18 Q1 Total
Support coordination 63% 31% 52%
Table G.16 Duration to plan activation by quarter of initial plan approval for active participants – SA
2016-17 Q1 2016-17 Q2 2016-17 Q3 2016-17 Q4
Plan activation N % N % N % N %
Less than 30 days 311 42% 792 34% 383 45% 200 34%
30 to 59 days 100 13% 335 14% 115 14% 97 17%
60 to 89 days 45 6% 282 12% 49 6% 37 6%
Activated within 90 days
456 61% 1,409 61% 547 64% 334 57%
90 to 119 days 22 3% 164 7% 44 5% 14 2%
120 days and over 106 14% 305 13% 60 7% 2 0%
Activated between 90 and 180 days
128 17% 469 20% 104 12% 16 3%
No payments 162 22% 436 19% 199 23% 232 40%
Total plans approved 746 100% 2,314 100% 850 100% 582 100%
Table G.17 Number of questionnaires completed by SFOF version – SA
Version Number of questionnaires
collected 2016-17 Number of questionnaires
collected Q1 2017-18 Number of questionnaires
Participant 0 to school 1,625 283 1,908
Participant school to 14 2,202 256 2,458
Participant 15 to 24 532 254 786
Participant 25 and over 29 512 541
Total Participant 4,388 1,305 5,693
Family 0 to 14 3,676 516 4,192
Family 15 to 24 483 133 616
Family 25 and over 1 55 56
Total Family 4,160 704 4,864
Total 8,548 2,009 10,557

September 2017 | COAG Disability Reform Council Quarterly Report 130
Table G.18 Selected key indicators for participants – Daily Living (DL) and Choice and Control (CC) – SA
Indicator 0 to before
school School to
14 15 to 24
25 and over
DL
% with concerns in 6 or more of the areas: gross motor skills, fine motor skills, self-care, eating, social interaction, communication, cognitive development, sensory processing
51%
CC % who say their child is able to tell them what he/she wants
82%
DL % developing functional, learning and coping skills appropriate to their ability and circumstances
36%
DL % who say their child is becoming more independent
55%
CC % of children who have a genuine say in decisions about themselves
80%
CC % who are happy with the level of independence/control they have now
44%
CC % who choose who supports them 32% 65%
CC % who choose what they do each day 42% 71%
CC % who had been given the opportunity to participate in a self-advocacy group meeting
18% 26%
CC % who want more choice and control in their life
70% 65%
Table G.19 Selected key indicators for participants – Relationships (REL) and Social/ Community Participation (S/CP) –
SA
Indicator 0 to before
school School to
14 15 to 24
25 and over
REL % of children who can make friends with people outside the family
66% 69%
S/CP % of children who participate in age appropriate community, cultural or religious activities
63%
REL % of children who spend time after school and on weekends with friends and/or in mainstream programs
47%
REL Of these, % who are welcomed or actively included
64% 78%
REL % of children who spend time with friends without an adult present
21%
REL % with no friends other than family or paid staff
29% 24%
S/CP % who have been actively involved in a community, cultural or religious group in the last 12 months
33% 38%
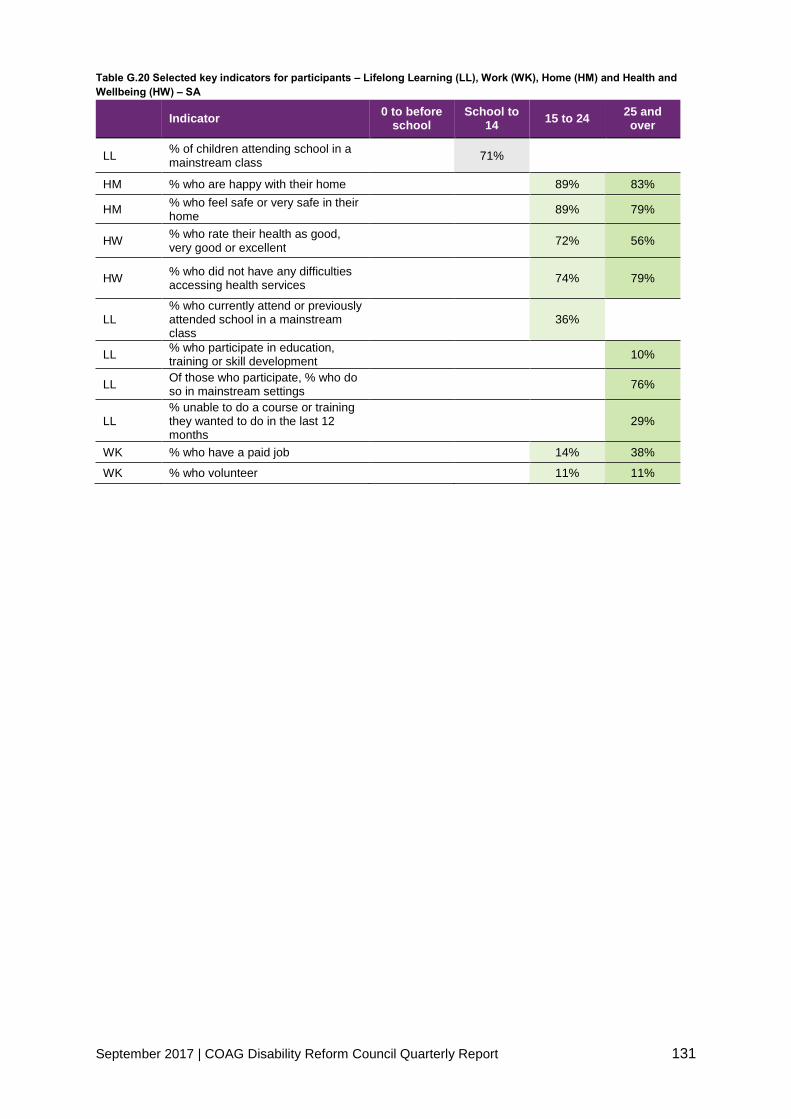
September 2017 | COAG Disability Reform Council Quarterly Report 131
Table G.20 Selected key indicators for participants – Lifelong Learning (LL), Work (WK), Home (HM) and Health and
Wellbeing (HW) – SA
Indicator 0 to before
school School to
14 15 to 24
25 and over
LL % of children attending school in a mainstream class
71%
HM % who are happy with their home 89% 83%
HM % who feel safe or very safe in their home
89% 79%
HW % who rate their health as good, very good or excellent
72% 56%
HW % who did not have any difficulties accessing health services
74% 79%
LL % who currently attend or previously attended school in a mainstream class
36%
LL % who participate in education, training or skill development
10%
LL Of those who participate, % who do so in mainstream settings
76%
LL % unable to do a course or training they wanted to do in the last 12 months
29%
WK % who have a paid job 14% 38%
WK % who volunteer 11% 11%

September 2017 | COAG Disability Reform Council Quarterly Report 132
Table G.21 Selected key indicators for families/ carers of participants – SA
Indicator 0 to 14 15 to 24 25 and over
% receiving Carer Payment 19% 30% 25%
% receiving Carer Allowance 47% 57% 20%
% working in a paid job 48% 48% 18%
Of those in a paid job, % in permanent employment
73% 71% Numbers are too
small
Of those in a paid job, % working 15 hours or more
78% 82% Numbers are too
small
% who say they (and their partner) are able to work as much as they want
48% 49% 78%
Of those unable to work as much as they want, % who say the situation of their child/family member with disability is a barrier to working more
80% 83% Numbers are too
small
Of those unable to work as much as they want, % who say insufficient flexibility of jobs is a barrier to working more
35% 30% Numbers are too
small
% able to advocate for their child/family member
79% 77% 70%
% who have friends and family they see as often as they like
54% 50% 50%
% who feel very confident or somewhat confident in supporting their child's development
88%
% who know what their family can do to enable their family member with disability to become as independent as possible
45%
% who feel in control selecting services 46% 54%
% who have made plans (or begun to make plans) for when they are no longer able to care for their family member with disability
38%
% who rate their health as good, very good or excellent
73% 64% 61%
Table G.22 Results for “Has the NDIS helped?” questions answered at review, for SFOF version ‘Participant 0 to
school’ (n=94) – SA
Question Yes
DL Has the NDIS improved your child's development? 93%
DL Has the NDIS improved your child's access to specialist services? 93%
CC Has the NDIS helped increase your child's ability to communicate what they want?
87%
REL Has the NDIS improved how your child fits into family life? 88%
S/CP Has the NDIS improved how your child fits into community life? 70%

September 2017 | COAG Disability Reform Council Quarterly Report 133
Table G.23 Results for “Has the NDIS helped?” questions answered at review, for SFOF version ‘Participant school to
14’ (n=155) – SA
Question Yes
DL Has the NDIS helped your child to become more independent? 65%
LL Has the NDIS improved your child's access to education? 50%
REL Has the NDIS improved your child's relationships with family and friends?
57%
S/CP Has the NDIS improved your child's social and recreational life? 56%
Table G.24 Results for “Has the NDIS helped?” questions answered at review, for SFOF versions ‘Participant 15 to 24’
(n=23) and ‘Participant 25 and over’ (n=0) – SA
Question 15 to 24 % Yes
25+ % Yes
CC Has the NDIS helped you have more choices and more control over your life?
81% No data available
DL Has the NDIS helped you with daily living activities? 73% No data available
REL Has the NDIS helped you to meet more people? 55% No data available
HM Has your involvement with the NDIS helped you to choose a home that's right for you?
50% No data available
HW Has your involvement with the NDIS improved your health and wellbeing?
67% No data available
LL Had your involvement with the NDIS helped you to learn things you want to learn or to take courses you want to take?
55% No data available
WK Has your involvement with the NDIS helped you find a job that's right for you?
27% No data available
S/CP Has the NDIS helped you be more involved? 68% No data available
Table G.25 Results for “Has the NDIS helped?” questions answered at review, for SFOF version ‘Family 0 to 14’
(n=247); and for SFOF versions ‘Family 15 to 24’ and ‘Family 25 and over’ combined (n=22) – SA
Question 0 to 14 % Yes
15+ % Yes
Has the NDIS improved your capacity to advocate (stand up) for your child? / Has the NDIS helped you to know your rights and advocate effectively?
57% 57%
Has the NDIS improved the level of support for your family? 78% 81%
Has the NDIS improved your access to services, programs and activities in the community?
76% 76%
Has the NDIS improved your ability/capacity to help your child develop and learn?
79%
Has the NDIS improved your health and wellbeing? 55% 65%

September 2017 | COAG Disability Reform Council Quarterly Report 134
Figure G.1 Proportion of participants describing satisfaction with the Agency planning process as good or very good
– by quarter (SA)64
Table G.26 Proportion of Participants rating their level of agreement as strongly agree, agree, neutral, disagree or
strongly disagree in response to statements about the planning process – SA
SA Very good
Good Neutral Poor Very Poor
Overall, how would you rate your experience with the planning process today?
43% 39% 11% 2% 4%
1. The planner listened to me 50% 46% 2% 2% 0%
2. I had enough time to tell my story and say what support I need
50% 46% 2% 2% 0%
3. The planner knows what I can do well 24% 63% 9% 4% 0%
4. The planner had some good ideas for my plan
28% 63% 4% 4% 0%
5. I know what is in my plan 28% 65% 2% 4% 0%
6. The planner helped me think about my future
22% 57% 13% 9% 0%
7. I think my plan will make my life better 39% 43% 15% 2% 0%
8. The planning meeting went well 46% 46% 9% 0% 0%
Table G.27 Plan reviews conducted by quarter – excluding plans less than 30 days – SA
Prior Quarters (Transition only)
2017-18 Q1 Transition Total
Total scheduled plan reviews 4,219 1,516 5,735
Trial participants 4,198 1,074 5,272
Transition participants 21 442 463
64 2016-17 Q4 data is not available from SA as survey only started again from 1 July 2017 onwards. Participant satisfaction results are not shown if there is insufficient data in the group.
91%
98% 98% 100% 100% 96%
73%
84%86%
83%
0%
10%
20%
30%
40%
50%
60%
70%
80%
90%
100%
Q3 14-15 Q4 14-15 Q1 15-16 Q2 15-16 Q3 15-16 Q4 15-16 Q1 16-17 Q2 16-17 Q3 16-17 Q4 16-17 Q1 17-18
Pro
po
rtio
n o
f P
art
icip
ants
%
Quarter

September 2017 | COAG Disability Reform Council Quarterly Report 135
Table G.28 Plan reviews conducted by quarter – excluding plans less than 30 days – SA
Prior Quarters (Transition only)
2017-18 Q1 Transition Total
Total unscheduled plan reviews 2,481 366 2,847
Trial participants 1,974 253 2,227
Transition participants 507 113 620
Table G.29 Estimated rate of unscheduled plan reviews – excluding plans less than 30 days – SA65
Prior Quarters
(Transition only)
2017-18 Q1 Transition
Total
% unscheduled reviews 25.8% 11.9% 22.4%
Table G.30 AAT cases by category – SA
Prior
Quarters 2017-18 Q1 Total
AAT Cases 24 13 37
Access 5 0 5
Plan 19 13 32
Plan Review 0 0 0
Other 0 0 0
Committed supports and payments
Table G.31 Committed supports by financial year ($m) - SA
2013-14 2014-15 2015-16 2016-17 2017-18 2018-19
and beyond
Total
Total Committed
11.0 50.6 105.5 187.7 187.4 11.4 553.7
65 The number of participants used in the calculation considers the length of time the participants have been in the Scheme.

September 2017 | COAG Disability Reform Council Quarterly Report 136
Figure G.2 Distribution of participants by annualised committed support band (including participants with shared
supported accommodation supports) – active participants with initial plan approvals 2017-18 Q1 compared with active
participants with initial plan approvals in prior quarters66 (SA)
Figure G.3 Distribution of participants by annualised committed support band (excluding participants with shared
supported accommodation supports) – active participants with initial plan approvals 2017-18 Q1 compared with active
participants with initial plan approvals in prior quarters67 (SA)
0.00%
5.00%
10.00%
15.00%
20.00%
25.00%
30.00%
35.00%
Dis
trib
uti
on
o
f p
art
icip
an
ts
Average annualised committed supports band
Prior Quarters distribution of participants 2017-18 Q1 distribution of participants
0.00%
5.00%
10.00%
15.00%
20.00%
25.00%
30.00%
35.00%
Dis
trib
uti
on
o
f p
art
icip
an
ts
Average annualised committed supports band
Prior Quarters distribution of participants 2017-18 Q1 distribution of participants

September 2017 | COAG Disability Reform Council Quarterly Report 137
Figure G.4 Average committed support by age group (including participants with shared supported accommodation
supports) – active participants with initial plan approvals 2017-18 Q1 compared with active participants with initial
plan approvals in prior quarters68 (SA)
66 Average annualised committed supports are not shown where there is insufficient data in the group. 67 Average annualised committed supports are not shown where there is insufficient data in the group. 68 Average annualised committed supports are not shown where there is insufficient data in the group.
$0
$10,000
$20,000
$30,000
$40,000
$50,000
$60,000
$70,000
$80,000
0 to 6 7 to 14 15 to 18 19 to 24 25 to 34 35 to 44 45 to 54 55 to 64 65+
Av
era
ge
an
nu
ali
se
d c
om
mit
ted
su
pp
ort
s
Age group
2017-18 Q1 expected average annualised committed supports (based on revenue)
2017-18 Q1 actual average annualised committed supports
Prior Quarters expected average annualised committed supports (based on revenue)
Prior Quarters actual average annualised committed supports

September 2017 | COAG Disability Reform Council Quarterly Report 138
Figure G.5 Average committed support by primary disability group (including participants with shared supported
accommodation supports) – active participants with initial plan approvals 2017-18 Q1 compared with active
participants with initial plan approvals in prior quarters69 (SA)
69 Average annualised committed supports are not shown where there is insufficient data in the group.
$0 $10,000 $20,000 $30,000 $40,000 $50,000 $60,000 $70,000 $80,000 $90,000
ABI
Autism
Cerebral Palsy
Developmental Delay
Global Developmental Delay
Hearing Impairment
Intellectual Disability
Multiple Sclerosis
Psychosocial disability
Spinal Cord Injury
Stroke
Visual Impairment
Other Neurological
Other Physical
Other Sensory/Speech
Other
Average annualised committed supports
Pri
ma
ry d
isa
bil
ity
Prior Quarters actual average annualised committed supports
Prior Quarters expected average annualised committed supports (based on revenue)
2017-18 Q1 actual average annualised committed supports
2017-18 Q1 expected average annualised committed supports (based on revenue)

September 2017 | COAG Disability Reform Council Quarterly Report 139
Figure G.6 Average committed support by level of function (including participants with shared supported
accommodation supports) – active participants with initial plan approvals 2017-18 Q1 compared with active
participants with initial plan approvals in prior quarters70 (SA)
Table G.32 Payments by financial year, compared to committed supports ($m) – SA
2013-14 2014-15 2015-16 2016-17 2017-18 2018-19 and
beyond Total
Total Committed 11.0 50.6 105.5 187.7 187.4 11.4 553.7
Total Paid 5.8 30.7 64.9 103.8 26.0 - 231.3
% utilised to date 53% 61% 62% 55% - - 56%71
Figure G.7 Utilisation of committed supports as at 30 June 2017 and 30 September 2017 (SA)
70 Average annualised committed supports are not shown where there is insufficient data in the group. Level of function 15 does not have sufficient data to show an average cost. 71 Note: Only committed supports expected to be used to 30 September 2017 have been used to calculate the utilisation from 1 July 2013 to date.
$0
$20,000
$40,000
$60,000
$80,000
$100,000
$120,000
$140,000
$160,000
1 2 3 4 5 6 7 8 9 10 11 12 13 14 15
Av
era
ge
an
nu
ali
se
d c
om
mit
ted
su
pp
ort
s
Level of function
2017-18 Q1 expected average annualised committed supports (based on revenue)
2017-18 Q1 actual average annualised committed supports
Prior Quarters expected average annualised committed supports (based on revenue)
Prior Quarters actual average annualised committed supports
53% 53%
61% 61%
64% 62%52% 55%
42%
$0m
$20m
$40m
$60m
$80m
$100m
$120m
$140m
$160m
$180m
$200m
2013-14 2014-15 2015-16 2016-17 2017-18YTD
Co
mm
itte
d s
up
po
rts
As at 30 Jun 2017: Paid As at 30 Jun 2017: Remaining
As at 30 Sep 2017: Paid As at 30 Sep 2017: Remaining
EXPERIENCE IS STILL EMERGING

September 2017 | COAG Disability Reform Council Quarterly Report 140
Providers and markets
Table G.33 Key provider indicators by quarter - SA
Prior Quarters 2017-18 Q1 Total
Provider indicators
a) Registrations by profile
Individual/ sole trader 396 59 451
Company/ organisation 757 131 880
Total 1,153 190 1,331
b) Registration revoked 12

September 2017 | COAG Disability Reform Council Quarterly Report 141
Table G.34 Number of approved providers by registration group - SA72
Registration Group Prior
Quarters 2017-18
Q1 Total % Change
Assistance services
Accommodation / Tenancy Assistance 89 9 98 10%
Assistance Animals 5 1 6 20%
Assistance with daily life tasks in a group or shared living arrangement
69 9 78 13%
Assistance with travel/transport arrangements 168 18 186 11%
Daily Personal Activities 87 13 100 15%
Group and Centre Based Activities 88 15 103 17%
High Intensity Daily Personal Activities 93 12 105 13%
Household tasks 151 41 192 27%
Interpreting and translation 40 7 47 18%
Participation in community, social and civic activities 116 22 138 19%
Assistive Technology
Assistive equipment for recreation 132 34 166 26%
Assistive products for household tasks 109 25 134 23%
Assistance products for personal care and safety 240 40 280 17%
Communication and information equipment 108 21 129 19%
Customised Prosthetics 101 6 107 6%
Hearing Equipment 66 5 71 8%
Hearing Services 9 2 11 22%
Personal Mobility Equipment 204 42 246 21%
Specialised Hearing Services 21 2 23 10%
Vision Equipment 44 4 48 9%
Capacity Building Services
Assistance in coordinating or managing life stages, transitions and supports
89 21 110 24%
Behaviour Support 158 40 198 25%
Community nursing care for high needs 64 14 78 22%
Development of daily living and life skills 115 22 137 19%
Early Intervention supports for early childhood 356 27 383 8%
Exercise Physiology and Physical Wellbeing activities
89 5 94 6%
Innovative Community Participation 110 36 146 33%
Specialised Driving Training 38 1 39 3%
Therapeutic Supports 452 63 515 14%
Capital services
Home modification design and construction 105 18 123 17%
Specialised Disability Accommodation 27 11 38 41%
Vehicle Modifications 30 4 34 13%
Choice and control support services
Management of funding for supports in participants plan
43 6 49 14%
Support Coordination 87 33 120 38%
Employment and Education support services
Assistance to access and/or maintain employment and/or education
65 7 72 11%
Specialised Supported Employment 17 0 17 0%
Total approved providers 1,141 190 1,331 17%
72 The 12 providers whose registration ended during the first quarter of 2017-18 are not included in the 2016-17 Q4 and prior numbers in this table.

September 2017 | COAG Disability Reform Council Quarterly Report 142
Table G.35 Key markets indicators by quarter – SA
Market indicators Prior Quarters 2017-18 Q1
a) Average number of providers per participant 1.25 1.24
b) Number of providers delivering new supports 161 175
c) Change in the number of active/inactive providers:
Active (%) 49% 50%
Not yet active (%) 45% 43%
Inactive (%) 6% 6%
d) Share of payments - top 25%
Daily Tasks/Shared Living (%) 78% 80%
Therapeutic Supports (%) 94% 93%
Participate Community (%) 69% 77%
Early Childhood Supports (%) 88% 88%
Assist Personal Activities (%) 77% 83%
Table G.36 Proportion of active participants with approved plans accessing mainstream supports – SA
Prior Quarters 2017-18 Q1 Total
Assistive technology 0% 0% 0%
Choice & Control 0% 1% 1%
Consumables 0% 0% 0%
Daily Activities 9% 8% 8%
Daily Equipment 0% 0% 0%
Employment 0% 2% 1%
Health & Wellbeing 18% 31% 22%
Home Living 0% 0% 0%
Housing & Home modifications 0% 0% 0%
Independence 2% 1% 2%
Lifelong Learning 43% 29% 39%
Relationships 3% 2% 3%
Social & Civic 3% 3% 3%
Transport 0% 0% 0%
Non-categorised 36% 28% 33%
Any mainstream service 91% 89% 90%

September 2017 | COAG Disability Reform Council Quarterly Report 143
Appendix H
Appendix H: Tasmania
The tables below replicate the tables in the main parts of this report for TAS only where the
data is available.
Participant Demographics
Table H.1 Plan approvals compared to estimates – TAS
Prior
Quarters 2017-18 Q1
Total excluding
ECEI
Total including
ECEI
Bilateral estimates
TAS 2,229 305 2,534 2,915 2,852
Table H.2 Quarterly intake split by plan and entry type since 1 July 2013 – TAS
Prior Quarters 2017-18 Q1 Total
Access decisions 2,658 553 3,211
Access Met 2,527 503 3,030
State 1,392 312 1,704
New 1,038 127 1,165
Commonwealth 97 64 161
Total Participant Plans 2,246 686 2,915
EI (s25) plans 190 59 249
PD (s24) plans 2,039 246 2,285
ECEI 17 381 381
Table H.3 Plan reviews conducted per quarter – TAS
Prior Quarters
(Transition only)
2017-18 Q1 Transition
Total
Total plan reviews 1,342 430 1,772
Early intervention plans 37 41 78
Permanent disability plans 1,305 389 1,694
Table H.4 Exits from the Scheme since 1 July 2013 as at 30 September 2017 – TAS
Exits
Total plan exits 32
Early Intervention plans 2
Permanent disability plans 30
Table H.5 Cumulative position by services previously received – TAS
Participant cohort Bilateral estimate
% of estimate
Awaiting a plan
State Commonwealth New ECEI Total
Trial 693 28 441 1,162 1,125 103%
End of 2016-17 1,211 58 960 17 2,246 2,242 100%
End of 2017-18 Q1 1,410 86 1,038 381 2,915 2,852 102% 402

September 2017 | COAG Disability Reform Council Quarterly Report 144
Table H.6 Cumulative position by entry into the Scheme – TAS
Participant cohort Bilateral estimate
% of estimate
Awaiting a plan
EI (s25) plan PD (s24) plan ECEI Total
Trial 25 1,137 1,162 1,125 103%
End of 2016-17 190 2,039 17 2,246 2,242 100%
End of 2017-18 Q1 249 2,285 381 2,915 2,852 102% 402
Table H.7 Active participants with approved plans per quarter by disability group – TAS73
Prior Quarters 2017-18 Q1 Total
Disability N % N % N %
Intellectual Disability 1,003 46% 121 40% 1,124 45%
Autism 777 35% 129 42% 906 36%
Psychosocial disability 52 2% 5 2% 57 2%
Cerebral Palsy 128 6% 22 7% 150 6%
Developmental Delay 8 0% 0 0% 8 0%
Other Neurological 63 3% 5 2% 68 3%
Other Physical 45 2% 3 1% 48 2%
Acquired Brain Injury 32 1% 10 3% 42 2%
Hearing Impairment 32 1% 6 2% 38 2%
Other Sensory/Speech 6 0% 0 0% 6 0%
Visual Impairment 25 1% 2 1% 27 1%
Multiple Sclerosis 4 0% 0 0% 4 0%
Global Developmental Delay 5 0% 2 1% 7 0%
Spinal Cord Injury 5 0% 0 0% 5 0%
Stroke 2 0% 0 0% 2 0%
Other 10 0% 0 0% 10 0%
Total 2,197 100% 305 100% 2,502 100%
Table H.8 Active participants with approved plan per quarter by level of function – TAS
Prior Quarters 2017-18 Q1 Total
Level of Function N % N % N %
1 (High Function) 8 0% 1 0% 9 0%
2 (High Function) 4 0% 0 0% 4 0%
3 (High Function) 199 10% 13 4% 212 9%
4 (High Function) 144 7% 23 8% 167 7%
5 (High Function) 281 14% 36 12% 317 13%
6 (Moderate Function) 404 20% 49 16% 453 19%
7 (Moderate Function) 253 12% 38 12% 291 12%
8 (Moderate Function) 167 8% 15 5% 182 8%
9 (Moderate Function) 0 0% 1 0% 1 0%
10 (Moderate Function) 135 7% 17 6% 152 6%
11 (Low Function) 152 7% 32 10% 184 8%
12 (Low Function) 162 8% 45 15% 207 9%
13 (Low Function) 109 5% 26 9% 135 6%
14 (Low Function) 47 2% 9 3% 56 2%
15 (Low Function) 1 0% 0 0% 1 0%
Missing 131 0 131
Total 2,197 100% 305 100% 2,502 100%
73 Table order based on national proportions (highest to lowest)

September 2017 | COAG Disability Reform Council Quarterly Report 145
Table H.9 Participant profile per quarter by Age group – TAS
Prior Quarters 2017-18 Q1 Total
Age Group N % N % N %
0 to 6 1 0% 3 1% 4 0%
7 to 14 420 19% 169 55% 589 24%
15 to 18 522 24% 28 9% 550 22%
19 to 24 804 37% 7 2% 811 32%
25 to 34 378 17% 9 3% 387 15%
35 to 44 33 2% 27 9% 60 2%
45 to 54 22 1% 35 11% 57 2%
55 to 64 16 1% 27 9% 43 2%
65+ 1 0% 0 0% 1 0%
Total 2,197 100% 305 100% 2,502 100%
Table H.10 Participant profile per quarter by Gender – TAS
Prior Quarters 2017-18 Q1 Total
Gender N % N % N %
Male 1,392 63% 190 62% 1,582 63%
Female 768 35% 101 33% 869 35%
Indeterminate 37 2% 14 5% 51 2%
Total 2,197 100% 305 100% 2,502 100%
Table H.11 Participant profile per quarter by Aboriginal and Torres Strait islander status – TAS
Prior Quarters 2017-18 Q1 Total
Participant profile N % N % N %
Aboriginal and Torres Strait Islander
192 8.7% 13 4.3% 205 8.2%
Not Aboriginal and Torres Strait Islander
1,952 88.8% 286 93.8% 2,238 89.4%
Not Stated 53 2.4% 6 2.0% 59 2.4%
Total 2,197 100% 305 100% 2,502 100%
Table H.12 Participant profile per quarter by culturally and linguistically diverse (CALD) status – TAS
Prior Quarters 2017-18 Q1 Total
Participant profile N % N % N %
CALD 38 1.7% 4 1.3% 42 1.7%
Not CALD 2,144 97.6% 300 98.4% 2,444 97.7%
Not Stated 15 0.7% 1 0.3% 16 0.6%
Total 2,197 100% 305 100% 2,502 100%
Table H.13 Participant profile per quarter by Young people in Residential aged care (YPIRAC) status – TAS
Prior Quarters 2017-18 Q1 Total
Participant profile N % N % N %
YPIRAC 0 0.0% 0 0.0% 0 0.0%
Not YPIRAC 2,197 100.0% 305 100.0% 2,502 100.0%
Total 2,197 100% 305 100% 2,502 100%

September 2017 | COAG Disability Reform Council Quarterly Report 146
Table H.14 Distribution of active participants by method of Financial Plan Management and quarter of plan approval –
TAS
Prior Quarters
(Transition only) 2017-18 Q1 Total
Self-managed fully 5% 7% 6%
Self-managed partly 9% 13% 11%
Plan managed 2% 3% 2%
Agency managed 84% 77% 82%
Total 100% 100% 100%
Table H.15 Distribution of active participants by support coordination and quarter of plan approval – TAS
Prior Quarters
(Transition only) 2017-18 Q1 Total
Support coordination 42% 47% 44%
Table H.16 Duration to plan activation by quarter of initial plan approval for active participants – TAS
2016-17 Q1 2016-17 Q2 2016-17 Q3 2016-17 Q4
Plan activation N % N % N % N %
Less than 30 days 40 27% 92 28% 112 48% 94 27%
30 to 59 days 22 15% 42 13% 22 10% 40 11%
60 to 89 days 15 10% 21 6% 13 6% 22 6%
Activated within 90 days
77 53% 155 46% 147 64% 156 44%
90 to 119 days 8 5% 24 7% 8 3% 9 3%
120 days and over 24 16% 40 12% 12 5% 1 0%
Activated between 90 and 180 days
32 22% 64 19% 20 9% 10 3%
No payments 37 25% 115 34% 64 28% 186 53%
Total plans approved 146 100% 334 100% 231 100% 352 100%
Table H.17 Number of questionnaires completed by SFOF version – TAS
Version Number of questionnaires
collected 2016-17 Number of questionnaires
collected Q1 2017-18 Number of questionnaires
Participant 0 to school 6 11 17
Participant school to 14 573 171 744
Participant 15 to 24 310 25 335
Participant 25 and over 166 79 245
Total Participant 1,055 286 1,341
Family 0 to 14 528 172 700
Family 15 to 24 164 25 189
Family 25 and over 6 23 29
Total Family 698 220 918
Total 1,753 506 2,259

September 2017 | COAG Disability Reform Council Quarterly Report 147
Table H.18 Selected key indicators for participants – Daily Living (DL) and Choice and Control (CC) – TAS
Indicator 0 to before
school School to 14
15 to 24 25 and over
DL
% with concerns in 6 or more of the areas: gross motor skills, fine motor skills, self-care, eating, social interaction, communication, cognitive development, sensory processing
Numbers are too small
CC % who say their child is able to tell them what he/she wants
Numbers are too small
DL % developing functional, learning and coping skills appropriate to their ability and circumstances
39%
DL % who say their child is becoming more independent
49%
CC % of children who have a genuine say in decisions about themselves
75%
CC % who are happy with the level of independence/control they have now
47%
CC % who choose who supports them 42% 25%
CC % who choose what they do each day 54% 43%
CC % who had been given the opportunity to participate in a self-advocacy group meeting
18% 43%
CC % who want more choice and control in their life
76% 71%
Table H.19 Selected key indicators for participants – Relationships (REL) and Social/ Community Participation (S/CP) –
TAS
Indicator 0 to before
school School to
14 15 to 24
25 and over
REL % of children who can make friends with people outside the family
Numbers are too small
69%
S/CP % of children who participate in age appropriate community, cultural or religious activities
Numbers are too small
REL % of children who spend time after school and on weekends with friends and/or in mainstream programs
28%
REL Of these, % who are welcomed or actively included
Numbers are too small
85%
REL % of children who spend time with friends without an adult present
17%
REL % with no friends other than family or paid staff
31% 26%
S/CP % who have been actively involved in a community, cultural or religious group in the last 12 months
20% 32%

September 2017 | COAG Disability Reform Council Quarterly Report 148
Table H.20 Selected key indicators for participants – Lifelong Learning (LL), Work (WK), Home (HM) and Health and
Wellbeing (HW) – TAS
Indicator 0 to before
school School to
14 15 to 24
25 and over
LL % of children attending school in a mainstream class
70%
HM % who are happy with their home 81% 78%
HM % who feel safe or very safe in their home
87% 81%
HW % who rate their health as good, very good or excellent
75% 57%
HW % who did not have any difficulties accessing health services
78% 78%
LL % who currently attend or previously attended school in a mainstream class
63%
LL % who participate in education, training or skill development
9%
LL Of those who participate, % who do so in mainstream settings
61%
LL % unable to do a course or training they wanted to do in the last 12 months
21%
WK % who have a paid job 9% 19%
WK % who volunteer 11% 6%

September 2017 | COAG Disability Reform Council Quarterly Report 149
Table H.21 Selected key indicators for families/ carers of participants – TAS
Indicator 0 to 14 15 to 24 25 and over
% receiving Carer Payment 45% 29% 3%
% receiving Carer Allowance 71% 39% 14%
% working in a paid job 43% 42% 45%
Of those in a paid job, % in permanent employment
71% 69% Numbers are too
small
Of those in a paid job, % working 15 hours or more
70% 79% Numbers are too
small
% who say they (and their partner) are able to work as much as they want
44% 49% Numbers are too
small
Of those unable to work as much as they want, % who say the situation of their child/family member with disability is a barrier to working more
90% 80% Numbers are too
small
Of those unable to work as much as they want, % who say insufficient flexibility of jobs is a barrier to working more
34% 24% Numbers are too
small
% able to advocate for their child/family member
83% 77% Numbers are too
small
% who have friends and family they see as often as they like
40% 50% 48%
% who feel very confident or somewhat confident in supporting their child's development
90%
% who know what their family can do to enable their family member with disability to become as independent as possible
52%
% who feel in control selecting services 44% Numbers are too
small
% who have made plans (or begun to make plans) for when they are no longer able to care for their family member with disability
Numbers are too
small
% who rate their health as good, very good or excellent
67% 69% Numbers are too
small
Table H.22 Results for “Has the NDIS helped?” questions answered at review, for SFOF version ‘Participant 0 to
school’ (n=0) – TAS
Question Yes
DL Has the NDIS improved your child's development? No data available
DL Has the NDIS improved your child's access to specialist services? No data available
CC Has the NDIS helped increase your child's ability to communicate what they want?
No data available
REL Has the NDIS improved how your child fits into family life? No data available
S/CP Has the NDIS improved how your child fits into community life? No data available

September 2017 | COAG Disability Reform Council Quarterly Report 150
Table H.23 Results for “Has the NDIS helped?” questions answered at review, for SFOF version ‘Participant school to
14’ (n=15) – TAS
Question Yes
DL Has the NDIS helped your child to become more independent?
Numbers
are too
small
LL Has the NDIS improved your child's access to education?
Numbers
are too
small
REL Has the NDIS improved your child's relationships with family and friends?
Numbers
are too
small
S/CP Has the NDIS improved your child's social and recreational life?
Numbers
are too
small
Table H.24 Results for “Has the NDIS helped?” questions answered at review, for SFOF versions ‘Participant 15 to 24’
(n=63) and ‘Participant 25 and over’ (n=13) – TAS
Question 15 to 24 % Yes
25+ % Yes
CC Has the NDIS helped you have more choices and more control over your life?
54%
Numbers
are too
small
DL Has the NDIS helped you with daily living activities? 47%
Numbers
are too
small
REL Has the NDIS helped you to meet more people? 47%
Numbers
are too
small
HM Has your involvement with the NDIS helped you to choose a home that's right for you?
15%
Numbers
are too
small
HW Has your involvement with the NDIS improved your health and wellbeing?
24%
Numbers
are too
small
LL Had your involvement with the NDIS helped you to learn things you want to learn or to take courses you want to take?
29%
Numbers
are too
small
WK Has your involvement with the NDIS helped you find a job that's right for you?
5%
Numbers
are too
small
S/CP Has the NDIS helped you be more involved? 40%
Numbers
are too
small

September 2017 | COAG Disability Reform Council Quarterly Report 151
Table H.25 Results for “Has the NDIS helped?” questions answered at review, for SFOF version ‘Family 0 to 14’ (n=9);
and for SFOF versions ‘Family 15 to 24’ and ‘Family 25 and over’ combined (n=32) – TAS
Question 0 to 14 % Yes
15+ % Yes
Has the NDIS improved your capacity to advocate (stand up) for your child? / Has the NDIS helped you to know your rights and advocate effectively?
Numbers
are too
small
59%
Has the NDIS improved the level of support for your family?
Numbers
are too
small
54%
Has the NDIS improved your access to services, programs and activities in the community?
Numbers
are too
small
57%
Has the NDIS improved your ability/capacity to help your child develop and learn?
Numbers
are too
small
Has the NDIS improved your health and wellbeing?
Numbers
are too
small
36%
Figure H.1 Proportion of participants describing satisfaction with the Agency planning process as good or very good –
by quarter (TAS)74
74 Participant satisfaction results are not shown if there is insufficient data in the group.
100%
88% 89%
97%93%
0%
10%
20%
30%
40%
50%
60%
70%
80%
90%
100%
Q3 14-15 Q4 14-15 Q1 15-16 Q2 15-16 Q3 15-16 Q4 15-16 Q1 16-17 Q2 16-17 Q3 16-17 Q4 16-17 Q1 17-18
Pro
po
rtio
n o
f P
art
icip
ants
%
Quarter

September 2017 | COAG Disability Reform Council Quarterly Report 152
Table H.26 Proportion of Participants rating their level of agreement as strongly agree, agree, neutral, disagree or
strongly disagree in response to statements about the planning process – TAS
TAS Very good
Good Neutral Poor Very Poor
Overall, how would you rate your experience with the planning process today?
43% 50% 2% 5% 0%
1. The planner listened to me 55% 45% 0% 0% 0%
2. I had enough time to tell my story and say what support I need
41% 45% 2% 11% 0%
3. The planner knows what I can do well 14% 57% 16% 11% 2%
4. The planner had some good ideas for my plan
14% 64% 16% 7% 0%
5. I know what is in my plan 23% 32% 23% 23% 0%
6. The planner helped me think about my future 25% 52% 9% 11% 2%
7. I think my plan will make my life better 34% 45% 20% 0% 0%
8. The planning meeting went well 34% 57% 5% 5% 0%
Table H.27 Plan reviews conducted by quarter – excluding plans less than 30 days – TAS
Prior Quarters (Transition only)
2017-18 Q1 Transition Total
Total scheduled plan reviews 629 304 933
Trial participants 625 185 810
Transition participants 4 119 123
Table H.28 Plan reviews conducted by quarter – excluding plans less than 30 days – TAS
Prior Quarters (Transition only)
2017-18 Q1 Transition Total
Total unscheduled plan reviews 713 126 839
Trial participants 566 63 629
Transition participants 147 63 210
Table H.29 Estimated rate of unscheduled plan reviews – excluding plans less than 30 days – TAS75
Prior Quarters
(Transition only)
2017-18 Q1 Transition
Total
% unscheduled reviews 43.7% 21.2% 37.7%
Table H.30 AAT cases by category – TAS
Prior
Quarters 2017-18 Q1 Total
AAT Cases 5 1 6
Access 1 0 1
Plan 4 1 5
Plan Review 0 0 0
Other 0 0 0
75 The number of participants used in the calculation considers the length of time the participants have been in the Scheme.

September 2017 | COAG Disability Reform Council Quarterly Report 153
Committed supports and payments
Table H.31 Committed supports by financial year ($m) - TAS
2013-14 2014-15 2015-16 2016-17 2017-18 2018-19
and beyond
Total
Total Committed
18.0 51.9 66.0 99.4 109.3 9.0 353.7
Figure H.2 Distribution of participants by annualised committed support band (including participants with shared
supported accommodation supports) – active participants with initial plan approvals 2017-18 Q1 compared with active
participants with initial plan approvals in prior quarters76 (TAS)
76 Average annualised committed supports are not shown where there is insufficient data in the group.
0.00%
5.00%
10.00%
15.00%
20.00%
25.00%
Dis
trib
uti
on
o
f p
art
icip
an
ts
Average annualised committed supports band
Prior Quarters distribution of participants 2017-18 Q1 distribution of participants

September 2017 | COAG Disability Reform Council Quarterly Report 154
Figure H.3 Distribution of participants by annualised committed support band (excluding participants with shared
supported accommodation supports) – active participants with initial plan approvals 2017-18 Q1 compared with active
participants with initial plan approvals in prior quarters77 (TAS)
77 Average annualised committed supports are not shown where there is insufficient data in the group.
0.00%
5.00%
10.00%
15.00%
20.00%
25.00%
30.00%
35.00%D
istr
ibu
tio
n o
f p
art
icip
an
ts
Average annualised committed supports band
Prior Quarters distribution of participants 2017-18 Q1 distribution of participants

September 2017 | COAG Disability Reform Council Quarterly Report 155
Figure H.4 Average committed support by age group (including participants with shared supported accommodation
supports) – active participants with initial plan approvals 2017-18 Q1 compared with active participants with initial
plan approvals in prior quarters78 (TAS)
78 Average annualised committed supports are not shown where there is insufficient data in the group.
$0
$50,000
$100,000
$150,000
$200,000
$250,000
$300,000
0 to 6 7 to 14 15 to 18 19 to 24 25 to 34 35 to 44 45 to 54 55 to 64 65+
Av
era
ge
an
nu
ali
se
d c
om
mit
ted
su
pp
ort
s
Age group
2017-18 Q1 expected average annualised committed supports (based on revenue)
2017-18 Q1 actual average annualised committed supports
Prior Quarters expected average annualised committed supports (based on revenue)
Prior Quarters actual average annualised committed supports

September 2017 | COAG Disability Reform Council Quarterly Report 156
Figure H.5 Average committed support by primary disability group (including participants with shared supported
accommodation supports) – active participants with initial plan approvals 2017-18 Q1 compared with active
participants with initial plan approvals in prior quarters79 (TAS)
79 Average annualised committed supports are not shown where there is insufficient data in the group.
$0 $20,000 $40,000 $60,000 $80,000 $100,000 $120,000 $140,000 $160,000
ABI
Autism
Cerebral Palsy
Developmental Delay
Global Developmental Delay
Hearing Impairment
Intellectual Disability
Multiple Sclerosis
Psychosocial disability
Spinal Cord Injury
Stroke
Visual Impairment
Other Neurological
Other Physical
Other Sensory/Speech
Other
Average annualised committed supports
Pri
ma
ry d
isa
bil
ity
Prior Quarters actual average annualised committed supports
Prior Quarters expected average annualised committed supports (based on revenue)
2017-18 Q1 actual average annualised committed supports
2017-18 Q1 expected average annualised committed supports (based on revenue)

September 2017 | COAG Disability Reform Council Quarterly Report 157
Figure H.6 Average committed support by level of function (including participants with shared supported
accommodation supports) – active participants with initial plan approvals 2017-18 Q1 compared with active
participants with initial plan approvals in prior quarters80 (TAS)
Table H.32 Payments by financial year, compared to committed supports ($m) – TAS
2013-14 2014-15 2015-16 2016-17 2017-18 2018-19 and
beyond Total
Total Committed 18.0 51.9 66.0 99.4 109.3 9.0 353.7
Total Paid 10.0 36.6 48.6 75.1 18.4 - 188.6
% utilised to date 55% 71% 74% 76% - - 70%81
Figure H.7 Utilisation of committed supports as at 30 June 2017 and 30 September 2017 (TAS)
80 Average annualised committed supports are not shown where there is insufficient data in the group. Level of function 15 does not have sufficient data to show an average cost. 81 Note: Only committed supports expected to be used to 30 September 2017 have been used to calculate the utilisation from 1 July 2013 to date.
$0
$50,000
$100,000
$150,000
$200,000
$250,000
$300,000
$350,000
1 2 3 4 5 6 7 8 9 10 11 12 13 14 15
Av
era
ge
an
nu
ali
se
d c
om
mit
ted
su
pp
ort
s
Level of function
2017-18 Q1 expected average annualised committed supports (based on revenue)
2017-18 Q1 actual average annualised committed supports
Prior quarter expected average annualised committed supports (based on revenue)
Prior quarter actual average annualised committed supports
55% 55%
71% 71%78% 74% 69%
76%
55%
$0m
$20m
$40m
$60m
$80m
$100m
$120m
2013-14 2014-15 2015-16 2016-17 2017-18YTD
Co
mm
itte
d s
up
po
rts
As at 30 Jun 2017: Paid As at 30 Jun 2017: Remaining
As at 30 Sep 2017: Paid As at 30 Sep 2017: Remaining
EXPERIENCE IS STILL EMERGING
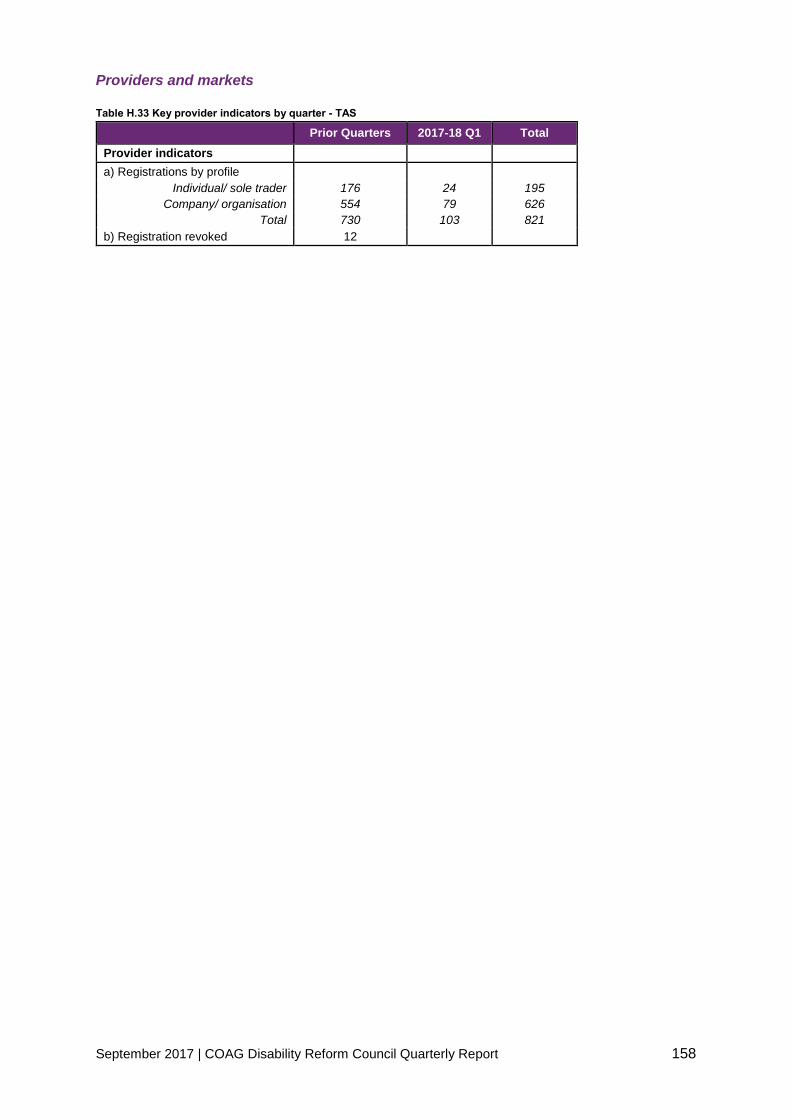
September 2017 | COAG Disability Reform Council Quarterly Report 158
Providers and markets
Table H.33 Key provider indicators by quarter - TAS
Prior Quarters 2017-18 Q1 Total
Provider indicators
a) Registrations by profile
Individual/ sole trader 176 24 195
Company/ organisation 554 79 626
Total 730 103 821
b) Registration revoked 12

September 2017 | COAG Disability Reform Council Quarterly Report 159
Table H.34 Number of approved providers by registration group - TAS82
Registration Group Prior
Quarters 2017-18
Q1 Total % Change
Assistance services
Accommodation / Tenancy Assistance 61 4 65 7%
Assistance Animals 1 1 2 100%
Assistance with daily life tasks in a group or shared living arrangement
58 3 61 5%
Assistance with travel/transport arrangements 116 6 122 5%
Daily Personal Activities 79 4 83 5%
Group and Centre Based Activities 68 5 73 7%
High Intensity Daily Personal Activities 78 4 82 5%
Household tasks 95 12 107 13%
Interpreting and translation 28 4 32 14%
Participation in community, social and civic activities 104 5 109 5%
Assistive Technology
Assistive equipment for recreation 100 24 124 24%
Assistive products for household tasks 81 14 95 17%
Assistance products for personal care and safety 177 37 214 21%
Communication and information equipment 78 16 94 21%
Customised Prosthetics 57 4 61 7%
Hearing Equipment 53 4 57 8%
Hearing Services 3 2 5 67%
Personal Mobility Equipment 150 32 182 21%
Specialised Hearing Services 9 2 11 22%
Vision Equipment 39 2 41 5%
Capacity Building Services
Assistance in coordinating or managing life stages, transitions and supports
95 6 101 6%
Behaviour Support 59 3 62 5%
Community nursing care for high needs 32 2 34 6%
Development of daily living and life skills 88 2 90 2%
Early Intervention supports for early childhood 55 6 61 11%
Exercise Physiology and Physical Wellbeing activities
56 3 59 5%
Innovative Community Participation 55 14 69 25%
Specialised Driving Training 38 1 39 3%
Therapeutic Supports 194 12 206 6%
Capital services
Home modification design and construction 77 8 85 10%
Specialised Disability Accommodation 19 10 29 53%
Vehicle Modifications 28 3 31 11%
Choice and control support services
Management of funding for supports in participants plan
27 1 28 4%
Support Coordination 43 7 50 16%
Employment and Education support services
Assistance to access and/or maintain employment and/or education
47 0 47 0%
Specialised Supported Employment 26 0 26 0%
Total approved providers 718 103 821 14%
82 The 12 providers whose registration ended during the first quarter of 2017-18 are not included in the 2016-17 Q4 and prior numbers in this table.

September 2017 | COAG Disability Reform Council Quarterly Report 160
Table H.35 Key markets indicators by quarter - TAS
Market indicators Prior Quarters 2017-18 Q1
a) Average number of providers per participant 1.42 1.36
b) Number of providers delivering new supports 65 71
c) Change in the number of active/inactive providers:
Active (%) 46% 48%
Not yet active (%) 47% 43%
Inactive (%) 7% 9%
d) Share of payments - top 25%
Daily Tasks/Shared Living (%) 61% 69%
Therapeutic Supports (%) 70% 76%
Participate Community (%) 68% 78%
Early Childhood Supports (%) 90% 93%
Assist Personal Activities (%) 79% 79%
Table H.36 Proportion of active participants with approved plans accessing mainstream supports - TAS
Prior
Quarters 2017-18 Q1 Total
Assistive technology 1% 1% 1%
Choice & Control 3% 3% 3%
Consumables 0% 0% 0%
Daily Activities 7% 14% 9%
Daily Equipment 1% 1% 1%
Employment 2% 3% 2%
Health & Wellbeing 53% 58% 55%
Home Living 3% 3% 3%
Housing & Home modifications 0% 1% 0%
Independence 2% 3% 2%
Lifelong Learning 44% 33% 40%
Relationships 3% 5% 3%
Social & Civic 4% 2% 3%
Transport 2% 1% 2%
Non-categorised 19% 21% 20%
Any mainstream service 89% 94% 91%

September 2017 | COAG Disability Reform Council Quarterly Report 161
Appendix I
Appendix I: Australian Capital Territory
The tables below replicate the tables in the main parts of this report for ACT only where the
data is available.
Participant Demographics
Table I.1 Plan approvals compared to estimates – ACT
Prior
Quarters 2017-18 Q1
Total excluding
ECEI
Total including
ECEI
Bilateral estimates
ACT 6,048 253 6,301 6,301 5,075
Table I.2 Quarterly intake split by plan and entry type since 1 July 2013 – ACT
Prior Quarters 2017-18 Q1 Total
Access decisions 7,522 230 7,752
Access Met 6,555 115 6,670
State 2,684 3 2,687
New 3,638 107 3,745
Commonwealth 233 5 238
Total Participant Plans 6,048 253 6,301
EI (s25) plans 2,119 112 2,231
PD (s24) plans 3,929 141 4,070
ECEI 0 0 0
Table I.3 Plan reviews conducted per quarter – ACT
Prior Quarters
(Transition only)
2017-18 Q1 Transition
Total
Total plan reviews 4,120 1,413 5,533
Early intervention plans 1,385 394 1,779
Permanent disability plans 2,735 1,019 3,754
Table I.4 Exits from the Scheme since 1 July 2013 as at 30 September 2017 – ACT
Exits
Total plan exits 280
Early Intervention plans 156
Permanent disability plans 124
Table I.5 Cumulative position by services previously received – ACT
Participant cohort Bilateral estimate
% of estimate
Awaiting a plan
State Commonwealth New ECEI Total
Trial 2,502 82 1,514 4,098 4,278 96%
End of 2016-17 2,647 208 3,193 0 6,048 5,075 119%
End of 2017-18 Q1 2,653 223 3,425 0 6,301 5,075 124% 288

September 2017 | COAG Disability Reform Council Quarterly Report 162
Table I.6 Cumulative position by entry into the Scheme – ACT
Participant cohort Bilateral estimate
% of estimate
Awaiting a plan
EI (s25) plan PD (s24) plan ECEI Total
Trial 1,559 2,539 4,098 4,278 96%
End of 2016-17 2,119 3,929 0 6,048 5,075 119%
End of 2017-18 Q1 2,231 4,070 0 6,301 5,075 124% 288
Table I.7 Active participants with approved plans per quarter by disability group – ACT83
Prior Quarters 2017-18 Q1 Total
Disability N % N % N %
Intellectual Disability 1,196 21% 32 13% 1,228 20%
Autism 1,245 22% 74 29% 1,319 22%
Psychosocial disability 729 13% 26 10% 755 13%
Cerebral Palsy 249 4% 4 2% 253 4%
Developmental Delay 498 9% 33 13% 531 9%
Other Neurological 226 4% 13 5% 239 4%
Other Physical 395 7% 19 8% 414 7%
Acquired Brain Injury 138 2% 5 2% 143 2%
Hearing Impairment 235 4% 10 4% 245 4%
Other Sensory/Speech 278 5% 8 3% 286 5%
Visual Impairment 121 2% 11 4% 132 2%
Multiple Sclerosis 147 3% 3 1% 150 2%
Global Developmental Delay 91 2% 11 4% 102 2%
Spinal Cord Injury 44 1% 2 1% 46 1%
Stroke 76 1% 2 1% 78 1%
Other 100 2% 0 0% 100 2%
Total 5,768 100% 253 100% 6,021 100%
Table I.8 Active participants with approved plan per quarter by level of function – ACT
Prior Quarters 2017-18 Q1 Total
Level of Function N % N % N %
1 (High Function) 21 0% 1 0% 22 0%
2 (High Function) 14 0% 0 0% 14 0%
3 (High Function) 278 5% 20 8% 298 5%
4 (High Function) 518 10% 44 17% 562 10%
5 (High Function) 1,338 25% 65 26% 1,403 25%
6 (Moderate Function) 646 12% 39 15% 685 12%
7 (Moderate Function) 375 7% 19 8% 394 7%
8 (Moderate Function) 420 8% 15 6% 435 8%
9 (Moderate Function) 33 1% 0 0% 33 1%
10 (Moderate Function) 541 10% 18 7% 559 10%
11 (Low Function) 261 5% 7 3% 268 5%
12 (Low Function) 673 12% 21 8% 694 12%
13 (Low Function) 197 4% 3 1% 200 4%
14 (Low Function) 106 2% 1 0% 107 2%
15 (Low Function) 1 0% 0 0% 1 0%
Missing 346 0 346
Total 5,768 100% 253 100% 6,021 100%
83 Table order based on national proportions (highest to lowest)

September 2017 | COAG Disability Reform Council Quarterly Report 163
Table I.9 Participant profile per quarter by Age group – ACT
Prior Quarters 2017-18 Q1 Total
Age Group N % N % N %
0 to 6 918 16% 66 26% 984 16%
7 to 14 1,453 25% 59 23% 1,512 25%
15 to 18 472 8% 16 6% 488 8%
19 to 24 444 8% 10 4% 454 8%
25 to 34 437 8% 27 11% 464 8%
35 to 44 525 9% 29 11% 554 9%
45 to 54 640 11% 23 9% 663 11%
55 to 64 691 12% 22 9% 713 12%
65+ 188 3% 1 0% 189 3%
Total 5,768 100% 253 100% 6,021 100%
Table I.10 Participant profile per quarter by Gender – ACT
Prior Quarters 2017-18 Q1 Total
Gender N % N % N %
Male 3,454 60% 168 66% 3,622 60%
Female 2,298 40% 83 33% 2,381 40%
Indeterminate 16 0% 2 1% 18 0%
Total 5,768 100% 253 100% 6,021 100%
Table I.11 Participant profile per quarter by Aboriginal and Torres Strait islander status – ACT
Prior Quarters 2017-18 Q1 Total
Participant profile N % N % N %
Aboriginal and Torres Strait Islander
249 4.3% 6 2.4% 255 4.2%
Not Aboriginal and Torres Strait Islander
5,300 91.9% 243 96.0% 5,543 92.1%
Not Stated 219 3.8% 4 1.6% 223 3.7%
Total 5,768 100% 253 100% 6,021 100%
Table I.12 Participant profile per quarter by culturally and linguistically diverse (CALD) status – ACT
Prior Quarters 2017-18 Q1 Total
Participant profile N % N % N %
CALD 385 6.7% 23 9.1% 408 6.8%
Not CALD 5,218 90.5% 230 90.9% 5,448 90.5%
Not Stated 165 2.9% 0 0.0% 165 2.7%
Total 5,768 100% 253 100% 6,021 100%
Table I.13 Participant profile per quarter by Young people in Residential aged care (YPIRAC) status – ACT
Prior Quarters 2017-18 Q1 Total
Participant profile N % N % N %
YPIRAC 30 0.5% 1 0.4% 31 0.5%
Not YPIRAC 5,738 99.5% 252 99.6% 5,990 99.5%
Total 5,768 100% 253 100% 6,021 100%
Table I.14 Distribution of active participants by method of Financial Plan Management and quarter of plan approval –
ACT
Prior Quarters
(Transition only) 2017-18 Q1 Total
Self-managed fully 21% 19% 20%
Self-managed partly 18% 12% 15%
Plan managed 26% 28% 27%
Agency managed 35% 41% 38%
Total 100% 100% 100%

September 2017 | COAG Disability Reform Council Quarterly Report 164
Table I.15 Distribution of active participants by support coordination and quarter of plan approval – ACT
Prior Quarters
(Transition only) 2017-18 Q1 Total
Support coordination 74% 21% 51%
Table I.16 Duration to plan activation by quarter of initial plan approval for active participants – ACT
2016-17 Q1 2016-17 Q2 2016-17 Q3 2016-17 Q4
Plan activation N % N % N % N %
Less than 30 days 535 56% 238 51% 206 47% 42 71%
30 to 59 days 123 13% 70 15% 56 13% 2 3%
60 to 89 days 52 5% 45 10% 22 5% 2 3%
Activated within 90 days
710 74% 353 76% 284 64% 46 78%
90 to 119 days 19 2% 18 4% 13 3% 1 2%
120 days and over 104 11% 30 6% 41 9% 0 0%
Activated between 90 and 180 days
123 13% 48 10% 54 12% 1 2%
No payments 126 13% 63 14% 104 24% 12 20%
Total plans approved 959 100% 464 100% 442 100% 59 100%
Table I.17 Number of questionnaires completed by SFOF version – ACT
Version Number of questionnaires
collected 2016-17 Number of questionnaires
collected Q1 2017-18 Number of questionnaires
Participant 0 to school 292 43 335
Participant school to 14 238 33 271
Participant 15 to 24 166 16 182
Participant 25 and over 888 79 967
Total Participant 1,584 171 1,755
Family 0 to 14 456 112 568
Family 15 to 24 36 17 53
Family 25 and over 25 15 40
Total Family 517 144 661
Total 2,101 315 2,416

September 2017 | COAG Disability Reform Council Quarterly Report 165
Table I.18 Selected key indicators for participants – Daily Living (DL) and Choice and Control (CC) – ACT
Indicator 0 to before
school School to 14
15 to 24 25 and over
DL
% with concerns in 6 or more of the areas: gross motor skills, fine motor skills, self-care, eating, social interaction, communication, cognitive development, sensory processing
36%
CC % who say their child is able to tell them what he/she wants
81%
DL % developing functional, learning and coping skills appropriate to their ability and circumstances
35%
DL % who say their child is becoming more independent
55%
CC % of children who have a genuine say in decisions about themselves
88%
CC % who are happy with the level of independence/control they have now
40%
CC % who choose who supports them 50% 67%
CC % who choose what they do each day 61% 78%
CC % who had been given the opportunity to participate in a self-advocacy group meeting
19% 26%
CC % who want more choice and control in their life
71% 70%
Table I.19 Selected key indicators for participants – Relationships (REL) and Social/ Community Participation (S/CP) –
ACT
Indicator 0 to before
school School to
14 15 to 24
25 and over
REL % of children who can make friends with people outside the family
71% 76%
S/CP % of children who participate in age appropriate community, cultural or religious activities
64%
REL % of children who spend time after school and on weekends with friends and/or in mainstream programs
48%
REL Of these, % who are welcomed or actively included
67% 82%
REL % of children who spend time with friends without an adult present
25%
REL % with no friends other than family or paid staff
23% 26%
S/CP % who have been actively involved in a community, cultural or religious group in the last 12 months
34% 37%

September 2017 | COAG Disability Reform Council Quarterly Report 166
Table I.20 Selected key indicators for participants – Lifelong Learning (LL), Work (WK), Home (HM) and Health and
Wellbeing (HW) – ACT
Indicator 0 to before
school School to
14 15 to 24
25 and over
LL % of children attending school in a mainstream class
78%
HM % who are happy with their home 79% 71%
HM % who feel safe or very safe in their home
83% 68%
HW % who rate their health as good, very good or excellent
64% 43%
HW % who did not have any difficulties accessing health services
74% 61%
LL % who currently attend or previously attended school in a mainstream class
60%
LL % who participate in education, training or skill development
17%
LL Of those who participate, % who do so in mainstream settings
79%
LL % unable to do a course or training they wanted to do in the last 12 months
45%
WK % who have a paid job 28% 31%
WK % who volunteer 14% 16%

September 2017 | COAG Disability Reform Council Quarterly Report 167
Table I.21 Selected key indicators for families/ carers of participants – ACT
Indicator 0 to 14 15 to 24 25 and over
% receiving Carer Payment 11% 21% 20%
% receiving Carer Allowance 18% 34% 30%
% working in a paid job 54% 66% 48%
Of those in a paid job, % in permanent employment
86% 79% Numbers are too
small
Of those in a paid job, % working 15 hours or more
83% 79% Numbers are too
small
% who say they (and their partner) are able to work as much as they want
53% 69% 50%
Of those unable to work as much as they want, % who say the situation of their child/family member with disability is a barrier to working more
83% Numbers are too
small Numbers are too
small
Of those unable to work as much as they want, % who say insufficient flexibility of jobs is a barrier to working more
29% Numbers are too
small Numbers are too
small
% able to advocate for their child/family member
89% 86% 92%
% who have friends and family they see as often as they like
53% 55% 50%
% who feel very confident or somewhat confident in supporting their child's development
88%
% who know what their family can do to enable their family member with disability to become as independent as possible
68%
% who feel in control selecting services 74% 43%
% who have made plans (or begun to make plans) for when they are no longer able to care for their family member with disability
42%
% who rate their health as good, very good or excellent
78% 68% 71%
Table I.22 Results for “Has the NDIS helped?” questions answered at review, for SFOF version ‘Participant 0 to school’
(n=60) – ACT
Question Yes
DL Has the NDIS improved your child's development? 98%
DL Has the NDIS improved your child's access to specialist services? 97%
CC Has the NDIS helped increase your child's ability to communicate what they want?
86%
REL Has the NDIS improved how your child fits into family life? 75%
S/CP Has the NDIS improved how your child fits into community life? 69%

September 2017 | COAG Disability Reform Council Quarterly Report 168
Table I.23 Results for “Has the NDIS helped?” questions answered at review, for SFOF version ‘Participant school to
14’ (n=74) – ACT
Question Yes
DL Has the NDIS helped your child to become more independent? 52%
LL Has the NDIS improved your child's access to education? 33%
REL Has the NDIS improved your child's relationships with family and friends?
56%
S/CP Has the NDIS improved your child's social and recreational life? 47%
Table I.24 Results for “Has the NDIS helped?” questions answered at review, for SFOF versions ‘Participant 15 to 24’
(n=54) and ‘Participant 25 and over’ (n=334) – ACT
Question 15 to 24 % Yes
25+ % Yes
CC Has the NDIS helped you have more choices and more control over your life?
60% 77%
DL Has the NDIS helped you with daily living activities? 53% 78%
REL Has the NDIS helped you to meet more people? 43% 49%
HM Has your involvement with the NDIS helped you to choose a home that's right for you?
16% 25%
HW Has your involvement with the NDIS improved your health and wellbeing?
49% 60%
LL Had your involvement with the NDIS helped you to learn things you want to learn or to take courses you want to take?
24% 32%
WK Has your involvement with the NDIS helped you find a job that's right for you?
23% 18%
S/CP Has the NDIS helped you be more involved? 46% 59%
Table I.25 Results for “Has the NDIS helped?” questions answered at review, for SFOF version ‘Family 0 to 14’
(n=115); and for SFOF versions ‘Family 15 to 24’ and ‘Family 25 and over’ combined (n=21) – ACT
Question 0 to 14 % Yes
15+ % Yes
Has the NDIS improved your capacity to advocate (stand up) for your child? / Has the NDIS helped you to know your rights and advocate effectively?
55%
Numbers
are too
small
Has the NDIS improved the level of support for your family? 66%
Numbers
are too
small
Has the NDIS improved your access to services, programs and activities in the community?
77%
Numbers
are too
small
Has the NDIS improved your ability/capacity to help your child develop and learn?
80%
Has the NDIS improved your health and wellbeing? 43%
Numbers
are too
small
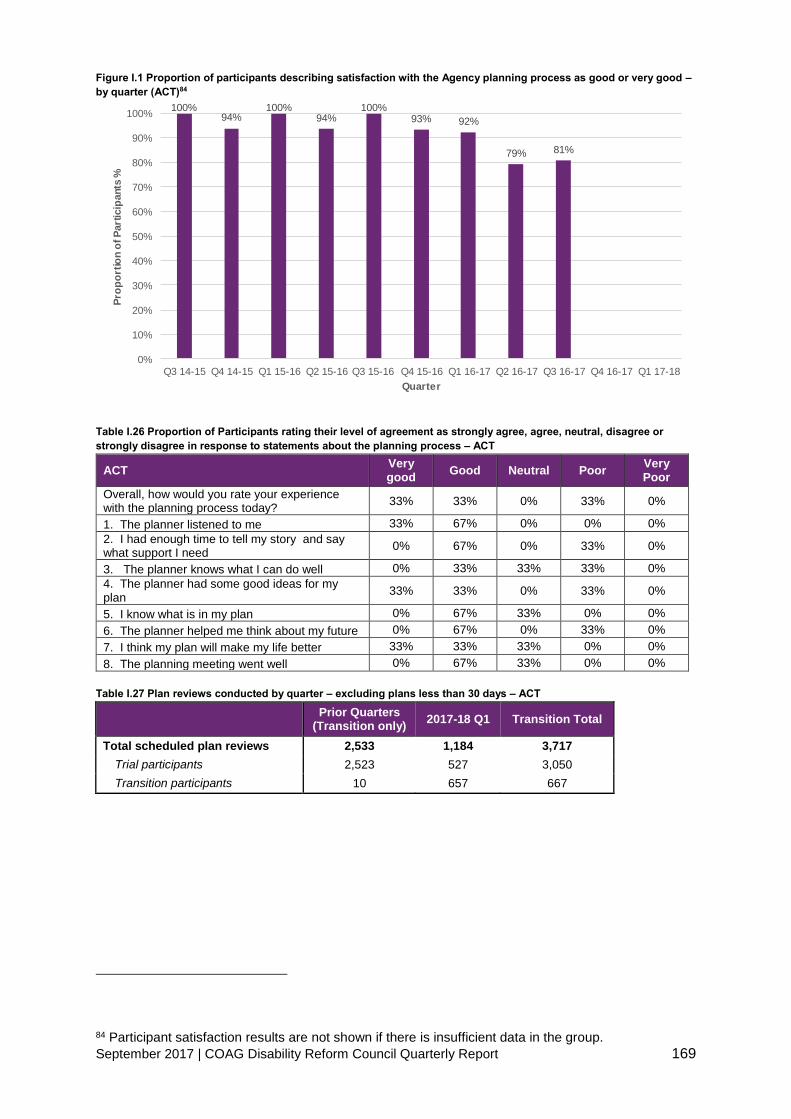
September 2017 | COAG Disability Reform Council Quarterly Report 169
Figure I.1 Proportion of participants describing satisfaction with the Agency planning process as good or very good –
by quarter (ACT)84
Table I.26 Proportion of Participants rating their level of agreement as strongly agree, agree, neutral, disagree or
strongly disagree in response to statements about the planning process – ACT
ACT Very good
Good Neutral Poor Very Poor
Overall, how would you rate your experience with the planning process today?
33% 33% 0% 33% 0%
1. The planner listened to me 33% 67% 0% 0% 0%
2. I had enough time to tell my story and say what support I need
0% 67% 0% 33% 0%
3. The planner knows what I can do well 0% 33% 33% 33% 0%
4. The planner had some good ideas for my plan
33% 33% 0% 33% 0%
5. I know what is in my plan 0% 67% 33% 0% 0%
6. The planner helped me think about my future 0% 67% 0% 33% 0%
7. I think my plan will make my life better 33% 33% 33% 0% 0%
8. The planning meeting went well 0% 67% 33% 0% 0%
Table I.27 Plan reviews conducted by quarter – excluding plans less than 30 days – ACT
Prior Quarters (Transition only)
2017-18 Q1 Transition Total
Total scheduled plan reviews 2,533 1,184 3,717
Trial participants 2,523 527 3,050
Transition participants 10 657 667
84 Participant satisfaction results are not shown if there is insufficient data in the group.
100%94%
100%94%
100%93% 92%
79% 81%
0%
10%
20%
30%
40%
50%
60%
70%
80%
90%
100%
Q3 14-15 Q4 14-15 Q1 15-16 Q2 15-16 Q3 15-16 Q4 15-16 Q1 16-17 Q2 16-17 Q3 16-17 Q4 16-17 Q1 17-18
Pro
po
rtio
n o
f P
art
icip
ants
%
Quarter

September 2017 | COAG Disability Reform Council Quarterly Report 170
Table I.28 Plan reviews conducted by quarter – excluding plans less than 30 days – ACT
Prior Quarters (Transition only)
2017-18 Q1 Transition Total
Total unscheduled plan reviews 1,587 229 1,816
Trial participants 1,352 166 1,518
Transition participants 235 63 298
Table I.29 Estimated rate of unscheduled plan reviews – excluding plans less than 30 days – ACT85
Prior Quarters
(Transition only)
2017-18 Q1 Transition
Total
% unscheduled reviews 29.3% 14.8% 26.1%
Table I.30 AAT cases by category – ACT
Prior
Quarters 2017-18 Q1 Total
AAT Cases 41 20 61
Access 16 11 27
Plan 25 9 34
Plan Review 0 0 0
Other 0 0 0
Committed supports and payments
Table I.31 Committed supports by financial year ($m) – ACT
2013-14 2014-15 2015-16 2016-17 2017-18 2018-19
and beyond
Total
Total Committed
- 26.6 137.1 279.3 212.8 11.4 667.3
85 The number of participants used in the calculation considers the length of time the participants have been in the Scheme.

September 2017 | COAG Disability Reform Council Quarterly Report 171
Figure I.2 Distribution of participants by annualised committed support band (including participants with shared
supported accommodation supports) – active participants with initial plan approvals 2017-18 Q1 compared with active
participants with initial plan approvals in prior quarters (ACT)
Figure I.3 Distribution of participants by annualised committed support band (excluding participants with shared
supported accommodation supports) – active participants with initial plan approvals 2017-18 Q1 compared with active
participants with initial plan approvals in prior quarters86 (ACT)
0.00%
5.00%
10.00%
15.00%
20.00%
25.00%
30.00%
Dis
trib
uti
on
o
f p
art
icip
an
ts
Average annualised committed supports band
Prior Quarters distribution of participants 2017-18 Q1 distribution of participants
0.00%
5.00%
10.00%
15.00%
20.00%
25.00%
30.00%
Dis
trib
uti
on
o
f p
art
icip
an
ts
Average annualised committed supports band
Prior Quarters distribution of participants 2017-18 Q1 distribution of participants

September 2017 | COAG Disability Reform Council Quarterly Report 172
Figure I.4 Average committed support by age group (including participants with shared supported accommodation
supports) – active participants with initial plan approvals 2017-18 Q1 compared with active participants with initial
plan approvals in prior quarters87 (ACT)
86 Average annualised committed supports are not shown where there is insufficient data in the group. 87 Average annualised committed supports are not shown where there is insufficient data in the group.
$0
$20,000
$40,000
$60,000
$80,000
$100,000
$120,000
0 to 6 7 to 14 15 to 18 19 to 24 25 to 34 35 to 44 45 to 54 55 to 64 65+Av
era
ge
an
nu
ali
se
d c
om
mit
ted
su
pp
ort
s
Age group
2017-18 Q1 expected average annualised committed supports (based on revenue)
2017-18 Q1 actual average annualised committed supports
Prior quarter expected average annualised committed supports (based on revenue)
Prior quarter actual average annualised committed supports

September 2017 | COAG Disability Reform Council Quarterly Report 173
Figure I.5 Average committed support by primary disability group (including participants with shared supported
accommodation supports) – active participants with initial plan approvals 2017-18 Q1 compared with active
participants with initial plan approvals in prior quarters88 (ACT)
88 Average annualised committed supports are not shown where there is insufficient data in the group.
$0 $20,000 $40,000 $60,000 $80,000 $100,000 $120,000 $140,000 $160,000
ABI
Autism
Cerebral Palsy
Developmental Delay
Global Developmental Delay
Hearing Impairment
Intellectual Disability
Multiple Sclerosis
Psychosocial disability
Spinal Cord Injury
Stroke
Visual Impairment
Other Neurological
Other Physical
Other Sensory/Speech
Other
Average annualised committed supports
Pri
ma
ry d
isa
bil
ity
Prior quarter actual average annualised committed supports
Prior quarter expected average annualised committed supports (based on revenue)
2017-18 Q1 actual average annualised committed supports
2017-18 Q1 expected average annualised committed supports (based on revenue)

September 2017 | COAG Disability Reform Council Quarterly Report 174
Figure I.6 Average committed support by level of function (including participants with shared supported
accommodation supports) – active participants with initial plan approvals 2017-18 Q1 compared with active
participants with initial plan approvals in prior quarters89 (ACT)
Table I.32 Payments by financial year, compared to committed supports ($m) – ACT
2013-14 2014-15 2015-16 2016-17 2017-18 2018-19 and
beyond Total
Total Committed - 26.6 137.1 279.3 212.8 11.4 667.3
Total Paid - 21.1 115.1 189.4 42.3 - 367.9
% utilised to date - 79% 84% 68% - - 70%90
Figure I.7 Utilisation of committed supports as at 30 June 2017 and 30 September 2017 (ACT)
89 Average annualised committed supports are not shown where there is insufficient data in the group. Level of function 15 does not have sufficient data to show an average cost. 90 Note: Only committed supports expected to be used to 30 September 2017 have been used to calculate the utilisation from 1 July 2013 to date.
$0
$20,000
$40,000
$60,000
$80,000
$100,000
$120,000
$140,000
$160,000
$180,000
$200,000
1 2 3 4 5 6 7 8 9 10 11 12 13 14 15
Av
era
ge
an
nu
ali
se
d c
om
mit
ted
su
pp
ort
s
Level of function
2017-18 Q1 expected average annualised committed supports (based on revenue)
2017-18 Q1 actual average annualised committed supports
Prior quarter expected average annualised committed supports (based on revenue)
Prior quarter actual average annualised committed supports
79% 79%
84% 84%
65%68%
54%
$0m
$50m
$100m
$150m
$200m
$250m
$300m
2013-14 2014-15 2015-16 2016-17 2017-18YTD
Co
mm
itte
d s
up
po
rts
As at 30 Jun 2017: Paid As at 30 Jun 2017: Remaining
As at 30 Sep 2017: Paid As at 30 Sep 2017: Remaining
EXPERIENCE IS STILL EMERGING

September 2017 | COAG Disability Reform Council Quarterly Report 175
Providers and markets
Table I.33 Key provider indicators by quarter – ACT
Prior Quarters 2017-18 Q1 Total
Provider indicators
a) Registrations by profile
Individual/ sole trader 191 39 224
Company/ organisation 623 104 718
Total 814 143 942
b) Registration revoked 15

September 2017 | COAG Disability Reform Council Quarterly Report 176
Table I.34 Number of approved providers by registration group - ACT91
Registration Group Prior
Quarters 2017-18
Q1 Total % Change
Assistance services
Accommodation / Tenancy Assistance 43 1 44 2%
Assistance Animals 1 3 4 300%
Assistance with daily life tasks in a group or shared living arrangement
55 2 57 4%
Assistance with travel/transport arrangements 133 18 151 14%
Daily Personal Activities 67 3 70 4%
Group and Centre Based Activities 52 3 55 6%
High Intensity Daily Personal Activities 63 4 67 6%
Household tasks 142 30 172 21%
Interpreting and translation 33 8 41 24%
Participation in community, social and civic activities 87 2 89 2%
Assistive Technology
Assistive equipment for recreation 122 26 148 21%
Assistive products for household tasks 106 17 123 16%
Assistance products for personal care and safety 205 46 251 22%
Communication and information equipment 86 19 105 22%
Customised Prosthetics 80 7 87 9%
Hearing Equipment 44 5 49 11%
Hearing Services 13 1 14 8%
Personal Mobility Equipment 182 39 221 21%
Specialised Hearing Services 20 2 22 10%
Vision Equipment 44 4 48 9%
Capacity Building Services
Assistance in coordinating or managing life stages, transitions and supports
87 3 90 3%
Behaviour Support 67 1 68 1%
Community nursing care for high needs 54 12 66 22%
Development of daily living and life skills 84 6 90 7%
Early Intervention supports for early childhood 93 6 99 6%
Exercise Physiology and Physical Wellbeing activities
93 9 102 10%
Innovative Community Participation 71 19 90 27%
Specialised Driving Training 44 2 46 5%
Therapeutic Supports 202 18 220 9%
Capital services
Home modification design and construction 103 16 119 16%
Specialised Disability Accommodation 18 8 26 44%
Vehicle Modifications 28 2 30 7%
Choice and control support services
Management of funding for supports in participants plan
37 0 37 0%
Support Coordination 53 3 56 6%
Employment and Education support services
Assistance to access and/or maintain employment and/or education
58 1 59 2%
Specialised Supported Employment 20 0 20 0%
Total approved providers 799 143 942 18%
91 The 15 providers whose registration ended during the first quarter of 2017-18 are not included in the 2016-17 Q4 and prior numbers in this table.
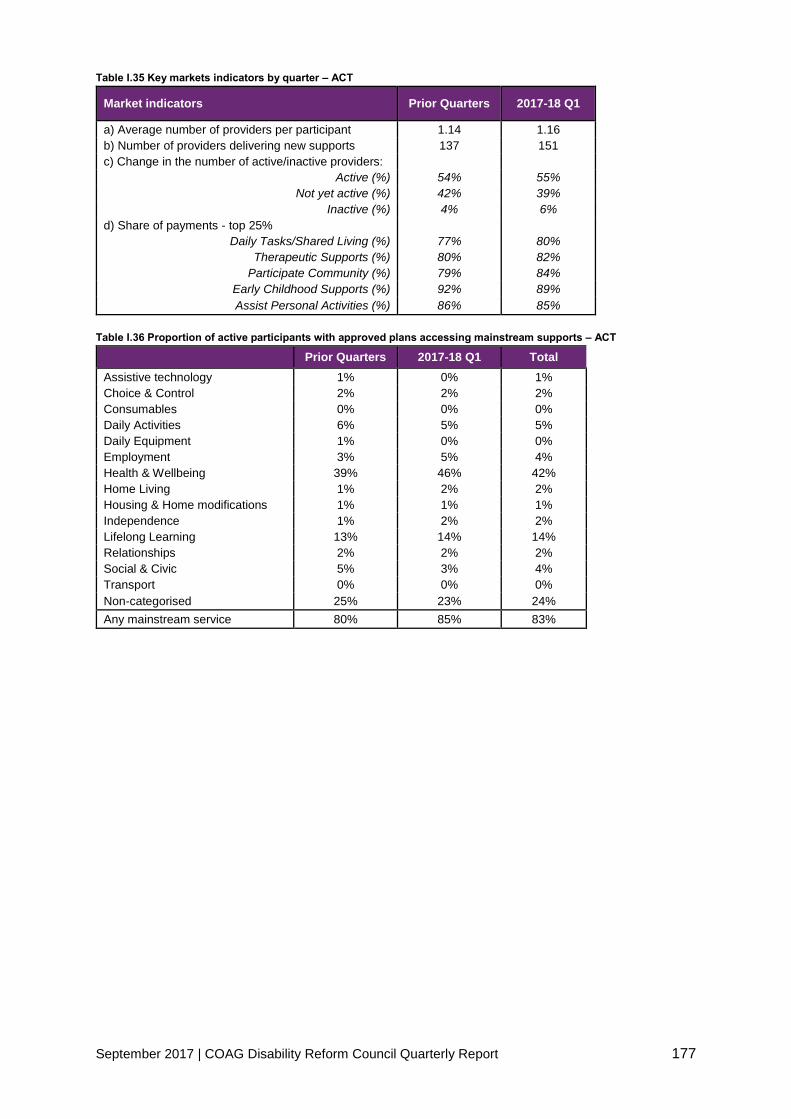
September 2017 | COAG Disability Reform Council Quarterly Report 177
Table I.35 Key markets indicators by quarter – ACT
Market indicators Prior Quarters 2017-18 Q1
a) Average number of providers per participant 1.14 1.16
b) Number of providers delivering new supports 137 151
c) Change in the number of active/inactive providers:
Active (%) 54% 55%
Not yet active (%) 42% 39%
Inactive (%) 4% 6%
d) Share of payments - top 25%
Daily Tasks/Shared Living (%) 77% 80%
Therapeutic Supports (%) 80% 82%
Participate Community (%) 79% 84%
Early Childhood Supports (%) 92% 89%
Assist Personal Activities (%) 86% 85%
Table I.36 Proportion of active participants with approved plans accessing mainstream supports – ACT
Prior Quarters 2017-18 Q1 Total
Assistive technology 1% 0% 1%
Choice & Control 2% 2% 2%
Consumables 0% 0% 0%
Daily Activities 6% 5% 5%
Daily Equipment 1% 0% 0%
Employment 3% 5% 4%
Health & Wellbeing 39% 46% 42%
Home Living 1% 2% 2%
Housing & Home modifications 1% 1% 1%
Independence 1% 2% 2%
Lifelong Learning 13% 14% 14%
Relationships 2% 2% 2%
Social & Civic 5% 3% 4%
Transport 0% 0% 0%
Non-categorised 25% 23% 24%
Any mainstream service 80% 85% 83%

September 2017 | COAG Disability Reform Council Quarterly Report 178
Appendix J
Appendix J: Northern Territory
The tables below replicate the tables in the main parts of this report for NT only where the
data is available.
Participant Demographics
Table J.1 Plan approvals compared to estimates – NT
Prior
Quarters 2017-18 Q1
Total excluding
ECEI
Total including
ECEI
Bilateral estimates
NT 388 159 547 547 899
Table J.2 Quarterly intake split by plan and entry type since 1 July 2013 – NT
Prior Quarters 2017-18 Q1 Total
Access decisions 520 172 692
Access Met 486 151 637
State 330 119 449
New 149 29 178
Commonwealth 7 3 10
Total Participant Plans 388 159 547
EI (s25) plans 69 8 77
PD (s24) plans 319 151 470
ECEI 0 0 0
Table J.3 Plan reviews conducted per quarter – NT
Prior Quarters
(Transition only)
2017-18 Q1 Transition
Total
Total plan reviews 297 195 492
Early intervention plans 50 15 65
Permanent disability plans 247 180 427
Table J.4 Exits from the Scheme since 1 July 2013 as at 30 September 2017 – NT
Exits
Total plan exits 14
Early Intervention plans 3
Permanent disability plans 11
Table J.5 Cumulative position by services previously received – NT
Participant cohort Bilateral estimate
% of estimate
Awaiting a plan
State Commonwealth New ECEI Total
Trial 72 3 80 155 149 104%
End of 2016-17 248 6 134 0 388 546 71%
End of 2017-18 Q1 391 6 150 0 547 899 61% 82

September 2017 | COAG Disability Reform Council Quarterly Report 179
Table J.6 Cumulative position by entry into the Scheme – NT
Participant cohort Bilateral estimate
% of estimate
Awaiting a plan
EI (s25) plan PD (s24) plan ECEI Total
Trial 38 117 155 149 104%
End of 2016-17 69 319 0 388 546 71%
End of 2017-18 Q1 77 470 0 547 899 61% 82
Table J.7 Active participants with approved plans per quarter by disability group - NT92
Prior Quarters 2017-18 Q1 Total
Disability N % N % N %
Intellectual Disability 119 32% 58 36% 177 33%
Autism 33 9% 8 5% 41 8%
Psychosocial disability 16 4% 3 2% 19 4%
Cerebral Palsy 46 12% 27 17% 73 14%
Developmental Delay 7 2% 3 2% 10 2%
Other Neurological 25 7% 9 6% 34 6%
Other Physical 42 11% 6 4% 48 9%
Acquired Brain Injury 30 8% 23 14% 53 10%
Hearing Impairment 11 3% 5 3% 16 3%
Other Sensory/Speech 6 2% 0 0% 6 1%
Visual Impairment 8 2% 3 2% 11 2%
Multiple Sclerosis 1 0% 0 0% 1 0%
Global Developmental Delay 4 1% 1 1% 5 1%
Spinal Cord Injury 8 2% 7 4% 15 3%
Stroke 15 4% 5 3% 20 4%
Other 3 1% 1 1% 4 1%
Total 374 100% 159 100% 533 100%
Table J.8 Active participants with approved plan per quarter by level of function – NT
Prior Quarters 2017-18 Q1 Total
Level of Function N % N % N %
1 (High Function) 1 0% 1 1% 2 0%
2 (High Function) 0 0% 0 0% 0 0%
3 (High Function) 14 4% 5 3% 19 4%
4 (High Function) 16 4% 6 4% 22 4%
5 (High Function) 36 10% 11 7% 47 9%
6 (Moderate Function) 29 8% 5 3% 34 7%
7 (Moderate Function) 26 7% 15 9% 41 8%
8 (Moderate Function) 16 4% 17 11% 33 6%
9 (Moderate Function) 3 1% 2 1% 5 1%
10 (Moderate Function) 37 10% 16 10% 53 10%
11 (Low Function) 43 12% 10 6% 53 10%
12 (Low Function) 69 19% 42 26% 111 21%
13 (Low Function) 35 10% 6 4% 41 8%
14 (Low Function) 36 10% 23 14% 59 11%
15 (Low Function) 0 0% 0 0% 0 0%
Missing 13 0 13
Total 374 100% 159 100% 533 100%
92 Table order based on national proportions (highest to lowest)

September 2017 | COAG Disability Reform Council Quarterly Report 180
Table J.9 Participant profile per quarter by Age group – NT
Prior Quarters 2017-18 Q1 Total
Age Group N % N % N %
0 to 6 26 7% 15 9% 41 8%
7 to 14 62 17% 16 10% 78 15%
15 to 18 16 4% 6 4% 22 4%
19 to 24 20 5% 18 11% 38 7%
25 to 34 58 16% 27 17% 85 16%
35 to 44 72 19% 25 16% 97 18%
45 to 54 74 20% 34 21% 108 20%
55 to 64 42 11% 18 11% 60 11%
65+ 4 1% 0 0% 4 1%
Total 374 100% 159 100% 533 100%
Table J.10 Participant profile per quarter by Gender – NT
Prior Quarters 2017-18 Q1 Total
Gender N % N % N %
Male 231 62% 102 64% 333 62%
Female 143 38% 57 36% 200 38%
Indeterminate 0 0% 0 0% 0 0%
Total 374 100% 159 100% 533 100%
Table J.11 Participant profile per quarter by Aboriginal and Torres Strait islander status – NT
Prior Quarters 2017-18 Q1 Total
Participant profile N % N % N %
Aboriginal and Torres Strait Islander
296 79.1% 116 73.0% 412 77.3%
Not Aboriginal and Torres Strait Islander
76 20.3% 31 19.5% 107 20.1%
Not Stated 2 0.5% 12 7.5% 14 2.6%
Total 374 100% 159 100% 533 100%
Table J.12 Participant profile per quarter by culturally and linguistically diverse (CALD) status – NT
Prior Quarters 2017-18 Q1 Total
Participant profile N % N % N %
CALD 5 1.3% 0 0.0% 5 0.9%
Not CALD 369 98.7% 159 100.0% 528 99.1%
Not Stated 0 0.0% 0 0.0% 0 0.0%
Total 374 100% 159 100% 533 100%
Table J.13 Participant profile per quarter by Young people in Residential aged care (YPIRAC) status – NT
Prior Quarters 2017-18 Q1 Total
Participant profile N % N % N %
YPIRAC 0 0.0% 0 0.0% 0 0.0%
Not YPIRAC 374 100.0% 159 100.0% 533 100.0%
Total 374 100% 159 100% 533 100%

September 2017 | COAG Disability Reform Council Quarterly Report 181
Table J.14 Distribution of active participants by method of Financial Plan Management and quarter of plan approval –
NT
Prior Quarters
(Transition only) 2017-18 Q1 Total
Self-managed fully 2% 1% 1%
Self-managed partly 3% 2% 3%
Plan managed 8% 16% 13%
Agency managed 87% 81% 83%
Total 100% 100% 100%
Table J.15 Distribution of active participants by support coordination and quarter of plan approval – NT
Prior Quarters
(Transition only) 2017-18 Q1 Total
Support coordination 92% 99% 97%
Table J.16 Duration to plan activation by quarter of initial plan approval for active participants – NT
2016-17 Q2 2016-17 Q3 2016-17 Q4
Plan activation N % N % N %
Less than 30 days 1 17% 48 36% 31 35%
30 to 59 days 1 17% 5 4% 6 7%
60 to 89 days 0 0% 9 7% 2 2%
Activated within 90 days 2 33% 62 46% 39 44%
90 to 119 days 0 0% 12 9% 1 1%
120 days and over 3 50% 12 9% 2 2%
Activated between 90 and 180 days
3 50% 24 18% 3 3%
No payments 1 17% 49 36% 46 52%
Total plans approved 6 100% 135 100% 88 100%

September 2017 | COAG Disability Reform Council Quarterly Report 182
Table J.17 Number of questionnaires completed by SFOF version – NT
Version Number of questionnaires
collected 2016-17 Number of questionnaires
collected Q1 2017-18 Number of questionnaires
Participant 0 to school 16 10 26
Participant school to 14 27 11 38
Participant 15 to 24 25 18 43
Participant 25 and over 159 81 240
Total Participant 227 120 347
Family 0 to 14 40 27 67
Family 15 to 24 3 3 6
Family 25 and over 15 9 24
Total Family 58 39 97
Total 285 159 444
Table J.18 Selected key indicators for participants – Daily Living (DL) and Choice and Control (CC) – NT
Indicator 0 to before
school School to 14
15 to 24 25 and over
DL
% with concerns in 6 or more of the areas: gross motor skills, fine motor skills, self-care, eating, social interaction, communication, cognitive development, sensory processing
65%
CC % who say their child is able to tell them what he/she wants
62%
DL % developing functional, learning and coping skills appropriate to their ability and circumstances
17%
DL % who say their child is becoming more independent
24%
CC % of children who have a genuine say in decisions about themselves
56%
CC % who are happy with the level of independence/control they have now
37%
CC % who choose who supports them 12% 15%
CC % who choose what they do each day 12% 21%
CC % who had been given the opportunity to participate in a self-advocacy group meeting
23% 18%
CC % who want more choice and control in their life
77% 81%

September 2017 | COAG Disability Reform Council Quarterly Report 183
Table J.19 Selected key indicators for participants – Relationships (REL) and Social/ Community Participation (S/CP) –
NT
Indicator 0 to before
school School to
14 15 to 24
25 and over
REL % of children who can make friends with people outside the family
60% 72%
S/CP % of children who participate in age appropriate community, cultural or religious activities
83%
REL % of children who spend time after school and on weekends with friends and/or in mainstream programs
50%
REL Of these, % who are welcomed or actively included
Numbers are too small
Numbers are too small
REL % of children who spend time with friends without an adult present
47%
REL % with no friends other than family or paid staff
16% 23%
S/CP % who have been actively involved in a community, cultural or religious group in the last 12 months
67% 50%
Table J.20 Selected key indicators for participants – Lifelong Learning (LL), Work (WK), Home (HM) and Health and
Wellbeing (HW) – NT
Indicator 0 to before
school School to
14 15 to 24
25 and over
LL % of children attending school in a mainstream class
36%
HM % who are happy with their home 60% 53%
HM % who feel safe or very safe in their home
71% 52%
HW % who rate their health as good, very good or excellent
48% 32%
HW % who did not have any difficulties accessing health services
33% 27%
LL % who currently attend or previously attended school in a mainstream class
4%
LL % who participate in education, training or skill development
4%
LL Of those who participate, % who do so in mainstream settings
Numbers are too small
LL % unable to do a course or training they wanted to do in the last 12 months
34%
WK % who have a paid job 7% 10%
WK % who volunteer 10% 9%
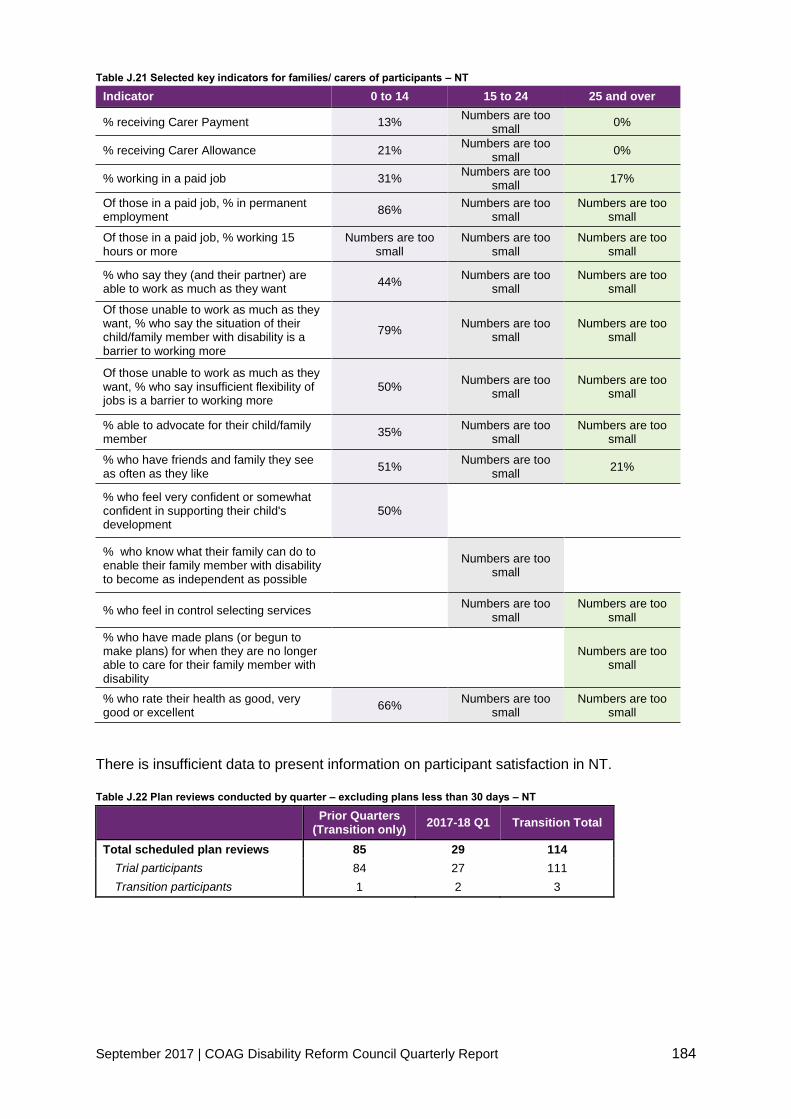
September 2017 | COAG Disability Reform Council Quarterly Report 184
Table J.21 Selected key indicators for families/ carers of participants – NT
Indicator 0 to 14 15 to 24 25 and over
% receiving Carer Payment 13% Numbers are too
small 0%
% receiving Carer Allowance 21% Numbers are too
small 0%
% working in a paid job 31% Numbers are too
small 17%
Of those in a paid job, % in permanent employment
86% Numbers are too
small Numbers are too
small
Of those in a paid job, % working 15 hours or more
Numbers are too small
Numbers are too small
Numbers are too small
% who say they (and their partner) are able to work as much as they want
44% Numbers are too
small Numbers are too
small
Of those unable to work as much as they want, % who say the situation of their child/family member with disability is a barrier to working more
79% Numbers are too
small Numbers are too
small
Of those unable to work as much as they want, % who say insufficient flexibility of jobs is a barrier to working more
50% Numbers are too
small Numbers are too
small
% able to advocate for their child/family member
35% Numbers are too
small Numbers are too
small
% who have friends and family they see as often as they like
51% Numbers are too
small 21%
% who feel very confident or somewhat confident in supporting their child's development
50%
% who know what their family can do to enable their family member with disability to become as independent as possible
Numbers are too
small
% who feel in control selecting services Numbers are too
small Numbers are too
small
% who have made plans (or begun to make plans) for when they are no longer able to care for their family member with disability
Numbers are too
small
% who rate their health as good, very good or excellent
66% Numbers are too
small Numbers are too
small
There is insufficient data to present information on participant satisfaction in NT.
Table J.22 Plan reviews conducted by quarter – excluding plans less than 30 days – NT
Prior Quarters (Transition only)
2017-18 Q1 Transition Total
Total scheduled plan reviews 85 29 114
Trial participants 84 27 111
Transition participants 1 2 3
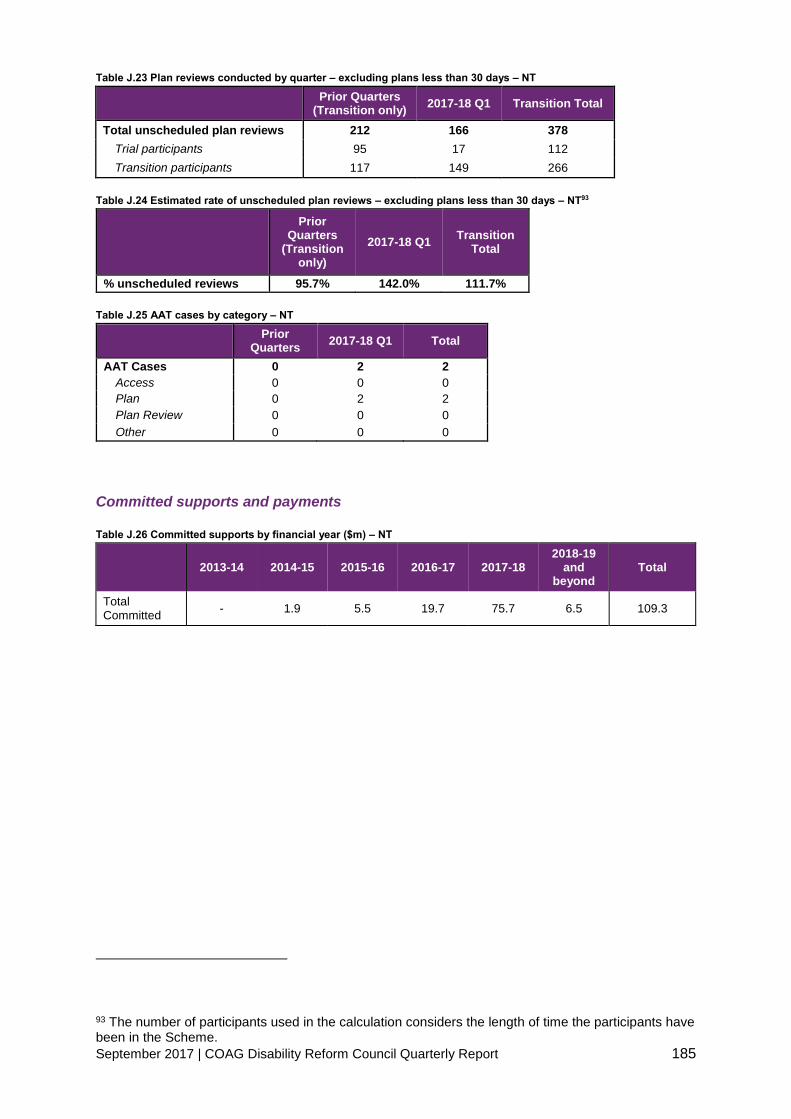
September 2017 | COAG Disability Reform Council Quarterly Report 185
Table J.23 Plan reviews conducted by quarter – excluding plans less than 30 days – NT
Prior Quarters (Transition only)
2017-18 Q1 Transition Total
Total unscheduled plan reviews 212 166 378
Trial participants 95 17 112
Transition participants 117 149 266
Table J.24 Estimated rate of unscheduled plan reviews – excluding plans less than 30 days – NT93
Prior Quarters
(Transition only)
2017-18 Q1 Transition
Total
% unscheduled reviews 95.7% 142.0% 111.7%
Table J.25 AAT cases by category – NT
Prior
Quarters 2017-18 Q1 Total
AAT Cases 0 2 2
Access 0 0 0
Plan 0 2 2
Plan Review 0 0 0
Other 0 0 0
Committed supports and payments
Table J.26 Committed supports by financial year ($m) – NT
2013-14 2014-15 2015-16 2016-17 2017-18 2018-19
and beyond
Total
Total Committed
- 1.9 5.5 19.7 75.7 6.5 109.3
93 The number of participants used in the calculation considers the length of time the participants have been in the Scheme.

September 2017 | COAG Disability Reform Council Quarterly Report 186
Figure J.1 Distribution of participants by annualised committed support band (including participants with shared
supported accommodation supports) – active participants with initial plan approvals 2017-18 Q1 compared with active
participants with initial plan approvals in prior quarters94 (NT)
94 Average annualised committed supports are not shown where there is insufficient data in the group.
0.00%
5.00%
10.00%
15.00%
20.00%
25.00%
30.00%
35.00%
40.00%
45.00%
50.00%
Dis
trib
uti
on
o
f p
art
icip
an
ts
Average annualised committed supports band
Prior Quarters distribution of participants 2017-18 Q1 distribution of participants

September 2017 | COAG Disability Reform Council Quarterly Report 187
Figure J.2 Distribution of participants by annualised committed support band (excluding participants with shared
supported accommodation supports) – active participants with initial plan approvals 2017-18 Q1 compared with active
participants with initial plan approvals in prior quarters95 (NT)
95 Average annualised committed supports are not shown where there is insufficient data in the group.
0.00%
5.00%
10.00%
15.00%
20.00%
25.00%
30.00%
35.00%
40.00%D
istr
ibu
tio
n o
f p
art
icip
an
ts
Average annualised committed supports band
Prior Quarters distribution of participants 2017-18 Q1 distribution of participants

September 2017 | COAG Disability Reform Council Quarterly Report 188
Figure J.3 Average committed support by age group (including participants with shared supported accommodation
supports) – active participants with initial plan approvals 2017-18 Q1 compared with active participants with initial
plan approvals in prior quarters96 (NT)
96 Average annualised committed supports are not shown where there is insufficient data in the group.
$0
$50,000
$100,000
$150,000
$200,000
$250,000
$300,000
0 to 6 7 to 14 15 to 18 19 to 24 25 to 34 35 to 44 45 to 54 55 to 64 65+Av
era
ge
an
nu
ali
se
d c
om
mit
ted
su
pp
ort
s
Age group
2017-18 Q1 expected average annualised committed supports (based on revenue)
2017-18 Q1 actual average annualised committed supports
Prior quarter expected average annualised committed supports (based on revenue)
Prior quarter actual average annualised committed supports

September 2017 | COAG Disability Reform Council Quarterly Report 189
Figure J.4 Average committed support by primary disability group (including participants with shared supported
accommodation supports) – active participants with initial plan approvals 2017-18 Q1 compared with active
participants with initial plan approvals in prior quarters97 (NT)
97 Average annualised committed supports are not shown where there is insufficient data in the group.
$0 $50,000 $100,000 $150,000 $200,000 $250,000 $300,000 $350,000
ABI
Autism
Cerebral Palsy
Developmental Delay
Global Developmental Delay
Hearing Impairment
Intellectual Disability
Multiple Sclerosis
Psychosocial disability
Spinal Cord Injury
Stroke
Visual Impairment
Other Neurological
Other Physical
Other Sensory/Speech
Other
Average annualised committed supports
Pri
ma
ry d
isa
bil
ity
Prior quarter actual average annualised committed supports
Prior quarter expected average annualised committed supports (based on revenue)
2017-18 Q1 actual average annualised committed supports
2017-18 Q1 expected average annualised committed supports (based on revenue)

September 2017 | COAG Disability Reform Council Quarterly Report 190
Figure J.5 Average committed support by level of function (including participants with shared supported
accommodation supports) – active participants with initial plan approvals 2017-18 Q1 compared with active
participants with initial plan approvals in prior quarters98 (NT)
Table J.27 Payments by financial year, compared to committed supports ($m) – NT
2013-14 2014-15 2015-16 2016-17 2017-18 2018-19 and
beyond Total
Total Committed - 1.9 5.5 19.7 75.7 6.5 109.3
Total Paid - 1.6 4.0 7.5 3.7 - 16.8
% utilised to date - 81% 73% 38% - - 38%99
Figure J.6 Utilisation of committed supports as at 30 June 2017 and 30 September 2017 (NT)
98 Average annualised committed supports are not shown where there is insufficient data in the group. Level of function 15 does not have sufficient data to show an average cost. 99 Note: Only committed supports expected to be used to 30 September 2017 have been used to calculate the utilisation from 1 July 2013 to date.
$0
$50,000
$100,000
$150,000
$200,000
$250,000
$300,000
$350,000
$400,000
1 2 3 4 5 6 7 8 9 10 11 12 13 14 15
Av
era
ge
an
nu
ali
se
d c
os
t
Level of function
2017-18 Q1 expected average annualised committed supports (based on revenue)
2017-18 Q1 actual average annualised committed supports
Prior quarter expected average annualised committed supports (based on revenue)
Prior quarter actual average annualised committed supports
86% 81%
80% 73% 26%38%
22%
$0m
$5m
$10m
$15m
$20m
$25m
2013-14 2014-15 2015-16 2016-17 2017-18YTD
Co
mm
itte
d s
up
po
rts
As at 30 Jun 2017: Paid As at 30 Jun 2017: Remaining
As at 30 Sep 2017: Paid As at 30 Sep 2017: Remaining
EXPERIENCE IS STILL EMERGING

September 2017 | COAG Disability Reform Council Quarterly Report 191
Providers and markets
Table J.28 Key provider indicators by quarter – NT
Prior Quarters 2017-18 Q1 Total
Provider indicators
a) Registrations by profile
Individual/ sole trader 60 10 65
Company/ organisation 323 33 349
Total 383 43 414
b) Registration revoked 12

September 2017 | COAG Disability Reform Council Quarterly Report 192
Table J.29 Number of approved providers by registration group – NT100
Registration Group Prior
Quarters 2017-18
Q1 Total % Change
Assistance services
Accommodation / Tenancy Assistance 40 10 50 25%
Assistance Animals 0 1 1
Assistance with daily life tasks in a group or shared living arrangement
17 6 23 35%
Assistance with travel/transport arrangements 45 9 54 20%
Daily Personal Activities 20 7 27 35%
Group and Centre Based Activities 17 7 24 41%
High Intensity Daily Personal Activities 21 4 25 19%
Household tasks 33 5 38 15%
Interpreting and translation 27 9 36 33%
Participation in community, social and civic activities 29 11 40 38%
Assistive Technology
Assistive equipment for recreation 65 -1 64 -2%
Assistive products for household tasks 50 0 50 0%
Assistance products for personal care and safety 82 3 85 4%
Communication and information equipment 67 13 80 19%
Customised Prosthetics 30 1 31 3%
Hearing Equipment 31 5 36 16%
Hearing Services 3 2 5 67%
Personal Mobility Equipment 76 1 77 1%
Specialised Hearing Services 5 2 7 40%
Vision Equipment 33 3 36 9%
Capacity Building Services
Assistance in coordinating or managing life stages, transitions and supports
22 9 31 41%
Behaviour Support 12 3 15 25%
Community nursing care for high needs 15 3 18 20%
Development of daily living and life skills 20 8 28 40%
Early Intervention supports for early childhood 14 2 16 14%
Exercise Physiology and Physical Wellbeing activities
28 0 28 0%
Innovative Community Participation 50 14 64 28%
Specialised Driving Training 15 0 15 0%
Therapeutic Supports 36 7 43 19%
Capital services
Home modification design and construction 41 0 41 0%
Specialised Disability Accommodation 9 6 15 67%
Vehicle Modifications 29 3 32 10%
Choice and control support services
Management of funding for supports in participants plan
7 6 13 86%
Support Coordination 13 8 21 62%
Employment and Education support services
Assistance to access and/or maintain employment and/or education
14 6 20 43%
Specialised Supported Employment 4 0 4 0%
Total approved providers 371 43 414 12%
100 The 12 providers whose registration ended during the first quarter of 2017-18 are not included in the 2016-17 Q4 and prior numbers in this table.

September 2017 | COAG Disability Reform Council Quarterly Report 193
Table J.30 Key markets indicators by quarter – NT
Market indicators Prior Quarters 2017-18 Q1
a) Average number of providers per participant 0.49 0.76
b) Number of providers delivering new supports 10 27
c) Change in the number of active/inactive providers:
Active (%) 48% 53%
Not yet active (%) 46% 41%
Inactive (%) 6% 7%
Table J.31 Proportion of active participants with approved plans accessing mainstream supports – NT
Prior Quarters 2017-18 Q1 Total
Assistive technology 0% 1% 1%
Choice & Control 0% 3% 2%
Consumables 0% 0% 0%
Daily Activities 8% 10% 10%
Daily Equipment 0% 0% 0%
Employment 1% 1% 1%
Health & Wellbeing 53% 54% 53%
Home Living 2% 2% 2%
Housing & Home modifications 0% 2% 1%
Independence 2% 5% 4%
Lifelong Learning 7% 4% 5%
Relationships 1% 2% 2%
Social & Civic 2% 4% 3%
Transport 0% 0% 0%
Non-categorised 21% 27% 25%
Any mainstream service 91% 94% 93%