Embed Size (px)
Citation preview

UNITED STATES SECURITIES AND EXCHANGE COMMISSIONWashington, D.C. 20549
_______________________________
FORM 10-K ☒ ANNUAL REPORT PURSUANT TO SECTION 13 OR 15(d) OF THE SECURITIES EXCHANGE ACT OF 1934
For the fiscal year ended December 31, 2020OR
☐ TRANSITION REPORT PURSUANT TO SECTION 13 OR 15(d) OF THE SECURITIES EXCHANGE ACT OF 1934For the transition period from ________ to ________
Commission file number: 001-38855 ___________________________________
Nasdaq, Inc. (Exact name of registrant as specified in its charter)
Delaware 52-1165937(State or Other Jurisdiction of Incorporation or Organization) (I.R.S. Employer Identification No.)
151 W. 42nd Street, New York, New York 10036(Address of Principal Executive Offices) (Zip Code)
Registrant’s telephone number, including area code: +1 212 401 8700 Securities registered pursuant to Section 12(b) of the Act:
Title of each class Trading Symbol(s) Name of each exchange on which registeredCommon Stock, $0.01 par value per share NDAQ The Nasdaq Stock Market
0.875% Senior Notes due 2030 NDAQ30 The Nasdaq Stock Market1.75% Senior Notes due 2029 NDAQ29 The Nasdaq Stock Market1.75% Senior Notes due 2023 NDAQ23 The Nasdaq Stock Market
Securities registered pursuant to Section 12(g) of the Act: NoneIndicate by check mark if the registrant is a well-known seasoned issuer, as defined in Rule 405 of the Securities Act. Yes ☒ No ☐Indicate by check mark if the registrant is not required to file reports pursuant to Section 13 or Section 15(d) of the Exchange Act. Yes ☐ No ☒ Indicate by check mark whether the registrant (1) has filed all reports required to be filed by Section 13 or 15(d) of the Securities Exchange Act of 1934
during the preceding 12 months (or for such shorter period that the registrant was required to file such reports), and (2) has been subject to such filing requirements for the past 90 days. Yes ☒ No ☐
Indicate by check mark whether the registrant has submitted electronically every Interactive Data File required to be submitted pursuant to Rule 405 of Regulation S-T (§232.405 of this chapter) during the preceding 12 months (or for such shorter period that the registrant was required to submit such files). Yes ☒ No ☐
Indicate by check mark whether the registrant is a large accelerated filer, an accelerated filer, a non-accelerated filer, a smaller reporting company, or an emerging growth company. See the definitions of “large accelerated filer,” “accelerated filer,” “smaller reporting company” and “emerging growth company” in Rule 12b-2 of the Exchange Act.Large accelerated filer ☒ Accelerated filer ☐Non-accelerated filer ☐ Smaller reporting company ☐Emerging growth company ☐
If an emerging growth company, indicate by check mark if the registrant has elected not to use the extended transition period for complying with any new or revised financial accounting standards provided pursuant to Section 13(a) of the Exchange Act. ☐
Indicate by check mark whether the registrant has filed a report on and attestation to its management’s assessment of the effectiveness of its internal control over financial reporting under Section 404(b) of the Sarbanes-Oxley Act (15 U.S.C. 7262(b)) by the registered public accounting firm that prepared or issued its audit report. ☒
Indicate by check mark whether the registrant is a shell company (as defined in Rule 12b-2 of the Exchange Act). Yes ☐ No ☒ As of June 30, 2020, the aggregate market value of the registrant’s common stock held by non-affiliates of the registrant was approximately $13.6 billion
(this amount represents approximately 114.4 million shares of Nasdaq, Inc.’s common stock based on the last reported sales price of $119.47 of the common stock on The Nasdaq Stock Market on such date).
Indicate the number of shares outstanding of each of the issuer’s classes of common stock, as of the latest practicable date.Class Outstanding at February 11, 2021
Common Stock, $0.01 par value per share 164,795,634 shares
Documents Incorporated by Reference: Certain portions of the Definitive Proxy Statement for the 2021 Annual Meeting of Shareholders are incorporated by reference into Part III of this Form 10-K.

Nasdaq, Inc.
Page
Part I.
Item 1. Business 2 Item 1A. Risk Factors 17
Item 1B. Unresolved Staff Comments 31
Item 2 Properties 31
Item 3. Legal Proceedings 31
Item 4. Mine Safety Disclosures 31
Part II.
Item 5. Market for Registrant's Common Equity, Related Stockholder Matters and Issuer Purchases of Equity Securities 31
Item 6. Selected Financial Data 34
Item 7. Management’s Discussion and Analysis of Financial Condition and Results of Operations 34 Item 7A. Quantitative and Qualitative Disclosures About Market Risk 58 Item 8. Financial Statements and Supplementary Data 58
Item 9. Changes in and Disagreements with Accountants on Accounting and Financial Disclosure 58
Item 9A. Controls and Procedures 58
Item 9B. Other Information 61
Part III. Item 10. Directors, Executive Officers and Corporate Governance 61 Item 11. Executive Compensation 61 Item 12. Security Ownership of Certain Beneficial Owners and Management and Related Stockholder Matters 61 Item 13. Certain Relationships and Related Transactions, and Director Independence 61 Item 14. Principal Accounting Fees and Services 62
Part IV. Item 15. Exhibits, Financial Statement Schedules 62 Item 16. Form 10-K Summary 65
i
About this Form 10-K
Throughout this Form 10-K, unless otherwise specified:
• “Nasdaq,” “we,” “us” and “our” refer to Nasdaq, Inc.
• “Nasdaq Baltic” refers to collectively, Nasdaq Tallinn AS, Nasdaq Riga, AS, and AB Nasdaq Vilnius.
• “Nasdaq BX” refers to the cash equity exchange operated by Nasdaq BX, Inc.
• “Nasdaq BX Options” refers to the options exchange operated by Nasdaq BX, Inc.
• “Nasdaq Clearing” refers to the clearing operations conducted by Nasdaq Clearing AB.
• “Nasdaq CXC” and “Nasdaq CX2” refer to the Canadian cash equity trading books operated by Nasdaq CXC Limited.
• “Nasdaq First North” refers to our alternative marketplaces for smaller companies and growth companies in the Nordic and Baltic regions.
• “Nasdaq GEMX” refers to the options exchange operated by Nasdaq GEMX, LLC.
• “Nasdaq ISE” refers to the options exchange operated by Nasdaq ISE, LLC.
• “Nasdaq MRX” refers to the options exchange operated by Nasdaq MRX, LLC.
• “Nasdaq Nordic” refers to collectively, Nasdaq Clearing AB, Nasdaq Stockholm AB, Nasdaq Copenhagen A/S, Nasdaq Helsinki Ltd, and Nasdaq Iceland hf.
• “Nasdaq PHLX” refers to the options exchange operated by Nasdaq PHLX LLC.
• “Nasdaq PSX” refers to the cash equity exchange operated by Nasdaq PHLX LLC.
• “The Nasdaq Options Market” refers to the options exchange operated by The Nasdaq Stock Market LLC.
• “The Nasdaq Stock Market” refers to the cash equity exchange and listing venue operated by The Nasdaq Stock Market LLC.
* * * * * *
Nasdaq also provides as a tool for the reader the following list of abbreviations and acronyms that are used throughout this Annual Report on Form 10-K.
401(k) Plan: Voluntary Defined Contribution Savings Plan
2017 Credit Facility: $1 billion senior unsecured revolving credit facility, which was terminated in December 2020
2020 Credit Facility: $1.25 billion senior unsecured revolving credit facility, which matures on December 22, 2025
2021 Notes: €600 million aggregate principal amount of 3.875% senior unsecured notes due June 7, 2021, repaid in full and terminated in March 2020
2022 Notes: $600 million aggregate principal amount of 0.455% senior unsecured notes due December 21, 2022
2023 Notes: €600 million aggregate principal amount of 1.75% senior unsecured notes due May 19, 2023
2024 Notes: $500 million aggregate principal amount of 4.25% senior unsecured notes due June 1, 2024
2026 Notes: $500 million aggregate principal amount of 3.85% senior unsecured notes due June 30, 2026
2029 Notes: €600 million aggregate principal amount of 1.75% senior unsecured notes due March 28, 2029
2030 Notes: €600 million aggregate principal amount of 0.875% senior unsecured notes due February 13, 2030
2031 Notes: $650 million aggregate principal amount of 1.650% senior unsecured notes due January 15, 2031
2040 Notes: $650 million aggregate principal amount of 2.500% senior unsecured notes due December 21, 2040
2050 Notes: $500 million aggregate principal amount of 3.25% senior unsecured notes due April 28, 2050
ASU: Accounting Standards Update
ATS: Alternative Trading System
ASU 2016-13: Measurement of Credit Losses on Financial Instruments
AUM: Assets Under Management
CAT: A market-wide consolidated audit trail established under an SEC approved plan by Nasdaq and other exchanges
CCP: Central Counterparty
CFTC: U.S. Commodity Futures Trading Commission
EMIR: European Market Infrastructure Regulation
Equity Plan: Nasdaq Equity Incentive Plan
ESG: Environmental, Social and Governance
ESPP: Nasdaq Employee Stock Purchase Plan
ii

ETF: Exchange Traded Fund
ETP: Exchange Traded Product
Exchange Act: Securities Exchange Act of 1934, as amended
FASB: Financial Accounting Standards Board
FICC: Fixed Income and Commodities Trading and Clearing
FINRA: Financial Industry Regulatory Authority
IPO: Initial Public Offering
LIBOR: London Interbank Offered Rate
MiFID II: Update to the Markets in Financial Instruments Directive
MiFIR: Markets in Financial Instruments Regulation
MTF: Multilateral Trading Facility
NFF: Nasdaq Financial Framework; Nasdaq's end-to-end technology solutions for market infrastructure operators, buy-side firms, sell-side firms and other non-financial markets
NFX: Nasdaq Futures, Inc.
NPM: The NASDAQ Private Market, LLC
NSCC: National Securities Clearing Corporation
OCC: The Options Clearing Corporation
OTC: Over-the-Counter
Proxy Statement: Nasdaq's Definitive Proxy Statement for the 2021 Annual Meeting of Shareholders
PSU: Performance Share Unit
Regulation NMS: Regulation National Market System
Regulation SCI: Regulation Systems Compliance and Integrity
SaaS: Software as a Service
SEC: U.S. Securities and Exchange Commission
SERP: Supplemental Executive Retirement Plan
SFSA: Swedish Financial Supervisory Authority
SI: Systematic Internalizer
S&P: Standard & Poor’s
S&P 500: S&P 500 Stock Index
SPAC: Special Purpose Acquisition Company
SRO: Self-regulatory Organization
SSMA: Swedish Securities Markets Act 2007:528
TSR: Total Shareholder Return
U.S. GAAP: U.S. Generally Accepted Accounting Principles
UTP: Unlisted Trading Privileges
UTP Plan: Joint SRO Plan Governing the Collection, Consolidation, and Dissemination of Quotation and Transaction Information for Nasdaq-Listed Securities Traded on Exchanges on a UTP Basis
* * * * * *
NASDAQ, the NASDAQ logos, and other brand, service or product names or marks referred to in this report are trademarks or service marks, registered or otherwise, of Nasdaq, Inc. and/or its subsidiaries. FINRA and TRADE REPORTING FACILITY are registered trademarks of FINRA.
* * * * * *
This Annual Report on Form 10-K includes market share and industry data that we obtained from industry publications and surveys, reports of governmental agencies and internal company surveys. Industry publications and surveys generally state that the information they contain has been obtained from sources believed to be reliable, but we cannot assure you that this information is accurate or complete. We have not independently verified any of the data from third-party sources nor have we ascertained the underlying economic assumptions relied upon therein. Statements as to our market position are based on the most currently available market data. For market comparison purposes, The Nasdaq Stock Market data in this Annual Report on Form 10-K for IPOs is based on data generated internally by us; therefore, the data may not be comparable to other publicly-available IPO data. Data in this Annual Report on Form 10-K for new listings of equity securities on The Nasdaq Stock Market is based on data generated internally by us, which includes issuers that switched from other listing venues, closed-end funds and ETPs. Data in this Annual Report on Form 10-K for IPOs and new listings of equity securities on the Nasdaq Nordic and Nasdaq Baltic exchanges and Nasdaq First North also is based on data generated internally by us. IPOs and new listings data is presented as of period end. While we are not aware of any misstatements regarding industry data presented herein, our estimates involve risks and uncertainties and are subject to change based on various factors, including those discussed in “Item 1A. Risk Factors” in this Annual Report on Form 10-K.
* * * * * *Nasdaq intends to use its website, ir.nasdaq.com, as a means for disclosing material non-public information and for complying with SEC Regulation FD and other disclosure obligations.
iii

Forward-Looking StatementsThe SEC encourages companies to disclose forward-looking information so that investors can better understand a company’s future prospects and make informed investment decisions. This Annual Report on Form 10-K contains these types of statements. Words such as “may,” “will,” “could,” “should,” “anticipates,” “envisions,” “estimates,” “expects,” “projects,” “intends,” “plans,” “believes” and words or terms of similar substance used in connection with any discussion of future expectations as to industry and regulatory developments or business initiatives and strategies, future operating results or financial performance, and other future developments are intended to identify forward-looking statements. These include, among others, statements relating to:
• our strategic direction;• the integration of acquired businesses, including accounting decisions relating thereto;• the scope, nature or impact of acquisitions, divestitures, investments, joint ventures or other transactional
activities;• the effective dates for, and expected benefits of, ongoing initiatives, including transactional activities and other
strategic, restructuring, technology, de-leveraging and capital return initiatives;• our products and services;• the impact of pricing changes;• tax matters;• the cost and availability of liquidity and capital;• any litigation, or any regulatory or government investigation or action, to which we are or could become a
party or which may affect us; and• the potential impact of the COVID-19 pandemic and the response of governments and other third parties on
our business, operations, results of operations, financial condition, workforce or the operations or decisions of our customers, suppliers or business partners.
Forward-looking statements involve risks and uncertainties. Factors that could cause actual results to differ materially from those contemplated by the forward-looking statements include, among others, the following:
• our operating results may be lower than expected;• our ability to successfully integrate acquired businesses or divest sold businesses or assets, including the fact
that any integration or transition may be more difficult, time consuming or costly than expected, and we may be unable to realize synergies from business combinations, acquisitions, divestitures or other transactional activities;
• loss of significant trading and clearing volumes or values, fees, market share, listed companies, market data customers or other customers;
• our ability to develop and grow our non-trading businesses, including our technology and analytics offerings;• our ability to keep up with rapid technological advances and adequately address cybersecurity risks;• economic, political and market conditions and fluctuations, including interest rate and foreign currency risk,
inherent in U.S. and international operations;• the performance and reliability of our technology and technology of third parties on which we rely;• any significant error in our operational processes;• our ability to continue to generate cash and manage our indebtedness; and• adverse changes that may occur in the litigation or regulatory areas, or in the securities markets generally, or
increased regulatory oversight domestically or internationally.Most of these factors are difficult to predict accurately and are generally beyond our control. You should consider the uncertainty and any risk related to forward-looking statements that we make. These risk factors are discussed under the caption “Item 1A. Risk Factors,” in this Annual Report on Form 10-K. You are cautioned not to place undue reliance on these forward-looking statements, which speak only as of the date of this report. You should carefully read this entire Annual Report on Form 10-K, including “Item 7. Management’s Discussion and Analysis of Financial Condition and Results of Operations” and the consolidated financial statements and the related notes. Except as required by the federal securities laws, we undertake no obligation to update any forward-looking statement, release publicly any revisions to any forward-looking statements or report the occurrence of unanticipated events. For any forward-looking statements contained in any document, we claim the protection of the safe harbor for forward-looking statements contained in the Private Securities Litigation Reform Act of 1995.
1
PART I
Item 1. Business
Overview
Nasdaq is a global technology company serving the capital markets and other industries. Our diverse offerings of data, analytics, software and services enables clients to optimize and execute their business vision with confidence.
We manage, operate and provide our products and services in four business segments: Market Services, Corporate Platforms, Investment Intelligence and Market Technology. In the fourth quarter of 2020, we renamed certain of our segments and businesses. See Note 1, “Organization and Nature of Operations,” to the consolidated financial statements for further discussion.
History
Nasdaq was founded in 1971 as a wholly-owned subsidiary of FINRA. Beginning in 2000, FINRA restructured and broadened ownership in Nasdaq by selling shares to FINRA members, investment companies and issuers listed on The Nasdaq Stock Market. In connection with this restructuring, FINRA fully divested its ownership of Nasdaq in 2006, and The Nasdaq Stock Market became an independent registered national securities exchange in 2007.
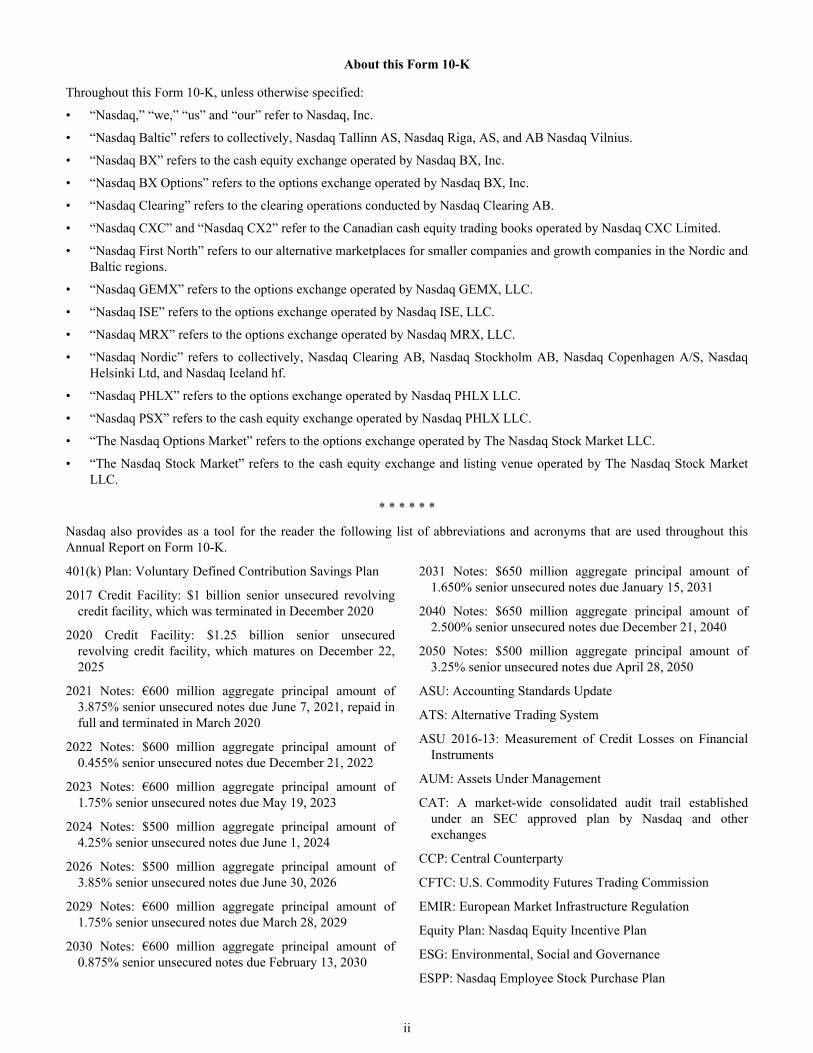
In February 2008, Nasdaq and OMX AB combined their businesses, and we changed our corporate name to The NASDAQ OMX Group, Inc. This transformational combination resulted in the expansion of our business from a U.S.-based exchange operator to a global exchange company offering technology that powers our own exchanges and markets as well as many other marketplaces around the world. We operated as the NASDAQ OMX Group until we rebranded our business as Nasdaq, Inc. in 2015. The chart below shows our historical evolution from 1971 through the present.
Growth Strategy
Since our transformative combination with OMX AB in 2008, we have grown our business both organically and through acquisitions that have expanded our operations globally and increasingly diversified our product and service offerings. This evolution was driven by our ability to create opportunities in areas adjacent to our core businesses, many
of which are non-transaction based and rooted in innovative technology. To keep pace with our understanding of future trends and to ensure our continued success in the evolving business environment, we have focused on refining our vision, mission, purpose and strategy:
Our Vision: To reimagine markets to realize the potential of tomorrow.
Our Mission: To provide the premier platform and ecosystem for global capital markets and beyond with unmatched technology, insights and markets expertise.
Our Purpose: To champion inclusive growth and prosperity. We power stronger economies, create more equitable opportunities and contribute to a more sustainable world to help our communities, clients, employees and people of all backgrounds reach their full potential.
Our Strategy: Our strategic direction is driven by our continuous examination of: (i) key macroeconomic, regulatory and technology trends, (ii) consultation with our clients about short- and long-term trends in their businesses and (iii) the competitive landscape.
Under the strategic direction that we have been implementing over the past four years, we have focused on maximizing the resources, people and capital allocated to our largest growth opportunities, particularly in our Market Technology and Investment Intelligence segments, as we seek to execute on our transformation into a higher growth, more scalable platform to meet our clients' most critical needs. We are also committed to maintaining and enhancing the marketplace platform businesses that are core to Nasdaq, including Market Services and Corporate Platforms. Additionally, we will continue to execute on our strategy to reduce capital and resources in areas that we believe are not as strategic to our clients and have less growth potential within Nasdaq. Our four business segments reflect our broad capabilities, with Market Technology and Investment Intelligence providing our technology and intelligence growth platform, and Corporate Platforms and Market Services serving as our foundational marketplace core.
• Increasing Investment in Businesses Where We See the Highest Growth Opportunity. We have increased investment in areas that we believe help solve our clients’ biggest challenges and are likely to generate growth for our stockholders. These areas include: the index and analytics business within our Investment Intelligence segment; ESG-focused solutions, within our Corporate Platforms segment; and our Market Technology segment (including our anti-financial crime technology business).
Consistent with this objective, in 2020 we acquired Solovis, a provider of multi-asset class portfolio management, analytics and reporting tools across public and private markets, which is a part of our Investment Intelligence segment. In February 2021, we completed the acquisition of Verafin, a provider of anti-financial
2

crime management solutions, which is part of our Market Technology segment. We are continuing to invest in the Market Technology segment through the expansion, enhancement, and flexibility of our technology platform, in addition to leveraging emerging technologies such as machine intelligence in our Trade Surveillance offering.
• Enhancing Our Foundation. As we strive to grow our business, we also have focused on enhancing our leadership position in the marketplaces in which we operate as we continue to innovate with new functionality and strong market share in our core markets. We migrated Nasdaq BX Options to a new trading platform that leverages the NFF. This updated technology will drive commonality across our internal derivatives markets.
• Optimizing Slower Growth Businesses. We continually review areas that are not critical to our core. In these areas, we expect to continue to target resiliency and efficiency versus growth, and free up resources when possible to redirect toward greater opportunities. In February 2021, we entered into an agreement to sell our U.S. fixed income business. This transaction aligns with our strategy to concentrate our resources and capital in order to maximize our potential as a major technology and analytics provider to the global capital markets. See “Sale of U.S. Fixed Income Business,” of Note 21, “Subsequent Events,” to the consolidated financial statements for further discussion of this transaction.
Products and Services
Market Services
Our Market Services segment includes our Equity Derivative Trading and Clearing, Cash Equity Trading, FICC and Trade Management Services businesses.
Equity Derivative Trading and Clearing
We operate six options exchanges in the U.S.: Nasdaq PHLX, The Nasdaq Options Market, Nasdaq BX Options, Nasdaq ISE, Nasdaq GEMX and Nasdaq MRX. These exchanges facilitate the trading of equity, ETF, index and foreign currency options. Together, our combined options market share in 2020 represented the largest share of the U.S. market for all categories, including single-exchange-listed options products. Our options trading platforms provide trading opportunities to both retail investors, algorithmic trading firms and market makers, who tend to prefer electronic trading, and institutional investors, who typically pursue more complex trading strategies and often trade on the floor.
In Europe, Nasdaq offers trading in derivatives, such as stock options and futures and index options and futures. Nasdaq Clearing offers central counterparty clearing services for stock options and futures and index options and futures.
Cash Equity Trading
In the U.S., we operate three cash equity exchanges: The Nasdaq Stock Market, Nasdaq BX and Nasdaq PSX. Our U.S. cash equity exchanges offer trading of both Nasdaq-listed and non-Nasdaq-listed securities. The Nasdaq Stock Market is the largest single venue of liquidity for trading U.S.-listed cash equities. Market participants include market makers, broker-dealers, ATSs, institutional investors, and registered securities exchanges.
In Canada, we operate an exchange with three independent markets, Nasdaq Canada CXC, Nasdaq Canada CX2 and Nasdaq Canada CXD, for the trading of Canadian-listed securities.
In Europe, Nasdaq operates exchanges in Stockholm (Sweden), Copenhagen (Denmark), Helsinki (Finland), and Reykjavik (Iceland). We also operate exchanges in Tallinn (Estonia), Riga (Latvia) and Vilnius (Lithuania).
Collectively, the Nasdaq Nordic and Nasdaq Baltic exchanges offer trading in cash equities, depository receipts, warrants, convertibles, rights, fund units and ETFs, as well as trading and clearing of derivatives and clearing of resale and repurchase agreements. Our platform allows the exchanges to share the same trading system, which enables efficient cross-border trading and settlement, cross membership and a single source for Nordic data products. Settlement and registration of cash equity trading takes place in Sweden, Finland, and Denmark via the local central securities depositories. In addition, Nasdaq owns a central securities depository that provides notary, settlement, central maintenance and other services in the Baltic countries and Iceland.
FICC
Our FICC business includes the U.S. and European portions of the Nasdaq Fixed Income, or NFI, business and Nasdaq Commodities.
The U.S. portion of Nasdaq Fixed Income includes an electronic platform for trading U.S. Treasuries. The electronic trading platform provides real-time institutional trading of benchmark U.S. Treasury securities. Through this business, we provide trading access to the U.S. Treasury securities market with an array of trading instruments to meet various investment goals across the fixed income spectrum. On February 2, 2021, we announced that we entered into a purchase and sale agreement, or the Purchase Agreement, to sell our U.S. Fixed Income business. See “Sale of U.S. Fixed Income Business,” of Note 21, “Subsequent Events,” to the consolidated financial statements for further discussion of this transaction.
The European portion of Nasdaq Fixed Income provides a wide range of products and services, such as trading and clearing, for fixed income products in Sweden, Denmark, Finland, Iceland, Estonia, Lithuania and Latvia. Nasdaq is the largest bond listing venue in the Nordics, with more than 5,800 listed retail and institutional bonds. In addition, Nasdaq Nordic facilitates the trading and clearing of Nordic fixed
3

income derivatives in a unique market structure. Buyers and sellers agree to trades in fixed income derivatives through bilateral negotiations and then report those trades to Nasdaq Clearing. Nasdaq Clearing offers central counterparty clearing services for fixed-income options and futures and interest rate swaps. Nasdaq Clearing also operates a clearing service for the resale and repurchase agreement market.
Nasdaq Commodities is the brand name for Nasdaq’s European commodity-related products and services. Nasdaq Commodities’ offerings include derivatives in power, natural gas and carbon emission markets, seafood, electricity certificates and clearing services. These products are listed on Nasdaq Oslo ASA, except for seafood, which is listed on Fishpool, a third party platform.
Nasdaq Oslo ASA is the commodity derivatives exchange for European products. All trades with Nasdaq Oslo ASA are subject to clearing with Nasdaq Clearing, which offers central counterparty clearing services for commodities options and futures.
Trade Management Services
We provide market participants with a wide variety of alternatives for connecting to and accessing our markets for a fee. Our marketplaces may be accessed via a number of different protocols used for quoting, order entry, trade reporting and connectivity to various data feeds. We also offer the Nasdaq Workstation, a browser-based, front-end interface that allows market participants to view data and enter orders, quotes and trade reports. In addition, we offer a variety of add-on compliance tools to help firms comply with regulatory requirements.
We provide colocation services to market participants, whereby we offer firms cabinet space and power to house their own equipment and servers within our data centers. Additionally, we offer a number of wireless connectivity offerings between select data centers using millimeter wave and microwave technology.
Our broker services operations business primarily offers technology and customized securities administration solutions to financial participants in the Nordic market. Such services and solutions primarily consist of flexible back-office systems, which allow customers to efficiently manage safekeeping, settlement and corporate actions and reporting, and include connectivity to exchanges and central securities depositories. In January 2020, we commenced an orderly wind-down of this broker services operations business. We expect this wind-down to continue through 2021.
Corporate Platforms
Our Corporate Platforms segment includes our Listing Services and IR & ESG Services businesses. These businesses deliver critical capital market and governance solutions across the lifecycle of public and private companies.
Listing Services
We operate a variety of listing platforms around the world to provide multiple global capital raising solutions for private and public companies. Companies listed on our markets represent a diverse array of industries including, among others, health care, consumer products, telecommunication services, information technology, financial services, industrials and energy. Our main listing markets are The Nasdaq Stock Market and the Nasdaq Nordic and Nasdaq Baltic exchanges.
Companies seeking to list securities on The Nasdaq Stock Market may do so on one of the three market tiers: The Nasdaq Global Select Market, The Nasdaq Global Market, or The Nasdaq Capital Market. To qualify, companies must meet minimum listing requirements, including specified financial and corporate governance criteria. Once listed, companies must maintain rigorous listing and corporate governance standards. We offer a suite of products to assist companies manage corporate governance standards, discussed below in “IR & ESG Services.”
As of December 31, 2020, a total of 3,392 companies listed securities on The Nasdaq Stock Market, with 1,476 listings on The Nasdaq Global Select Market, 907 on The Nasdaq Global Market and 1,009 on The Nasdaq Capital Market.
We seek new listings from companies conducting IPOs, including SPACs, and direct listings as well as companies looking to switch from alternative exchanges. In 2020, The Nasdaq Stock Market attracted 454 new listings, including 316 IPOs, representing 67% of U.S. IPOs in 2020. Of the 316 IPOs that listed on The Nasdaq Stock Market, 184 were operating companies, representing 83% of all operating company IPOs in 2020 and a 53% win rate among SPACs. The new listings were comprised of the following:
IPOs 316 Switches from the New York Stock Exchange LLC,
or NYSE and the NYSE American LLC, or NYSE American 20
Upgrades from OTC 46 ETPs and Other Listings 72
Total 454
During 2020, we had 20 new listings resulting from companies switching their listings from NYSE or NYSE American to join Nasdaq. Together with companies that transferred additional securities to Nasdaq during 2020, an aggregate of $282 billion in global equity market capitalization switched to Nasdaq. Notable switches in 2020 included AstraZeneca PLC, American Electric Power Company, Inc., Keurig Dr Pepper Inc., and Opendoor Technologies.
We also offer listings on the exchanges that comprise Nasdaq Nordic and Nasdaq Baltic. For smaller companies and growth companies, we offer access to the financial markets through the Nasdaq First North alternative marketplaces. As of December 31, 2020, a total of 1,071 companies listed
4

securities on our Nordic and Baltic exchanges and Nasdaq First North.
Our European listing customers include companies, funds and governments. Customers issue securities in the form of cash equities, depository receipts, warrants, ETPs, convertibles, rights, options, bonds or fixed-income related products. In 2020, a total of 67 new companies listed on our Nordic and Baltic exchanges and Nasdaq First North. In addition, 12 companies upgraded their listings from Nasdaq First North to the Nordic and Baltic exchanges.
Our Listing Services business also includes NPM, which provides liquidity solutions for private companies to enable employees, investors, and companies to execute transactions.
We are continuing to grow our U.S. Corporate Bond exchange for the listing of corporate bonds. This exchange operates pursuant to The Nasdaq Stock Market exchange license and is powered by the NFF. Surveillance is conducted by the Nasdaq regulatory team, assisted by our Nasdaq Trade Surveillance solution. As of December 31, 2020, 86 corporate bonds were listed on the Corporate Bond exchange. Our U.S. corporate bond listing offering won 11 new issues and we added 20 existing bond listings that transferred from the NYSE.
IR & ESG Services
Our IR & ESG Services business serves both public and private companies and organizations. Our public company clients can be companies listed on our exchanges or other U.S. and global exchanges. We help organizations enhance their ability to understand and expand their global shareholder base, improve corporate governance, and navigate the evolving ESG landscape through our suite of advanced technology, analytics, and consultative services. We also provide clients with counsel on a range of governance and sustainability-related issues.
As of December 31, 2020, we provided IR & ESG Services products and services in the following key areas:
• Investor Relations Intelligence. We offer a global team of consultative experts that deliver advisory services including Strategic Capital Intelligence, Shareholder Identification and Perception Studies, as well as an industry-leading platform, Nasdaq IR Insight, to investor relations professionals. These solutions allow investor relations officers to better manage their investor relations programs, understand their investor base, target new investors, manage meetings and consume key data such as investor profiles, equity research, consensus estimates and news.
• Governance Solutions. We provide a global technology offering and consultative services that streamline the meeting process for board of directors and executive leadership teams and help them accelerate decision making and strengthen governance. Our solutions protect sensitive data and facilitate productive collaboration, so
board members and teams can work faster and more effectively.
In January 2020, Nasdaq acquired OneReport, a provider of ESG reporting solutions that helps organizations to navigate corporate responsibility frameworks, manage the information capture and response process, and deliver ESG data to ratings agencies and other stakeholders.
Investment Intelligence
Our Investment Intelligence business provides the global investing community with access to the financial markets together with strong investment insights.
Our Investment Intelligence segment is organized into the following businesses:
• Market Data;
• Index; and
• Analytics.
For both institutional and retail investors, our market and alternative data enhances transparency and access to the markets we operate, and we help guide investment decisions around the globe through our proprietary indexes and analytics.
Market Data
Our Market Data business sells and distributes historical and real-time market data to the sell-side, the institutional investing community, retail online brokers, proprietary trading shops, other venues, internet portals and data distributors.
Our market data products enhance transparency of market activity within our exchanges and provide critical information to professional and non-professional investors globally. We collect, process and create information and earn revenues as a distributor of our own, as well as select third-party content. We provide varying levels of quote and trade information to our customers who in turn provide subscriptions for this information. Our systems enable distributors to gain access to our market depth, fund valuation, order imbalances, market sentiment and other analytical data.
We distribute this proprietary market information to both market participants and non-participants through a number of proprietary products, including Nasdaq TotalView, our flagship market depth quote product. TotalView shows subscribers quotes, orders and total anonymous interest at every displayed price level in The Nasdaq Stock Market for Nasdaq-listed securities and critical data for the opening, closing, halt and IPO crosses. We also offer TotalView products for our Nasdaq BX, Nasdaq PSX, Nasdaq Fixed Income and other Nordic markets.
We operate several other proprietary services and data products to provide market information, including Nasdaq Basic, a low cost alternative to the industry Level 1 feed and Nasdaq Canada Basic, a low cost alternative to other high
5

priced data feeds. We also provide various other data, including data relating to our six U.S. options exchanges, Nordic and U.S. futures, Nordic commodities, and U.S. Treasuries.
Our Market Data business also includes revenues from U.S. tape plans. The plan administrators sell quotation and last sale information for all transactions in Nasdaq-listed securities, whether traded on The Nasdaq Stock Market or other exchanges, to market participants and to data distributors, who then provide the information to subscribers. After deducting costs, the plan administrators distribute the tape revenues to the respective plan participants based on a formula required by Regulation NMS that takes into account both trading and quoting activity.
The Nasdaq Nordic and Nasdaq Baltic exchanges, as well as Nasdaq Commodities, also offer data products and services. These data products and services provide critical market transparency to professional and non-professional investors who participate in European marketplaces and, at the same time, give investors greater insight into these markets.
Much like the U.S. products, European data products and services are based on trading information from the Nasdaq Nordic and Nasdaq Baltic exchanges, as well as Nasdaq Commodities, for the following classes of assets: cash equities, bonds, derivatives and commodities. We provide varying levels of quote and trade information to market participants and to data distributors, who in turn provide subscriptions for this information. Significant European data products include Nordic Equity TotalView, Nordic Derivative TotalView, and Nordic Fixed Income TotalView, Level 2 and Analytics.
Index
Our Index business develops and licenses Nasdaq-branded indexes and financial products. License fees for our trademark licenses vary by product based on a percentage of underlying assets, dollar value of a product issuance, number of products or number of contracts traded. We also license cash-settled options, futures and options on futures on our indexes.
As of December 31, 2020, 339 ETPs listed in over 20 countries and exchanges tracked a Nasdaq index and accounted for $359 billion in AUM. This includes approximately $121 billion in ETP AUM, or 34% of the total AUM that tracked our smart beta indexes during this same time period. Our flagship index, the Nasdaq-100 Index, includes the top 100 non-financial securities listed on The Nasdaq Stock Market, and is tracked by more than 70 ETPs worldwide, and had nearly $200 billion in assets tracking the index as of December 31, 2020.
We provide index data products based on Nasdaq indexes. Index data products include our Global Index Data Service, which delivers real-time index values throughout the trading day, and Global Index Watch/Global Index File Delivery Service, which delivers daily as well as historical weightings and components data, corporate actions and a breadth of
additional data for our more than 46,000 indexes that we operate.
Nasdaq Dorsey Wright, or NDW, provides passive indexing and smart beta strategies to support the financial advisor community, as well as Systematic Relative Strength strategies to manage separately and unified managed accounts. NDW strengthens Nasdaq’s position as a leading smart beta index provider in the U.S.
Analytics
Our Analytics business provides asset managers, investment consultants and institutional asset owners with information and analytics to make data-driven investment decisions, deploy their resources more productively, and provide liquidity solutions for private funds. Through eVestment and Solovis, we provide a suite of cloud-based solutions that help institutional investors and consultants conduct pre-investment due diligence, and monitor their portfolios post-investment. The eVestment platform also enables asset managers to market their institutional products worldwide.
Additionally, our Nasdaq Cloud Data Service provides a flexible and efficient method of delivery for real-time exchange data and other financial information. Data is made available through a suite of application programming interfaces, or APIs, allowing for the integration of data from disparate sources and a reduction in time to market for customer-designed applications. The API is highly scalable and can support the delivery of real-time exchange data.
Through the Solovis platform, endowments, foundations, pensions and family offices transform how they collect and aggregate investment data, analyze portfolio performance, model and predict future outcomes, and share meaningful portfolio insights with key stakeholders. The Nasdaq Fund Network and Quandl are additional components in our suite of investment data and analytics offerings. Nasdaq Fund Network gathers and distributes daily net asset values from over 33,000 funds and other investment vehicles across North America. We have extended Nasdaq Fund Network to support the distribution of collective investment trusts, hedge funds, managed accounts, separate accounts and demand deposit accounts. Quandl strengthens our position as a leading source for financial, economic, and alternative datasets. For investment management firms, investment banks and other investors, we provide predictive insights to inform investment decisions from discovered data.
Market Technology
Powering over 130 market infrastructure operators and new market clients in more than 50 countries, our Market Technology business is a leading global technology solutions provider and partner to exchanges, clearing organizations, central securities depositories, regulators, banks, brokers, buy-side firms and corporate businesses. Our solutions can handle a wide array of assets, including but not limited to cash equities, equity derivatives, currencies, various interest-bearing securities, commodities, energy products and digital currencies. Our solutions can also be used in the creation of
6

new asset classes, and non-capital markets customers, including those in insurance liabilities securitization, cryptocurrencies and sports wagering.
Nasdaq’s market technology is utilized by leading markets in the U.S., Europe and Asia as well as emerging markets in the Middle East, Latin America, and Africa. Additionally, more than 180 market participants leverage our surveillance technology globally to manage their integrity obligations and assist them in complying with market rules, regulations and internal market surveillance policies.
During 2020, we advanced our strategic goals in order to establish a comprehensive SaaS business with a broad and interconnected portfolio by extending and migrating our current offerings to services. We created a cross-discipline transformation program, successfully migrated our Nasdaq Market Surveillance offering for marketplaces and regulators, advanced our Universal Matching Service, which is a cloud-optimize matching service, and launched our new SaaS marketplace platform layer, the Nasdaq Marketplace Services Platform, which leverages the NFF. We added 10 SaaS market infrastructure customers and 17 market participant customers, and established a partnership with Microsoft to deliver our Marketplace Services Platform via Microsoft’s Azure cloud platform.
Our Market Technology business has evolved from its origins serving the capital markets, as we have leveraged NFF to develop our SaaS platform and offerings. We expect to continue to expand adoption by our clients to this SaaS model in the future.
Market Infrastructure Operators (MIO) & New Markets Portfolio
For MIOs, we provide and deliver mission-critical solutions across the trade lifecycle via the NFF, which is our flexible and modular architecture and technology that provides next generation capital markets capabilities in an open and agile environment. The NFF is designed to cover all aspects of a market operator’s needs, from trading and clearing to risk management, market surveillance, index development, data, management, testing, and quality assurance. During 2020, we continued to invest in the NFF by enabling emerging technologies, including integrating technology for issuance and settlement of securities, cloud-enabled trading and clearing, and machine learning applications. In 2020, we also
materially completed development of the core NFF platform and moved to the deployment phase.
Our New Markets initiative is focused on extending the NFF’s capabilities and our expertise as a market operator outside of capital markets. Market Technology currently offers its services to several digital assets exchanges, two commercial real estate markets, the reinsurance market, and several sports wagering operators. Our Marketplaces Services Platform provides next-generation marketplace capabilities spanning the transaction lifecycle to facilitate the exchange of assets, services and information across various types of market ecosystems and machine-to-machine transactions. The Marketplaces Services Platform is targeted at new markets and enables end-to-end marketplace implementation without the resources required with on-premise solutions.
Many MIO and New Markets projects involve complex delivery management and systems integration. Through our integration services, we can assume responsibility for projects that involve migration to a new system and the establishment of entirely new marketplaces. We also offer operation and support for the applications, systems platforms, networks and other components included in an information technology solution, as well as advisory services.
Buy- and Sell-side Portfolio
We continue to expand the NFF offering to the global bank and broker community. Regulatory pressure across multiple jurisdictions has made outsourcing of front-office infrastructure an attractive option for sell-side organizations and, as a result, we offer trading and execution infrastructure for SIs, single-dealer platforms and both multi-lateral and organized trading facilities. Our execution platform business continued its growth in 2020.
We also continue to extend our anti-financial crime strategy. Our Nasdaq Trade Surveillance solution is a managed service designed for brokers and other market participants to assist them in complying with market rules, regulations and internal market surveillance policies. In 2020, we added an anti-money laundering offering with a new automated investigator tool for retail banks, the Nasdaq Automated Investigator. Additionally, in February 2021, we completed the acquisition of Verafin, a provider of anti-financial crime management solutions that provides a cloud-based platform to help detect, investigate, and report money laundering and financial fraud to more than 2,000 financial institutions in North America. We also offer our clients Nasdaq Risk, which is a suite of products that offer a real-time, multi-tiered risk solution that integrates pre-, at- and on-trade risk management, including margining.
Technology
Technology plays a key role in ensuring the growth, reliability and regulation of financial markets. We have established a technology risk program to evaluate the resiliency of critical systems, including risks associated with cybersecurity. This program is focused on identifying areas for improvement in systems, and implementing changes and
7
upgrades to technology and processes to minimize future risk. We have continued our focus on improving the security of our technology with an emphasis on employee awareness through training, targeted phishing campaigns, and new tool deployment for our securities operations team. See “Item 1A. Risk Factors,” in this Annual Report on Form 10-K for further discussion.
Core Technology. The NFF is Nasdaq’s approach to delivering end-to-end solutions for market infrastructure operators, buy-side firms, sell-side firms and other non-financial markets. The framework consists of a single operational core platform that ties together Nasdaq’s portfolio of functionality across the trade lifecycle, in an open framework whereby exchanges, clearinghouses, central securities depositories, and other entities can easily integrate Nasdaq’s business applications with each other, as well as other third-party solutions. In addition to being able to integrate a broad range of business functions, the NFF enables end users to leverage recent technology developments.
Competitive Strengths
We are a global technology company and we continue to diversify our product and service offerings by having a client-first focus and orientation; unparalleled expertise in markets; a trusted, independent, global brand; unique technology capabilities and reputation; and fostering a leading issuer community and investor intelligence platform. We believe that our strong competitive position in large, high-growth markets positions us for sustained growth.
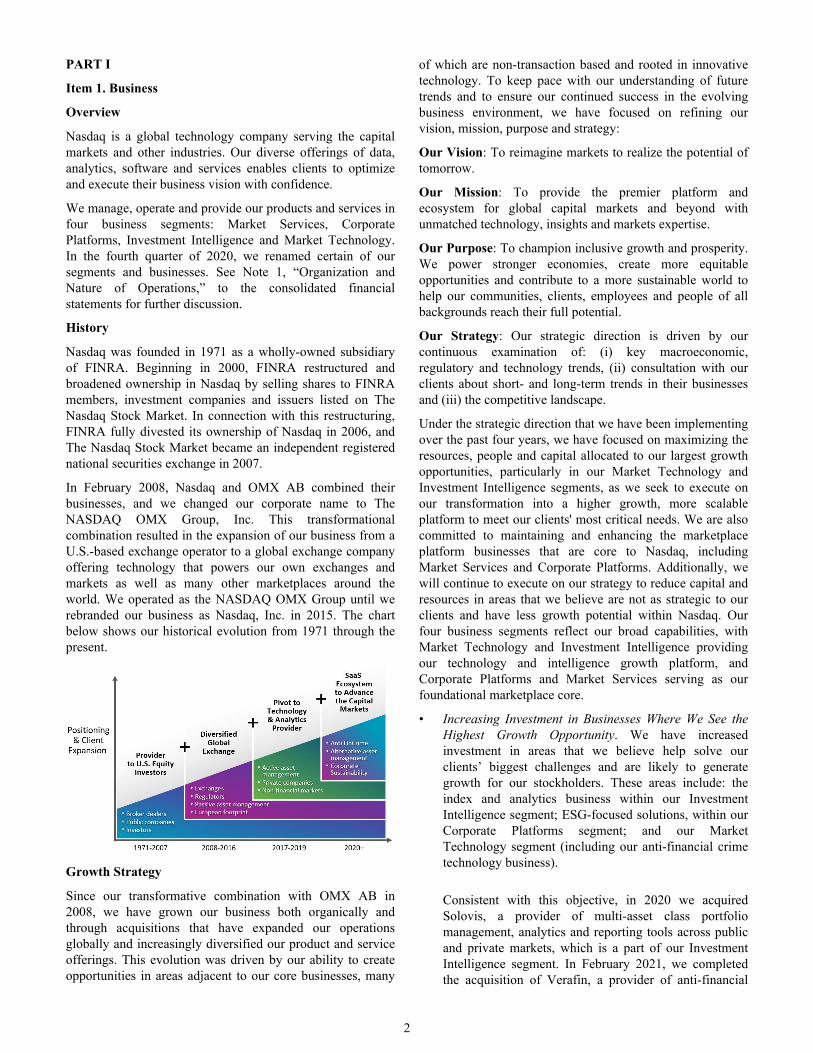
A Unique Value Proposition
We operate a diverse and resilient capital markets franchise with a marketplace core. Our businesses provide capital-markets infrastructure services to industry players, allowing us to:
• Develop efficient and reliable technologies to facilitate capital markets activity;
• Manage the complexities and costs of business on a global scale; and
• Provide data, tools and insights that drive sound decision making.
Technological Strength
The strength and resiliency of our technology, enhanced by our Market Technology business, in meeting the advancing demands of our global customer base is vital to the continued success of our business and distinguishes us from our competitors.
A Focus on Client Needs Throughout the Marketplace
We strive to serve a diverse range of clients including:
• Brokers and Traders - Helping brokers and traders to confidently plan, optimize and execute their business vision.
• Market Participants - Enabling market participants to monitor and capitalize on real-time market changes.
• Investors and Asset Managers - Offering products and services to assist investors and asset managers in optimizing their portfolios and offerings.
• Listed Companies - Promoting the capital health of our listed companies.
• Private Companies - Working with private companies to meet liquidity needs, manage relationships with long-term institutional investors and oversee their entire equity program.
• Market Infrastructure Players - Assisting market infrastructure players (exchanges, regulators, clearinghouses, and central securities depositories) in increasing efficiency, meeting customer needs and growing revenue.
• Capital-Markets - Delivering efficiencies through economies of scale (cost, speed, connectivity) to all members of the capital-markets ecosystem.
• Banks and Financial Institutions - Providing a suite of trade surveillance and anti-financial crime management solutions.
Competition
Market Services
We face intense competition in North America and Europe in businesses that comprise our Market Services segment. We seek to provide market participants with greater functionality, trading system stability, speed of execution, high levels of customer service, and efficient pricing. In both North America and Europe, our competitors include other exchange operators, operators of non-exchange trading systems and banks and brokerages that operate their own internal trading pools and platforms.
In the U.S., our options markets compete with exchanges operated by Cboe Global Markets, Inc., or Cboe, Miami International Holdings, Inc., or MIAX, and Intercontinental Exchange, Inc., or ICE. In cash equities in the U.S., we compete with exchanges operated by Cboe, ICE, MIAX, The Investors Exchange, and the recently launched Members Exchange and the Long Term Stock Exchange. We also face
8

competition from ATSs, known as “dark pools,” and other less-heavily regulated broker-owned trade facilitation systems, as well as from other types of OTC trading. In Canada, our cash equities exchange competes with exchanges such as the Toronto Stock Exchange, or TSX, and other marketplaces.
In Europe, our cash equities markets compete with exchanges such as Euronext N.V., Deutsche Börse AG and London Stock Exchange Group plc, or LSE, and many MTFs such as Cboe, Turquoise and Aquis. Our competitors in the trading and clearing of options and futures on European equities include Eurex, Cboe, ICE Futures Europe and London Clearing House, or LCH. In addition, in equities in Europe we face competition from other broker-owned systems, dark pools, SIs, and other types of OTC trading. Competition among exchanges for trading European equity derivatives tends to occur where there is competition in the trading of the underlying equities. In addition to exchange-based competition, we face competition from OTC derivative markets.
The implementation of MiFID II and MiFIR has resulted in further competitive pressure on our European trading business. SIs are already attracting a significant share of electronically matched volume and we expect such venues to compete aggressively for the trading of equity securities listed on our Nordic exchanges. Different bilateral trading systems pursuing block business also remain active in Europe. As part of this, trading on SIs has increased markedly as volumes migrate from more transparent types of trading venues. Regulators are continuously monitoring the market structure and have, in a series of consultations, asked for input regarding suggested changes to MiFID II.
Our FICC business also operates in an intensely competitive environment. Our trading platform for benchmark U.S. treasuries faces competition from both long-established competitors, such as CME Group Inc. and newly emerging electronic and voice brokerages, and the operating environment remains extremely challenging. Our European fixed income and commodities products and services are subject to relentless competitive pressure from European exchanges and clearinghouses.
Our Trade Management Services business competes with other exchange operators, extranet providers, and data center providers.
Corporate Platforms
Our Listing Services business in both the U.S. and Europe provides a means of facilitating capital formation through public capital markets. There are competing ways of raising capital, and we seek to demonstrate the benefits of listing shares on our exchange. Our primary competitor for larger company stock share listings in the U.S. is NYSE. The Nasdaq Stock Market competes with local and international markets located outside the U.S. for listings of equity securities of both U.S. and non-U.S. companies that choose to list (or dual-list) outside of their home country. For
example, The Nasdaq Stock Market competes for listings with exchanges in Europe and Asia, such as LSE and The Stock Exchange of Hong Kong Limited. Additionally, we face competition from private equity firms that may elect to keep their portfolio companies as private companies.
The Listings Services business in Europe is characterized by a large number of exchanges competing for new or secondary listings. Each country has one or more national exchanges, which are often the first choice of companies in each respective country. For those considering an alternative, competing European exchanges that frequently attract many listings from outside their respective home countries include LSE, Euronext N.V. and Deutsche Börse AG. In addition to the larger exchanges, companies seeking capital or liquidity from public capital markets are able to raise capital without a regulated market listing and can consider trading their shares on smaller markets and quoting facilities.
In our IR & ESG Services business, competition is varied and can be fragmented. For our Investor Relations Intelligence business, there are many regional competitors and relatively few global providers. Other exchange operators are partnering with firms that have capabilities in this area and seeking to acquire relevant assets in order to provide investor relations services to customers alongside listing services. The competitive landscape for our Governance Solutions business varies by customer segment and geography. Most competitors offer SaaS solutions that are supported by a data center strategy. Some firms offer specialized services that focus on a single niche segment. The larger players often offer additional services. Customers frequently seek single-source providers that are able to address a broad range of needs within a single platform. Our ESG-focused services, including Nasdaq OneReport and ESG Advisory, are positioned in evolving markets with competitors offering multiple point solutions providing software, data or consulting services.
Investment Intelligence
Our Market Data business in the U.S. includes both proprietary and consolidated data products. Proprietary data products are made up exclusively of data derived from each exchange’s systems. Consolidated data products are distributed by SEC-mandated consolidators (one for Nasdaq-listed stocks and another for NYSE and other-listed stocks) that share the revenue among the exchanges that contribute data. In Europe, all data products are proprietary, as there is no official data consolidator. Competition in the data business is intense and is influenced by rapidly changing technology and the creation of new product and service offerings.
The sale of our proprietary data products in both the U.S. and Europe is under competitive threat from alternative exchanges and trading venues that offer similar products. Our data business competes with other exchanges and third party vendors to provide information to market participants. Examples of our competitors in proprietary data products are ICE, Cboe, TSX, and Dow Jones & Company.
9
The consolidated data business is under competitive pressure from other securities exchanges that trade Nasdaq-listed securities. In addition, The Nasdaq Stock Market similarly competes for the tape fees from the sale of information on securities listed on other markets.
Our Index business faces competition from providers of various competing financial indexes. For example, there are a number of indexes that aim to track the technology sector and thereby compete with the Nasdaq-100 Index and the Nasdaq Composite Index. We face competition from investment banks, dedicated index providers, markets and other product developers, including S&P Dow Jones Indices, MSCI and FTSE Russell.
Our Analytics business faces competition from a broad array of data and analytics suppliers, both established firms and small start-ups. Our primary competitors are Morningstar, FactSet, Mercer and any number of smaller firms along with start-up data providers and aggregators. Our Solovis offering competes with other analytics providers, including Addepar and Caissa. Additionally, other large providers to the financial services industry, such as Bloomberg and Refinitiv, are believed to be interested in pursuing certain aspects of the services we provide.
Market Technology
Traditionally, exchanges and exchange-related businesses internally developed technology, sometimes aided by consultants. However, over time this model has changed as many operators have recognized the cost-savings made possible by buying technology from third parties. As a result, two types of competitors have emerged in our Market Technology segment: exchange operators and technology providers unaffiliated with exchanges. These organizations make available a range of off-the-shelf technology, including trading, clearing, market surveillance, settlement, depository and information dissemination, and offer customization and operation expertise. Market conditions in Market Technology are evolving rapidly, which makes continuous investment and innovation a necessity.
A wide range of providers compete with us in surveillance. In surveillance, standardization of products and budget pressures drive customers to focus on pricing. Our competitors range from large enterprise software providers that cover the broader compliance lifecycle to smaller vendors focusing on a single silo of the compliance workflow. Recently, an influx of start-ups have entered the space from the FinTech landscape, often shifting from data and analytics, or a complimentary silo like electronic communications, to surveillance. Our offerings must demonstrate ability to decrease false-positives, provide in-depth views into potential abuses and risks that stem from those cases and help firms both reduce the reputational and regulatory risk and complexity in efforts to keep markets safe.
Intellectual Property
We believe that our intellectual property assets are important for maintaining the competitive differentiation of our products, systems, software and services, enhancing our ability to access technology of third parties and maximizing our return on research and development investments.
To support our business objectives and benefit from our investments in research and development, we actively create and maintain a wide array of intellectual property assets, including patents and patent applications related to our innovations, products and services; trademarks related to our brands, products and services; copyrights in software and creative content; trade secrets; and through other intellectual property rights, licenses of various kinds and contractual provisions. We enter into confidentiality and invention assignment agreements with our employees and contractors, and utilize non-disclosure agreements with third parties with whom we conduct business in order to secure and protect our proprietary rights and to limit access to, and disclosure of, our proprietary information.
We own, or have licensed, rights to trade names, trademarks, domain names and service marks that we use in conjunction with our operations and services. We have registered many of our most important trademarks in the U.S. and in foreign countries. For example, our primary “Nasdaq” mark is a registered trademark that we actively seek to protect in the U.S. and in over 50 other countries worldwide.
Over time, we have accumulated a robust portfolio of issued patents in the U.S. and in many other jurisdictions across the world. We currently hold rights to patents relating to certain aspects of our products, systems, software and services, but we primarily rely on the innovative skills, technical competence and marketing abilities of our personnel. No single patent is in itself core to the operations of Nasdaq or any of its principal business areas.
Corporate Venture Practice
We operate a corporate venture program to make minority investments primarily in emerging growth financial technology companies that are strategically relevant to, and aligned with, Nasdaq. Investments are made through the venture program to further our organic research and development efforts and accelerate the path to commercial viability. We expect that capital invested will continue to be modest and will not have a material impact on our consolidated financial statements, existing capital return or deployment priorities. Since its inception in 2017, our venture program has grown, with aggregate initial and follow-on investments of approximately $67 million in 15 companies in various sectors, including data and analytics, blockchain and digital assets, market infrastructure, machine intelligence and regulatory technology and compliance, ESG and new marketplaces.
10

Environmental, Social and Governance Matters
Nasdaq is committed to long-term ESG, advocacy, oversight, and philanthropy to engage with stakeholders at all levels. During 2020, particularly in response to the COVID-19 pandemic and the social justice movement, we broadened our corporate and community ESG efforts, including expanding ESG oversight of our own operations and furthering our commitment to greater sustainability. Nasdaq achieved its continued commitment to be carbon neutral across all business operations through the purchase of green power, carbon offsets, and renewable energy certificates. We were named to the Dow Jones Sustainability North America Index for the fifth consecutive year. We also expanded our ESG services and solutions with new offerings for our clients, including our new platform Nasdaq OneReport to help clients streamline the data gathering process to provide data to ratings agencies, the Nasdaq Sustainable Bond Network, which provides access to detailed information on sustainable, green and social bonds and allows investors to obtain detailed information on sustainable bonds for product due diligence, selection and monitoring, the Nasdaq ESG Data Portal, which now includes ESG-related data from more than 600 companies and the Nasdaq ESG Footprint, a tool to help both institutional and retail investors understand the real-life impact of their portfolios. We also provide clients with counsel on a range of governance and sustainability-related issues.
Additionally, we filed a new proposed U.S. listing rule with the SEC that seeks to standardize disclosure of board-level diversity statistics through a consistent disclosure framework. The proposal includes disclosure of either the recommended minimum diversity goal of two diverse directors or an explanation, and is subject to SEC approval.
For more information regarding our ESG efforts in 2020, both internally and externally, please see the section entitled “Human Capital Management” below and our 2021 Proxy Statement.
Regulation
We are subject to extensive regulation in the U.S., Canada and Europe.
U.S. Regulation
U.S. federal securities laws establish a system of cooperative regulation of securities markets, market participants and listed companies. SROs conduct the day-to-day administration and regulation of the nation’s securities markets under the close supervision of, and subject to extensive regulation, oversight and enforcement by, the SEC. SROs, such as national securities exchanges, are registered with the SEC.
This regulatory framework applies to our U.S. business in the following ways:
• regulation of our registered national securities exchanges; and
• regulation of our U.S. broker-dealer and investment advisor subsidiaries.
National Securities Exchanges. SROs in the securities industry are an essential component of the regulatory scheme of the Exchange Act for providing fair and orderly markets and protecting investors. The Exchange Act and the rules thereunder, as well as each SRO’s own rules, impose many regulatory and operational responsibilities on SROs, including the day-to-day responsibilities for market and broker-dealer oversight. Moreover, an SRO is responsible for enforcing compliance by its members, and persons associated with its members, with the provisions of the Exchange Act, the rules and regulations thereunder, and the rules of the SRO, including rules and regulations governing the business conduct of its members.
Nasdaq currently operates three cash equity, six options markets and one corporate bond market in the U.S. We operate The Nasdaq Stock Market, The Nasdaq Options Market and the Corporate Bond Market pursuant to The Nasdaq Stock Market’s SRO license; Nasdaq BX and Nasdaq BX Options pursuant to Nasdaq BX’s SRO license; Nasdaq PSX and Nasdaq PHLX pursuant to Nasdaq PHLX’s SRO license; and Nasdaq ISE, Nasdaq GEMX and Nasdaq MRX, each of which operates an options market under its own SRO license. As SROs, each entity has separate rules pertaining to its broker-dealer members and listed companies. Broker-dealers that choose to become members of our exchanges are subject to the rules of those exchanges.
All of our U.S. national securities exchanges are subject to SEC oversight, as prescribed by the Exchange Act, including periodic and special examinations by the SEC. Our exchanges also are potentially subject to regulatory or legal action by the SEC at any time in connection with alleged regulatory violations. We have been subject to a number of routine reviews and inspections by the SEC or external auditors in the ordinary course, and we have been and may in the future be subject to SEC enforcement proceedings. To the extent such actions or reviews and inspections result in regulatory or other changes, we may be required to modify the manner in which we conduct our business, which may adversely affect our business.
Section 19 of the Exchange Act provides that our exchanges must submit to the SEC proposed changes to any of the SROs’ rules, practices and procedures, including revisions to provisions of our certificate of incorporation and by-laws that constitute SRO rules. The SEC will typically publish such proposed changes for public comment, following which the SEC may approve or disapprove the proposal, as it deems appropriate. SEC approval requires a finding by the SEC that the proposal is consistent with the requirements of the Exchange Act and the rules and regulations thereunder. Pursuant to the requirements of the Exchange Act, our exchanges must file with the SEC, among other things, all proposals to change their pricing structure.
Nasdaq conducts real-time market monitoring, certain equity surveillance not involving cross-market activity, most options
11
surveillance, rulemaking and membership functions through our Nasdaq Regulation department. We review suspicious trading behavior discovered by our regulatory staff, and depending on the nature of the activity, may refer the activity to FINRA for further investigation. Pursuant to regulatory services agreements between FINRA and our SROs, FINRA provides certain regulatory services to our markets, including some regulation of trading activity and surveillance and investigative functions. Our SROs retain ultimate regulatory responsibility for all regulatory activities performed under regulatory agreements by FINRA, and for fulfilling all regulatory obligations for which FINRA does not have responsibility under the regulatory services agreements.
In addition to its other SRO responsibilities, The Nasdaq Stock Market, as a listing market, also is responsible for overseeing each listed company’s compliance with The Nasdaq Stock Market’s financial and corporate governance standards. Our listing qualifications department evaluates applications submitted by issuers interested in listing their securities on The Nasdaq Stock Market to determine whether the quantitative and qualitative listing standards have been satisfied. Once securities are listed, the listing qualifications department monitors each issuer’s on-going compliance with The Nasdaq Stock Market’s continued listing standards.
Broker-dealer regulation. Nasdaq’s broker-dealer subsidiaries are subject to regulation by the SEC, the SROs and various state securities regulators. Nasdaq operates five broker-dealers: Nasdaq Execution Services, LLC, Execution Access, LLC, NPM Securities, SMTX, LLC, and Nasdaq Capital Markets Advisory LLC. Each broker-dealer is registered with the SEC, a member of FINRA and registered in the U.S. states and territories required by the operation of its business.
Nasdaq Execution Services operates as our routing broker for sending orders from Nasdaq's U.S. cash equity and options exchanges to other venues for execution. SMTX acts as an intermediary to facilitate closings of, and introduce prospective accredited investors in connection with, private non-capital raising transactions. Nasdaq Capital Markets Advisory acts as a third-party advisor to privately-held or publicly-traded companies during IPOs and various other offerings.
Two of our broker-dealers also are registered with the SEC as ATSs. Execution Access operates as the broker-dealer for our fixed income business, including as Nasdaq Fixed Income’s registered ATS for U.S. Treasury securities. NPM Securities operates an ATS that facilitates the purchase and sale of ownership interests in primary and secondary transactions in certain funds (both registered or not registered under the Investment Company Act of 1940), business development companies, certain closed end funds and private real estate investment funds.
The SEC, FINRA and the exchanges adopt rules and examine broker-dealers and require strict compliance with their rules and regulations. The SEC, SROs and state securities commissions may conduct administrative proceedings which
can result in censures, fines, the issuance of cease-and-desist orders or the suspension or expulsion of a broker-dealer, its officers or employees. The SEC and state regulators may also institute proceedings against broker-dealers seeking an injunction or other sanction. All broker-dealers have an SRO that is assigned by the SEC as the broker-dealer’s Designated Examining Authority. The Designated Examining Authority is responsible for examining a broker-dealer for compliance with the SEC’s financial responsibility rules. FINRA is the current Designated Examining Authority for each of our broker-dealer subsidiaries.
Our registered broker-dealers are subject to regulatory requirements intended to ensure their general financial soundness and liquidity, which require that they comply with certain minimum capital requirements. As of December 31, 2020, each of our broker-dealers were in compliance with all of the applicable capital requirements.
Regulatory contractual relationships with FINRA. Our SROs have signed a series of regulatory service agreements covering the services FINRA provides to the respective SROs. Under these agreements, FINRA personnel act as our agents in performing the regulatory functions outlined above, and FINRA bills us a fee for these services. These agreements have enabled us to reduce our headcount while ensuring that the markets for which we are responsible are properly regulated. However, we have reduced the scope of services provided by FINRA under these regulatory services agreements and are performing certain of those regulatory functions directly. In addition, our SROs retain ultimate regulatory responsibility for all regulatory activities performed under these agreements by FINRA.
Exchange Act Rule 17d-2 permits SROs to enter into agreements, commonly called Rule 17d-2 agreements, approved by the SEC with respect to enforcement of common rules relating to common members. Our SROs have entered into several such agreements under which FINRA assumes regulatory responsibility for specifics covered by the agreement, including:
• agreements with FINRA covering the enforcement of common rules, the majority of which relate to the regulation of common members of our SROs and FINRA;
• joint industry agreements with FINRA covering responsibility for enforcement of insider trading rules;
• joint industry agreement with FINRA covering enforcement of rules related to cash equity sales practices and certain other non-market related rules; and
• joint industry agreement covering enforcement of rules related to options sales practices.
Regulation NMS and Options Intermarket Linkage Plan. We are subject to Regulation NMS for our cash equity markets, and our options markets have joined the Options Intermarket Linkage Plan. These are designed to facilitate the routing of orders among exchanges to create a national market system
12

as mandated by the Exchange Act. One of the principal purposes of a national market system is to assure that brokers may execute investors’ orders at the best market price. Both Regulation NMS and the Options Intermarket Linkage Plan require that exchanges avoid trade-throughs, locking or crossing of markets and provide market participants with electronic access to the best prices among the markets for the applicable cash equity or options order.
In addition, Regulation NMS requires that every national securities exchange on which an NMS stock is traded and every national securities association act jointly pursuant to one or more national market system plans to disseminate consolidated information, including a national best bid and national best offer, on quotations for transactions in NMS stocks, and that such plan or plans provide for the dissemination of all consolidated information for an individual NMS stock through a single plan processor.
The UTP Plan was filed with and approved by the SEC as a national market system plan in accordance with the Exchange Act and Regulation NMS to provide for the collection, consolidation and dissemination of such information for Nasdaq-listed securities. The Nasdaq Stock Market serves as the processor for the UTP Plan pursuant to a contract that was recently extended for a two-year term through October 2023. The Nasdaq Stock Market also serves as the administrator for the UTP Plan. To fulfill its obligations as the processor, The Nasdaq Stock Market has designed, implemented, maintained, and operated a data processing and communications system, hardware, software and communications infrastructure to provide processing for the UTP Plan. As the administrator, The Nasdaq Stock Market manages the distribution of market data, the collection of the resulting market data revenue, and the dissemination of that revenue to plan members in accordance with the terms of the UTP Plan and of Regulation NMS.
In May 2020, the SEC adopted an order to require changes to the governance of securities information processors. The SEC also approved, with material amendments, SRO proposed policies regarding the governance of these entities. In June and July 2020, we and several other exchanges petitioned the U.S. Court of Appeals for the District of Columbia Circuit to review both the SEC’s governance order and its amendments to the SRO-proposed policies. In December 2020, the SEC adopted a rule to modify the infrastructure for the collection, consolidation and dissemination of market data for exchange-listed national market stocks, or NMS data. The rule changes include, among other things, requiring exchanges to add more “core data” to the securities information processors, including partial depth-of-book, certain odd-lot quotations/transactions, auction, regulatory, and administrative data; eliminating central, official consolidators of tape plans and enables multiple competing consolidators to register to aggregate and disseminate core data; and authorizing persons to purchase and aggregate core data directly from the exchanges for their own use. The rule implementation schedule has not yet been finalized by the SEC, and we are not certain of the timing, or
the impact, of these new rules on our business or role as a securities information processor. In February 2021, we petitioned the U.S. Court of Appeals for the District of Columbia Circuit to review the SEC’s rulemaking. In addition, we requested the SEC to stay implementation of the rule.
Regulation SCI. Regulation SCI is a set of rules designed to strengthen the technology infrastructure of the U.S. securities markets. Regulation SCI applies to national securities exchanges, operators of certain ATSs, market data information providers and clearing agencies, subjecting these entities to extensive new compliance obligations, with the goals of reducing the occurrence of technical issues that disrupt the securities markets and improving recovery time when disruptions occur. We implemented an inter-disciplinary program to ensure compliance with Regulation SCI. Regulation SCI policies and procedures were created, internal policies and procedures were updated, and an information technology governance program was developed to ensure compliance.
Regulation of Registered Investment Advisor Subsidiary. Our subsidiary NDW is an investment advisor registered with the SEC under the Investment Advisors Act of 1940. In this capacity, NDW is subject to oversight and inspections by the SEC. Among other things, registered investment advisors like NDW must comply with certain disclosure obligations, advertising and fee restrictions and requirements relating to client suitability and custody of funds and securities. Registered investment advisors are also subject to anti-fraud provisions under both federal and state law.
CFTC Regulation. The Dodd-Frank Wall Street Reform and Consumer Protection Act also has resulted in increased CFTC regulation of our use of certain regulated derivatives products, as well as the operations of some of our subsidiaries outside the U.S. and their customers.
Canadian Regulation
Regulation of Nasdaq Canada is performed by the Canadian Securities Administrators, an umbrella organization of Canada’s provincial and territorial securities regulators. As a recognized exchange in Ontario, Nasdaq Canada must comply with the terms and conditions of its exchange recognition order. While exempt from exchange recognition in each jurisdiction in Canada other than Ontario where Nasdaq Canada carries on business, Nasdaq must comply with the terms and conditions of an exemption order granted by the other jurisdictions. Oversight of the exchange is performed by Nasdaq Canada’s lead regulator, the Ontario Securities Commission. Additionally, Nasdaq Fixed Income provides access to Canadian-based “Permitted Clients” for trading non-Canadian fixed income securities and is subject to Canadian securities regulations in connection with providing these services.
Nasdaq Canada is subject to several national marketplace related instruments which set out requirements for marketplace operations, trading rules and managing
13
electronic trading risk. Exchange terms and conditions include but are not limited to, requirements for, governance, regulation, rules and rulemaking, fair access, conflict management and financial viability.
European Regulation
Regulation of our markets in the European Union and the European Economic Area focuses on matters relating to financial services, listing and trading of securities, clearing and settlement of securities and commodities as well as issues related to market abuse.
In July 2016, the European Union’s Market Abuse Regulation, which is intended to prevent market abuse, entered into force. MiFID II and MiFIR entered into force in January 2018 and primarily affect our European trading businesses. Many of the provisions of MiFID II and MiFIR are implemented through technical standards drafted by the European Securities and Markets Authority and approved by the European Commission. In addition, in 2016, the European Union adopted legislation on governance and control of the production and use of benchmark indexes. The Benchmark Regulation applies in the European Union from early 2018. However, due to transitional clauses in the Benchmark Regulation, Nasdaq as a benchmark provider, did not need to be in compliance with the Benchmark Regulation until January 1, 2020 in relation to benchmarks provided by Nasdaq’s European subsidiaries, or until January 1, 2024, in relation to benchmarks provided by non-European Nasdaq entities. As the regulatory environment continues to evolve and related opportunities arise, we intend to continue developing our products and services to ensure that the exchanges and clearinghouse that comprise Nasdaq Nordic and Nasdaq Baltic maintain favorable liquidity and offer fair and efficient trading.
The entities that operate trading venues in the Nordic and Baltic countries are each subject to local regulations. As a result, we have a strong local presence in each jurisdiction in which we operate regulated businesses. The regulated entities have decision-making power and can adopt policies and procedures and retain resources to manage all operations subject to their license. In Sweden, general supervision of the Nasdaq Stockholm exchange is carried out by the SFSA, while Nasdaq Clearing’s role as CCP in the clearing of derivatives is supervised by the SFSA and overseen by the Swedish central bank (Riksbanken). Additionally, as a function of the Swedish two-tier supervisory model, certain surveillance in relation to the exchange market is carried out by the Nasdaq Stockholm exchange, through its surveillance function.
Nasdaq Stockholm’s exchange activities are regulated primarily by the SSMA, which implements MiFID II into Swedish law and which sets up basic requirements regarding the board of the exchange and its share capital, and which also outlines the conditions on which exchange licenses are issued. The SSMA also provides that any changes to the exchange’s articles of association following initial
registration must be approved by the SFSA. Nasdaq Clearing holds the license as a CCP under EMIR.
With respect to ongoing operations, the SSMA requires exchanges to conduct their activities in an honest, fair and professional manner, and in such a way as to maintain public confidence in the securities markets. When operating a regulated market, an exchange must apply the principles of free access (i.e., that each person which meets the requirements established by law and by the exchange may participate in trading), neutrality (i.e., that the exchange’s rules for the regulated market are applied in a consistent manner to all those who participate in trading) and transparency (i.e., that the participants must be given speedy, simultaneous and correct information concerning trading and that the general public must be given the opportunity to access this information). Additionally, the exchange operator must identify and manage the risks that may arise in its operations, use secure technical systems and identify and handle the conflicts of interest that may arise between the exchange or its owners’ interests and the interest in safeguarding effective risk management and secure technical systems. Similar requirements are set up by EMIR in relation to clearing operations.
The SSMA also contains the framework for both the SFSA’s supervisory work in relation to exchanges and clearinghouses and the surveillance to be carried out by the exchanges themselves. The latter includes the requirement that an exchange should have “an independent surveillance function with sufficient resources and powers to meet the exchange’s obligations.” That requires the exchange to, among other things, supervise trading and price information, compliance with laws, regulations and good market practice, participant compliance with trading participation rules, financial instrument compliance with relevant listing rules and the extent to which issuers meet their obligation to submit regular financial information to relevant authorities.
The regulatory environment in the other Nordic and Baltic countries in which a Nasdaq entity has a trading venue is broadly similar to the regulatory environment in Sweden. Since 2005, there has been cooperation between the supervisory authorities in Sweden, Iceland, Denmark and Finland, which looks to safeguard effective and comprehensive supervision of the exchanges comprising Nasdaq Nordic and the systems operated by it, and to ensure a common supervisory approach. In 2019, the supervisory authority in Norway joined this cooperation.
Nasdaq owns a central securities depository known as Nasdaq CSD SE (Societas Europaea)¸ that provides notary, settlement, central maintenance and other services in the Baltic countries and in Iceland. Nasdaq CSD SE is licensed under the European Central Securities Depositories Regulation and is supervised by the respective regulatory institutions.
We operate a licensed exchange, Nasdaq Oslo ASA, in Norway that trades and lists commodity derivatives. Although Norway is not a member of the EU, as a result of
14

the European Economic Area, or EEA, agreement (agreement on the EEA entered into between the EU and European Free Trade Association) the regulatory environment is broadly similar to what applies in EU member states. In addition, in January 2019 new legislation entered into force in Norway mirroring the provisions of MiFID II and MIFIR. As a result, the regulatory environment in Norway is similar to Sweden. The Financial Supervisory Authority of Norway supervises the Norwegian exchange on an autonomous basis and the Norwegian exchange also has a separate market surveillance function overseen by the Financial Supervisory Authority.
Confidence in capital markets is paramount for trading to function properly. Nasdaq Nordic carries out market surveillance through an independent unit that is separate from the business operations. The surveillance work is conceptually organized into two functions: one for the review and admission of listing applications and surveillance activities related to issuers (issuer surveillance) and one for surveillance of trading (trading surveillance). The real-time trading surveillance for the Finnish, Icelandic, Danish and Swedish markets has been centralized to Stockholm. In addition, there are special personnel who carry out surveillance activities at Nasdaq Oslo and each of the three Baltic exchanges. In Finland and Sweden, decisions to list new companies on the main market are made by listing committees that have external members in addition to members from each respective exchange and in the other countries the decision is made by the respective president of the exchange.
If there is suspicion that a listed company or member has acted in breach of exchange regulations, the matter is handled by the respective surveillance department. Serious breaches are considered by the respective disciplinary committee in Denmark, Finland, Iceland, Sweden and Norway. Suspected insider trading is reported to the appropriate authorities in the respective country.
In the United Kingdom, The Nasdaq Stock Market and Nasdaq Oslo ASA are each subject to regulation by the Financial Conduct Authority as “Recognised Overseas Investment Exchanges.” Exchanges in Sweden, Denmark, and Finland have applied for status as “Recognised Overseas Investment Exchanges” and we expect these exchanges to receive such status during 2021. Pending approval, we are able to operate in the United Kingdom under the overseas person exemption. Nasdaq Clearing is registered as a recognized third country CCP with the Bank of England under the temporary recognition regime. The registration became effective on December 31, 2020, and lasts for three years. We will be applying for permanent recognition within eighteen months of the end of this implementation period.
Human Capital Management
Nasdaq’s commitment to, and investment in, attracting, retaining, developing and motivating its employees strengthened during 2020, and while the COVID-19 pandemic has created certain challenges for our employees, we have bolstered our human capital management efforts
throughout the past year. We have built on our existing foundation of striving to create a diverse and inclusive work environment of equal opportunity, where employees feel respected and valued for their contributions, and where Nasdaq and its employees have opportunities to make positive contributions to our local communities and to social justice initiatives.
As of December 31, 2020, we had 4,830 employees.
ESG Oversight
The Nominating & ESG Committee has formal responsibility and oversight for ESG policies and programs and receives regular reporting on key ESG matters and initiatives. Our internal ESG Working Group is co-chaired by executive leaders and comprised of geographically diverse representatives from multiple business units. The ESG Working Group serves as the central oversight body for our ESG strategy.
COVID-19 and Employee Safety
As the COVID-19 pandemic continues around the world, affecting all of our offices, we are committed to ensuring the safety and well-being of our employees and stakeholders, and complying with local government regulations in the areas in which we operate. This includes having the vast majority of our employees work from home, while implementing additional safety measures and precautions for employees continuing critical on-site work in certain of our offices. We have informed our employees that they may continue to work remotely through at least June 30, 2021, and we will continue to evaluate local conditions and regulations before we fully transition back to our offices.
Talent Management and Development
We continued to increase our efforts in attracting and retaining our employees.
Nasdaq seeks to hire world-class, innovative, and diverse talent across the globe. We recently strengthened our employer brand strategy with an updated “People Promise,” which encapsulates Nasdaq’s vision, mission, purpose and employment experience in order to become a leading company for highly sourced talent. In addition, we created a new diversity recruiting function to help us attract talent using innovative new techniques and channels.
We introduced new onboarding and exit surveys to better understand why employees join, and leave, Nasdaq. We conducted annual performance management, succession planning and advancement exercises to ensure we are aligning our employees with the right opportunities across the company. Additionally, we introduced a peer-to-peer employee recognition program. Finally, as a result of COVID-19 restrictions, we reinvented our internship program to remotely welcome 151 interns to Nasdaq.
We have invested in professional development for our employees, including offering access to more than 14,000 professional development programs; providing tuition
15

assistance to employees enrolled in degree-granting academic programs; holding internal career fairs and career development programs; and providing one-on-one professional coaching opportunities.
Diversity and Inclusion
In 2020, we established three pillars to guide our diversity and inclusion efforts with our employees: Workforce, to ensure our employee population is representative of the communities in which we operate; Workplace, to ensure a positive workplace experience for all employees of Nasdaq; and Marketplace, to positively influence our peers in the capital market space and to invest in our local communities in which we operate.
Nasdaq sponsors eleven employee-led internal affinity networks. These networks include more than 1,500 employee members to support the diverse communities that comprise our workforce, and include networks for our Black, Asian American, Hispanic, LGBTQ, female, disabled, veteran, and parent/caregiver employees. The networks provide both formal and informal development programs and guidance for their members, and benefit the entire Nasdaq workforce through educational events, guest speakers, and volunteering opportunities.
We created a dedicated diversity recruiting function to further our recruiting efforts and enhance the representation of women and minorities at Nasdaq. In order to monitor our diversity efforts on an ongoing basis, each business unit has a dashboard reflecting the diversity of their employee population and can track changes on a monthly basis. We launched a new “Inclusive Leadership” training program for all employees, starting with our Chief Executive Officer and senior executives. We also added customized developmental programs for underrepresented talent, including executive mentoring and accelerated leadership development programs. Additionally, as a signatory to the Parity Pledge, we fulfilled our commitment to interview female candidates for all externally advertised roles at the Vice President level and above.
On a company-wide basis, as the social justice movement gained momentum in 2020, we hosted a series of educational discussions for all of our employees featuring internal and external guest speakers addressing racial dynamics in our society and fostering greater understanding in the workplace. In honor of Juneteenth, we debuted “Amplifying Black Voices,” a series of art by Black artists displayed on the Nasdaq Tower in New York’s Times Square.
Finally, Nasdaq published statistics on the composition of its own global workforce by gender, and of its U.S. workforce by gender, race and ethnicity, in our U.S. EEO-1 report and our Sustainability Report, which reports are available on our website.Compensation and BenefitsOur Total Rewards compensation program is designed to attract, retain, and empower employees to successfully execute our growth strategy. Nasdaq’s balanced Total
Rewards program encourages decisions and behaviors that align with the short and long-term interests of our shareholders. The building blocks of our Total Rewards program are designed to promote and support our strategy and reinforce our cultural values of: Act as an Owner, Play as a Team, Fuel Client Success, Lead with Integrity, Expand Your Expertise, and Drive Innovation. Our Company values energize and align employees with the most important priorities, and encourage and reward high levels of performance, innovation and growth, while not promoting undue risk. Our compensation program seeks to retain our most talented employees in a highly dynamic, competitive talent market, while also engaging and exciting current and future employees who possess the leading skills and competencies needed for us to achieve our strategy and objectives. The Total Rewards compensation program is comprised of base salary, an annual cash bonus incentive program and long-term equity incentive awards. The long-term equity awards align our employee interests with our shareholders.
In addition to cash and equity compensation, we also offer employee benefits such as health (medical, dental, vision and telehealth) insurance, paid time off, paid parental leave, adoption assistance and a U.S. 401(k) Plan with company matching. We also introduced additional new benefits this year as a result of the COVID-19 pandemic in an effort to help our employees with the additional stress in balancing their work and personal commitments, including providing “flex days” for additional time away from the office without requiring the usage of vacation or personal leave days, additional family care resources and benefits, including back-up childcare and other caregiver support, wellness benefits, and student loan repayment benefits. We also provide additional benefits to our international employees based on local regulations and practice to address market-specific needs.
Community Involvement
We are committed to creating lasting, positive change within our Company and the communities we serve, and increased our community involvement during 2020, both as a result of the COVID-19 pandemic and the heightened focus on social inequality in the United States.
Our employees take pride in being active in our communities. Through our Nasdaq GoodWorks Corporate Responsibility Program, we have committed to supporting the communities in which we live and work by providing eligible full and part-time employees two paid days off per year to volunteer. We also match charitable donations of all Nasdaq employees and contractors up to $1,000, or more in certain circumstances, per calendar year, and during 2020, we offered additional, higher matching programs for employee donations to global COVID-19 relief and response organizations and other charities selected by the Nasdaq employee networks. While most of our in-person volunteer efforts in 2020 pivoted to virtual volunteering events due to the pandemic, we still organized more than 90 volunteer events around the world,
16

and more than 260 associates volunteered and contributed over 2,600 service hours.
In 2020, we announced actions to strengthen our continued commitment to diversity and inclusion and donated an aggregate of $7 million, including $6 million in cash, to organizations serving underserved, minority communities in fighting the impact of the COVID-19 health crisis. These organizations included the Equal Justice Initiative, the NAACP’s COVID-19 project and World Central Kitchen’s Restaurants for the People. Additionally, we contributed $10 million to support the Nasdaq Foundation and plan to annually fund the Nasdaq Foundation with approximately one quarter of one percent of our operating profits beginning in 2021.
In September 2020, we launched the “Purpose Initiative,” which is designed to advance inclusive growth and prosperity. The Purpose Initiative comprises our philanthropic, community outreach, corporate sustainability, and employee volunteerism programs, all designed to leverage our unique place at the center of capital creation, markets, and technology and drive stronger economies, more equitable opportunities and contribute to a more sustainable world. We also relaunched the Nasdaq Foundation in September 2020, with a renewed mission focused on two primary goals: (i) reimagining investor engagement to equip under-represented communities with the financial knowledge to share in the wealth that markets create; and (ii) leveraging our investment in the Nasdaq Entrepreneurial Center alongside new strategic partnerships with organizations that can help build a deeper, data-led understanding of where the challenges are greatest, what existing efforts could be amplified, and how the Nasdaq Foundation can make new and distinctive contributions.
Nasdaq Website and Availability of SEC Filings
We file periodic reports, proxy statements and other information with the SEC. The SEC maintains a website that contains reports, proxy and information statements, and other information regarding issuers that file electronically with the SEC. The address of that site is http://www.sec.gov.
Our website is http://ir.nasdaq.com. Information on our website is not a part of this Form 10-K. We make available free of charge on our website, or provide a link to, our Forms 10-K, Forms 10-Q and Forms 8-K and any amendments to these documents, that are filed or furnished pursuant to Section 13(a) or 15(d) of the Exchange Act as soon as reasonably practicable after we electronically file such material with, or furnish it to, the SEC. To access these filings, go to Nasdaq’s website and click on “Financials” then click on “SEC Filings.”
Item 1A. Risk Factors
The risks and uncertainties described below are not the only ones facing us. Additional risks and uncertainties not presently known to us or that we currently believe to be immaterial may also adversely affect our business. If any of
the following risks actually occur, our business, financial condition, or operating results could be adversely affected.
RISKS RELATED TO OUR BUSINESS AND INDUSTRY
The COVID-19 pandemic could have an adverse effect on our business, financial condition, liquidity or results of operations.
We are continuing to closely monitor the evolving impact of the COVID-19 pandemic on our industry and business in the United States and worldwide, including its effect on our customers, employees, vendors and other stakeholders. The COVID-19 pandemic has created significant volatility, uncertainty and economic disruption, which may adversely affect our business, financial condition, liquidity or results of operations.
While results in our Market Services segment were strong in 2020, reflecting elevated trading volumes amidst the COVID-19 pandemic, there is no assurance that such trading levels will continue. In our Corporate Platforms segment, while we have experienced strong demand for IPOs in 2020, we cannot predict whether investor demand for IPOs and new listings will continue in the future. We continue to observe that certain Market Technology customers are delaying purchasing decisions or extending implementation schedules. While our licensed ETPs, and in particular our Nasdaq-100 index, have grown due to the increases in the market and net inflows, there is no assurance that such AUM levels or volume trends will continue in the future.
As the COVID-19 pandemic and its resultant economic effects continue, existing customers in each of our segments may reduce or cancel spending for our products and services. Additionally, our sales pipeline with new client prospects may be further affected as new clients may delay or cancel purchase decisions while they evaluate the continuing impact of COVID-19.
In response to COVID-19, we have shifted to having a majority of our staff work from home and have added additional network capacity and monitoring. However, such remote work may cause heightened cybersecurity and operational risks. Certain of our global offices have re-opened on a limited basis, with applicable safety protocols in place, or expect to re-open subject to limitations during 2021. We could face disruption to our business or operations if a significant number of our employees or any of our key employees becomes ill due to the virus. We have filed a proposal with the SEC to amend Nasdaq PHLX’s business continuity plan to permit a virtual trading crowd, which would allow Nasdaq PHLX to operate its trading floor remotely in the event the physical trading floor becomes unavailable due to COVID-19. If our pending rule change is not approved by the SEC, and Nasdaq PHLX is unable to operate its physical trading floor due to COVID-19 or other restrictions, our revenue, market share and reputation may be adversely affected. If the rule change is approved by the SEC and we are unable to successfully operate the virtual trading
17

crowd in compliance with the SEC rules, our revenues and reputation may be harmed. Any disruption to our ability to deliver services to our clients could result in liability to our customers, regulatory fines, penalties or other sanctions, increased operational costs or harm to our reputation and brand. This, in turn, may have an adverse effect on our business, financial condition, liquidity or results of operations.
The extent to which the COVID-19 pandemic impacts our business, financial condition, liquidity or results of operations will depend on future developments, which are uncertain and cannot be predicted, including the scope and duration of the COVID-19 pandemic, the length of time government, commercial and travel limitations are in place, the continued effectiveness of our remote work arrangements, actions taken by governmental authorities, regulators and other third parties in response to the pandemic, as well as other direct and indirect impacts on us, our exchanges, our customers, our vendors and other stakeholders.
Economic conditions and market factors, which are beyond our control, may adversely affect our business and financial condition.
Our business performance is impacted by a number of factors, including general economic conditions, market volatility, changes in investment patterns and priorities, pandemics and other factors that are generally beyond our control. To the extent that global or national economic conditions weaken and result in slower growth or recessions, our business is likely to be negatively impacted. Adverse market conditions could reduce customer demand for our services and the ability of our customers, lenders and other counterparties to meet their obligations to us. Poor economic conditions may result in a reduction in the demand for our products and services, including our market technology, data, indexes and IR & ESG Services, a decline in trading volumes or values and deterioration of the economic welfare of our listed companies.
Trading volumes and values are driven primarily by general market conditions and declines in trading volumes or values may affect our market share and impact our pricing. In addition, our Market Services businesses receive revenues from a relatively small number of customers concentrated in the financial industry, so any event that impacts one or more customers or the financial industry in general could impact our revenues.
The number of listings on our markets is primarily influenced by factors such as investor demand, the global economy, available sources of financing, and tax and regulatory policies. Adverse conditions may jeopardize the ability of our listed companies to comply with the continued listing requirements of our exchanges, or reduce the number of issuers launching IPOs, including SPACs, and direct listings.
Investment Intelligence revenues may be significantly affected by global economic conditions. Professional subscriptions to our data products are at risk if staff
reductions occur in financial services companies or if our customers consolidate, which could result in significant reductions in our professional user revenue or expose us to increased risks relating to dependence on a smaller number of customers. In addition, adverse market conditions may cause reductions in the number of non-professional investors with investments in the market and in ETP AUM tracking Nasdaq indexes as well as trading in futures linked to Nasdaq indexes.
There may be less demand for our IR & ESG Services or Market Technology products if global economic conditions are weak. Our customers historically cut back on purchases of new services and technology when growth rates decline, thereby reducing our opportunities to sell new products and services or upgrade existing products and services.
A reduction in trading volumes or values, market share of trading, the number of our listed companies, or demand for Investment Intelligence, Market Technology or Corporate Platforms products and services due to economic conditions or other market factors could adversely affect our business, financial condition and operating results.
The industries we operate in are highly competitive.
We face significant competition in our Market Technology, Investment Intelligence and Corporate Platforms businesses from other market participants. We face intense competition from other exchanges and markets for market share of trading activity and listings. This competition includes both product and price competition.
The liberalization and globalization of world markets has resulted in greater mobility of capital, greater international participation in local markets and more competition. As a result, both in the U.S. and in other countries, the competition among exchanges and other execution venues has become more intense. Marketplaces in both Europe and the U.S. have also merged to achieve greater economies of scale and scope.
Regulatory changes also have facilitated the entry of new participants in the European Union that compete with our European markets. The regulatory environment, both in the U.S. and in Europe, is structured to maintain this environment of intense competition. In addition, a high proportion of business in the securities markets is becoming concentrated in a smaller number of institutions and our revenue may therefore become concentrated in a smaller number of customers.
We also compete globally with other regulated exchanges and markets, ATSs, MTFs and other traditional and non-traditional execution venues. Some of these competitors also are our customers. In addition, competitors recently have launched new exchanges in the U.S., including an exchange established by a group of our customers. Competitors may develop market trading platforms that are more competitive than ours. Competitors may leverage data more effectively or enter into strategic partnerships, mergers or acquisitions that could make their trading, listings, clearing, data or technology businesses more competitive than ours.
18

We face intense price competition in all areas of our business. In particular, the trading industry is characterized by price competition. We have in the past lowered prices, and in the U.S., increased rebates for trade executions to attempt to gain or maintain market share. These strategies have not always been successful and have at times hurt operating performance. Additionally, we have also been, and may once again be, required to adjust pricing to respond to actions by competitors and new entrants, or due to new SEC regulations, which could adversely impact operating results. We also compete with respect to the pricing of data products and with respect to products for pre-trade book data and for post-trade last sale data. In addition, pricing in our Corporate Platforms, Index and Market Technology businesses is subject to competitive pressures.
If we are unable to compete successfully in the industries in which we do business, our business, financial condition and operating results will be adversely affected.
System limitations or failures could harm our business.
Our businesses depend on the integrity and performance of the technology, computer and communications systems supporting them. If new systems fail to operate as intended or our existing systems cannot expand to cope with increased demand or otherwise fail to perform, we could experience unanticipated disruptions in service, slower response times and delays in the introduction of new products and services. These consequences could result in service outages, lower trading volumes or values, financial losses, decreased customer satisfaction and regulatory sanctions. Our markets and the markets that rely on our technology have experienced systems failures and delays in the past and could experience future systems failures and delays.
Although we currently maintain and expect to maintain multiple computer facilities that are designed to provide redundancy and back-up to reduce the risk of system disruptions and have facilities in place that are expected to maintain service during a system disruption, such systems and facilities may prove inadequate. If trading volumes increase unexpectedly or other unanticipated events occur, we may need to expand and upgrade our technology, transaction processing systems and network infrastructure. We do not know whether we will be able to accurately project the rate, timing or cost of any volume increases, or expand and upgrade our systems and infrastructure to accommodate any increases in a timely manner.
While we have programs in place to identify and minimize our exposure to vulnerabilities and work in collaboration with the technology industry to share corrective measures with our business partners, we cannot guarantee that such events will not occur in the future. Any system issue that causes an interruption in services, decreases the responsiveness of our services or otherwise affects our services could impair our reputation, damage our brand name and negatively impact our business, financial condition and operating results.
We must continue to introduce new products, initiatives and enhancements to maintain our competitive position.
We intend to launch new products and initiatives and continue to explore and pursue opportunities to strengthen our business and grow our company. We may spend substantial time and money developing new products, initiatives and enhancements to existing products. If these products and initiatives are not successful, we may not be able to offset their costs, which could have an adverse effect on our business, financial condition and operating results.
In our technology operations, we have invested substantial amounts in the development of system platforms, the rollout of our platforms and the adoption of new technologies. Although investments are carefully planned, there can be no assurance that the demand for such platforms or technologies will justify the related investments. If we fail to generate adequate revenue from planned system platforms or the adoption of new technologies, or if we fail to do so within the envisioned timeframe, it could have an adverse effect on our results of operations and financial condition. In addition, clients may delay purchases in anticipation of new products or enhancements. Additionally, it is also possible that we may allocate significant amounts of cash and other resources to product technologies or business models for which market demand is lower than anticipated. In addition, the introduction of new products by competitors, the emergence of new industry standards or the development of entirely new technologies to replace existing product offerings could render our existing or future products obsolete.
A decline in trading and clearing volumes or values or market share will decrease our trading and clearing revenues.
Trading and clearing volumes and values are directly affected by economic, political and market conditions, broad trends in business and finance, unforeseen market closures or other disruptions in trading, the level and volatility of interest rates, inflation, changes in price levels of securities and the overall level of investor confidence. In recent years, and particularly in 2020, trading and clearing volumes and values across our markets have fluctuated significantly depending on market conditions and other factors beyond our control, including the COVID-19 pandemic. Current initiatives being considered by regulators and governments could have a material adverse effect on overall trading and clearing volumes or values. Because a significant percentage of our revenues is tied directly to the volume or value of securities traded and cleared on our markets, it is likely that a general decline in trading and clearing volumes or values would lower revenues and may adversely affect our operating results if we are unable to offset falling volumes or values through pricing changes. Declines in trading and clearing volumes or values may also impact our market share or pricing structures and adversely affect our business and financial condition.
If our total market share in securities decreases relative to our competitors, our venues may be viewed as less attractive sources of liquidity. If our exchanges are perceived to be less
19

liquid, then our business, financial condition and operating results could be adversely affected.
Since some of our exchanges offer clearing services in addition to trading services, a decline in market share of trading could lead to a decline in clearing and depository revenues. Declines in market share also could result in issuers viewing the value of a listing on our exchanges as less attractive, thereby adversely affecting our listing business. Finally, declines in market share of Nasdaq-listed securities, or recently adopted SEC rules and regulations, could lower The Nasdaq Stock Market’s share of tape pool revenues under the consolidated data plans, thereby reducing the revenues of our Market Data business.
Our role in the global marketplace may place us at greater risk for a cyberattack.
Our systems and operations are vulnerable to damage or interruption from security breaches. Due to COVID-19, most of our workforce may continue to work from home, creating a broader and more distributed network footprint and increased reliance on the home networks of employees. Some of these threats include attacks from foreign governments, hacktivists, insiders and criminal organizations. Foreign governments may seek to obtain a foothold in U.S. critical infrastructure, hacktivists may seek to deploy denial of service attacks to bring attention to their cause, insiders may pose a risk by human error or malicious activity and criminal organizations may seek to profit from stolen data. Computer viruses and worms also continue to be a threat with ransomware increasingly being used by criminals to extort money. Given our position in the global securities industry, we may be more likely than other companies to be a direct target, or an indirect casualty, of such events.
While we continue to employ resources to monitor our systems and protect our infrastructure, these measures may prove insufficient depending upon the attack or threat posed. Any system issue, whether as a result of an intentional breach, collateral damage from a new virus or a non-malicious act, could damage our reputation and cause us to lose customers, experience lower trading volumes or values, incur significant liabilities or otherwise have a negative impact on our business, financial condition and operating results. Any system breach may go undetected for an extended period of time. As cybersecurity threats continue to increase in frequency and sophistication, and as the domestic and international regulatory and compliance structure related to information security, data privacy and data usage becomes increasingly complex and exacting, we may be required to devote significant additional resources to strengthen our cybersecurity capabilities, and to identify and remediate any security vulnerabilities, which could adversely impact our business, financial condition and operating results.
The success of our business depends on our ability to keep up with rapid technological and other competitive changes affecting our industry. Specifically, we must complete development of, successfully implement and maintain platforms that have the functionality, performance,
capacity, reliability and speed required by our business and our regulators, as well as by our customers.
The markets in which we compete are characterized by rapidly changing technology, evolving industry and regulatory standards, frequent enhancements to existing products and services, the adoption of new services and products and changing customer demands. We are reliant on our customers that purchase our on-premise solutions to maintain a certain level of network infrastructure for our products to operate and to allow for our support of those products, and there is no assurance that a customer will implement such measures. We may not be able to keep up with rapid technological and other competitive changes affecting our industry. For example, we must continue to enhance our platforms to remain competitive as well as to address our regulatory responsibilities, and our business will be negatively affected if our platforms or the technology solutions we sell to our customers fail to function as expected. If we are unable to develop our platforms to include other products and markets, or if our platforms do not have the required functionality, performance, capacity, reliability and speed required by our business and our regulators, as well as by our customers, we may not be able to compete successfully. Further, our failure to anticipate or respond adequately to changes in technology and customer preferences or any significant delays in product development efforts, could have a material adverse effect on our business, financial condition and operating results.
Our clearinghouse operations expose us to risks, including credit or liquidity risks that may include defaults by clearing members, or insufficiencies in margins or default funds.
We are subject to risks relating to our operation of a clearinghouse, including counterparty and liquidity risks, risk of defaults by clearing members and risks associated with adequacy of the customer margin and of default funds. Our clearinghouse operations expose us to counterparties with differing risk profiles. We may be adversely impacted by the financial distress or failure of a clearing member, which may cause us negative financial impact, reputational harm or regulatory consequences, including litigation or regulatory enforcement actions.
In September 2018, a member of the Nasdaq Clearing commodities market defaulted due to an inability to post sufficient collateral to cover increased margin requirements for the positions of the relevant member. For further discussion of the default, see Note 15, “Clearing Operations,” to the consolidated financial statements. There are no assurances that similar defaults will not occur again, which could result in losses. To the extent that our regulatory capital and risk management policies are not adequate to manage future financial and operational risks in our clearinghouse, we may experience adverse consequences to our operating results or ability to conduct our business.
We are exposed to credit risk from third parties, including customers, counterparties and clearing agents.
20

We are exposed to credit risk from third parties, including customers, counterparties and clearing agents. These parties may default on their obligations to us due to the effects of COVID-19 on their business, bankruptcy, lack of liquidity, operational failure or other reasons.
We clear a range of equity-related and fixed-income-related derivative products, commodities and resale and repurchase agreements. We assume the counterparty risk for all transactions that are cleared through Nasdaq Clearing on our markets and guarantee that our cleared contracts will be honored. We enforce minimum financial and operational criteria for membership eligibility, require members and investors to provide collateral, and maintain established risk policies and procedures to ensure that the counterparty risks are properly monitored and proactively managed; however, none of these measures provides absolute assurance against experiencing financial losses from defaults by our counterparties on their obligations. No guarantee can be given that the collateral provided will at all times be sufficient. Although we maintain clearing capital resources to serve as an additional layer of protection to help ensure that we are able to meet our obligations, these resources may not be sufficient.
In addition, one of our broker-dealer subsidiaries, Execution Access, has a clearing arrangement with the Industrial and Commercial Bank of China Financial Services LLC, or ICBC. As of December 31, 2020, we have contributed $13 million of clearing deposits to ICBC in connection with this clearing arrangement. Some of the trading activity in Execution Access is cleared by ICBC through the Fixed Income Clearing Corporation. Execution Access assumes the counterparty risk of clients that do not clear through the Fixed Income Clearing Corporation. Counterparty risk of clients exists for Execution Access between the trade date and settlement date of the individual transactions, which is at least one business day (or more, if specified by the U.S. Treasury issuance calendar). Counterparties that do not clear through the Fixed Income Clearing Corporation are subject to a credit due diligence process and may be required to post collateral, provide principal letters, or provide other forms of credit enhancement to Execution Access for the purpose of mitigating counterparty risk. Daily position trading limits are also enforced for such counterparties. Although we believe that the potential for us to be required to make payments under these arrangements is mitigated through the pledged collateral and our risk management policies, no guarantee can be provided that these arrangements will at all times be sufficient.
We also have credit risk related to transaction and subscription-based revenues that are billed to customers on a monthly or quarterly basis, in arrears.
Credit losses such as those described above could adversely affect our consolidated financial position and results of operations.
Technology issues relating to our role as exclusive processor for Nasdaq-listed stocks could affect our business.
Nasdaq, as technology provider to the UTP Operating Committee, has implemented measures to enhance the resiliency of the existing processor system. Nasdaq transferred the processor technology platform to our INET platform and this migration further enhanced the resiliency of the processor systems. We further improved the systems' resiliency by adding the UTP SnapShot service. However, if future outages occur or the processor systems fail to function properly while we are operating the systems, it could have an adverse effect on our business, reputation and financial condition.
Stagnation or decline in the listings market could have an adverse effect on our revenues.
The market for listings is dependent on the prosperity of companies and the availability of risk capital. A stagnation or decline in the number of new listings, or an increase in the number of delistings, on The Nasdaq Stock Market and the Nasdaq Nordic and Nasdaq Baltic exchanges could cause a decrease in revenues for future years. Furthermore, a prolonged decrease in the number of listings could negatively impact the growth of our transactions revenues. Our IR & ESG Services business is also impacted by declines in the listings market or increases in acquisitions activity as there will be fewer publicly-traded customers that need our products.
RISKS RELATED TO TRANSACTIONAL ACTIVITIES AND STRATEGIC RELATIONSHIPS
We may not be able to successfully integrate acquired businesses, which may result in an inability to realize the anticipated benefits of our acquisitions.
We must rationalize, coordinate and integrate the operations of our acquired businesses. This process involves complex technological, operational and personnel-related challenges, which are time-consuming and expensive and may disrupt our business. The difficulties, costs and delays that could be encountered may include:
• difficulties, costs or complications in combining the companies’ operations, including technology platforms, which could lead to us not achieving the synergies we anticipate or customers not renewing their contracts with us as we migrate platforms;
• incompatibility of systems and operating methods;
• reliance on, or provision of, transition services;
• inability to use capital assets efficiently to develop the business of the combined company;
• difficulties of complying with government-imposed regulations in the U.S. and abroad, which may be conflicting;
21
• resolving possible inconsistencies in standards, controls, procedures and policies, business cultures and compensation structures;
• the diversion of management’s attention from ongoing business concerns and other strategic opportunities;
• difficulties in operating businesses we have not operated before;
• difficulties of integrating multiple acquired businesses simultaneously;
• the retention of key employees and management;
• the implementation of disclosure controls, internal controls and financial reporting systems at non-U.S. subsidiaries to enable us to comply with U.S. GAAP and U.S. securities laws and regulations, including the Sarbanes Oxley Act of 2002, required as a result of our status as a reporting company under the Exchange Act;
• the coordination of geographically separate organizations;
• the coordination and consolidation of ongoing and future research and development efforts;
• possible tax costs or inefficiencies associated with integrating the operations of a combined company;
• pre-tax restructuring and revenue investment costs;
• the retention of strategic partners and attracting new strategic partners; and
• negative impacts on employee morale and performance as a result of job changes and reassignments.
Foreign acquisitions involve risks in addition to those mentioned above, including those related to integration of operations across different cultures and languages, our ability to enforce contracts in various jurisdictions, currency risks and the particular economic, political and regulatory risks associated with specific countries. We may not be able to address these risks successfully, or at all, without incurring significant costs, delays or other operating problems that could disrupt our business and have a material adverse effect on our financial condition.
For these reasons, we may not achieve the anticipated financial and strategic benefits from our acquisitions and strategic initiatives. Any actual cost savings and synergies may be lower than we expect and may take a longer time to achieve than we anticipate, and we may fail to realize the anticipated benefits of acquisitions.
We may be required to recognize impairments of our goodwill, intangible assets or other long-lived assets in the future.
Our business acquisitions typically result in the recording of goodwill and intangible assets, and the recorded values of those assets may become impaired in the future. As of December 31, 2020, goodwill totaled $6.9 billion and intangible assets, net of accumulated amortization, totaled
$2.3 billion. The determination of the value of such goodwill and intangible assets requires management to make estimates and assumptions that affect our consolidated financial statements.
We assess goodwill and intangible assets, as well as other long-lived assets, including equity method investments, equity securities, and property and equipment, for potential impairment on an annual basis or more frequently if indicators of impairment arise. We estimate the fair value of such assets by assessing many factors, including historical performance and projected cash flows. Considerable management judgment is necessary to project future cash flows and evaluate the impact of expected operating and macroeconomic changes on these cash flows. The estimates and assumptions we use are consistent with our internal planning process. However, there are inherent uncertainties in these estimates.
There was no impairment of goodwill for the years ended December 31, 2020, 2019 and 2018, and there were no indefinite-lived intangible asset impairment charges in 2020, 2019 and 2018.
We may experience future events that may result in asset impairments. Future disruptions to our business, prolonged economic weakness, due to COVID-19 or otherwise, or significant declines in operating results at any of our reporting units or businesses, may result in impairment charges to goodwill, intangible assets or other long-lived assets. A significant impairment charge in the future could have a material adverse effect on our operating results.
Acquisitions, divestments, investments, joint ventures and other transactional activities may require significant resources and/or result in significant unanticipated losses, costs or liabilities.
Over the past several years, acquisitions have been significant factors in our growth. We have, and may continue to, divest additional businesses or assets in the future. Although we cannot predict our transactional activities, we believe that additional acquisitions, divestments, investments, joint ventures and other transactional activities will be important to our strategy. Such transactions may be material in size and scope. Many of the other potential purchasers of assets in our industry have greater financial resources than we have. Therefore, we cannot be sure that we will be able to complete future transactions on terms favorable to us.
We also invest in early-stage companies through our Nasdaq Venture program and hold minority interests in other entities. Given the size of these investments, we do not have operational control of these entities and may have limited visibility into risk management practices. Thus, we may be subject to additional capital requirements in certain circumstances and financial and reputational risks if there are operational failures.
We may finance future transactions by issuing additional equity and/or debt. The issuance of additional equity in connection with any such transaction could be substantially
22

dilutive to existing shareholders. In addition, the announcement or implementation of future transactions by us or others could have a material effect on the price of our common stock. The issuance of additional debt could increase our leverage substantially. We could face financial risks associated with incurring additional debt, particularly if the debt results in significant incremental leverage. Additional debt may reduce our liquidity, curtail our access to financing markets, impact our standing with credit rating agencies and increase the cash flow required for debt service. Any incremental debt incurred to finance a transaction could also place significant constraints on the operation of our business.
Furthermore, any future transactions could entail a number of additional risks, including:
• the inability to maintain key pre-transaction business relationships;
• increased operating costs;
• the inability to meet our target for return on invested capital;
• increased debt obligations, which may adversely affect our targeted debt ratios;
• risks to the continued achievement of our strategic direction;
• risks associated with divesting employees, customers or vendors when divesting businesses or assets;
• declines in the value of investments;
• exposure to unanticipated liabilities, including after a transaction is completed;
• incurred but unreported claims for an acquired company;
• difficulties in realizing projected efficiencies, synergies and cost savings; and
• changes in our credit rating and financing costs.
Charges to earnings resulting from acquisition, integration and restructuring costs may materially adversely affect the market value of our common stock.
In accordance with U.S. GAAP, we account for the completion of our acquisitions using the acquisition method of accounting. We allocate the total estimated purchase price to net tangible and identifiable intangible assets based on their fair values as of the date of completion of the acquisition and record the excess of the purchase price over those fair values as goodwill. Our financial results, including earnings per share, could be adversely affected by a number of financial adjustments including the following:
• we may incur additional amortization expense over the estimated useful lives of certain of the intangible assets acquired in connection with acquisitions during such estimated useful lives;
• we may have additional depreciation expense as a result of recording acquired tangible assets at fair value, in accordance with U.S. GAAP, as compared to book value as recorded;
• to the extent the value of goodwill or intangible assets becomes impaired, we may be required to incur material charges relating to the impairment of those assets;
• we may incur additional costs from integrating our acquisitions. The success of our acquisitions depends, in part, on our ability to integrate these businesses into our existing operations and realize anticipated cost savings, revenue synergies and growth opportunities; and
• we may incur restructuring costs in connection with the reorganization of any of our businesses.
RISKS RELATED TO LEGAL AND REGULATORY MATTERS
We operate in a highly regulated industry and may be subject to censures, fines and enforcement proceedings if we fail to comply with regulatory obligations that can be ambiguous and can change unexpectedly.
We operate in a highly regulated industry and are subject to extensive regulation in the U.S., Europe and Canada. The securities trading industry is subject to significant regulatory oversight and could be subject to increased governmental and public scrutiny in the future that can change in response to global conditions and events, or due to changes in trading patterns, such as due to the recent volatility involving the trading of certain stocks.
Our ability to comply with complex and changing regulation is largely dependent on our establishment and maintenance of compliance, audit and reporting systems that can quickly adapt and respond, as well as our ability to attract and retain qualified compliance and other risk management personnel. There is no assurance that our policies and procedures will always be effective or that we will always be successful in monitoring or evaluating the risks to which we are or may be exposed.
Our regulated markets are subject to audits, investigations, administrative proceedings and enforcement actions relating to compliance with applicable rules and regulations. Regulators have broad powers to impose fines, penalties or censure, issue cease-and-desist orders, prohibit operations, revoke licenses or registrations and impose other sanctions on our exchanges, broker-dealers, central securities depositories, clearinghouse and markets for violations of applicable requirements.
In the future, we could be subject to regulatory investigations or enforcement proceedings that could result in substantial sanctions, including revocation of our operating licenses. Any such investigations or proceedings, whether successful or unsuccessful, could result in substantial costs, the diversion of resources, including management time, and potential harm to our reputation, which could have a material adverse effect on our business, results of operations or
23

financial condition. In addition, our exchanges could be required to modify or restructure their regulatory functions in response to any changes in the regulatory environment, or they may be required to rely on third parties to perform regulatory and oversight functions, each of which may require us to incur substantial expenses and may harm our reputation if our regulatory services are deemed inadequate.
The regulatory framework under which we operate and new regulatory requirements or new interpretations of existing regulatory requirements could require substantial time and resources for compliance, which could make it difficult and costly for us to operate our business.
Under current U.S. federal securities laws, changes in the rules and operations of our securities markets, including our pricing structure, must be reviewed and in many cases explicitly approved by the SEC. The SEC may approve, disapprove, or recommend changes to proposals that we submit. In addition, the SEC may delay either the approval process or the initiation of the public comment process. Favorable SEC rulings and interpretations can be challenged in and reversed by federal courts of appeals, reducing or eliminating the value of such prior interpretations. Any delay in approving changes, or the altering of any proposed change, could have an adverse effect on our business, financial condition and operating results.
We must compete not only with ATSs that are not subject to the same SEC approval process but also with other exchanges that may have lower regulation and surveillance costs than us. There is a risk that trading will shift to exchanges that charge lower fees because, among other reasons, they spend significantly less on regulation.
In 2016, the SEC approved a plan for Nasdaq and other exchanges to establish a CAT, to improve regulators’ ability to monitor trading activity. In addition to increased regulatory obligations, implementation of a consolidated audit trail has resulted in significant additional expenditures, including to implement the new technology to meet any plan’s requirements. Creating CAT has required the development and implementation of complex and costly technology. This development effort has been funded by the SROs (including Nasdaq) in exchange for promissory notes that Nasdaq expects to be repaid at such time that the SEC approves the assessment of fees for the funding of CAT. The SEC could determine not to approve the assessment of such fees in which case some or all of the promissory notes would not be repaid. In addition, the ongoing failure to timely launch or properly operate such technology exposes Nasdaq and other exchanges to SEC fines.
In addition, our registered broker-dealer subsidiaries are subject to regulation by the SEC, FINRA and other SROs. These subsidiaries are subject to regulatory requirements intended to ensure their general financial soundness and liquidity, which require that they comply with certain minimum capital requirements. The SEC and FINRA impose rules that require notification when a broker-dealer’s net capital falls below certain predefined criteria, dictate the ratio
of debt to equity in the regulatory capital composition of a broker-dealer and constrain the ability of a broker-dealer to expand its business under certain circumstances. Additionally, the SEC’s Uniform Net Capital Rule and FINRA rules impose certain requirements that may have the effect of prohibiting a broker-dealer from distributing or withdrawing capital and requiring prior notice to the SEC and FINRA for certain withdrawals of capital. Any failure to comply with these broker-dealer regulations could have a material adverse effect on the operation of our business, financial condition and operating results.
Our non-U.S. business is subject to regulatory oversight in all the countries in which we operate regulated businesses, such as exchanges, clearinghouses or central securities depositories. In these countries, we have received authorization from the relevant authorities to conduct our regulated business activities. The authorities may issue regulatory fines or may ultimately revoke our authorizations if we do not suitably carry out our regulated business activities. The authorities are also entitled to request that we adopt measures in order to ensure that we continue to fulfill the authorities’ requirements. Additionally, we are subject to the obligations under the Benchmark Regulation ((EU) 2016/1011), compliance with which could be costly or cause a change in our business practices.
Furthermore, certain of our customers operate in a highly regulated industry. Regulatory authorities could impose regulatory changes that could impact the ability of our customers to use our exchanges. The loss of a significant number of customers or a reduction in trading activity on any of our exchanges as a result of such changes could have a material adverse effect on our business, financial condition and operating results.
Regulatory changes and changes in market structure and proprietary data could have a material adverse effect on our business.
Regulatory changes adopted by the SEC or other regulators of our markets, and regulatory changes that our markets may adopt in fulfillment of their regulatory obligations, could materially affect our business operations. In recent years, there has been increased regulatory and governmental focus on issues affecting the securities markets, including market structure, technological oversight and fees for proprietary market data, connectivity and transactions. The SEC, FINRA and the national securities exchanges have introduced several initiatives to ensure the oversight, integrity and resilience of markets.
With respect to our regulated businesses, our business model can be severely impacted by policy decisions. In May 2020, the SEC adopted a rule to require changes to the governance of securities information processors. In December 2020, the SEC adopted a rule to modify the infrastructure for the collection, consolidation and dissemination of market data for exchange-listed national market stocks. If either or both of these rules are fully implemented, they may adversely affect our revenues. The timing for the implementation of these
24

rules is currently unknown, and we believe they may take two to three years to fully implement. If the rules are ultimately implemented as set forth in their adopting releases, demand for certain of our proprietary tape share data products may be reduced, or we may have to reduce our pricing to compete with other entrants into the market for consolidated data. Our opponents in some markets are larger and better funded and, if successful in influencing certain policies, may successfully advocate for positions that adversely impact our business. These regulatory changes could impose significant costs, including litigation costs, and other obligations on the operation of our exchanges and processor systems and have other impacts on our business.
In Canada, all new marketplace fees and changes to existing fees, including trading and market data fees, must be filed with and approved by the Ontario Securities Commission. The Canadian Securities Administrators adopted a Data Fees Methodology that restricts the total amount of fees that can be charged by all marketplaces to a reference benchmark. Currently, all marketplaces are subject to annual reviews of their market data fees tying market data revenues to pre- and post- trade market share metrics. Permitted fee ranges are based on an interim domestic benchmark that is subject to change to an international benchmark, which could lower the permitted fees charged by marketplaces, which could adversely impact our revenues.
Our European exchanges currently offer market data products to customers on a non-discriminatory and reasonable commercial basis. The MiFID II/MiFIR rules entail that the price for regulated market data such as pre- and post-trade data shall be based on cost plus a reasonable margin. However, these terms are not clearly defined. There is a risk that a different interpretation of these terms may influence the fees for European market data products adversely. In addition, any future actions by European Union institutions could affect our ability to offer market data products in the same manner as today, thereby causing an adverse effect on our market data revenues.
We are subject to litigation risks and other liabilities.
Many aspects of our business potentially involve substantial liability risks. Although under current law we are immune from private suits arising from conduct within our regulatory authority and from acts and forbearances incident to the exercise of our regulatory authority, this immunity only covers certain of our activities in the U.S., and we could be exposed to liability under national and local laws, court decisions and rules and regulations promulgated by regulatory agencies.
Some of our other liability risks arise under the laws and regulations relating to the tax, employment, intellectual property, anti-money laundering, technology export, foreign asset controls, foreign corrupt practices, employee labor and employment areas, including anti-discrimination and fair-pay laws and regulations.
Liability could also result from disputes over the terms of a trade, claims that a system failure or delay cost a customer money, claims we entered into an unauthorized transaction or claims that we provided materially false or misleading statements in connection with a securities transaction. As we intend to defend any such litigation actively, significant legal expenses could be incurred. Although we carry insurance that may limit our risk of damages in some cases, we still may sustain uncovered losses or losses in excess of available insurance that would affect our financial condition and results of operations.
We have self-regulatory obligations and also operate for-profit businesses, and these two roles may create conflicts of interest.
We have obligations to regulate and monitor activities on our markets and ensure compliance with applicable law and the rules of our markets by market participants and listed companies. In the U.S., some have expressed concern about potential conflicts of interest of “for-profit” markets performing the regulatory functions of an SRO. We perform regulatory functions and bear regulatory responsibility related to our listed companies and our markets. Any failure by us to diligently and fairly regulate our markets or to otherwise fulfill our regulatory obligations could significantly harm our reputation, prompt SEC scrutiny and adversely affect our business and reputation.
Our Nordic and Baltic exchanges monitor trading and compliance with listing standards in accordance with the European Union’s Market Abuse Regulation and other applicable laws. The prime objective of such monitoring activities is to promote confidence in the exchanges among the general public and to ensure fair and orderly functioning markets. The monitoring functions within the Nasdaq Nordic and Nasdaq Baltic exchanges are the responsibility of the surveillance departments or other surveillance personnel. The surveillance departments or personnel are intended to strengthen the integrity of and confidence in these exchanges and to avoid conflicts of interest. Any failure to diligently and fairly regulate the Nordic and Baltic exchanges could significantly harm our reputation, prompt scrutiny from regulators and adversely affect our business and reputation.
Laws and regulations regarding the handling of personal data and information may affect our services or result in increased costs, legal claims or fines against us.
Our business relies on the processing of data in many jurisdictions and the movement of data, including personal data, across national borders. Legal and contractual requirements relating to the collection, storage, handling, use, disclosure, transfer and security of personal data continue to evolve; regulatory scrutiny and customer requirements in this area are increasing around the world. Significant uncertainty exists as privacy and data protection laws may be interpreted and applied differently across jurisdictions and may create inconsistent or conflicting requirements with privacy and other laws to which we are subject.
25

Laws and regulations such as the European Union General Data Protection Regulation, or GDPR, and the California Consumer Privacy Act, or CCPA, can have application and effect beyond their territorial limits, and require companies to meet new requirements regarding the handling of personal data. In addition to directly applying to certain Nasdaq business activities, these laws impact many of our customers, which may affect their requirements and decisions related to services that we offer. Our efforts to comply with GDPR, CCPA and other privacy and data protection laws may entail substantial expenses, may divert resources from other initiatives and projects, and could impact the services that we offer. Furthermore, enforcement actions and investigations by regulatory authorities, as well as third party litigation, related to data security incidents and privacy violations continue to increase. The enactment of more restrictive laws, rules or regulations, future enforcement actions or investigations, or the creation of new rights to pursue damages could impact us through increased costs or restrictions on our business, and noncompliance could result in regulatory penalties and significant legal liability.
Changes in tax laws, regulations or policies could have a material adverse effect on our financial results.
Like other corporations, we are subject to taxes at the federal, state and local levels, as well as in non-U.S. jurisdictions. Changes in tax laws, regulations or policies could result in us having to pay higher taxes, which may reduce our net income, or could adversely affect our ability to continue our capital allocation program or effect strategic transactions in a tax-favorable manner. In addition, such changes, including federal or state financial transaction taxes, may increase the cost of our offerings or services, which may cause our clients to reduce their use of our services.
In addition, some of our subsidiaries are subject to tax in the jurisdictions in which they are organized or operate. In computing our tax obligation in these jurisdictions, we take various tax positions. We cannot ensure that upon review of these positions, the applicable authorities will agree with our positions. A successful challenge by a tax authority could result in additional taxes imposed on our clients or our subsidiaries.
RISKS RELATED TO LIQUIDITY AND CAPITAL RESOURCES
Our credit rating could increase the cost of our funding from the capital markets.
Our debt is currently rated investment grade by two of the major rating agencies. These rating agencies regularly evaluate us, and their ratings of our long-term debt and commercial paper are based on a number of factors, including our financial strength and corporate development activity, as well as factors not entirely within our control, including conditions affecting our industry generally. There can be no assurance that we will maintain our current ratings. Our failure to maintain such ratings could reduce or eliminate our ability to issue commercial paper and adversely affect the
cost and other terms upon which we are able to obtain funding and increase our cost of capital. A reduction in credit ratings would also result in increases in the cost of our commercial paper and other outstanding debt as the interest rate on the outstanding amounts under our credit facilities and our senior notes fluctuates based on our credit ratings.
Our leverage limits our financial flexibility, increases our exposure to weakening economic conditions and may adversely affect our ability to obtain additional financing.
Our indebtedness as of December 31, 2020 was $5.5 billion. We may borrow additional amounts by utilizing available liquidity under our existing credit facilities, issuing additional debt securities or issuing short-term, unsecured commercial paper notes through our commercial paper program.
Our leverage could:
• reduce funds available to us for operations and general corporate purposes or for capital expenditures as a result of the dedication of a substantial portion of our consolidated cash flow from operations to the payment of principal and interest on our indebtedness;
• increase our exposure to a continued downturn in general economic conditions;
• place us at a competitive disadvantage compared with our competitors with less debt;
• affect our ability to obtain additional financing in the future for refinancing indebtedness, acquisitions, working capital, capital expenditures or other purposes; and
• increase our cost of debt and reduce or eliminate our ability to issue commercial paper.
In addition, we must comply with the covenants in our credit facilities. Among other things, these covenants restrict our ability to effect certain fundamental transactions, dispose of certain assets, incur additional indebtedness and grant liens on assets. Failure to meet any of the covenant terms of our credit facilities could result in an event of default. If an event of default occurs, and we are unable to receive a waiver of default, our lenders may increase our borrowing costs, restrict our ability to obtain additional borrowings and accelerate all amounts outstanding.
We will need to invest in our operations to maintain and grow our business and to integrate acquisitions, and we may need additional funds, which may not be readily available.
We depend on the availability of adequate capital to maintain and develop our business. Although we believe that we can meet our current capital requirements from internally generated funds, cash on hand and borrowings under our revolving credit facility and commercial paper program, if the capital and credit markets experience volatility, access to capital or credit may not be available on terms acceptable to us or at all. Limited access to capital or credit in the future could have an impact on our ability to refinance debt,
26

maintain our credit rating, meet our regulatory capital requirements, engage in strategic initiatives, make acquisitions or strategic investments in other companies, pay dividends, repurchase our stock or react to changing economic and business conditions. If we are unable to fund our capital or credit requirements, it could have an adverse effect on our business, financial condition and operating results.
In addition to our debt obligations, we will need to continue to invest in our operations for the foreseeable future to integrate acquired businesses and to fund new initiatives. If we do not achieve the expected operating results, we will need to reallocate our cash resources. This may include borrowing additional funds to service debt payments, which may impair our ability to make investments in our business or to integrate acquired businesses.
Should we need to raise funds through issuing additional equity, our equity holders will suffer dilution. Should we need to raise funds through incurring additional debt, we may become subject to covenants more restrictive than those contained in our credit facilities, the indentures governing our notes and our other debt instruments. Furthermore, if adverse economic conditions occur, we could experience decreased revenues from our operations which could affect our ability to satisfy financial and other restrictive covenants to which we are subject under our existing indebtedness.
RISKS RELATED TO INTELLECTUAL PROPERTY AND BRAND REPUTATION
Damage to our reputation or brand name could have a material adverse effect on our businesses.
One of our competitive strengths is our strong reputation and brand name. Various issues may give rise to reputational risk, including issues relating to:
• our ability to maintain the security of our data and systems;
• the quality and reliability of our technology platforms and systems;
• the ability to fulfill our regulatory obligations;
• the ability to execute our business plan, key initiatives or new business ventures and the ability to keep up with changing customer demand;
• the representation of our business in the media;
• the accuracy of our financial statements and other financial and statistical information;
• the accuracy of our financial guidance or other information provided to our investors;
• the quality of our corporate governance structure;
• the quality of our products, including the reliability of our transaction-based, IR & ESG Services and market technology products, the accuracy of the quote and trade information provided by our Market Data business and
the accuracy of calculations used by our Indexes business for indexes and unit investment trusts;
• the quality of our disclosure controls or internal controls over financial reporting, including any failures in supervision;
• extreme price volatility on our markets;
• any negative publicity surrounding our listed companies;
• any negative publicity surrounding the use of our products and/or services by our customers, including in connection with emerging asset classes such as crypto assets; and
• any misconduct, fraudulent activity or theft by our employees or other persons formerly or currently associated with us.
Damage to our reputation could cause some issuers not to list their securities on our exchanges, as well as reduce the trading volumes or values on our exchanges or cause us to lose customers in our Market Data, Index, IR & ESG Services or Market Technology businesses. This, in turn, may have a material adverse effect on our business, financial condition and operating results.
Failure to meet customer expectations or deadlines for the implementation of our products could result in negative publicity, losses and reduced sales, each of which may harm our reputation, business and results of operations.
We generally mutually agree with our customers on the duration, budget and costs associated with the implementation of certain of our products, particularly our Market Technology large-scale market infrastructure projects. Various factors may cause implementations to be delayed, inefficient or otherwise unsuccessful, including due to unforeseen project complexities, our deployment of insufficient resources, logistical challenges due to the effects of COVID-19 or other external factors. The effects of a failure to meet an implementation schedule could include monetary credits for current or future service engagements, a reduction in fees for the project, or the expenditure of additional expenses to mitigate such delays. In addition, time-consuming implementations may also increase the personnel we must allocate to such customer, thereby increasing our costs and diverting attention from other projects. Unsuccessful, lengthy, or costly customer implementation projects could result in claims from customers, decreased customer satisfaction, harm to our reputation, and opportunities for competitors to displace us, each of which could have an adverse effect on our reputation, business and results of operations.
Failure to protect our intellectual property rights, or allegations that we have infringed on the intellectual property rights of others, could harm our brand-building efforts and ability to compete effectively.
To protect our intellectual property rights, we rely on a combination of trademark laws, copyright laws, patent laws,
27
trade secret protection, confidentiality agreements and other contractual arrangements with our affiliates, clients, strategic partners, employees and others. However, the efforts we have taken to protect our intellectual property and proprietary rights might not be sufficient, or effective, at stopping unauthorized use of those rights. We may be unable to detect the unauthorized use of, or take appropriate steps to enforce, our intellectual property rights.
We have registered, or applied to register, our trademarks in the United States and in over 50 foreign jurisdictions and have pending U.S. and foreign applications for other trademarks. We also maintain copyright protection for software products and pursue patent protection for inventions developed by us. We hold a number of patents, patent applications and licenses in the United States and other foreign jurisdictions. However, effective trademark, copyright, patent and trade secret protection might not be available or cost-effective in every country in which our services and products are offered. Moreover, changes in patent law, such as changes in the law regarding patentable subject matter, could also impact our ability to obtain patent protection for our innovations. There is also a risk that the scope of protection under our patents may not be sufficient in some cases, or that existing patents may be deemed invalid or unenforceable. Failure to protect our intellectual property adequately could harm our brand and affect our ability to compete effectively. Further, defending our intellectual property rights could result in the expenditure of significant financial and managerial resources.
Third parties may assert intellectual property rights claims against us, which may be costly to defend, could require the payment of damages and could limit our ability to use certain technologies, trademarks or other intellectual property. Any intellectual property claims, with or without merit, could be expensive to litigate or settle and could divert management resources and attention. Successful challenges against us could require us to modify or discontinue our use of technology or business processes where such use is found to infringe or violate the rights of others, or require us to purchase licenses from third parties, any of which could adversely affect our business, financial condition and operating results.
GENERAL RISK FACTORS
We are a holding company that depends on cash flow from our subsidiaries to meet our obligations, and any restrictions on our subsidiaries’ ability to pay dividends or make other payments to us may have a material adverse effect on our results of operations and financial condition.
As a holding company, we require dividends and other payments from our subsidiaries to meet cash requirements. Minimum capital requirements mandated by regulatory authorities having jurisdiction over some of our regulated subsidiaries indirectly restrict the amount of dividends paid upstream.
In addition, unremitted earnings of certain subsidiaries outside of the U.S. are used to finance our international operations and are considered to be indefinitely reinvested.
If our subsidiaries are unable to pay dividends and make other payments to us when needed, we may be unable to satisfy our obligations, which would have a material adverse effect on our business, financial condition and operating results.
We may experience fluctuations in our operating results, which may adversely affect the market price of our common stock.
Our industry is risky and unpredictable and is directly affected by many national and international factors beyond our control, including:
• economic, political and geopolitical market conditions;
• natural disasters, terrorism, pandemics, war or other catastrophes;
• broad trends in finance and technology;
• changes in price levels and volatility in the stock markets;
• the level and volatility of interest rates;
• changes in government monetary or tax policy;
• the perceived attractiveness of the U.S. or European capital markets; and
• inflation.
Any one of these factors could have a material adverse effect on our business, financial condition and operating results by causing a substantial decline in the financial services markets and reducing trading volumes or values.
Additionally, since borrowings under our credit facilities bear interest at variable rates and commercial paper is issued at prevailing interest rates, any increase in interest rates on debt that we have not fixed using interest rate hedges will increase our interest expense, reduce our cash flow or increase the cost of future borrowings or refinancings. Other than variable rate debt, we believe our business has relatively large fixed costs and low variable costs, which magnifies the impact of revenue fluctuations on our operating results. As a result, a decline in our revenue may lead to a relatively larger impact on operating results. A substantial portion of our operating expenses is related to personnel costs, regulation and corporate overhead, none of which can be adjusted quickly and some of which cannot be adjusted at all. Our operating expense levels are based on our expectations for future revenue. If actual revenue is below management’s expectations, or if our expenses increase before revenues do, both revenues less transaction-based expenses and operating results would be materially and adversely affected. Because of these factors, it is possible that our operating results or other operating metrics may fail to meet the expectations of stock market analysts and investors. If this happens, the market price of our common stock may be adversely affected.
28

We rely on third parties to perform certain functions, and our business could be adversely affected if these third parties fail to perform as expected.
We rely on third parties for regulatory, data center, cloud, data storage, data content, clearing and other services. Interruptions or delays in services from our third-party data center hosting facilities or cloud computing platform providers could impair the delivery of our services and harm our business. To the extent that any of our vendors or other third-party service providers experiences difficulties, materially changes their business relationship with us or is unable for any reason to perform their obligations, our business or our reputation may be materially adversely affected.
We also rely on members of our trading community to maintain markets and add liquidity. To the extent that any of our largest members experiences difficulties, materially changes its business relationship with us or is unable for any reason to perform market making activities, our business or our reputation may be materially adversely affected.
Our operational processes are subject to the risk of error, which may result in financial loss or reputational damage.
We have instituted extensive controls to reduce the risk of error inherent in our operations; however, such risk cannot completely be eliminated. Our businesses are highly dependent on our ability to process and report, on a daily basis, a large number of transactions across numerous and diverse markets. Some of our operations require complex processes, and the introduction of new products or services or changes in processes or reporting due to regulatory requirements may result in an increased risk of errors for a period after implementation. Additionally, the likelihood of such errors or vulnerabilities is heightened as we acquire new products from third parties, whether as a result of acquisitions or otherwise.
Data, other content or information that we distribute may contain errors or be delayed, causing reputational harm. Use of our products and services as part of the investment process creates the risk that clients, or the parties whose assets are managed by our clients, may pursue claims against us in the event of such delay or error. Even with a favorable outcome, significant litigation against us might unduly burden management, personnel, financial and other resources.
In addition, the sophisticated software we sell to our customers may contain undetected errors or vulnerabilities, some of which may be discovered only after delivery, or could fail to perform its intended purpose. Because our clients depend on our solutions for critical business functions, any service interruptions, failures or other issues may result in lost or delayed market acceptance and lost sales, or negative customer experiences that could damage our reputation, resulting in the loss of customers, loss of revenues and liability for damages, which may adversely affect our business and financial results.
Climate change may have a long-term adverse impact on our business.
While we seek to mitigate our business risks associated with climate change by establishing robust environmental and sustainability programs, there are inherent climate related risks wherever our business is conducted. There is an increased focus from our investors, clients, employees, and other stakeholders concerning corporate citizenship and sustainability matters. Access to clean water and reliable energy in the communities where we conduct our business, whether for our offices, data centers, vendors, clients or other stakeholders, is a priority. For example, changes in weather where we operate may increase the costs of powering and cooling our data centers or the facilities that we use to operate our exchanges and clearinghouses, develop our products or provide cloud-based services. Climate related events, including extreme weather events and their impact on the critical infrastructure in the United States and elsewhere, have the potential to disrupt our business or the business of our clients; cause increased volatility in commodity markets in which Nasdaq Clearing operates as a clearinghouse, which may result in Nasdaq Clearing holding insufficient collateral for such volatility; and create adverse market conditions, including trading volatility beyond historical levels, any of which could adversely affect our business, reputation, financial condition and operating results.
Failure to attract and retain key personnel may adversely affect our ability to conduct our business.
Our future success depends, in large part, upon our ability to attract and retain highly qualified and skilled professional personnel that can learn and embrace new technologies. Competition for key personnel in the various localities and business segments in which we operate is intense. Our ability to attract and retain key personnel, in particular senior officers or technology personnel, will be dependent on a number of factors, including prevailing market conditions, office/remote working arrangements and compensation packages offered by companies competing for the same talent. There is no guarantee that we will have the continued service of key employees who we rely upon to execute our business strategy and identify and pursue strategic opportunities and initiatives. In particular, we may have to incur costs to replace senior officers or other key employees who leave, and our ability to execute our business strategy could be impaired if we are unable to replace such persons in a timely manner.
Our non-U.S. business operates in various international markets, particularly emerging markets that are subject to greater political, economic and social uncertainties than developed countries.
Our non-U.S. business operates in various international markets, including but not limited to Northern Europe, the Baltics, the Middle East, Africa and Asia. Therefore, our non-U.S. operations are subject to the risk inherent in the international environment. Political, economic or social events or developments in one or more of our non-U.S.
29

locations could adversely affect our operations and financial results. Some locations, such as Lithuania, India and the Philippines, have economies that may be subject to greater political, economic and social uncertainties than countries with more developed institutional structures, which may increase our operational risk.
Unforeseen or catastrophic events could interrupt our critical business functions. In addition, our U.S. and European businesses are heavily concentrated in particular areas and may be adversely affected by events in those areas.
We may incur losses as a result of unforeseen or catastrophic events, such as terrorist attacks, natural disasters, pandemics (such as COVID-19), extreme weather, fire, power loss, telecommunications failures, human error, theft, sabotage and vandalism. Given our position in the global capital markets, we may be more likely than other companies to be a target for malicious disruption activities.
In addition, our U.S. and European business operations are heavily concentrated in the U.S. East Coast, and Stockholm, Sweden, respectively. Any event that impacts either of those geographic areas could potentially affect our ability to operate our businesses.
We have disaster recovery and business continuity plans and capabilities for critical systems and business functions to mitigate the risk of an interruption. Any interruption in our critical business functions or systems could negatively impact our financial condition and operating results. Additionally, some colocation customers may lack adequate disaster recovery solutions to avoid loss of trade flow from a sustained interruption of our critical systems.
Because we have operations in numerous countries, we are exposed to currency risk.
We have operations in the U.S., the Nordic and Baltic countries, the United Kingdom, Australia and many other foreign countries. We therefore have significant exposure to exchange rate movements between the Euro, Swedish Krona and other foreign currencies towards the U.S. dollar. Significant inflation or disproportionate changes in foreign exchange rates with respect to one or more of these currencies could occur as a result of general economic conditions, acts of war or terrorism, changes in governmental monetary or tax policy, changes in local interest rates or other factors. These exchange rate differences will affect the translation of our non-U.S. results of operations, interest expense and financial condition into U.S. dollars as part of the preparation of our consolidated financial statements.
If our risk management methods are not effective, our business, reputation and financial results may be adversely affected.
We utilize widely-accepted methods to identify, assess, monitor and manage our risks, including oversight of risk management, by Nasdaq’s Global Risk Management Committee, which is comprised of senior executives and has
the responsibility for regularly reviewing risks and referring significant risks to the board of directors or specific board committees. Local risk management committees in our international offices provide local risk oversight and escalation to local boards, as appropriate. Certain risk management methods require subjective evaluation of dynamic information regarding markets, customers or other matters. That variable information may not in all cases be accurate, complete, up-to-date or properly evaluated. If we do not successfully identify, assess, monitor or manage the risks to which we are exposed, our business, reputation, financial condition and operating results could be materially adversely affected.
Decisions to declare future dividends on our common stock will be at the discretion of our board of directors based upon a review of relevant considerations. Accordingly, there can be no guarantee that we will pay future dividends to our stockholders.
Our board of directors regularly declares quarterly cash dividend payments on our outstanding common stock. Future declarations of quarterly dividends and the establishment of future record and payment dates are subject to approval by Nasdaq’s board of directors. The board’s determination to declare dividends will depend upon our profitability and financial condition, contractual restrictions, restrictions imposed by applicable law and other factors that the board deems relevant. Based on an evaluation of these factors, the board of directors may determine not to declare future dividends at all or to declare future dividends at a reduced amount. Accordingly, there can be no guarantee that we will pay future dividends to our stockholders.
Provisions of our certificate of incorporation, by-laws, exchange rules (including provisions included to address SEC concerns) and governing law restrict the ownership and voting of our common stock. In addition, such provisions could delay or prevent a change in control of us and entrench current management.
Our organizational documents place restrictions on the voting rights of certain stockholders. The holders of our common stock are entitled to one vote per share on all matters to be voted upon by the stockholders except that no person may exercise voting rights in respect of any shares in excess of 5% of the then outstanding shares of our common stock. Any change to the 5% voting limitation would require SEC approval.
In response to the SEC’s concern about a concentration of our ownership, the rules of some of our exchange subsidiaries include a prohibition on any member or any person associated with a member of the exchange from beneficially owning more than 20% of our outstanding voting interests. SEC consent would be required before any investor could obtain more than a 20% voting interest in us. The rules of some of our exchange subsidiaries also require the SEC’s approval of any business ventures with exchange members, subject to exceptions.
30

Our organizational documents contain provisions that may be deemed to have an anti-takeover effect and may delay, deter or prevent a change of control of us, such as a tender offer or takeover proposal that might result in a premium over the market price for our common stock. Additionally, certain of these provisions make it more difficult to bring about a change in the composition of our board of directors, which could result in entrenchment of current management.
Our certificate of incorporation and by-laws:
• do not permit stockholders to act by written consent;
• require certain advance notice for director nominations and actions to be taken at annual meetings; and
• authorize the issuance of undesignated preferred stock, or “blank check” preferred stock, which could be issued by our board of directors without stockholder approval.
Section 203 of the Delaware General Corporation Law imposes restrictions on mergers and other business combinations between us and any holder of 15% or more (or, in some cases, a holder who previously held 15% or more) of our common stock. In general, Delaware law prohibits a publicly held corporation from engaging in a “business combination” with an “interested stockholder” for three years after the stockholder becomes an interested stockholder, unless the corporation’s board of directors and stockholders approve the business combination in a prescribed manner.
Finally, many of the European countries where we operate regulated entities require prior governmental approval before an investor acquires 10% or greater of our common stock.
Item 1B. Unresolved Staff Comments
None.
Item 2. Properties
We conduct our business operations in leased facilities. We do not own any real property. Our U.S. headquarters are located in New York, New York, and our European
headquarters are located in Stockholm, Sweden. We also lease space in multiple locations around the world, which are used for research and development, sales and support, and administrative activities, as well as for data centers and disaster preparedness facilities.
Generally, our properties are not allocated for use by a particular segment. Instead, most of our properties are used by two or more segments. We believe the facilities that we occupy are adequate for the purposes for which they are currently used and are well-maintained.
Item 3. Legal Proceedings
See “Legal and Regulatory Matters - Litigation,” of Note 18, “Commitments, Contingencies and Guarantees,” to the consolidated financial statements, which is incorporated herein by reference.
Item 4. Mine Safety Disclosures
Not applicable.
PART II
Item 5. Market for Registrant's Common Equity, Related Stockholder Matters and Issuer Purchases of Equity Securities
Market Information
Our common stock is listed on The Nasdaq Stock Market under the ticker symbol “NDAQ.” As of February 11, 2021, we had approximately 229 holders of record of our common stock.
Issuer Purchases of Equity Securities
Share Repurchase Program
See “Share Repurchase Program,” of Note 12, “Nasdaq Stockholders’ Equity,” to the consolidated financial statements for further discussion of our share repurchase program.
31

Purchases of Equity Securities by the Issuer and Affiliated Purchasers
The table below represents repurchases made by or on behalf of us or any “affiliated purchaser” of our common stock during the fiscal quarter ended December 31, 2020:
Period(a) Total Number of Shares Purchased
(b) Average Price Paid Per Share
(c) Total Number of Shares Purchased as Part
of Publicly Announced Plans or Programs
(d) Maximum Dollar Value of Shares that
May Yet Be Purchased Under the Plans or
Programs (in millions)
October 2020 Share repurchase program(1) — $ — — $ 446 Employee transactions(2) 12,466 $ 127.08 N/A N/A
November 2020 Share repurchase program(1) 77,364 $ 126.70 77,364 $ 436 Employee transactions(2) 55 $ 133.20 N/A N/A
December 2020 Share repurchase program(1) 203,617 $ 127.16 203,617 $ 410 Employee transactions(2) 55,205 $ 133.72 N/A N/A
Total Quarter Ended December 31, 2020 Share repurchase program 280,981 $ 127.04 280,981 $ 410 Employee transactions 67,726 $ 132.49 N/A N/A
____________N/A Not applicable.(1) See “Share Repurchase Program,” of Note 12, “Nasdaq Stockholders’ Equity,” to the consolidated financial statements for
further discussion of our share repurchase program. (2) Represents shares surrendered to us to satisfy tax withholding obligations arising from the vesting of restricted stock and
PSUs issued to employees.
32

PERFORMANCE GRAPHThe following graph compares the total return of our common stock to the Nasdaq Composite Index, the S&P 500 and a peer group selected by us, shown below, for the past five years:
Peer Group• ASX Limited • Deutsche Börse AG • LSE • B3 S.A. • Euronext N.V. • Singapore Exchange Limited• Bolsas Mexicana de Valores, S.A.B.
de C.V.• Hong Kong Exchanges and Clearing
Limited• TMX Group Limited
• Cboe • ICE• CME Group Inc. • Japan Exchange Group, Inc
The figures represented below assume an initial investment of $100 in the common stock or index at the closing price on December 31, 2015 and the reinvestment of all dividends.
COMPARISON OF 5 YEAR CUMULATIVE TOTAL RETURN*Among Nasdaq, Inc., the Nasdaq Composite Index, the S&P 500, and a Peer Group
Period Ended
Nasdaq, Inc. Nasdaq Composite IndexS&P 500 Peer Group
2015 2016 2017 2018 2019 2020$50
$100
$150
$200
$250
$300
* $100 invested on 12/31/2015 in stock or index, including reinvestment of dividends.
Fiscal Year Ended December 31,2015 2016 2017 2018 2019 2020
Nasdaq, Inc. $ 100 $ 117 $ 137 $ 148 $ 199 $ 251 Nasdaq Composite Index 100 109 141 137 187 272 S&P 500 100 112 136 130 171 203 Peer Group 100 110 148 159 204 244
Copyright© 2020 Standard & Poor's, a division of S&P Global. All rights reserved.
33
Item 6. Selected Financial Data
As a result of our early adoption, in December 2020, of SEC Final Rule Release No. 33-10890, “Management's Discussion and Analysis, Selected Financial Data, and Supplementary Financial Information,” this item has been omitted.
Item 7. Management’s Discussion and Analysis of Financial Condition and Results of Operations
The following discussion and analysis of the financial condition and results of operations of Nasdaq should be read in conjunction with our consolidated financial statements and related notes included in this Form 10-K, as well as the discussion under “Item 1A. Risk Factors.” For further discussion of our growth strategy, products and services, and competitive strengths, see “Item 1. Business.” Unless stated otherwise, the comparisons presented in this discussion and analysis refer to the year-over-year comparison of changes in our financial condition and results of operations as of and for the fiscal years ended December 31, 2020 and December 31, 2019. Discussion of fiscal year 2018 items and the year-over year comparison of changes in our financial condition and results of operations as of and for the fiscal years ended December 31, 2019 and December 31, 2018 can be found in Part II, “Item 7. Management’s Discussion and Analysis of Financial Condition and Results of Operations” of our Annual Report on Form 10-K for the fiscal year ended December 31, 2019, which was previously filed with the SEC on February 25, 2020.
Business Segments
We manage, operate and provide our products and services in four business segments: Market Services, Corporate Platforms, Investment Intelligence and Market Technology. See Note 1, “Organization and Nature of Operations,” and Note 19, “Business Segments,” to the consolidated financial statements for further discussion of our reportable segments and geographic data, as well as how management allocates resources, assesses performance and manages these businesses as four separate segments.
Impact of COVID-19 on Our Business
For a discussion of the impact of COVID-19 on our business, see “Item 1A. Risk Factors - Risks Related To Our Business and Industry - The COVID-19 pandemic could have an adverse effect on our business, financial condition, liquidity or results of operations,” and “Liquidity and Capital Resources.”
Sources of Revenues and Transaction-Based Expenses
See “Revenue Recognition and Transaction-Based Expenses,” of Note 2, “Summary of Significant Accounting Policies,” to the consolidated financial statements for further discussion of our sources of revenues and transaction-based expenses.
34

Nasdaq’s Operating ResultsKey Drivers The following table and charts include key drivers and other metrics for our Market Services, Corporate Platforms, Investment Intelligence and Market Technology segments. In evaluating the performance of our business, our senior management closely evaluates these key drivers.
Year Ended December 31, 2020 2019 2018Market Services Equity Derivative Trading and Clearing U.S. equity options Total industry average daily volume (in millions) 27.7 17.5 18.2 Nasdaq PHLX matched market share 12.7% 15.9% 15.7% The Nasdaq Options Market matched market share 9.8% 8.8% 9.4% Nasdaq BX Options matched market share 0.2% 0.2% 0.4% Nasdaq ISE Options matched market share 7.8% 9.0% 8.8% Nasdaq GEMX Options matched market share 5.6% 4.2% 4.5% Nasdaq MRX Options matched market share 0.7% 0.2% 0.1% Total matched market share executed on Nasdaq’s exchanges 36.8% 38.3% 38.9% Nasdaq Nordic and Nasdaq Baltic options and futures Total average daily volume of options and futures contracts(1) 320,204 366,289 339,139 Cash Equity Trading Total U.S.-listed securities Total industry average daily share volume (in billions) 10.9 7.0 7.3 Matched share volume (in billions) 508.3 348.1 358.5 The Nasdaq Stock Market matched market share 16.8% 17.2% 15.9% Nasdaq BX matched market share 0.9% 1.7% 2.8% Nasdaq PSX matched market share 0.6% 0.7% 0.8% Total matched market share executed on Nasdaq’s exchanges 18.3% 19.6% 19.5% Market share reported to the FINRA/Nasdaq Trade Reporting Facility 31.8% 29.8% 31.3% Total market share(2) 50.1% 49.4% 50.8% Nasdaq Nordic and Nasdaq Baltic securities Average daily number of equity trades executed on Nasdaq’s exchanges 933,822 590,705 618,579 Total average daily value of shares traded (in billions) $ 5.6 $ 4.5 $ 5.6 Total market share executed on Nasdaq’s exchanges 78.1% 72.8% 68.8% FICC Fixed Income U.S. fixed income volume ($ billions traded) $ 6,169 $ 10,465 $ 15,983 Total average daily volume of Nasdaq Nordic and Nasdaq Baltic fixed income
contracts 103,379 112,738 132,475 Commodities Power contracts cleared (TWh)(3) 956 842 1,067 Corporate Platforms IPOs
The Nasdaq Stock Market 316 188 186 Exchanges that comprise Nasdaq Nordic and Nasdaq Baltic 45 34 53
Total new listings The Nasdaq Stock Market(4) 454 313 303 Exchanges that comprise Nasdaq Nordic and Nasdaq Baltic(5) 67 53 72
Number of listed companies The Nasdaq Stock Market(6) 3,392 3,140 3,058 Exchanges that comprise Nasdaq Nordic and Nasdaq Baltic(7) 1,071 1,040 1,019
Investment Intelligence Number of licensed ETPs 339 332 365 ETP AUM tracking Nasdaq indexes (in billions) $ 359 $ 233 $ 172 Market Technology Order intake (in millions)(8) $ 240 $ 366 $ 223 Annualized recurring revenue, or ARR (in millions)(9) $ 283 $ 260 $ 222
35

____________(1) Includes Finnish option contracts traded on Eurex for which Nasdaq and Eurex have a revenue sharing arrangement.(2) Includes transactions executed on The Nasdaq Stock Market’s, Nasdaq BX’s and Nasdaq PSX’s systems plus trades
reported through the FINRA/Nasdaq Trade Reporting Facility.(3) Transactions executed on Nasdaq Commodities or OTC and reported for clearing to Nasdaq Commodities measured by
Terawatt hours (TWh).(4) New listings include IPOs, including issuers that switched from other listing venues, closed-end funds and separately listed
ETPs. (5) New listings include IPOs and represent companies listed on the Nasdaq Nordic and Nasdaq Baltic exchanges and
companies on the alternative markets of Nasdaq First North.(6) Number of total listings on The Nasdaq Stock Market at period end, including 412 ETPs as of December 31, 2020, 412 as
of December 31, 2019 and 392 as of December 31, 2018.(7) Represents companies listed on the Nasdaq Nordic and Nasdaq Baltic exchanges and companies on the alternative markets
of Nasdaq First North.(8) Total contract value of orders signed during the period.(9) ARR for a given period is the annualized revenue of active Market Technology support and SaaS subscription contracts.
ARR is currently one of our key performance metrics to assess the health and trajectory of our recurring business. ARR does not have any standardized definition and is therefore unlikely to be comparable to similarly titled measures presented by other companies. ARR should be viewed independently of revenue and deferred revenue and is not intended to be combined with or to replace either of those items. ARR is not a forecast and the active contracts at the end of a reporting period used in calculating ARR may or may not be extended or renewed by our customers.
The following chart summarizes our annualized recurring revenue, or ARR (in millions):
$1,359$1,359$1,446$1,446
$1,577$1,577
$284 $284 $308
$420 $430 $470
$433 $472$516
$222$260
$283
Market Services Corporate Platforms Investment Intelligence Market Technology
4Q18 4Q19 4Q20
ARR for a given period is the annualized revenue derived from subscription contracts with a defined contract value. This excludes contracts that are not recurring, are one-time in nature, or where the contract value fluctuates based on defined metrics. ARR is currently one of our key performance metrics to assess the health and trajectory of our recurring business. ARR does not have any standardized definition and is therefore unlikely to be comparable to similarly titled measures presented by other companies. ARR should be viewed independently of revenue and deferred revenue and is not intended to be combined with or to replace either of those items. ARR is not a forecast and the active contracts at the end of a reporting period used in calculating ARR may or may not be extended or renewed by our customers.
36

____________Includes:◦ Trade Management Services business, excluding one-time service requests.◦ U.S. and Nordic annual listing fees, IR and ESG products, including subscription contracts for IR Insight, Boardvantage
and OneReport, and IR advisory services. ◦ Proprietary market data and index data subscriptions as well as subscription contracts for eVestment, Solovis, DWA tools
and services, Nasdaq Fund Network and Quandl. Also includes guaranteed minimum on futures contracts within the Index business.
◦ Active Market Technology support and SaaS subscription contracts.
The following chart summarizes our SaaS revenues for the years ended December 31, 2018, 2019 and 2020 (in millions):
$382$382$411$411
$456$456
$136 $136 $144
$144 $164$184
$102$111
$128
Corporate Platforms Investment Intelligence Market Technology
2018 2019 2020
Financial Summary
The following table summarizes our financial performance for the year ended December 31, 2020 when compared to the same period in 2019 and for the year ended December 31, 2019 when compared with the same period in 2018. For a detailed discussion of our results of operations, see “Segment Operating Results” below. Year End December 31, Percentage Change
2020 2019 2018 2020 vs. 2019 2019 vs. 2018 (in millions, except per share amounts) Revenues less transaction-based expenses $ 2,903 $ 2,535 $ 2,526 14.5 % 0.4 %Operating expenses $ 1,669 $ 1,518 $ 1,498 9.9 % 1.3 %Operating income $ 1,234 $ 1,017 $ 1,028 21.3 % (1.1) %Net income attributable to Nasdaq $ 933 $ 774 $ 458 20.5 % 69.0 %Diluted earnings per share $ 5.59 $ 4.63 $ 2.73 20.7 % 69.6 %Cash dividends declared per common share $ 1.94 $ 1.85 $ 1.70 4.9 % 8.8 %
In countries with currencies other than the U.S. dollar, revenues and expenses are translated using monthly average exchange rates. Impacts on our revenues less transaction-based expenses and operating income associated with fluctuations in foreign currency are discussed in more detail under “Item 7A. Quantitative and Qualitative Disclosures about Market Risk.”
37

Segment Operating Results
The following table shows our revenues by segment, transaction-based expenses for our Market Services segment and total revenues less transaction-based expenses:
Year Ended December 31, Percentage Change 2020 2019 2018 2020 vs. 2019 2019 vs. 2018 (in millions) Market Services $ 3,832 $ 2,639 $ 2,709 45.2 % (2.6) %Transaction-based expenses (2,724) (1,727) (1,751) 57.7 % (1.4) %Market Services revenues less transaction-based expenses 1,108 912 958 21.5 % (4.8) %Corporate Platforms 530 496 487 6.9 % 1.8 %Investment Intelligence 908 779 714 16.6 % 9.1 %Market Technology 357 338 270 5.6 % 25.2 %Other revenues(1) — 10 97 (100.0) % (89.7) %Total revenues less transaction-based expenses $ 2,903 $ 2,535 $ 2,526 14.5 % 0.4 %
____________(1) For the year ended December 31, 2019 and 2018, other revenues include the revenues from the BWise enterprise
governance, risk and compliance software platform, which was sold in March 2019, and for the year ended December 31, 2018, other revenues also include revenues from the Public Relations Solutions and Digital Media Services businesses which were sold in April 2018. Prior to the sale dates, these revenues were included in our IR & ESG Services business within our Corporate Platforms segment.
38

The following charts show our Market Services, Corporate Platforms, Investment Intelligence, and Market Technology segments as a percentage of our total revenues less transaction-based expenses of $2,903 million in 2020, $2,535 million in 2019, and $2,526 million in 2018:
2020 Percentage of Revenues LessTransaction-based Expenses by Segment
MarketServices:38.2%
CorporatePlatforms:18.2%
InvestmentIntelligence:31.3%Market
Technology:12.3%
2019 Percentage of Revenues LessTransaction-based Expenses by Segment
MarketServices:36.0%
CorporatePlatforms:19.6%
Otherrevenues:0.4%
InvestmentIntelligence:30.7%
MarketTechnology:13.3%
2018 Percentage of Revenues LessTransaction-based Expenses by Segment
MarketServices:37.9%
CorporatePlatforms:19.3%
Otherrevenues:3.8%
InvestmentIntelligence:28.3%
MarketTechnology:10.7%
39

MARKET SERVICES
The following table shows total revenues, transaction-based expenses, and total revenues less transaction-based expenses from our Market Services segment: Year Ended December 31, Percentage Change
2020 2019 2018 2020 vs. 2019 2019 vs. 2018
(in millions)
Market Services Revenues: Equity Derivative Trading and Clearing Revenues(1) $ 1,258 $ 816 $ 849 54.2 % (3.9) %Transaction-based expenses:
Transaction rebates (828) (477) (506) 73.6 % (5.7) %Brokerage, clearance and exchange fees(1) (76) (47) (44) 61.7 % 6.8 %Equity derivative trading and clearing revenues
less transaction-based expenses 354 292 299 21.2 % (2.3) %
Cash Equity Trading Revenues(2) 2,211 1,462 1,476 51.2 % (0.9) %Transaction-based expenses:
Transaction rebates (1,200) (847) (830) 41.7 % 2.0 %Brokerage, clearance and exchange fees(2) (618) (352) (361) 75.6 % (2.5) %Cash equity trading revenues less transaction-
based expenses 393 263 285 49.4 % (7.7) %
FICC Revenues 64 70 92 (8.6) % (23.9) %Transaction-based expenses:
Transaction rebates (1) (3) (8) (66.7) % (62.5) %Brokerage, clearance and exchange fees (1) (1) (2) — % (50.0) %FICC revenues less transaction-based expenses 62 66 82 (6.1) % (19.5) %
Trade Management Services Revenues 299 291 292 2.7 % (0.3) %Total Market Services revenues less transaction-
based expenses $ 1,108 $ 912 $ 958 21.5 % (4.8) %____________(1) Includes Section 31 fees of $69 million in 2020, $43 million in 2019, and $39 million in 2018. Section 31 fees are
recorded as equity derivative trading and clearing revenues with a corresponding amount recorded in transaction-based expenses.
(2) Includes Section 31 fees of $586 million in 2020, $337 million in 2019, and $343 million in 2018. Section 31 fees are recorded as cash equity trading revenues with a corresponding amount recorded in transaction-based expenses.
Equity Derivative Trading and Clearing Revenues
Equity derivative trading and clearing revenues and equity derivative trading and clearing revenues less transaction-based expenses increased in 2020 compared with 2019. The increase in equity derivative trading and clearing revenues was primarily due to higher U.S. industry trading volumes, a higher U.S. gross capture rate, and higher Section 31 pass-through fee revenue, partially offset by lower overall U.S. matched market share executed on Nasdaq's exchanges. The increase in equity derivative trading and clearing revenues less transaction-based expenses was primarily due to higher U.S. industry trading volumes, partially offset by a lower U.S. net capture rate and lower overall U.S. matched market share executed on Nasdaq's exchanges.
Section 31 fees are recorded as equity derivative trading and clearing revenues with a corresponding amount recorded as
transaction-based expenses. In the U.S., we are assessed these fees from the SEC and pass them through to our customers in the form of incremental fees. Pass-through fees can increase or decrease due to rate changes by the SEC, our percentage of the overall industry volumes processed on our systems, and differences in actual dollar value of shares traded. Since the amount recorded in revenues is equal to the amount recorded as transaction-based expenses, there is no impact on our revenues less transaction-based expenses. Section 31 fees increased in 2020 compared with 2019 primarily due to higher dollar value traded on Nasdaq's exchanges and higher average SEC fee rates.
Transaction rebates, in which we credit a portion of the per share execution charge to the market participant, increased in 2020 compared with 2019 due to higher U.S. industry trading volumes and an increase in the U.S. rebate capture rate,
40

partially offset by a decrease in our overall U.S. matched market share executed on Nasdaq's exchanges.
Brokerage, clearance and exchange fees increased in 2020 compared with 2019 primarily due to higher Section 31 pass-through fees, as discussed above.
Cash Equity Trading Revenues
Cash equity trading revenues and cash equity trading revenues less transaction-based expenses increased in 2020 compared with 2019 primarily due to higher U.S. industry trading volumes and higher European value traded, partially offset by lower overall U.S. matched market share executed on Nasdaq's exchanges. Also contributing to the increase in cash equity trading revenues were higher Section 31 pass-through fee revenue, while a higher net U.S. capture rate also contributed to the increase in cash equity trading revenues less transaction-based expenses in 2020.
Similar to equity derivative trading and clearing, in the U.S. we record Section 31 fees as cash equity trading revenues with a corresponding amount recorded as transaction-based expenses. We are assessed these fees from the SEC and pass them through to our customers in the form of incremental fees. Since the amount recorded as revenues is equal to the amount recorded as transaction-based expenses, there is no impact on our revenues less transaction-based expenses. Section 31 fees increased in 2020 compared with 2019 due to higher dollar value traded on Nasdaq’s exchanges and higher average SEC fee rates.
Transaction rebates increased in 2020 compared with 2019. For The Nasdaq Stock Market, Nasdaq PSX and Nasdaq CXC, we credit a portion of the per share execution charge to the market participant that provides the liquidity, and for Nasdaq BX and Nasdaq CX2, we credit a portion of the per share execution charge to the market participant that takes the liquidity. The increase in 2020 was primarily due to higher U.S. industry trading volumes, partially offset by lower overall U.S. matched market share executed on Nasdaq's exchanges and a lower rebate capture rate.
Brokerage, clearance and exchange fees increased in 2020 compared with 2019 primarily due to higher Section 31 pass-through fees, as discussed above.
FICC Revenues
FICC revenues and FICC revenues less transaction-based expenses decreased in 2020 compared with 2019 driven by lower U.S. fixed income volumes and the sale of the core assets of our NFX business, partially offset by higher European products revenues.
Trade Management Services Revenues
Trade management services revenues increased in 2020 compared with 2019 primarily due to higher demand for our connectivity services.
* * * * * *
CORPORATE PLATFORMS
The following table shows revenues from our Corporate Platforms segment: Year Ended December 31, Percentage Change
2020 2019 2018 2020 vs. 2019 2019 vs. 2018
(in millions)
Corporate Platforms:Listing Services $ 316 $ 296 $ 290 6.8 % 2.1 %IR & ESG Services 214 200 197 7.0 % 1.5 %Total Corporate Platforms $ 530 $ 496 $ 487 6.9 % 1.8 %
Listing Services Revenues
Listing services revenues increased in 2020 compared with 2019. The increase was primarily due to higher U.S. listings revenues due to an increase in the overall number of listed companies and a favorable impact from foreign exchange of $2 million.
IR & ESG Services Revenues IR & ESG Services revenues increased in 2020 compared with 2019 primarily due to increases in demand for both governance and investor relations intelligence services.
41

INVESTMENT INTELLIGENCE
The following table shows revenues from our Investment Intelligence segment: Year Ended December 31, Percentage Change 2020 2019 2018 2020 vs. 2019 2019 vs. 2018 (in millions) Investment Intelligence:Market Data $ 409 $ 398 $ 390 2.8 % 2.1 %Index 324 223 206 45.3 % 8.3 %Analytics 175 158 118 10.8 % 33.9 %Total Investment Intelligence $ 908 $ 779 $ 714 16.6 % 9.1 %
Market Data RevenuesMarket data revenues increased in 2020 compared with 2019 primarily due to organic growth in proprietary products from new sales, including continued expansion geographically, partially offset by a decrease in shared tape plan revenues.Index RevenuesIndex revenues increased in 2020 compared with 2019 primarily due to higher licensing revenues from higher
average AUM in ETPs linked to Nasdaq indexes and higher licensing revenues from futures trading linked to the Nasdaq-100 Index.Analytics RevenuesAnalytics revenues increased in 2020 compared with 2019 primarily due to the acquisition of Solovis and growth in eVestment.
* * * * * *
MARKET TECHNOLOGY
The following table shows revenues from our Market Technology segment: Year Ended December 31, Percentage Change 2020 2019 2018 2020 vs. 2019 2019 vs. 2018
(in millions)
Market Technology $ 357 $ 338 $ 270 5.6 % 25.2 %
Market Technology Revenues
Market technology revenues increased in 2020 compared with 2019. The increase was primarily due to higher SaaS revenues and a favorable impact from foreign exchange of $6 million.
OTHER REVENUES
For the year ended December 31, 2019 and 2018, other revenues include the revenues from the BWise enterprise governance, risk and compliance software platform, which was sold in March 2019, and for the year ended December 31, 2018, other revenues also include revenues from the Public Relations Solutions and Digital Media Services businesses which were sold in April 2018. Prior to the sale dates, these revenues were included in our IR & ESG Services business within our Corporate Platforms segment.
42

Expenses
Operating Expenses
The following table shows our operating expenses:
Year Ended December 31, Percentage Change
2020 2019 2018 2020 vs. 2019 2019 vs. 2018
(in millions) Compensation and benefits $ 786 $ 707 $ 712 11.2 % (0.7) %Professional and contract services 137 127 144 7.9 % (11.8) %Computer operations and data communications 151 133 127 13.5 % 4.7 %Occupancy 107 97 95 10.3 % 2.1 %General, administrative and other 142 125 120 13.6 % 4.2 %Marketing and advertising 39 39 37 — % 5.4 %Depreciation and amortization 202 190 210 6.3 % (9.5) %Regulatory 24 31 32 (22.6) % (3.1) %Merger and strategic initiatives 33 30 21 10.0 % 42.9 %Restructuring charges 48 39 — 23.1 % N/M
Total operating expenses $ 1,669 $ 1,518 $ 1,498 9.9 % 1.3 %_______N/M Not meaningful.
The increase in compensation and benefits expense in 2020 was primarily driven by an increase in headcount as a result of our strategic initiatives, higher performance incentives and higher compensation costs resulting from our recent acquisitions. Partially offsetting the higher compensation and benefits expense in 2020 was lower compensation costs resulting from our 2019 divestiture.
Headcount increased to 4,830 employees as of December 31, 2020 from 4,361 as of December 31, 2019 primarily due to our strategic initiatives, mainly growth in our Market Technology business, and recent acquisitions.
Professional and contract services expense increased in 2020 primarily due to higher consulting and legal costs.
Computer operations and data communications expense increased in 2020 primarily due to higher software and hardware maintenance costs, higher cloud costs, higher market data feed costs, and our recent acquisitions.
Occupancy expense increased in 2020 mainly due to higher costs associated with additional facility and rent costs resulting from the expansion of our new U.S. headquarters in New York.
General, administrative and other expense increased in 2020 primarily due to a higher loss on extinguishment of debt, a reserve recorded for a loss on a Market Technology implementation project, and charitable donations made to the Nasdaq Foundation, COVID-19 response and relief efforts, and social justice charities. These increases were partially offset by a higher provision for notes receivable in 2019 and lower corporate travel costs in 2020.
Depreciation and amortization expense increased in 2020 primarily due to an increase in capitalized software placed in service.
Regulatory expense decreased in 2020 primarily due to a favorable decision on a regulatory matter. In December 2016, we were issued a $6 million fine by the SFSA as a result of findings following its investigations of cybersecurity processes at our Nordic exchanges and clearinghouse. We appealed the SFSA’s decision, including the amount of the fine and received a favorable decision in the third quarter of 2020 where the court set aside the SFSA’s decision including the fine. The SFSA decided not to appeal the decision and the decision is therefore now final. As a result, the $6 million fine was reversed to regulatory expense in the consolidated statements of income for 2020.
Merger and strategic initiatives expense increased in 2020. We have pursued various strategic initiatives and completed acquisitions and divestitures in recent years which have resulted in expenses which would not have otherwise been incurred. These expenses generally include integration costs, as well as legal, due diligence and other third party transaction costs and will vary based on the size and frequency of the activities described above.
See Note 20, “Restructuring Charges,” to the consolidated financial statements for further discussion of our 2019 restructuring plan and charges associated with this plan.
43

Non-operating Income and Expenses
The following table shows our non-operating income and expenses: Year Ended December 31, Percentage Change
2020 2019 2018 2020 vs. 2019 2019 vs. 2018
(in millions)
Interest income $ 4 $ 10 $ 10 (60.0) % — %Interest expense (101) (124) (150) (18.5) % (17.3) %
Net interest expense (97) (114) (140) (14.9) % (18.6) %Gain on sale of investment security — — 118 — % (100.0) %Net gain on divestiture of businesses — 27 33 (100.0) % (18.2) %Other income 5 5 7 — % (28.6) %Net income from unconsolidated investees 70 84 18 (16.7) % 366.7 %
Total non-operating income (expenses) $ (22) $ 2 $ 36 (1,200.0) % (94.4) %
Interest Income
Interest income decreased in 2020 compared to 2019 primarily due to a decrease in interest rates.
Interest Expense
Interest expense decreased in 2020 compared with 2019 primarily due to the refinancing of our 3.875% senior notes in March 2020 with the 2030 Notes and the refinancing of our 5.55% senior notes in May 2019 with the 2029 Notes, both at lower interest rates, and the repayment of our senior unsecured floating rate notes in March 2019 with commercial paper issuances and cash on hand. See Note 9, “Debt Obligations,” to the consolidated financial statements for further discussion of our debt obligations.
The following table shows our interest expense: Year Ended December 31, Percentage Change 2020 2019 2018 2020 vs. 2019 2019 vs. 2018 (in millions) Interest expense on debt $ 93 $ 115 $ 140 (19.1) % (17.9) %Accretion of debt issuance costs and debt discount 6 6 7 — % (14.3) %Other fees 2 3 3 (33.3) % — %Interest expense $ 101 $ 124 $ 150 (18.5) % (17.3) %
Net Gain on Divestiture of Businesses
The net gain on divestiture of businesses in 2019 related to the divestiture of BWise. See “2019 Divestiture,” of Note 4, “Acquisitions and Divestiture,” to the consolidated financial statements for further discussion. The net gain on divestiture of businesses in 2018 related to the sale of the Public Relations Solutions and Digital Media Services business, which was part of our IR & ESG Services business within our Corporate Platforms segment.
Net Income from Unconsolidated Investees
Net income from unconsolidated investees decreased in 2020 compared with 2019 primarily due to a decrease in income recognized from our equity method investment in OCC. See “Equity Method Investments,” of Note 6, “Investments,” to the consolidated financial statements for further discussion.
Tax Matters
The following table shows our income tax provision and effective tax rate:Year Ended December 31, Percentage Change
2020 2019 2018 2020 vs. 2019 2019 vs. 2018
($ in millions)
Income tax provision $ 279 $ 245 $ 606 13.9 % (59.6) %Effective tax rate 23.0 % 24.0 % 57.0 %
For further discussion of our tax matters, see Note 17, “Income Taxes,” to the consolidated financial statements.
44

Non-GAAP Financial Measures
In addition to disclosing results determined in accordance with U.S. GAAP, we also have provided non-GAAP net income attributable to Nasdaq and non-GAAP diluted earnings per share. Management uses this non-GAAP information internally, along with U.S. GAAP information, in evaluating our performance and in making financial and operational decisions. We believe our presentation of these measures provides investors with greater transparency and supplemental data relating to our financial condition and results of operations. In addition, we believe the presentation of these measures is useful to investors for period-to-period comparisons of our ongoing operating performance.
These measures are not in accordance with, or an alternative to, U.S. GAAP, and may be different from non-GAAP measures used by other companies. In addition, other companies, including companies in our industry, may calculate such measures differently, which reduces their usefulness as comparative measures. Investors should not rely on any single financial measure when evaluating our business. This non-GAAP information should be considered as supplemental in nature and is not meant as a substitute for our operating results in accordance with U.S. GAAP. We recommend investors review the U.S. GAAP financial measures included in this Annual Report on Form 10-K, including our consolidated financial statements and the notes thereto. When viewed in conjunction with our U.S. GAAP results and the accompanying reconciliation, we believe these non-GAAP measures provide greater transparency and a more complete understanding of factors affecting our business than U.S. GAAP measures alone.
We understand that analysts and investors regularly rely on non-GAAP financial measures, such as non-GAAP net income attributable to Nasdaq and non-GAAP diluted earnings per share, to assess operating performance. We use non-GAAP net income attributable to Nasdaq and non-GAAP diluted earnings per share because they highlight trends more clearly in our business that may not otherwise be apparent when relying solely on U.S. GAAP financial measures, since these measures eliminate from our results specific financial items that have less bearing on our ongoing operating performance. Non-GAAP net income attributable to Nasdaq for the periods presented below is calculated by adjusting for the following items:
Amortization expense of acquired intangible assets: We amortize intangible assets acquired in connection with various acquisitions. Intangible asset amortization expense can vary from period to period due to episodic acquisitions completed, rather than from our ongoing business operations. As such, if intangible asset amortization is included in performance measures, it is more difficult to assess the day-to-day operating performance of the businesses, the relative operating performance of the businesses between periods, and the earnings power of Nasdaq. Performance measures excluding intangible asset amortization expense therefore
provide investors with a useful representation of our businesses’ ongoing activity in each period.
Merger and strategic initiatives expense: We have pursued various strategic initiatives and completed acquisitions and divestitures in recent years that have resulted in expenses which would not have otherwise been incurred. These expenses generally include integration costs, as well as legal, due diligence and other third party transaction costs. The frequency and the amount of such expenses vary significantly based on the size, timing and complexity of the transaction. Accordingly, we exclude these costs for purposes of calculating non-GAAP measures which provide a more meaningful analysis of Nasdaq’s ongoing operating performance or comparisons in Nasdaq’s performance between periods.
Restructuring charges: We initiated the transition of certain technology platforms to advance our strategic opportunities as a technology and analytics provider and continue the re-alignment of certain business areas. See Note 20, “Restructuring Charges,” to the consolidated financial statements for further discussion of our 2019 restructuring plan. Charges associated with this plan represent a fundamental shift in our strategy and technology as well as executive re-alignment and will be excluded for purposes of calculating non-GAAP measures as they are not reflective of ongoing operating performance or comparisons in Nasdaq's performance between periods.
Net income from unconsolidated investee: See “Equity Method Investments,” of Note 6, “Investments,” to the consolidated financial statements for further discussion. Our income on our investment in OCC may vary significantly compared to prior years due to the changes in the OCC's capital management policy. Accordingly, we will exclude this income from current and prior periods for purposes of calculating non-GAAP measures which provide a more meaningful analysis of Nasdaq’s ongoing operating performance or comparisons in Nasdaq’s performance between periods.
Other significant items: We have excluded certain other charges or gains, including certain tax items, that are the result of other non-comparable events to measure operating performance. We believe the exclusion of such amounts allows management and investors to better understand the ongoing financial results of Nasdaq.
For 2020, other significant items primarily included:
• a provision for notes receivable associated with the funding of technology development for the CAT;
• a loss on extinguishment of debt;
• charges associated with duplicative rent and impairment of leasehold assets related to our global headquarter move;
• charitable donations made to the Nasdaq Foundation, COVID-19 response and relief efforts, and social justice charities; and
45

• the reversal of a $6 million regulatory fine issued by the SFSA which is recorded in regulatory expense in the Consolidated Statements of Income.
For 2019, other significant items primarily included:
• a provision for notes receivable associated with the funding of technology development for the CAT;
• a loss on extinguishment of debt; and
• a net gain on divestiture of business which represents our pre-tax net gain of $27 million on the sale of BWise;
• other items:
◦ a tax reserve for certain prior year examinations; and
◦ certain litigation costs which are recorded in professional and contract services expense in the Consolidated Statements of Income.
The above charges, with the exception of those noted differently above, are recorded in general, administrative and other expense in our Consolidated Statements of Income.
Significant tax items:
The non-GAAP adjustment to the income tax provision included the tax impact of each non-GAAP adjustment and:
• for 2020:
◦ a tax benefit related to favorable audit settlements;
◦ a release of tax reserves due to statute of limitation expiration, partially offset with an increase to certain tax reserves related to certain tax filings; and
◦ a tax benefit on compensation related deductions determined to be allowable.
• for 2020 and 2019, excess tax benefits related to employee share-based compensation to reflect the recognition of the income tax effects of share-based awards when awards vest or are settled. This item is subject to volatility and will vary based on the timing of the vesting of employee share-based compensation arrangements and fluctuation in our stock price.
• for 2019, a tax benefit primarily related to an adjustment to the 2018 federal and state tax returns and a tax benefit related to capital distributions from the OCC. See “Equity Method Investments,” of Note 6, “Investments,” to the consolidated financial statements for further discussion of our OCC investment.
46

The following table shows reconciliations between U.S. GAAP net income attributable to Nasdaq and diluted earnings per share and non-GAAP net income attributable to Nasdaq and diluted earnings per share:
Year End December 31,
2020 2019 2018
(in millions, except share and per share amounts)
U.S. GAAP net income attributable to Nasdaq $ 933 $ 774 $ 458 Non-GAAP adjustments:Amortization expense of acquired intangible assets 103 101 109 Merger and strategic initiatives expense 33 30 21 Restructuring charges 48 39 — Net income from unconsolidated investees (70) (82) (16) Clearing default loss — — 31 Provision for notes receivable 6 20 — Extinguishment of debt 36 11 — Net gain on divestiture of businesses — (27) (33) Gain on sale of investment security — — (118) Charitable donations 17 — — Other 8 17 17
Total non-GAAP adjustments 181 109 11 Adjustment to the income tax provision to reflect non-GAAP
adjustments and other tax items (77) (43) 6 Excess tax benefits related to employee share-based compensation (6) (5) (9) Impact of enacted U.S. tax legislation — — 290 Reversal of certain Swedish tax benefits — — 41
Total non-GAAP tax adjustments (83) (48) 328 Total non-GAAP adjustments, net of tax 98 61 339
Non-GAAP net income attributable to Nasdaq $ 1,031 $ 835 $ 797
Weighted-average common shares outstanding for diluted earnings per share 166,903,941 166,970,161 167,691,299
U.S. GAAP diluted earnings per share $ 5.59 $ 4.63 $ 2.73 Total adjustments from non-GAAP net income 0.59 0.37 2.02
Non-GAAP diluted earnings per share $ 6.18 $ 5.00 $ 4.75
Liquidity and Capital Resources
Historically, we have funded our operating activities and met our commitments through cash generated by operations, augmented by the periodic issuance of our common stock and debt. Currently, our cost and availability of funding remain healthy.
In response to the uncertainties posed by COVID-19 and related economic impacts, we took actions to strengthen our liquidity and cash position and to reduce our refinancing risk.
In March 2020, we observed that conditions in the market for Tier 2 commercial paper issuers were deteriorating, impacting both costs and actionable duration of commercial paper issues. To mitigate funding uncertainties and as a precautionary measure to maximize our liquidity and increase
our available cash on hand, Nasdaq borrowed $799 million under the revolving credit commitment of the 2017 Credit Facility. See “Early Extinguishment of 2017 Credit Facility,” of Note 9, “Debt Obligations,” to the consolidated financial statements for further discussion of the 2017 Credit Facility.
In April 2020, we issued the 2050 Notes and used the net proceeds from the 2050 Notes to repay a portion of amounts previously borrowed under the 2017 Credit Facility. For further discussion of the 2050 Notes, see “3.25% Senior Unsecured Notes Due 2050,” of Note 9, “Debt Obligations,” to the consolidated financial statements. In June 2020, the remaining outstanding amount under the 2017 Credit Facility was repaid using cash on hand. In June 2020, we also repaid all outstanding borrowings under our commercial paper program.
47
Other Financing Transactions
In February 2020, we issued the 2030 Notes. We primarily used the net proceeds from the 2030 Notes to redeem the 2021 Notes and for other general corporate purposes. See “0.875% Senior Unsecured Notes Due 2030,” and “Early Extinguishment of 3.875% Senior Unsecured Notes Due 2021,” of Note 9, “Debt Obligations,” to the consolidated financial statements for further discussion.
In December 2020, we issued the 2022 Notes, 2031 Notes and 2040 Notes. The net proceeds were used to partially finance the acquisition of Verafin. For further discussion of these notes, see “Senior Unsecured Notes Due 2022, 2031 and 2040,” of Note 9, “Debt Obligations,” to the consolidated financial statements. For further discussion of the acquisition of Verafin, see “Acquisition of Verafin,” of Note 4, “Acquisitions and Divestiture,” to the consolidated financial statements.
In December 2020, we also terminated the 2017 Credit Facility and entered into the 2020 Credit Facility. See “Credit Facilities,” of Note 9, “Debt Obligations,” to the consolidated financial statements for further discussion.
As of December 31, 2020, our sources and uses of cash were not materially impacted by COVID-19 and we have not identified any material liquidity deficiencies as a result of the COVID-19 pandemic. We will continue to closely monitor and manage our liquidity and capital resources. In addition, we continue to prudently assess our capital deployment strategy through balancing acquisitions, internal investments, debt repayments, and shareholder return activity including share repurchases and dividends.
Other Liquidity and Capital Considerations
In the near term, we expect that our operations and the availability under our revolving credit facility and commercial paper program will provide sufficient cash to fund our operating expenses, capital expenditures, debt repayments, any share repurchases, and any dividends. In January 2021, we increased the size of our commercial paper program from $1 billion to $1.25 billion. In February 2021, we issued $475 million of commercial paper to partially fund the acquisition of Verafin. For further discussion of the acquisition of Verafin, see “Acquisition of Verafin,” of Note 4, “Acquisitions and Divestiture,” to the consolidated financial statements.
As part of the purchase price consideration of a prior acquisition, Nasdaq has contingent future obligations to issue 992,247 shares of Nasdaq common stock annually through 2027. See “Non-Cash Contingent Consideration,” of Note 18, “Commitments, Contingencies and Guarantees,” to the consolidated financial statements for further discussion.
The value of various assets and liabilities, including cash and cash equivalents, receivables, accounts payable and accrued expenses, the current portion of long-term debt, and commercial paper, can fluctuate from month to month. Working capital (calculated as current assets less current
liabilities) was $2,736 million as of December 31, 2020, compared with $63 million as of December 31, 2019, an increase of $2,673 million. Current asset balance changes increased working capital by $3,370 million, with increases in cash and cash equivalents, primarily due to net proceeds of $1.9 billion from issuances of long-term debt in the fourth quarter of 2020 for the acquisition of Verafin, default funds and margin deposits, receivables, net, and restricted cash and cash equivalents, partially offset by decreases in financial investments and other current assets. Current liability balance changes decreased working capital by $697 million, due to increases in default funds and margin deposits, Section 31 fees payable to the SEC, accrued personnel costs, accounts payable and accrued expenses, and deferred revenue, partially offset by decreases in short-term debt and other current liabilities.
Principal factors that could affect the availability of our internally-generated funds include:• deterioration of our revenues in any of our business
segments;• changes in regulatory and working capital requirements;
and• an increase in our expenses.
Principal factors that could affect our ability to obtain cash from external sources include:• operating covenants contained in our credit facilities that
limit our total borrowing capacity;• increases in interest rates under our credit facilities;• credit rating downgrades, which could limit our access to
additional debt;• a decrease in the market price of our common stock; • volatility or disruption in the public debt and equity
markets; and
• the impact of the COVID-19 pandemic on our business.
The following sections discuss the effects of changes in our financial assets, debt obligations, regulatory capital requirements, and cash flows on our liquidity and capital resources.
Financial Assets
The following table summarizes our financial assets: December 31, 2020 December 31, 2019
(in millions)
Cash and cash equivalents $ 2,745 $ 332 Restricted cash and cash
equivalents 37 30 Financial investments 195 291 Total financial assets $ 2,977 $ 653
48

Cash and Cash Equivalents and Restricted Cash and Cash Equivalents
Cash and cash equivalents includes all non-restricted cash in banks and highly liquid investments with original maturities of 90 days or less at the time of purchase. The balance retained in cash and cash equivalents is a function of anticipated or possible short-term cash needs, prevailing interest rates, our investment policy, and alternative investment choices. As of December 31, 2020, our cash and cash equivalents of $2,745 million were primarily invested in bank deposits and money market funds. In the long-term, we may use both internally generated funds and external sources to satisfy our debt obligations and other long-term liabilities. Cash and cash equivalents as of December 31, 2020 increased $2,413 million from December 31, 2019, primarily due to:• proceeds from issuances of long-term debt, net of
issuance costs. For further discussion, see “Senior Unsecured Notes Due 2022, 2031, and 2040,” of Note 9, “Debt Obligations,” to the consolidated financial statements;
• net cash provided by operating activities; and• proceeds from the net sales of securities. These increases
were partially offset by:◦ repayments of borrowings under our credit
commitment and debt obligations;◦ repayments of commercial paper, net;◦ cash dividends paid on our common stock;◦ repurchases of our common stock;◦ purchases of property and equipment;◦ cash paid for acquisitions, net of cash and cash
equivalents acquired; ◦ payments related to employee shares withheld for
taxes; and◦ payment of debt extinguishment costs.
See “Cash Flow Analysis” below for further discussion.
Restricted cash and cash equivalents are restricted from withdrawal due to contractual or regulatory requirements or is not available for general use. Restricted cash and cash equivalents were $37 million as of December 31, 2020 and $30 million as of December 31, 2019, an increase of $7 million. Restricted cash and cash equivalents are classified as restricted cash and cash equivalents in the Consolidated Balance Sheets.
Repatriation of Cash
Our cash and cash equivalents held outside of the U.S. in various foreign subsidiaries totaled $237 million as of
December 31, 2020 and $160 million as of December 31, 2019. The remaining balance held in the U.S. totaled $2,508 million as of December 31, 2020 and $172 million as of December 31, 2019. See “Cash and Cash Equivalents,” of Note 2, “Summary of Significant Accounting Policies,” to the consolidated financial statements for discussion of the increase in cash and cash equivalents.
Unremitted earnings of certain subsidiaries outside of the U.S. are used to finance our international operations and are considered to be indefinitely reinvested.
Share Repurchase Program
See “Share Repurchase Program,” of Note 12, “Nasdaq Stockholders’ Equity,” to the consolidated financial statements for further discussion of our share repurchase program.
Cash Dividends on Common Stock
The following table shows quarterly cash dividends paid per common share on our outstanding common stock:
2020 2019
First quarter $ 0.47 $ 0.44 Second quarter 0.49 0.47 Third quarter 0.49 0.47 Fourth quarter 0.49 0.47 Total $ 1.94 $ 1.85
See “Cash Dividends on Common Stock,” of Note 12, “Nasdaq Stockholders’ Equity,” to the consolidated financial statements for further discussion of the dividends.
Financial Investments
Our financial investments totaled $195 million as of December 31, 2020 and were trading securities primarily comprised of highly rated European government debt securities. As of December 31, 2019, financial investments totaled $291 million and were trading securities primarily comprised of highly rated European government debt securities, time deposits and highly rated corporate debt. Of these securities, $175 million as of December 31, 2020 and $169 million as of December 31, 2019 are assets primarily utilized to meet regulatory capital requirements, mainly for our clearing operations at Nasdaq Clearing. See Note 6, “Investments,” to the consolidated financial statements for further discussion.
49
Debt Obligations
The following table summarizes our debt obligations by contractual maturity:
Maturity Date December 31, 2020 December 31, 2019 (in millions)
Short-term debt - commercial paper $ — $ 391 Long-term debt:
3.875% senior unsecured notes Repaid March 2020 $ — $ 671 $1 billion senior unsecured revolving credit facility Terminated December 2020 — (2) 0.445% senior unsecured notes December 2022 597 — 1.75% senior unsecured notes May 2023 730 668 4.25% senior unsecured notes June 2024 498 497 $1.25 billion senior unsecured revolving credit facility December 2025 (4) — 3.85% senior unsecured notes June 2026 497 497 1.75% senior unsecured notes March 2029 726 665 0.875% senior unsecured notes February 2030 726 — 1.650% senior unsecured notes January 2031 643 — 2.500% senior unsecured notes December 2040 643 — 3.25% senior unsecured notes April 2050 485 —
Total long-term debt $ 5,541 $ 2,996 Total debt obligations $ 5,541 $ 3,387
In addition to the $1.25 billion revolving credit facility, we also have other credit facilities primarily to support our Nasdaq Clearing operations in Europe, as well to provide a cash pool credit line for one subsidiary. These credit facilities, which are available in multiple currencies, totaled $232 million as of December 31, 2020 and $203 million as of December 31, 2019 in available liquidity, none of which was utilized as of December 31, 2020, and of which $15 million was utilized as of December 31, 2019.
As of December 31, 2020, we were in compliance with the covenants of all of our debt obligations.
See Note 9, “Debt Obligations,” to the consolidated financial statements for further discussion of our debt obligations.
Regulatory Capital Requirements
Clearing Operations Regulatory Capital Requirements
We are required to maintain minimum levels of regulatory capital for the clearing operations of Nasdaq Clearing. The level of regulatory capital required to be maintained is dependent upon many factors, including market conditions and creditworthiness of the counterparty. As of December 31, 2020, our required regulatory capital of $145 million was comprised of highly rated European government debt securities that are included in financial investments in the Consolidated Balance Sheets.
Broker-Dealer Net Capital Requirements
Our broker-dealer subsidiaries, Nasdaq Execution Services, Execution Access, NPM Securities, SMTX, and Nasdaq
Capital Markets Advisory, are subject to regulatory requirements intended to ensure their general financial soundness and liquidity. These requirements obligate these subsidiaries to comply with minimum net capital requirements. As of December 31, 2020, the combined required minimum net capital totaled $1 million and the combined excess capital totaled $55 million, substantially all of which is held in cash and cash equivalents in the Consolidated Balance Sheets. The required minimum net capital is included in restricted cash and cash equivalents in the Consolidated Balance Sheets.
Nordic and Baltic Exchange Regulatory Capital Requirements
The entities that operate trading venues in the Nordic and Baltic countries are each subject to local regulations and are required to maintain regulatory capital intended to ensure their general financial soundness and liquidity. As of December 31, 2020, our required regulatory capital of $39 million was primarily invested in European debt securities that are included in financial investments in the Consolidated Balance Sheets and cash which is included in restricted cash and cash equivalents in the Consolidated Balance Sheets.
Other Capital Requirements
We operate several other businesses which are subject to local regulation and are required to maintain certain levels of regulatory capital. As of December 31, 2020, other required regulatory capital was $12 million and was primarily included in restricted cash in the Consolidated Balance Sheets.
50

* * * * * *Cash Flow AnalysisThe following table summarizes the changes in cash flows: Year Ended December 31, Percentage Change 2020 2019 2018 2020 vs. 2019 2019 vs. 2018
Net cash provided by (used in): (in millions) Operating activities $ 1,252 $ 963 $ 1,028 30.0 % (6.3) %Investing activities (231) (240) 196 (3.8) % (222.4) %Financing activities 1,383 (937) (1,027) (247.6) % (8.8) %Effect of exchange rate changes on cash and cash equivalents
and restricted cash and cash equivalents 16 (10) (10) (260.0) % — %Net increase (decrease) in cash and cash equivalents and
restricted cash 2,420 (224) 187 (1,180.4) % (219.8) %Cash and cash equivalents and restricted cash and cash
equivalents at beginning of period 362 586 399 (38.2) % 46.9 %Cash and cash equivalents and restricted cash and cash
equivalents at end of period $ 2,782 $ 362 $ 586 668.5 % (38.2) %
Net Cash Provided by Operating Activities
Net cash provided by operating activities primarily consists of net income adjusted for certain non-cash items such as: depreciation and amortization expense of property and equipment; amortization expense of acquired finite-lived intangible assets; expense associated with share-based compensation; and net income from unconsolidated investees.
Net cash provided by operating activities is also impacted by the effects of changes in operating assets and liabilities such as: accounts receivable which is impacted by the timing of customer billings and related collections from our customers; accounts payable and accrued expenses due to timing of payments; accrued personnel costs which are impacted by employee performance targets and the timing of payments related to employee bonus incentives; and Section 31 fees payable to the SEC, which is impacted by the timing of collections from customers and payments to the SEC.
Net cash provided by operating activities increased $289 million for the year ended December 31, 2020 compared with the same period in 2019. The increase was primarily driven by higher net income, an increase in Section 31 fees payable to the SEC due to elevated U.S. industry trading volumes, lower performance incentive payments made in 2020 compared with 2019 primarily due to prior year performance and lower interest paid due to a decline in average interest rates on our debt obligations, partially offset by an increase in receivables, net, due to elevated U.S. industry trading volumes and higher income taxes paid. The remaining change is primarily due to fluctuations in our working capital.
Net Cash Used in Investing Activities
Net cash used in investing activities for 2020 primarily related to $188 million of purchases of property and equipment and $157 million of cash used for acquisitions, net of cash and cash equivalents acquired, partially offset by $119 million of proceeds from the net sales of securities.
Net cash used in investing activities for 2019 primarily relates to $206 million of cash used for acquisitions, net of cash and cash equivalents acquired, $127 million of purchases of property and equipment, and $36 million of net purchases of securities, partially offset by receipt of cash of $132 million related to our 2019 divestiture.
Net Cash Used in (Provided by) Financing Activities
Net cash provided by financing activities for 2020 primarily related to $3,811 million of proceeds from issuances of long-term debt and the utilization of our credit commitment, partially offset by $1,472 million in repayments of borrowings under our credit commitment and debt obligations, $391 million of net repayments of commercial paper, $320 million of dividend payments to our shareholders, and $222 million in repurchases of common stock.
Net cash used in financing activities for 2019 primarily relates to $1,215 million in repayments of debt obligations, $305 million of dividend payments to our shareholders, and $200 million in repurchases of common stock, partially offset by $680 million from proceeds related to long-term debt issuances and $116 million in net borrowings of commercial paper.
See Note 4, “Acquisitions and Divestiture,” to the consolidated financial statements for further discussion of our acquisitions and divestiture.
See Note 9, “Debt Obligations,” to the consolidated financial statements for further discussion of our debt obligations.
51
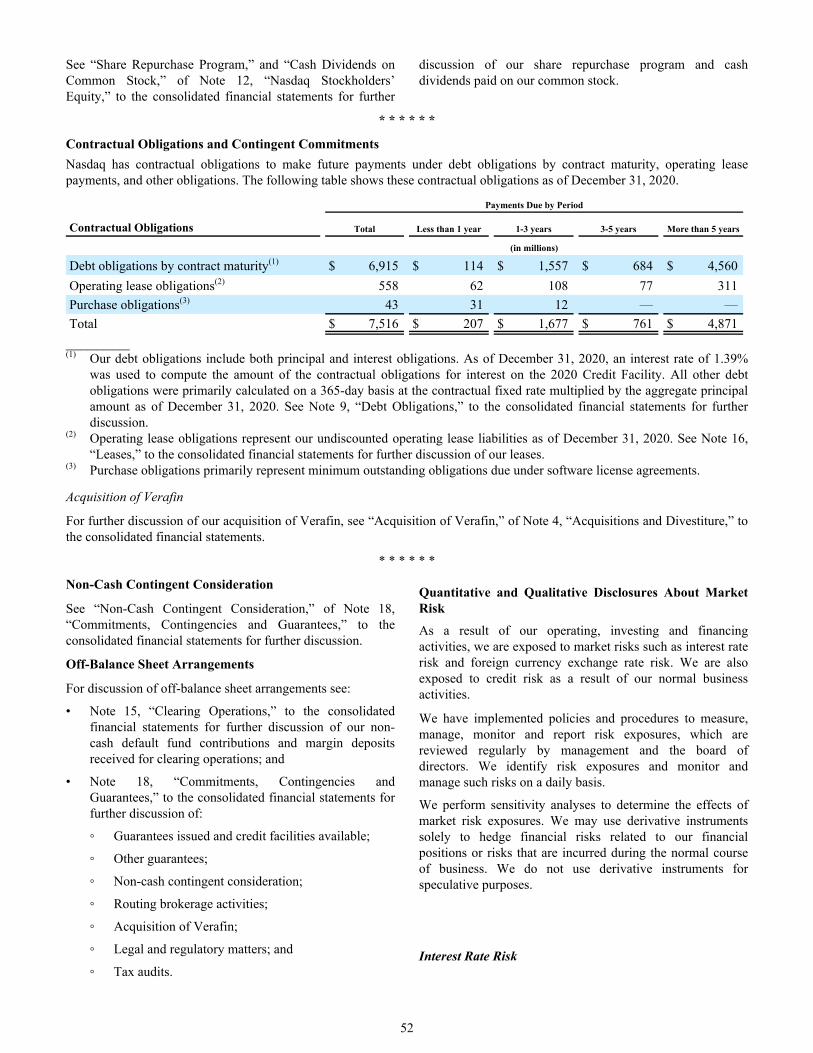
See “Share Repurchase Program,” and “Cash Dividends on Common Stock,” of Note 12, “Nasdaq Stockholders’ Equity,” to the consolidated financial statements for further
discussion of our share repurchase program and cash dividends paid on our common stock.
* * * * * *
Contractual Obligations and Contingent CommitmentsNasdaq has contractual obligations to make future payments under debt obligations by contract maturity, operating lease payments, and other obligations. The following table shows these contractual obligations as of December 31, 2020.
Payments Due by Period
Contractual Obligations Total Less than 1 year 1-3 years 3-5 years More than 5 years
(in millions)
Debt obligations by contract maturity(1) $ 6,915 $ 114 $ 1,557 $ 684 $ 4,560 Operating lease obligations(2) 558 62 108 77 311 Purchase obligations(3) 43 31 12 — — Total $ 7,516 $ 207 $ 1,677 $ 761 $ 4,871
____________(1) Our debt obligations include both principal and interest obligations. As of December 31, 2020, an interest rate of 1.39%
was used to compute the amount of the contractual obligations for interest on the 2020 Credit Facility. All other debt obligations were primarily calculated on a 365-day basis at the contractual fixed rate multiplied by the aggregate principal amount as of December 31, 2020. See Note 9, “Debt Obligations,” to the consolidated financial statements for further discussion.
(2) Operating lease obligations represent our undiscounted operating lease liabilities as of December 31, 2020. See Note 16, “Leases,” to the consolidated financial statements for further discussion of our leases.
(3) Purchase obligations primarily represent minimum outstanding obligations due under software license agreements.
Acquisition of Verafin
For further discussion of our acquisition of Verafin, see “Acquisition of Verafin,” of Note 4, “Acquisitions and Divestiture,” to the consolidated financial statements.
* * * * * *
Non-Cash Contingent Consideration
See “Non-Cash Contingent Consideration,” of Note 18, “Commitments, Contingencies and Guarantees,” to the consolidated financial statements for further discussion.
Off-Balance Sheet Arrangements
For discussion of off-balance sheet arrangements see:
• Note 15, “Clearing Operations,” to the consolidated financial statements for further discussion of our non-cash default fund contributions and margin deposits received for clearing operations; and
• Note 18, “Commitments, Contingencies and Guarantees,” to the consolidated financial statements for further discussion of:
◦ Guarantees issued and credit facilities available;
◦ Other guarantees;
◦ Non-cash contingent consideration;
◦ Routing brokerage activities;
◦ Acquisition of Verafin;
◦ Legal and regulatory matters; and
◦ Tax audits.
Quantitative and Qualitative Disclosures About Market Risk
As a result of our operating, investing and financing activities, we are exposed to market risks such as interest rate risk and foreign currency exchange rate risk. We are also exposed to credit risk as a result of our normal business activities.
We have implemented policies and procedures to measure, manage, monitor and report risk exposures, which are reviewed regularly by management and the board of directors. We identify risk exposures and monitor and manage such risks on a daily basis.
We perform sensitivity analyses to determine the effects of market risk exposures. We may use derivative instruments solely to hedge financial risks related to our financial positions or risks that are incurred during the normal course of business. We do not use derivative instruments for speculative purposes.
Interest Rate Risk
52

We are subject to the risk of fluctuating interest rates in the normal course of business. Our exposure to market risk for changes in interest rates relates primarily to our financial investments and debt obligations which are discussed below.
Financial Investments
As of December 31, 2020, our investment portfolio was primarily comprised of highly rated European government debt securities, which pay a fixed rate of interest. These securities are subject to interest rate risk and the fair value of these securities will decrease if market interest rates increase. If market interest rates were to increase immediately and uniformly by 100 basis points from levels as of December 31, 2020, the fair value of this portfolio would have declined by $5 million.
Debt Obligations
As of December 31, 2020, the majority of our debt obligations were fixed-rate obligations. Interest rates on
certain tranches of notes are subject to adjustment to the extent our debt rating is downgraded below investment grade, as further discussed in Note 9, “Debt Obligations,” to the consolidated financial statements. While changes in interest rates will have no impact on the interest we pay on fixed-rate obligations, we are exposed to changes in interest rates as a result of borrowings under our 2020 Credit Facility, as the interest rate on this facility has a variable interest rate. We are also exposed to changes in interest rates as a result of the amounts outstanding from the sale of commercial paper under our commercial paper program, which have variable interest rates. As of December 31, 2020, there were no outstanding borrowings under our 2020 Credit Facility or commercial paper program.
We may utilize interest rate swap agreements to achieve a desired mix of variable and fixed rate debt.
* * * * * *
Foreign Currency Exchange Rate Risk
We are subject to foreign currency exchange rate risk. Our primary transactional exposure to foreign currency denominated revenues less transaction-based expenses and operating income for the years ended December 31, 2020 and 2019 are presented in the following table:
EuroSwedish Krona
Other Foreign
Currencies U.S. Dollar Total
(in millions, except currency rate)
Year End December 31, 2020 Average foreign currency rate to the U.S. dollar 1.1398 0.1086 # N/A N/APercentage of revenues less transaction-based expenses 7.7 % 6.6 % 4.7 % 81.0 % 100.0 %Percentage of operating income 10.7 % (4.6) % (4.9) % 98.8 % 100.0 %
Impact of a 10% adverse currency fluctuation on revenues less transaction-based expenses $ (22) $ (19) $ (14) $ — $ (55)
Impact of a 10% adverse currency fluctuation on operating income $ (13) $ (6) $ (6) $ — $ (25)
EuroSwedish Krona
Other Foreign
Currencies U.S. Dollar Total
(in millions, except currency rate)
Year End December 31, 2019Average foreign currency rate to the U.S. dollar 1.1193 0.1057 # N/A N/APercentage of revenues less transaction-based expenses 7.7 % 7.6 % 5.0 % 79.7 % 100.0 %Percentage of operating income 13.9 % (4.3) % (5.8) % 96.2 % 100.0 %Impact of a 10% adverse currency fluctuation on revenues less
transaction-based expenses $ (19) $ (19) $ (13) $ — $ (51) Impact of a 10% adverse currency fluctuation on operating
income $ (14) $ (4) $ (6) $ — $ (24) ____________# Represents multiple foreign currency rates.N/A Not applicable.
Our investments in foreign subsidiaries are exposed to volatility in currency exchange rates through translation of
the foreign subsidiaries’ net assets or equity to U.S. dollars. Substantially all of our foreign subsidiaries operate in
53

functional currencies other than the U.S. dollar. The financial statements of these subsidiaries are translated into U.S. dollars for consolidated reporting using a current rate of exchange, with net gains or losses recorded in accumulated other comprehensive loss within stockholders’ equity in the Consolidated Balance Sheets.
Our primary exposure to net assets in foreign currencies as of December 31, 2020 is presented in the following table:
Net Assets
Impact of a 10% Adverse Currency
Fluctuation
(in millions)
Swedish Krona(1) $ 3,675 $ 367 British Pound 212 21 Norwegian Krone 177 18 Canadian Dollar 123 12 Australian Dollar 122 12 Euro 39 4
____________(1) Includes goodwill of $2,728 million and intangible
assets, net of $665 million.
Credit Risk
Credit risk is the potential loss due to the default or deterioration in credit quality of customers or counterparties. We are exposed to credit risk from third parties, including customers, counterparties and clearing agents. These parties may default on their obligations to us due to bankruptcy, lack of liquidity, operational failure or other reasons. We limit our exposure to credit risk by evaluating the counterparties with which we make investments and execute agreements. For our investment portfolio, our objective is to invest in securities to preserve principal while maximizing yields, without significantly increasing risk. Credit risk associated with investments is minimized substantially by ensuring that these financial assets are placed with governments which have investment grade ratings, well-capitalized financial institutions and other creditworthy counterparties.
Our subsidiary, Nasdaq Execution Services, may be exposed to credit risk due to the default of trading counterparties in connection with the routing services it provides for our trading customers. System trades in cash equities routed to other market centers for members of our cash equity exchanges are routed by Nasdaq Execution Services for clearing to the NSCC. In this function, Nasdaq Execution Services is to be neutral by the end of the trading day, but may be exposed to intraday risk if a trade extends beyond the trading day and into the next day, thereby leaving Nasdaq Execution Services susceptible to counterparty risk in the period between accepting the trade and routing it to the clearinghouse. In this interim period, Nasdaq Execution Services is not novating like a clearing broker but instead is subject to the short-term risk of counterparty failure before the clearinghouse enters the transaction. Once the clearinghouse officially accepts the trade for novation, Nasdaq Execution Services is legally removed from trade
execution risk. However, Nasdaq has membership obligations to NSCC independent of Nasdaq Execution Services’ arrangements.
Pursuant to the rules of the NSCC and Nasdaq Execution Services’ clearing agreement, Nasdaq Execution Services is liable for any losses incurred due to a counterparty or a clearing agent’s failure to satisfy its contractual obligations, either by making payment or delivering securities. Adverse movements in the prices of securities that are subject to these transactions can increase our credit risk. However, we believe that the risk of material loss is limited, as Nasdaq Execution Services’ customers are not permitted to trade on margin and NSCC rules limit counterparty risk on self-cleared transactions by establishing credit limits and capital deposit requirements for all brokers that clear with NSCC. Historically, Nasdaq Execution Services has never incurred a liability due to a customer’s failure to satisfy its contractual obligations as counterparty to a system trade. Credit difficulties or insolvency, or the perceived possibility of credit difficulties or insolvency, of one or more larger or visible market participants could also result in market-wide credit difficulties or other market disruptions.
Execution Access is our introducing broker which operates the trading platform for our Fixed Income business to trade in U.S. Treasury securities. Execution Access has a clearing arrangement with ICBC. As of December 31, 2020, we have contributed $13 million of clearing deposits to ICBC in connection with this clearing arrangement. These deposits are recorded in other current assets in our Consolidated Balance Sheets. Some of the trading activity in Execution Access is cleared by ICBC through the Fixed Income Clearing Corporation, with ICBC acting as agent. Execution Access assumes the counterparty risk of clients that do not clear through the Fixed Income Clearing Corporation. Counterparty risk of clients exists for Execution Access between the trade date and settlement date of the individual transactions, which is at least one business day (or more, if specified by the U.S. Treasury issuance calendar). Counterparties that do not clear through the Fixed Income Clearing Corporation are subject to a credit due diligence process and may be required to post collateral, provide principal letters, or provide other forms of credit enhancement to Execution Access for the purpose of mitigating counterparty risk. Daily position trading limits are also enforced for such counterparties.
We have credit risk related to transaction and subscription-based revenues that are billed to customers on a monthly or quarterly basis, in arrears. Our potential exposure to credit losses on these transactions is represented by the receivable balances in our Consolidated Balance Sheets. We review and evaluate changes in the status of our counterparties’ creditworthiness. Credit losses such as those described above could adversely affect our consolidated financial position and results of operations.
On January 1, 2020, we adopted ASU 2016-13. “See “Receivables, net - Measurement of Credit Losses on
54

Financial Instruments,” of Note 2, “Summary of Significant Accounting Policies,” to the consolidated financial statements for further discussion. This ASU changes the impairment model for certain financial instruments. The new model is a forward looking expected loss model and applies to financial assets subject to credit losses and measured at amortized cost and certain off-balance sheet credit exposures. This includes loans, held-to-maturity debt securities, loan commitments, financial guarantees and trade receivables.
We also are exposed to credit risk through our clearing operations with Nasdaq Clearing. See Note 15, “Clearing Operations,” to the consolidated financial statements for further discussion. Our clearinghouse holds material amounts of clearing member cash deposits which are held or invested primarily to provide security of capital while minimizing credit, market and liquidity risks. While we seek to achieve a reasonable rate of return, we are primarily concerned with preservation of capital and managing the risks associated with these deposits. As the clearinghouse may pass on interest revenues (minus costs) to the members, this could include negative or reduced yield due to market conditions. The following is a summary of the risks associated with these deposits and how these risks are mitigated.
• Credit Risk. When the clearinghouse has the ability to hold cash collateral at a central bank, the clearinghouse utilizes its access to the central bank system to minimize credit risk exposures. When funds are not held at a central bank, we seek to substantially mitigate credit risk by ensuring that investments are primarily placed in large, highly rated financial institutions, highly rated government debt instruments and other creditworthy counterparties.
• Liquidity Risk. Liquidity risk is the risk a clearinghouse may not be able to meet its payment obligations in the right currency, in the right place and the right time. To mitigate this risk, the clearinghouse monitors liquidity requirements closely and maintains funds and assets in a manner which minimizes the risk of loss or delay in the access by the clearinghouse to such funds and assets. For example, holding funds with a central bank where possible or investing in highly liquid government debt instruments serves to reduce liquidity risks.
• Interest Rate Risk. Interest rate risk is the risk that interest rates rise causing the value of purchased securities to decline. If we were required to sell securities prior to maturity, and interest rates had risen, the sale of the securities might be made at a loss relative to the latest market price. Our clearinghouse seeks to manage this risk by making short term investments of members' cash deposits. In addition, the clearinghouse investment guidelines allow for direct purchases or repurchase agreements with short dated maturities of high quality sovereign debt (for example, European government and U.S. Treasury securities), central bank certificates and supranational debt instruments.
• Security Issuer Risk. Security issuer risk is the risk that an issuer of a security defaults on its payment when the security matures. This risk is mitigated by limiting allowable investments and collateral under reverse repurchase agreements to high quality sovereign, government agency or supranational debt instruments.
Critical Accounting Policies and Estimates
The preparation of financial statements and related disclosures in conformity with U.S. GAAP requires management to make judgments, assumptions, and estimates that affect the amounts reported in the consolidated financial statements and accompanying notes. Note 2, “Summary of Significant Accounting Policies,” to the consolidated financial statements describes the significant accounting policies and methods used in the preparation of the consolidated financial statements. The accounting policies described below are significantly affected by critical accounting estimates. Such accounting policies require significant judgments, assumptions, and estimates used in the preparation of the consolidated financial statements, and actual results could differ materially from the amounts reported based on these policies.
Revenue Recognition
Market Technology Revenues
We enter into long-term contracts with customers to develop customized technology solutions, license the right to use software and provide support and other services to our customers which results in these contracts containing multiple performance obligations. We allocate the contract transaction price to each performance obligation using our best estimate of the standalone selling price of each distinct good or service in the contract. In instances where standalone selling price is not directly observable, such as when we do not sell the product or service separately, we determine the standalone selling price predominantly through an expected cost plus a margin approach.
We generally recognize revenue over time as our customers simultaneously receive and consume the benefits provided by our performance because our customer controls the asset for which we are creating, our performance does not create an asset with alternative use, and we have a right to payment for performance completed to date. For these services, we recognize revenue over time using costs incurred to date relative to total estimated costs at completion to measure progress toward satisfying our performance obligation. Incurred costs represent work performed, which corresponds with, and thereby depicts, the transfer of control to the customer.
Accounting for our long-term contracts requires judgment relative to assessing risks and their impact on the estimate of revenues and costs. Our estimates are impacted by factors such as the potential for schedule and technical issues, productivity, the complexity of work performed, and logistical challenges due to the effects of COVID-19. Revenue and cost estimates for our long-term contracts are
55

reviewed and reassessed at least quarterly. When adjustments in estimated total contract costs are required, any changes in the estimated revenues from prior estimates are recognized in the current period for the effect of such change. If estimates of total costs to be incurred on a contract exceed estimates of total revenues, a provision for the entire estimated loss on the contract is recorded in the period in which the loss is determined. During the fourth quarter, as part of our regular review of significant implementation projects, we refined and revised our plans relating to a large-scale post-trade clearing implementation project for a specific client. At that point it became probable that we would incur a loss over the remainder of that particular project, in part due to the logistical implications of COVID-19. As a result, we recorded a $25 million provision for the estimated loss in general, administrative and other expense in our Consolidated Statements of Income and is included in other current and other non-current liabilities in our Consolidated Balance Sheets.
Due to the significance of judgment in the estimation process, as discussed above, changes in assumptions and estimates may adversely or positively affect financial performance in future periods.
For further discussion related to recognition of these fees, see “Revenue From Contracts with Customers - Revenue Recognition - Market Technology,” of Note 2, “Summary of Significant Accounting Policies,” to the consolidated financial statements.
Goodwill and Related Impairment
Goodwill represents the excess of purchase price over the value assigned to the net assets, including identifiable intangible assets, of a business acquired. Goodwill is allocated to our reporting units based on the assignment of the fair values of each reporting unit of the acquired company. We test goodwill for impairment at the reporting unit level annually, or in interim periods if certain events occur indicating that the carrying amount may be impaired, such as changes in the business climate, poor indicators of operating performance or the sale or disposition of a significant portion of a reporting unit. For purposes of performing our goodwill impairment test, our five reporting units are the Market Services segment, the two businesses comprising the Corporate Platforms segment: Listing Services and IR & ESG Services, the Investment Intelligence segment, and the Market Technology segment. We test for impairment during the fourth quarter of our fiscal year using an October 1 measurement date. When testing goodwill for impairment, we have the option of first performing a qualitative assessment to determine whether it is more likely than not that the fair value of a reporting unit is less than its carrying amount as the basis to determine if it is necessary to perform a quantitative goodwill impairment test. In performing a qualitative assessment, we consider the extent to which unfavorable events or circumstances identified, such as changes in economic conditions, industry and market conditions or company specific events, could affect the
comparison of the reporting unit’s fair value with its carrying amount. If we choose not to complete a qualitative assessment for a given reporting unit, or if the initial assessment indicates that it is more likely than not that the carrying amount of a reporting unit exceeds its estimated fair value, a quantitative test is required.
When assessing goodwill for impairment, our decision to perform a qualitative impairment assessment for a reporting unit in a given year is influenced by a number of factors, including but not limited to, the size of the reporting unit’s goodwill, the significance of the excess of the reporting unit’s estimated fair value over its carrying amount at the last quantitative assessment date, and the amount of time in between quantitative fair value assessments.
On January 1, 2020, we adopted ASU 2017-04, “Simplifying the Test for Goodwill Impairment,” and as a result, when performing the quantitative goodwill impairment test, we compare the fair value of each reporting unit with its carrying amount. The fair value of each reporting unit is estimated using a combination of a discounted cash flow valuation, which incorporates assumptions regarding future growth rates, terminal values, and discount rates, as well as guideline public company valuations, incorporating relevant trading multiples of comparable companies and other factors. The estimates and assumptions used consider historical performance and are consistent with the assumptions used in determining future profit plans for each reporting unit, which are approved by our board of directors. If the reporting unit’s fair value exceeds its estimated carrying amount, goodwill is not impaired. If the carrying amount exceeds the fair value of the reporting unit, an impairment charge is recognized in an amount equal to the difference, limited to the total amount of goodwill allocated to that reporting unit.
The following table presents the balances of goodwill for our reportable segments at the time of our 2020 annual impairment test:
October 1, 2020
(in millions)
Market Services $ 3,391 Corporate Platforms 465 Investment Intelligence 2,457 Market Technology 287 $ 6,600
In 2020, we performed a quantitative test for our annual impairment test for goodwill for all reporting units based on our policy of performing a quantitative impairment test every three years, even if qualitative considerations do not indicate the fair value of a reporting unit is less than its carrying amount. The periodic and timely calculation of the quantitative assessment provides better support for our qualitative assessment. In conducting the quantitative assessment, we determined that fair value sufficiently exceeded the carrying amount for each of our reporting units. As a result, no goodwill impairment was recorded in 2020. In 2019 and 2018, we performed a qualitative assessment and
56
no goodwill impairment was recorded.
Although we believe our estimates of fair value are reasonable, the determination of certain valuation inputs is subject to management’s judgment. Changes in these inputs could materially affect the results of our impairment review. If our forecasts of cash flows or other key inputs are negatively revised in the future, the estimated fair value of each reporting unit would be adversely impacted, potentially leading to an impairment in the future that could materially affect our operating results.
Subsequent to our annual impairment test, no indications of impairment were identified.
Indefinite-Lived Intangible Assets and Related Impairment
Intangible assets deemed to have indefinite useful lives, primarily exchange and clearing registrations, are not amortized but instead are tested for impairment at least annually and more frequently whenever events or changes in circumstances indicate that the fair value of the asset may be less than its carrying amount. Similar to goodwill impairment testing, we test for impairment of indefinite-lived intangible assets during the fourth quarter of our fiscal year using an October 1 measurement date and may first perform a qualitative assessment, considering similar factors as discussed above in the goodwill impairment discussion, to determine if it is more likely than not that the fair value of the indefinite-lived intangible asset is less than its carrying amount. If we elect to perform or are required to perform a quantitative assessment, the test consists of a comparison of the fair value of the indefinite-lived intangible asset to its carrying amount as of the impairment testing date. If the carrying amount of the indefinite-lived intangible asset exceeds its fair value, an impairment charge is recorded for the difference. The fair value of indefinite-lived intangible assets is primarily determined on the basis of estimated discounted value, using the Greenfield Approach for exchange and clearing registrations and licenses and the relief from royalty approach or excess earnings approach for trade names, both of which incorporate assumptions regarding future revenue projections and discount rates. During our annual indefinite-lived intangible asset impairment test during the fourth quarter of 2020, we performed a quantitative test based on our policy of performing a quantitative impairment test every three years as discussed above in the goodwill impairment discussion.
There were no indefinite-lived intangible asset impairment charges in 2020 and there were no impairment charges recorded in 2019 and 2018.
Subsequent to our annual indefinite-lived impairment test, no indications of impairment were identified.
Other Long-Lived Assets and Related Impairment
We review our other long-lived assets, such as finite-lived intangible assets, equity method investments, equity securities, property and equipment, and operating lease assets
for potential impairment when there is evidence that events or changes in circumstances indicate that the carrying amount of an asset may not be recoverable. The carrying amount of an asset is not recoverable if it exceeds the sum of the undiscounted cash flows expected to result from the use and eventual disposition of the asset. Fair value of finite-lived intangible assets and property and equipment is based on various valuation techniques. We evaluate our equity method investments for other-than-temporary declines in value by considering a variety of factors such as the earnings capacity of the investment and the fair value of the investment compared to its carrying amount. In addition, for investments where the market value is readily determinable, we consider the underlying stock price as an additional factor. For equity securities, when assessing investments in private companies for impairment, we consider such factors as, among others, the share price from the investee's latest financing round, the performance of the investee in relation to its own operating targets, the investee's liquidity and cash position, and general market conditions. Any required impairment loss is measured as the amount by which the carrying amount of the asset exceeds its fair value and is recorded as a reduction in the carrying amount of the related asset and a charge to operating results.
We recorded pre-tax, non-cash property and equipment asset impairment charges of $4 million in 2020 and $24 million in 2019. The asset impairment charges in 2020 and 2019 primarily related to capitalized software that was retired and are included in restructuring charges in the Consolidated Statements of Income for 2020 and 2019. See Note 20, “Restructuring Charges,” to the consolidated financial statements for a discussion of our 2019 restructuring plan. For the year ended December 31, 2018, there were no material property and equipment asset impairment charges.
No material impairments were recorded to reduce the carrying value of our other long-lived assets during 2020, 2019 or 2018.
Income Taxes
Estimates and judgments are required in the calculation of certain tax liabilities and in the determination of the recoverability of certain deferred tax assets, which arise from net operating loss carryforwards, tax credit carryforwards and temporary differences between the tax and financial statement recognition of revenue and expense. Our deferred tax assets are reduced by a valuation allowance if it is more likely than not that some portion or all of the recorded deferred tax assets will not be realized in future periods. Management is required to determine whether a tax position is more likely than not to be sustained upon examination, including resolution of any related appeals or litigation processes, based on the technical merits of the position. Once it is determined that a position meets the recognition thresholds, the position is measured to determine the amount of benefit to be recognized in the consolidated financial statements.
In assessing the need for a valuation allowance, we consider
57

all available evidence including past operating results, the existence of cumulative losses in the most recent fiscal years, estimates of future taxable income and the feasibility of tax planning strategies. In the event that we change our determination as to the amount of deferred tax assets that can be realized, we will adjust our valuation allowance with a corresponding impact to the provision for income taxes in the period in which such determination is made.
In addition, the calculation of our tax liabilities involves uncertainties in the application of tax regulations in the U.S. and other tax jurisdictions. We recognize potential liabilities for anticipated tax audit issues in such jurisdictions based on our estimate of whether, and the extent to which, additional taxes and interest may be due. While we believe that our tax liabilities reflect the probable outcome of identified tax uncertainties, it is reasonably possible that the ultimate resolution of any tax matter may be greater or less than the amount accrued. If events occur and the payment of these amounts ultimately proves unnecessary, the reversal of the liabilities would result in tax benefits being recognized in the period when we determine the liabilities are no longer necessary. If our estimate of tax liabilities proves to be less than the ultimate assessment, a further charge to expense would result.
Recent Accounting Pronouncements Not Yet Adopted
We have considered all recent accounting pronouncements and have concluded that no accounting pronouncements that have not yet been adopted would have a material impact on our financial position or results of operations.
Item 7A. Quantitative and Qualitative Disclosures About Market Risk
Information about quantitative and qualitative disclosures about market risk is incorporated herein by reference from “Item 7. Management’s Discussion and Analysis of Financial Condition and Results of Operations - Quantitative and Qualitative Disclosures About Market Risk.”
Item 8. Financial Statements and Supplementary Data
Nasdaq’s consolidated financial statements, including Consolidated Balance Sheets as of December 31, 2020 and 2019, Consolidated Statements of Income for the years ended December 31, 2020, 2019 and 2018, Consolidated Statements of Comprehensive Income for the years ended December 31, 2020, 2019 and 2018, Consolidated Statements of Changes in Stockholders' Equity for the years ended December 31, 2020, 2019 and 2018, Consolidated Statements of Cash Flows for the years ended December 31, 2020, 2019 and 2018 and notes to our consolidated financial statements, together with a report thereon of Ernst & Young LLP, dated February 23, 2021, are attached hereto as pages F-1 through F-46 and incorporated by reference herein.
Summarized Quarterly Financial Data (Unaudited)
As a result of our early adoption, in December 2020, of SEC Final Rule Release No. 33-10890, “Management's Discussion and Analysis, Selected Financial Data, and Supplementary
Financial Information,” this data has been omitted.
Item 9. Changes in and Disagreements with Accountants on Accounting and Financial Disclosure
None.
Item 9A. Controls and Procedures
Disclosure controls and procedures. Nasdaq’s management, with the participation of Nasdaq’s President and Chief Executive Officer, and Executive Vice President, Corporate Strategy and Chief Financial Officer, has evaluated the effectiveness of Nasdaq’s disclosure controls and procedures (as defined in Rule 13a-15(e) and Rule 15d-15(e) under the Exchange Act) as of the end of the period covered by this report. Based upon that evaluation, Nasdaq’s President and Chief Executive Officer and Executive Vice President, Corporate Strategy and Chief Financial Officer, have concluded that, as of the end of such period, Nasdaq’s disclosure controls and procedures are effective.
Changes in internal control over financial reporting. There have been no changes in Nasdaq’s internal control over financial reporting (as defined in Rule 13a-15(f) and Rule 15d-15(f) under the Exchange Act) that occurred during the quarter ended December 31, 2020 that have materially affected, or are reasonably likely to materially affect, Nasdaq’s internal control over financial reporting.
58
Management’s Report on Internal Control Over Financial Reporting
Management is responsible for the preparation and integrity of the consolidated financial statements appearing in the reports that we file with the SEC. The consolidated financial statements were prepared in conformity with U.S. generally accepted accounting principles and include amounts based on management’s estimates and judgments.
Management is also responsible for establishing and maintaining adequate internal control over Nasdaq’s financial reporting. Although there are inherent limitations in the effectiveness of any system of internal control over financial reporting, we maintain a system of internal control that is designed to provide reasonable assurance as to the fair and reliable preparation and presentation of the consolidated financial statements, as well as to safeguard assets from unauthorized use or disposition that could have a material effect on the financial statements.
Our management assessed the effectiveness of our internal control over financial reporting as of December 31, 2020, based on criteria established in Internal Control—Integrated Framework issued by the Committee of Sponsoring Organizations of the Treadway Commission (COSO) (2013 framework). This evaluation included review of the documentation of controls, evaluation of the design effectiveness of controls, testing of the operating effectiveness of controls and a conclusion on this evaluation. Based on its assessment, our management believes that, as of December 31, 2020, our internal control over financial reporting is effective.
Ernst & Young LLP, an independent registered public accounting firm, has issued an attestation report on Nasdaq’s internal control over financial reporting, which is included herein.
59

Report of Independent Registered Public Accounting Firm
To the Shareholders and the Board of Directors of Nasdaq, Inc.
Opinion on Internal Control over Financial ReportingWe have audited Nasdaq, Inc.’s internal control over financial reporting as of December 31, 2020, based on criteria established in Internal Control—Integrated Framework issued by the Committee of Sponsoring Organizations of the Treadway Commission (2013 framework) (the COSO criteria). In our opinion, Nasdaq, Inc. (the Company) maintained, in all material respects, effective internal control over financial reporting as of December 31, 2020, based on the COSO criteria.
We also have audited, in accordance with the standards of the Public Company Accounting Oversight Board (United States) (PCAOB), the consolidated balance sheets of the Company as of December 31, 2020 and 2019, and the related consolidated statements of income, comprehensive income, changes in stockholders’ equity and cash flows for each of the three years in the period ended December 31, 2020, and the related notes and our report dated February 23, 2021 expressed an unqualified opinion thereon.
Basis for OpinionThe Company’s management is responsible for maintaining effective internal control over financial reporting and for its assessment of the effectiveness of internal control over financial reporting included in the accompanying Management’s Report on Internal Control Over Financial Reporting. Our responsibility is to express an opinion on the Company’s internal control over financial reporting based on our audit. We are a public accounting firm registered with the PCAOB and are required to be independent with respect to the Company in accordance with the U.S. federal securities laws and the applicable rules and regulations of the Securities and Exchange Commission and the PCAOB.
We conducted our audit in accordance with the standards of the PCAOB. Those standards require that we plan and perform the audit to obtain reasonable assurance about whether effective internal control over financial reporting was maintained in all material respects.
Our audit included obtaining an understanding of internal control over financial reporting, assessing the risk that a material weakness exists, testing and evaluating the design and operating effectiveness of internal control based on the assessed risk, and performing such other procedures as we considered necessary in the circumstances. We believe that our audit provides a reasonable basis for our opinion.
Definition and Limitations of Internal Control Over Financial Reporting A company’s internal control over financial reporting is a process designed to provide reasonable assurance regarding the reliability of financial reporting and the preparation of financial statements for external purposes in accordance with generally accepted accounting principles. A company’s internal control over financial reporting includes those policies and procedures that (1) pertain to the maintenance of records that, in reasonable detail, accurately and fairly reflect the transactions and dispositions of the assets of the company; (2) provide reasonable assurance that transactions are recorded as necessary to permit preparation of financial statements in accordance with generally accepted accounting principles, and that receipts and expenditures of the company are being made only in accordance with authorizations of management and directors of the company; and (3) provide reasonable assurance regarding prevention or timely detection of unauthorized acquisition, use, or disposition of the company’s assets that could have a material effect on the financial statements.
Because of its inherent limitations, internal control over financial reporting may not prevent or detect misstatements. Also, projections of any evaluation of effectiveness to future periods are subject to the risk that controls may become inadequate because of changes in conditions, or that the degree of compliance with the policies or procedures may deteriorate.
/s/ Ernst & Young LLP
New York, New YorkFebruary 23, 2021
60

Item 9B. Other Information
None.
PART III
Item 10. Directors, Executive Officers and Corporate Governance
Information about Nasdaq’s directors, as required by Item 401 of Regulation S-K, is incorporated by reference from the discussion under the caption “Board of Directors-Proposal 1: Election of Directors” in Nasdaq’s Proxy Statement. Information about Nasdaq’s executive officers, as required by Item 401 of Regulation S-K, is incorporated by reference from the discussion under the caption “Other Items-Executive Officers” in the Proxy Statement. Information about Section 16 reports, as required by Item 405 of Regulation S-K, is incorporated by reference from the discussion under the caption “Other Items-Delinquent Section 16(a) Reports” in the Proxy Statement. Information about Nasdaq’s code of ethics, as required by Item 406 of Regulation S-K, is incorporated by reference from the discussion under the caption “Our Ethical Culture” in the Proxy Statement. Information about Nasdaq’s nomination procedures, Audit & Risk Committee and Audit & Risk
Committee financial experts, as required by Items 407(c)(3), 407(d)(4) and 407(d)(5) of Regulation S-K, is incorporated by reference from the discussions under the headings “Board of Directors-Proposal 1: Election of Directors” and “Board of Directors-Board Committees” in the Proxy Statement.
Item 11. Executive Compensation
Information about Nasdaq’s director and executive compensation, as required by Items 402, 407(e)(4) and 407(e)(5) of Regulation S-K, is incorporated by reference from the discussions under the headings “Board of Directors-Director Compensation” and “Named Executive Officer Compensation” in the Proxy Statement.
Item 12. Security Ownership of Certain Beneficial Owners and Management and Related Stockholder Matters
Information about security ownership of certain beneficial owners and management, as required by Item 403 of Regulation S-K, is incorporated by reference from the discussion under the heading “Other Items-Security Ownership of Certain Beneficial Owners and Management” in the Proxy Statement.
* * * * * *
Equity Compensation Plan and ESPP Information
Nasdaq’s Equity Plan provides for the issuance of our equity securities to all employees and directors as part of their compensation plan, though employees in certain of our locations may be ineligible due to local securities laws and regulations.
In addition, in jurisdictions where participation in the ESPP is permitted, all our employees are eligible. Employees may purchase shares of our common stock at a 15% discount to the lesser of the closing price of our common stock on (i) the first trading day of the offering period or (ii) the last trading day of the offering period. Offering periods under the ESPP are six months in duration. As of December 31, 2020, over 99.0% of our employees are eligible to participate.
The Equity Plan and the ESPP have been previously approved by our stockholders. The following table sets forth information regarding outstanding options and shares reserved for future issuance under all of Nasdaq’s compensation plans as of December 31, 2020.
Plan Category
Number of sharesto be issued upon exercise
of outstanding options, warrants and rights(a)(1)
Weighted-average exercise price of
outstanding options, warrants and rights(b)
Number of shares remaining available
for future issuance under equity compensation plans
(excluding shares reflected in column(a))(c)
Equity compensation plans approved by stockholders 293,353 $ 63.22 14,270,858 (2)
Equity compensation plans not approved by stockholders — — —
Total 293,353 $ 63.22 14,270,858 (2) ____________(1) The amounts in this column include only the number of shares to be issued upon exercise of outstanding options, warrants
and rights. As of December 31, 2020, we also had 2,618,588 shares to be issued upon vesting of outstanding restricted stock and PSUs.
(2) This amount includes 9,837,094 shares of common stock that may be awarded pursuant to the Equity Plan and 4,433,764 shares of common stock that may be issued pursuant to the ESPP.
Item 13. Certain Relationships and Related Transactions, and Director Independence
Information about certain relationships and related transactions, as required by Item 404 of Regulation S-K, is incorporated herein by reference from the discussion under the heading “Other Items-Certain Relationships and Related Transactions” in the Proxy Statement. Information about director independence, as required by Item 407(a) of Regulation S-K, is incorporated
61
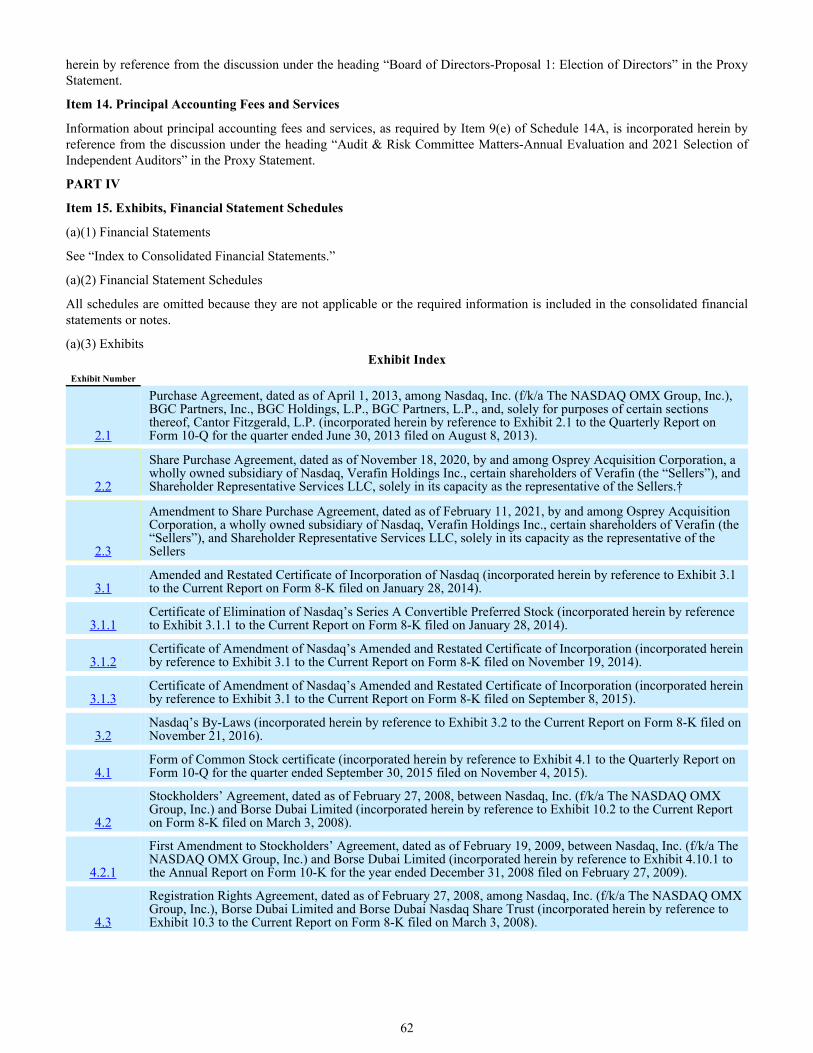
herein by reference from the discussion under the heading “Board of Directors-Proposal 1: Election of Directors” in the Proxy Statement.
Item 14. Principal Accounting Fees and Services
Information about principal accounting fees and services, as required by Item 9(e) of Schedule 14A, is incorporated herein by reference from the discussion under the heading “Audit & Risk Committee Matters-Annual Evaluation and 2021 Selection of Independent Auditors” in the Proxy Statement.
PART IV
Item 15. Exhibits, Financial Statement Schedules
(a)(1) Financial Statements
See “Index to Consolidated Financial Statements.”
(a)(2) Financial Statement Schedules
All schedules are omitted because they are not applicable or the required information is included in the consolidated financial statements or notes.
(a)(3) ExhibitsExhibit Index
Exhibit Number
2.1
Purchase Agreement, dated as of April 1, 2013, among Nasdaq, Inc. (f/k/a The NASDAQ OMX Group, Inc.), BGC Partners, Inc., BGC Holdings, L.P., BGC Partners, L.P., and, solely for purposes of certain sections thereof, Cantor Fitzgerald, L.P. (incorporated herein by reference to Exhibit 2.1 to the Quarterly Report on Form 10-Q for the quarter ended June 30, 2013 filed on August 8, 2013).
2.2
Share Purchase Agreement, dated as of November 18, 2020, by and among Osprey Acquisition Corporation, a wholly owned subsidiary of Nasdaq, Verafin Holdings Inc., certain shareholders of Verafin (the “Sellers”), and Shareholder Representative Services LLC, solely in its capacity as the representative of the Sellers.†
2.3
Amendment to Share Purchase Agreement, dated as of February 11, 2021, by and among Osprey Acquisition Corporation, a wholly owned subsidiary of Nasdaq, Verafin Holdings Inc., certain shareholders of Verafin (the “Sellers”), and Shareholder Representative Services LLC, solely in its capacity as the representative of the Sellers
3.1 Amended and Restated Certificate of Incorporation of Nasdaq (incorporated herein by reference to Exhibit 3.1 to the Current Report on Form 8-K filed on January 28, 2014).
3.1.1 Certificate of Elimination of Nasdaq’s Series A Convertible Preferred Stock (incorporated herein by reference to Exhibit 3.1.1 to the Current Report on Form 8-K filed on January 28, 2014).
3.1.2 Certificate of Amendment of Nasdaq’s Amended and Restated Certificate of Incorporation (incorporated herein by reference to Exhibit 3.1 to the Current Report on Form 8-K filed on November 19, 2014).
3.1.3 Certificate of Amendment of Nasdaq’s Amended and Restated Certificate of Incorporation (incorporated herein by reference to Exhibit 3.1 to the Current Report on Form 8-K filed on September 8, 2015).
3.2 Nasdaq’s By-Laws (incorporated herein by reference to Exhibit 3.2 to the Current Report on Form 8-K filed on November 21, 2016).
4.1 Form of Common Stock certificate (incorporated herein by reference to Exhibit 4.1 to the Quarterly Report on Form 10-Q for the quarter ended September 30, 2015 filed on November 4, 2015).
4.2
Stockholders’ Agreement, dated as of February 27, 2008, between Nasdaq, Inc. (f/k/a The NASDAQ OMX Group, Inc.) and Borse Dubai Limited (incorporated herein by reference to Exhibit 10.2 to the Current Report on Form 8-K filed on March 3, 2008).
4.2.1
First Amendment to Stockholders’ Agreement, dated as of February 19, 2009, between Nasdaq, Inc. (f/k/a The NASDAQ OMX Group, Inc.) and Borse Dubai Limited (incorporated herein by reference to Exhibit 4.10.1 to the Annual Report on Form 10-K for the year ended December 31, 2008 filed on February 27, 2009).
4.3
Registration Rights Agreement, dated as of February 27, 2008, among Nasdaq, Inc. (f/k/a The NASDAQ OMX Group, Inc.), Borse Dubai Limited and Borse Dubai Nasdaq Share Trust (incorporated herein by reference to Exhibit 10.3 to the Current Report on Form 8-K filed on March 3, 2008).
62

4.3.1
First Amendment to Registration Rights Agreement, dated as of February 19, 2009, among Nasdaq, Inc. (f/k/a The NASDAQ OMX Group, Inc.), Borse Dubai Limited and Borse Dubai Nasdaq Share Trust (incorporated herein by reference to Exhibit 4.11.1 to the Annual Report on Form 10-K for the year ended December 31, 2008 filed on February 27, 2009).
4.4
Stockholders’ Agreement, dated as of December 16, 2010, between Nasdaq, Inc. (f/k/a The NASDAQ OMX Group, Inc.) and Investor AB (incorporated herein by reference to Exhibit 4.12 to the Annual Report on Form 10-K for the year ended December 31, 2010 filed on February 24, 2011).
4.5
Indenture, dated as of June 7, 2013, between Nasdaq, Inc. (f/k/a The NASDAQ OMX Group, Inc.) and Wells Fargo Bank, National Association, as Trustee (incorporated herein by reference to Exhibit 4.1 to the Current Report on Form 8-K filed on June 10, 2013).
4.6
First Supplemental Indenture, dated as of June 7, 2013, among Nasdaq, Inc. (f/k/a The NASDAQ OMX Group, Inc.), Wells Fargo Bank, National Association, as Trustee, Deutsche Bank AG, London Branch, as paying agent, and Deutsche Bank Luxembourg S.A., as registrar and transfer agent (incorporated herein by reference to Exhibit 4.2 to the Current Report on Form 8-K filed on June 10, 2013).
4.7
Second Supplemental Indenture, dated as of May 29, 2014, among Nasdaq, Inc. (f/k/a The NASDAQ OMX Group, Inc.) and Wells Fargo Bank, National Association, as Trustee (incorporated herein by reference to Exhibit 4.1 to the Current Report on Form 8-K filed on May 30, 2014).
4.8
Third Supplemental Indenture, dated as of May 20, 2016, among Nasdaq, Inc., Wells Fargo Bank, National Association, as Trustee, and HSBC Bank USA, National Association, as paying agent and as registrar and transfer agent (incorporated herein by reference to the Current Report on Form 8-K filed on May 23, 2016).
4.9
Fifth Supplemental Indenture, dated as of September 22, 2017, among Nasdaq, Inc. and Wells Fargo Bank, National Association, as Trustee (incorporated herein by reference to Exhibit 4.1 to the Current Report on Form 8-K filed on September 22, 2017).
4.10
Sixth Supplemental Indenture, dated as of April 1, 2019, among Nasdaq, Inc., Wells Fargo Bank, National Association, as Trustee, and HSBC Bank USA, National Association, as paying agent and as registrar and transfer agent (incorporated by reference to Exhibit 4.2 to the Form 8-A filed on April 1, 2019).
4.11
Seventh Supplemental Indenture, dated February 13, 2020, among Nasdaq, Inc., Wells Fargo Bank, National Association, as Trustee, and HSBC Bank USA, National Association, as paying agent and as registrar and transfer agent (incorporated herein by reference to Exhibit 4.2 to the Company’s Form 8-A filed on February 13, 2020).
4.12
Eighth Supplemental Indenture, dated April 28, 2020, by and between Nasdaq, Inc. and Wells Fargo Bank, National Association, as Trustee (incorporated herein by reference to Exhibit 4.2 to the Current Report on Form 8-K filed on April 28, 2020).
4.13
Ninth Supplemental Indenture, dated December 21, 2020, by and between Nasdaq, Inc. and Wells Fargo Bank, National Association, as Trustee (incorporated herein by reference to Exhibit 4.2 to the Current Report on Form 8-K filed on December 21, 2020).
4.14
Tenth Supplemental Indenture, dated December 21, 2020, by and between Nasdaq, Inc. and Wells Fargo Bank, National Association, as Trustee (incorporated herein by reference to Exhibit 4.3 to the Current Report on Form 8-K filed on December 21, 2020).
4.15
Eleventh Supplemental Indenture, dated December 21, 2020, by and between Nasdaq, Inc. and Wells Fargo Bank, National Association, as Trustee (incorporated herein by reference to Exhibit 4.4 to the Current Report on Form 8-K filed on December 21, 2020).
4.16
Registration Rights Agreement, dated as of June 28, 2013, by and among Nasdaq, Inc. (f/k/a The NASDAQ OMX Group, Inc.), BGC Partners, Inc., BGC Holdings, L.P. and BGC Partners, L.P. (incorporated herein by reference to Exhibit 10.1 to the Current Report on Form 8-K filed on July 1, 2013).
4.17 Description of Securities.
10.1
Amended and Restated Board Compensation Policy, effective on May 19, 2020 (incorporated herein by reference to Exhibit 10.1 to the Quarterly Report on Form 10-Q for the quarter ended June 30, 2020 filed on August 5, 2020).*
10.2 Nasdaq Executive Corporate Incentive Plan, effective as of January 1, 2015 (incorporated herein by reference to Exhibit 10.1 to the Current Report on Form 8-K filed on May 11, 2015).*
10.3Nasdaq, Inc. Equity Incentive Plan (as amended and restated as of April 24, 2018) (incorporated herein by reference to Exhibit 10.1 to the Form S-8 filed on May 25, 2018).*
10.4 Form of Nasdaq Non-Qualified Stock Option Award Certificate (incorporated herein by reference to Exhibit 10.3 to the Annual Report on Form 10-K for the year ended December 31, 2010 filed on February 24, 2011).*
63

10.5
Form of Nasdaq Restricted Stock Unit Award Certificate (employees) (incorporated herein by reference to Exhibit 10.2 to the Quarterly Report on Form 10-Q for the quarter ended June 30, 2020 filed on August 5, 2020).*
10.6
Form of Nasdaq Restricted Stock Unit Award Certificate (directors) (incorporated herein by reference to Exhibit 10.3 to the Quarterly Report on Form 10-Q for the quarter ended June 30, 2020 filed on August 5, 2020).*
10.7Form of Nasdaq One-Year Performance Share Unit Agreement (incorporated herein by reference to Exhibit 10.4 to the Quarterly Report on Form 10-Q for the quarter ended June 30, 2019 filed on August 5, 2019).*
10.8Form of Nasdaq Three-Year Performance Share Unit Agreement (incorporated herein by reference to Exhibit 10.4 to the Quarterly Report on Form 10-Q for the quarter ended June 30, 2020 filed on August 5, 2020).*
10.9Form of Nasdaq Continuing Obligations Agreement (incorporated herein by reference to Exhibit 10.1 to the Quarterly Report on Form 10-Q for the quarter ended March 31, 2017 filed on May 10, 2017).*
10.10
Amended and Restated Supplemental Executive Retirement Plan, dated as of December 17, 2008 (incorporated herein by reference to Exhibit 10.6 to the Annual Report on Form 10-K for the year ended December 31, 2008 filed on February 27, 2009).*
10.10.1
Amendment No. 1 to Amended and Restated Supplemental Executive Retirement Plan, effective as of December 31, 2008 (incorporated herein by reference to Exhibit 10.6.1 to the Annual Report on Form 10-K for the year ended December 31, 2008 filed on February 27, 2009).*
10.11
Nasdaq Supplemental Employer Retirement Contribution Plan, dated as of December 17, 2008 (incorporated herein by reference to Exhibit 10.7 to the Annual Report on Form 10-K for the year ended December 31, 2008 filed on February 27, 2009).*
10.12
Employment Agreement between Nasdaq and Adena Friedman, made and entered into on November 14, 2016 and effective as of January 1, 2017 (incorporated herein by reference to Exhibit 10.10 to the Annual Report on Form 10-K for the year ended December 31, 2016 filed on March 1, 2017).*
10.13
Nonqualified Stock Option Award Certificate to Adena T. Friedman from Nasdaq, Inc. in connection with grant made on January 3, 2017 (incorporated herein by reference to Exhibit 10.1 to the Quarterly Report on Form 10-Q for the quarter ended September 30, 2017 filed on November 7, 2017).*
10.14
Employment Offer Letter, dated as of May 10, 2016, between Nasdaq, Inc. and Michael Ptasznik (incorporated herein by reference to Exhibit 10.2 to the Quarterly Report on Form 10-Q for the quarter ended March 31, 2017 filed on May 10, 2017).*
10.15Retirement Agreement and General Release of Claims by and between Nasdaq, Inc. and Michael Ptasznik, dated October 21, 2020.*
10.16
Employment Agreement between Nasdaq and Bradley J. Peterson, dated August 1, 2016 (incorporated herein by reference to Exhibit 10.1 to the Quarterly Report on Form 10-Q for the quarter ended September 30, 2016 filed on November 8, 2016).*
10.17 Employment Agreement by and between Nasdaq, Inc. and Bradley J. Peterson, dated October 1, 2020.*
10.18
Employment Offer Letter, dated as of April 30, 2019, between Nasdaq, Inc. and Lauren B. Dillard (incorporated herein by reference to Exhibit 10.6 to the Quarterly Report on Form 10-Q for the quarter ended June 30, 2019 filed on August 5, 2019).*
10.19
Nasdaq Change in Control Severance Plan for Executive Vice Presidents and Senior Vice Presidents, effective November 26, 2013 (incorporated herein by reference to Exhibit 10.1 to the Current Report on Form 8-K filed on November 29, 2013).*
10.20
Credit Agreement, dated as of April 25, 2017, among Nasdaq, Inc., the various lenders from time to time party thereto, Bank of America, N.A., as administrative agent and an issuing bank, and the other financial institutions party thereto (incorporated herein by reference to Exhibit 10.1 to the Current Report on Form 8-K filed on April 26, 2017).
10.21
Amendment No. 1 to Credit Agreement, dated as of December 1, 2020, by and among Nasdaq, Inc., the lenders party thereto, and Bank of America, N.A., as administrative agent (incorporated herein by reference to Exhibit 10.1 to the Current Report on Form 8-K filed on December 3, 2020).
10.22
Credit Agreement, dated as of December 21, 2020, among Nasdaq, Inc., the various lenders from time to time party thereto and, Bank of America, N.A., as administrative agent and issuing bank (incorporated herein by reference to Exhibit 10.1 to the Current Report on Form 8-K filed on December 21, 2020).
10.23 Form of Commercial Paper Dealer Agreement between Nasdaq, Inc., as Issuer, and the Dealer party thereto (incorporated herein by reference to Exhibit 10.3 to the Current Report on Form 8-K filed on April 26, 2017).
64

11 Statement regarding computation of per share earnings (incorporated herein by reference from Note 13 to the consolidated financial statements under Part II, Item 8 of this Form 10-K).
21.1 List of all subsidiaries. 23.1 Consent of Ernst & Young LLP. 24.1 Powers of Attorney.
31.1Certification of President and Chief Executive Officer pursuant to Section 302 of the Sarbanes-Oxley Act of 2002 (“Sarbanes-Oxley”).
31.2Certification of Executive Vice President, Corporate Strategy and Chief Financial Officer pursuant to Section 302 of Sarbanes-Oxley.
32.1 Certifications Pursuant to 18 U.S.C. Section 1350, as adopted pursuant to Section 906 of Sarbanes-Oxley.
101
The following materials from the Nasdaq, Inc. Annual Report on Form 10-K for the year ended December 31, 2020, formatted in iXBRL (Inline eXtensible Business Reporting Language): (i) Consolidated Balance Sheets as of December 31, 2020 and December 31, 2019; (ii) Consolidated Statements of Income for the years ended December 31, 2020, 2019 and 2018; (iii) Consolidated Statements of Comprehensive Income for the years ended December 31, 2020, 2019 and 2018; (iv) Consolidated Statements of Changes in Stockholders' Equity for the years ended December 31, 2020, 2019 and 2018; (v) Consolidated Statements of Cash Flows for the years ended December 31, 2020, 2019 and 2018; and (vi) notes to consolidated financial statements.
104 Cover Page Interactive Data File, formatted in iXBRL and contained in Exhibit 101.____________* Management contract or compensatory plan or arrangement.
† Schedules have been omitted pursuant to Item 601(b)(2) of Regulation S-K.
(b) Exhibits:
See Item 15(a)(3) above.
(c) Financial Statement Schedules:
All schedules are omitted because they are not applicable or the required information is included in the consolidated financial statements or notes.
Item 16. Form 10-K Summary
None.
65
SIGNATURESPursuant to the requirements of Section 13 or 15(d) of the Securities Exchange Act of 1934, the registrant has duly caused this report to be signed on its behalf by the undersigned, thereunto duly authorized, on February 23, 2021.
Nasdaq, Inc. (Registrant)
By: /s/ Adena T. FriedmanName: Adena T. Friedman
Title: President and Chief Executive Officer
Pursuant to the requirements of the Securities Exchange Act of 1934, this report has been signed below by the following persons on behalf of the registrant and in the capacities indicated as of February 23, 2021.
Name Title/s/ Adena T. Friedman President and Chief Executive OfficerAdena T. Friedman (Principal Executive Officer)
/s/ Michael Ptasznik Executive Vice President, Corporate Strategy and Chief Financial OfficerMichael Ptasznik (Principal Financial Officer)
/s/ Ann M. Dennison Senior Vice President and ControllerAnn M. Dennison (Principal Accounting Officer)
* Chairman of the BoardMichael R. Splinter
* DirectorMelissa M. Arnoldi
* DirectorCharlene T. Begley
* DirectorSteven D. Black
* DirectorEssa Kazim
* DirectorThomas A. Kloet
* DirectorJohn D. Rainey
* DirectorJacob Wallenberg
* DirectorAlfred W. Zollar
* Pursuant to Power of AttorneyBy: /s/ John A. Zecca
John A. ZeccaAttorney-in-Fact
66

Nasdaq, Inc.
INDEX TO CONSOLIDATED FINANCIAL STATEMENTS
The following consolidated financial statements of Nasdaq, Inc. and its subsidiaries are presented herein on the page indicated:
Report of Independent Registered Public Accounting Firm F-2Consolidated Balance Sheets F-4Consolidated Statements of Income F-5Consolidated Statements of Comprehensive Income F-6Consolidated Statements of Changes in Stockholders' Equity F-7Consolidated Statements of Cash Flows F-8Notes to Consolidated Financial Statements F-9
F-1

Report of Independent Registered Public Accounting Firm To the Shareholders and the Board of Directors of Nasdaq, Inc. Opinion on the Financial StatementsWe have audited the accompanying consolidated balance sheets of Nasdaq, Inc. (the Company) as of December 31, 2020 and 2019, the related consolidated statements of income, comprehensive income, changes in stockholders’ equity and cash flows for each of the three years in the period ended December 31, 2020, and the related notes (collectively referred to as the “consolidated financial statements”). In our opinion, the consolidated financial statements present fairly, in all material respects, the financial position of the Company at December 31, 2020 and 2019, and the results of its operations and its cash flows for each of the three years in the period ended December 31, 2020, in conformity with U.S. generally accepted accounting principles. We also have audited, in accordance with the standards of the Public Company Accounting Oversight Board (United States) (PCAOB), the Company's internal control over financial reporting as of December 31, 2020, based on criteria established in Internal Control-Integrated Framework issued by the Committee of Sponsoring Organizations of the Treadway Commission (2013 framework), and our report dated February 23, 2021 expressed an unqualified opinion thereon.
Adoption of ASU No. 2016-02As discussed in Note 2 to the consolidated financial statements, the Company changed its method of accounting for leases in 2019 due to the adoption of ASU No. 2016-02, Leases (Topic 842).
Basis for OpinionThese financial statements are the responsibility of the Company's management. Our responsibility is to express an opinion on the Company’s financial statements based on our audits. We are a public accounting firm registered with the PCAOB and are required to be independent with respect to the Company in accordance with the U.S. federal securities laws and the applicable rules and regulations of the Securities and Exchange Commission and the PCAOB.
We conducted our audits in accordance with the standards of the PCAOB. Those standards require that we plan and perform the audit to obtain reasonable assurance about whether the financial statements are free of material misstatement, whether due to error or fraud. Our audits included performing procedures to assess the risks of material misstatement of the financial statements, whether due to error or fraud, and performing procedures that respond to those risks. Such procedures included examining, on a test basis, evidence regarding the amounts and disclosures in the financial statements. Our audits also included evaluating the accounting principles used and significant estimates made by management, as well as evaluating the overall presentation of the financial statements. We believe that our audits provide a reasonable basis for our opinion.
Critical Audit MatterThe critical audit matter communicated below is a matter arising from the current period audit of the financial statements that was communicated or required to be communicated to the audit committee and that: (1) relates to accounts or disclosures that are material to the financial statements and (2) involved our especially challenging, subjective or complex judgments. The communication of the critical audit matter does not alter in any way our opinion on the consolidated financial statements, taken as a whole, and we are not, by communicating the critical audit matter below, providing a separate opinion on the critical audit matter or on the accounts or disclosures to which it relates.
F-2

Market Technology Revenue RecognitionDescription of the Matter
As described in Notes 2, 3 and 8 to the consolidated financial statements, the Company enters into long-term market technology contracts with customers to develop customized technology solutions, license the right to use software, and provide support and other services which results in these contracts containing multiple performance obligations. The Company recorded market technology deferred revenue of $53 million as of December 31, 2020 and recognized $357 million in revenue for the year then ended. The Company allocates the contract transaction price to each performance obligation using their best estimate of the standalone selling price of each distinct good or service in the respective market technology contract. In instances where standalone selling price is not directly observable, such as when a product or service is not sold separately, the Company determines the standalone selling price predominantly through an expected cost plus a margin approach. The Company recognizes revenue over time using costs incurred to date relative to total estimated costs at completion to measure progress toward satisfying the performance obligation.
Auditing the Company’s calculation of the standalone selling price and timing of revenue recognition was complex and involved a high degree of subjective auditor judgment because of the significant management judgment required to develop the estimates. The standalone selling price is based on an estimate of total project costs, ongoing monitoring of completion of performance obligations and establishing margins for goods or services where a standalone selling price is not directly observable.
How We Addressed the Matter in Our Audit
We obtained an understanding, evaluated the design and tested the operating effectiveness of controls over the Company's processes with respect to estimates that impact the timing and measurement of revenue recognition. For example, we tested controls over the allocation of contract transaction price to performance obligations, including management’s review of the estimated margin used when applying the cost plus an estimated margin to determine the standalone selling price. We also evaluated the design and tested the operating effectiveness of controls over the completeness and accuracy of the data utilized to measure the estimate and recognize the revenue in the appropriate period.
We performed substantive audit procedures that included, among other things, evaluating the significant assumptions and the accuracy and completeness of the underlying data used in management’s calculation. Specifically, we inspected certain customer contracts, including contract modifications, and tested management’s determination of the standalone selling price and its allocation to performance obligations in accordance with the cost plus a margin approach, including comparing the margin assumptions to actual margins earned on completed contracts. We also tested the accuracy of the revenue recognized in the current period by inspecting reports relating to the hours recorded on a project. We evaluated the adequacy of the Company’s disclosures in Notes 2, 3 and 8 to the consolidated financial statements related to market technology revenue recognition.
/s/ Ernst & Young LLP
We have served as the Company’s auditor since 1986.
New York, New YorkFebruary 23, 2021
F-3

Nasdaq, Inc. Consolidated Balance Sheets
(in millions, except share and par value amounts)December 31, 2020 December 31, 2019
AssetsCurrent assets:
Cash and cash equivalents $ 2,745 $ 332 Restricted cash and cash equivalents 37 30 Financial investments 195 291 Receivables, net 566 422 Default funds and margin deposits 3,942 2,996 Other current assets 175 219
Total current assets 7,660 4,290 Property and equipment, net 475 384 Goodwill 6,850 6,366 Intangible assets, net 2,255 2,249 Operating lease assets 381 346 Other non-current assets 358 289 Total assets $ 17,979 $ 13,924 LiabilitiesCurrent liabilities:
Accounts payable and accrued expenses $ 175 $ 148 Section 31 fees payable to SEC 224 132 Accrued personnel costs 227 188 Deferred revenue 235 211 Other current liabilities 121 161 Default funds and margin deposits 3,942 2,996 Short-term debt — 391
Total current liabilities 4,924 4,227 Long-term debt 5,541 2,996 Deferred tax liabilities, net 502 552 Operating lease liabilities 389 331 Other non-current liabilities 187 179 Total liabilities 11,543 8,285 Commitments and contingenciesEquityNasdaq stockholders’ equity:
Common stock, $0.01 par value, 300,000,000 shares authorized, shares issued: 171,278,761 at December 31, 2020 and 171,075,011 at December 31, 2019; shares outstanding: 164,933,678 at December 31, 2020 and 165,094,440 at December 31, 2019 2 2 Additional paid-in capital 2,547 2,632 Common stock in treasury, at cost: 6,345,083 shares at December 31, 2020 and 5,980,571 shares at December 31, 2019 (376) (336) Accumulated other comprehensive loss (1,368) (1,686) Retained earnings 5,628 5,027
Total Nasdaq stockholders’ equity 6,433 5,639 Noncontrolling interests 3 —
Total equity 6,436 5,639 Total liabilities and equity $ 17,979 $ 13,924
See accompanying notes to consolidated financial statements.
F-4
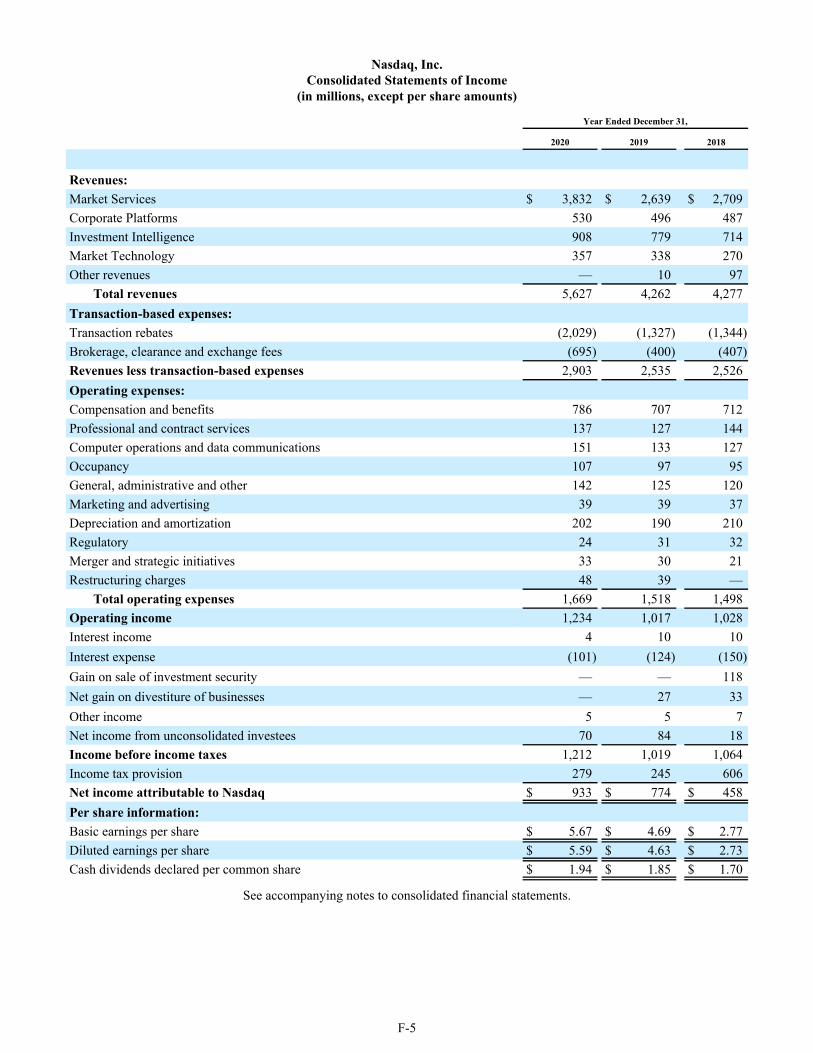
Nasdaq, Inc.Consolidated Statements of Income
(in millions, except per share amounts)
Year Ended December 31,
2020 2019 2018
Revenues: Market Services $ 3,832 $ 2,639 $ 2,709 Corporate Platforms 530 496 487 Investment Intelligence 908 779 714 Market Technology 357 338 270 Other revenues — 10 97
Total revenues 5,627 4,262 4,277 Transaction-based expenses: Transaction rebates (2,029) (1,327) (1,344) Brokerage, clearance and exchange fees (695) (400) (407) Revenues less transaction-based expenses 2,903 2,535 2,526 Operating expenses: Compensation and benefits 786 707 712 Professional and contract services 137 127 144 Computer operations and data communications 151 133 127 Occupancy 107 97 95 General, administrative and other 142 125 120 Marketing and advertising 39 39 37 Depreciation and amortization 202 190 210 Regulatory 24 31 32 Merger and strategic initiatives 33 30 21 Restructuring charges 48 39 —
Total operating expenses 1,669 1,518 1,498 Operating income 1,234 1,017 1,028 Interest income 4 10 10 Interest expense (101) (124) (150) Gain on sale of investment security — — 118 Net gain on divestiture of businesses — 27 33 Other income 5 5 7 Net income from unconsolidated investees 70 84 18 Income before income taxes 1,212 1,019 1,064 Income tax provision 279 245 606 Net income attributable to Nasdaq $ 933 $ 774 $ 458 Per share information: Basic earnings per share $ 5.67 $ 4.69 $ 2.77 Diluted earnings per share $ 5.59 $ 4.63 $ 2.73 Cash dividends declared per common share $ 1.94 $ 1.85 $ 1.70
See accompanying notes to consolidated financial statements.
F-5
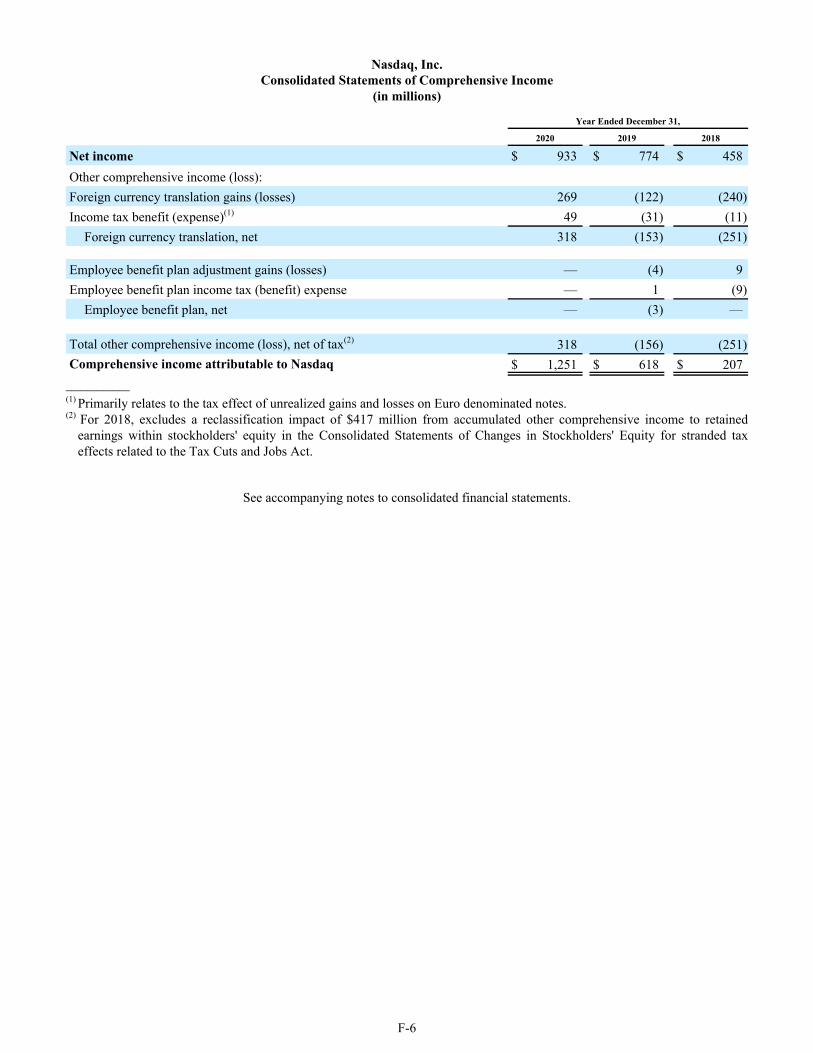
Nasdaq, Inc.Consolidated Statements of Comprehensive Income
(in millions)
Year Ended December 31,
2020 2019 2018
Net income $ 933 $ 774 $ 458 Other comprehensive income (loss): Foreign currency translation gains (losses) 269 (122) (240) Income tax benefit (expense)(1) 49 (31) (11)
Foreign currency translation, net 318 (153) (251)
Employee benefit plan adjustment gains (losses) — (4) 9 Employee benefit plan income tax (benefit) expense — 1 (9)
Employee benefit plan, net — (3) —
Total other comprehensive income (loss), net of tax(2) 318 (156) (251) Comprehensive income attributable to Nasdaq $ 1,251 $ 618 $ 207
____________(1) Primarily relates to the tax effect of unrealized gains and losses on Euro denominated notes.(2) For 2018, excludes a reclassification impact of $417 million from accumulated other comprehensive income to retained
earnings within stockholders' equity in the Consolidated Statements of Changes in Stockholders' Equity for stranded tax effects related to the Tax Cuts and Jobs Act.
See accompanying notes to consolidated financial statements.
F-6

Nasdaq, Inc. Consolidated Statements of Changes in Stockholders' Equity
(in millions)
Year Ended December 31,
2020 2019 2018
Shares $ Shares $ Shares $Common stock 165 2 165 2 167 2
Additional paid-in capitalBeginning balance 2,632 2,716 3,024
Share repurchase program (2) (222) (2) (200) (5) (394) Share-based compensation 1 87 1 79 2 69 Stock option exercises, net — 2 — 2 — 3 Other issuances of common stock, net 1 48 1 35 1 14
Ending balance 2,547 2,632 2,716
Common stock in treasury, at costBeginning balance (336) (297) (247)
Other employee stock activity — (40) — (39) — (50) Ending balance (376) (336) (297)
Accumulated other comprehensive lossBeginning balance (1,686) (1,530) (862)
Other comprehensive income (loss) 318 (156) (251) Reclassification impact of Tax Reform — — (417)
Ending balance (1,368) (1,686) (1,530)
Retained earningsBeginning balance 5,027 4,558 3,963
Impact of adoption of ASU 2016-13 (12) — Net income 933 774 458 Reclassification impact of Tax Reform — — 417 Cash dividends declared per common share (320) (305) (280)
Ending balance 5,628 5,027 4,558
Total Nasdaq stockholders’ equity 6,433 5,639 5,449
Noncontrolling interestsBeginning balance — — —
Net activity related to noncontrolling interests 3 — —
Ending balance 3 — —
Total Equity 165 $ 6,436 165 $ 5,639 165 $ 5,449
See accompanying notes to consolidated financial statements.
F-7

Nasdaq, Inc.Consolidated Statements of Cash Flows
(in millions)Year Ended December 31,
2020 2019 2018
Cash flows from operating activities:Net income $ 933 $ 774 $ 458 Adjustments to reconcile net income to net cash provided by operating activities:
Depreciation and amortization 202 190 210 Share-based compensation 87 79 69 Deferred income taxes 41 35 301 Reversal of certain Swedish tax benefits — — 41 Extinguishment of debt 36 11 — Net gain on divestiture of businesses — (27) (33) Gain on sale of investment security — — (118) Non-cash restructuring charges 14 25 — Net income from unconsolidated investees (70) (84) (18) Other reconciling items included in net income 18 8 15
Net change in operating assets and liabilities, net of effects of divestiture and acquisitions:Receivables, net (167) (42) (35) Other assets 26 (173) (40) Accounts payable and accrued expenses 5 (49) 33 Section 31 fees payable to SEC 92 23 (19) Accrued personnel costs 32 (9) 37 Deferred revenue 15 (15) 7 Other liabilities (12) 217 120
Net cash provided by operating activities 1,252 963 1,028 Cash flows from investing activities:Purchases of securities (283) (579) (421) Proceeds from sales and redemptions of securities 402 543 374 Proceeds from divestiture of businesses — 132 286 Proceeds from sale of investment securities 22 11 169 Acquisition of businesses, net of cash and cash equivalents acquired (157) (206) (75) Purchases of property and equipment (188) (127) (111) Other investing activities (27) (14) (26) Net cash provided by (used in) investing activities (231) (240) 196 Cash flows from financing activities:Proceeds from (repayments of) commercial paper, net (391) 116 (205) Repayments of borrowings under our credit commitment and debt obligations (1,468) (1,215) (115) Payment of debt extinguishment cost (36) (11) — Proceeds from issuances of long-term debt, net of issuance costs and utilization of credit commitment 3,807 680 — Repurchases of common stock (222) (200) (394) Dividends paid (320) (305) (280) Proceeds received from employee stock activity and other issuances 50 37 17 Payments related to employee shares withheld for taxes (40) (39) (50) Other financing activities 3 — — Net cash provided by (used in) financing activities 1,383 (937) (1,027) Effect of exchange rate changes on cash and cash equivalents and restricted cash and cash equivalents 16 (10) (10) Net increase (decrease) in cash and cash equivalents and restricted cash and cash equivalents 2,420 (224) 187 Cash and cash equivalents and restricted cash and cash equivalents at beginning of period 362 586 399 Cash and cash equivalents and restricted cash and cash equivalents at end of period $ 2,782 $ 362 $ 586 Supplemental Disclosure Cash Flow InformationCash paid for:
Interest $ 97 $ 120 $ 148 Income taxes, net of refund $ 290 $ 205 $ 221
See accompanying notes to consolidated financial statements.
F-8

Nasdaq, Inc.
Notes to Consolidated Financial Statements
1. Organization and Nature of Operations
Nasdaq is a global technology company serving the capital markets and other industries. Our diverse offerings of data, analytics, software and services enables clients to optimize and execute their business vision with confidence.
We manage, operate and provide our products and services in four business segments: Market Services, Corporate Platforms, Investment Intelligence and Market Technology. In the fourth quarter of 2020, we renamed the segment that was formerly known as the Corporate Services segment to the Corporate Platforms segment and renamed the business that was formerly known as the Corporate Solutions business to the IR & ESG Services business. We also renamed the segment that was formerly known as the Information Services segment to the Investment Intelligence segment and renamed the business that was formerly known as the Investment Data and Analytics business to the Analytics business. There was no impact to current or prior years' operating results as a result of these changes.
Market Services
Our Market Services segment includes our Equity Derivative Trading and Clearing, Cash Equity Trading, FICC and Trade Management Services businesses. We operate multiple exchanges and other marketplace facilities across several asset classes, including derivatives, commodities, cash equity, debt, structured products and ETPs. In addition, in certain countries where we operate exchanges, we also provide broker services, clearing, settlement and central depository services. In November 2019, we sold NFX’s futures exchange business to a third party which acquired the core assets of NFX, including the portfolio of open interest in NFX contracts. During 2020, all open interest was migrated to other exchanges. In January 2020, we commenced an orderly wind-down of our Nordic broker services operations business. We expect this wind-down to continue through 2021. Also, in February 2021, we announced that we entered into a Purchase Agreement to sell NFI. See “Sale of U.S. Fixed Income Business,” of Note 21, “Subsequent Events,” for further discussion of this transaction.
Our transaction-based platforms provide market participants with the ability to access, process, display and integrate orders and quotes. The platforms allow the routing and execution of buy and sell orders as well as the reporting of transactions, providing fee-based revenues.
For further discussion of our Market Services businesses, see “Products and Services - Market Services,” of “Item 1. Business.”
Corporate Platforms
Our Corporate Platforms segment includes our Listing Services and IR & ESG Services businesses. These businesses deliver critical capital market and governance
solutions across the lifecycle of public and private companies.
Our Listing Services business includes our U.S. and European Listing Services businesses. We operate a variety of listing platforms around the world to provide multiple global capital raising solutions for private and public companies. Our main listing markets are The Nasdaq Stock Market and the Nasdaq Nordic and Nasdaq Baltic exchanges. Through Nasdaq First North, our Nordic and Baltic operations also offer alternative marketplaces for smaller companies and growth companies. Our Listing Services business also includes NPM, which provides liquidity solutions for private companies.
We are continuing to grow our U.S. Corporate Bond exchange for the listing of corporate bonds. This exchange operates pursuant to The Nasdaq Stock Market exchange license and is powered by NFF. As of December 31, 2020, 86 corporate bonds were listed on the Corporate Bond exchange. We also continue to grow the Nasdaq Sustainable Bond Network, a platform for increased transparency in the global sustainable bond markets.
As of December 31, 2020, there were 3,392 total listings on The Nasdaq Stock Market, including 412 ETPs. The combined market capitalization was approximately $22.0 trillion. In Europe, the Nasdaq Nordic and Nasdaq Baltic exchanges, together with Nasdaq First North, were home to 1,071 listed companies with a combined market capitalization of approximately $2.1 trillion.
Our IR & ESG Services business includes our Investor Relations Intelligence and Governance Solutions businesses, which serve both public and private companies and organizations. Our public company clients can be companies listed on our exchanges or other U.S. and global exchanges. We help organizations enhance their ability to understand and expand their global shareholder base, improve corporate governance, and navigate the evolving ESG landscape through our suite of advanced technology, analytics, and consultative services. We provide clients with counsel on a range of governance and sustainability-related issues. Our acquisition of OneReport in January 2020 broadened our offerings which also include our ESG Advisory service and our board assessment and collaboration technology.
For further discussion of our Corporate Platforms businesses, see “Products and Services - Corporate Platforms,” of “Item 1. Business.”
Investment Intelligence
Our Investment Intelligence segment includes our Market Data, Index and Analytics businesses.
Our Market Data business sells and distributes historical and real-time market data to the sell-side, the institutional investing community, retail online brokers, proprietary trading shops, other venues, internet portals and data distributors. Our market data products enhance transparency
F-9
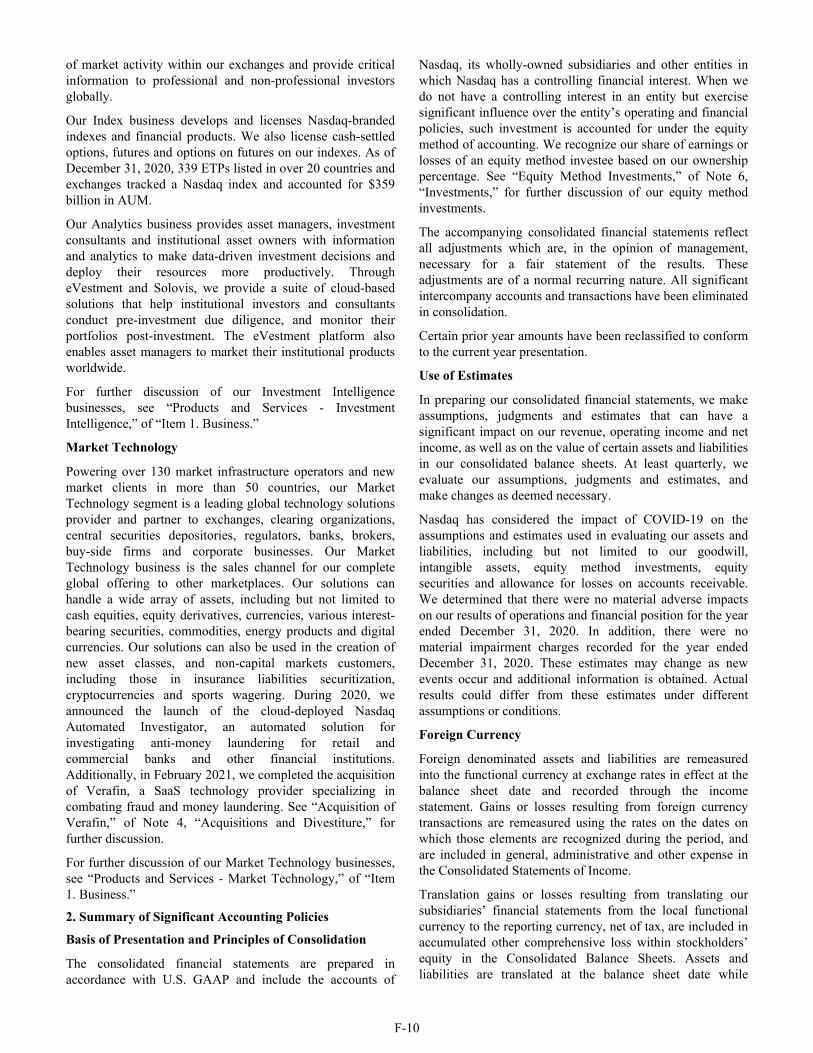
of market activity within our exchanges and provide critical information to professional and non-professional investors globally.
Our Index business develops and licenses Nasdaq-branded indexes and financial products. We also license cash-settled options, futures and options on futures on our indexes. As of December 31, 2020, 339 ETPs listed in over 20 countries and exchanges tracked a Nasdaq index and accounted for $359 billion in AUM.
Our Analytics business provides asset managers, investment consultants and institutional asset owners with information and analytics to make data-driven investment decisions and deploy their resources more productively. Through eVestment and Solovis, we provide a suite of cloud-based solutions that help institutional investors and consultants conduct pre-investment due diligence, and monitor their portfolios post-investment. The eVestment platform also enables asset managers to market their institutional products worldwide.
For further discussion of our Investment Intelligence businesses, see “Products and Services - Investment Intelligence,” of “Item 1. Business.”
Market Technology
Powering over 130 market infrastructure operators and new market clients in more than 50 countries, our Market Technology segment is a leading global technology solutions provider and partner to exchanges, clearing organizations, central securities depositories, regulators, banks, brokers, buy-side firms and corporate businesses. Our Market Technology business is the sales channel for our complete global offering to other marketplaces. Our solutions can handle a wide array of assets, including but not limited to cash equities, equity derivatives, currencies, various interest-bearing securities, commodities, energy products and digital currencies. Our solutions can also be used in the creation of new asset classes, and non-capital markets customers, including those in insurance liabilities securitization, cryptocurrencies and sports wagering. During 2020, we announced the launch of the cloud-deployed Nasdaq Automated Investigator, an automated solution for investigating anti-money laundering for retail and commercial banks and other financial institutions. Additionally, in February 2021, we completed the acquisition of Verafin, a SaaS technology provider specializing in combating fraud and money laundering. See “Acquisition of Verafin,” of Note 4, “Acquisitions and Divestiture,” for further discussion.
For further discussion of our Market Technology businesses, see “Products and Services - Market Technology,” of “Item 1. Business.”
2. Summary of Significant Accounting Policies
Basis of Presentation and Principles of Consolidation
The consolidated financial statements are prepared in accordance with U.S. GAAP and include the accounts of
Nasdaq, its wholly-owned subsidiaries and other entities in which Nasdaq has a controlling financial interest. When we do not have a controlling interest in an entity but exercise significant influence over the entity’s operating and financial policies, such investment is accounted for under the equity method of accounting. We recognize our share of earnings or losses of an equity method investee based on our ownership percentage. See “Equity Method Investments,” of Note 6, “Investments,” for further discussion of our equity method investments.
The accompanying consolidated financial statements reflect all adjustments which are, in the opinion of management, necessary for a fair statement of the results. These adjustments are of a normal recurring nature. All significant intercompany accounts and transactions have been eliminated in consolidation.
Certain prior year amounts have been reclassified to conform to the current year presentation.
Use of Estimates
In preparing our consolidated financial statements, we make assumptions, judgments and estimates that can have a significant impact on our revenue, operating income and net income, as well as on the value of certain assets and liabilities in our consolidated balance sheets. At least quarterly, we evaluate our assumptions, judgments and estimates, and make changes as deemed necessary.
Nasdaq has considered the impact of COVID-19 on the assumptions and estimates used in evaluating our assets and liabilities, including but not limited to our goodwill, intangible assets, equity method investments, equity securities and allowance for losses on accounts receivable. We determined that there were no material adverse impacts on our results of operations and financial position for the year ended December 31, 2020. In addition, there were no material impairment charges recorded for the year ended December 31, 2020. These estimates may change as new events occur and additional information is obtained. Actual results could differ from these estimates under different assumptions or conditions.
Foreign Currency
Foreign denominated assets and liabilities are remeasured into the functional currency at exchange rates in effect at the balance sheet date and recorded through the income statement. Gains or losses resulting from foreign currency transactions are remeasured using the rates on the dates on which those elements are recognized during the period, and are included in general, administrative and other expense in the Consolidated Statements of Income.
Translation gains or losses resulting from translating our subsidiaries’ financial statements from the local functional currency to the reporting currency, net of tax, are included in accumulated other comprehensive loss within stockholders’ equity in the Consolidated Balance Sheets. Assets and liabilities are translated at the balance sheet date while
F-10

revenues and expenses are translated at the date the transaction occurs or at an applicable average rate.
Cash and Cash Equivalents
Cash and cash equivalents include all non-restricted cash in banks and highly liquid investments with original maturities of 90 days or less at the time of purchase. Such equivalent investments included in cash and cash equivalents in the Consolidated Balance Sheets were $2,509 million as of December 31, 2020 and $135 million as of December 31, 2019. Cash equivalents are carried at cost plus accrued interest, which approximates fair value due to the short maturities of these investments. The increase in cash equivalents in 2020 was primarily due to the investment of net proceeds of $1.9 billion from issuances of long-term debt in the fourth quarter of 2020 for the acquisition of Verafin, which closed in February 2021. See “Acquisition of Verafin,” of Note 4, “Acquisitions and Divestiture,” for further discussion.
Restricted Cash
Restricted cash and cash equivalents, which was $37 million as of December 31, 2020 and $30 million as of December 31, 2019, is restricted from withdrawal due to a contractual or regulatory requirement or not available for general use and as such is classified as restricted in the Consolidated Balance Sheets. As of December 31, 2020 and 2019, restricted cash and cash equivalents primarily includes funds held for our trading and clearing businesses.
Receivables, net
Our receivables are concentrated with our member firms, market data distributors, listed companies and investor relations and governance and market technology customers. Receivables are shown net of a reserve for uncollectible accounts. On January 1, 2020, we adopted ASU 2016-13. Implementation of this standard is discussed below under “Measurement of Credit Losses on Financial Instruments.” The reserve for bad debts is maintained at a level that management believes to be sufficient to absorb expected losses over the life of our accounts receivable portfolio. The reserve is increased by the provision for bad debts which is charged against operating results and decreased by the amount of charge-offs, net of recoveries. The provision for bad debts is included in general, administrative and other expense in the Consolidated Statements of Income. The amount charged against operating results is based on an aging methodology. This method applies loss rates based on historical loss information which is disaggregated by business segment and, as deemed necessary, is adjusted for other factors and considerations that could impact collectibility. In circumstances where a specific customer’s inability to meet its financial obligations is known (i.e., bankruptcy filings), we determine whether a specific provision for bad debts is required. Accounts receivable are written-off against the reserve for bad debts when collection efforts cease. Due to changing economic, business and market conditions, we review the reserve for bad debts
monthly and make changes to the reserve through the provision for bad debts as appropriate. If circumstances change (i.e., higher than expected defaults or an unexpected material adverse change in a major customer’s ability to pay), our estimates of recoverability could be reduced by a material amount. The total reserve netted against receivables in the Consolidated Balance Sheets was $21 million as of December 31, 2020, $9 million as of December 31, 2019 and $13 million as of December 31, 2018. The changes in the balance between periods was immaterial.
Measurement of Credit Losses on Financial Instruments
ASU 2016-13 changed the impairment model for certain financial instruments. The new model is a forward looking expected loss model and applies to financial assets subject to credit losses and measured at amortized cost and certain off-balance sheet credit exposures. This includes loans, held-to-maturity debt securities, loan commitments, financial guarantees and trade receivables. For available-for-sale debt securities with unrealized losses, credit losses are measured in a manner similar to previous accounting, except that the losses are recognized as allowances rather than reductions in the amortized cost of the securities.We recorded a $12 million non-cash cumulative effect adjustment to retained earnings on our opening Consolidated Balance Sheets as of January 1, 2020 as a result of the adoption of this new standard.
The comparative information has not been restated and continues to be reported under the accounting standards in effect for those periods. We expect the impact of the adoption of the new standard to be immaterial to our net income on an on-going basis.
At the date of adoption, the adjustment impacted by the standard related primarily to an adjustment to trade receivables. We took into consideration all financial instruments held at the date of adoption which were impacted by the standard, including reverse repurchase agreements and commercial paper, and estimated the risk of loss to be immaterial. Therefore, no adjustment was recorded for these instruments.
In accordance with the new standard, Nasdaq must recognize an allowance when a receivable or contract asset is established, regardless of whether there has been an incurred loss.
In order to assess the appropriate allowance as of January 1, 2020, we disaggregated our trade receivables by business segment and the aging of receivables. We concluded that historical loss information is a reasonable starting point on which to determine expected credit losses for trade receivables held at the date of adoption as the composition of our trade receivables at adoption of the standard is materially consistent with that used in developing the historical loss percentages for each business unit. In order to incorporate our expectation of credit losses over the life of our receivables, we considered corporate default rate averages over an extended period as compared to the period covered
F-11

by our historical loss data and included an adjustment to historical loss percentages for current conditions and expected future conditions at the date of adoption.
Investments
Purchases and sales of investment securities are recognized on settlement date.
Financial investments
Financial investments are comprised of trading securities. These investments are bought principally to meet regulatory capital requirements mainly for our clearing operations at Nasdaq Clearing. These investments are classified as trading securities as they are generally sold in the near term. Changes in fair value of trading securities are included in other income in the Consolidated Statements of Income.
Fair value is generally obtained from third party pricing sources. When available, quoted market prices are used to determine fair value. If quoted market prices are not available, fair values are estimated using pricing models with observable market inputs. The inputs to the valuation models vary by the type of security being priced but are typically benchmark yields, reported trades, broker-dealer quotes, and prices of similar assets. Pricing models generally do not entail material subjectivity because the methodologies employed use inputs observed from active markets. See “Fair Value Measurements,” below for further discussion of fair value measures.
Equity Securities
Investments in equity securities with readily determinable fair values (other than those accounted for under the equity method or those that result in consolidation of the investee) are measured at fair value and any changes in fair value are recognized in other income in the Consolidated Statements of Income.
Equity investments without readily determinable fair values are accounted for under the measurement alternative, under which investments are measured at cost, less any impairment, plus or minus changes resulting from observable price changes in orderly transactions for the identical or a similar investment of the same issuer on a prospective basis. We assess relevant transactions that occur on or before the balance sheet date to identify observable price changes, and we regularly monitor these investments to evaluate whether there is an indication that the investment is impaired, based on the share price from the investee's latest financing round, the performance of the investee in relation to its own operating targets, the investee's liquidity and cash position, and general market conditions. If a qualitative assessment indicates that the security is impaired, Nasdaq will estimate the fair value of the security, and if the fair value is less than the carrying amount of the security, recognize an impairment loss in net income equal to the difference in the period the impairment occurs. See Note 6, “Investments,” for further discussion of our equity securities.
For the years ended December 31, 2020, 2019 and 2018, no material adjustments were made to the carrying value of our equity securities.
Our investments in equity securities are included in other non-current assets in the Consolidated Balance Sheets, as we intend to hold these investments for more than one year.
Equity Method Investments
In general, the equity method of accounting is used when we own 20% to 50% of the outstanding voting stock of a company or when we are able to exercise significant influence over the operating and financial policies of a company. We have certain investments in which we have determined that we have significant influence and as such account for the investments under the equity method of accounting. We record our estimated pro-rata share of earnings or losses each reporting period and record any dividends as a reduction in the investment balance. We evaluate our equity method investments for other-than-temporary declines in value by considering a variety of factors such as the earnings capacity of the investment and the fair value of the investment compared to its carrying amount. In addition, for investments where the market value is readily determinable, we consider the underlying stock price. If the estimated fair value of the investment is less than the carrying amount and management considers the decline in value to be other than temporary, the excess of the carrying amount over the estimated fair value is recognized in net income in the period the impairment occurs. See Note 6, “Investments,” for further discussion of our equity method investments.
No material impairments were recorded to reduce the carrying value of our equity method investments in 2020, 2019 or 2018.
Default Funds and Margin Deposits
Nasdaq Clearing members’ cash contributions are included in default funds and margin deposits in the Consolidated Balance Sheets as both a current asset and a current liability. These balances may fluctuate over time due to changes in the amount of deposits required and whether members choose to provide cash or non-cash contributions. Non-cash contributions include highly rated government debt securities that must meet specific criteria approved by Nasdaq Clearing. Non-cash contributions are pledged assets that are not recorded in the Consolidated Balance Sheets as Nasdaq Clearing does not take legal ownership of these assets and the risks and rewards remain with the clearing members.
Derivative Financial Instruments and Hedging Activities
Non-Designated Derivatives
We use foreign exchange forward contracts to manage foreign currency exposure of intercompany loans, accounts receivable, accounts payable and other balance sheet items. These contracts are not designated as hedges for financial reporting purposes. The change in fair value of these contracts is recognized in general, administrative and other
F-12

expense in the Consolidated Statements of Income and offsets the foreign currency exposure.
As of December 31, 2020 and 2019, the fair value amounts of our derivative instruments were immaterial.
Net Investment Hedges
Net assets of our foreign subsidiaries are exposed to volatility in foreign currency exchange rates. We may utilize net investment hedges to offset the translation adjustment arising from re-measuring our investment in foreign subsidiaries.
Our 2023, 2029, and 2030 Notes have been designated as a hedge of our net investment in certain foreign subsidiaries to mitigate the foreign exchange risk associated with certain investments in these subsidiaries. Any increase or decrease related to the remeasurement of the 2023, 2029, and 2030 Notes into U.S. dollars is recorded in accumulated other comprehensive loss within stockholders’ equity in the Consolidated Balance Sheets. See “1.75% Senior Unsecured Notes Due 2023,” “1.75% Senior Unsecured Notes Due 2029,” and “0.875% Senior Unsecured Notes Due 2030,” of Note 9, “Debt Obligations,” for further discussion.
Property and Equipment, net
Property and equipment, including leasehold improvements, are carried at cost less accumulated depreciation and amortization. Depreciation and amortization are recognized using the straight-line method over the estimated useful lives of the related assets, which range from 10 to 40 years for buildings and improvements, 2 to 5 years for data processing equipment, and 5 to 10 years for furniture and equipment.
We develop systems solutions for both internal and external use. Certain costs incurred in connection with developing or obtaining internal use software are capitalized. In addition, certain costs of computer software to be sold, leased, or otherwise marketed as a separate product or as part of a product or process are capitalized beginning when a product’s technological feasibility has been established and ending when a product is available for general release. Technological feasibility is established upon completion of a detailed program design or, in its absence, completion. Prior to reaching technological feasibility, all costs are charged to expense. Unamortized capitalized costs are included in data processing equipment and software, within property and equipment, net in the Consolidated Balance Sheets. Capitalized software costs are amortized on a straight-line basis over the estimated useful lives of the software, generally 5 to 10 years. Amortization of these costs is included in depreciation and amortization expense in the Consolidated Statements of Income.
Leasehold improvements are amortized using the straight-line method over the shorter of their estimated useful lives or the remaining term of the related lease.
See Note 7, “Property and Equipment, net,” for further discussion.
LeasesOn January 1, 2019, we adopted ASU 2016-02, “Leases,” or ASU 2016-02, and elected the optional transition method to initially apply the standard at the January 1, 2019 adoption date. Prior periods continue to be reported under guidance in effect prior to January 1, 2019.
At inception, we determine whether a contract is or contains a lease. We have operating leases which are primarily real estate leases for our U.S. and European headquarters and for general office space. As of December 31, 2020, these leases have varying lease terms with remaining maturities ranging from 1 month to 15 years. Operating lease balances are included in operating lease assets, other current liabilities, and operating lease liabilities in our Consolidated Balance Sheets. We do not have any leases classified as finance leases.
Operating lease assets represent our right to use an underlying asset for the lease term and lease liabilities represent our obligation to make lease payments arising from the lease. Operating lease assets and liabilities are recognized at commencement date based on the present value of lease payments over the lease term. Since our leases do not provide an implicit rate, we use our incremental borrowing rate based on the estimated rate of interest for collateralized borrowing over a similar term of the lease payments at commencement date in determining the present value of lease payments. The operating lease asset also includes any lease payments made and excludes lease incentives. Our lease terms include options to extend or terminate the lease when we are reasonably certain that we will exercise that option. Lease expense for lease payments is recognized on a straight-line basis over the lease term. Certain of our lease agreements include rental payments adjusted periodically for inflation based on an index or rate. These payments are included in the initial measurement of the operating lease liability and operating lease asset. However, rental payments that are based on a change in an index or a rate are considered variable lease payments and are expensed as incurred.
We have lease agreements with lease and non-lease components, which are accounted for as a single performance obligation to the extent that the timing and pattern of transfer are similar for the lease and non-lease components and the lease component qualifies as an operating lease. We do not recognize lease liabilities and operating lease assets for leases with a term of 12 months or less. We recognize these lease payments on a straight-line basis over the lease term.
See Note 16, “Leases,” for further discussion.
Goodwill and Indefinite-Lived Intangible Assets
Goodwill represents the excess of purchase price over the value assigned to the net assets, including identifiable intangible assets, of a business acquired. Goodwill is assessed for impairment annually in the fourth quarter of our fiscal year using an October 1 measurement date, or more frequently if conditions exist that indicate that the asset may be impaired, such as changes in the business climate, poor
F-13
indicators of operating performance or the sale or disposition of a significant portion of a reporting unit. When testing goodwill for impairment, we have the option of first performing a qualitative assessment to determine whether it is more likely than not that the fair value of a reporting unit is less than its carrying amount as the basis to determine if it is necessary to perform a quantitative goodwill impairment test. When assessing goodwill for impairment, our decision to perform a qualitative impairment assessment for a reporting unit in a given year is influenced by a number of factors, including but not limited to, the size of the reporting unit’s goodwill, the significance of the excess of the reporting unit’s estimated fair value over its carrying amount at the last quantitative assessment date, and the amount of time in between quantitative fair value assessments.
In performing a qualitative assessment, we consider the extent to which unfavorable events or circumstances identified, such as changes in economic, industry and market conditions or company specific events, could affect the comparison of the reporting unit’s fair value with its carrying amount. If we choose not to complete a qualitative assessment for a given reporting unit, or if the initial assessment indicates that it is more likely than not that the carrying amount of a reporting unit exceeds its estimated fair value, a quantitative test is required. When performing a quantitative goodwill impairment test, we compare the fair value of a reporting unit with its carrying amount. If the fair value is less than the carrying amount, an impairment charge is recognized in an amount equal to the difference, limited to the total amount of goodwill allocated to that reporting unit.
We also evaluate indefinite-lived intangible assets for impairment annually in the fourth quarter of our fiscal year using an October 1 measurement date, or more frequently whenever events or changes in circumstances indicate that the fair value of the asset may be less than its carrying amount. Such evaluation includes determining the fair value of the asset and comparing the fair value of the asset with its carrying amount. If the fair value of the indefinite-lived intangible asset is less than its carrying amount, an impairment charge is recognized in an amount equal to the difference.
For indefinite-lived intangible assets impairment testing, we also have the option to first perform a qualitative assessment to determine whether it is more likely than not that the fair value of an indefinite-lived intangible asset is less than the carrying amount. If, after assessing the totality of events or circumstances, we determine that it is more likely than not that the fair value of an indefinite-lived intangible asset is less than its carrying amount, then we must perform additional testing of the asset. Otherwise, we conclude that no impairment is indicated and further testing is not performed.
There was no impairment of goodwill for the years ended December 31, 2020, 2019 and 2018 and there were no indefinite-lived intangible asset impairment charges in 2020, 2019 and 2018. Future disruptions to our business and events,
such as prolonged economic weakness or unexpected significant declines in operating results of any of our reporting units or businesses, may result in goodwill or indefinite-lived intangible asset impairment charges in the future.
Valuation of Other Long-Lived Assets
We review our other long-lived assets, such as finite-lived intangible assets and property and equipment, for potential impairment when there is evidence that events or changes in circumstances indicate that the carrying amount of an asset may not be recoverable. The carrying amount of an asset is not recoverable if it exceeds the sum of the undiscounted cash flows expected to result from the use and eventual disposition of the asset. Fair value of finite-lived intangible assets and property and equipment is based on various valuation techniques. Any required impairment loss is measured as the amount by which the carrying amount of the asset exceeds its fair value and is recorded as a reduction in the carrying amount of the related asset and a charge to operating results.
We recorded pre-tax, non-cash property and equipment asset impairment charges of $4 million in 2020 and $24 million in 2019. For the year ended December 31, 2018, no material adjustments were made to the carrying amounts of finite-lived intangible assets or property and equipment.
Revenue Recognition and Transaction-Based Expenses
Revenue From Contracts With Customers
Our revenue recognition policies under ASU 2014-09, “Revenue from Contracts with Customers (Topic 606),” are described in the following paragraphs.
Contract Balances
Substantially all of our revenues are considered to be revenues from contracts with customers. The related accounts receivable balances are recorded in our Consolidated Balance Sheets as receivables which is net of allowance for doubtful accounts of $21 million as of December 31, 2020 and $9 million as of December 31, 2019. The changes in the balance between periods were immaterial. We do not have obligations for warranties, returns or refunds to customers.
For the majority of our contracts with customers, except for our market technology and listings services contracts, our performance obligations are short-term in nature and there is no significant variable consideration.
We do not have a material amount of revenues recognized from performance obligations that were satisfied in prior periods. We do not provide disclosures about transaction price allocated to unsatisfied performance obligations if contract durations are less than one year. Excluding our market technology contracts, for contract durations that are one-year or greater, materially all of the transaction price allocated to unsatisfied performance obligations is included in deferred revenue. For our market technology contracts, for the portion of transaction price allocated to unsatisfied performance obligations, see Note 3, “Revenue From
F-14

Contracts With Customers.” Deferred revenue primarily represents our contract liabilities related to our fees for annual and initial listings, market technology, IR & ESG services and investment intelligence contracts. Deferred revenue is the only significant contract asset or liability as of December 31, 2020. See Note 8, “Deferred Revenue,” for our discussion of deferred revenue balances, activity, and expected timing of recognition. See “Revenue Recognition” below for further descriptions of our revenue contracts.
Sales commissions earned by our sales force are considered incremental and recoverable costs of obtaining a contract with a customer. These costs are deferred and amortized on a straight-line basis over the period of benefit that we have determined to be the contract term or estimated service period. Sales commissions for renewal contracts are deferred and amortized on a straight-line basis over the related contractual renewal period. Amortization expense is included in compensation and benefits expense in the Consolidated Statements of Income. The balance of deferred costs and related amortization expense are not material to our consolidated financial statements. Sales commissions are expensed when incurred if contract durations are one year or less. Sales taxes are excluded from transaction prices.
Certain judgments and estimates were used in the identification and timing of satisfaction of performance obligations and the related allocation of transaction price and are discussed below. We believe that these represent a faithful depiction of the transfer of services to our customers.
Revenue Recognition
Our primary revenue contract classifications are described below. Although we may discuss additional revenue details in our “Management's Discussion and Analysis of Financial Condition and Results of Operations,” the categories below best represent those that depict similar economic characteristics of the nature, amount, timing and uncertainty of our revenues and cash flows.
Market Services
Transaction-Based Trading and Clearing
Transaction-based trading and clearing includes equity derivative trading and clearing, cash equity trading and FICC revenues. Nasdaq charges transaction fees for trades executed on our exchanges, as well as on orders that are routed to and executed on other market venues. Nasdaq charges clearing fees for contracts cleared with Nasdaq Clearing.
In the U.S., transaction fees are based on trading volumes for trades executed on our U.S. exchanges and in Europe, transaction fees are based on the volume and value of traded and cleared contracts. In Canada, transaction fees are based on trading volumes for trades executed on our Canadian exchange.
Nasdaq satisfies its performance obligation for trading services upon the execution of a customer trade and clearing services when a contract is cleared, as trading and clearing transactions are substantially complete when they are
executed and we have no further obligation to the customer at that time. Transaction-based trading and clearing fees can be variable and are based on trade volume tiered discounts. Transaction revenues, as well as any tiered volume discounts, are calculated and billed monthly in accordance with our published fee schedules. In the U.S., we also pay liquidity payments to customers based on our published fee schedules. We use these payments to improve the liquidity on our markets and therefore recognize those payments as a cost of revenue.
The majority of our FICC trading and clearing customers are charged transaction fees, as discussed above, which are based on the volume and value of traded and cleared contracts. We also enter into annual fixed contracts with customers trading U.S. Treasury securities. The customers are charged an annual fixed fee which is billed per the agreement, on a monthly or quarterly basis. Revenues earned on fixed contracts are recognized over time on a ratable basis over the contract period beginning on the date that our service is made available to the customer since the customer receives and consumes the benefit as Nasdaq provides the service.
For U.S. equity derivative trading, we credit a portion of the per share execution charge to the market participant that provides the liquidity. For U.S. cash equity trading, for The Nasdaq Stock Market, Nasdaq PSX and Nasdaq CXC, we credit a portion of the per share execution charge to the market participant that provides the liquidity, and for Nasdaq BX and Nasdaq CX2, we credit a portion of the per share execution charge to the market participant that takes the liquidity. We record these credits as transaction rebates that are included in transaction-based expenses in the Consolidated Statements of Income. These transaction rebates are paid on a monthly basis and the amounts due are included in accounts payable and accrued expenses in the Consolidated Balance Sheets.
In the U.S., we pay Section 31 fees to the SEC for supervision and regulation of securities markets. We pass these costs along to our customers through our equity derivative trading and clearing fees and our cash equity trading fees. We collect the fees as a pass-through charge from organizations executing eligible trades on our options exchanges and our cash equity platforms and we recognize these amounts in transaction-based expenses when incurred. Section 31 fees received are included in cash and cash equivalents in the Consolidated Balance Sheets at the time of receipt and, as required by law, the amount due to the SEC is remitted semiannually and recorded as Section 31 fees payable to the SEC in the Consolidated Balance Sheets until paid. Since the amount recorded as revenues is equal to the amount recorded as transaction-based expenses, there is no impact on our revenues less transaction-based expenses. As we hold the cash received until payment to the SEC, we earn interest income on the related cash balances.
Under our Limitation of Liability Rule and procedures, we may, subject to certain caps, provide compensation for losses directly resulting from our systems’ actual failure to correctly
F-15

process an order, quote, message or other data into our platform. We do not record a liability for any potential claims that may be submitted under the Limitation of Liability Rule unless they meet the provisions required in accordance with U.S. GAAP. As such, losses arising as a result of the rule are accrued and charged to expense only if the loss is probable and estimable.
Trade Management Services
We provide market participants with a wide variety of alternatives for connecting to and accessing our markets for a fee. We also offer market participants colocation services, whereby we charge firms for cabinet space and power to house their own equipment and servers within our data centers. These participants are charged monthly fees for cabinet space, connectivity and support in accordance with our published fee schedules. These fees are recognized on a monthly basis when the performance obligation is met. We also earn revenues from annual and monthly exchange membership and registration fees. Revenues for monthly exchange membership and registration fees are recognized on a monthly basis as the service is provided. Revenues from annual fees for exchange membership and registration fees are recognized ratably over the following 12-month period since the customer receives and consumes the benefit as Nasdaq provides the service. We also offer broker services to financial participants in the Nordic market primarily offering technology and customized securities administration solutions. Revenues from broker services are based on a fixed basic fee for administration or licensing, maintenance and operations, and an incremental fee depending on the number of transactions completed. Broker services revenues are generally billed and recognized monthly. As previously noted, in January 2020, we commenced an orderly wind-down of this broker services operations business. We expect this wind-down to continue through 2021.
Corporate Platforms
Listing Services
Listing services revenues primarily include initial listing fees and annual renewal fees. Under Topic 606, the initial listing fee is allocated to multiple performance obligations including initial and subsequent listing services and IR & ESG services (when a company qualifies to receive these services under the applicable Nasdaq rule), as well as a customer's material right to renew the option to list on our exchanges. In performing this allocation, the standalone selling price of the performance obligations is based on the initial and annual listing fees and the standalone selling price of the IR & ESG services is based on its market value. All listing fees are billed upfront and the identified performance obligations are satisfied over time since the customer receives and consumes the benefit as Nasdaq provides the listing service. The amount of revenue related to the IR & ESG services performance obligation is recognized ratably over a two-year period, which is based on contract terms, with the remaining revenue recognized ratably over six years which is based on
our historical listing experience and projected future listing duration.
In the U.S., annual renewal fees are charged to listed companies based on their number of outstanding shares at the end of the prior year and are recognized ratably over the following 12-month period since the customer receives and consumes the benefit as Nasdaq provides the service. Annual fees are charged to newly listed companies on a pro-rata basis, based on outstanding shares at the time of listing and recognized over the remainder of the year. European annual renewal fees, which are received from companies listed on our Nasdaq Nordic and Nasdaq Baltic exchanges and Nasdaq First North, are directly related to the listed companies’ market capitalization on a trailing 12-month basis and are recognized ratably over the following 12-month period since the customer receives and consumes the benefit as Nasdaq provides the service.
IR & ESG Services
Our IR & ESG Services business includes our Investor Relations Intelligence and Governance Solutions businesses, which serve both public and private companies and organizations.
IR & ESG Services revenues primarily include subscription and transaction-based income from our investor relations intelligence and governance solutions products and services. Subscription-based revenues earned are recognized over time on a ratable basis over the contract period beginning on the date that our service is made available to the customer since the customer receives and consumes the benefit as Nasdaq provides the service. Generally, fees are billed in advance and the contract provides for automatic renewal. As part of subscription agreements, customers can also be charged usage fees based upon actual usage of the services provided. Revenues from usage fees are recognized at a point in time when the service is provided.
Investment Intelligence
Market Data
Market data revenues are earned from U.S. and European proprietary market data products. In the U.S., we also earn revenues from U.S. shared tape plans.
We earn revenues primarily based on the number of data subscribers and distributors of our data. Market data revenues are subscription-based and are recognized on a monthly basis.
For U.S. tape plans, revenues are collected monthly based on published fee schedules and distributed quarterly to the U.S. exchanges based on a formula required by Regulation NMS that takes into account both trading and quoting activity. Revenues are presented on a net basis as we are acting as an agent in this arrangement.
Market Data Revenue Sharing
The most significant component of market data revenues recorded on a net basis is the UTP Plan revenue sharing in
F-16

the U.S. All indicators of principal versus agent reporting under U.S. GAAP have been considered in analyzing the appropriate presentation of the revenue sharing. However, the following are the primary indicators of net reporting:
• We are the administrator for the plan, in addition to being a participant in the plan. In our unique role as administrator, we facilitate the collection and dissemination of revenues on behalf of the plan participants. As a participant, we share in the net distribution of revenues according to the plan on the same terms as all other plan participants.
• The operating committee of the plan, which is comprised of representatives from each of the participants, including us solely in our capacity as a plan participant, is responsible for setting the level of fees to be paid by distributors and subscribers and taking action in accordance with the provisions of the plan, subject to SEC approval.
• Risk of loss on the revenue is shared equally among plan participants according to the plan.
The exchanges that comprise Nasdaq Nordic and Nasdaq Baltic do not have any material market data revenue sharing agreements.
Index
We develop and license Nasdaq branded indexes and financial products as part of our Global Index Family. We also provide index data products and custom calculation services for third-party clients. Revenues primarily include license fees from these branded indexes and financial products in the U.S. and abroad. We primarily have two types of license agreements: transaction-based licenses and asset-based licenses. Transaction-based licenses are generally renewable agreements. Customers are charged based on transaction volume or a minimum contract amount, or both. If a customer is charged based on transaction volume, we recognize revenue when the transaction occurs. If a customer is charged based on a minimum contract amount, we recognize revenue on a pro-rata basis over the licensing term since the customer receives and consumes the benefit as Nasdaq provides the service. Asset-based licenses are also generally renewable agreements. Customers are charged based on a percentage of AUM for licensed products, per the agreement, on a monthly or quarterly basis. These revenues are recognized over the term of the license agreement since the customer receives and consumes the benefit as Nasdaq provides the service. Revenue from index data subscriptions are recognized on a monthly basis.
Analytics
Analytics revenues are earned from investment content and analytics products. We earn revenues primarily based on the number of content and analytics subscribers and distributors.
Subscription agreements are generally annual in term, payable in advance, and provide for automatic renewal. Subscription-based revenues are recognized over time on a ratable basis over the contract period beginning on the date
that our service is made available to the customer since the customer receives and consumes the benefit as Nasdaq provides the service.
Market Technology
Market Technology revenues primarily consist of software, license and support revenues, change request revenues, and SaaS revenues.
In our Market Technology business, we enter into long-term contracts with customers to develop customized technology solutions, license the right to use software, and provide support and other services to our customers. We also enter into agreements to modify the system solutions sold by Nasdaq after delivery has occurred. In addition, we enter into subscription agreements which allow customers to connect to our servers to access our software.
Our long-term contracts with customers to develop customized technology solutions, license the right to use software and provide support and other services to our customers have multiple performance obligations. The performance obligations are generally: (i) software license and installation service and (ii) software support. We have determined that the software license and installation service are not distinct as the license and the customized installation service are inputs to produce the combined output, a functional and integrated software system.
For contracts with multiple performance obligations, we allocate the contract transaction price to each performance obligation using our best estimate of the standalone selling price of each distinct good or service in the contract. In instances where standalone selling price is not directly observable, such as when we do not sell the product or service separately, we determine the standalone selling price predominantly through an expected cost plus a margin approach.
Contract modifications are routine in the performance of our contracts. Contracts are often modified to account for changes in contract specifications or requirements. In most instances, contract modifications are for goods and services that are not distinct, and, therefore, are accounted for as part of the existing contract.
For our long-term contracts, payments are generally made throughout the contract life and can be dependent on either reaching certain milestones or paid upfront in advance of the service period depending on the stage of the contract. For subscription agreements, contract payment terms can be quarterly, annually or monthly, in advance. For all other contracts, payment terms vary.
We generally recognize revenue over time as our customers simultaneously receive and consume the benefits provided by our performance because our customer controls the asset for which we are creating, our performance does not create an asset with alternative use, and we have a right to payment for performance completed to date. For these services, we recognize revenue over time using costs incurred to date
F-17

relative to total estimated costs at completion to measure progress toward satisfying our performance obligation. Incurred costs represent work performed, which corresponds with, and thereby depicts, the transfer of control to the customer. Contract costs generally include labor and direct overhead. For software support and update services, and for subscription agreements which allow customers to connect to our servers to access our software, we generally recognize revenue ratably over the service period beginning on the date our service is made available to the customer since the customer receives and consumes the benefit consistently over the period as Nasdaq provides the services.
Accounting for our long-term contracts requires judgment relative to assessing risks and their impact on the estimate of revenues and costs. Our estimates are impacted by factors such as the potential for schedule and technical issues, productivity, and the complexity of work performed. When adjustments in estimated total contract costs are required, any changes in the estimated revenues from prior estimates are recognized in the current period for the effect of such change. If estimates of total costs to be incurred on a contract exceed estimates of total revenues, a provision for the entire estimated loss on the contract is recorded in the period in which the loss is determined. During the fourth quarter, as part of our regular review of significant implementation projects, we refined and revised our plans relating to a large-scale post-trade clearing implementation project for a specific client. At that point it became probable that we would incur a loss over the remainder of that particular project, in part due to the logistical implications of COVID-19. As a result, we recorded a $25 million provision for the estimated loss in general, administrative and other expense in our Consolidated Statements of Income and is included in other current and other non-current liabilities in our Consolidated Balance Sheets.
Other Revenues
For the year ended December 31, 2019 and 2018, other revenues include the revenues from the BWise enterprise governance, risk and compliance software platform, which was sold in March 2019, and for the year ended December 31, 2018, other revenues also include revenues from the Public Relations Solutions and Digital Media Services businesses which were sold in April 2018. Prior to the sale dates, these revenues were included in our IR & ESG Services business within our Corporate Platforms segment and were both subscription and transaction-based revenues.
Earnings Per Share
We present both basic and diluted earnings per share. Basic earnings per share is computed by dividing net income attributable to Nasdaq by the weighted-average number of common shares outstanding for the period. Diluted earnings per share is computed by dividing net income attributable to Nasdaq by the weighted-average number of common shares and common share equivalents outstanding during the period and reflects the assumed conversion of all dilutive securities, which primarily consist of restricted stock, PSUs, and
employee stock options. Common share equivalents are excluded from the computation in periods for which they have an anti-dilutive effect. Stock options for which the exercise price exceeds the average market price over the period are anti-dilutive and, accordingly, are excluded from the calculation. Shares which are considered contingently issuable are included in the computation of dilutive earnings per share on a weighted average basis when management determines the applicable performance criteria would have been met if the performance period ended as of the date of the relevant computation. See Note 13, “Earnings Per Share,” for further discussion.
Pension and Post-Retirement Benefits
Pension and other post-retirement benefit plan information for financial reporting purposes is developed using actuarial valuations. We assess our pension and other post-retirement benefit plan assumptions on a regular basis. In evaluating these assumptions, we consider many factors, including evaluation of the discount rate, expected rate of return on plan assets, mortality rate, healthcare cost trend rate, retirement age assumption, our historical assumptions compared with actual results and analysis of current market conditions and asset allocations. See Note 10, “Retirement Plans,” for further discussion.
Discount rates used for pension and other post-retirement benefit plan calculations are evaluated annually and modified to reflect the prevailing market rates at the measurement date of a high-quality fixed-income debt instrument portfolio that would provide the future cash flows needed to pay the benefits included in the benefit obligations as they come due. Actuarial assumptions are based upon management’s best estimates and judgment.
The expected rate of return on plan assets for our U.S. pension plans represents our long-term assessment of return expectations which may change based on significant shifts in economic and financial market conditions. The long-term rate of return on plan assets is derived from return assumptions based on targeted allocations for various asset classes. While we consider the pension plans’ recent performance and other economic growth and inflation factors, which are supported by long-term historical data, the return expectations for the targeted asset categories represent a long-term prospective return.
Share-Based Compensation
Nasdaq uses the fair value method of accounting for share-based awards. Share-based awards, or equity awards, include restricted stock, PSUs, and stock options. The fair value of restricted stock awards and PSUs, other than PSUs granted with market conditions, is determined based on the grant date closing stock price less the present value of future cash dividends. We estimate the fair value of PSUs granted with market conditions using a Monte Carlo simulation model at the date of grant. The fair value of stock options are estimated using the Black-Scholes option-pricing model.
F-18

We generally recognize compensation expense for equity awards on a straight-line basis over the requisite service period of the award, taking into account an estimated forfeiture rate. Granted but unvested shares are generally forfeited upon termination of employment.
Excess tax benefits or expense related to employee share-based payments, if any, are recognized as income tax benefit or expense in the Consolidated Statements of Income when the awards vest or are settled.
Nasdaq also has an ESPP that allows eligible employees to purchase a limited number of shares of our common stock at six-month intervals, called offering periods, at 85.0% of the lower of the fair market value on the first or the last day of each offering period. The 15.0% discount given to our employees is included in compensation and benefits expense in the Consolidated Statements of Income.
See Note 11, “Share-Based Compensation,” for further discussion of our share-based compensation plans.
Merger and Strategic Initiatives
We incur incremental direct merger and strategic initiative costs relating to various completed and potential acquisitions, divestitures, and other strategic opportunities. These costs generally include integration costs, as well as legal, due diligence and other third party transaction costs. As of December 31, 2020, all planned integrations for our 2018 and 2017 acquisitions have been completed.
Fair Value Measurements
Fair value is defined as the price that would be received from selling an asset or paid to transfer a liability, or the exit price, in an orderly transaction between market participants at the measurement date. When determining the fair value measurements for assets and liabilities required or permitted to be either recorded or disclosed at fair value, we consider the principal or most advantageous market in which we would transact, and we also consider assumptions that market participants would use when pricing the asset or liability. Fair value measurement establishes a hierarchy of valuation techniques based on whether the inputs to those valuation techniques are observable or unobservable. Observable inputs reflect market data obtained from independent sources, while unobservable inputs reflect Nasdaq’s market assumptions. These two types of inputs create the following fair value hierarchy:
• Level 1-Quoted prices for identical instruments in active markets.
• Level 2-Quoted prices for similar instruments in active markets; quoted prices for identical or similar instruments in markets that are not active; and model-derived valuations whose inputs are observable or whose significant value drivers are observable.
• Level 3-Instruments whose significant value drivers are unobservable.
This hierarchy requires the use of observable market data when available.
See Note 14, “Fair Value of Financial Instruments,” for further discussion.
Tax Matters
We use the asset and liability method to determine income taxes on all transactions recorded in the consolidated financial statements. Deferred tax assets (net of valuation allowances) and deferred tax liabilities are presented net by jurisdiction as either a non-current asset or liability in our Consolidated Balance Sheets, as appropriate. Deferred tax assets and liabilities are determined based on differences between the financial statement carrying amounts and the tax basis of existing assets and liabilities (i.e., temporary differences) and are measured at the enacted rates that will be in effect when these differences are realized. If necessary, a valuation allowance is established to reduce deferred tax assets to the amount that is more likely than not to be realized.
In order to recognize and measure our unrecognized tax benefits, management determines whether a tax position is more likely than not to be sustained upon examination, including resolution of any related appeals or litigation processes, based on the technical merits of the position. Once it is determined that a position meets the recognition thresholds, the position is measured to determine the amount of benefit to be recognized in the consolidated financial statements. Interest and/or penalties related to income tax matters are recognized in income tax expense.
Subsequent Events
We have evaluated subsequent events through the issuance date of this Annual Report on Form 10-K. See Note 21, “Subsequent Events,” for further discussion.
F-19

3. Revenue From Contracts With Customers
Disaggregation of Revenue
The following tables summarize the disaggregation of revenue by major product and service and by segment for the years ended December 31, 2020, 2019 and 2018:
Year Ended December 31, 2020
Market Services
Corporate Platforms
Investment Intelligence
Market Technology Consolidated
(in millions)
Transaction-based trading and clearing, net $ 809 $ — $ — $ — $ 809 Trade management services 299 — — — 299 Listing services — 316 — — 316 IR & ESG Services — 214 — — 214 Market data — — 409 — 409 Index — — 324 — 324 Analytics — — 175 — 175 Market technology — — — 357 357 Revenues less transaction-based expenses $ 1,108 $ 530 $ 908 $ 357 $ 2,903
Year End December 31, 2019
Market Services
Corporate Platforms
Investment Intelligence
Market Technology
Other Revenues Consolidated
(in millions)
Transaction-based trading and clearing, net $ 621 $ — $ — $ — $ — $ 621 Trade management services 291 — — — — 291 Listing services — 296 — — — 296 IR & ESG Services — 200 — — — 200 Market data — — 398 — — 398 Index — — 223 — — 223 Analytics — — 158 — — 158 Market technology — — — 338 — 338 Other revenues — — — — 10 10 Revenues less transaction-based expenses $ 912 $ 496 $ 779 $ 338 $ 10 $ 2,535
Year End December 31, 2018
Market Services
Corporate Platforms
Investment Intelligence
Market Technology
Other Revenues Consolidated
(in millions)
Transaction-based trading and clearing, net $ 666 $ — $ — $ — $ — $ 666 Trade management services 292 — — — — 292 Listing services — 290 — — — 290 IR & ESG Services — 197 — — — 197 Market data — — 390 — — 390 Index — — 206 — — 206 Analytics — — 118 — — 118 Market technology — — — 270 — 270 Other revenues — — — — 97 97 Revenues less transaction-based expenses $ 958 $ 487 $ 714 $ 270 $ 97 $ 2,526
F-20

For the year ended December 31, 2020, approximately 69.8% of Market Services revenues were recognized at a point in time and 30.2% were recognized over time. For the year ended December 31, 2019, approximately 65.1% of Market Services revenues were recognized at a point in time and 34.9% were recognized over time. For the year ended December 31, 2018, approximately 63.6% of Market Services revenues were recognized at a point in time and 36.4% were recognized over time. The increase in Market Services revenues recognized at a point in time for the year ended December 31, 2020 compared with 2019 and 2018 was primarily due to higher U.S. industry trading volumes in our equity derivative trading and clearing business and higher U.S. industry trading volumes and higher European value traded in our cash equity trading business. Substantially all revenues from the Corporate Platforms, Investment Intelligence and Market Technology segments were recognized over time for the years ended December 31, 2020, 2019 and 2018.
As discussed in “Revenue From Contracts with Customers - Contract Balances,” of Note 2, “Summary of Significant Accounting Policies,” for contract durations that are one-year or greater, we do not have a material portion of transaction price allocated to unsatisfied performance obligations that are not included in deferred revenue other than for our market technology contracts.
For our market technology contracts, the following table summarizes the amount of the transaction price allocated to performance obligations that are unsatisfied as of December 31, 2020:
(in millions)
2021 $ 287 2022 174 2023 93 2024 68 2025 51 2026 and thereafter 112 Total $ 785
Market technology deferred revenue, as discussed in Note 8, “Deferred Revenue,” represents consideration received that is yet to be recognized as revenue for unsatisfied performance obligations.
4. Acquisitions and Divestiture
The financial results of the below transactions are included in our consolidated financial statements from the date of each acquisition or divestiture.
2021 Acquisition
Acquisition of Verafin
In February 2021, we completed the acquisition of Verafin, a SaaS technology provider specializing in combating fraud and money laundering, for an aggregate purchase price of $2.75 billion, subject to certain adjustments. Verafin is part of our Market Technology segment.
Nasdaq used the net proceeds from our offering of new senior notes in December 2020, commercial paper issuances, and cash on hand to fund this acquisition. See “Commercial Paper Program,” and “Senior Unsecured Notes Due 2022, 2031 and 2040,” of Note 9, “Debt Obligations,” for further discussion.
We are currently reviewing the impact of this acquisition under FASB Accounting Standards Codification Topic 805, “Business Combinations.” Any additional disclosures would not be practicable for the year ended December 31, 2020. Such disclosures will be included in our Quarterly Report on Form 10-Q for the quarter ending March 31, 2021.
2020 Acquisition
Acquisition of Solovis
In March 2020, we acquired Solovis, a provider of multi-asset class portfolio management, analytics and reporting tools across public and private markets. Solovis is part of our Investment Intelligence segment.
2019 Acquisition and Divestiture
2019 Divestiture
Divestiture of BWise
F-21

In March 2019, we sold the BWise enterprise governance, risk and compliance software platform, which was part of our IR & ESG Services business within our Corporate Platforms segment, to SAI Global and recognized a pre-tax gain on the sale of $27 million, net of disposal costs ($20 million after tax). The pre-tax gain is included in net gain on divestiture of businesses in the Consolidated Statements of Income for the year ended December 31, 2019.
2019 Acquisition
Acquisition of Cinnober Purchase
ConsiderationTotal Net Assets
Acquired Total Net Deferred
Tax LiabilityAcquired
Intangible Assets Goodwill(in millions)
Cinnober $ 219 $ 18 $ (19) $ 74 $ 146
In January 2019, we acquired Cinnober, a Swedish financial technology provider to brokers, exchanges and clearinghouses worldwide for $219 million. Cinnober is part of our Market Technology segment.
Nasdaq used cash on hand to fund this acquisition. The amounts in the table above represent the final allocation of the purchase price.
See “Intangible Assets” below for further discussion of intangible assets acquired in the Cinnober acquisition.Intangible AssetsThe following table presents the details of the customer relationships intangible asset at the date of acquisition for Cinnober which was the significant acquired intangible asset for this acquisition. All acquired intangible assets with finite lives are amortized using the straight-line method.
Customer relationships (in millions) $ 67 Discount rate used 9.5 %Estimated average useful life 13 years
Customer Relationships
Customer relationships represent the non-contractual and contractual relationships with customers.
Methodology Customer relationships were valued using the income approach, specifically an excess earnings method. The excess earnings method examines the economic returns contributed by the identified tangible and intangible assets of a company, and then isolates the excess return that is attributable to the intangible asset being valued.
Discount Rate
The discount rate used reflects the amount of risk associated with the hypothetical cash flows for the customer relationships relative to the overall business. In developing a discount rate for the customer relationships, we estimated a weighted-average cost of capital for the overall business and we employed this rate when discounting the cash flows. The resulting discounted cash flows were then tax-effected at the applicable statutory rate.
For our acquisition of Cinnober, a discounted tax amortization benefit was added to the fair value of the assets under the assumption that the customer relationships would be amortized for tax purposes over a period of 5 years.
Estimated Useful Life We estimate the useful life based on the historical behavior of the customers and a parallel analysis of the customers using the excess earnings method.
Pro Forma Results and Acquisition-Related Costs
The consolidated financial statements for the years ended December 31, 2020 and 2019 include the financial results of the above acquisitions from the dates of these acquisitions. Pro forma financial results have not been presented since these acquisitions both individually and in the aggregate were not material to our financial results.
Acquisition-related costs for the transactions described abovewere expensed as incurred and are included in merger and strategic initiatives expense in the Consolidated Statements of Income.
* * * * * *
5. Goodwill and Acquired Intangible Assets
Goodwill
The following table presents the changes in goodwill by business segment during the year ended December 31, 2020:Market Services
Corporate Platforms
Investment Intelligence
Market Technology Total
(in millions)
Balance at December 31, 2019 $ 3,342 $ 460 $ 2,283 $ 281 $ 6,366 Goodwill acquired — — 135 — 135 Foreign currency translation adjustment 177 21 123 28 349 Balance at December 31, 2020 $ 3,519 $ 481 $ 2,541 $ 309 $ 6,850
F-22

The goodwill acquired for Investment Intelligence shown above relates to our acquisition of Solovis. See “2020 Acquisition,” of Note 4, “Acquisitions and Divestiture,” for further discussion of this acquisition.
Goodwill represents the excess of purchase price over the value assigned to the net assets, including identifiable intangible assets, of a business acquired. Goodwill is allocated to our reporting units based on the assignment of the fair values of each reporting unit of the acquired company. We test goodwill for impairment at the reporting unit level annually, or in interim periods if certain events
occur indicating that the carrying amount may be impaired, such as changes in the business climate, poor indicators of operating performance or the sale or disposition of a significant portion of a reporting unit. There was no impairment of goodwill for the years ended December 31, 2020 and 2019; however, events such as prolonged economic weakness or unexpected significant declines in operating results of any of our reporting units or businesses, may result in goodwill impairment charges in the future.
* * * * * *Acquired Intangible AssetsThe following table presents details of our total acquired intangible assets, both finite- and indefinite-lived:
December 31, 2020 December 31, 2019
Gross Amount
Accumulated Amortization Net Amount
Gross Amount
Accumulated Amortization Net Amount
(in millions) (in millions)
Finite-Lived Intangible Assets Technology $ 76 $ (24) $ 52 $ 63 $ (19) $ 44 Customer relationships 1,599 (648) 951 1,596 (532) 1,064 Other 18 (6) 12 18 (5) 13 Foreign currency translation adjustment (104) 58 (46) (159) 55 (104)
Total finite-lived intangible assets $ 1,589 $ (620) $ 969 $ 1,518 $ (501) $ 1,017 Indefinite-Lived Intangible Assets
Exchange and clearing registrations $ 1,257 $ — $ 1,257 $ 1,257 $ — $ 1,257 Trade names 121 — 121 121 — 121 Licenses 52 — 52 52 — 52 Foreign currency translation adjustment (144) — (144) (198) — (198)
Total indefinite-lived intangible assets $ 1,286 $ — $ 1,286 $ 1,232 $ — $ 1,232 Total intangible assets $ 2,875 $ (620) $ 2,255 $ 2,750 $ (501) $ 2,249
Amortization expense for acquired finite-lived intangible assets was $103 million for the year ended December 31, 2020, $101 million for the year ended December 31, 2019 and $109 for the year ended December 31, 2018. These amounts are included in depreciation and amortization expense in the Consolidated Statements of Income.The estimated future amortization expense (excluding the impact of foreign currency translation adjustments of $46 million as of December 31, 2020) of acquired finite-lived intangible assets as of December 31, 2020 is as follows:
(in millions)
2021 $ 109 2022 106 2023 103 2024 98 2025 96 2026 and thereafter 503 Total $ 1,015
6. Investments
The following table presents the details of our investments:December 31,
2020December 31,
2019
(in millions)
Financial investments $ 195 $ 291
Equity method investments $ 216 $ 156 Equity securities $ 60 $ 49
Financial Investments
As of December 31, 2020, financial investments are comprised of trading securities, and are primarily comprised of highly rated European government debt securities, of which $175 million are assets primarily utilized to meet regulatory capital requirements, mainly for our clearing operations at Nasdaq Clearing. As of December 31, 2019, financial investments are comprised of trading securities, and are primarily comprised of highly rated European government debt securities, time deposits and highly rated
F-23

corporate debt securities, of which $169 million are assets primarily utilized to meet regulatory capital requirements, mainly for our clearing operations at Nasdaq Clearing.
Equity Method Investments
We record our estimated pro-rata share of earnings or losses each reporting period and record any dividends as a reduction in the investment balance. As of December 31, 2020 and 2019, our equity method investments primarily included our 40.0% equity interest in the OCC.
The carrying amounts of our equity method investments are included in other non-current assets in the Consolidated Balance Sheets. No material impairments were recorded for the years end December 31, 2020, 2019 and 2018.
Net income recognized from our equity interest in the earnings and losses of these equity method investments, primarily the OCC, was $70 million for the year ended December 31, 2020, $84 million for the year ended December 31, 2019 and $18 million for the year ended December 31, 2018. For the year ended December 31, 2020, higher equity earnings in the OCC, driven by elevated U.S. industry trading volumes, were partially offset by a rebate to clearing members in the fourth quarter of 2020.
In 2019, the SEC disapproved the OCC capital plan that had been established in 2015. Following the SEC disapproval, the OCC suspended customer rebates and dividends to owners, including the unpaid dividend on 2018 results. We were not able to determine the impact of the disapproval of the OCC capital plan on OCC's 2018 net income until March 2019, when OCC's 2018 financial statements were made available to us. As a result, during the first quarter of 2019, we recognized $36 million of additional income relating to our share of OCC's 2018 net income, which is included in the $84 million for the year ended December 31, 2019.
Equity Securities The carrying amounts of our equity securities are included in other non-current assets in the Consolidated Balance Sheets. We elected the measurement alternative for primarily all of our equity securities as they do not have a readily determinable fair value. No material adjustments were made to the carrying value of our equity securities for the years
ended December 31, 2020, 2019 and 2018. As of December 31, 2020 and December 31, 2019, our equity securities represent various strategic investments made through our corporate venture program as well as investments acquired through various acquisitions.
7. Property and Equipment, net
The following table presents our major categories of property and equipment, net:
Year Ended December 31,
2020 2019
(in millions)
Data processing equipment and software $ 732 $ 565
Furniture, equipment and leasehold improvements 300 305
Total property and equipment 1,032 870 Less: accumulated depreciation and
amortization (557) (486) Total property and equipment, net $ 475 $ 384
Depreciation and amortization expense for property and equipment was $99 million for the year ended December 31, 2020, $89 million for the year ended December 31, 2019, and $101 million for the year ended December 31, 2018. These amounts are included in depreciation and amortization expense in the Consolidated Statements of Income.
We recorded pre-tax, non-cash property and equipment asset impairment charges on capitalized software that was retired and accelerated depreciation expense on certain assets as a result of a decrease in their useful life of $14 million in 2020 and $26 million in 2019. These charges are included in restructuring charges in the Consolidated Statements of Income. See Note 20, “Restructuring Charges,” for a discussion of our 2019 restructuring plan. There were no other material impairments of property and equipment recorded in 2020, 2019 or 2018.
As of December 31, 2020 and 2019, we did not own any real estate properties.
F-24

8. Deferred Revenue
Deferred revenue represents consideration received that is yet to be recognized as revenue. The changes in our deferred revenue during the year ended December 31, 2020 are reflected in the following table:
Initial Listing Revenues
Annual Listings
Revenues
IR & ESG Services
Revenues
Investment Intelligence Revenues
Market Technology Revenues Other(1) Total
(in millions)
Balance at December 31, 2019 $ 69 $ 2 $ 41 $ 82 $ 66 $ 14 $ 274 Deferred revenue billed in the current
period, net of recognition 50 3 46 80 39 10 228 Revenue recognized that was included
in the beginning of the period (30) (2) (41) (64) (60) (10) (207) Foreign currency translation adjustment 2 (1) — (1) 8 3 11 Balance at December 31, 2020 $ 91 $ 2 $ 46 $ 97 $ 53 $ 17 $ 306
____________(1) Balance at December 31, 2020 primarily includes deferred revenue from non-U.S. listing of additional shares fees. In the
U.S., these fees will run-off in 2021 as a result of the implementation of our all-inclusive annual fee. Listing of additional shares fees are included in our Listing Services business.
As of December 31, 2020, we estimate that our deferred revenue will be recognized in the following years:
Initial Listing Revenues
Annual Listings
Revenues
IR & ESG Services
Revenues
Investment Intelligence Revenues
Market Technology Revenues Other(1) Total
(in millions)
Fiscal year ended: 2021 $ 35 $ 2 $ 42 $ 95 $ 51 $ 10 $ 235 2022 23 — 4 2 2 2 33 2023 13 — — — — 3 16 2024 10 — — — — 2 12 2025 7 — — — — — 7 2026 and thereafter 3 — — — — — 3 Total $ 91 $ 2 $ 46 $ 97 $ 53 $ 17 $ 306
____________(1) For composition of “Other” see footnote (1) above.
The timing of recognition of our deferred market technology revenues is primarily dependent upon the completion of customization and any significant modifications made pursuant to existing market technology contracts. As such, as it relates to market technology revenues, the timing represents our best estimate.
F-25

9. Debt Obligations
The following table presents the changes in the carrying amount of our debt obligations during the year ended December 31, 2020:
December 31, 2019 Additions
Payments, Foreign Currency
Translation and Accretion December 31, 2020
(in millions)
Short-term debt - commercial paper $ 391 $ 990 $ (1,381) $ — Long-term debt:
3.875% senior unsecured notes repaid on March 16, 2020 671 — (671) — 4.25% senior unsecured notes due June 1, 2024 497 — 1 498 1.75% senior unsecured notes due May 19, 2023 668 — 62 730 3.85% senior unsecured notes due June 30, 2026 497 — — 497 1.75% senior unsecured notes due March 28, 2029 665 — 61 726 0.875% senior unsecured notes due February 13, 2030 — 644 82 726 3.25% senior unsecured notes due April 28, 2050 — 485 — 485 0.445% senior unsecured notes due December 21, 2022 — 597 — 597 1.650% senior unsecured notes due January 15, 2031 — 643 — 643 2.500% senior unsecured notes due December 21, 2040 — 643 — 643 $1 billion senior unsecured revolving credit facility
terminated December 2020 (2) 799 (797) — $1.25 billion senior unsecured revolving credit facility due
December 22, 2025 — (4) — (4) Total long-term debt 2,996 3,807 (1,262) 5,541 Total debt obligations $ 3,387 $ 4,797 $ (2,643) $ 5,541
Commercial Paper Program
Our U.S. dollar commercial paper program is supported by our 2020 Credit Facility which provides liquidity support for the repayment of commercial paper issued through this program. Prior to the 2020 Credit Facility, the 2017 Credit Facility provided liquidity support for repayment of commercial paper. The 2017 Credit Facility was terminated in December 2020. See “Early Extinguishment of 2017 Credit Facility” below for further discussion of our 2017 Credit Facility. The effective interest rate of commercial paper issuances fluctuates as short term interest rates and demand fluctuate. The fluctuation of these rates due to market conditions may impact our interest expense.
In March 2020, we observed that conditions for Tier 2 commercial paper issuers were deteriorating, impacting both costs and actionable duration of commercial paper issues. To mitigate funding uncertainties and as a precautionary measure to maximize our liquidity and increase our available cash on hand, Nasdaq borrowed $799 million under the revolving credit commitment of the 2017 Credit Facility. In April 2020, Nasdaq issued the 2050 Notes and used the net proceeds to repay a portion of amounts borrowed under the 2017 Credit Facility. In June 2020, the remaining outstanding amount under the 2017 Credit Facility was repaid using cash on hand. For further discussion of the 2050 Notes, see “3.25% Senior Unsecured Notes Due 2050” below and see “Early Extinguishment of 2017 Credit Facility” below for
further discussion of our 2017 Credit Facility. As of December 31, 2020, we had no outstanding borrowings under our commercial paper program. In January 2021, we increased the size of our commercial paper program from $1 billion to $1.25 billion. In February 2021, we issued $475 million of commercial paper to partially fund the acquisition of Verafin. For further discussion of the acquisition of Verafin, see “Acquisition of Verafin,” of Note 4, “Acquisitions and Divestiture.”
Senior Unsecured Notes
Our 2022 and 2040 Notes were issued at par. The remaining senior unsecured notes were issued at a discount. As a result of the discount, the proceeds received from each issuance were less than the aggregate principal amount. As of December 31, 2020, the amounts in the table above reflect the aggregate principal amount, less the unamortized debt discount and the unamortized debt issuance costs which are being accreted through interest expense over the life of the applicable notes. For our Euro denominated notes, the “Payments, Accretion and Other” column also includes the impact of foreign currency translation. Our senior unsecured notes are general unsecured obligations of ours and rank equally with all of our existing and future unsubordinated obligations and they are not guaranteed by any of our subsidiaries. The senior unsecured notes were issued under indentures that, among other things, limit our ability to
F-26

consolidate, merge or sell all or substantially all of our assets, create liens, and enter into sale and leaseback transactions.
Upon a change of control triggering event (as defined in the various note indentures), the terms require us to repurchase all or part of each holder’s notes for cash equal to 101% of the aggregate principal amount purchased plus accrued and unpaid interest, if any.
Early Extinguishment of 3.875% Senior Unsecured Notes Due 2021
Nasdaq issued the 2021 Notes in June 2013. The 2021 Notes paid interest annually at a rate of 3.875% per annum.
In March 2020, we primarily used the net proceeds from the 2030 Notes to repay in full and terminate our 2021 Notes. For further discussion of the 2030 Notes, see “0.875% Senior Unsecured Notes Due 2030” below. In connection with the early extinguishment of the 2021 Notes, we recorded a charge of $36 million, which primarily included a make-whole redemption price premium. This charge is included in general, administrative and other expense in the Consolidated Statements of Income for the year ended December 31, 2020.
4.25% Senior Unsecured Notes Due 2024
In May 2014, Nasdaq issued the 2024 Notes. The 2024 Notes pay interest semiannually at a rate of 4.25% per annum until June 1, 2024. Such interest rate may vary with Nasdaq’s debt rating, to the extent Nasdaq is downgraded below investment grade, up to a rate not to exceed 6.25%.
1.75% Senior Unsecured Notes Due 2023
In May 2016, Nasdaq issued the 2023 Notes. The 2023 Notes pay interest annually at a rate of 1.75% per annum until May 19, 2023. Such interest rate may vary with Nasdaq’s debt rating, to the extent Nasdaq is downgraded below investment grade, up to a rate not to exceed 3.75%.
The 2023 Notes have been designated as a hedge of our net investment in certain foreign subsidiaries to mitigate the foreign exchange rate risk associated with certain investments in these subsidiaries. The increase in the carrying amount of $62 million noted in the “Payments, Foreign Currency Translation and Accretion” column in the table above primarily reflects the translation of the 2023 Notes into U.S. dollars and is recorded in accumulated other comprehensive loss within stockholders’ equity in the Consolidated Balance Sheets as of December 31, 2020.
3.85% Senior Unsecured Notes Due 2026
In June 2016, Nasdaq issued the 2026 Notes. The 2026 Notes pay interest semi-annually at a rate of 3.85% per annum until June 30, 2026. Such interest rate may vary with Nasdaq’s debt rating, to the extent Nasdaq is downgraded below investment grade, up to a rate not to exceed 5.85%.
1.75% Senior Unsecured Notes Due 2029
In April 2019, Nasdaq issued the 2029 Notes. The 2029 Notes pay interest annually at a rate of 1.75% per annum until March 28, 2029. Such interest rate may vary with
Nasdaq’s debt rating, to the extent Nasdaq is downgraded below investment grade, up to a rate not to exceed 3.75%. The 2029 Notes may be redeemed by Nasdaq at any time, subject to a make-whole amount.
The 2029 Notes have been designated as a hedge of our net investment in certain foreign subsidiaries to mitigate the foreign exchange risk associated with certain investments in these subsidiaries. The increase in the carrying amount of $61 million noted in the “Payments, Foreign Currency Translation and Accretion” column in the table above primarily reflects the translation of the 2029 Notes into U.S. dollars and is recorded in accumulated other comprehensive loss within stockholders’ equity in the Consolidated Balance Sheets as of December 31, 2020.
0.875% Senior Unsecured Notes Due 2030
In February 2020, Nasdaq issued the 2030 Notes. The 2030 Notes pay interest annually in arrears, which began on February 13, 2021 and may be redeemed by Nasdaq at any time, subject to a make-whole amount. The interest rate of 0.875% may vary with Nasdaq's debt rating, to the extent Nasdaq is downgraded below investment grade, up to a rate not to exceed 1.875%. The proceeds from the 2030 Notes, approximately $644 million after issuing the notes at a discount and deducting underwriting fees of the offering, were primarily used to redeem the 2021 Notes and for other general corporate purposes. For further discussion of the 2021 Notes, see “Early Extinguishment of 3.875% Senior Unsecured Notes Due 2021” above.
The 2030 Notes were designated as a hedge of our net investment in certain foreign subsidiaries to mitigate the foreign exchange risk associated with certain investments in these subsidiaries. The increase in the carrying amount of $82 million noted in the “Payments, Foreign Currency Translation and Accretion” column in the table above primarily reflects the translation of the 2030 Notes into U.S. dollars and is recorded in accumulated other comprehensive loss within stockholders’ equity in the Consolidated Balance Sheets as of December 31, 2020.
3.25% Senior Unsecured Notes Due 2050
In April 2020, Nasdaq issued the 2050 Notes. The 2050 Notes pay interest semi-annually in arrears, which began on October 28, 2020 and may be redeemed by Nasdaq at any time, subject to a make-whole amount. The interest rate of 3.25% may vary with Nasdaq's debt rating, to the extent Nasdaq is downgraded below investment grade, up to a rate not to exceed 5.25%. The net proceeds from the 2050 Notes were approximately $485 million after issuing the notes at a discount and deducting underwriting fees of the offering. In April 2020, we used the net proceeds from the 2050 Notes to repay a portion of amounts previously borrowed under the 2017 Credit Facility. See “Early Extinguishment of 2017 Credit Facility” below for further discussion of our 2017 Credit Facility.
F-27

Senior Unsecured Notes Due 2022, 2031 and 2040
In December 2020, Nasdaq issued the 2022, 2031 and 2040 Notes. The net proceeds were used to partially finance the acquisition of Verafin. For further discussion of the acquisition of Verafin, see “Acquisition of Verafin,” of Note 4, “Acquisitions and Divestiture.”
0.445% Senior Unsecured Notes Due 2022
The 2022 Notes pay interest semi-annually in arrears, beginning on June 21, 2021 and may be redeemed by Nasdaq at any time, subject to a make-whole amount. The proceeds from the 2022 Notes were approximately $597 million after deducting underwriting fees of the offering. The interest rate of 0.445% may vary with Nasdaq's debt rating, to the extent Nasdaq is downgraded below investment grade, up to a rate not to exceed 1.445%.
1.650% Senior Unsecured Notes Due 2031
The 2031 Notes pay interest semi-annually in arrears, which began on January 15, 2021 and may be redeemed by Nasdaq at any time, subject to a make-whole amount. The proceeds from the 2031 Notes were approximately $643 million after issuing the notes at a discount and deducting underwriting fees of the offering. The interest rate of 1.650% may vary with Nasdaq's debt rating, to the extent Nasdaq is downgraded below investment grade, up to a rate not to exceed 2.65%.
2.500% Senior Unsecured Notes Due 2040
The 2040 Notes pay interest semi-annually in arrears, beginning on June 21, 2021 and may be redeemed by Nasdaq at any time, subject to a make-whole amount. The proceeds from the 2040 Notes were approximately $643 million after deducting the underwriting fees of the offering. The interest rate of 2.500% may vary with Nasdaq's debt rating, to the extent Nasdaq is downgraded below investment grade, up to a rate not to exceed 3.50%.
Credit Facilities
Early Extinguishment of 2017 Credit Facility
In April 2017, Nasdaq entered into the 2017 Credit Facility. Under our 2017 Credit Facility, borrowings bore interest on the principal amount outstanding at a variable interest rate based on either the LIBOR or the base rate (or other applicable rate with respect to non-dollar borrowings), plus an applicable margin that varied with Nasdaq’s debt rating.
In December 2020 we terminated our 2017 Credit Facility. No amounts were outstanding at the time of termination.
2020 Credit Facility
In December 2020, Nasdaq entered into the 2020 Credit Facility. The 2020 Credit Facility consists of a $1.25 billion five-year revolving credit facility (with sublimits for non-dollar borrowings, swingline borrowings and letters of credit), which replaced the 2017 Credit Facility. Nasdaq intends to use funds available under the 2020 Credit Facility for general corporate purposes and to provide liquidity
support for the repayment of commercial paper issued through the commercial paper program. Nasdaq is permitted to repay borrowings under our 2020 Credit Facility at any time in whole or in part, without penalty.
As of December 31, 2020, no amounts were outstanding on the 2020 Credit Facility. The $(4) million balance represents unamortized debt issuance costs which are being accreted through interest expense over the life of the credit facility.
Under our 2020 Credit Facility, borrowings under the revolving credit facility and swingline borrowings bear interest on the principal amount outstanding at a variable interest rate based on either the LIBOR or the base rate (as defined in the credit agreement) (or other applicable rate with respect to non-dollar borrowings), plus an applicable margin that varies with Nasdaq’s debt rating. We are charged commitment fees of 0.125% to 0.350%, depending on our credit rating, whether or not amounts have been borrowed. These commitment fees are included in interest expense and were not material for the year ended December 31, 2020.
The 2020 Credit Facility contains financial and operating covenants. Financial covenants include a maximum leverage ratio. Operating covenants include, among other things, limitations on Nasdaq’s ability to incur additional indebtedness, grant liens on assets, dispose of assets and make certain restricted payments. The facility also contains customary affirmative covenants, including access to financial statements, notice of defaults and certain other material events, maintenance of properties and insurance, and customary events of default, including cross-defaults to our material indebtedness.
The 2020 Credit Facility includes an option for Nasdaq to increase the available aggregate amount by up to $625 million subject to the consent of the lenders funding the increase and certain other conditions.
Other Credit Facilities
Certain of our European subsidiaries have several other credit facilities, which are available in multiple currencies, primarily to support our Nasdaq Clearing operations in Europe, as well to provide a cash pool credit line for one subsidiary. These credit facilities, in aggregate, totaled $232 million as of December 31, 2020 and $203 million as of December 31, 2019 in available liquidity, none of which was utilized as of December 31, 2020, and of which $15 million was utilized as of December 31, 2019. Generally, these facilities each have a one year term. The amounts borrowed under these various credit facilities bear interest on the principal amount outstanding at a variable interest rate based on a base rate (as defined in the applicable credit agreement), plus an applicable margin. We are charged commitment fees (as defined in the applicable credit agreement), whether or not amounts have been borrowed. These commitment fees are included in interest expense and were not material for the years ended December 31, 2020, 2019 and 2018.
These facilities include customary affirmative and negative operating covenants and events of default.
F-28

Debt Covenants
As of December 31, 2020, we were in compliance with the covenants of all of our debt obligations.
Transition from LIBOR
Nasdaq is currently evaluating the impact of the transition from LIBOR as an interest rate benchmark to other potential alternative reference rates. Currently, Nasdaq has debt instruments in place that reference LIBOR-based rates. As of December 31, 2020, we did not have material risk exposure to LIBOR through our outstanding debt instruments or other transactions.
10. Retirement Plans
Defined Contribution Savings Plan
We sponsor a 401(k) Plan for U.S. employees. Employees are immediately eligible to make contributions to the plan and are also eligible for an employer contribution match at an amount equal to 100.0% of the first 6.0% of eligible employee contributions. Savings plan expense included in compensation and benefits expense in the Consolidated Statements of Income was $14 million for the year ended December 31, 2020, $13 million for the year ended December 31, 2019 and $14 million for the year ended December 31, 2018.
Pension and Supplemental Executive Retirement Plans
We maintain non-contributory, defined-benefit pension plans, non-qualified SERPs for certain senior executives and other post-retirement benefit plans for eligible employees in the U.S., collectively referred to as the Nasdaq Benefit Plans. Our pension plans and SERPs are frozen. Future service and salary for all participants do not count toward an accrual of benefits under the pension plans and SERPs. Most employees outside the U.S. are covered by local retirement plans or by applicable social laws. Benefits under social laws are generally expensed in the periods in which the costs are incurred. The total expense for these plans is included in compensation and benefits expense in the Consolidated Statements of Income and was $23 million for the year ended December 31, 2020, $20 million for the year ended December 31, 2019 and $22 million for the year ended December 31, 2018.
Nasdaq recognizes the funded status of the Nasdaq Benefit Plans, measured as the difference between the fair value of the plan assets and the benefit obligation, in the Consolidated Balance Sheets. The fair value of our U.S. defined-benefit pension plans' assets was $119 million as of December 31, 2020 and $110 million as of December 31, 2019 and the benefit obligation was $118 million as of December 31, 2020 and $110 million as of December 31, 2019. As a result, the U.S. defined-benefit pension plans are fully funded as of December 31, 2020 and 2019. During 2020 and 2019, we did not make any contributions to our U.S. defined-benefit pension plans. For our SERP and other post-retirement benefit plans, the net underfunded liability was $30 million as of December 31, 2020 and $33 million as of December 31,
2019. The underfunded liability for the above plans is included in accrued personnel costs and other non-current liabilities in the Consolidated Balance Sheets. The plan assets of the Nasdaq Benefit Plans are invested per target allocations adopted by Nasdaq’s Pension and 401(k) Committee and are primarily invested in collective fund investments that have underlying investments in fixed income securities. The collective fund investments are valued at net asset value which is a practical expedient to estimate fair value.
Accumulated Other Comprehensive Loss
As of December 31, 2020, accumulated other comprehensiveloss for the Nasdaq Benefit Plans was $25 million reflecting an unrecognized net loss of $32 million, partially offset by an income tax benefit of $7 million, primarily due to our pension plans.
Estimated Future Benefit Payments
We expect to make the following benefit payments to participants in the next ten fiscal years under the Nasdaq Benefit Plans:
Pension SERP Total
Fiscal Year Ended: (in millions)
2021 $ 8 $ 7 $ 15 2022 7 2 9 2023 7 2 9 2024 8 2 10 2025 8 2 10 2026 through 2030 40 8 48 $ 78 $ 23 $ 101
11. Share-Based Compensation
We have a share-based compensation program for employees and non-employee directors. Share-based awards granted under this program include restricted stock (consisting of restricted stock units), PSUs and stock options. For accounting purposes, we consider PSUs to be a form of restricted stock.
Summary of Share-Based Compensation Expense
The following table shows the total share-based compensation expense resulting from equity awards and the 15.0% discount for the ESPP for the years ended December 31, 2020, 2019 and 2018, which is included in compensation and benefits expense in the Consolidated Statements of Income: Year Ended December 31,
2020 2019 2018 (in millions)
Share-based compensation expense before income taxes $ 87 $ 79 $ 69
Income tax benefit (23) (21) (19) Share-based compensation
expense after income taxes $ 64 $ 58 $ 50
F-29

Common Shares Available Under Our Equity Plan
As of December 31, 2020, we had approximately 9.8 million shares of common stock authorized for future issuance under our Equity Plan.
Restricted Stock
We grant restricted stock to most active employees. The grant date fair value of restricted stock awards is based on the closing stock price at the date of grant less the present value of future cash dividends. Restricted stock awards granted to employees below the manager level generally vest 33.3% on the first anniversary of the grant date, 33.3% on the second anniversary of the grant date, and 33.3% on the third anniversary of the grant date. Restricted stock awards granted to employees at or above the manager level generally vest 33.3% on the second anniversary of the grant date, 33.3% on the third anniversary of the grant date, and 33.3% on the fourth anniversary of the grant date.
Summary of Restricted Stock Activity
The following table summarizes our restricted stock activity for the years ended December 31, 2020, 2019 and 2018:
Restricted Stock
Number of Awards
Weighted-Average Grant Date Fair
Value
Unvested at December 31, 2017 1,988,500 $ 57.34
Granted 550,544 81.66 Vested (702,832) 48.64 Forfeited (252,837) 63.86 Unvested at December 31,
2018 1,583,375 $ 68.62 Granted 605,033 85.03 Vested (548,588) 61.45 Forfeited (153,064) 73.99 Unvested at December 31,
2019 1,486,756 $ 77.38 Granted 743,300 89.93 Vested (499,357) 72.95 Forfeited (91,648) 81.17 Unvested at December 31,
2020 1,639,051 $ 84.21
As of December 31, 2020, $70 million of total unrecognized compensation cost related to restricted stock is expected to be recognized over a weighted-average period of 1.8 years.
PSUs
PSUs are based on performance measures that impact the amount of shares that each recipient will receive upon vesting. Prior to April 1, 2020, we had two performance-based PSU programs for certain officers, a one-year performance-based program and a three-year cumulative performance-based program that focuses on TSR. Effective with new equity awards issued on April 1, 2020, to better
align the equity programs for eligible officers, the one-year performance-based program was eliminated and all eligible officers will participate in the three-year cumulative performance-based program. While the performance periods are complete for all PSUs granted under the one-year performance-based program, some shares underlying these PSUs have not vested.
One-Year PSU Program
The grant date fair value of PSUs under the one-year performance-based program was based on the closing stock price at the date of grant less the present value of future cash dividends. Under this program, an eligible employee received a target grant of PSUs, but could have received from 0.0% to 150.0% of the target amount granted, depending on the achievement of performance measures. These awards vest ratably on an annual basis over a three-year period commencing with the end of the one-year performance period. Compensation cost is recognized over the performance period and the three-year vesting period based on the probability that such performance measures will be achieved, taking into account an estimated forfeiture rate.
Three-Year PSU Program
Under the three-year performance-based program, each eligible individual receives PSUs, subject to market conditions, with a three-year cumulative performance period that vest at the end of the performance period. Compensation cost is recognized over the three-year performance period, taking into account an estimated forfeiture rate, regardless of whether the market condition is satisfied, provided that the requisite service period has been completed. Performance will be determined by comparing Nasdaq’s TSR to two peer groups, each weighted 50.0%. The first peer group consists of exchange companies, and the second peer group consists of all companies in the S&P 500. Nasdaq’s relative performance ranking against each of these groups will determine the final number of shares delivered to each individual under the program. The award issuance under this program will be between 0.0% and 200.0% of the number of PSUs granted and will be determined by Nasdaq’s overall performance against both peer groups. However, if Nasdaq’s TSR is negative for the three-year performance period, regardless of TSR ranking, the award issuance will not exceed 100.0% of the number of PSUs granted. We estimate the fair value of PSUs granted under the three-year PSU program using the Monte Carlo simulation model, as these awards contain a market condition.
Grants of PSUs that were issued in 2018 with a three-year performance period exceeded the applicable performance parameters. As a result, an additional 150,290 units above the original target were granted in the first quarter of 2021 and were fully vested upon issuance.
The following weighted-average assumptions were used to determine the weighted-average fair values of the PSU awards granted under the three-year PSU program for the years ended December 31, 2020 and 2019:
F-30
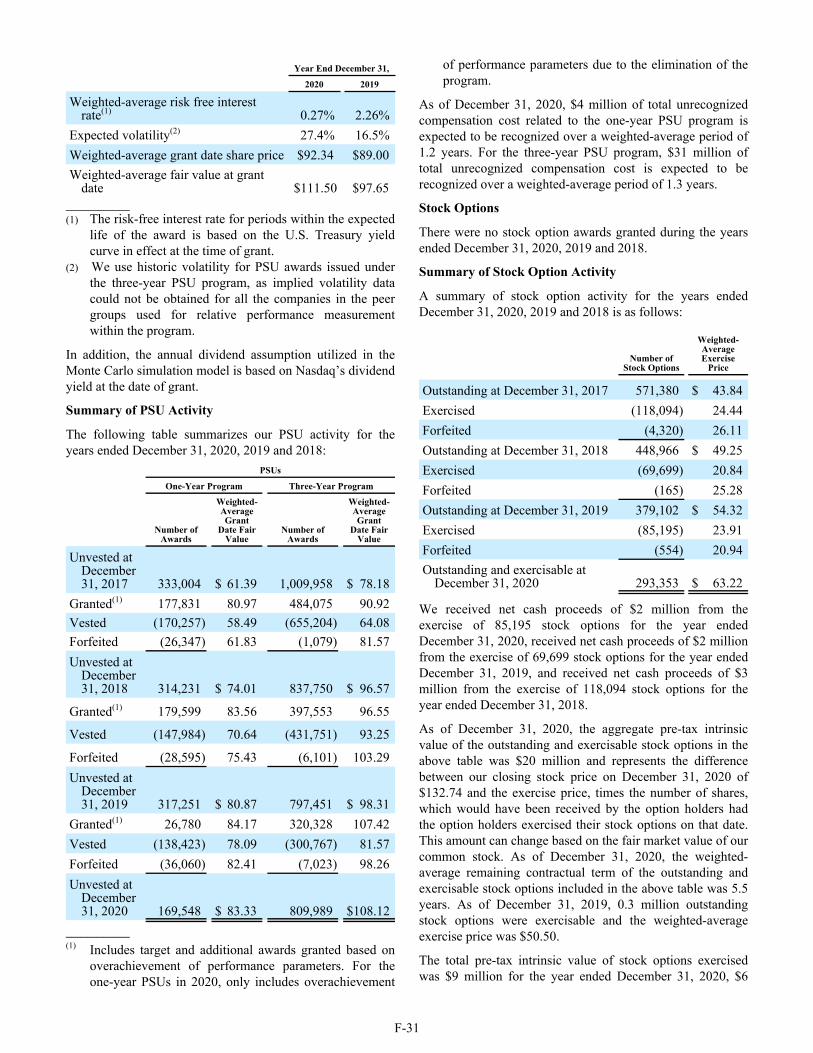
Year End December 31,
2020 2019
Weighted-average risk free interest rate(1) 0.27% 2.26%
Expected volatility(2) 27.4% 16.5% Weighted-average grant date share price $92.34 $89.00Weighted-average fair value at grant
date $111.50 $97.65____________(1) The risk-free interest rate for periods within the expected
life of the award is based on the U.S. Treasury yield curve in effect at the time of grant.
(2) We use historic volatility for PSU awards issued under the three-year PSU program, as implied volatility data could not be obtained for all the companies in the peer groups used for relative performance measurement within the program.
In addition, the annual dividend assumption utilized in the Monte Carlo simulation model is based on Nasdaq’s dividend yield at the date of grant.
Summary of PSU Activity
The following table summarizes our PSU activity for the years ended December 31, 2020, 2019 and 2018:
PSUs
One-Year Program Three-Year Program
Number of Awards
Weighted-Average Grant
Date Fair Value
Number of Awards
Weighted-Average Grant
Date Fair Value
Unvested at December 31, 2017 333,004 $ 61.39 1,009,958 $ 78.18
Granted(1) 177,831 80.97 484,075 90.92 Vested (170,257) 58.49 (655,204) 64.08 Forfeited (26,347) 61.83 (1,079) 81.57 Unvested at
December 31, 2018 314,231 $ 74.01 837,750 $ 96.57
Granted(1) 179,599 83.56 397,553 96.55
Vested (147,984) 70.64 (431,751) 93.25
Forfeited (28,595) 75.43 (6,101) 103.29 Unvested at
December 31, 2019 317,251 $ 80.87 797,451 $ 98.31
Granted(1) 26,780 84.17 320,328 107.42 Vested (138,423) 78.09 (300,767) 81.57 Forfeited (36,060) 82.41 (7,023) 98.26 Unvested at
December 31, 2020 169,548 $ 83.33 809,989 $ 108.12
____________(1) Includes target and additional awards granted based on
overachievement of performance parameters. For the one-year PSUs in 2020, only includes overachievement
of performance parameters due to the elimination of the program.
As of December 31, 2020, $4 million of total unrecognized compensation cost related to the one-year PSU program is expected to be recognized over a weighted-average period of 1.2 years. For the three-year PSU program, $31 million of total unrecognized compensation cost is expected to be recognized over a weighted-average period of 1.3 years.
Stock Options
There were no stock option awards granted during the years ended December 31, 2020, 2019 and 2018.
Summary of Stock Option Activity
A summary of stock option activity for the years ended December 31, 2020, 2019 and 2018 is as follows:
Number of Stock Options
Weighted-Average Exercise
Price
Outstanding at December 31, 2017 571,380 $ 43.84 Exercised (118,094) 24.44 Forfeited (4,320) 26.11 Outstanding at December 31, 2018 448,966 $ 49.25 Exercised (69,699) 20.84 Forfeited (165) 25.28 Outstanding at December 31, 2019 379,102 $ 54.32 Exercised (85,195) 23.91 Forfeited (554) 20.94 Outstanding and exercisable at
December 31, 2020 293,353 $ 63.22
We received net cash proceeds of $2 million from the exercise of 85,195 stock options for the year ended December 31, 2020, received net cash proceeds of $2 million from the exercise of 69,699 stock options for the year ended December 31, 2019, and received net cash proceeds of $3 million from the exercise of 118,094 stock options for the year ended December 31, 2018.
As of December 31, 2020, the aggregate pre-tax intrinsic value of the outstanding and exercisable stock options in the above table was $20 million and represents the difference between our closing stock price on December 31, 2020 of $132.74 and the exercise price, times the number of shares, which would have been received by the option holders had the option holders exercised their stock options on that date. This amount can change based on the fair market value of our common stock. As of December 31, 2020, the weighted-average remaining contractual term of the outstanding and exercisable stock options included in the above table was 5.5 years. As of December 31, 2019, 0.3 million outstanding stock options were exercisable and the weighted-average exercise price was $50.50.
The total pre-tax intrinsic value of stock options exercised was $9 million for the year ended December 31, 2020, $6
F-31
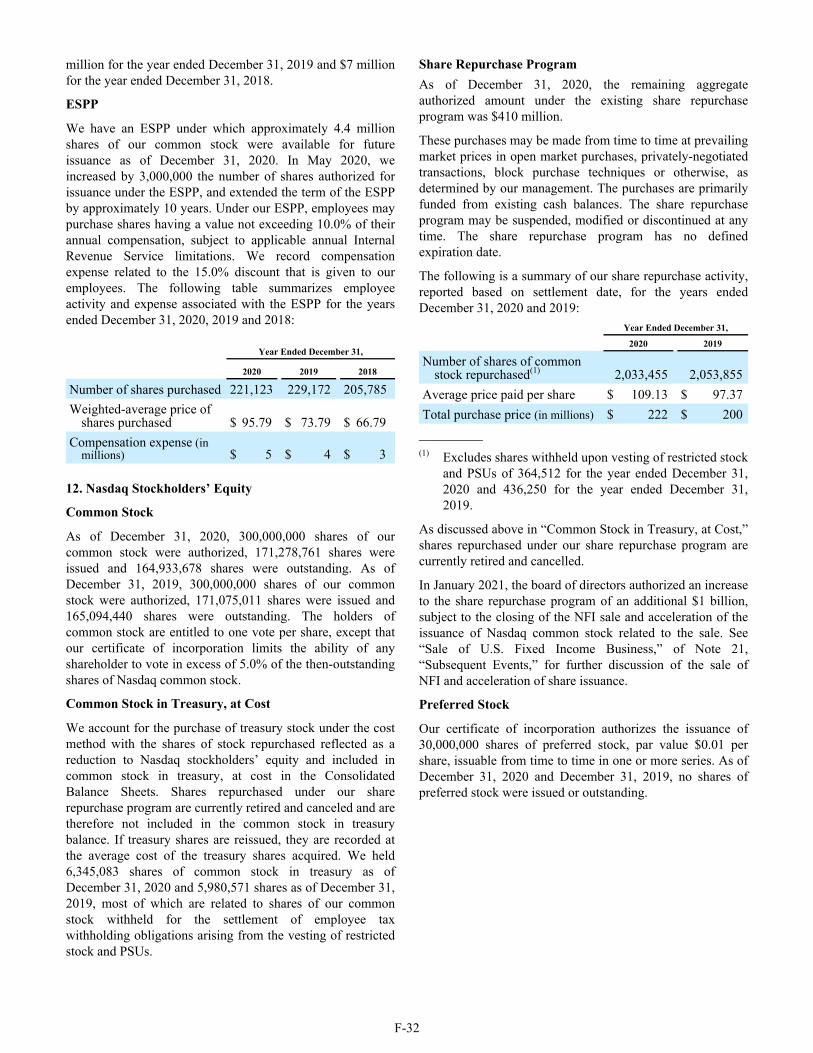
million for the year ended December 31, 2019 and $7 million for the year ended December 31, 2018.
ESPP
We have an ESPP under which approximately 4.4 million shares of our common stock were available for future issuance as of December 31, 2020. In May 2020, we increased by 3,000,000 the number of shares authorized for issuance under the ESPP, and extended the term of the ESPP by approximately 10 years. Under our ESPP, employees may purchase shares having a value not exceeding 10.0% of their annual compensation, subject to applicable annual Internal Revenue Service limitations. We record compensation expense related to the 15.0% discount that is given to our employees. The following table summarizes employee activity and expense associated with the ESPP for the years ended December 31, 2020, 2019 and 2018:
Year Ended December 31,
2020 2019 2018
Number of shares purchased 221,123 229,172 205,785 Weighted-average price of
shares purchased $ 95.79 $ 73.79 $ 66.79 Compensation expense (in
millions) $ 5 $ 4 $ 3
12. Nasdaq Stockholders’ Equity
Common Stock
As of December 31, 2020, 300,000,000 shares of our common stock were authorized, 171,278,761 shares were issued and 164,933,678 shares were outstanding. As of December 31, 2019, 300,000,000 shares of our common stock were authorized, 171,075,011 shares were issued and 165,094,440 shares were outstanding. The holders of common stock are entitled to one vote per share, except that our certificate of incorporation limits the ability of any shareholder to vote in excess of 5.0% of the then-outstanding shares of Nasdaq common stock.
Common Stock in Treasury, at Cost
We account for the purchase of treasury stock under the cost method with the shares of stock repurchased reflected as a reduction to Nasdaq stockholders’ equity and included in common stock in treasury, at cost in the Consolidated Balance Sheets. Shares repurchased under our share repurchase program are currently retired and canceled and are therefore not included in the common stock in treasury balance. If treasury shares are reissued, they are recorded at the average cost of the treasury shares acquired. We held 6,345,083 shares of common stock in treasury as of December 31, 2020 and 5,980,571 shares as of December 31, 2019, most of which are related to shares of our common stock withheld for the settlement of employee tax withholding obligations arising from the vesting of restricted stock and PSUs.
Share Repurchase ProgramAs of December 31, 2020, the remaining aggregate authorized amount under the existing share repurchase program was $410 million.
These purchases may be made from time to time at prevailing market prices in open market purchases, privately-negotiated transactions, block purchase techniques or otherwise, as determined by our management. The purchases are primarily funded from existing cash balances. The share repurchase program may be suspended, modified or discontinued at any time. The share repurchase program has no defined expiration date.
The following is a summary of our share repurchase activity, reported based on settlement date, for the years ended December 31, 2020 and 2019:
Year Ended December 31,
2020 2019
Number of shares of common stock repurchased(1) 2,033,455 2,053,855
Average price paid per share $ 109.13 $ 97.37 Total purchase price (in millions) $ 222 $ 200
____________(1) Excludes shares withheld upon vesting of restricted stock
and PSUs of 364,512 for the year ended December 31, 2020 and 436,250 for the year ended December 31, 2019.
As discussed above in “Common Stock in Treasury, at Cost,” shares repurchased under our share repurchase program are currently retired and cancelled.
In January 2021, the board of directors authorized an increase to the share repurchase program of an additional $1 billion, subject to the closing of the NFI sale and acceleration of the issuance of Nasdaq common stock related to the sale. See “Sale of U.S. Fixed Income Business,” of Note 21, “Subsequent Events,” for further discussion of the sale of NFI and acceleration of share issuance.
Preferred Stock
Our certificate of incorporation authorizes the issuance of 30,000,000 shares of preferred stock, par value $0.01 per share, issuable from time to time in one or more series. As of December 31, 2020 and December 31, 2019, no shares of preferred stock were issued or outstanding.
F-32

Cash Dividends on Common Stock
During 2020, our board of directors declared the following cash dividends:
Declaration Date
Dividend PerCommon
Share Record Date Total Amount Paid Payment Date
(in millions) January 28, 2020 $ 0.47 March 13, 2020 $ 78 March 27, 2020April 22, 2020 0.49 June 12, 2020 80 June 26, 2020July 22, 2020 0.49 September 11, 2020 81 September 25, 2020October 21, 2020 0.49 December 4, 2020 81 December 18, 2020
$ 320
The total amount paid of $320 million was recorded in retained earnings in the Consolidated Balance Sheets at December 31, 2020.
In January 2021, the board of directors approved a regular quarterly cash dividend of $0.49 per share on our outstanding common stock. The dividend is payable on March 26, 2021 to shareholders of record at the close of business on March 12, 2021. The estimated amount of this dividend is $81 million. Future declarations of quarterly dividends and the establishment of future record and payment dates are subject to approval by the board of directors.
Our board of directors maintains a dividend policy with the intention to provide stockholders with regular and growing dividends over the long term as earnings and cash flow grow.
13. Earnings Per Share
The following table sets forth the computation of basic and diluted earnings per share: Year Ended December 31,
2020 2019 2018
Numerator: (in millions, except share and per share amounts)
Net income attributable to common shareholders $ 933 $ 774 $ 458 Denominator: Weighted-average common shares outstanding for basic earnings per share 164,415,191 164,931,628 165,349,471 Weighted-average effect of dilutive securities:
Employee equity awards(1) 2,135,532 1,679,922 1,988,610 Contingent issuance of common stock(2) 353,218 358,611 353,218
Weighted-average common shares outstanding for diluted earnings per share 166,903,941 166,970,161 167,691,299 Basic and diluted earnings per share: Basic earnings per share $ 5.67 $ 4.69 $ 2.77 Diluted earnings per share $ 5.59 $ 4.63 $ 2.73
____________(1) PSUs, which are considered contingently issuable, are included in the computation of dilutive earnings per share on a
weighted average basis when management determines that the applicable performance criteria would have been met if the performance period ended as of the date of the relevant computation.
(2) See “Non-Cash Contingent Consideration,” of Note 18, “Commitments, Contingencies and Guarantees,” for further discussion.
Securities that were not included in the computation of diluted earnings per share because their effect was antidilutive were immaterial for the years ended 2020, 2019 and 2018.
F-33

14. Fair Value of Financial Instruments
The following tables present our financial assets and financial liabilities that were measured at fair value on a recurring basis as of December 31, 2020 and December 31, 2019. December 31, 2020 December 31, 2019 Total Level 1 Level 2 Level 3 Total Level 1 Level 2 Level 3
(in millions) (in millions)
Assets at Fair ValueEuropean government debt securities $ 156 $ 156 $ — $ — $ 157 $ 157 $ — $ — Corporate debt securities 2 — 2 — 34 — 34 — State owned enterprises and municipal
securities 15 — 15 — 24 — 24 — Swedish mortgage bonds 22 — 22 — 19 — 19 — Time deposits — — — — 57 — 57 —
Total assets at fair value $ 195 $ 156 $ 39 $ — $ 291 $ 157 $ 134 $ —
Financial Instruments Not Measured at Fair Value on a Recurring BasisSome of our financial instruments are not measured at fair value on a recurring basis but are recorded at amounts that approximate fair value due to their liquid or short-term nature. Such financial assets and financial liabilities include: cash and cash equivalents, restricted cash and cash equivalents, receivables, net, certain other current assets, accounts payable and accrued expenses, Section 31 fees payable to SEC, accrued personnel costs, commercial paper and certain other current liabilities.Our investment in OCC is accounted for under the equity method of accounting. We have elected the measurement alternative for the majority of our equity securities, which primarily represent various strategic investments made through our corporate venture program. See “Equity Method Investments,” and “Equity Securities,” of Note 6, “Investments,” for further discussion.
We also consider our debt obligations to be financial instruments. As of December 31, 2020, the majority of our debt obligations were fixed-rate obligations. We were exposed to changes in interest rates as a result of borrowings under our 2017 Credit Facility and we are exposed to changes in interest rates under our 2020 Credit Facility, as the interest rates on these facility have a variable interest rate. We are also exposed to changes in interest rates as a result of the amounts outstanding from the sale of commercial paper under our commercial paper program. As of December 31, 2020, we had no outstanding borrowings under our 2020 Credit Facility or commercial paper program. The fair value of our debt obligations utilizing prevailing market rates for our fixed rate debt was $5.9 billion as of December 31, 2020 and the fair value of our debt obligations, utilizing discounted cash flow analyses for our floating rate debt and prevailing market rates for our fixed rate debt was $3.6 billion as of December 31, 2019. The discounted cash flow analyses are based on borrowing rates currently available to us for debt with similar terms and maturities. The fair value of our commercial paper as of December 31, 2019 approximated the
carrying value since the rates of interest on this short-term debt approximated market rates. Our commercial paper and our fixed rate and floating rate debt are categorized as Level 2 in the fair value hierarchy.
For further discussion of our debt obligations, see Note 9, “Debt Obligations.”Non-Financial Assets Measured at Fair Value on a Non-Recurring Basis
Our non-financial assets, which include goodwill, intangible assets, and other long-lived assets, are not required to be carried at fair value on a recurring basis. Fair value measures of non-financial assets are primarily used in the impairment analysis of these assets. Any resulting asset impairment would require that the non-financial asset be recorded at its fair value. Nasdaq uses Level 3 inputs to measure the fair value of the above assets on a non-recurring basis. As of December 31, 2020 and December 31, 2019, there were no non-financial assets measured at fair value on a non-recurring basis.
15. Clearing Operations
Nasdaq Clearing
Nasdaq Clearing is authorized and supervised under EMIR as a multi-asset clearinghouse by the SFSA. Such authorization is effective for all member states of the European Union and certain other non-member states that are part of the European Economic Area, including Norway. The clearinghouse acts as the CCP for exchange and OTC trades in equity derivatives, fixed income derivatives, resale and repurchase contracts, power derivatives, emission allowance derivatives, and seafood derivatives.
Through our clearing operations in the financial markets, which include the resale and repurchase market, the commodities markets, and the seafood market, Nasdaq Clearing is the legal counterparty for, and guarantees the fulfillment of, each contract cleared. These contracts are not used by Nasdaq Clearing for the purpose of trading on its own behalf. As the legal counterparty of each transaction,
F-34

Nasdaq Clearing bears the counterparty risk between the purchaser and seller in the contract. In its guarantor role, Nasdaq Clearing has precisely equal and offsetting claims to and from clearing members on opposite sides of each contract, standing as the CCP on every contract cleared. In accordance with the rules and regulations of Nasdaq Clearing, default fund and margin collateral requirements are calculated for each clearing member’s positions in accounts with the CCP. See “Default Fund Contributions and Margin Deposits” below for further discussion of Nasdaq Clearing’s default fund and margin requirements.
Nasdaq Clearing maintains four member sponsored default funds: one related to financial markets, one related to commodities markets, one related to the seafood market, and a mutualized fund. Under this structure, Nasdaq Clearing and its clearing members must contribute to the total regulatory capital related to the clearing operations of Nasdaq Clearing. This structure applies an initial separation of default fund contributions for the financial, commodities and seafood markets in order to create a buffer for each market’s counterparty risks. Simultaneously, a mutualized default fund provides capital efficiencies to Nasdaq Clearing’s members with regard to total regulatory capital required. See “Default Fund Contributions” below for further discussion of Nasdaq Clearing’s default fund. Power of assessment and a liability waterfall also have been implemented. See “Power of Assessment” and “Liability Waterfall” below for further discussion. These requirements align risk between Nasdaq Clearing and its clearing members.
Nasdaq Commodities Clearing Default
In September 2018, a member of the Nasdaq Clearing commodities market defaulted due to inability to post sufficient collateral to cover increased margin requirements for the positions of the relevant member, which had experienced losses due to sharp adverse movements in the Nordic - German power market spread. Nasdaq Clearing followed default procedures and offset the future market risk on the defaulting member’s positions. The default resulted in an initial loss of $133 million. In accordance with the liability waterfall, the first $8 million of the loss was allocated to Nasdaq Clearing’s junior capital and the remainder was allocated on a pro-rata basis to the commodities clearing members’ default funds. In September 2018, these funds were replenished.
Immediately following the event, Nasdaq Clearing launched a comprehensive enhancement program to strengthen the resilience and robustness of the clearinghouse.
In December 2018, we initiated a capital relief program. The capital relief program was a voluntary program open to each commodities default fund participant; each such participant who agreed to the capital relief program received a proportion of the funds made available under the capital relief program as reflected by their proportionate share of the aggregate of the clearing members' default fund replenishments. In 2018, we recorded a charge of $23 million related to this program.
Since the member default in 2018, Nasdaq Clearing has been working to maximize the recovery from the defaulted member. All funds recovered are applied towards the default fund participants on a pro rata basis. As of December 31, 2020, the expected recovery together with the capital relief program amounts to approximately 80% of the initial loss, of which the majority has been paid and the remainder is expected to be paid during 2021.
In December 2018, the SFSA initiated a review of Nasdaq Clearing. On January 27, 2021, the SFSA issued a warning combined with an administrative fine of approximately $36 million (SEK 300 million) to Nasdaq Clearing based on their review. Nasdaq Clearing has assessed the SFSA´s decision and has decided to appeal the decision to the Administrative Court. As of December 31, 2020, no accrual has been recorded related to this matter as the outcome cannot be reasonably estimated.
Default Fund Contributions and Margin Deposits
As of December 31, 2020, clearing member default fund contributions and margin deposits were as follows: December 31, 2020
Cash Contributions
Non-Cash Contributions
Total Contributions
(in millions)
Default fund contributions $ 529 $ 99 $ 628
Margin deposits 3,413 5,511 8,924
Total $ 3,942 $ 5,610 $ 9,552
Of the total default fund contributions of $628 million, Nasdaq Clearing can utilize $556 million as capital resources in the event of a counterparty default. The remaining balance of $72 million pertains to member posted surplus balances.
Our clearinghouse holds material amounts of clearing member cash deposits which are held or invested primarily to provide security of capital while minimizing credit, market and liquidity risks. While we seek to achieve a reasonable rate of return, we are primarily concerned with preservation of capital and managing the risks associated with these deposits.
Clearing member cash contributions are maintained in demand deposits held at central banks and large, highly rated financial institutions or secured through direct investments, primarily central bank certificates and highly rated European government debt securities with original maturities of 90 days or less, reverse repurchase agreements and supranational debt securities. Investments in reverse repurchase agreements are secured with highly rated government securities with maturity dates that range from 4 days to 7 days. The carrying value of these securities approximates their fair value due to the short-term nature of the instruments and reverse repurchase agreements.
Nasdaq Clearing has invested the total cash contributions of $3,942 million as of December 31, 2020 and $2,996 million
F-35

as of December 31, 2019, in accordance with its investment policy as follows: December 31, 2020 December 31, 2019 (in millions)
Demand deposits $ 2,086 $ 1,328 Central bank certificates 1,111 896 European government debt
securities 470 508 Reverse repurchase
agreements 180 116 Supranational debt
securities 95 148
Total $ 3,942 $ 2,996
In the investment activity related to default fund and margin contributions, we are exposed to counterparty risk related to reverse repurchase agreement transactions, which reflect the risk that the counterparty might become insolvent and, thus, fail to meet its obligations to Nasdaq Clearing. We mitigate this risk by only engaging in transactions with high credit quality reverse repurchase agreement counterparties and by limiting the acceptable collateral under the reverse repurchase agreement to high quality issuers, primarily government securities and other securities explicitly guaranteed by a government. The value of the underlying security is monitored during the lifetime of the contract, and in the event the market value of the underlying security falls below the reverse repurchase amount, our clearinghouse may require additional collateral or a reset of the contract.
Default Fund Contributions
Required contributions to the default funds are proportional to the exposures of each clearing member. When a clearing member is active in more than one market, contributions must be made to all markets’ default funds in which the member is active. Clearing members’ eligible contributions may include cash and non-cash contributions. Cash contributions received are maintained in demand deposits held at central banks and large, highly rated financial institutions or invested by Nasdaq Clearing, in accordance with its investment policy, either in central bank certificates, highly rated government debt securities, reverse repurchase agreements with highly rated government debt securities as collateral, or supranational debt securities. Nasdaq Clearing maintains and manages all cash deposits related to margin collateral. All risks and rewards of collateral ownership, including interest, belong to Nasdaq Clearing. Clearing members’ cash contributions are included in default funds and margin deposits in the Consolidated Balance Sheets as both a current asset and a current liability. Non-cash contributions include highly rated government debt securities that must meet specific criteria approved by Nasdaq Clearing. Non-cash contributions are pledged assets that are not recorded in the Consolidated Balance Sheets as Nasdaq Clearing does not take legal ownership of these assets and the risks and rewards remain with the clearing members. These balances may fluctuate over time due to changes in the
amount of deposits required and whether members choose to provide cash or non-cash contributions. Assets pledged are held at a nominee account in Nasdaq Clearing’s name for the benefit of the clearing members and are immediately accessible by Nasdaq Clearing in the event of a default. In addition to clearing members’ required contributions to the liability waterfall, Nasdaq Clearing is also required to contribute capital to the liability waterfall and overall regulatory capital as specified under its clearinghouse rules. As of December 31, 2020, Nasdaq Clearing committed capital totaling $145 million to the liability waterfall and overall regulatory capital, in the form of government debt securities, which are recorded as financial investments in the Consolidated Balance Sheets. The combined regulatory capital of the clearing members and Nasdaq Clearing is intended to secure the obligations of a clearing member exceeding such member’s own margin and default fund deposits and may be used to cover losses sustained by a clearing member in the event of a default.
Margin Deposits
Nasdaq Clearing requires all clearing members to provide collateral, which may consist of cash and non-cash contributions, to guarantee performance on the clearing members’ open positions, or initial margin. In addition, clearing members must also provide collateral to cover the daily margin call if needed. See “Default Fund Contributions” above for further discussion of cash and non-cash contributions.
Similar to default fund contributions, Nasdaq Clearing maintains and manages all cash deposits related to margin collateral. All risks and rewards of collateral ownership, including interest, belong to Nasdaq Clearing and are recorded in revenues. These cash deposits are recorded in default funds and margin deposits in the Consolidated Balance Sheets as both a current asset and a current liability. Pledged margin collateral is not recorded in our Consolidated Balance Sheets as all risks and rewards of collateral ownership, including interest, belong to the counterparty. Assets pledged are held at a nominee account in Nasdaq Clearing’s name for the benefit of the clearing members and are immediately accessible by Nasdaq Clearing in the event of a default.
Nasdaq Clearing marks to market all outstanding contracts and requires payment from clearing members whose positions have lost value. The mark-to-market process helps identify any clearing members that may not be able to satisfy their financial obligations in a timely manner allowing Nasdaq Clearing the ability to mitigate the risk of a clearing member defaulting due to exceptionally large losses. In the event of a default, Nasdaq Clearing can access the defaulting member’s margin and default fund deposits to cover the defaulting member’s losses.
Regulatory Capital and Risk Management Calculations
Nasdaq Clearing manages risk through a comprehensive counterparty risk management framework, which is
F-36

comprised of policies, procedures, standards and financial resources. The level of regulatory capital is determined in accordance with Nasdaq Clearing’s regulatory capital and default fund policy, as approved by the SFSA. Regulatory capital calculations are continuously updated through a proprietary capital-at-risk calculation model that establishes the appropriate level of capital.
As mentioned above, Nasdaq Clearing is the legal counterparty for each contract cleared and thereby guarantees the fulfillment of each contract. Nasdaq Clearing accounts for this guarantee as a performance guarantee. We determine the fair value of the performance guarantee by considering daily settlement of contracts and other margining and default fund requirements, the risk management program, historical evidence of default payments, and the estimated probability of potential default payouts. The calculation is determined using proprietary risk management software that simulates gains and losses based on historical market prices, extreme but plausible market scenarios, volatility and other factors present at that point in time for those particular unsettled contracts. Based on this analysis, excluding any liability related to the Nasdaq commodities clearing default (see discussion above), the estimated liability was nominal and no liability was recorded as of December 31, 2020.
Power of Assessment
To further strengthen the contingent financial resources of the clearinghouse, Nasdaq Clearing has power of assessment that provides the ability to collect additional funds from its clearing members to cover a defaulting member’s remaining obligations up to the limits established under the terms of the clearinghouse rules. The power of assessment corresponds to 230.0% of the clearing member’s aggregate contribution to the financial, commodities and seafood markets’ default funds.
Liability Waterfall
The liability waterfall is the priority order in which the capital resources would be utilized in the event of a default where the defaulting clearing member’s collateral would not be sufficient to cover the cost to settle its portfolio. If a default occurs and the defaulting clearing member’s collateral, including cash deposits and pledged assets, is depleted, then capital is utilized in the following amount and order:
• junior capital contributed by Nasdaq Clearing, which totaled $39 million as of December 31, 2020;
• a loss sharing pool related only to the financial market that is contributed to by clearing members and only applies if the defaulting member’s portfolio includes interest rate swap products;
• specific market default fund where the loss occurred (i.e., the financial, commodities, or seafood market), which includes capital contributions of the clearing members on a pro-rata basis;
• senior capital contributed to each specific market by Nasdaq Clearing, calculated in accordance with clearinghouse rules, which totaled $24 million as of December 31, 2020; and
• mutualized default fund, which includes capital contributions of the clearing members on a pro-rata basis.
If additional funds are needed after utilization of the liability waterfall, then Nasdaq Clearing will utilize its power of assessment and additional capital contributions will be required by non-defaulting members up to the limits established under the terms of the clearinghouse rules.
In addition to the capital held to withstand counterparty defaults described above, Nasdaq Clearing also has committed capital of $82 million to ensure that it can handle an orderly wind-down of its operation, and that it is adequately protected against investment, operational, legal, and business risks.
Market Value of Derivative Contracts Outstanding
The following table includes the market value of derivative contracts outstanding prior to netting: December 31, 2020
(in millions)
Commodity and seafood options, futures and forwards(1)(2)(3) $ 122
Fixed-income options and futures(1)(2) 773 Stock options and futures(1)(2) 175 Index options and futures(1)(2) 68 Total $ 1,138
____________(1) We determined the fair value of our option contracts
using standard valuation models that were based on market-based observable inputs including implied volatility, interest rates and the spot price of the underlying instrument.
(2) We determined the fair value of our futures contracts based upon quoted market prices and average quoted market yields.
(3) We determined the fair value of our forward contracts using standard valuation models that were based on market-based observable inputs including LIBOR rates and the spot price of the underlying instrument.
F-37

Derivative Contracts Cleared
The following table includes the total number of derivative contracts cleared through Nasdaq Clearing for the years ended December 31, 2020 and 2019:
December 31, 2020 December 31, 2019
Commodity and seafood options, futures and forwards(1) 672,219 542,557
Fixed-income options and futures 21,299,713 21,464,522
Stock options and futures 19,757,733 23,777,980 Index options and futures 51,371,391 47,595,114 Total 93,101,056 93,380,173
____________
(1) The total volume in cleared power related to commodity contracts was 956 Terawatt hours (TWh) for the year ended December 31, 2020 and 842 TWh for the year ended December 31, 2019.
The outstanding contract value of resale and repurchase agreements was $0.3 billion as of December 31, 2020 and 2019. The total number of contracts cleared was 4,832,504 for the year ended December 31, 2020 and was 6,627,103 for the year ended December 31, 2019.
16. Leases
We have operating leases which are primarily real estate leases for our U.S. and European headquarters and for general office space. The following table provides supplemental balance sheet information related to Nasdaq's operating leases:
Leases Balance Sheet Classification
December 31, 2020
December 31, 2019
(in millions)
Assets:
Operating lease assets
Operating lease assets $ 381 $ 346
Liabilities:
Current lease liabilities
Other current liabilities $ 46 $ 61
Non-current lease liabilities
Operating lease liabilities 389 331
Total lease liabilities $ 435 $ 392
The following table summarizes Nasdaq's lease cost: Year Ended December 31,
2020 2019
(in millions)
Operating lease cost(1) $ 85 $ 79 Variable lease cost 26 23 Sublease income (4) (5) Total lease cost $ 107 $ 97
____________
(1) Includes short-term lease cost, which was immaterial.
In 2018, prior to the adoption of ASU 2016-02, rent expense for operating leases was $82 million, which is net of immaterial amounts of sublease income.
The following table reconciles the undiscounted cash flows for each of the first five years and total of the remaining years to the operating lease liabilities recorded in our Consolidated Balance Sheets.
December 31, 2020
(in millions)
2021 $ 62 2022 56 2023 52 2024 45 2025 32 2026 and thereafter 311 Total lease payments 558 Less: interest(1) (123) Present value of lease liabilities(2) $ 435
____________(1) Calculated using the interest rate for each lease.(2) Includes the current portion of $46 million.
The following table provides information related to Nasdaq's lease term and discount rate:
December 31, 2020
Weighted-average remaining lease term (in years) 11.5
Weighted-average discount rate 4.2 %
The following table provides supplemental cash flow information related to Nasdaq's operating leases:
Years End December 31,
2020 2019
(in millions)
Cash paid for amounts included in the measurement of operating lease liabilities $ 77 $ 78
Lease assets obtained in exchange for new operating lease liabilities $ 100 $ 26
17. Income Taxes
The Tax Cuts and Jobs Act was enacted in December 2017 and included a number of changes to previous U.S. tax laws that impacted Nasdaq, most notably a reduction of the U.S. corporate income tax rate from 35 percent to 21 percent for tax years beginning after December 31, 2017. In accordance with Staff Accounting Bulletin No.118, during the fourth quarter of 2018, we completed our accounting for the tax effects of the act, finalizing our analysis of the act and subsequent guidance issued by the U.S. Internal Revenue Service. As a result, we recorded a $290 million non-cash tax
F-38

charge, reducing deferred tax assets relating to foreign currency translation.
Income Before Income Tax Provision
The following table presents the domestic and foreign components of income before income tax provision:
Year Ended December 31,
2020 2019 2018
(in millions)
Domestic $ 898 $ 691 $ 636 Foreign 314 328 428 Income before income tax
provision $ 1,212 $ 1,019 $ 1,064
Income Tax ProvisionThe income tax provision consists of the following amounts:
Year Ended December 31,
2020 2019 2018
(in millions)
Current income taxes provision: Federal $ 114 $ 120 $ 103 State 50 40 56 Foreign 74 50 146 Total current income taxes
provision 238 210 305 Deferred income taxes provision
(benefit): Federal 37 27 185 State 6 7 116 Foreign (2) 1 — Total deferred income taxes
provision 41 35 301 Total income tax provision $ 279 $ 245 $ 606
We have determined that undistributed earnings of certain non-U.S. subsidiaries will be reinvested for an indefinite period of time. We have both the intent and ability to indefinitely reinvest these earnings. As of December 31, 2020, the cumulative amount of undistributed earnings in these subsidiaries is $280 million. Given our intent to reinvest these earnings for an indefinite period of time, we have not accrued a deferred tax liability on these earnings. A determination of an unrecognized deferred tax liability related to these earnings is not practicable.
A reconciliation of the income tax provision, based on the U.S. federal statutory rate, to our actual income tax provision for the years ended December 31, 2020, 2019 and 2018 is as follows:
Year Ended December 31,
2020 2019 2018
Federal income tax provision at the statutory rate 21.0 % 21.0 % 21.0 %
State income tax provision, net of federal effect 4.2 % 4.1 % 3.7 %
Change in deferred taxes due to U.S. tax law changes — % — % 27.0 %
Excess tax benefits related to employee share-based compensation (0.6) % (0.5) % (0.7) %
Non-U.S. subsidiary earnings 0.5 % 1.0 % 0.4 %Tax credits and deductions (0.2) % (0.2) % (0.2) %Change in unrecognized tax
benefits (0.6) % (0.1) % 4.7 %Other, net (1.3) % (1.3) % 1.1 %Actual income tax provision 23.0 % 24.0 % 57.0 %
The majority of the decrease in our effective tax rate in 2020 compared to 2019 was the result of favorable audit settlements and remeasurement of our deferred inventory, which is included in “Other, net” in the table above. The decrease in our effective tax rate in 2019 compared to 2018 was primarily due to the remeasurement of our U.S. deferred tax inventory in 2018 from the Tax Cuts and Jobs Act. The higher effective tax rate in 2018 was also impacted by the reversal of certain Swedish tax benefits recorded in prior years.
The effective tax rate may vary from period to period depending on, among other factors, the geographic and business mix of earnings and losses. These same and other factors, including history of pre-tax earnings and losses, are taken into account in assessing the ability to realize deferred tax assets.
Deferred Income TaxesThe temporary differences, which give rise to our deferred tax assets and (liabilities), consisted of the following:
F-39
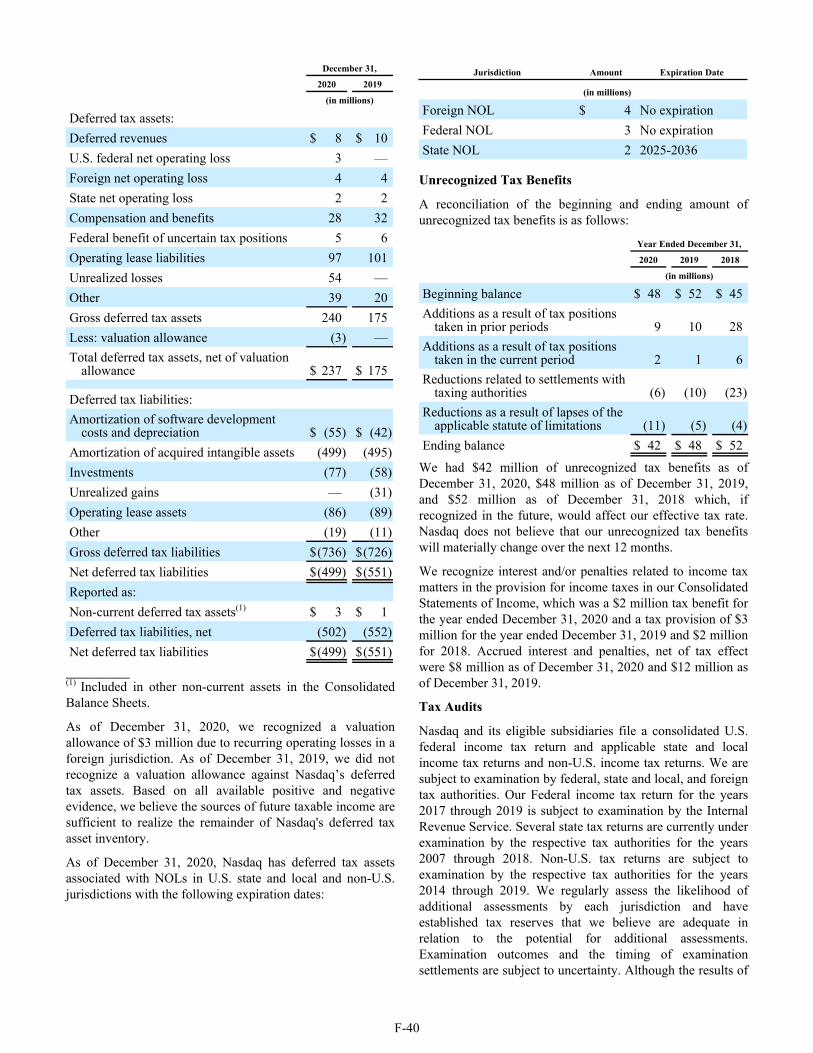
December 31,
2020 2019
(in millions)
Deferred tax assets: Deferred revenues $ 8 $ 10 U.S. federal net operating loss 3 — Foreign net operating loss 4 4 State net operating loss 2 2 Compensation and benefits 28 32 Federal benefit of uncertain tax positions 5 6 Operating lease liabilities 97 101 Unrealized losses 54 — Other 39 20 Gross deferred tax assets 240 175 Less: valuation allowance (3) — Total deferred tax assets, net of valuation
allowance $ 237 $ 175
Deferred tax liabilities: Amortization of software development
costs and depreciation $ (55) $ (42) Amortization of acquired intangible assets (499) (495) Investments (77) (58) Unrealized gains — (31) Operating lease assets (86) (89) Other (19) (11) Gross deferred tax liabilities $ (736) $ (726) Net deferred tax liabilities $ (499) $ (551) Reported as:Non-current deferred tax assets(1) $ 3 $ 1 Deferred tax liabilities, net (502) (552) Net deferred tax liabilities $ (499) $ (551)
____________(1) Included in other non-current assets in the Consolidated Balance Sheets.
As of December 31, 2020, we recognized a valuation allowance of $3 million due to recurring operating losses in a foreign jurisdiction. As of December 31, 2019, we did not recognize a valuation allowance against Nasdaq’s deferred tax assets. Based on all available positive and negative evidence, we believe the sources of future taxable income are sufficient to realize the remainder of Nasdaq's deferred tax asset inventory.
As of December 31, 2020, Nasdaq has deferred tax assets associated with NOLs in U.S. state and local and non-U.S. jurisdictions with the following expiration dates:
Jurisdiction Amount Expiration Date
(in millions)
Foreign NOL $ 4 No expirationFederal NOL 3 No expirationState NOL 2 2025-2036
Unrecognized Tax Benefits
A reconciliation of the beginning and ending amount of unrecognized tax benefits is as follows:
Year Ended December 31,
2020 2019 2018
(in millions)
Beginning balance $ 48 $ 52 $ 45 Additions as a result of tax positions
taken in prior periods 9 10 28 Additions as a result of tax positions
taken in the current period 2 1 6 Reductions related to settlements with
taxing authorities (6) (10) (23) Reductions as a result of lapses of the
applicable statute of limitations (11) (5) (4) Ending balance $ 42 $ 48 $ 52
We had $42 million of unrecognized tax benefits as of December 31, 2020, $48 million as of December 31, 2019, and $52 million as of December 31, 2018 which, if recognized in the future, would affect our effective tax rate. Nasdaq does not believe that our unrecognized tax benefits will materially change over the next 12 months.
We recognize interest and/or penalties related to income tax matters in the provision for income taxes in our Consolidated Statements of Income, which was a $2 million tax benefit for the year ended December 31, 2020 and a tax provision of $3 million for the year ended December 31, 2019 and $2 million for 2018. Accrued interest and penalties, net of tax effect were $8 million as of December 31, 2020 and $12 million as of December 31, 2019.
Tax Audits
Nasdaq and its eligible subsidiaries file a consolidated U.S. federal income tax return and applicable state and local income tax returns and non-U.S. income tax returns. We are subject to examination by federal, state and local, and foreign tax authorities. Our Federal income tax return for the years 2017 through 2019 is subject to examination by the Internal Revenue Service. Several state tax returns are currently under examination by the respective tax authorities for the years 2007 through 2018. Non-U.S. tax returns are subject to examination by the respective tax authorities for the years 2014 through 2019. We regularly assess the likelihood of additional assessments by each jurisdiction and have established tax reserves that we believe are adequate in relation to the potential for additional assessments. Examination outcomes and the timing of examination settlements are subject to uncertainty. Although the results of
F-40
such examinations may have an impact on our unrecognized tax benefits, we do not anticipate that such impact will be material to our consolidated financial position or results of operations. We do not expect to settle any material tax audits in the next twelve months.
The Swedish Tax Agency disallowed certain interest expense deductions for the years 2013 - 2018. We appealed this decision to the Lower Administrative Court which denied our appeal in 2018. During 2018, we further appealed to the Administrative Court of Appeal, however, we were no longer able to assert that we were more than likely to be successful and, as such, we recorded a related tax expense. In November 2019, the Administrative Court of Appeal upheld the disallowance of these deductions. As we have not recognized any benefits related to the disallowed deductions and we have paid the related assessments from the Swedish Tax Agency, the decision of the Administrative Court of Appeal does not impact our consolidated financial statements.
18. Commitments, Contingencies and Guarantees
Guarantees Issued and Credit Facilities Available
In addition to the default fund contributions and margin collateral pledged by clearing members discussed in Note 15, “Clearing Operations,” we have obtained financial guarantees and credit facilities which are guaranteed by us through counter indemnities, to provide further liquidity related to our clearing businesses. Financial guarantees issued to us totaled $5 million as of December 31, 2020 and $11 million as of December 31, 2019. As discussed in “Other Credit Facilities,” of Note 9, “Debt Obligations,” we also have credit facilities primarily related to our Nasdaq Clearing operations, which are available in multiple currencies, and totaled $232 million as of December 31, 2020 and $203 million as of December 31, 2019 in available liquidity, none of which was utilized as of December 31, 2020, and of which $15 million was utilized as of December 31, 2019.
Execution Access is our introducing broker which operates the trading platform for our Fixed Income business to trade in U.S. Treasury securities. Execution Access has a clearing arrangement with ICBC. As of December 31, 2020, we have contributed $13 million of clearing deposits to ICBC in connection with this clearing arrangement. These deposits are recorded in other current assets in our Consolidated Balance Sheets. Some of the trading activity in Execution Access is cleared by ICBC through the Fixed Income Clearing Corporation, with ICBC acting as agent. Execution Access assumes the counterparty risk of clients that do not clear through the Fixed Income Clearing Corporation. Counterparty risk of clients exists for Execution Access between the trade date and the settlement date of the individual transactions, which is at least one business day (or more, if specified by the U.S. Treasury issuance calendar). Counterparties that do not clear through the Fixed Income Clearing Corporation are subject to a credit due diligence process and may be required to post collateral, provide principal letters, or provide other forms of credit enhancement to Execution Access for the purpose of
mitigating counterparty risk. Daily position trading limits are also enforced for such counterparties.
We believe that the potential for us to be required to make payments under these arrangements is mitigated through the pledged collateral and our risk management policies. Accordingly, no contingent liability is recorded in the Consolidated Balance Sheets for these arrangements. However, no guarantee can be provided that these arrangements will at all times be sufficient.
Other Guarantees
Through our clearing operations in the financial markets, Nasdaq Clearing is the legal counterparty for, and guarantees the performance of, its clearing members. See Note 15, “Clearing Operations,” for further discussion of Nasdaq Clearing performance guarantees.
We have provided a guarantee related to lease obligations for The Nasdaq Entrepreneurial Center, Inc., which is a not-for-profit organization designed to convene, connect and engage aspiring and current entrepreneurs. This entity is not included in the consolidated financial statements of Nasdaq.
We believe that the potential for us to be required to make payments under these arrangements is unlikely. Accordingly, no contingent liability is recorded in the Consolidated Balance Sheets for the above guarantees.
Non-Cash Contingent Consideration
As part of the purchase price consideration of a prior acquisition, we have agreed to future annual issuances of 992,247 shares of Nasdaq common stock which approximated certain tax benefits associated with the transaction. Such contingent future issuances of Nasdaq common stock will be issued annually through 2027 if Nasdaq’s total gross revenues equal or exceed $25 million in each such year. The contingent future issuances of Nasdaq common stock are subject to anti-dilution protections and acceleration upon certain events.
In February 2021, we announced that we entered into a Purchase Agreement to sell NFI. Upon the consummation of this transaction, the aggregate number of Nasdaq shares that remain subject to this contingent obligation is expected to be reduced (pursuant to the discounting adjustment provisions set forth in the original purchase agreement for Nasdaq's acquisition of the business) and accelerated, which would result in an issuance of an aggregate of approximately 6.2 million shares of Nasdaq common stock. See “Sale of U.S. Fixed Income Business,” of Note 21, “Subsequent Events,” for further discussion of this transaction.
Routing Brokerage Activities
One of our broker-dealer subsidiaries, Nasdaq Execution Services, provides a guarantee to securities clearinghouses and exchanges under its standard membership agreements, which require members to guarantee the performance of other members. If a member becomes unable to satisfy its obligations to a clearinghouse or exchange, other members
F-41

would be required to meet its shortfalls. To mitigate these performance risks, the exchanges and clearinghouses often require members to post collateral, as well as meet certain minimum financial standards. Nasdaq Execution Services’ maximum potential liability under these arrangements cannot be quantified. However, we believe that the potential for Nasdaq Execution Services to be required to make payments under these arrangements is unlikely. Accordingly, no contingent liability is recorded in the Consolidated Balance Sheets for these arrangements.
Acquisition of Verafin
For further discussion of our acquisition of Verafin, see “Acquisition of Verafin,” of Note 4, “Acquisitions and Divestiture.”
Legal and Regulatory Matters
Litigation
As previously disclosed, we are named as one of many defendants in City of Providence v. BATS Global Markets, Inc., et al., 14 Civ. 2811 (S.D.N.Y.), which was filed on April 18, 2014 in the United States District Court for the Southern District of New York. The district court appointed lead counsel, who filed an amended complaint on September 2, 2014. The amended complaint names as defendants seven national exchanges, as well as Barclays PLC, which operated a private alternative trading system. On behalf of a putative class of securities traders, the plaintiffs allege that the defendants engaged in a scheme to manipulate the markets through high-frequency trading; the amended complaint asserts claims against us under Section 10(b) of the Exchange Act and Rule 10b-5, as well as under Section 6(b) of the Exchange Act. The plaintiffs seek injunctive and monetary relief of an unspecified amount. We filed a motion to dismiss the amended complaint on November 3, 2014. In response, the plaintiffs filed a second amended complaint on November 24, 2014, which names the same defendants and alleges essentially the same violations. We then filed a motion to dismiss the second amended complaint on January 23, 2015. On August 26, 2015, the district court entered an order dismissing the second amended complaint in its entirety. The plaintiffs appealed the judgment of dismissal to the United States Court of Appeals for the Second Circuit (although opting not to appeal the dismissal with respect to Barclays PLC or the dismissal of claims under Section 6(b) of the Exchange Act). On December 19, 2017, the Second Circuit issued an opinion vacating the district court’s judgment of dismissal and remanding to the district court for further proceedings. On May 18, 2018, the exchanges filed a motion to dismiss the amended complaint, raising issues not addressed in the proceedings to date. On May 28, 2019, the district court denied the exchanges’ renewed motion to dismiss. The parties are currently engaged in the discovery process. On June 17, 2019, the exchanges filed a motion to certify the district court’s order for immediate review by the Second Circuit and on July 16, 2019, the district court denied the motion. Given the preliminary nature of the proceedings, we are unable to estimate what, if any, liability may result
from this litigation. However, we believe that the claims are without merit and will continue to litigate vigorously.
Nasdaq Commodities Clearing Default
During September 2018, a clearing member of Nasdaq Clearing's commodities market was declared in default. In December 2018, the SFSA initiated a review of Nasdaq Clearing. We have been cooperating fully with the SFSA in their review. On January 27, 2021, the SFSA issued a warning combined with an administrative fine of approximately $36 million (SEK 300 million) to Nasdaq Clearing relating to its review. Nasdaq Clearing has assessed the SFSA's decision and has decided to appeal the decision to the Administrative Court. See “Nasdaq Commodities Clearing Default,” of Note 15, “Clearing Operations,” for further information.
Other Matters
Except as disclosed above and in prior reports filed under the Exchange Act, we are not currently a party to any litigation or proceeding that we believe could have a material adverse effect on our business, consolidated financial condition, or operating results. However, from time to time, we have been threatened with, or named as a defendant in, lawsuits or involved in regulatory proceedings.
In the normal course of business, Nasdaq discusses matters with its regulators raised during regulatory examinations or otherwise subject to their inquiries. Management believes that censures, fines, penalties or other sanctions that could result from any ongoing examinations or inquiries will not have a material impact on its consolidated financial position or results of operations. However, we are unable to predict the outcome or the timing of the ultimate resolution of these matters, or the potential fines, penalties or injunctive or other equitable relief, if any, that may result from these matters.
Tax Audits
We are engaged in ongoing discussions and audits with taxing authorities on various tax matters, the resolutions of which are uncertain. Currently, there are matters that may lead to assessments, some of which may not be resolved for several years. Based on currently available information, we believe we have adequately provided for any assessments that could result from those proceedings where it is more likely than not that we will be assessed. We review our positions on these matters as they progress. See “Tax Audits,” of Note 17, “Income Taxes,” for further discussion.
19. Business Segments
We manage, operate and provide our products and services in four business segments: Market Services, Corporate Platforms, Investment Intelligence and Market Technology. See Note 1, “Organization and Nature of Operations,” for further discussion of our reportable segments.
Our management allocates resources, assesses performance and manages these businesses as four separate segments. We
F-42

evaluate the performance of our segments based on several factors, of which the primary financial measure is operating income. Results of individual businesses are presented based on our management accounting practices and structure. Our
chief operating decision maker does not review total assets or statements of income below operating income by segments as key performance metrics; therefore, such information is not presented below.
The following table presents certain information regarding our business segments for the years ended December 31, 2020, 2019 and 2018:
Market Services
Corporate Platforms
Investment Intelligence
Market Technology
Corporate Items Consolidated
(in millions)
Year Ended December 31, 2020 Total revenues $ 3,832 $ 530 $ 908 $ 357 $ — $ 5,627 Transaction-based expenses (2,724) — — — — (2,724) Revenues less transaction-based expenses 1,108 530 908 357 — 2,903 Depreciation and amortization 78 34 57 $ 33 — 202 Operating income (loss) 687 190 580 32 (255) 1,234 Purchase of property and equipment 63 30 52 43 — 188 Year Ended December 31, 2019 Total revenues $ 2,639 $ 496 $ 779 $ 338 $ 10 $ 4,262 Transaction-based expenses (1,727) — — — — (1,727) Revenues less transaction-based expenses 912 496 779 338 10 2,535 Depreciation and amortization 74 34 52 30 — 190 Operating income (loss) 516 178 490 54 (221) 1,017 Purchase of property and equipment 30 27 30 40 — 127 Year Ended December 31, 2018Total revenues $ 2,709 $ 487 $ 714 $ 270 $ 97 $ 4,277 Transaction-based expenses (1,751) — — — — (1,751) Revenues less transaction-based expenses 958 487 714 270 97 2,526 Depreciation and amortization 95 36 51 21 7 210 Operating income (loss) 544 155 460 34 (165) 1,028 Purchase of property and equipment 28 29 17 37 — 111
Certain amounts are allocated to corporate items in our management reports as we believe they do not contribute to a meaningful evaluation of a particular segment's ongoing operating performance. These items, which are shown in the table below, include the following:
Amortization expense of acquired intangible assets: We amortize intangible assets acquired in connection with various acquisitions. Intangible asset amortization expense can vary from period to period due to episodic acquisitions completed, rather than from our ongoing business operations. As such, if intangible asset amortization is included in performance measures, it is more difficult to assess the day-to-day operating performance of the segments, and the relative operating performance of the segments between periods. Management does not consider intangible asset amortization expense for the purpose of evaluating the performance of our segments or their managers or when making decisions to allocate resources. Therefore, we believe performance measures excluding intangible asset amortization expense provide management with a useful representation of our segments' ongoing activity in each period.
Merger and strategic initiatives expense: We have pursued various strategic initiatives and completed acquisitions and divestitures in recent years that have resulted in expenses which would not have otherwise been incurred. These expenses generally include integration costs, as well as legal, due diligence and other third party transaction costs. The frequency and the amount of such expenses vary significantly based on the size, timing and complexity of the transaction. Management does not consider merger and strategic initiatives expense for the purpose of evaluating the performance of our segments or their managers or when making decisions to allocate resources. Therefore, we believe performance measures excluding merger and strategic initiatives expense provide management with a useful representation of our segments' ongoing activity in each period.Restructuring charges: We initiated the transition of certain technology platforms to advance our strategic opportunities as a technology and analytics provider and continue the re-alignment of certain business areas. See Note 20, “Restructuring Charges,” for further discussion of our 2019 restructuring plan. We believe performance measures
F-43

excluding restructuring charges provide management with a useful representation of our segments' ongoing activity in each period.
2019 and 2018 divestitures: We have included in corporate items the revenues and expenses of BWise and the Public Relations Solutions and Digital Media Services businesses which were part of the IR & ESG Services business within our Corporate Platforms segment as BWise was sold in March 2019 and the Public Relations Solutions and Digital Media Services businesses were sold in April 2018.
Other significant items: We have included certain other charges or gains in corporate items, to the extent we believe they should be excluded when evaluating the ongoing operating performance of each individual segment. Other significant items included:
• for the year ended December 31, 2020, charitable donations made to the Nasdaq Foundation, COVID-19 response and relief efforts, and social justice charities and charges associated with duplicative rent and impairment of leasehold assets related to our global headquarter move;
• for the years ended December 31, 2020 and 2019, a provision for notes receivable associated with the
funding of technology development for the CAT, a loss on extinguishment of debt, and a tax reserve for certain prior year examinations;
• for the years ended December 31, 2020, 2019 and 2018, certain litigation costs which are recorded in professional and contract services expense in the Consolidated Statements of Income; and
• for the year ended December 31, 2018, charges related to uncertain positions pertaining to sales and use tax and value added tax and charges associated with the clearing default that occurred in September 2018.
The above charges are recorded in general, administrative and other expense in our Consolidated Statements of Income unless noted otherwise.
Accordingly, we do not allocate these costs for purposes of disclosing segment results because they do not contribute to a meaningful evaluation of a particular segment’s ongoing operating performance.
* * * * * *
A summary of our Corporate Items is as follows:
Year End December 31,
2020 2019 2018(in millions)
Revenues - divested business $ — $ 10 $ 97 Expenses:
Amortization expense of acquired intangible assets 103 101 109 Merger and strategic initiatives expense 33 30 21 Restructuring charges 48 39 — Clearing default loss — — 31 Provision for notes receivable 6 20 — Extinguishment of debt 36 11 — Charitable donations 17 — — Expenses - divested businesses — 8 83 Other 12 22 18
Total expenses 255 231 262 Operating loss $ (255) $ (221) $ (165)
For further discussion of our segments’ results, see “Item 7. Management’s Discussion and Analysis of Financial Condition and Results of Operations-Segment Operating Results.”
F-44

Geographic Data
The following table presents total revenues and property and equipment, net by geographic area for 2020, 2019 and 2018. Revenues are classified based upon the location of the customer. Property and equipment information is based on the physical location of the assets.
TotalRevenues
Property andEquipment,
Net
(in millions)
2020: United States $ 4,664 $ 311 All other countries 963 164
Total $ 5,627 $ 475 2019: United States $ 3,409 $ 250 All other countries 853 134
Total $ 4,262 $ 384 2018: United States $ 3,379 $ 224 All other countries 898 152
Total $ 4,277 $ 376
Our property and equipment, net for all other countries primarily includes assets held in Sweden. No single customer accounted for 10.0% or more of our revenues in 2020, 2019 and 2018.
20. Restructuring Charges
In September 2019, we initiated the transition of certain technology platforms to advance the company's strategic opportunities as a technology and analytics provider and continue the re-alignment of certain business areas. In connection with these restructuring efforts, we are retiring certain elements of our marketplace infrastructure and technology product offerings as we implement NFF and other technologies internally and externally. This represents a fundamental shift in our strategy and technology as well as executive re-alignment. As a result of these actions, we expect to incur approximately $100 million in pre-tax charges over a two year period related primarily to third-party consulting costs and non-cash items such as asset impairments and accelerated depreciation. Severance and employee-related charges also will be incurred. Restructuring charges are recorded on restructuring plans that have been committed to by management and are, in part, based upon management’s best estimates of future events.
The following table presents a summary of the 2019 restructuring plan charges in the Consolidated Statements of Income for the years ended December 31, 2020 and 2019 which primarily consisted of consulting services, asset impairment charges primarily related to capitalized software
that was retired, and accelerated depreciation expense on certain assets as a result of a decrease in their useful life.
Year End December 31,
2020 2019
(in millions)
Asset impairment charges and accelerated depreciation expense $ 14 $ 26
Consulting services 22 2 Contract terminations 3 2 Severance and employee-related costs 3 8 Other 6 1
Total restructuring charges $ 48 $ 39 21. Subsequent Events
Sale of U.S. Fixed Income Business
On February 2, 2021, we announced that we entered into a Purchase Agreement to sell NFI to an affiliate of Tradeweb Markets Inc., or Tradeweb. Pursuant to the Purchase Agreement, an affiliate of Tradeweb will acquire all of the outstanding equity interests in certain subsidiaries of Nasdaq and certain assets and liabilities related to the transaction. The closing is subject to regulatory approvals and the satisfaction of other customary conditions, and is expected to occur later in 2021.
As discussed in “Non-Cash Contingent Consideration,” of Note 18, “Commitments, Contingencies and Guarantees,” as part of the purchase price consideration of a prior acquisition, Nasdaq has a contingent obligation to issue 992,247 shares of Nasdaq common stock annually through 2027. Upon the consummation of the transaction with Tradeweb, the aggregate number of Nasdaq shares that remain subject to this contingent obligation is expected to be reduced (pursuant to the discounting adjustment provisions set forth in the original purchase agreement for Nasdaq's acquisition of the business) and accelerated, which would result in an issuance of an aggregate of approximately 6.2 million shares of Nasdaq common stock.
Nasdaq intends to use the proceeds from the sale of NFI, available tax benefits and NFI working and clearing capital, as well as other sources of cash to repurchase shares in order to offset dilution. The proceeds from the sale, the remaining tax benefits related to the 2013 purchase, and the working and clearing capital to be released upon closing of the transaction are estimated to total approximately $700 million.
To facilitate these repurchases, the board of directors has authorized an increase to the share repurchase program of an additional $1 billion, subject to the closing of the NFI sale and the acceleration of the share issuance.
Acquisition of Verafin
For further discussion of our acquisition of Verafin, see “Acquisition of Verafin,” of Note 4, “Acquisitions and Divestiture.”
F-45

Nasdaq Commodities Clearing Default
During September 2018, a clearing member of Nasdaq Clearing's commodities market was declared in default. In December 2018, the SFSA initiated a review of Nasdaq Clearing. We have been cooperating fully with the SFSA in their review. On January 27, 2021, the SFSA issued a warning combined with an administrative fine of approximately $36 million (SEK 300 million) to Nasdaq Clearing relating to its review. Nasdaq Clearing has assessed the SFSA's decision and has decided to appeal the decision to the Administrative Court. See “Nasdaq Commodities Clearing Default,” of Note 15, “Clearing Operations,” for further information.
F-46