Embed Size (px)
Citation preview
Document code: FOTL_220320193_3 Copyright © 2016 Firstobject Technologies Ltd. All rights reserved
SAKSOFT LTDResult Update (CONSOLIDATED BASIS): Q3 FY19
CMP: 294.30 MAR 22nd, 2019
Overweight ISIN:INE667G01015
Index DetailsSYNOPSIS
Saksoft Ltd is a leading player in providing digitaltransformation solutions to help businesses stayrelevant in a highly connected, rapidly evolvingworld.
Saksoft Ltd has achieved a consolidated turnoverof Rs. 926.77 mn for Q3 FY19 as against Rs.750.71 mn in Q3 FY18, an increase of 23.45%.
During the quarter, consolidated EBITDA stoodat Rs. 155.53 mn as against Rs. 115.69 mn in thecorresponding period of the previous year, up by34.44%.
Consolidated PBT increased to Rs. 134.64 mn inQ3 FY19 against Rs. 94.95 mn in Q3 FY18, upby 41.80%.
During the quarter, consolidated net profitincreased by 52.47% to Rs. 98.34 mn from Rs.64.49 mn in the corresponding quarter ending ofprevious year.
EPS of the company stood at Rs. 9.89 in Q3 FY19as against Rs. 6.16 in the corresponding quarter ofthe previous year.
During the quarter, EBIDTA and PAT marginsare stood at 16.78% and 10.61% respectively.
The Company recorded consolidated revenue ofRs. 2643.7 mn during 9MFY19, as against Rs.2078.5 mn in 9MFY18 a growth of 27.19%.
Consolidated PAT (before minority interest) forthe 9MFY19 stood at Rs. 275.6 mn as against Rs.168.7 mn in 9MFY18 an increase of 63.36%.
Net Sales and PAT of the company are expectedto grow at a CAGR of 14% and 21% over 2017 to2020E, respectively.
Stock DataSector IT Software ProductsBSE Code 590051Face Value 10.0052wk. High / Low (Rs.) 342.80/202.00Volume (2wk. Avg.) 1878Market Cap (Rs. in mn.) 2926.08
Annual Estimated Results(A*: Actual / E*: Estimated)Years(Rs. in mn) FY18A FY19E FY20ENet Sales 2858.70 3635.38 4289.75EBITDA 419.03 609.29 710.93Net Profit 218.32 363.05 431.99EPS 21.96 36.51 43.45P/E 13.40 8.06 6.77
Shareholding Pattern (%)
As on Dec 2018 As on Sep 2018
Promoter 69.21 69.21
Public 25.71 25.71
Others 5.08 5.08
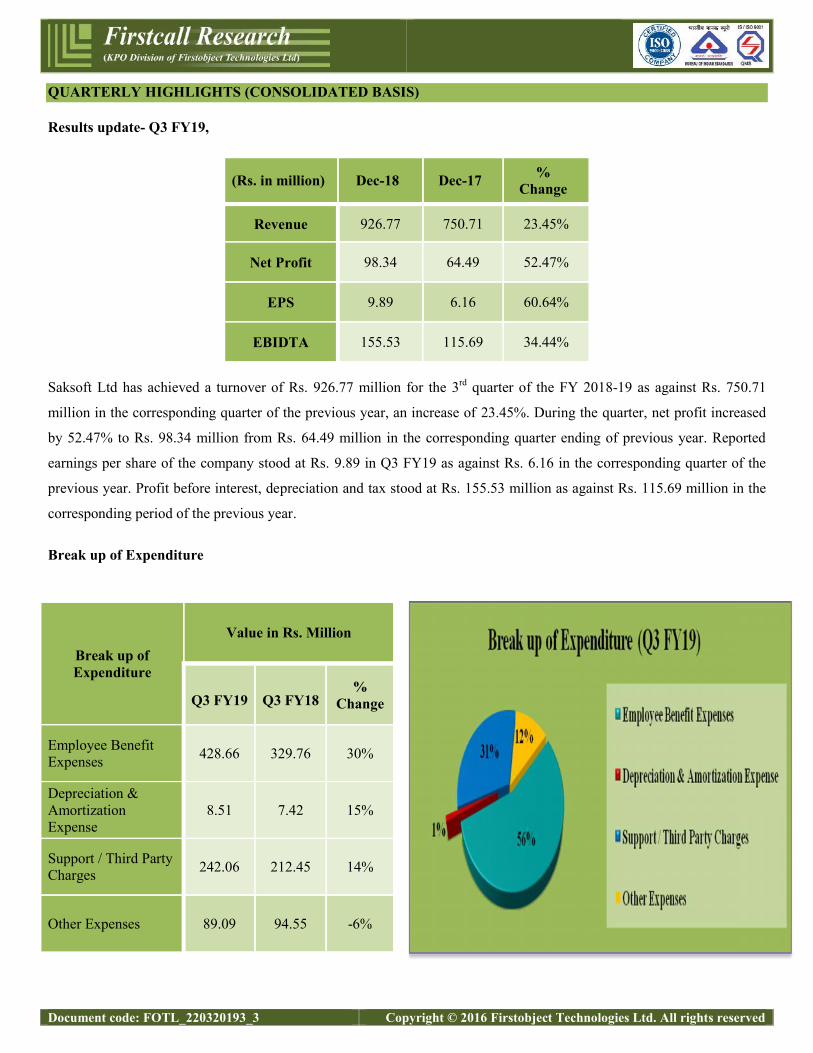
1 Year Comparative Graph
SAKSOFT LTD S&P BSE SENSEX
PEER GROUPS CMP MARKET CAP EPS(TTM) P/E (X)(TTM) P/BV(X) DIVIDEND
Company Name (Rs.) Rs. in mn. (Rs.) Ratio Ratio (%)Saksoft Ltd 294.30 2926.08 33.26 8.85 1.98 35.00ABM Knowledgeware Ltd 62.50 1250.10 8.12 7.70 0.86 25.00Mindteck Ltd 37.00 948.00 1.33 27.82 0.53 10.00Kellton Tech Solutions Ltd 40.40 3893.90 8.27 4.89 1.50 0.00
Document code: FOTL_220320193_3 Copyright © 2016 Firstobject Technologies Ltd. All rights reserved
QUARTERLY HIGHLIGHTS (CONSOLIDATED BASIS)
Results update- Q3 FY19,
(Rs. in million) Dec-18 Dec-17 %Change
Revenue 926.77 750.71 23.45%
Net Profit 98.34 64.49 52.47%
EPS 9.89 6.16 60.64%
EBIDTA 155.53 115.69 34.44%
Saksoft Ltd has achieved a turnover of Rs. 926.77 million for the 3rd quarter of the FY 2018-19 as against Rs. 750.71
million in the corresponding quarter of the previous year, an increase of 23.45%. During the quarter, net profit increased
by 52.47% to Rs. 98.34 million from Rs. 64.49 million in the corresponding quarter ending of previous year. Reported
earnings per share of the company stood at Rs. 9.89 in Q3 FY19 as against Rs. 6.16 in the corresponding quarter of the
previous year. Profit before interest, depreciation and tax stood at Rs. 155.53 million as against Rs. 115.69 million in the
corresponding period of the previous year.
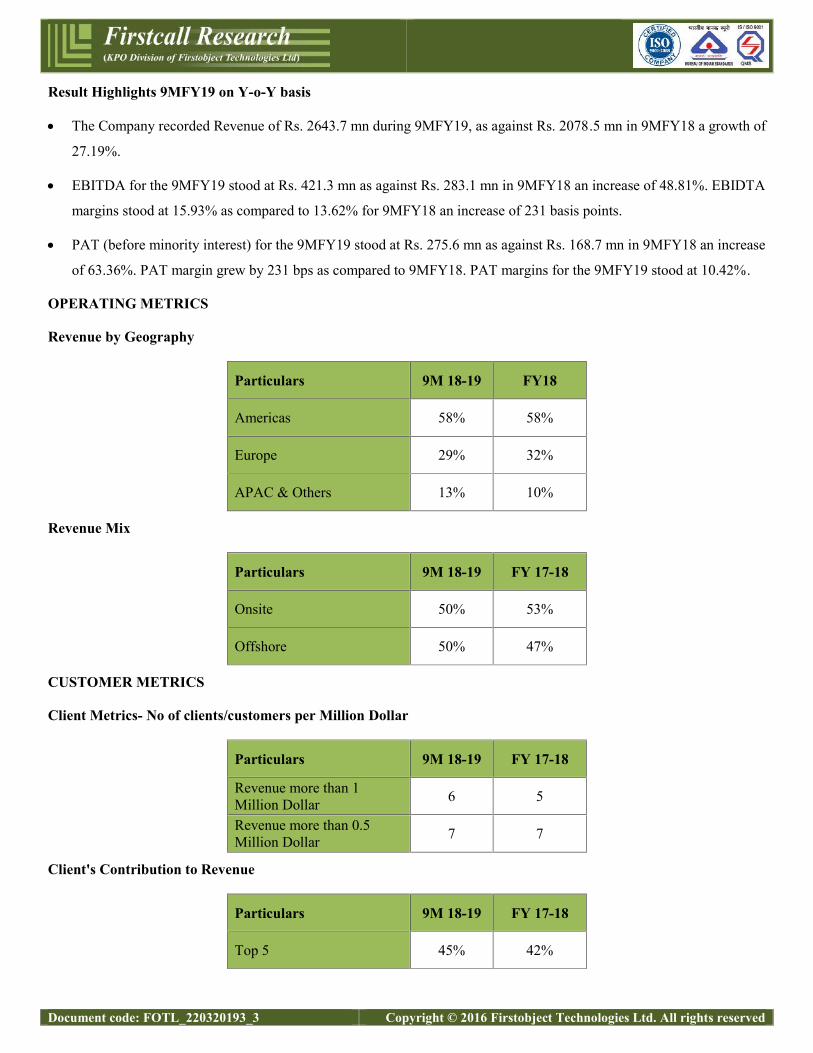
Break up of Expenditure
Break up ofExpenditure
Value in Rs. Million
Q3 FY19 Q3 FY18%
Change
Employee BenefitExpenses 428.66 329.76 30%
Depreciation &AmortizationExpense
8.51 7.42 15%
Support / Third PartyCharges 242.06 212.45 14%
Other Expenses 89.09 94.55 -6%
Document code: FOTL_220320193_3 Copyright © 2016 Firstobject Technologies Ltd. All rights reserved
Result Highlights 9MFY19 on Y-o-Y basis
The Company recorded Revenue of Rs. 2643.7 mn during 9MFY19, as against Rs. 2078.5 mn in 9MFY18 a growth of
27.19%.
EBITDA for the 9MFY19 stood at Rs. 421.3 mn as against Rs. 283.1 mn in 9MFY18 an increase of 48.81%. EBIDTA
margins stood at 15.93% as compared to 13.62% for 9MFY18 an increase of 231 basis points.
PAT (before minority interest) for the 9MFY19 stood at Rs. 275.6 mn as against Rs. 168.7 mn in 9MFY18 an increase
of 63.36%. PAT margin grew by 231 bps as compared to 9MFY18. PAT margins for the 9MFY19 stood at 10.42%.
OPERATING METRICS
Revenue by Geography
Particulars 9M 18-19 FY18
Americas 58% 58%
Europe 29% 32%
APAC & Others 13% 10%
Revenue Mix
Particulars 9M 18-19 FY 17-18
Onsite 50% 53%
Offshore 50% 47%
CUSTOMER METRICS
Client Metrics- No of clients/customers per Million Dollar
Particulars 9M 18-19 FY 17-18
Revenue more than 1Million Dollar 6 5
Revenue more than 0.5Million Dollar 7 7
Client's Contribution to Revenue
Particulars 9M 18-19 FY 17-18
Top 5 45% 42%

Document code: FOTL_220320193_3 Copyright © 2016 Firstobject Technologies Ltd. All rights reserved
Top 10 52% 49%
Top 20 60% 57%
COMPANY PROFILE
Saksoft Limited is a leading player in providing digital transformation solutions to help businesses stay relevant in a
highly connected, rapidly evolving world. Saksoft is a niche technology specialist that provides a comprehensive suite of
business transformation, information management, application development and testing services. Saksoft helps their
clients level the playing field by helping them transform their business spaces.
Saksoft is headquartered in Chennai (India), and has 14 offices across the USA, Europe and Asia employing over 1000+
people.

Document code: FOTL_220320193_3 Copyright © 2016 Firstobject Technologies Ltd. All rights reserved
FINANCIAL HIGHLIGHT (CONSOLIDATED BASIS) (A*- Actual, E* -Estimations & Rs. In Millions)
Balance Sheet as of March 31st, 2017 –2020E
FY-17A FY-18A FY-19E FY-20EASSETSNon-Current Assets
a) Property, Plant and Equipment 33.68 26.04 21.87 23.18b) Goodwill on Consolidation 1220.83 1421.12 1605.86 1798.57c) Other Intangible Assets 18.70 46.44 47.84 50.23d) Financial Assets
i) Investments 1.10 0.00 0.00 0.00ii) Loans 0.28 0.03 0.03 0.03iii) Others 14.59 23.92 24.88 25.88
e) Deferred Tax Assets 3.01 10.91 15.27 18.33f) Other Non -Current Assets 0.52 0.19 0.93 1.08
1. Sub Total – Non - Current Assets 1292.69 1528.65 1716.68 1917.29Current Assets
a) Financial Assetsi) Investments 0.00 0.00 6.93 7.28ii) Trade and Other Receivables 507.11 584.31 697.66 816.27iii) Cash and Bank balances 223.11 300.21 273.19 319.63iv) Loans 3.04 1.98 2.30 2.60v) Others 84.84 74.62 89.55 102.98
b) Current Tax Assets (Net) 0.00 2.26 0.00 0.00c) Other Current Assets 127.61 136.84 186.10 215.88
2. Sub Total - Current Assets 945.70 1100.21 1255.73 1464.63Total Assets (1+2) 2238.39 2628.86 2972.41 3381.92EQUITY AND LIABILITIESEQUITY
a) Equity Share Capital 104.55 99.43 99.43 99.43b) Other Equity 1145.65 1380.75 1743.80 2175.79c) Non-Controlling Interest 58.27 60.86 41.38 38.07
1. Total Equity 1308.47 1541.04 1884.61 2313.29LiabilitiesNon Current Liabilities
a) Financial Liabilitiesi) Borrowings 410.91 380.49 323.42 284.61ii) Other Financial Liabilities 0.00 60.93 69.46 74.32
b) Provisions 21.49 26.42 30.65 34.022. Sub Total - Non Current Liabilities 432.39 467.84 423.52 392.95Current Liabilities
a) Financial Liabilitiesi) Borrowings 8.00 44.19 62.74 72.78ii) Trade Payables 220.96 286.26 252.42 234.14iii) Other Financial Liabilities 72.04 76.30 61.80 64.28
b) Current Tax Liabilities (Net) 1.35 0.00 10.60 10.92c) Other Current Liabilities 185.22 203.24 264.21 280.06d) Provisions 9.96 10.00 12.50 13.50
3. Sub Total - Current Liabilities 497.53 619.99 664.28 675.68Total Equity and Liabilities (1+2+3) 2238.39 2628.86 2972.41 3381.92

Document code: FOTL_220320193_3 Copyright © 2016 Firstobject Technologies Ltd. All rights reserved
Annual Profit & Loss Statement for the period of 2017 to 2020E
Value(Rs.in.mn) FY17A FY18A FY19E FY20E
Description 12m 12m 12m 12mNet Sales 2595.03 2858.70 3635.38 4289.75Other Income 19.30 23.07 31.28 33.15Total Income 2614.34 2881.77 3666.66 4322.91Expenditure -2265.92 -2462.73 -3057.37 -3611.97Operating Profit 348.42 419.03 609.29 710.93Interest -46.50 -52.14 -39.69 -34.93Gross profit 301.92 366.90 569.60 676.01Depreciation -13.14 -28.71 -41.98 -47.44Profit Before Tax 288.78 338.19 527.62 628.57Tax -87.83 -94.11 -146.31 -179.77Profit After Tax 200.96 244.08 381.31 448.80Minority Interest -29.99 -25.76 -18.26 -16.80Net Profit 170.97 218.32 363.05 431.99Equity capital 104.55 99.43 99.43 99.43Reserves 1145.65 1380.75 1743.80 2175.79Face value 10.00 10.00 10.00 10.00EPS 16.35 21.96 36.51 43.45
Quarterly Profit & Loss Statement for the period of 30th June, 2018 to 31st Mar, 2019E
Value(Rs.in.mn) 30-Jun-18 30-Sep-18 31-Dec-18 31-Mar-19E
Description 3m 3m 3m 3mNet sales 825.43 891.54 926.77 991.64Other income 12.03 21.31 -11.43 9.37Total Income 837.46 912.85 915.34 1001.01Expenditure -710.08 -752.51 -759.81 -834.96Operating profit 127.38 160.34 155.53 166.05Interest -8.14 -8.41 -12.38 -10.77Gross profit 119.24 151.93 143.15 155.28Depreciation -12.35 -11.93 -8.51 -9.19Profit Before Tax 106.89 140.01 134.64 146.09Tax -29.49 -44.22 -32.13 -40.47Profit After Tax 77.40 95.78 102.50 105.62Minority Interest -7.76 -2.54 -4.17 -3.79
Net Profit 69.64 93.24 98.34 101.83Equity capital 99.43 99.43 99.43 99.43Face value 10.00 10.00 10.00 10.00EPS 7.00 9.38 9.89 10.24

Document code: FOTL_220320193_3 Copyright © 2016 Firstobject Technologies Ltd. All rights reserved
Ratio Analysis
Particulars FY17A FY18A FY19E FY20E
EPS (Rs.) 16.35 21.96 36.51 43.45
EBITDA Margin (%) 13.43% 14.66% 16.76% 16.57%
PBT Margin (%) 11.13% 11.83% 14.51% 14.65%
PAT Margin (%) 7.74% 8.54% 10.49% 10.46%
P/E Ratio (x) 18.00 13.40 8.06 6.77
ROE (%) 16.07% 16.49% 20.69% 19.73%
ROCE (%) 20.09% 20.49% 25.45% 25.20%
Debt Equity Ratio 0.34 0.29 0.21 0.16
EV/EBITDA (x) 9.39 7.28 4.98 4.16
Book Value (Rs.) 119.58 148.87 185.39 228.84
P/BV 2.46 1.98 1.59 1.29
Charts

Document code: FOTL_220320193_3 Copyright © 2016 Firstobject Technologies Ltd. All rights reserved
OUTLOOK AND CONCLUSION
At the current market price of Rs. 294.30, the stock P/E ratio is at 8.06 x FY19E and 6.77 x FY20E respectively.
Earning per share (EPS) of the company for the earnings for FY19E and FY20E is seen at Rs. 36.51 and Rs. 43.45
respectively.
Net Sales and PAT of the company are expected to grow at a CAGR of 15% and 25% over 2017 to 2020E,
respectively.
On the basis of EV/EBITDA, the stock trades at 4.98 x for FY19E and 4.16 x for FY20E.
Price to Book Value of the stock is expected to be at 1.59 x and 1.29 x for FY19E and FY20E respectively.
Hence, we say that, we are Overweight in this particular scrip for Medium to Long term investment.
INDUSTRY OVERVIEW
Global IT sector overview
The global information technology industry surpassed US$ 4.5 trillion in revenues in 2017. The US is the largest tech
market in the world, accounting for 31% of the total revenues, or ~US$ 1.5 trillion for 2018. In aggregate terms, the Asia
Pacific region accounts for one-third of the global IT spending. A vast majority of technology spending stems from
purchases made by corporate or governmental entities. A smaller portion comes from household spending, including
home-based businesses. With the blurring of work and personal lives, especially in the small business space, along with
the shadow IT phenomenon, it is now difficult to classify certain types of technology purchases as being solely for
business or solely for consumer. Breaking the IT market into its components, the traditional categories of hardware,
software and services account for 53% of the total. The other core category, telecom services, accounts for 30%. The
remaining 17% covers various emerging technologies that either don’t fit into one of the traditional buckets or span
multiple categories, which is the case for many emerging as-a-service solutions that include elements of hardware,
software and IoT offerings. During CY2017, the IT Industry Business Confidence Index crossed the 70-point threshold
Document code: FOTL_220320193_3 Copyright © 2016 Firstobject Technologies Ltd. All rights reserved
for the first-time ever during Q4. Tech hardware is beginning to show some signs of life, with computer equipment
offtake increasing by 2.6% in 2017 and communications equipment offtake edging higher by 3.1%.
Worldwide IT spending is projected at total US$3.7 trillion in 2018, an increase of 4.3% from the 2017 estimated
spending of US$3.5 trillion. Enterprise software and IT services continue to exhibit strong growth, with communications
services continuing to drive the majority of spending. Software spending is projected to grow by 9.4% in 2018 to total
US$387 billion. Software and tech consulting services spending could see the strongest growth, with spending in both
categories increasing by >6% in 2018. Spending on outsourcing and telecom services could see slower growth of 2.2% in
2018.
Indian IT and BPM sector overview
India’s IT – BPM industry accounts for 56% of the global outsourcing market size and the largest private sector employer
in India – delivering 3.7 million jobs. Total IT industry revenue (excluding hardware) was estimated to be ~US$ 152
billion in FY2017-18 compared to US$ 154 billion in FY2016-17. The sector continued to record double-digit growth
despite static growth in global tech spending. The Indian IT industry’s cost-competitiveness and qualitative excellence
have been instrumental in transforming the perception of India in the global economy. This is reflected in India’s high
market share in the global services sourcing industry which stands at 56%, the highest in the world. India’s IT-BPM sector
grew to US$140 billion, registering a growth of 8% over FY2016-17. However, IT-related export percentage, compared to
2006, came down by 1%, from 68% to 67%. IT-BPM export revenues grew by 7.6% to reach US$116 billion from
US$108 billion. To promote this sector, many initiatives have been taken, which include the establishment of BPO
Promotion and Common Services Centres to help create digital inclusion and equitable growth and provide employment
to 1.45 lac people, mostly in small towns, setting up a separate North East BPO Promotion Scheme with 5,000 seats and
an employment potential of 15,000 people and preparing the draft Open Data Protection Policy. Besides, long-term
initiatives like Digital India, Make in India, Smart Cities, e-governance, Skill India and Startup India will continue driving
India towards a cashless economy and rekindling innovational growth.
Governmental initiatives
The Government of India is exploring opportunities such as providing BPO services in the realms of healthcare and
agriculture to achieve the target of making India a US$ 1 trillion digital economy.
The Government of Andhra Pradesh is targeting to attract investments worth US$ 2 billion and create 100,000 jobs in
the IT sector in the state.
The Government of Telangana is targeting to provide broadband connection to every household in the state by 2018,
which is expected to lead to revolutionary changes in the education and healthcare sectors.
The Government of India launched project DARPAN for achieving financial inclusion among the country’s unbanked
rural population.

Document code: FOTL_220320193_3 Copyright © 2016 Firstobject Technologies Ltd. All rights reserved
The Government of India is planning to set up Wi-Fi facilities across ~5.5 lac villages by March 2019 at an estimated
investment of US$ 555 million and expects to start broadband services with about 1 megabit per second speeds across
1 lac gram panchayats.
Outlook
Notwithstanding global headwinds and uncertainties, the IT and BPO segment is projected to grow at a rate of ~9% during
FY2018-19 compared to 7.8% during FY2017-18. Export revenues are estimated to reach US$137 billion dollars during
FY2018-19 compared to US$126 billion dollars during FY2017-18. The industry is expecting to add 1lac jobs during the
ongoing fiscal whereas the overall IT-BPO industry size would be adding ~US$16 billion in revenues. With Niti Aayog,
the Central Government’s policy think tank being mandated to lead the charge on Digital India, the technology sector can
look at more initiatives in the near future. The long-term trend for India is to pursue a ‘low-rate, broad-base’ business tax
strategy. With India having to respond to the twin pressures of BEPS constraints and US tax reforms, extending 100%
deduction to startups set up till March 31, 2021 is a welcome incentive for the technology sector. Over US$ 480 million
has been allotted solely for Digital India programmes with no output and deliverables mentioned. As part of the outcome,
the funding aims to transform India into a digitally empowered society and knowledge economy. Inclusive progress in
three dimensions namely digital infrastructure as a utility to citizens, governance and services on demand and digital
empowerment of citizens.

Document code: FOTL_220320193_3 Copyright © 2016 Firstobject Technologies Ltd. All rights reserved
Disclosure Section
The information and opinions in Firstcall Research was prepared by our analysts and it does not constitute an offer orsolicitation for the purchase or sale of any financial instrument including any companies scrips or this is not an officialconfirmation of any transaction. The information contained herein is from publicly available secondary sources and dataor other secondary sources believed to be reliable but we do not represent that it is accurate or complete and it should notbe relied on as such. Firstcall Research or any of its affiliates shall not be in any way responsible for any loss or damagethat may arise to any person from any inadvertent error in the information contained in this report. Firstcall Research and/or its affiliates and/or employees will not be liable for the recipients’ investment decision based on this document.
Analyst Certification
The following analysts hereby state that their views about the companies and sectors are on best effort basis to the best oftheir knowledge. Unless otherwise stated, the individuals listed on the cover page of this report are research analysts. Theanalyst qualifications, sectors covered and their exposure if any are tabulated hereunder:
Name of the Analyst Qualifications SectorsCovered
Exposure/Interest tocompany/sector UnderCoverage in the CurrentReport
Dr.C.V.S.L. Kameswari M.Sc, PGDCA,M.B.A,Ph.D (Finance)
Pharma &Diversified
No Interest/ Exposure
U. Janaki Rao M.B.A CapitalGoods
No Interest/ Exposure
B. Anil Kumar M.B.A Auto, IT &FMCG
No Interest/ Exposure
V. Harini Priya M.B.A Diversified No Interest/ Exposure
Important Disclosures on Subject Companies
In the next 3 months, neither Firstcall Research nor the Entity expects to receive or intends to seek compensation for anyservices from the company under the current analytical research coverage. Within the last 12 months, Firstcall Researchhas not received any compensation for its products and services from the company under the current coverage. Within thelast 12 months, Firstcall Research has not provided or is providing any services to, or has any client relationship with, thecompany under current research coverage.
Within the last 12 months, Firstcall Research has neither provided or is providing any services to and/or in the past has notentered into an agreement to provide services or does not have a client relationship with the company under the researchcoverage.
Certain disclosures listed above are also for compliance with applicable regulations in various jurisdictions. FirstcallResearch does not assign ratings of Buy, Hold or Sell to the stocks we cover. Overweight, Equal-weight, No-Weight andUnderweight are not the equivalent of buy, hold and sell. Investors should carefully read the definitions of all weightsused in Firstcall Research. In addition, since Firstcall Research contains more complete information concerning theanalyst's views, investors should carefully read Firstcall Research, in its entirety, and not infer the contents from theweightages assigned alone. In any case, weightages (or research) should not be used or relied upon as investment advice.An investor's decision to buy or sell should depend on individual circumstances (such as the investor's own discretion, hisability of understanding the dynamics, existing holdings) and other considerations.

Document code: FOTL_220320193_3 Copyright © 2016 Firstobject Technologies Ltd. All rights reserved
Analyst Stock Weights
Overweight (O): The stock's total return is expected to exceed the average total return of the analyst's industry (orindustry team's) coverage universe, on a risk-adjusted basis, over the next 12-18 months.
Equal-weight (E): The stock's total return is expected to be in line with the average total return of the analyst's industry(or industry team's) coverage universe, on a risk-adjusted basis, over the next 12-18 months.
No-weight (NR): Currently the analyst does not have adequate conviction about the stock's total return relative to theaverage total return of the analyst's industry (or industry team's) coverage universe, on a risk-adjusted basis, over the next12-18 months.
Underweight (U): The stock's total return is expected to be below the average total return of the analyst's industry (orindustry team's) coverage universe, on a risk-adjusted basis, over the next 12-18 months.
Unless otherwise specified, the weights included in Firstcall Research does not indicate any price targets. The statisticalsummaries of Firstcall Research will only indicate the direction of the industry perception of the analyst and theinterpretations of analysts should be seen as statistical summaries of financial data of the companies with perceivedindustry direction in terms of weights.
Firstcall Research may not be distributed to the public media or quoted or used by the public media without the expresswritten consent of Firstcall Research. The reports of Firstcall Research are for Information purposes only and is not to beconstrued as a recommendation or a solicitation to trade in any securities/instruments. Firstcall Research is not abrokerage and does not execute transactions for clients in the securities/instruments.
Firstcall Research - Overall StatementS.No Particulars Remarks1 Comments on general trends in the securities market Full Compliance in Place2 Discussion is broad based and also broad based indices Full Compliance in Place3 Commentaries on economic, political or market conditions Full Compliance in Place4
Periodic reports or other communications not for public appearanceFull Compliance in Place
5 The reports are statistical summaries of financial data of the companies as and whereapplicable
Full Compliance in Place
6 Analysis relating to the sector concerned Full Compliance in Place7 No material is for public appearance Full Compliance in Place8 We are no intermediaries for anyone and neither our entity nor our analysts have any
interests in the reportsFull Compliance in Place
9 Our reports are password protected and contain all the required applicable disclosures Full Compliance in Place
10 Analysts as per the policy of the company are not entitled to take positions either fortrading or long term in the analytical view that they form as a part of their work
Full Compliance in Place
11 No conflict of interest and analysts are expected to maintain strict adherence to thecompany rules and regulations.
Full Compliance in Place
12As a matter of policy no analyst will be allowed to do personal trading or deal andeven if they do so they have to disclose the same to the company and take priorapproval of the company
Full Compliance in Place
13Our entity or any analyst shall not provide any promise or assurance of any favorableoutcome based on their reports on industry, company or sector or group
Full Compliance in Place

Document code: FOTL_220320193_3 Copyright © 2016 Firstobject Technologies Ltd. All rights reserved
14 Researchers maintain arms length/ Chinese wall distance from other employees of theentity
Full Compliance in Place
15No analyst will be allowed to cover or do any research where he has financial interest
Full Compliance in Place
16 Our entity does not do any reports upon receiving any compensation from anycompany
Full Compliance in Place
Firstcall Research Provides
Industry Research on all the Sectors and Equity Research on Major Companiesforming part of Listed and Unlisted Segments
For Further Details Contact:Mobile No: 09959010555
E-mail: [email protected]@firstcallresearch.comwww.firstcallresearch.com