Embed Size (px)
Citation preview

November 5–8, 2017
52nd Edison Electric Institute Financial Conference

1
Caution Regarding Forward-Looking Statements and Regulation G Compliance
In this presentation, and from time to time, Entergy Corporation makes certain “forward-looking statements” within the meaning of the Private Securities Litigation Reform Act of 1995. Such forward-looking statements include, among other things, Entergy’s 2017 earnings guidance, its current financial and operational outlook, and statements of Entergy’s plans, beliefs or expectations included in this presentation. Readers are cautioned not to place undue reliance on these forward-looking statements, which apply only as of the date of this presentation. Except to the extent required by the federal securities laws, Entergy undertakes no obligation to publicly update or revise any forward-looking statements, whether as a result of new information, future events or otherwise.
Forward-looking statements are subject to a number of risks, uncertainties and other factors that could cause actual results to differ materially from those expressed or implied in such forward-looking statements, including (a) those factors discussed elsewhere in this presentation and in Entergy’s most recent Annual Report on Form 10-K, any subsequent Quarterly Reports on Form 10-Q and Entergy’s other reports and filings made under the Securities Exchange Act of 1934; (b) uncertainties associated with rate proceedings, formula rate plans and other cost recovery mechanisms, including the risk that costs may not be recoverable to the extent anticipated by the utilities; (c) uncertainties associated with efforts to remediate the effects of major storms and recover related restoration costs; (d) nuclear plant relicensing, operating and regulatory costs and risks, including any changes resulting from the nuclear crisis in Japan following its catastrophic earthquake and tsunami; (e) changes in decommissioning trust fund values or earnings or in the timing or cost of decommissioning Entergy’s nuclear plant sites; (f) legislative and regulatory actions and risks and uncertainties associated with claims or litigation by or against Entergy and its subsidiaries; (g) risks and uncertainties associated with strategic transactions that Entergy or its subsidiaries may undertake, including the risk that any such transaction may not be completed as and when expected and the risk that the anticipated benefits of the transaction may not be realized; (h) effects of changes in federal, state or local laws and regulations and other governmental actions or policies, including changes in monetary, fiscal, tax, environmental or energy policies; and (i) the effects of technological changes and changes in commodity markets, capital markets or economic conditions, during the periods covered by the forward-looking statements.
This presentation includes the non-GAAP financial measures of UP&O adjusted EPS; normalized ROE; parent debt to total debt, excluding securitization debt; operational FFO to debt, excluding securitization debt; and debt to operational adjusted EBITDA, excluding securitization debt when describing Entergy’s results of operations and financial performance. We have prepared reconciliations of these financial measures to the most directly comparable GAAP measure, which can be found in the appendix of this presentation. Further information can be found in Entergy’s investor earnings releases, which are posted on our website at www.entergy.com.

2
Objectives for Our Stakeholders
Owners
Deliver top-quartile
returns
Communities
Achieve top-decile corporate social
responsibility performance
Customers
Deliver top-quartile
customer satisfaction
Employees
Earn top-quartile organizational health score
and top-decile safety performance

3
Our Strategy Two key areas of focus
Steady, predictable growth at the Utility…
• Earnings growth at our Utility, Parent & Other segment
• Dividend growth
…while managing risk • Customer-centric investment plan
• Progressive regulatory constructs
• Orderly wind-down of EWC
RISK MANAGEMENT IDENTIFY
REDUCE
ASSESS
TRANSFER
ANALYZE
CONTROL

4
Strategic Execution over the Past Few Years
Investing in the Utility Constructive Regulation EWC Wind-Down Major generation projects
• Completed: Ninemile 6, Union Power Station
• Approved: St. Charles, Lake Charles, Montgomery County Power Stations
• In regulatory review: N.O. Power Station, Washington Parish Energy Center
Transmission expansion • Joined MISO • MTEP 15 and MTEP 16 • Lake Charles transmission
project AMI
Arkansas legislation / EAI forward test year FRP
ELL FRP extension (requested)
ELL/EGSL business combination
EMI FRP with forward-looking features
ETI DCRF/TCRF Ninemile 6, Union
Power Station in rates System Agreement
termination
Decisions to close or sell merchant nuclear plants
FitzPatrick sale Agreement to sell VY Progress on Indian
Point license renewal RISEC sale (CCGT)

5
1Q
2Q 3Q 4Q
IPEC closure announcement
NYPA trust transfer Final IPEC WQC/
SPDES issued EMI FRP filing ETI TCRF decision EAI and ELL
renewable RFP selections
IPEC CZM concurrence
VY license transfer filing with the NRC
ELL annual FRP filing • New Orleans Power
Station CCNO decision (in process)
ENOI renewable RFP selection
FitzPatrick transaction close
EMI FRP decision ETI DCRF filing
EAI FRP filing Palisades PPA
termination decision by the Michigan PSC
• ENOI AMI decision (in process)
ELL annual FRP implementation
Lake Charles Power Station LPSC decision
ELL FRP extension and modification filing (new)
ETI DCRF decision
• MTEP 17 approval • EAI FRP decision
(unanimous comprehensive settlement filed)*
EAI AMI decision* ELL AMI decision EMI AMI decision ETI AMI filing Montgomery
County Power Station PUCT decision
Annual dividend review*
Progress in 2017
* Update since third quarter 2017 earnings release presentation 1 Estimated timing; some subject to regulatory approvals or other requirements/factors that could lead to changes
2017 Key Deliverables1 (subject to change)

6
Projected Rate Base
1 Internal estimates based on last-approved rate base adjusted for assumed changes in the major rate base components and includes CWIP; deferred taxes are deducted from rate base for all OpCos, including EAI
17E 18E 19E 20E
Projected Rate Base1; $B
~21.5 ~22.5–23.5
~24–25 ~25.5–26.5

7
Preliminary Three-Year Capital Plan $10.7 Billion
Preliminary 2018E – 2020E Utility Capital Plan
Generation
Utility Support
Distribution
Transmission
$10.7B
Significant long-term stakeholder benefits across functions
• Good-paying jobs • Production cost savings • Enhanced reliability • Reduced environmental footprint • Greater control and options over
energy usage • Incremental economic stimulation
through employment and expanded tax base
• Maintain reasonable rates

8
Generation Investment
17E 18E–20E Average
New Build – To improve reliability, meet increased demand and replace aging infrastructure
Nuclear – To preserve, for the long-term, nuclear resources which provide fuel diversity and clean, reliable baseload generation for customers
Non-Nuclear Baseline – To maintain normal operations of the units
Preliminary Generation Capital Plan; $M
1,415 1,485
9
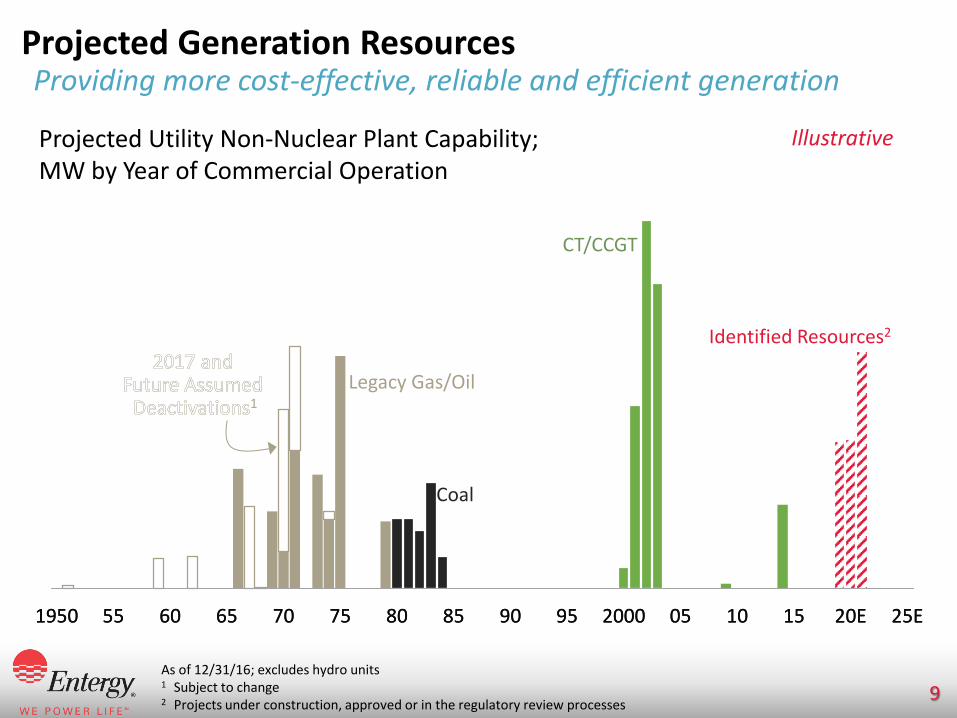
Projected Generation Resources Providing more cost-effective, reliable and efficient generation
As of 12/31/16; excludes hydro units 1 Subject to change 2 Projects under construction, approved or in the regulatory review processes
Projected Utility Non-Nuclear Plant Capability; MW by Year of Commercial Operation
Illustrative
1950 55 60 65 70 75 80 85 90 95 2000 05 10 15 20E 25E1950 55 60 65 70 75 80 85 90 95 2000 05 10 15 20E 25E
1
Identified Resources2
CT/CCGT
Legacy Gas/Oil
Coal

10
Transmission Investment
17E 18E–20E Average
Preliminary Transmission Capital Plan; $M
930 845
Economic – To maximize benefits to our customers from our participation in the MISO market by eliminating congestion when economic
Asset Management – To replace equipment or improve efficiency with better technology
Reliability and Growth – To satisfy reliability requirements (NERC, SERC, etc.) and to serve step changes in the load from industrial growth

11
Distribution and Utility Support Investment
Preliminary Distribution and Utility Support Capital Plan; $M
Distribution Baseline (including gas distribution) – To maintain reliability, respond to outages and serve new customers
AMI – Includes meters, systems and communication network
Utility Support (excluding AMI) – General purpose assets such as information system infrastructure and facilities
17E 18E–20E Average
1,290 1,240

12
AMI Timeline EAI, ELL and EMI approved; reviews in process for ENOI and ETI
Plans and timeline dependent on regulatory approvals
2017 2018 2019 2020 2021
IT System Implementation
Communication Network Installation
Meter Deployment
625
2,025 2,955
75
190
210
19E 20E 21E
Preliminary Meter Deployment Schedule Cumulative Meters, 000s
Electric
Gas
Illustrative

13
Investment Strategy Supports Environmental Stewardship Positioning Entergy to operate in a carbon-constrained economy
One of the cleanest generating fleets in the U.S.
• Environment2020: Voluntary pledge to reduce CO2 emissions 20% below year 2000 levels through 2020
• Meeting objectives through ‒ Portfolio transformation ‒ Investment in nuclear fleet ‒ New technologies ‒ Renewables and distributed energy
resources

14
Multiple Cost Recovery Mechanisms Supporting timely recovery of costs and investment
1 Requested extension of the existing FRP with certain modifications, including forward-looking transmission recovery
Mechanism
Benefits EAI ELL EMI ENOI ETI
Forward-looking ratemaking
Annual evaluation; matches current rates and costs
FRP Annual evaluation; simpler process that aligns current rates and costs better than traditional rate cases
Rider mechanisms (transmission, distribution, capacity and/or MISO)
Recovery of specific costs outside of typical base rate process
Plant acquisition/ construction
Recovery of specific, large investments outside of typical base rate process
tbd1
1

15
Base Rate Filing Timeline
1 ENOI required to file by 7/31/18; anticipate seeking new FRP 2 Requirement may be extended by PUCT if non-material change in rates would result; exact timing to be determined by
notification from the PUCT
Base rate evaluations
2017 2018 2019 2020 2021
FRP filing
FRP filing
FRP review
FRP filing
FRP extension (requested)
Rate case1
4 year rate case filing requirement2
FRP extension or rate case filing
EAI
ELL
EMI
ENOI
ETI
SERI Monthly
cost of service billing
Illustrative

16
Competitive Customer Rate Advantage
0
5
10
15
20
25
ETR
2016 Average Retail Price by Parent Company; ₵ per kWh
Source: S&P Global Market Intelligence Regulated Retail Price of Electricity published 5/31/17

17
Bills Below Regional Average Multiple levers to support goal of maintaining reasonable bills
1 Source: EIA Short-Term Energy Outlook – August 2017 for rates; EIA 861 for consumption
Avg. Monthly Residential Bill; $
Regional Avg.1 2% CAGR off 2018E Examples of levers to help
control customer bills
Productive investments
Cost management (including production costs)
AMI
Energy efficiency
Economic development
Fuel price
Securitizations rolling off
Illustrative
16 17E 18E 19E 20E
Non- Fuel
Fuel

18
Utility, Parent & Other Earnings Growth, Dividend Growth Targeting 5%–7% long-term earnings growth
1 6.12 Utility + (1.15) Parent & Other 2 6.34 Utility + (1.24) Parent & Other
3.08 4.38
15 16 17E 18E 19E 20E
4.25–4.55
5.20–5.60 4.90–5.30 4.50–4.90
Utility, Parent & Other Outlook Adjusted EPS; $
Actual dividend
5.10 As-Reported2
3.43 excluding regulatory
charges
4.97 As-Reported1

19
EWC Strategy Orderly wind-down, reducing risk
2014
2017
2018–2022
FitzPatrick
Sold (2017)
Pilgrim
Planned shutdown
(2019)
Palisades
Planned shutdown
(2022)
Indian Point
Planned shutdown
(2020/2021)
Vermont Yankee
Shutdown (2014)
Agreement to sell (2018)

20
RESILIENT and RELIABLE
ENVIRONMENTALLY RESPONSIBLE CUSTOMER CONTROL
Our Longer-Term Strategy Driving to customer solutions
CUSTOMER-DRIVEN
Because of us, customers should not have to stop what they’re doing
Transition to delivering customer solutions

21
Our Business Is Evolving Today’s customer-centric plan focused on customer benefits
Adding CUSTOMER SOLUTIONS
FOCUSED ON CUSTOMER
BENEFITS
Current Focus Beyond 2020
Lower production costs
Increased reliability
Greater economic development
Improved sustainability
Distribution
Transmission
Generation

22
Our Business Is Evolving Adding customer solutions
Beyond 2020
No interruptions
Save money
New technology
Green
Ease of use
…TAILORED CUSTOMER SOLUTIONS TAKE SHAPE
Enha
nced
util
ity in
fras
truc
ture
New
products and services W
hat c
usto
mer
s wan
t
TECHNOLOGY ADVANCES AND
ENHANCED ANALYTICS MAKE IT
POSSIBLE…

23
Implications for Our Longer-Term Strategy
Significant investment opportunity • Continued “traditional” investments • Deployment of new technologies
New revenue streams • New products and services • Delivery of customer solutions
A path for continued steady, predictable
growth at the Utility

24
Appendix and Regulation G Reconciliations

25
Utility Overview
1 Percent of 2016 weather-adjusted GWh electric retail sales 2 Percent of owned and leased MW capability for generation portfolio as of 12/31/16
67
23 10
2016 Electric Retail Sales1; %
2016 Generation Portfolio2; %
31
26
41
2
Nuclear
Coal
Gas/Oil/Hydro
Residential
Commercial
Industrial
Governmental • Electric and gas utility
• Number of customers – Electric 1,082,000 – Gas 94,000
• Authorized ROE ranges: – Electric 9.15%–10.75% – Gas 9.45%–10.45%
• Electric FRP (requested extension), Gas RSP
• Electric utility
• 712,000 customers
• Authorized ROE range: 9.25%–10.25%
• Forward test year FRP
ELL EAI
ETI ENOI EMI
• Electric utility
• 448,000 customers
• Authorized ROE: 9.8%
• Rate case
• Electric and gas utility
• Number of customers – Electric 200,000 – Gas 107,000
• Authorized ROE ranges: – Electric 10.7%–11.5% – Gas 10.25%–11.25%
• Rate case
• Electric utility
• 450,000 customers
• Authorized ROE range: 9.47%–11.49%
• FRP with forward-looking features
26
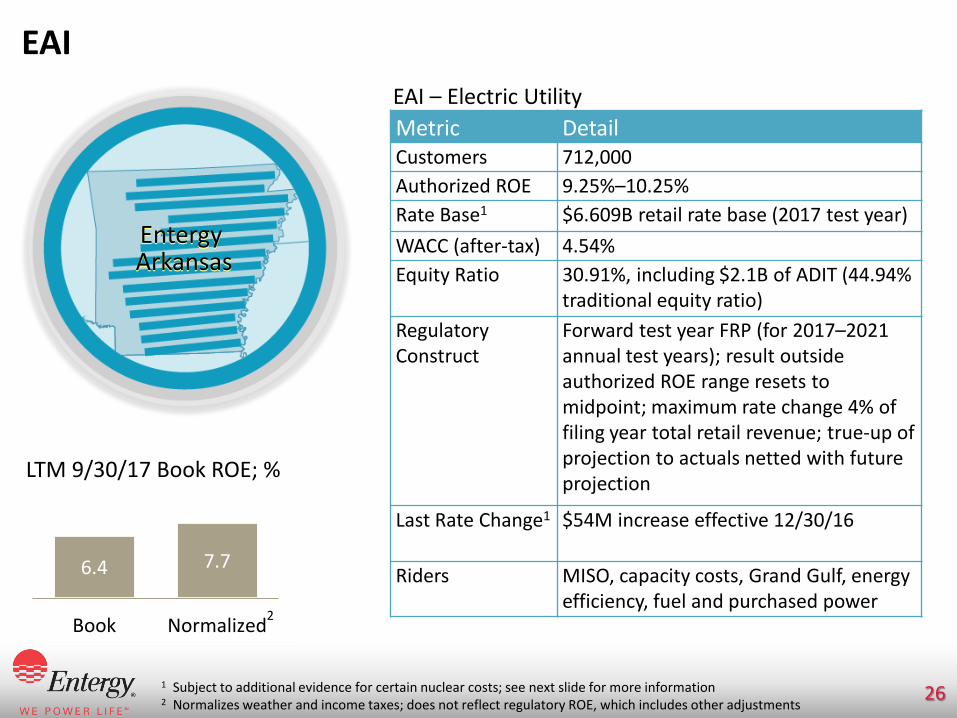
EAI
1 Subject to additional evidence for certain nuclear costs; see next slide for more information 2 Normalizes weather and income taxes; does not reflect regulatory ROE, which includes other adjustments
6.4 7.7
Book Normalized
LTM 9/30/17 Book ROE; %
2
Entergy Arkansas
Metric Detail Customers 712,000 Authorized ROE 9.25%–10.25%
Rate Base1 $6.609B retail rate base (2017 test year)
WACC (after-tax) 4.54% Equity Ratio 30.91%, including $2.1B of ADIT (44.94%
traditional equity ratio) Regulatory Construct
Forward test year FRP (for 2017–2021 annual test years); result outside authorized ROE range resets to midpoint; maximum rate change 4% of filing year total retail revenue; true-up of projection to actuals netted with future projection
Last Rate Change1 $54M increase effective 12/30/16
Riders MISO, capacity costs, Grand Gulf, energy efficiency, fuel and purchased power
EAI – Electric Utility

27
EAI Additional regulatory highlights
* Update since third quarter 2017 earnings release presentation
1 Capped at $71M (4% cap)
2018 Forward Test Year FRP Filed 7/7/17 (Docket 16–036–FR)
• 9.75% ROE midpoint (9.25%–10.25% range) • $7.095B rate base (ADIT included in WACC, not
rate base) • WACC (after-tax) 4.67%; equity ratio 31.69%
including $2.2B ADIT at 0% cost rate (45.48% traditional equity ratio)
• $71M cap on FRP revenue change (7.83% ROE)
Date Event 11/8-9/17 Hearings 12/13/17 Requested decision 1/2/18 Requested rate adjustment
Key Dates
Category $M Change in revenue requirement (original filing) 129.71 Revenue adjustment (14.3) Cost of capital (2.1) Other 0.1 Change in revenue requirement (settlement) 113.41
Requested Revenue Requirement
2017 Forward Test Year FRP Additional Evidence
• EAI provided additional evidence on ~$19M of non-fuel O&M and ~$87M of capital projects (~$5M in revenue requirement) currently being recovered
Status: On 10/31/17, parties submitted a unanimous settlement agreement*
28
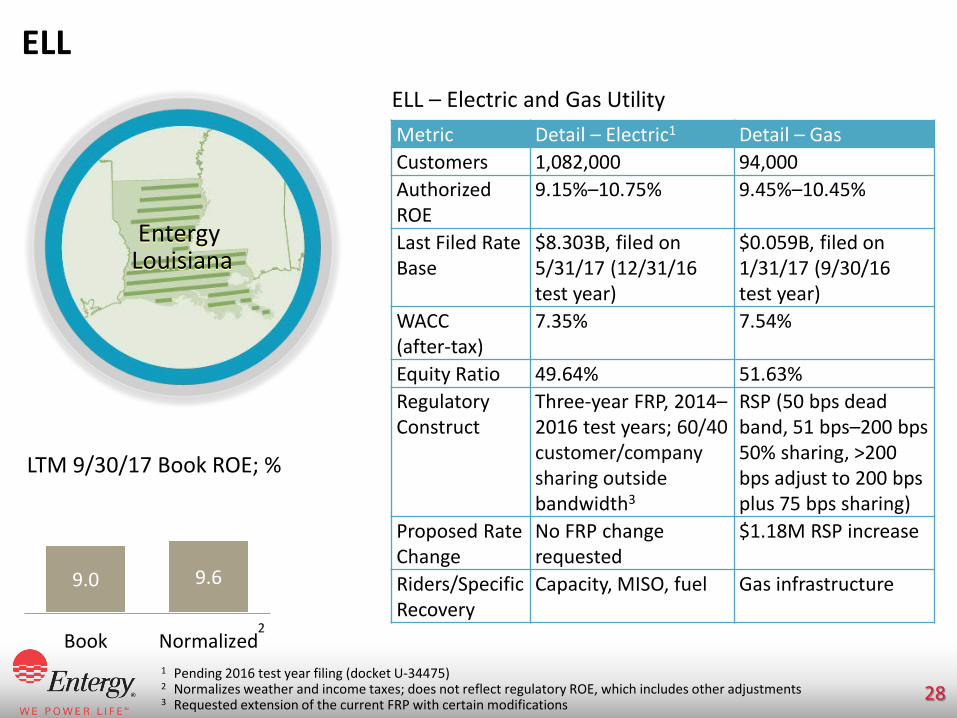
ELL
1 Pending 2016 test year filing (docket U-34475) 2 Normalizes weather and income taxes; does not reflect regulatory ROE, which includes other adjustments 3 Requested extension of the current FRP with certain modifications
9.0 9.6
Book Normalized
LTM 9/30/17 Book ROE; %
2
Entergy Louisiana
Metric Detail – Electric1 Detail – Gas Customers 1,082,000 94,000 Authorized ROE
9.15%–10.75% 9.45%–10.45%
Last Filed Rate Base
$8.303B, filed on 5/31/17 (12/31/16 test year)
$0.059B, filed on 1/31/17 (9/30/16 test year)
WACC (after-tax)
7.35% 7.54%
Equity Ratio 49.64% 51.63% Regulatory Construct
Three-year FRP, 2014–2016 test years; 60/40 customer/company sharing outside bandwidth3
RSP (50 bps dead band, 51 bps–200 bps 50% sharing, >200 bps adjust to 200 bps plus 75 bps sharing)
Proposed Rate Change
No FRP change requested
$1.18M RSP increase
Riders/Specific Recovery
Capacity, MISO, fuel Gas infrastructure
ELL – Electric and Gas Utility

29
ELL Additional regulatory highlights
Date Event 11/17/17 Staff status report at November Business & Executive meeting
Key Dates
Application to Extend and Modify FRP Filed 8/21/17 (Docket U-34631)
Highlights • Three-year extension (2017–2019 test years) • Allow one-time reset of revenue to the ROE midpoint (2017 test year); sharing provisions in place
for 2018 and 2019 test years • Maintain current 9.95% ROE midpoint and narrow bandwidth to +/- 40 bps (from +/- 80 bps) • Modify MISO recovery mechanism to incorporate more timely recovery of MTEP projects, critical
infrastructure protection projects and regulatory costs associated with MISO participation (i.e., forward-looking incremental transmission plant)
• Extraordinary cost provision to address potential changes in tax law during the FRP term • Status: Deferred establishment of procedural schedule in order to work informally with parties in
series of outside conferences to reach consensual resolution

30
ELL – Washington Parish Energy Center Regulatory approval process
* Update since third quarter 2017 earnings release presentation
1 Includes transmission interconnection and other related costs
Item Details MW ~361 Estimated total investment
$261M1
Plant type/fuel CT/natural gas Location Bogalusa, LA In-service date 2021 (pending timely approval) Recovery mechanism
FRP adjustment outside sharing for the first year if ELL’s FRP is in effect when the project is placed in service, otherwise through base rate case filing
Status Procedural schedule delayed for parties to explore possible settlement
Project Overview (Docket U-34472)
Next Steps* Date Event 12/27/17 Staff and intervenor direct testimony 1/26/18 Staff and intervenor cross-answering testimony 2/9/18 Company rebuttal testimony 4/6/18 File joint pre-hearing statement 4/11/18 Pre-hearing briefs 4/23–27/18 Hearing

31
EMI
1 Normalizes weather and income taxes; does not reflect regulatory ROE, which includes other adjustments
9.2 9.7
Book Normalized
LTM 9/30/17 Book ROE; %
1
Entergy Mississippi
Metric Detail Customers 450,000 Authorized ROE
10.48% performance-adjusted midpoint (9.95% + 0.53% performance factor); 9.47%–11.49% range (annual redetermination based on formula)
Rate Base $2.131B (2017 forward test year)
WACC (after-tax)
7.35%
Equity Ratio 49.37% Regulatory Construct
FRP with forward-looking features; annual redetermination subject to performance-based bandwidth calculation and subject to annual “look-back” evaluation; maximum rate increase 4% of test year retail revenue (higher rate increase requires filing of a general rate case)
Last Rate Change
$23.7M revenue increase ($19.4M base rates plus $4.3M increase under updated ad valorem tax adjustment rider schedule) effective 7/1/16
Riders Power Management Rider, Grand Gulf, fuel, MISO, Unit Power Cost, storm damage, energy efficiency, ad valorem tax adjustment
EMI – Electric Utility

32
ENOI
1 Last filed electric rate base does not include Algiers assets transferred to ENOI from ELL on 9/1/15; net book value of the assets at the time of the transfer was ~$85M
2 Normalizes weather and income taxes; does not reflect regulatory ROE, which includes other adjustments
2
Metric Detail – Electric Detail – Gas Customers 200,000 107,000
Authorized ROE 10.7%–11.5% 10.25%–11.25%
Rate Base (filed on 5/31/12)1
$0.299B (12/31/11 test year) – does not include $0.228B for Union (first year average rate base)
$0.089B (12/31/11 test year)
WACC (after-tax) 8.58% 8.40%
Equity Ratio 50.08% 50.08%
Regulatory Construct Rate case Rate case Riders/Specific Recovery
Fuel, capacity (e.g., Ninemile 6, Union)
Purchased gas
ENOI – Electric and Gas Utility
Entergy New Orleans
10.5 10.2
Book Normalized
LTM 9/30/17 Book ROE; %
33
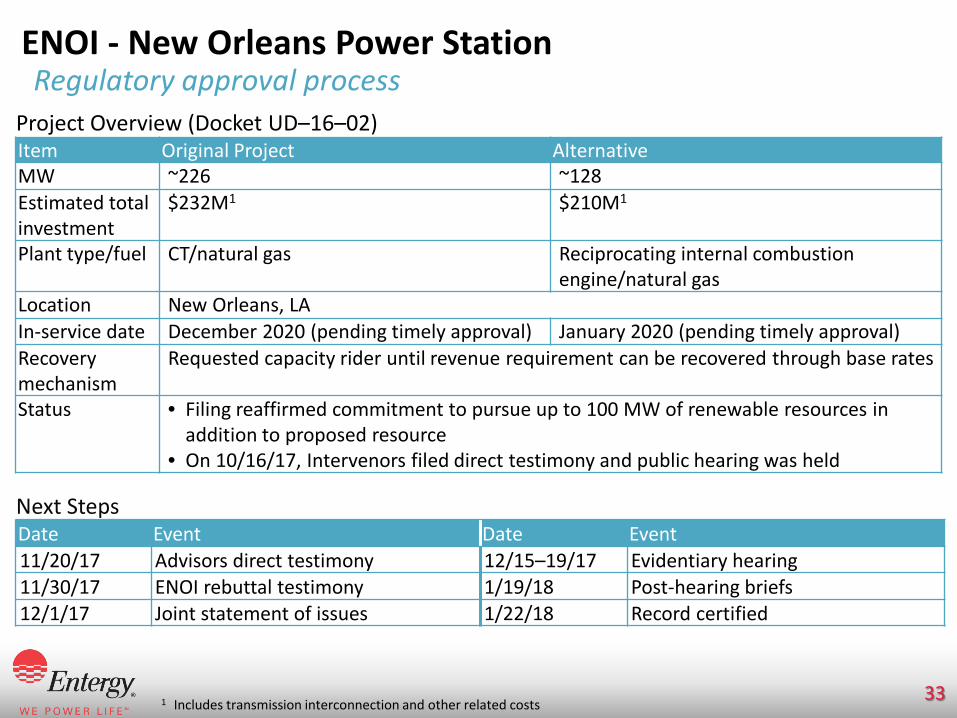
ENOI - New Orleans Power Station Regulatory approval process
1 Includes transmission interconnection and other related costs
Item Original Project Alternative MW ~226 ~128 Estimated total investment
$232M1 $210M1
Plant type/fuel CT/natural gas Reciprocating internal combustion engine/natural gas
Location New Orleans, LA In-service date December 2020 (pending timely approval) January 2020 (pending timely approval) Recovery mechanism
Requested capacity rider until revenue requirement can be recovered through base rates
Status • Filing reaffirmed commitment to pursue up to 100 MW of renewable resources in addition to proposed resource
• On 10/16/17, Intervenors filed direct testimony and public hearing was held
Project Overview (Docket UD–16–02)
Date Event Date Event 11/20/17 Advisors direct testimony 12/15–19/17 Evidentiary hearing 11/30/17 ENOI rebuttal testimony 1/19/18 Post-hearing briefs 12/1/17 Joint statement of issues 1/22/18 Record certified
Next Steps

34
ETI
1 Rates relate back to 4/14/16 2 Normalizes weather and income taxes; does not reflect regulatory ROE, which includes other adjustments
7.7 8.7
Book Normalized
LTM 9/30/17 Book ROE; %
2
ETI – Electric Utility Metric Detail Customers 448,000 Authorized ROE 9.8%
Rate Base $1.634B (3/31/13 adjusted test year), filed on 9/25/13 – does not include ~$0.331B for rate base being recovered through DCRF and TCRF
WACC (after-tax) 8.22% Equity Ratio 48.6% Regulatory Construct
Rate case
Last Rate Changes TCRF increase: ~$11M effective 8/29/161
TCRF increase: ~$19M effective 3/20/17 DCRF increase: ~$9.6M effective 9/1/17
Riders Fuel, capacity, DCRF, TCRF, RPCE payments, rate case expenses, among others
Entergy Texas

35
SERI
1 Sale leaseback obligation excluded from capital structure, treated as an operating lease and recovered as an O&M cost 2 Reflects percentages under SERI’s Unit Power Sales Agreement
Energy and Capacity Allocation2; %
36
14 33
17 ENOI
EAI
EMI ELL
Grand Gulf Nuclear Station
Metric Detail Principal Asset An ownership and leasehold
interest in Grand Gulf Authorized ROE 10.94%
Last Calculated Rate Base $1.220B (9/30/17) WACC (after-tax) 8.90% Equity Ratio 65%1
Regulatory Construct Monthly cost of service
SERI – Generation Company

36
SERI Additional regulatory highlights
ROE Complaint (FERC Docket EL17-41) and SERI Depreciation and Decommissioning (FERC Dockets EL17-93 and ER17-2219) Consolidated Proceeding
• On 1/23/17, the APSC and MPSC filed a complaint which alleged that the 10.94% ROE in SERI’s Unit Power Sales Agreement is unjust and unreasonable
− MPSC and APSC provided analysis supporting an ROE range of 8.37% to 8.67% − LPSC and CCNO intervened in support of the complaint
• On 9/29/17, FERC set the complaint for hearing and settlement discussions before an ALJ,
with a refund effective date of 1/23/17; FERC also consolidated the complaint with two other SERI rate proceedings related to depreciation rates and decommissioning costs
• On 10/16/17, the first settlement conference in the consolidated proceeding was held
Date Event 4Q17-1Q18 Settlement proceedings ongoing
Next Steps:

37
Generation Projects
Note: Projects are subject to applicable approvals 1 Includes transmission interconnection and other related costs 2 Reciprocating internal combustion engine
Project Location OpCo MW Estimated
Cost1 Estimated In-Service Status
St. Charles Power Station Montz, LA ELL ~980
CCGT $869M 2019 Under construction
New Orleans Power Station
New Orleans, LA ENOI
~128 RICE2 $210M 2020
Under regulatory review; see slide 33 ~226
CT $232M 2020
Lake Charles Power Station Westlake, LA ELL ~994
CCGT $872M 2020 Approved
Montgomery County Power
Station Willis, TX ETI ~993
CCGT $937M 2021 Approved
Washington Parish Energy
Center Bogalusa, LA ELL ~361
CT $261M 2021 Under regulatory review; see slide 30

38
AMI Regulatory Approval Processes
* Update since third quarter 2017 earnings release presentation
1 Suspended the procedural schedule to allow for settlement discussions 2 No hearing required for a unanimous settlement; will be taken up at future PUCT Open Meeting (expected in November)
Procedural Schedules
Jurisdictional Overview OpCo Docket Capital Proposed Recovery Method EAI 16-060-U $208M FRP beginning in 2018 as costs are reflected in the applicable test year ELL U-34320 $330M Customer charge beginning in 2019 EMI 2016-UA-261 $132M FRP beginning in 2018 as costs are reflected in the applicable test year ENOI UD-16-04 $75M Customer charge beginning in 2019 ETI 47416 $132M Levelized surcharge beginning in 2018
Event EAI ELL EMI ENOI ETI Filing 9/19/16 11/22/16 11/30/16 10/18/16 7/18/17 Intervenor testimony
Approved* 10/30/17
Approved 7/26/17
Approved 5/4/17
4/7/17
n/a
Staff/Advisors testimony 5/26/17 Company rebuttal Suspended1
Staff surrebuttal n/a Company sur-surrebuttal
Settlement filing n/a 10/23/17 Hearing Suspended1 n/a2

39
Jurisdictional Rate Filing Guidelines
1 Pending FRP extension and modification proceeding result; see slide 29 2 Not required to be filed per FERC Order 3 Requirement may be extended by PUCT if non-material change in rates would result; exact timing to be determined by
notification from the PUCT
4 May be suspended for an additional 150 days
EAI ELL EMI ENOI ETI SERI Latest Filing FRP filed 7/7/17
(pending) FRP filed 5/31/17
(limited issues pending)
FRP filed 3/15/17 12/31/11 test year FRP
(FRP expired)
2013 rate case; rates effective
4/1/14
Monthly cost of service
calculation2
Next Filing Date
FRP: July 2018 FRP: 5/31/181 FRP: 3/15/18 Requirement to file rate case no
later than 7/31/18
2018 (four year filing
requirement)3
n/a
Rate Effective Date
January following filing
September following filing1
June
following filing 1 year +
15 days after rate case filing
35 days after filing4
Immediate
Evaluation Period
Forward test year ended 12/31
Historical test year
ended 12/311
Historical test year ended 12/31 plus forward test year ended 12/31
(certain items)
Historical and forecasted test
years ended 12/31
12-month historical test year
with updates available
Uses actual current month
expense and prior month balance
sheet
FRP Term/ Post FRP Framework
FRP: 5 years (2017–2021 test years); option to
request FRP extension, file rate case or do
nothing
Requesting FRP extension and modification1
FRP: No stated term; review
scheduled in 2019
n/a n/a Continues until terminated by
mutual agreement
40
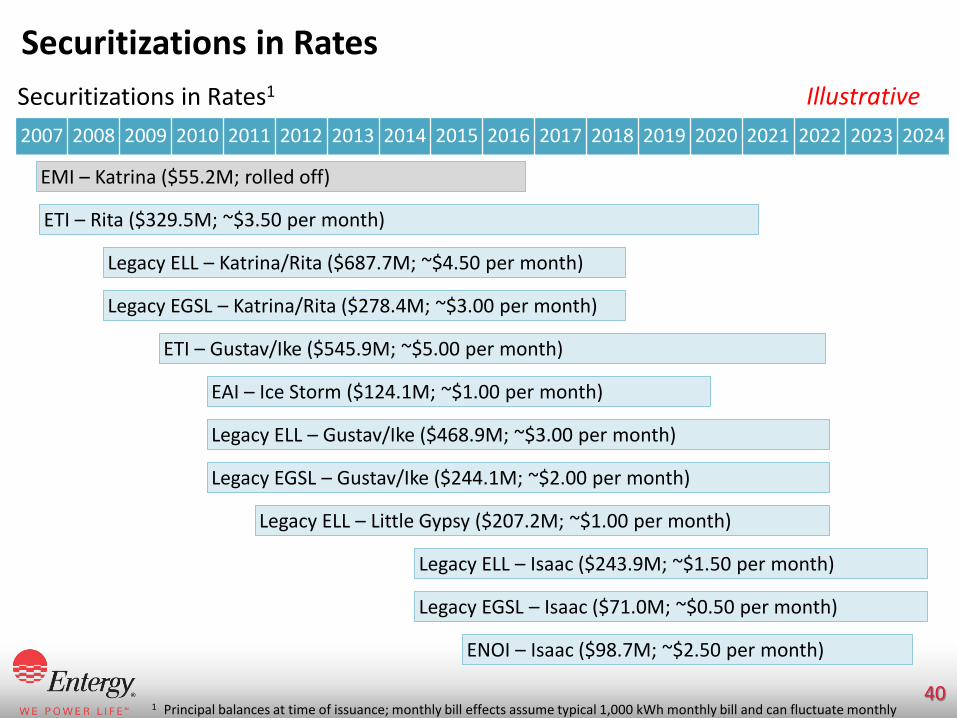
Securitizations in Rates Illustrative
2007 2008 2009 2010 2011 2012 2013 2014 2015 2016 2017 2018 2019 2020 2021 2022 2023 2024
EMI – Katrina ($55.2M; rolled off)
Legacy ELL – Katrina/Rita ($687.7M; ~$4.50 per month)
Legacy ELL – Gustav/Ike ($468.9M; ~$3.00 per month)
Legacy ELL – Little Gypsy ($207.2M; ~$1.00 per month)
Legacy ELL – Isaac ($243.9M; ~$1.50 per month)
EAI – Ice Storm ($124.1M; ~$1.00 per month)
ENOI – Isaac ($98.7M; ~$2.50 per month)
ETI – Rita ($329.5M; ~$3.50 per month)
ETI – Gustav/Ike ($545.9M; ~$5.00 per month)
Securitizations in Rates1
Legacy EGSL – Katrina/Rita ($278.4M; ~$3.00 per month)
Legacy EGSL – Isaac ($71.0M; ~$0.50 per month)
Legacy EGSL – Gustav/Ike ($244.1M; ~$2.00 per month)
1 Principal balances at time of issuance; monthly bill effects assume typical 1,000 kWh monthly bill and can fluctuate monthly
41
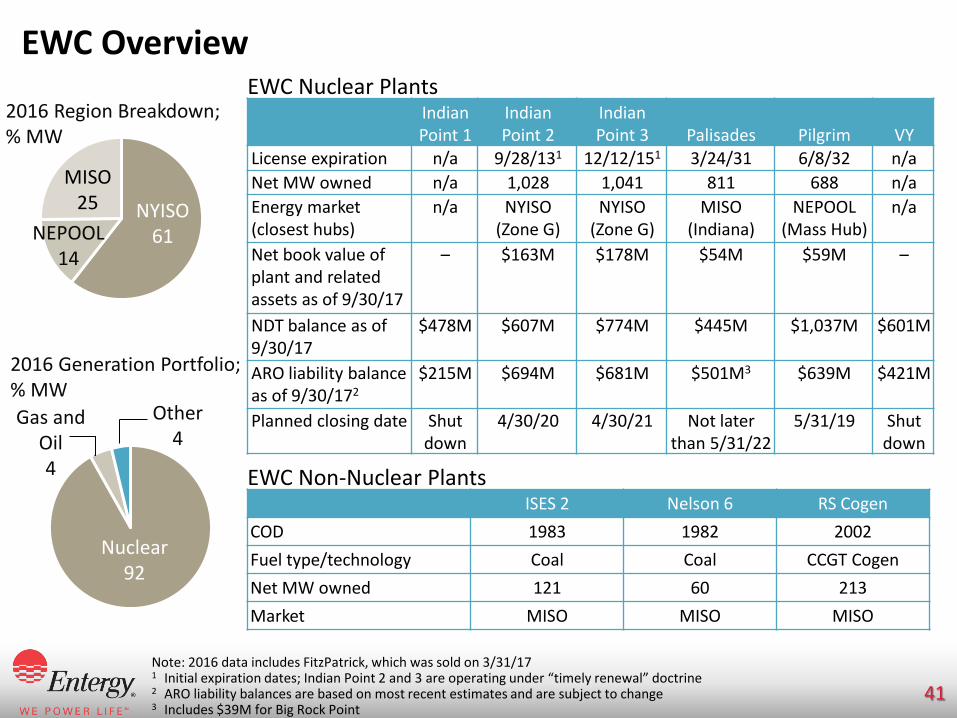
EWC Overview
Note: 2016 data includes FitzPatrick, which was sold on 3/31/17 1 Initial expiration dates; Indian Point 2 and 3 are operating under “timely renewal” doctrine 2 ARO liability balances are based on most recent estimates and are subject to change 3 Includes $39M for Big Rock Point
2016 Region Breakdown; % MW
2016 Generation Portfolio; % MW
Nuclear 92
Gas and Oil 4
Other 4
Indian Point 1
Indian Point 2
Indian Point 3 Palisades Pilgrim VY
License expiration n/a 9/28/131 12/12/151 3/24/31 6/8/32 n/a Net MW owned n/a 1,028 1,041 811 688 n/a Energy market (closest hubs)
n/a NYISO (Zone G)
NYISO (Zone G)
MISO (Indiana)
NEPOOL (Mass Hub)
n/a
Net book value of plant and related assets as of 9/30/17
– $163M $178M $54M $59M –
NDT balance as of 9/30/17
$478M $607M $774M $445M $1,037M $601M
ARO liability balance as of 9/30/172
$215M $694M $681M $501M3 $639M $421M
Planned closing date Shut down
4/30/20 4/30/21 Not later than 5/31/22
5/31/19 Shut down
EWC Non-Nuclear Plants ISES 2 Nelson 6 RS Cogen
COD 1983 1982 2002 Fuel type/technology Coal Coal CCGT Cogen Net MW owned 121 60 213 Market MISO MISO MISO
NYISO 61 NEPOOL
14
MISO 25
EWC Nuclear Plants

42
IPEC License Renewal Status
NRC License Renewal Application (NRC Dockets 50-247 (IP2) and 50-286 (IP3))
• On 2/8/17, Entergy filed with NRC: − Notice of intent to shut down in 2020/21 and − Amendment to license application to shorten license life to 2024/25
• Issuance of renewed license expected mid-2018

43
Vermont Yankee Transaction Overview
1 Approval timeline subject to change if NRC grants State of Vermont or New England Coalition request for hearing
Transaction Highlights Structure Equity sale of ENVY Purchaser NorthStar Decommissioning Holdings, LLC Expected Close December 2018 Consideration • Transfer of ENVY’s ARO and NDT and site restoration trust funds to NorthStar
• $1,000 purchase price and a promissory note from ENVY equal to the value of the Entergy credit facility for the VY dry fuel storage project (estimated to be ~$145M)
Conditions to Close
Closing conditions include: • Receipt of all required regulatory approvals • Minimum NDT balance
Vermont Public Utility Commission
NRC – License Transfer Application
Docket 8880 50-271 (ADAMS ML17045A140) Date of filing 12/16/16 2/9/17 PSDAR/decommissioning cost estimate submitted to NRC
4/6/17
Information session and first public hearing 4/6/17 Second public hearing 1/4/18 Technical hearing 1/22–2/2/18 Approval Targeted 2Q18 Requested by 12/1/171
Regulatory Filings

44
Tax Reform – Preliminary Thoughts Based on initial review of 11/2/17 proposed Tax Cuts and Jobs Act
Analysis is illustrative for each potential component and are not additive Estimates based on 12/31/16 balances
Utility Parent & Other EWC Reduced federal income tax rate to 20% from 35%
• Would reduce revenue requirement from:
‒ Lower tax expense
‒ Excess deferred tax liability (~$2.8B, including ~$1.0B unprotected), offset by higher rate base
• ~$170M one-time reduction in deferred tax asset (not in rates), but no cash impact
• Would reduce earnings due to expected losses, but minimal cash impact with NOL
• Would reduce as-reported earnings due to expected losses, but minimal cash impact with NOL
• ~$415M one-time reduction in deferred tax asset, but no cash impact
100% expensing of capital expenditures
• Not expected to apply • n/a • Not expected to have a material impact
Limited deductibility of interest expense on all debt
• Not expected to apply • Not expected to have a material impact
• Not expected to have a material impact
Illustrative

45
Cash and Credit Profile
1 Senior secured ratings for the OpCos and SERI; corporate credit rating for Entergy
Credit Ratings1 (outlook) Financial Performance Measures
Entity S&P Moody’s EAI A (pos.) A2 (stable)
ELL A (pos.) A2 (stable)
EMI A (pos.) A2 (stable)
ENOI A (pos.) Baa2 (stable)
ETI A (pos.) Baa1 (stable)
SERI A (pos.) Baa1 (stable)
Entergy BBB+ (pos.)
Baa2 (stable)
20.9
3Q17 Target
Target 18–20
Parent Debt to Total Debt; %
15.3
3Q17 Target
4.6
3Q17 Target
FFO to Debt; % Debt to EBITDA; Times
Max range 3.5–4.5 Min range
13–23
18E 19E 20E
Cumulative OCF
~$10.5B over next three years

46
2017 EPS Guidance
1 Originally prepared February 2017 and Entergy operational updated August 2017
Entergy Operational UP&O Adjusted
6.80–7.40 7.10 midpoint
2017 EPS Guidance1; $
4.25–4.55 4.40 midpoint
Current expectations in the top half of the range
Current expectations in the lower end of the range

47
Preliminary Three-Year Utility Capital Plan
Function EAI ELL EMI ENOI ETI SERI ESI/EOI Utility
Generation 730 1,695 455 270
815 485 – 4,450
Transmission 475 1,080 345 35 600 – –
2,535
Distribution 685 1,025 375 235 385 – – 2,705
Utility Support 245 325 135 45 95
30 135
1,010
Total Capital Investment 2,135 4,125 1,310 585 1,895 515 135 10,700
Total Depreciation Expense 940 1,660 505 185 420 415 n/a 4,125
Preliminary 2018E–2020E Utility Capital Plan; $M

48
Preliminary View of 2018 UP&O Adjusted EPS Drivers
4.40 4.70
2017 GuidanceMidpoint
Net Revenue Non-fuel O&M Depreciation 2018 OutlookMidpoint
UP&O Adjusted EPS; $
Continued capital
investment
Illustrative
Primarily regulatory
actions
Slight decline in spending

49
Utility, Parent & Other – 2018 Key Drivers and Assumptions
1 2018 industrial sales expected to be relatively flat to 2017; industrial sales growth expected to resume in 2019 as new projects expected to come online
Category Considerations Sales Growth • Preliminary weather-adjusted sales growth estimate based on actuals
through 9/30/17 essentially flat1
• YTD 3Q17 weather = $(0.50)/share
Retail Price • Full year effect: ETI TCRF riders • Pending filings: EAI FRP and ETI AMI filing • Expected filings: EMI FRP, ELL FRP (if extension is approved), ETI rate
case (target resolution by year-end 2018) and ENOI rate case (target resolution in 2019)
Utility Non-Fuel O&M
• 2018E ~$2.59B (including RFO), slight decline year-over-year – Pension discount rate currently assumed at 4.25%
Utility Investment Effects
• Depreciation expense expected to increase with continued investment – Average depreciation rate ~2.6%
• Interest expense expected to be slightly higher, largely offset by AFUDC
Income Tax • Guidance will include any potential tax items with high probability Utility Book ROE • Expected in the low- to mid-9% range
P&O • Expected relatively flat year-over-year

50
EWC Capital Plan
EWC Capital Plan; $M 18E 19E 20E 21E 22E
Pilgrim 20 - - - - Indian Point 95 60 25 10 -
Expected to be impaired as incurred and classified as a special item
115 60 25 10 -
Palisades/other 120 15 15 5 - Total EWC Capital 235 75 40 15 -
Estimated depreciation expense 160 160 120 80 30

51
EWC Operational Adjusted EBITDA Reflects 9/30/17 market prices, Palisades operating until spring 2022
See estimated special items on slide 52 1 Primarily Taxes other than income taxes
EWC Operational Adjusted EBITDA; $M
540 460 430
325 200
10
17E 18E 19E 20E 21E 22E
Net Revenue 1,385 1,320 1,190 885 555 160
Non-Fuel O&M (765) (770) (670) (495) (320) (135)
Other1 (80) (90) (90) (65) (35) (15)
Total 540 460 430 325 200 10

52
EWC Estimated Special Items
1 Includes tax effect of pre-tax items above plus income tax benefit recorded in first quarter 2017
Estimated Special Items; Pre-Tax $M 17E 18E 19E 20E 21E 22E
Asset impairments (capital) (175) (115) (60) (25) (10) - Asset impairments (fuel, refuel/defuel, other) (400) (135) (100) (15) (10) (10) Severance and retention (110) (170) (95) (85) (35) (15) Net gain or loss on sale of assets 30 (125) - - - - Total (655) (545) (255) (125) (55) (25)
Estimated special items; EPS1 (2.10)
Note: Estimates for expected special items resulting from decisions to close or sell EWC nuclear plants. Other special items may occur during the periods presented, the impact of which cannot reasonably be estimated at this time.
53
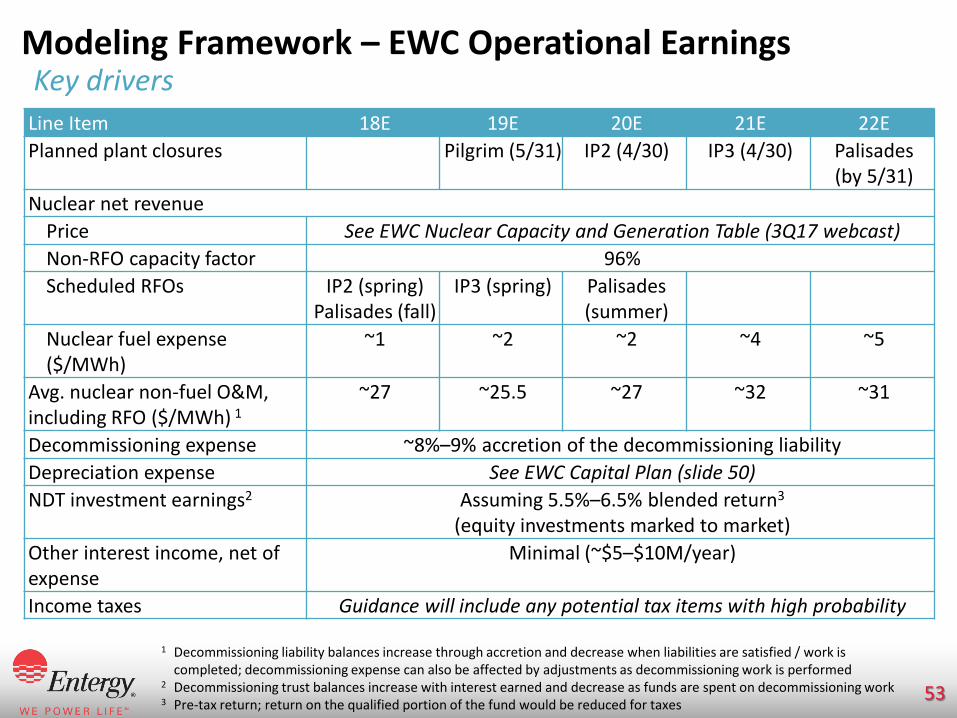
Modeling Framework – EWC Operational Earnings Key drivers
1 Decommissioning liability balances increase through accretion and decrease when liabilities are satisfied / work is completed; decommissioning expense can also be affected by adjustments as decommissioning work is performed
2 Decommissioning trust balances increase with interest earned and decrease as funds are spent on decommissioning work 3 Pre-tax return; return on the qualified portion of the fund would be reduced for taxes
Line Item 18E 19E 20E 21E 22E Planned plant closures Pilgrim (5/31) IP2 (4/30) IP3 (4/30) Palisades
(by 5/31) Nuclear net revenue
Price See EWC Nuclear Capacity and Generation Table (3Q17 webcast) Non-RFO capacity factor 96% Scheduled RFOs IP2 (spring)
Palisades (fall) IP3 (spring)
Palisades (summer)
Nuclear fuel expense ($/MWh)
~1 ~2 ~2 ~4 ~5
Avg. nuclear non-fuel O&M, including RFO ($/MWh) 1
~27 ~25.5 ~27 ~32 ~31
Decommissioning expense ~8%–9% accretion of the decommissioning liability
Depreciation expense See EWC Capital Plan (slide 50) NDT investment earnings2 Assuming 5.5%–6.5% blended return3
(equity investments marked to market) Other interest income, net of expense
Minimal (~$5–$10M/year)
Income taxes Guidance will include any potential tax items with high probability

54
Plan to Operate Palisades until Spring 2022 Key Income Statement Impacts from Decision to Continue Operating Under PPA
Revenue • Operations until spring 2022 • Pricing under current PPA (expires 4/11/22)
Fuel expense • Fuel balance as of 9/30/17 $7M • Future fuel expenditures will be recorded as an asset and
expensed as the fuel is used Refueling outage expense
• Refueling outage balance as of 9/30/17 $0 • Future refueling outage costs will be recorded as an asset and
expensed until the next refueling outage or end of operations Depreciation expense
• Net plant balance as of 9/30/17 $41M • Future capital expenditures will be capitalized and depreciated
over the remaining useful life of the plant Decommissioning expense
• Decommissioning liability reduced by $69M because of plans to operate longer
• Balance as of 9/30/17 $501M1
PPA termination payment
• No longer applicable (would have been classified as a special item)
Severance and retention
• Program updated to reflect longer operations (expense classified as a special item)
1 Includes $39M for Big Rock Point

55
Regulation G Reconciliations Table 1: Utility, Parent & Other Adjusted Earnings and EPS Reconciliation of GAAP to Non-GAAP Measures 2015 and 2016
2015 2016 ($ in millions)
Utility as-reported earnings (a) 1,096.9 1,134.2 Parent & Other as-reported (loss) (b) (205.6) (222.5) UP&O as-reported earnings (c) = (a)+(b) 891.3 911.7 Less: Special items (d) - - Weather (e) 56.3 18.1 Tax effect of weather1 (f) (21.7) (7.0) Estimated weather impact (after-tax) (g) = (e)-(f) 34.6 11.1 Customer sharing (h) (107.0) (16.1) Tax effect of customer sharing1 (i) 41.2 6.2 Other tax items (j) 370.0 126.9 Tax items, net of customer sharing (k) = (h)+(i)+(j) 304.2 117.0 UP&O adjusted earnings (l) = (c)-(g)-(k) 552.5 783.6
(After tax, per share in $) UP&O as-reported earnings (m) 4.97 5.10 Less: Special items (n) - - Weather (o) 0.19 0.06 UP&O tax items, net of customer sharing (p) 1.70 0.66 UP&O adjusted earnings (q) = (m)-(n)-(o)-(p) 3.08 4.38
Calculations may differ due to rounding
1 Income tax effect is calculated by multiplying the pre-tax amount by the estimated income tax rates that are expected to apply to those adjustments

56
Regulation G Reconciliations
Calculations may differ due to rounding
1 Utility does not equal the sum of the operating companies due primarily to SERI (as-reported income ~$84M, normalized income ~$94M and average common equity ~$715M) and preferred dividend requirements of Entergy Utility Holding Co.
2 Normalizes weather and income taxes; does not reflect regulatory ROE, which includes other adjustments
Table 2: Normalized ROE Reconciliation of GAAP to Non-GAAP Measures LTM Ending Sept. 30, 2017
($ in millions) EAI ELL EMI ENOI ETI Utility1
As-reported earnings available to common stock (a) 147.9 472.8 104.2 45.6 84.3 929.4 Add back: Preferred dividend requirement (b) 1.4 - 1.0 1.0 - 11.7 Income taxes (c) 104.6 219.3 65.2 24.3 44.3 524.7 As-reported income before income taxes (d) = (a)+(b)+(c) 254.0 692.1 170.4 70.8 128.6 1,465.8 Less certain items (pre-tax): Weather (e) (42.7) (43.5) (8.9) (2.5) (17.5) (115.1) Normalized income before taxes (f) = (d)-(e) 296.7 735.6 179.4 73.3 146.1 1,581.0 State-specific standard income tax rate (g) 39.23% 38.48% 38.25% 38.48% 35.00% 38.50% Income tax at state-specific standard rate (h) = (f)*(g) 116.4 283.1 68.6 28.2 51.1 608.7 Normalized earnings applicable to common stock (i) = (f)-(h)-(b) 178.9 452.5 109.7 44.1 95.0 960.6 Affiliated preferred (j) - 127.6 - - - 127.6 Normalized earnings applicable to common stock, adjusted for affiliate preferred
(k) = (f)-[(f)-(j)]*(g)-(b) 178.9 501.6 109.7 44.1 95.0 1,009.7
Average common equity (l) 2,323.8 5,235.3 1,128.7 432.1 1,098.4 10,712.3 As-reported ROE (a)/(l) 6.4% 9.0% 9.2% 10.5% 7.7% 8.7% Normalized ROE, adjusted for affiliate preferred2 (k)/(l) 7.7% 9.6% 9.7% 10.2% 8.7% 9.4%

57
Regulation G Reconciliations
Calculations may differ due to rounding
Table 3: Parent Debt to Total Debt, Excluding Securitization Debt
Reconciliation of GAAP to Non-GAAP Measures 3Q17 ($ in millions)
3Q17 Entergy Corporation notes: Due September 2020 450
Due July 2022 650 Due September 2026 750
Total parent long-term debt 1,850 Revolver draw 150 Commercial paper 1,272 Total parent debt (a) 3,272 Total debt 16,224
Less securitization debt 582 Total debt, excluding securitization debt (b) 15,642
Parent debt to total debt, excluding securitization debt (a)/(b) 20.9%

58
Regulation G Reconciliations
Calculations may differ due to rounding
Table 4: Operational FFO to Debt, Excluding Securitization Debt
Reconciliation of GAAP to Non-GAAP Measures 3Q17
($ in millions) 3Q17 OCF (LTM) 2,459 AFUDC-borrowed funds (LTM) (41) Less working capital in OCF (LTM): Receivables (24) Fuel inventory 30 Accounts payable (1) Prepaid taxes and taxes accrued 9 Interest accrued - Other working capital accounts 28 Securitization regulatory charge 114
Total 156 FFO (LTM) 2,262 Add back FFO specials (LTM): Items associated with decisions to close or sell EWC nuclear plants (pre-tax) 126 Operational FFO (LTM) (a) 2,388 Total debt 16,224 Less securitization debt 582 Total debt, excluding securitization debt (b) 15,642 Operational FFO to Debt, excluding securitization debt (a)/(b) 15.3%

59
Regulation G Reconciliations
Calculations may differ due to rounding
Table 4 (continued): Debt to Operational Adjusted EBITDA, Excluding Securitization Debt
Reconciliation of GAAP to Non-GAAP Measures 3Q17 ($ in millions) 3Q17 As-reported consolidated net income (LTM) (864) Add back: interest expense (LTM) 656 Add back: income taxes (LTM) (1,054) Add back: depreciation and amortization (LTM) 1,389 Add back: regulatory charges (credits) (LTM) (21) Subtract: securitization proceeds (LTM) 144 Subtract: interest and investment income (LTM) 223 Subtract: AFUDC-equity funds (LTM) 85 Add back: decommissioning expense (LTM) 407 Adjusted EBITDA (LTM) 61 Add back special items (LTM pre-tax): Items associated with decisions to close or sell EWC Nuclear plants
3,331
Gain on sale of FitzPatrick (16) Operational adjusted EBITDA (LTM) (c) 3,376 Debt to operational adjusted EBITDA, excluding securitization debt (b)/(c) 4.6x
60
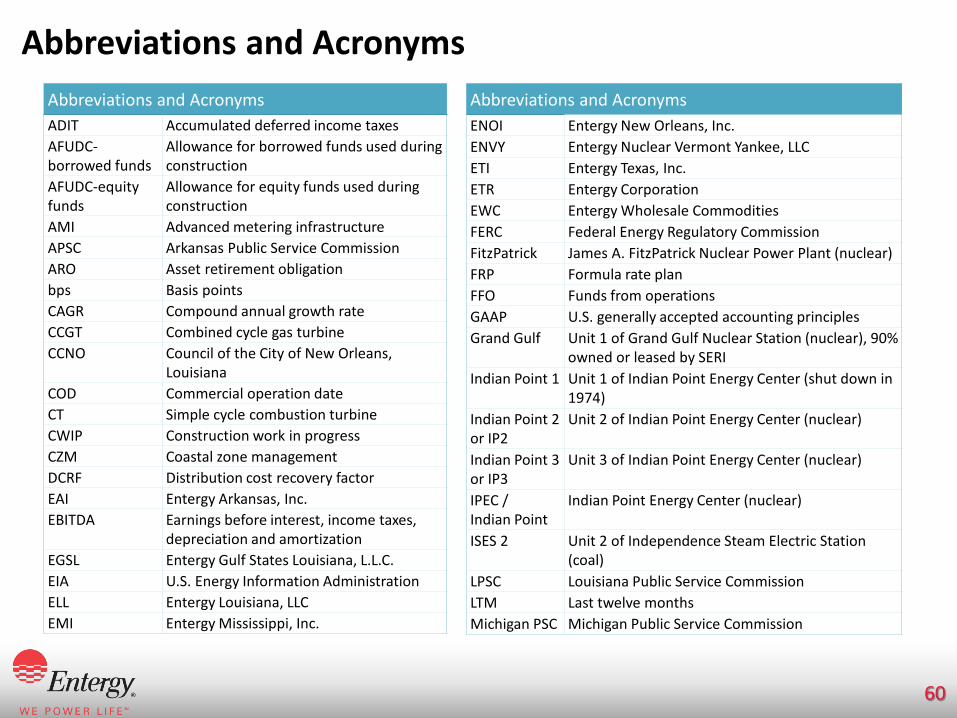
Abbreviations and Acronyms Abbreviations and Acronyms ADIT Accumulated deferred income taxes AFUDC-borrowed funds
Allowance for borrowed funds used during construction
AFUDC-equity funds
Allowance for equity funds used during construction
AMI Advanced metering infrastructure APSC Arkansas Public Service Commission ARO Asset retirement obligation bps Basis points CAGR Compound annual growth rate CCGT Combined cycle gas turbine CCNO Council of the City of New Orleans,
Louisiana COD Commercial operation date CT Simple cycle combustion turbine CWIP Construction work in progress CZM Coastal zone management DCRF Distribution cost recovery factor EAI Entergy Arkansas, Inc. EBITDA Earnings before interest, income taxes,
depreciation and amortization EGSL Entergy Gulf States Louisiana, L.L.C. EIA U.S. Energy Information Administration ELL Entergy Louisiana, LLC EMI Entergy Mississippi, Inc.
Abbreviations and Acronyms ENOI Entergy New Orleans, Inc. ENVY Entergy Nuclear Vermont Yankee, LLC ETI Entergy Texas, Inc. ETR Entergy Corporation EWC Entergy Wholesale Commodities FERC Federal Energy Regulatory Commission FitzPatrick James A. FitzPatrick Nuclear Power Plant (nuclear) FRP Formula rate plan FFO Funds from operations GAAP U.S. generally accepted accounting principles Grand Gulf Unit 1 of Grand Gulf Nuclear Station (nuclear), 90%
owned or leased by SERI Indian Point 1 Unit 1 of Indian Point Energy Center (shut down in
1974) Indian Point 2 or IP2
Unit 2 of Indian Point Energy Center (nuclear)
Indian Point 3 or IP3
Unit 3 of Indian Point Energy Center (nuclear)
IPEC / Indian Point
Indian Point Energy Center (nuclear)
ISES 2 Unit 2 of Independence Steam Electric Station (coal)
LPSC Louisiana Public Service Commission LTM Last twelve months Michigan PSC Michigan Public Service Commission

61
Abbreviations and Acronyms PUCT Public Utility Commission of Texas RFP Request for proposal RISEC Rhode Island State Energy Center (CCGT) ROE Return on equity RPCE Rough production cost equalization RSP Rate stabilization plan RS Cogen RS Cogen facility (CCGT cogeneration) S&P S&P Global Ratings SERC SERC Reliability Corporation SERI System Energy Resources, Inc. SPDES State Pollutant Discharge Elimination System TCRF Transmission cost recovery factor Union Union Power Station (CCGT) UP&O Utility, Parent & Other VY / Vermont Yankee
Vermont Yankee Nuclear Power Station (nuclear)
WACC Weighted-average cost of capital WQC Water Quality Certification
Abbreviations and Acronyms (continued) Abbreviations and Acronyms
MISO Midcontinent Independent System Operator, Inc.
Moody’s Moody’s Investors Service MTEP MISO Transmission Expansion Planning MPSC Mississippi Public Service Commission NDT Nuclear decommissioning trust Nelson 6 Unit 6 of Roy S. Nelson plant (coal) NEPOOL New England Power Pool NERC North American Electric Reliability Corporation Ninemile 6 Ninemile Point Unit 6 (CCGT) Non-fuel O&M
O&M expenses excluding fuel, fuel-related expenses and gas purchased for resale and purchased power
NRC Nuclear Regulatory Commission NYISO New York Independent System Operator, Inc. NYPA New York Power Authority O&M Operation and maintenance expense OCF Net cash flow provided by operating activities OpCo Utility operating company Palisades Palisades Power Plant (nuclear) Pilgrim Pilgrim Nuclear Power Station (nuclear) PPA Purchased power agreement or power
purchase agreement PSDAR Post-Shutdown Decommissioning Activities
Report