Embed Size (px)
Citation preview
NCHRP Report 772: Evaluating the Performance of Corridors with RoundaboutsTransportation Education SeriesOctober 30, 2014
Photo: Lee
Rod
egerdts
Contractors
• Kittelson & Associates, Inc.– Lee Rodegerdts ‐ Principal Investigator– Brian Ray, Pete Jenior, Zachary Bugg
• Institute for Transportation Research & Education (North Carolina State University)– Bastian Schroeder
• Texas Transportation Institute (Texas A&M University)– Marcus Brewer
• Write Rhetoric– Danica Rhoades
Project Panel
• Phil Demosthenes, consultant (chair)• Stephen Bass, Kansas DOT• Wylie Bearup, City of Phoenix, AZ• Sarah Bowman, Walkable Communities, Inc.• Robert Fenton, Ohio State University• Theron Knause, Virginia DOT• Mark Lenters, Ourston Roundabout Engineering, Inc.• Avijit Maji, Maryland State Highway Administration• Dina Swires, Washington State DOT• Rich Cunard, TRB• Hillary Isebrands, FHWA
• Lori Sundstrom, NCHRP Program Officer
Presentation overview
• Project objective• Project scope• Corridors and data collection
• Project products
Photo: Lee
Rod
egerdts

Project Objective
• Document examples of existing corridors• Provide evaluation methods for alternatives analysis• Provide evaluation framework for alt analysis• Focus on three or more roundabouts in series
Photo: Lee
Rod
egerdts
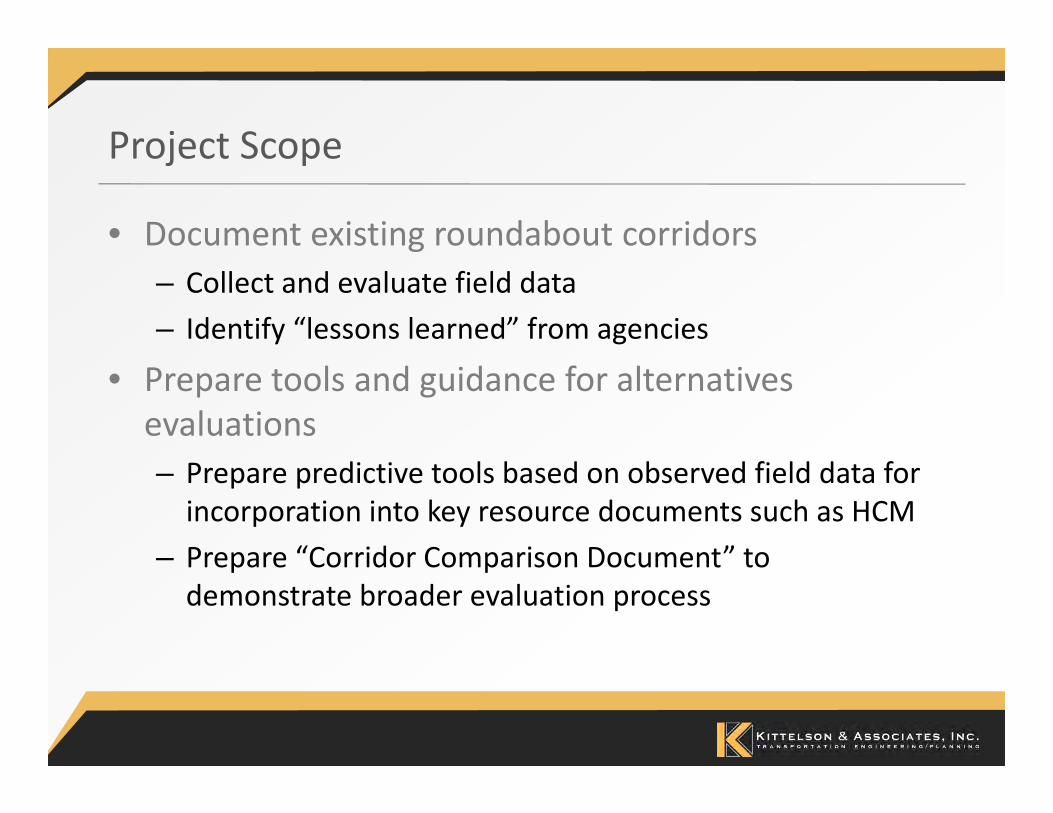
Project Scope
• Document existing roundabout corridors– Collect and evaluate field data– Identify “lessons learned” from agencies
• Prepare tools and guidance for alternatives evaluations– Prepare predictive tools based on observed field data for incorporation into key resource documents such as HCM
– Prepare “Corridor Comparison Document” to demonstrate broader evaluation process
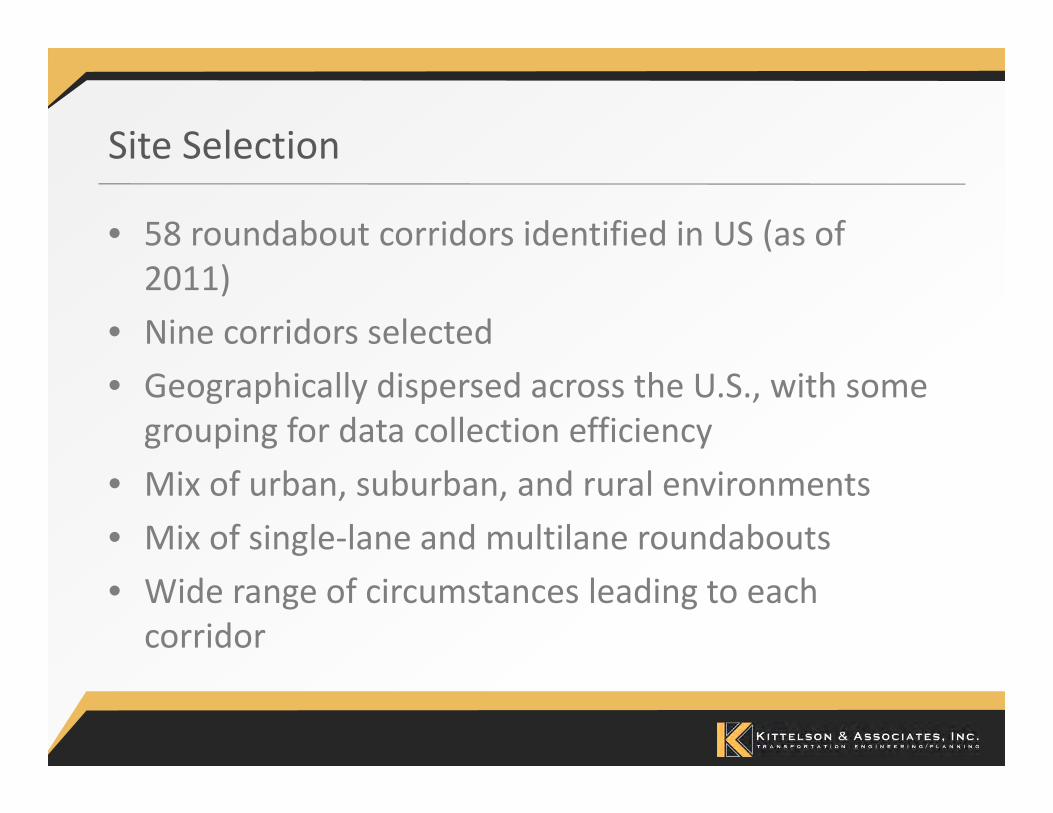
Site Selection
• 58 roundabout corridors identified in US (as of 2011)
• Nine corridors selected• Geographically dispersed across the U.S., with some grouping for data collection efficiency
• Mix of urban, suburban, and rural environments• Mix of single‐lane and multilane roundabouts• Wide range of circumstances leading to each corridor
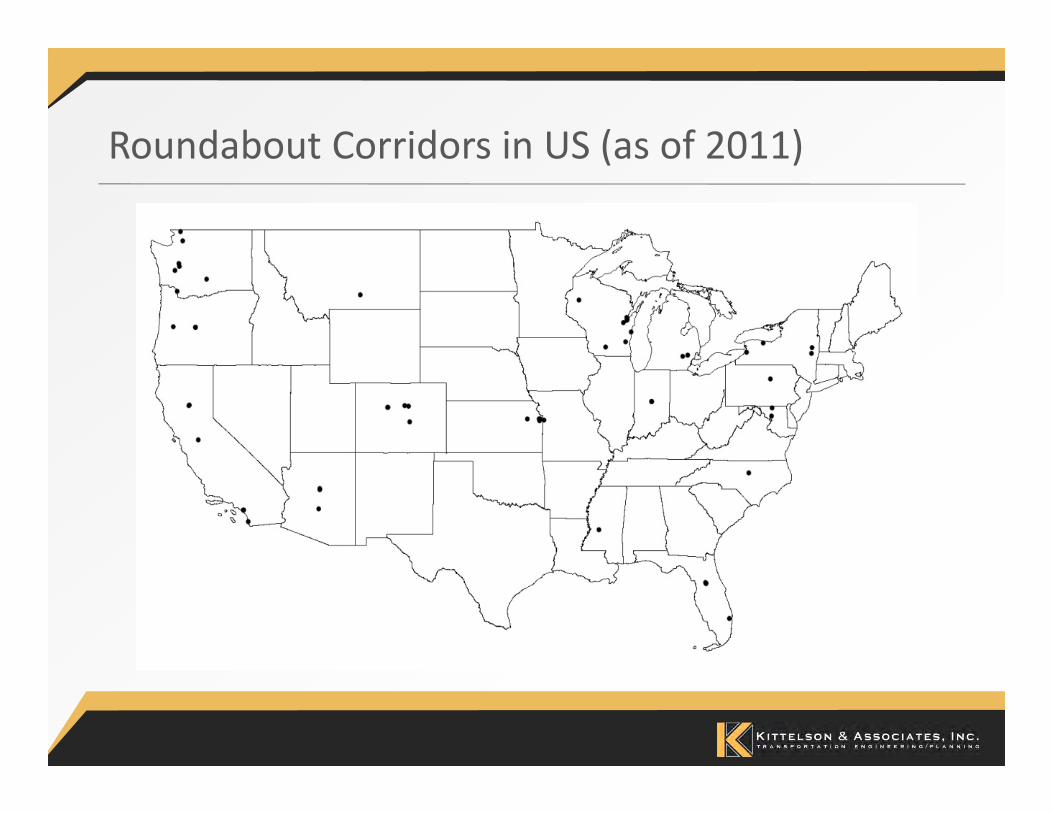
Roundabout Corridors in US (as of 2011)
Data Collection Corridors
• MD 216, Scaggsville, MD (pilot study site)• La Jolla Boulevard, San Diego, CA (pilot study site)• Old Meridian Street, Carmel, IN• Spring Mill Road, Carmel, IN• Borgen Boulevard, Gig Harbor, WA• SR 539, Whatcom County, WA• Golden Road, Golden, CO• Avon Road, Avon, CO• SR 67, Malta, NY
Data Collection Methods
• Travel time runs using GPS• Bluetooth™ data collection (pilot sites only)• Video recording of intersections (primarily for peak hour turning movement extraction)
• Spot speed samples• Photographs and field notes• Interviews with corridor owners/operators
• Data collection methods refined after pilot study locations (focused on GPS instead of Bluetooth)
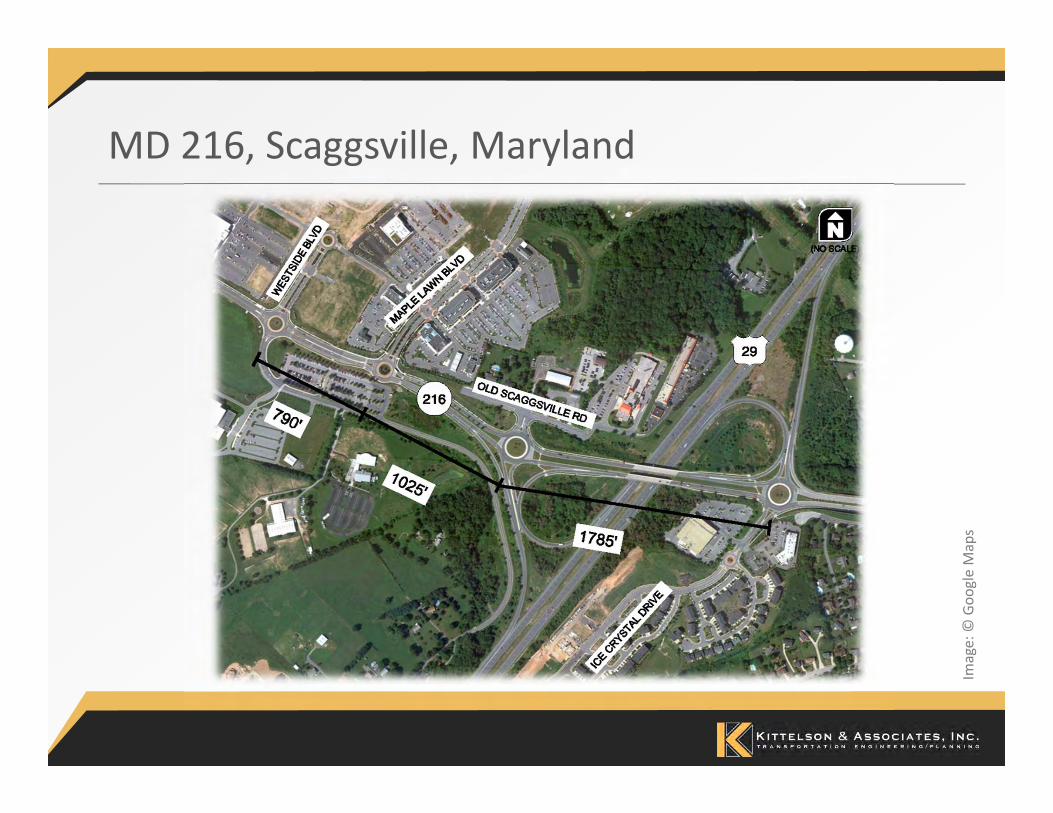
MD 216, Scaggsville, Maryland
Image: ©
Goo
gle Maps
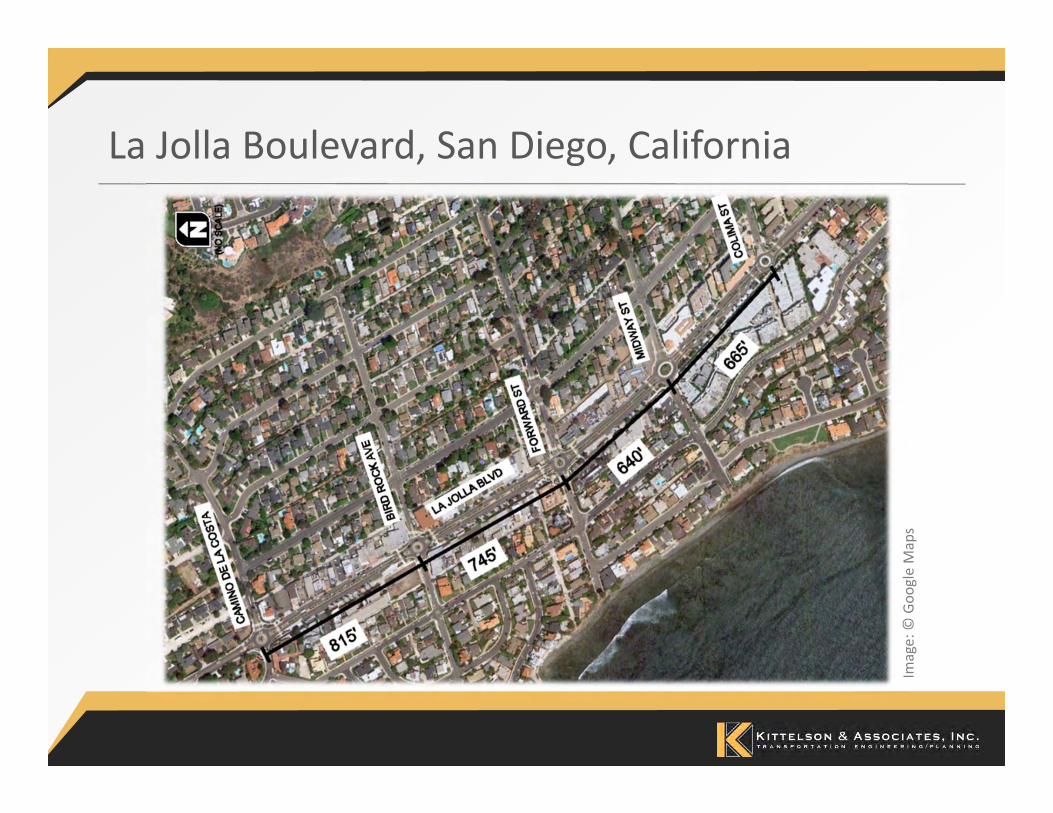
La Jolla Boulevard, San Diego, California
Image: ©
Goo
gle Maps
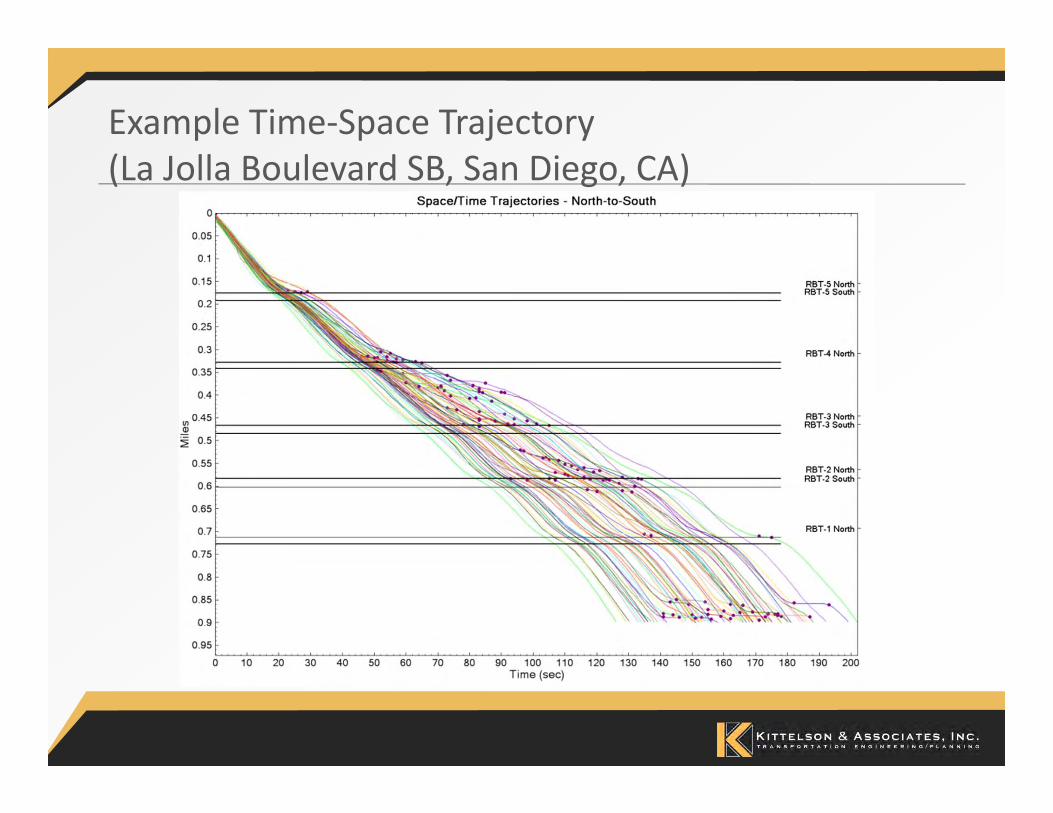
Example Time‐Space Trajectory(La Jolla Boulevard SB, San Diego, CA)
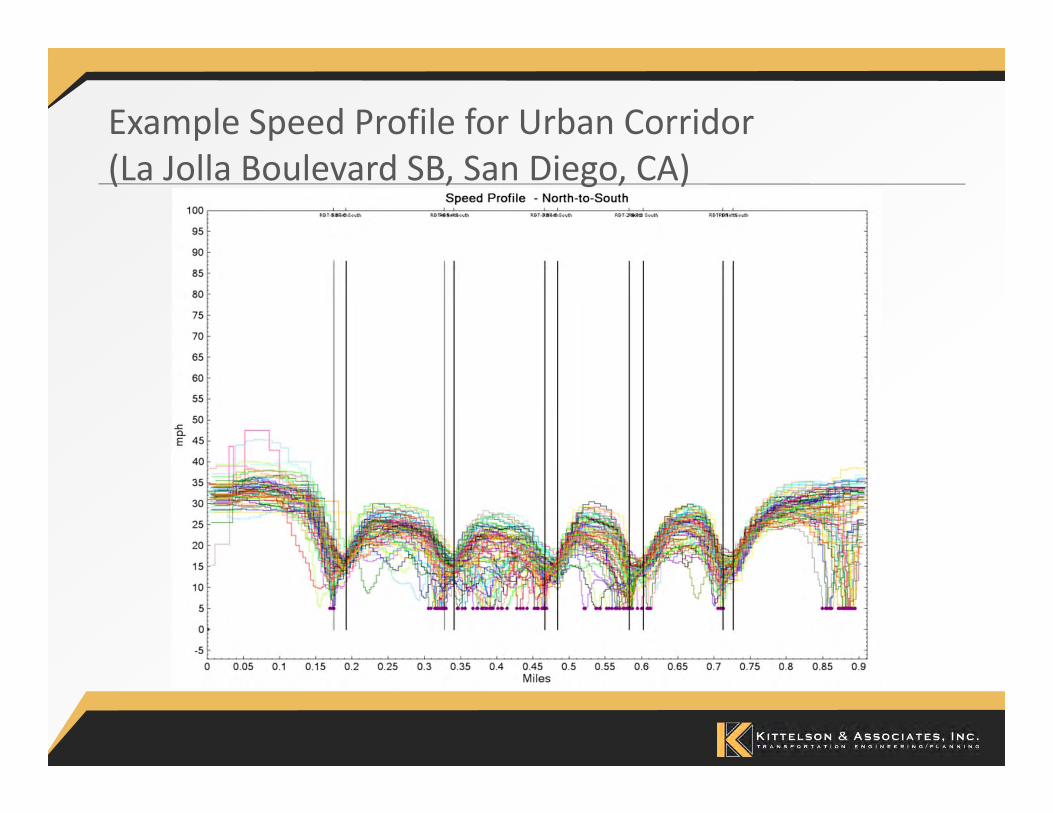
Example Speed Profile for Urban Corridor(La Jolla Boulevard SB, San Diego, CA)
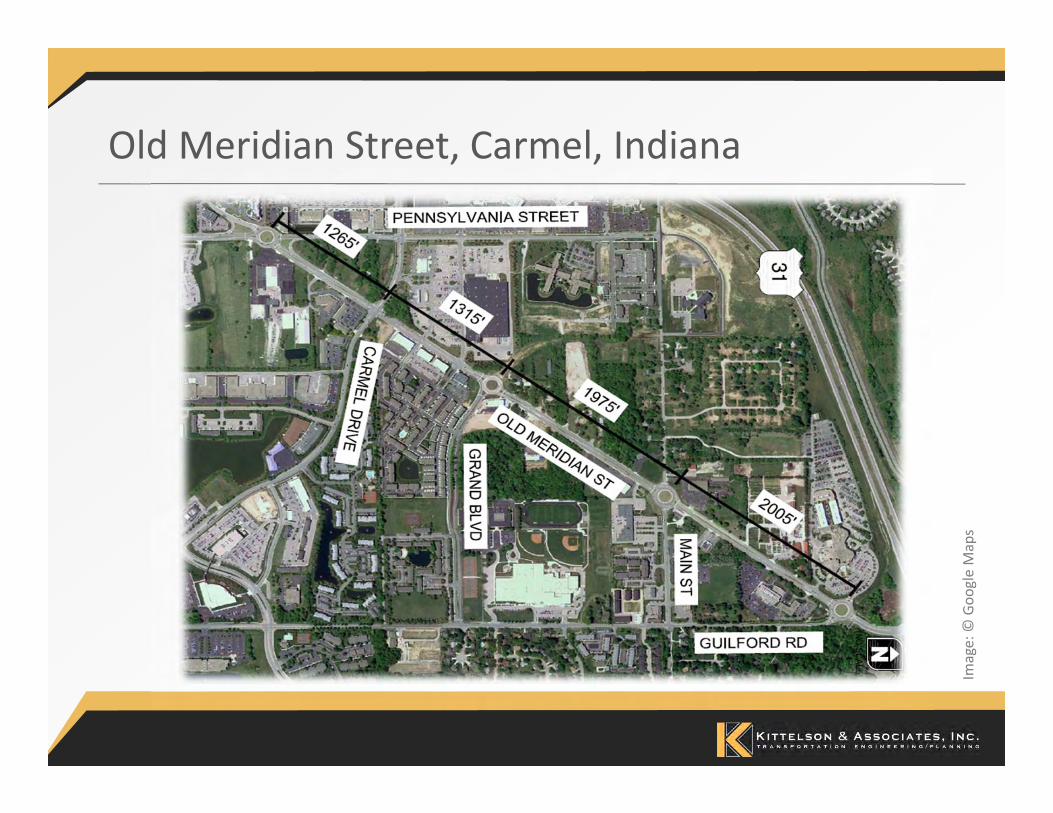
Old Meridian Street, Carmel, Indiana
Image: ©
Goo
gle Maps

Spring Mill Road, Carmel, Indiana
Image: ©
Goo
gle Maps
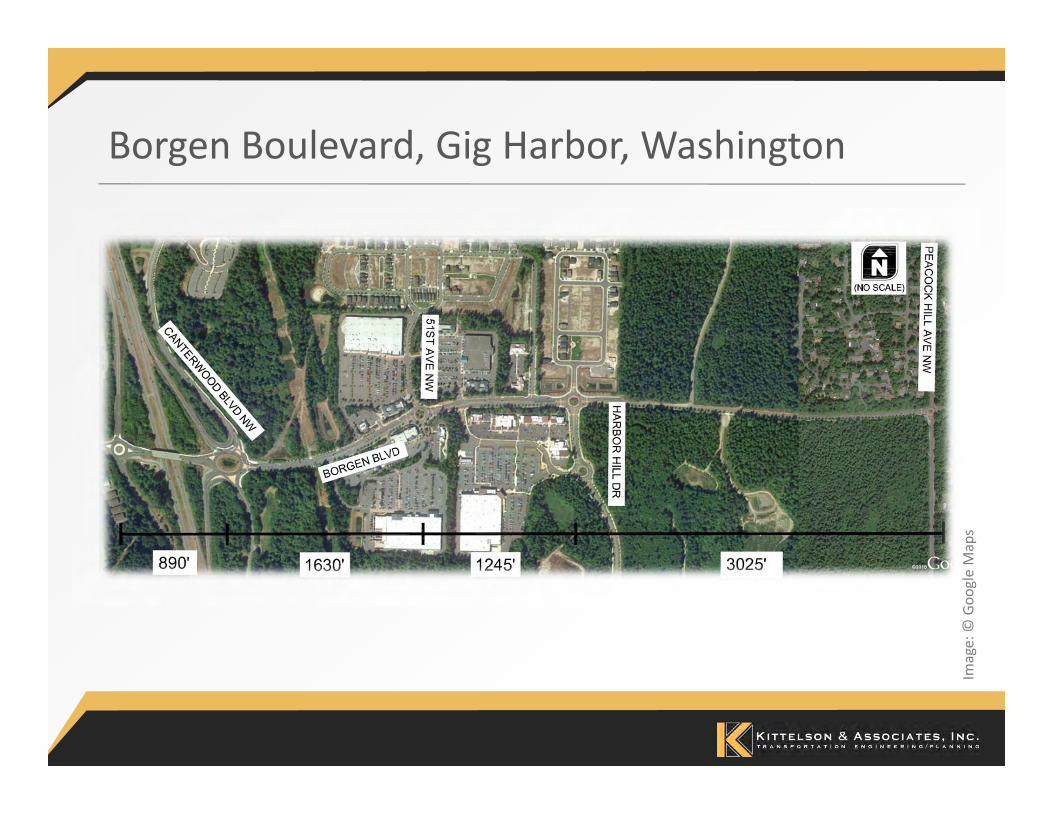
Borgen Boulevard, Gig Harbor, Washington
Image: ©
Goo
gle Maps
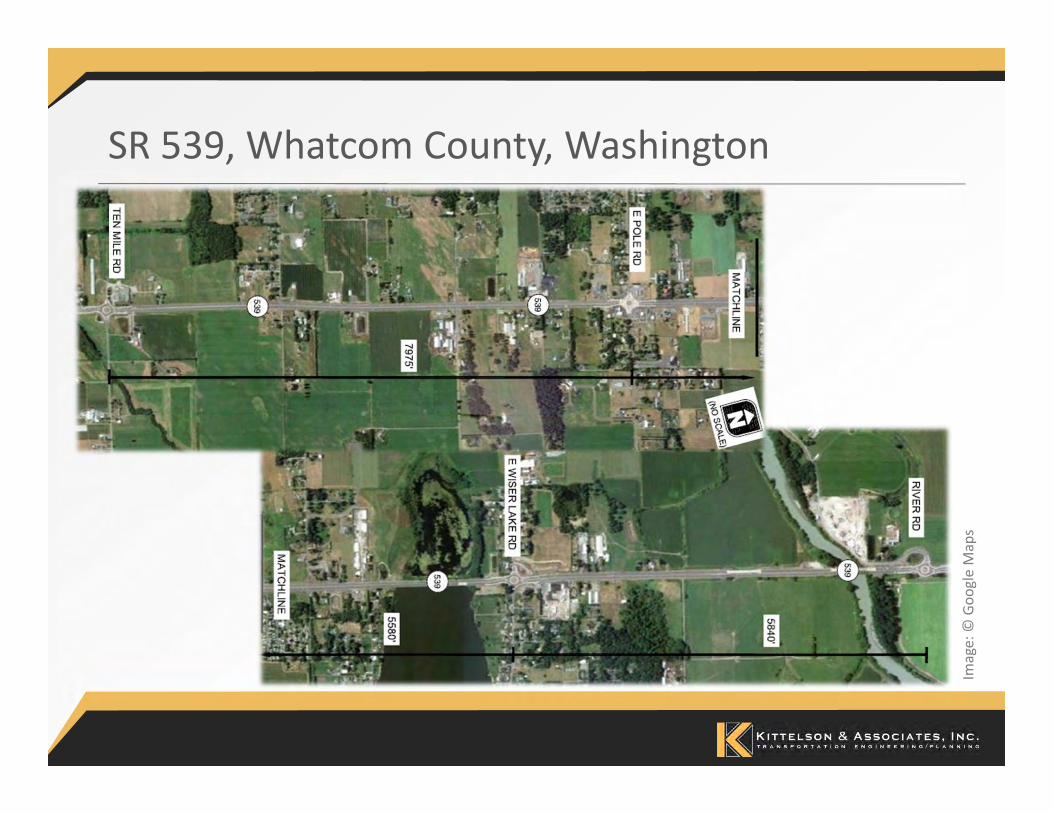
SR 539, Whatcom County, Washington
Image: ©
Goo
gle Maps
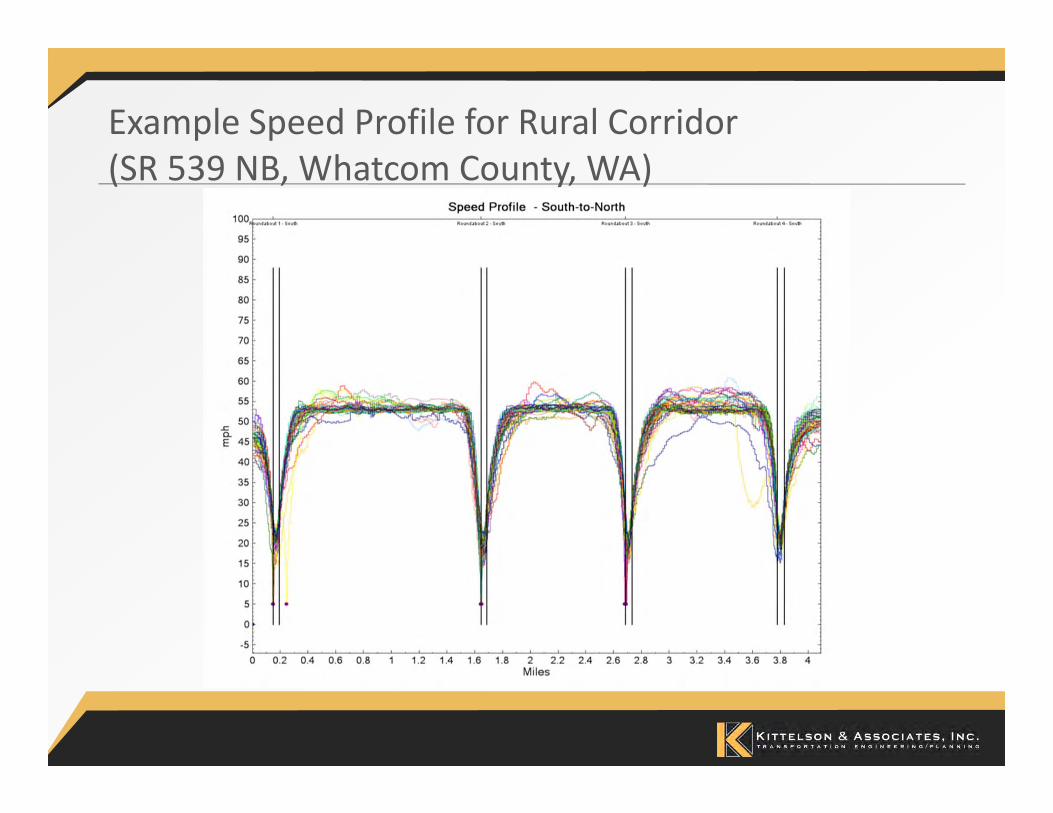
Example Speed Profile for Rural Corridor(SR 539 NB, Whatcom County, WA)
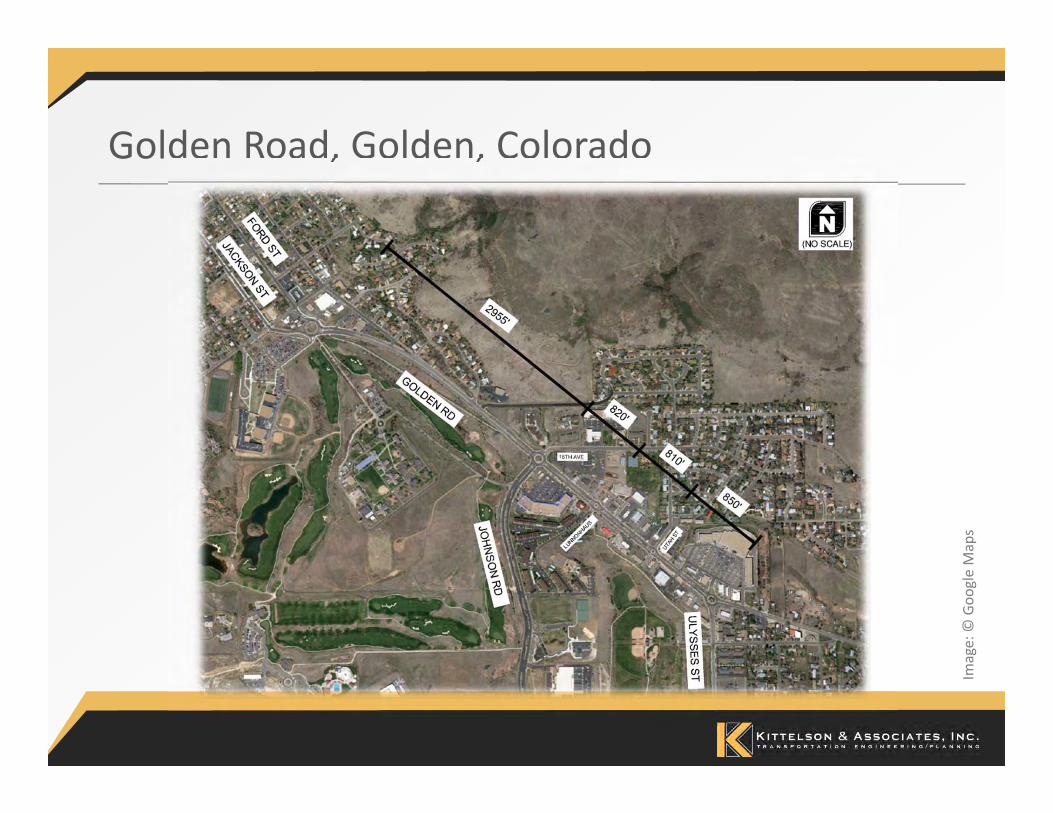
Golden Road, Golden, Colorado
Image: ©
Goo
gle Maps

Avon Road, Avon, Colorado
Image: ©
Goo
gle Maps
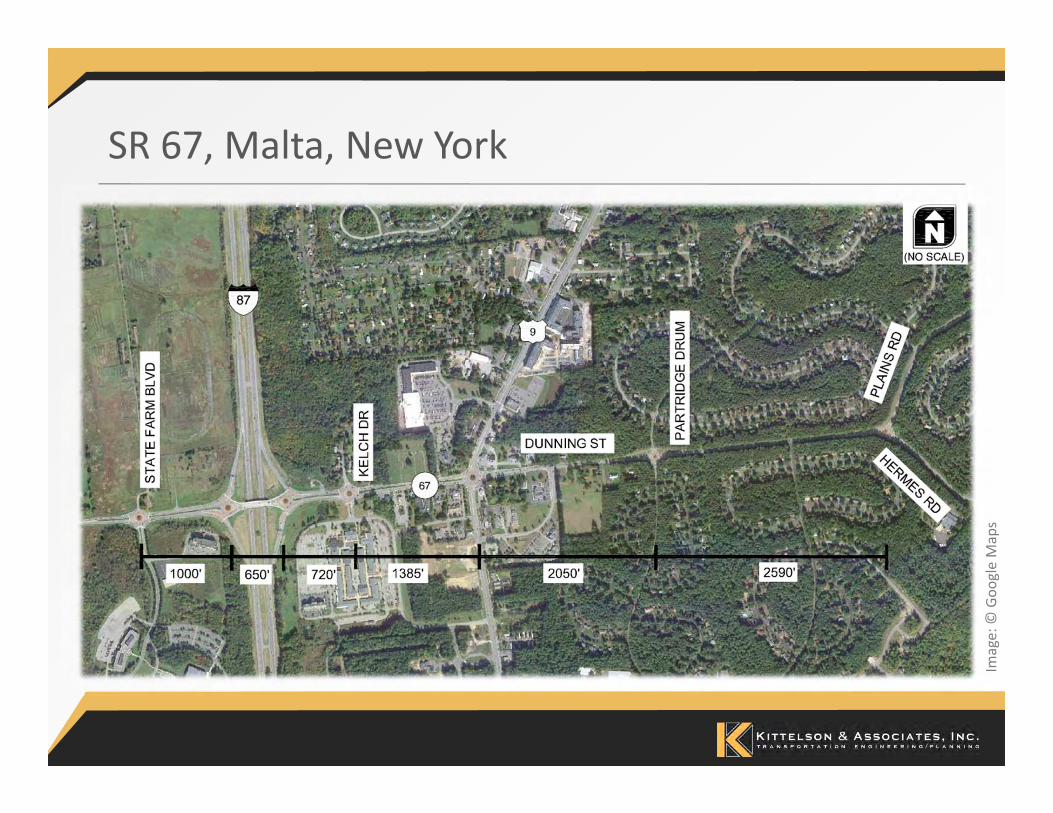
SR 67, Malta, New York
Image: ©
Goo
gle Maps
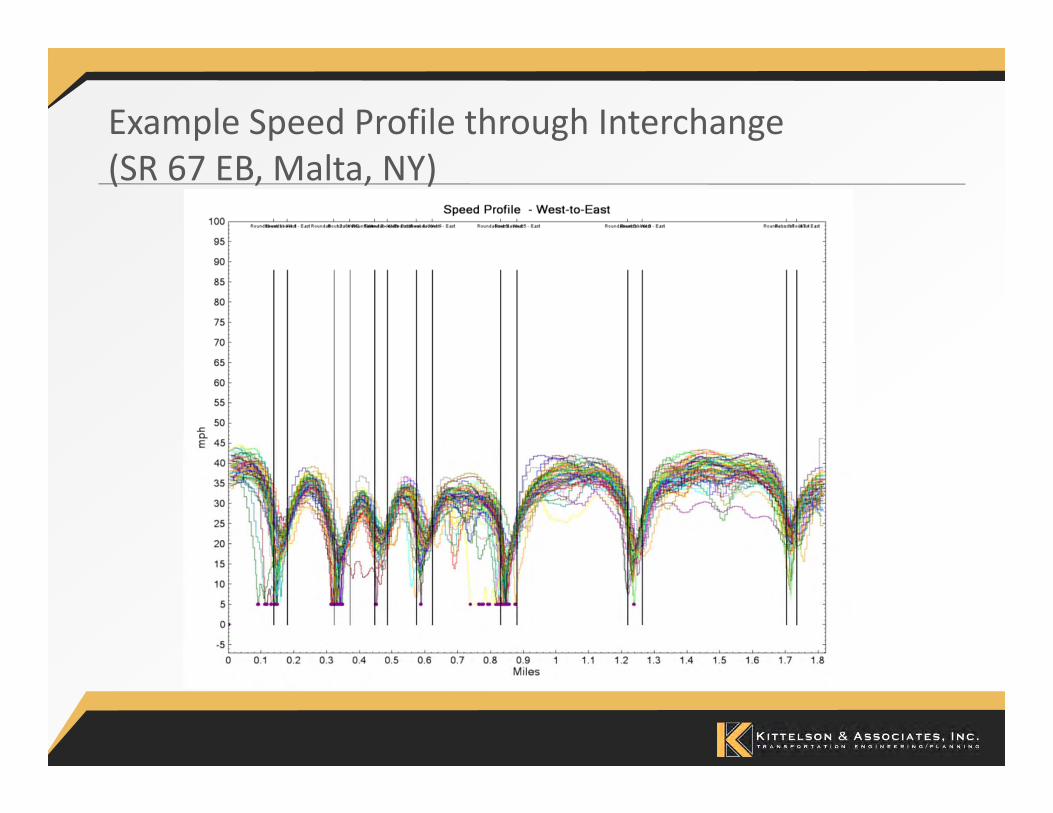
Example Speed Profile through Interchange(SR 67 EB, Malta, NY)
Corridor Owner/Operator Interviews
• Wide variety of experiences leading to development of corridors
• Reinforces motivation of Corridor Comparison Document to evaluate corridors on case‐by‐case basis

Corridor Owner/Operators – Lessons Learned
• Once several roundabouts built on a corridor, more are likely– Increased acceptance of roundabouts– Concerns about signal queue spillback– Access management– Consistency within corridor
• Traffic analysis typically analyzed roundabouts in isolation
• Agency champion is key
Modeling
• New predictive tools for estimating operational performance of roundabout corridors
• Created for for incorporation into HCM to enable signals‐versus‐roundabouts predictive comparisons
• Process of incorporating into HCM is underway with development of HCM 2010 Major Update
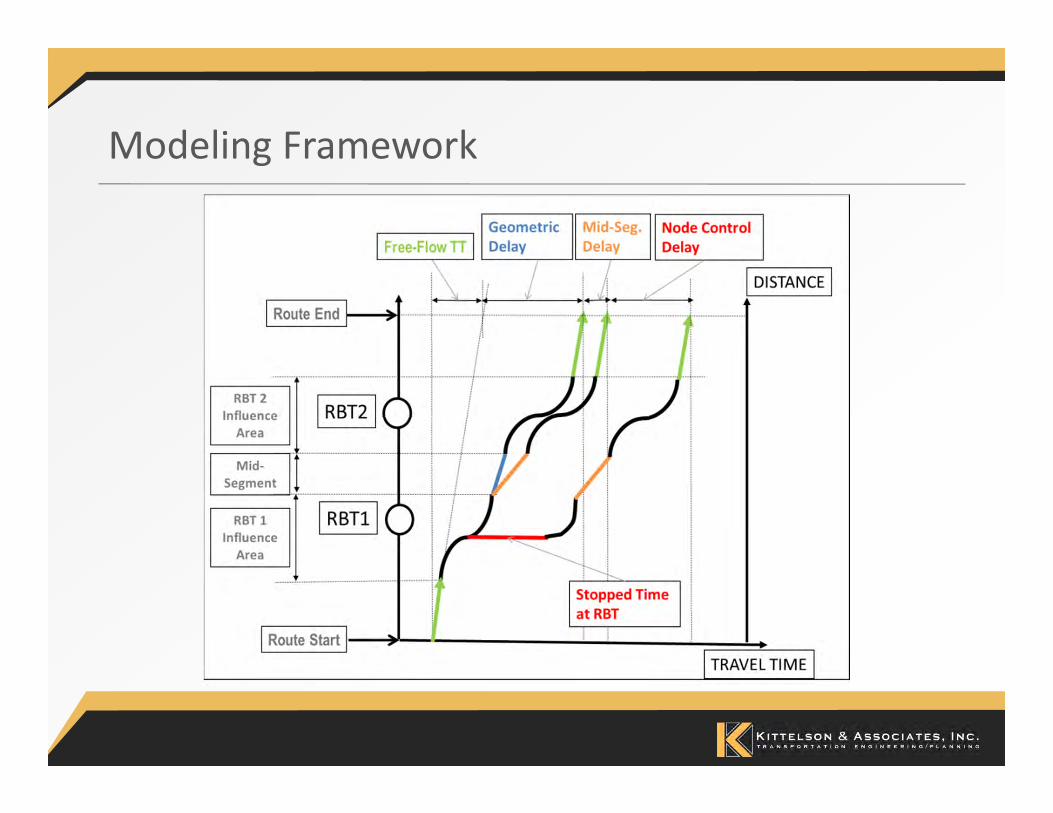
Modeling Framework

Modeling Framework
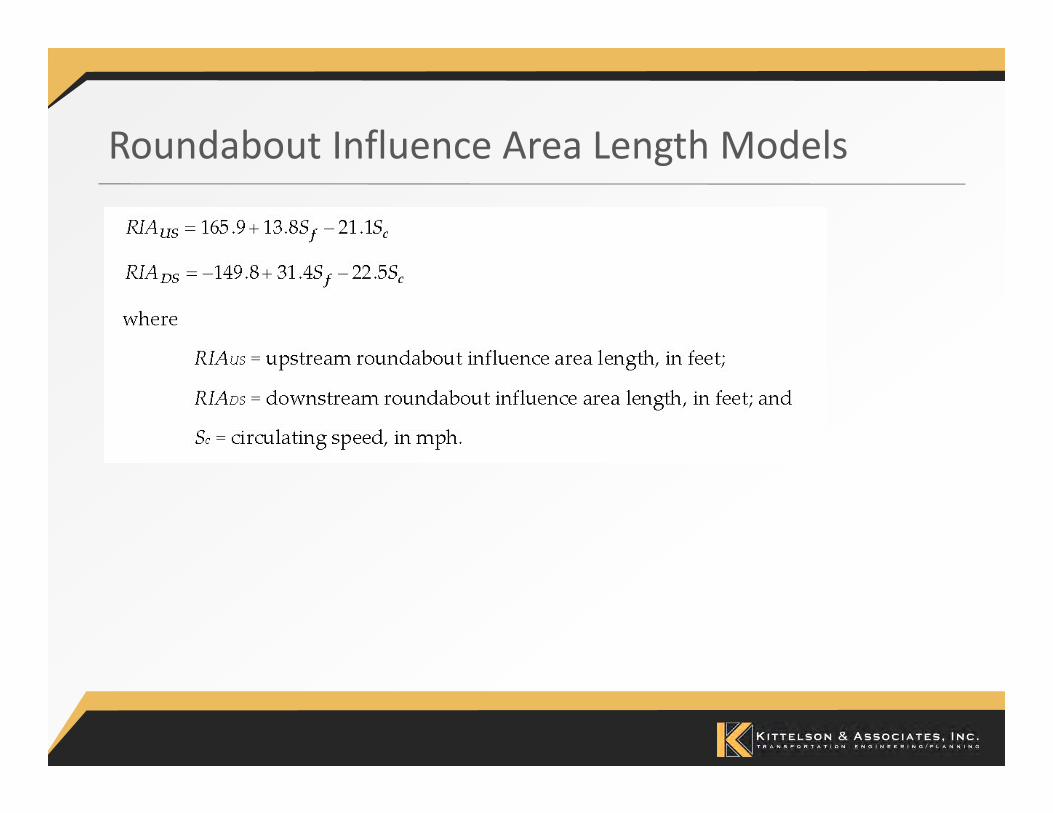
• New models developed by this project:– Free‐flow speed (Step B)– Roundabout Influence Area Length (Step C)
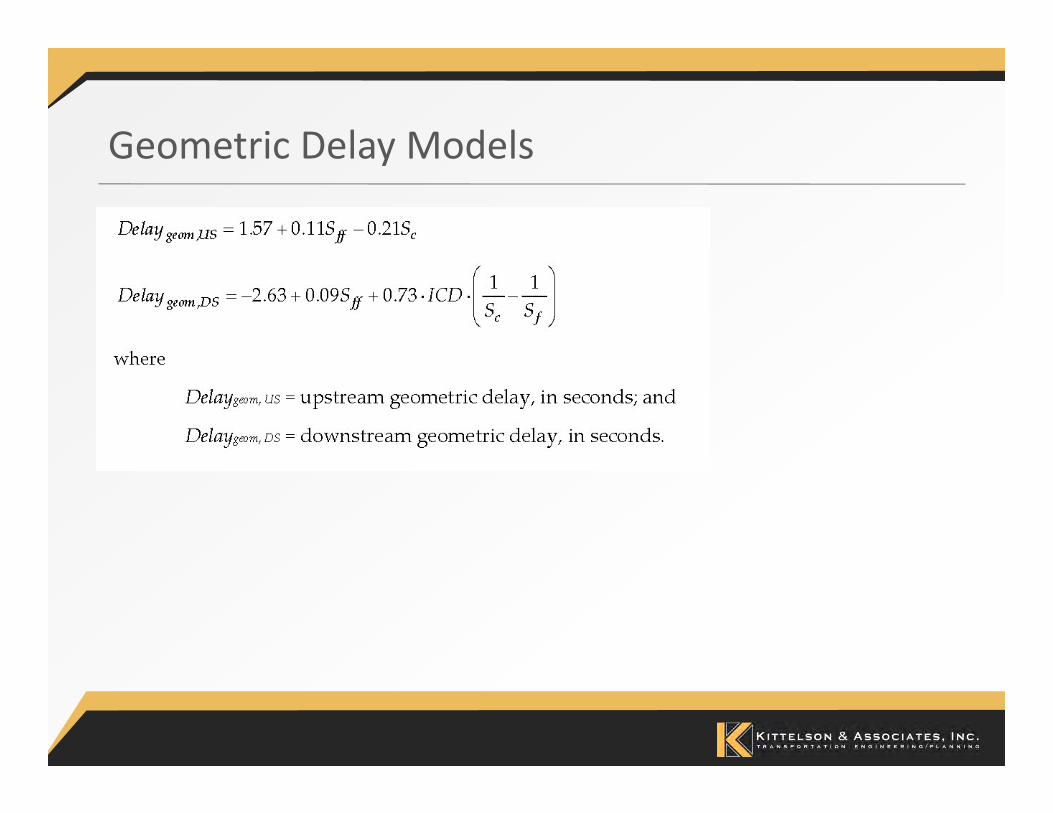
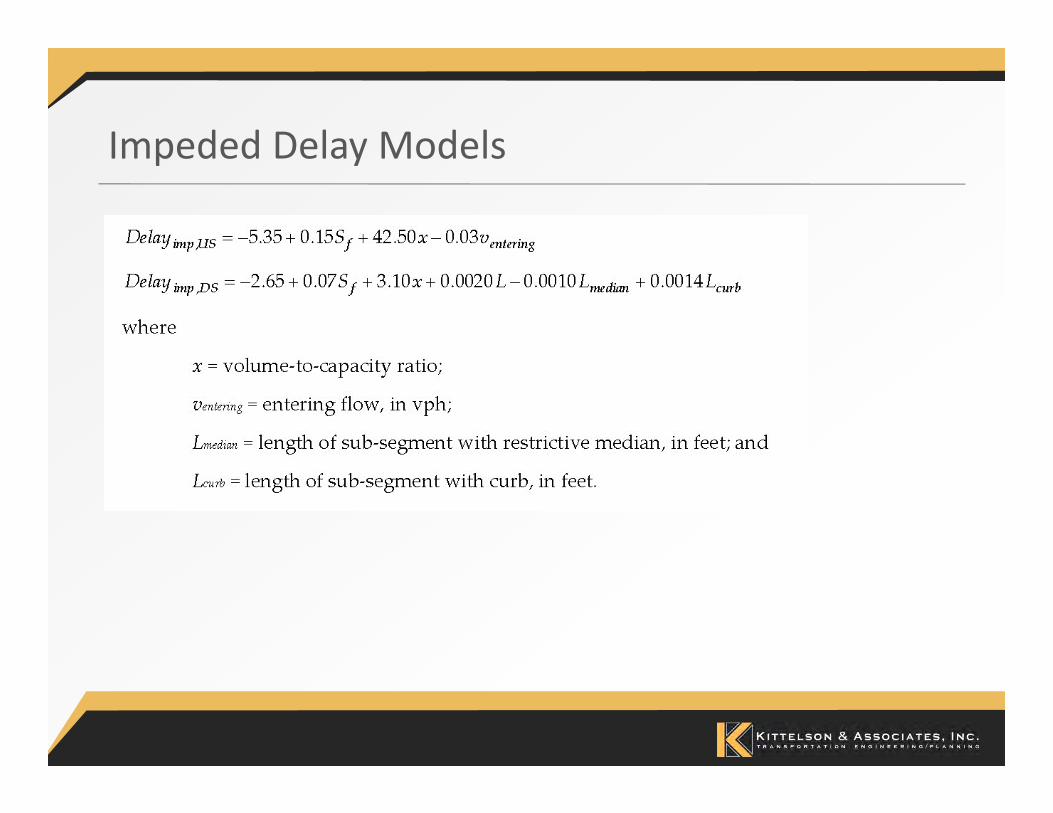
– Geometric Delay (Step H)– Impeded Delay (Step I) –analogous to control delay
• Fits into existing Urban Streets Procedure

Segment and Sub‐Segment Definitions
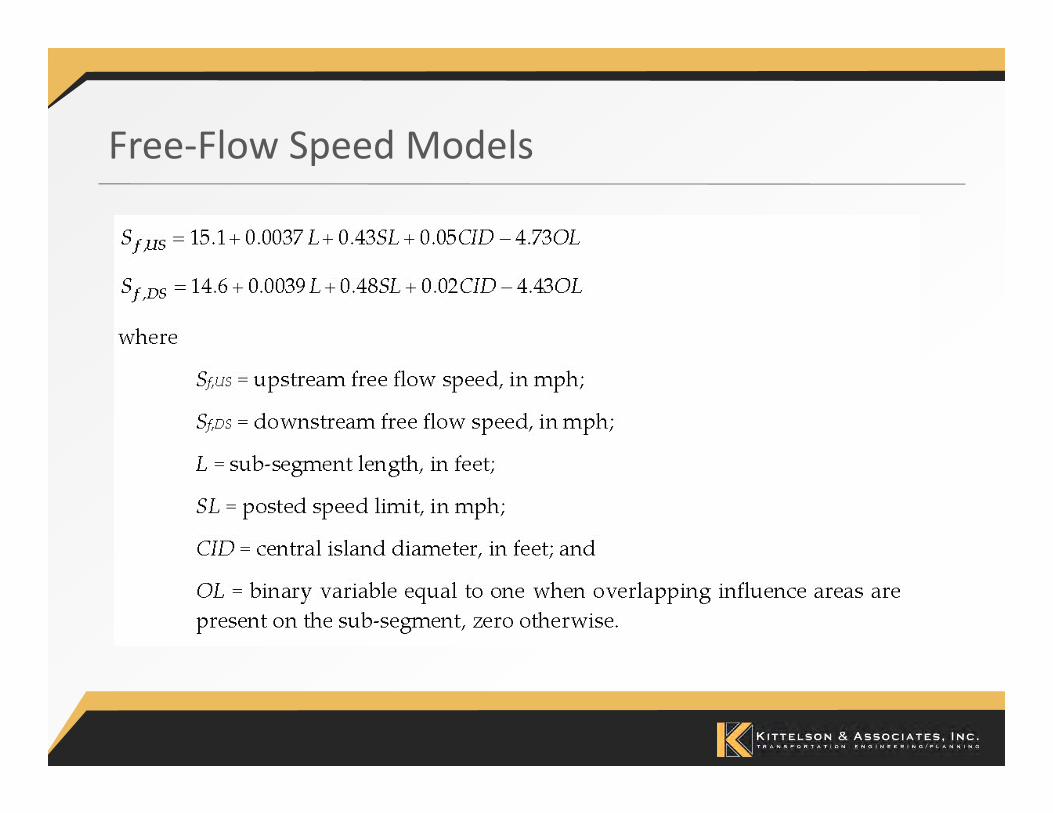
Free‐Flow Speed Models
Roundabout Influence Area Length Models
Geometric Delay Models
Impeded Delay Models

Operations Comparisons with “Equivalent Signalized Corridors”
• High‐level comparison to suggest trends if any• “Equivalent” signalized corridors developed for each roundabout corridor
• Estimate travel time (TT) performance using HCM‐based and simple simulation‐based analysis
• Compare estimated TT to field‐measured roundabout performance
Operations Comparisons with “Equivalent Signalized Corridors”
• Neither control option consistently results in reduced travel time or delay for through routes
• Site‐specific evaluation is key• Roundabouts tends to improve travel time for routes with a left turn onto or off a corridor
• Roundabouts are more likely to improve travel time with irregular intersection spacing
Corridor Comparison Document
• Chapter 1: Introduction• Chapter 2: Users of Arterials• Chapter 3: Project Planning Process
– 3.1 Project Initiation (incl. understanding of context)– 3.2 Concept Development– 3.3 Alternatives Analysis
• Chapter 4: Performance Measures• Chapter 5: Example Applications
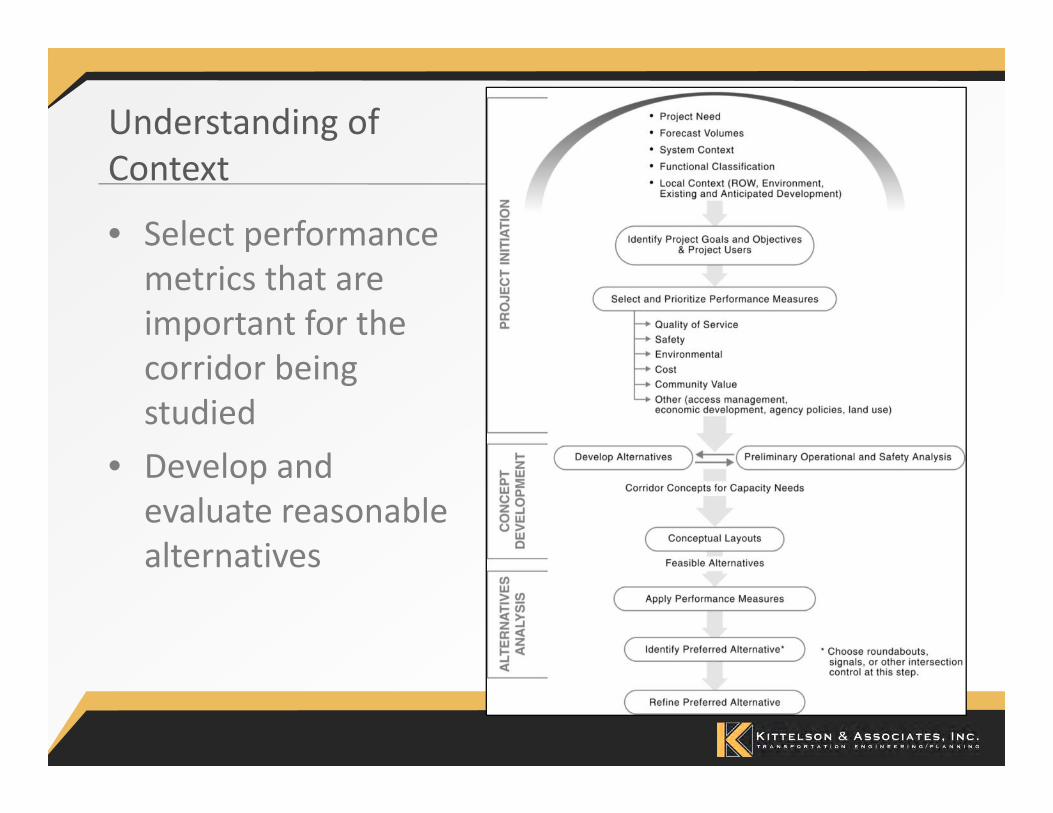
Understanding ofContext
• Select performance metrics that are important for the corridor being studied
• Develop and evaluate reasonable alternatives

Potential PerformanceMeasures
• Categories:– Quality of Service– Safety– Environmental– Costs– Community Values– Other

Example Applications
• Show use of:– Corridor Comparison Document– Roundabout travel time model developed for this project
• Examples– New suburban greenfield corridor– Community enhancement on existing urban corridor– Existing rural corridor in context sensitive, suburbanizing area
– Existing suburban corridor undergoing operations and safety evaluation
Thank you!
Photo: Lee
Rod
egerdts