Embed Size (px)
Citation preview

NCHRP Project 14-20A Final Report
H - 1
A P P E N D I X H
Procedure to Quantify Consequences of Delayed Maintenance of Pavement Markings
The purpose of pavement markings is to provide “guidance and information for the road user” for safer
driving conditions (FHWA 2009). Longitudinal lane, shoulder, and center lines; raised markers; and symbols,
guidance, and warning messages found on the surface of the roadway, all fall under the pavement marking
category. Federal Highway Administration has recognized the positive effects of pavement markings, also
called roadway delineation, on roadway safety since 1983 with the implementation of the pavement marking
initiatives (Migletz et al. 1994). Pavement markings are especially important during nighttime when fatal
crashes occur twice more often than during daytime (NHTSA 2014). Delaying maintenance of the pavement
markings system will not only impact the agency’s future maintenance and replacement costs but it will also
affect safety by increasing the likelihood of car accidents. Figure H-1 shows the procedure to quantify the
consequences of delayed maintenance of pavement markings systems.
Figure H-1. Procedure to quantify the consequences of delayed maintenance of pavement markings.
Scenario 1
All Needs
(Baseline Scenario)
Future budget needs:
- Backlog cost
- Pavement Marking Sustainability Ratio
Pavement Marking Condition and
Remaining Service Life
Pavement Marking System Value and
Sustainability Ratio
Step 3: Conduct Delayed
Maintenance Scenarios
Analyses
Step 2: Determine
Maintenance and Budget
Needs
Step 1: Define the Pavement
Marking System
Preservation Policy
Scenario 2
Do Nothing
Scenario 3
Delayed Maintenance,
treatments are delayed by
certain number of years
1.1: Identify the Types of Maintenance Activities
1.2: Establish Performance Objectives for the Pavement Marking System
1.3: Formulate Decision Criteria for Pavement Marking Maintenance Activities
2.1: Assess the Pavement Marking System Condition and Service Life
3.1: Formulate Delayed Maintenance Scenarios
3.2: Perform the Delayed Maintenance Scenarios Analyses
3.3: Determine the Impact of Delayed Maintenance and
Report the Consequences
2.2: Select Performance Models to Forecast the Pavement Marking Condition
2.3: Perform the Needs Analysis
Scenario 4
Budget-driven with
limited funds
NCHRP Project 14-20A Final Report
H - 2
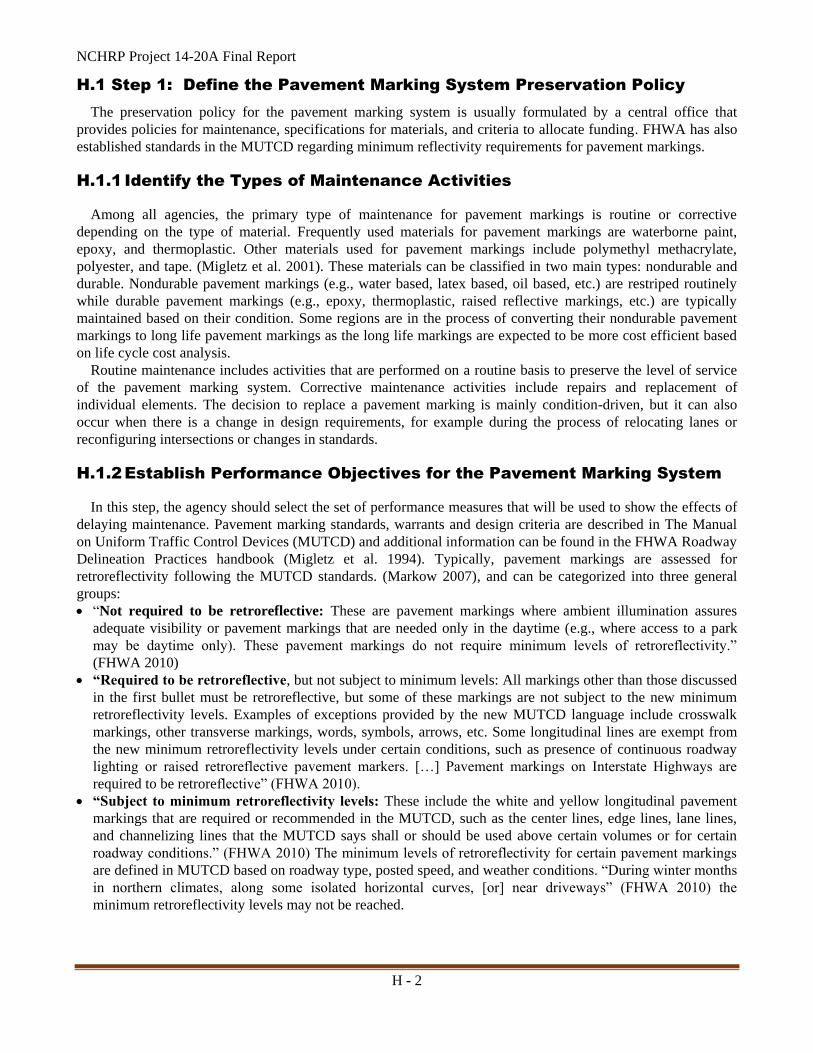
H.1 Step 1: Define the Pavement Marking System Preservation Policy
The preservation policy for the pavement marking system is usually formulated by a central office that
provides policies for maintenance, specifications for materials, and criteria to allocate funding. FHWA has also
established standards in the MUTCD regarding minimum reflectivity requirements for pavement markings.
H.1.1 Identify the Types of Maintenance Activities
Among all agencies, the primary type of maintenance for pavement markings is routine or corrective
depending on the type of material. Frequently used materials for pavement markings are waterborne paint,
epoxy, and thermoplastic. Other materials used for pavement markings include polymethyl methacrylate,
polyester, and tape. (Migletz et al. 2001). These materials can be classified in two main types: nondurable and
durable. Nondurable pavement markings (e.g., water based, latex based, oil based, etc.) are restriped routinely
while durable pavement markings (e.g., epoxy, thermoplastic, raised reflective markings, etc.) are typically
maintained based on their condition. Some regions are in the process of converting their nondurable pavement
markings to long life pavement markings as the long life markings are expected to be more cost efficient based
on life cycle cost analysis.
Routine maintenance includes activities that are performed on a routine basis to preserve the level of service
of the pavement marking system. Corrective maintenance activities include repairs and replacement of
individual elements. The decision to replace a pavement marking is mainly condition-driven, but it can also
occur when there is a change in design requirements, for example during the process of relocating lanes or
reconfiguring intersections or changes in standards.
H.1.2 Establish Performance Objectives for the Pavement Marking System
In this step, the agency should select the set of performance measures that will be used to show the effects of
delaying maintenance. Pavement marking standards, warrants and design criteria are described in The Manual
on Uniform Traffic Control Devices (MUTCD) and additional information can be found in the FHWA Roadway
Delineation Practices handbook (Migletz et al. 1994). Typically, pavement markings are assessed for
retroreflectivity following the MUTCD standards. (Markow 2007), and can be categorized into three general
groups:
“Not required to be retroreflective: These are pavement markings where ambient illumination assures
adequate visibility or pavement markings that are needed only in the daytime (e.g., where access to a park
may be daytime only). These pavement markings do not require minimum levels of retroreflectivity.”
(FHWA 2010)
“Required to be retroreflective, but not subject to minimum levels: All markings other than those discussed
in the first bullet must be retroreflective, but some of these markings are not subject to the new minimum
retroreflectivity levels. Examples of exceptions provided by the new MUTCD language include crosswalk
markings, other transverse markings, words, symbols, arrows, etc. Some longitudinal lines are exempt from
the new minimum retroreflectivity levels under certain conditions, such as presence of continuous roadway
lighting or raised retroreflective pavement markers. […] Pavement markings on Interstate Highways are
required to be retroreflective” (FHWA 2010).
“Subject to minimum retroreflectivity levels: These include the white and yellow longitudinal pavement
markings that are required or recommended in the MUTCD, such as the center lines, edge lines, lane lines,
and channelizing lines that the MUTCD says shall or should be used above certain volumes or for certain
roadway conditions.” (FHWA 2010) The minimum levels of retroreflectivity for certain pavement markings
are defined in MUTCD based on roadway type, posted speed, and weather conditions. “During winter months
in northern climates, along some isolated horizontal curves, [or] near driveways” (FHWA 2010) the
minimum retroreflectivity levels may not be reached.
NCHRP Project 14-20A Final Report
H - 3
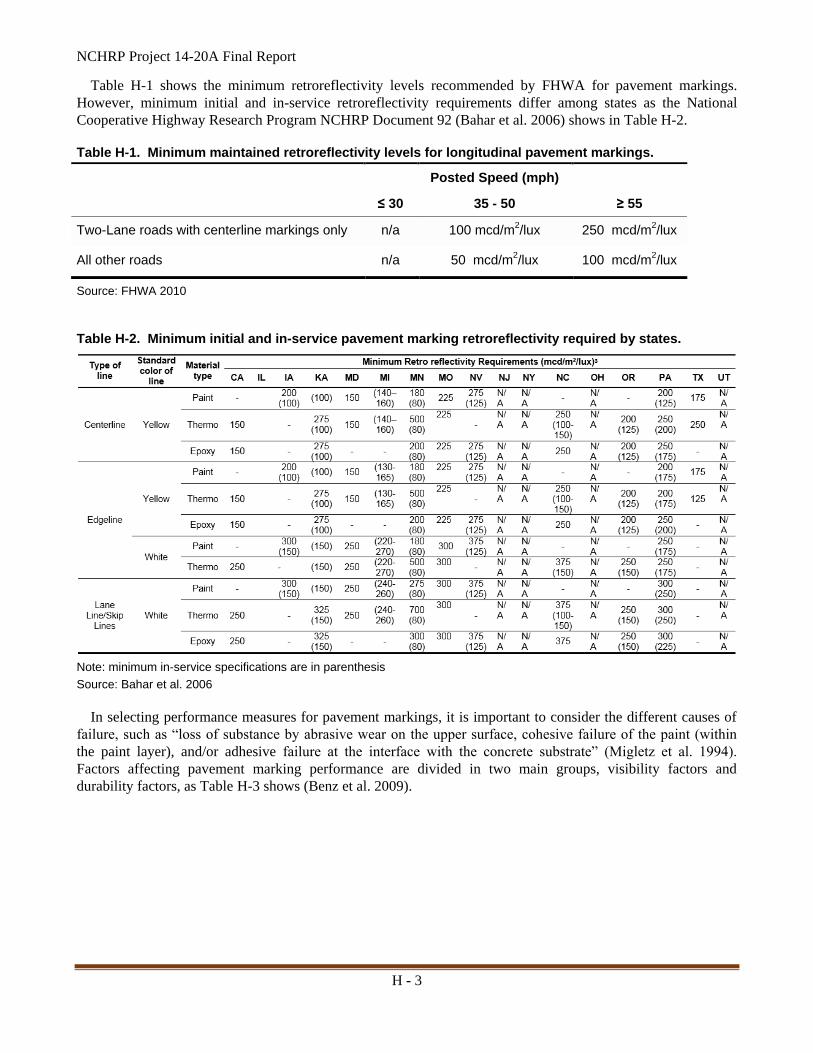
Table H-1 shows the minimum retroreflectivity levels recommended by FHWA for pavement markings.
However, minimum initial and in-service retroreflectivity requirements differ among states as the National
Cooperative Highway Research Program NCHRP Document 92 (Bahar et al. 2006) shows in Table H-2.
Table H-1. Minimum maintained retroreflectivity levels for longitudinal pavement markings.
Source: FHWA 2010
Table H-2. Minimum initial and in-service pavement marking retroreflectivity required by states.
Note: minimum in-service specifications are in parenthesis
Source: Bahar et al. 2006
In selecting performance measures for pavement markings, it is important to consider the different causes of
failure, such as “loss of substance by abrasive wear on the upper surface, cohesive failure of the paint (within
the paint layer), and/or adhesive failure at the interface with the concrete substrate” (Migletz et al. 1994).
Factors affecting pavement marking performance are divided in two main groups, visibility factors and
durability factors, as Table H-3 shows (Benz et al. 2009).
Posted Speed (mph)
≤ 30 35 - 50 ≥ 55
Two-Lane roads with centerline markings only n/a 100 mcd/m2/lux 250 mcd/m
2/lux
All other roads n/a 50 mcd/m2/lux 100 mcd/m
2/lux
NCHRP Project 14-20A Final Report
H - 4
Table H-3. Pavement marking performance factors.
Visibility factors Durability Factors
Contrast, Retroreflectivity, Presence, Pavement Texture, Pavement Color, Marking Color, Marking Type, Marking Size, Headlamp Type, Viewing Geometry, Ambient Lighting Conditions
Marking Material, Marking Thickness, Pavement Type, Pavement Texture, Traffic Volume, Weather, Maintenance Activities Marking Location (Edgeline, Centerline, Lane line) Roadway Geometry (Horizontal Curves, Weaving Areas, etc.
Source: Benz et al. 2009
Pavement markings performance categories with corresponding data and contributing factors are shown in
Table H-4 (e.g., brightness, day visibility, retroreflectivity).
Table H-4. Pavement marking performance categories and important contributing factors.
Category Important Data or Factor Source
Overall Performance
Brightness Benefit Factor (BBF) = average retroreflectivity over anticipated service life * service life / average cost per unit length
(KDOT 2002)
Condition
Day Visibility (Presence) NCHRP Synthesis 470 (Zimmerman 2015)
Retroreflectivity threshold of min. 100 mcd/m2/lux (Kopf 2004)
Durability, Appearance, Nighttime Visibility – each rated on a scale 0 (none remaining) to 10 (perfect)
(Migletz et al. 1994)
Individual performance measures and factors affecting pavement markings system performance can be tied to
levels of service using a simplified scale. For example, CDOT’s inspection guidelines rate the visibility of
pavement markings. The rating ranges from 4 when 81-100 percent of pavement markings are visible, to 0 when
0-20 percent of pavement markings are visible. There is also a condition indicator rating for retroreflectivity
reading (mcd/m²/lux), which ranges from a rating of 4 when it is greater than 200 mcd/m²/lux, to rating of 0
when it is 49 mcd/m²/lux or less. Annual inspections are performed on 700 different random locations statewide.
These ratings are used to assign a letter grade from A to F for the Maintenance Level of Service (MLOS) to
define pavement markings categories. The MLOS grade is used as a base line for the current system
performance, and to set target objectives for future years. CDOT uses the levels of service for stripping and
markings shown in Table H-5. The criterion is based on the percentage of striping and markings that are not
functioning as intended (worn or not easily visible).
Targets for maintenance depend upon the performance measures used by the agency and data availability. The
following common performance measures are used in pavement markings to setup targets (Markow 2007):
Loss of retroreflectivity
Pavement marking age and estimated remaining life
Percentage of pavement markings at certain level of service
Percentage of broken or missing raised pavement markers
Deterioration due to abrasion or wear
Customer complaints.

NCHRP Project 14-20A Final Report
H - 5
The performance measures can be either physical (measured in units, e.g., mcd/m2/lux for retroreflectivity),
or qualitative (assessed on a scale: e.g., good, fair, poor; A, B, C, D, F) (Markow 2007). The pavement marking
model developed in this research considers level of service categories (A, B, C, D, F) based on retroreflectivity
measurements or remaining service life, and captures the percentage of the system in each category due to a
given maintenance preservation policy. Retroreflectivity thresholds for the condition categories are shown in
Table H-6 based on the data shown in Table H-2.
Table H-5. Levels of service for pavement striping and markings.
Maintenance Program Area: Traffic Services Survey Item: Striping, Markings
Pavement striping and other markings are in generally excellent condition, with a high visibility and reflectivity in daytime and nighttime, and little or no wearing and obliteration. Approximate limits for levels of service are as follows, expressed as a percent of striping and other pavement markings that are worn or not easily visible: A+, less than 5.0 percent; A, up to 9.2 percent; A-, up to 13.3 percent.
Pavement striping and other markings are in generally good condition, visible in daytime and nighttime, and showing only minor wearing or obliteration. Approximate limits for levels of service are as follows, expressed as a percent of striping and other pavement markings that are worn or not easily visible: B+, up to 17.5 percent; B, up to 22.5 percent; B-, up to 27.5 percent.
Pavement striping and other markings are in fair condition, generally visible in daytime and nighttime, but with noticeable wearing and obliteration, or loss of reflectivity. Approximate limits for levels of service are as follows, expressed as a percent of striping and other pavement markings that are worn or not easily visible: C+, up to 32.5 percent; C, up to 36.7 percent; C-, up to 40.7 percent.
Pavement striping and other markings are in marginal condition, with noticeable wearing, obliteration, or loss of reflectivity in almost half of the markings. Approximate limits for levels of service are as follows, expressed as a percent of striping and other pavement markings that are worn or not easily visible: D+, up to 45.0 percent; D, up to 48.3 percent; D-, up to 54.7 percent.
Pavement striping and markings are essentially worn and obliterated. Markings that are still present are not easily visible. Approximate limits for levels of service are as follows, expressed as a percent of striping and other pavement markings that are worn or not easily visible: F+, up to 55.0 percent; F, up to 75.0 percent; F-, more than 75.0 percent.
Source: CDOT 1999
Table H-6. Pavement marking condition categories based on retroreflectivity.
Condition Category Lower Retroreflectivity Limit
A 319 mcd/m²/lux
B 263 mcd/m²/lux
C 207 mcd/m²/lux
D 150 mcd/m²/lux
F below 150 mcd/m²/lux
The inventory used in the example includes pavement markings with three types of materials (epoxy,
polyurea, and thermoplastic), and two colors (white, yellow). The model predicts the percentage of pavement
markings in each condition level category. Pavement markings below 150 mcd/m²/lux are scheduled for
repainting in order to restore the retroreflectivity to its initial value of 375 mcd/m²/lux as mandated by FHWA.
In the model, the user specifies whether the analysis is condition based or age based, and the available budget
over the period of analysis. The model calculates the budget needs over the analysis period for repainting
pavement markings with retroreflectivity vales below 150 mcd/m²/lux.

NCHRP Project 14-20A Final Report
H - 6
H.1.3 Formulate Decision Criteria for Pavement Marking Maintenance
Activities
This step involves determining what maintenance activities should be included in the pavement markings
preservation program. Maintenance activities include cleaning, repainting or reapplying, repairing or replacing,
or removal. Maintenance activities for pavement markings are recommended to be scheduled in coordination
with pavement treatment activities needed in the same road segment (AASHTO 2007).
The criteria for maintenance activities depends on the preservation policy and the performance measures
selected by the agency. Most of the maintenance activities are formulated based on field surveys to determine
the pavement marking condition. For example, in Minnesota, each district has a stripping coordinator. Some
districts rely on retroreflectometer data and others on visual inspection to determine maintenance needs for the
following year. The districts decide whether latex or epoxy paint is used to refresh the markings. Epoxy paint
last about three years, while latex paint is expected to last one year. The type of paint depends on the ADT and
pavement surface type. At North Carolina Department of Transportation, pavement markings are checked for
location and visibility with annual inspections. The inspections are performed on a representative sample.
Routine maintenance is performed for nondurable pavement markings and they are typically restriped twice a
year. Maintenance activities affected by a resurfacing cycle or snowplowing are considered routine.
Durable pavement markings are replaced based on condition. Currently, the types of pavement markings used
in North Carolina include paint, thermoplastic, cold applied plastic, and polyurea. Colorado Department of
Transportation annually inspects a random sample of pavement marking assets. The condition ratings from the
inspections are then used to formulate the budget. In Utah, pavement markings are also inspected semiannually,
where a representative sample is measured for retroreflectivity. The regions have full authority over
maintenance activities. Maintenance for water-based (less durable) pavement markings is considered routine
maintenance and they are repainted annually. More durable markings (e.g., epoxy paint) are maintained based
on performance. The MMQA (Maintenance Management Quality Assurance) rating is related to nighttime
visibility of the lines. The results from semiannual inspection is used to identify the percent of assets which are
deficient within a station (section of highway). Based on this percentage, the station is given a Level of
Maintenance (LOM) category which is expressed with a letter grade (i.e., A, B, C, D, and F) and a target grade
(A to C) is established for each maintenance activity. “Once a target LOM is established, the goal is to meet that
LOM as closely as possible, neither falling short of the target nor exceeding it” (UDOT 2012).
Florida Department of Transportation determines all pavement markings that fall below their standard for
visibility through their annual inspection process. Stripping that does not meet the MRP standard is scheduled to
be restriped. At the project level, Florida’s MRP handbook specifies maintenance conditions for pavement
markings. During inspections, each line is evaluated per the MRP standard to determine if maintenance is
needed. For example, striping does not meet the MRP standards when the following conditions exist.
1. If more than 10 percent of the length of any line is less than 5.4 inches wide during daylight inspection.
2. If more than 10 percent of the length and width of any line is not visible for a distance of 160 feet at night.
3. If more than 10 percent of the length of any line is missing.
4. If more than 10 percent of the length of any line is covered by soil, grass, or debris.
In this study, the decision criteria for maintenance activities is based on minimum retroreflectivity standards
in terms of a letter grade system. “Paint” is applied when a pavement marking reaches category D or F to restore
the retroreflectivity level.
H.2 Step 2: Determine Maintenance and Budget Needs for the Pavement
Marking System
H.2.1 Assess the Pavement Marking System Condition
The MUTCD provides general guidelines on the condition assessment for pavement markings. Visual
inspections using retroreflectometers (handheld or mobile) are performed at daytime and nighttime (FHWA
2009). New MUTCD mentions the following condition assessment methods:

NCHRP Project 14-20A Final Report
H - 7
“Calibrated Visual Nighttime Inspection: Prior to conducting a nighttime inspection from a moving vehicle
and in conditions similar to nighttime field conditions, a trained inspector calibrates his eyes to pavement
markings with known retroreflectivity levels at or above those in Table 3A-1. Pavement markings identified by
the inspector to have retroreflectivity below the minimum levels are replaced.” (FHWA 2010)
“Consistent Parameters Visual Nighttime Inspection: A trained inspector at least 60 years old conducts a
nighttime inspection from a moving vehicle under parameters consistent with the supporting research. Pavement
markings identified by the inspector to have retroreflectivity below the minimum levels are replaced” (FHWA
2010)
“Measured Retroreflectivity: Pavement marking retroreflectivity is measured using a retroreflectometer.
Pavement markings with retroreflectivity levels below the minimums are replaced.” (FHWA 2010)
“Service Life Based on Monitored Markings: Markings are replaced based on the monitored performance
of similar in-service markings with similar placement characteristics. All pavement markings in a
group/area/corridor are replaced when those in the representative monitored control set are near or at minimum
retroreflectivity levels. The control set markings are monitored on a regular basis by the visual nighttime
inspection method, the measured retroreflectivity method, or both” (FHWA 2010)
“Blanket Replacement – All pavement markings in a group/area/corridor or of a given type are replaced at
specific intervals. The replacement interval is based on when the shortest-life material in that
group/area/corridor approaches the minimum retroreflectivity level. The interval is also based on historical
retroreflectivity data for that group/area/corridor.” (FHWA 2010)
“Other Methods – Other methods developed based on engineering studies that determine when markings are
to be replaced based on the minimum levels in Table 3A-1.” (FHWA 2010)
Pavement marking durability and retroreflectivity is affected by several factors, including wet thickness of
paint during application. A report for Missouri DOT suggests that “new pavement surfaces should receive a
heavier one-time application of material or be striped twice in a season” (Weinkein et al. 2002). Also the color
of the marking is a factor, as yellow markings tend to deteriorate twice as fast as white markings (Sarasua et al.
2012). The pavement type also affects the pavement marking deterioration rate, usually paint lasts longer on
asphalt than on concrete. Climate represents another factor since extremely low or high temperatures, snow fall,
usage of snow ploughs, and heavy rain falls may reduce service life of pavement markings (Migletz et al. 1994).
Pavement markings service life expectancy is usually determined based on agency experience, professional
judgment, and manufacturer’s data. The life expectancy for pavement markings ranges between 6 months to 2
years for non-epoxy paint, between 1 to 5 years for epoxy paint, 2 to 10 years for thermoplastic, 1 to 10 years
for cold plastic, and 5 to 10 years for tape (Markow 2007), as Table H-7 shows.
Table H-7. Pavement markings life expectancy.
Component and Material No. of
Responses Minimum (Years)
Maximum (Years)
Mean (Years)
Median (Years)
Mode (Years)
Lane and Edge Striping - - - - - -
Non-epoxy paint 22 0.5 2 1.1 1 1
Epoxy paint 13 1 5 3.3 4 4
Thermoplastic 16 2 10 4.2 4 5
Cold plastic 8 1 10 4.9 5 6
Polyester 2 2 3 2.3 2.3 -
Tape 5 5 10 6.3 6 5
Thin thermoplastic 1 - - 1-2 - -
Preformed thermoplastic 1 - - 3 - -
Pavement Markers - - - - - -
Ceramic pavement markers 2 3 3 3 3 3
NCHRP Project 14-20A Final Report
H - 8
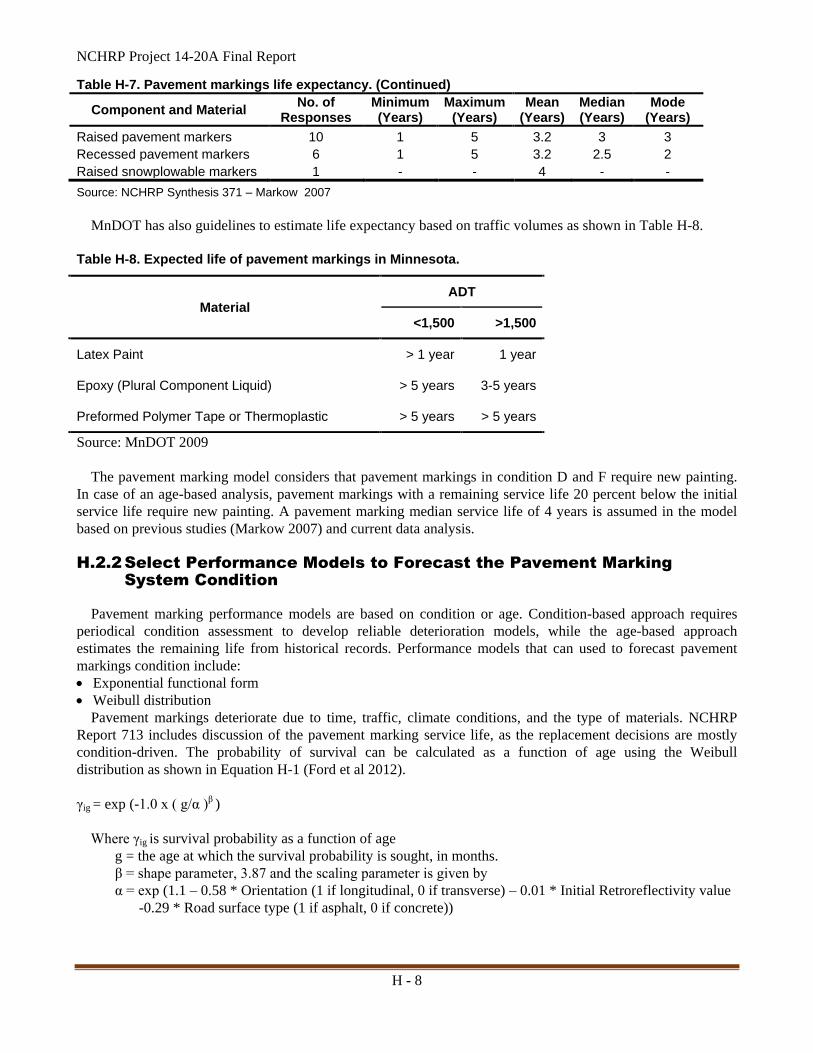
Table H-7. Pavement markings life expectancy. (Continued)
Component and Material No. of
Responses Minimum (Years)
Maximum (Years)
Mean (Years)
Median (Years)
Mode (Years)
Raised pavement markers 10 1 5 3.2 3 3
Recessed pavement markers 6 1 5 3.2 2.5 2
Raised snowplowable markers 1 - - 4 - -
Source: NCHRP Synthesis 371 – Markow 2007
MnDOT has also guidelines to estimate life expectancy based on traffic volumes as shown in Table H-8.
Table H-8. Expected life of pavement markings in Minnesota.
Material ADT
<1,500 >1,500
Latex Paint > 1 year 1 year
Epoxy (Plural Component Liquid) > 5 years 3-5 years
Preformed Polymer Tape or Thermoplastic > 5 years > 5 years
Source: MnDOT 2009
The pavement marking model considers that pavement markings in condition D and F require new painting.
In case of an age-based analysis, pavement markings with a remaining service life 20 percent below the initial
service life require new painting. A pavement marking median service life of 4 years is assumed in the model
based on previous studies (Markow 2007) and current data analysis.
H.2.2 Select Performance Models to Forecast the Pavement Marking
System Condition
Pavement marking performance models are based on condition or age. Condition-based approach requires
periodical condition assessment to develop reliable deterioration models, while the age-based approach
estimates the remaining life from historical records. Performance models that can used to forecast pavement
markings condition include:
Exponential functional form
Weibull distribution
Pavement markings deteriorate due to time, traffic, climate conditions, and the type of materials. NCHRP
Report 713 includes discussion of the pavement marking service life, as the replacement decisions are mostly
condition-driven. The probability of survival can be calculated as a function of age using the Weibull
distribution as shown in Equation H-1 (Ford et al 2012).
γig = exp (-1.0 x ( g/α )β )
Where γig is survival probability as a function of age
g = the age at which the survival probability is sought, in months.
β = shape parameter, 3.87 and the scaling parameter is given by
α = exp (1.1 – 0.58 * Orientation (1 if longitudinal, 0 if transverse) – 0.01 * Initial Retroreflectivity value
-0.29 * Road surface type (1 if asphalt, 0 if concrete))

NCHRP Project 14-20A Final Report
H - 9
Other deterioration models for pavement markings establish a relationship between retroreflectivity and age.
Sarasua et al. (2012) in a study for South Carolina DOT estimated a linear relationship between retroreflectivity
and age for yellow solid, yellow skip, and white edgeline markings for waterborne, thermoplastic, and high-
build materials. Their model is able to “predict retroreflectivity values within a 20 percent error for
approximately 65 percent of the measured pavement marking values for waterborne white edge lines, 90 percent
for high-build white edge line markings, 71 percent for waterborne yellow solid” (Sarasua et al. 2012).
A Weibull distribution for the probability of failure of pavement markings based on age can developed from a
DOT data inventory. Table H-9 shows a summary of the data statistics used for the development of a Weibull
regression model. The statistics results are close to the values previously suggested by Markow (2007).
Table H-9. Pavement marking life expectancy.
Pavement Marking Type No. of
Observations Minimum (Years)
Maximum (Years)
Mean (Years)
Median (Years)
Mode (Years)
White, Epoxy White, Polyurea White, Thermoplastic Yellow, Epoxy Yellow, Polyurea Yellow, Thermoplastic
62 269 314 10
270 105
1 1 1 2 1 1
6 5 8 4 9 8
3.8 2.9 4.5 3
3.5 4.6
4 3 4 3 3 4
6 2 4 2 2 4
Table H-10 shows the Weibull regression model developed in this study using data available from a DOT.
Table H-10. Weibull deterioration model parameters for pavement markings.
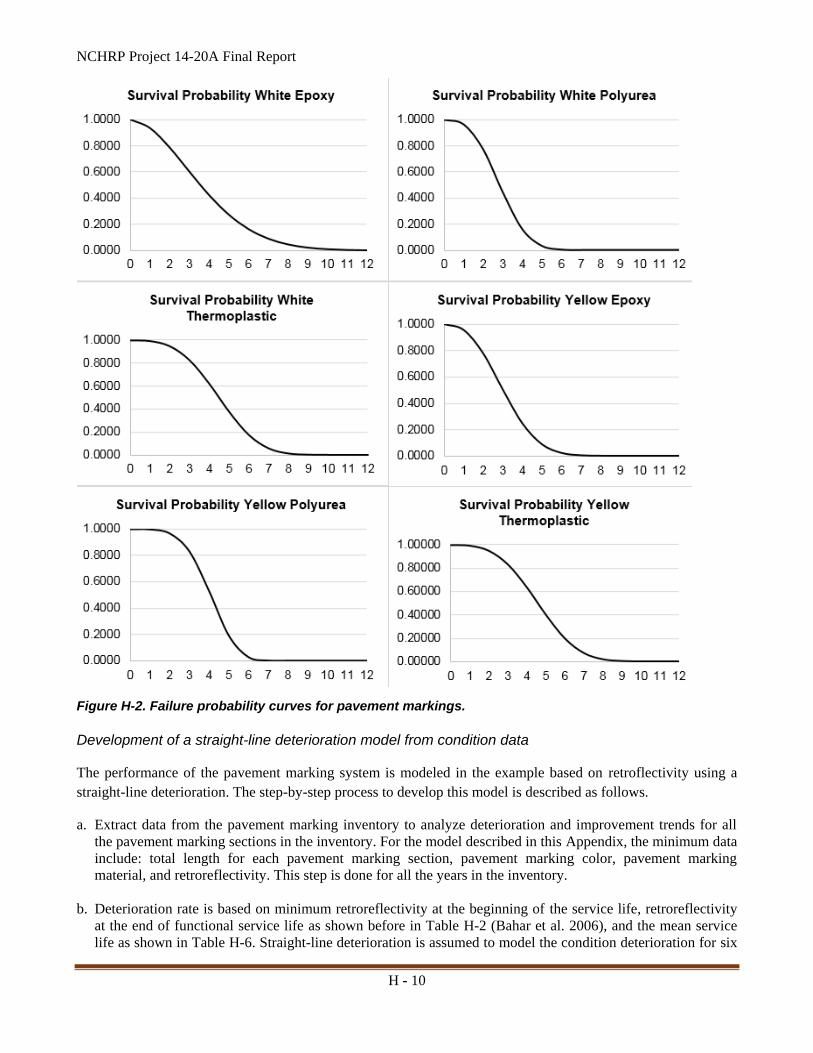
Survival probability curves that were developed in this study for the pavement markings are shown in
Figure H-2. The curves show the probability that in a certain year pavement markings still comply with the
minimum retroreflectivity.
In a simplified approach, linear deterioration over time is modeled based on service life expectancy for
different pavement marking types (e.g., white, yellow), and materials (e.g., epoxy, polyuria, thermoplastic). The
process to develop a simplified straight-line deterioration model is described in the next section.
Pavement Marking Type Shape Factor, β Scaling Factor, α
White, Epoxy 1.838 4.338
White, Polyurea 2.835 3.227
White, Thermoplastic 3.208 5.032
Yellow, Epoxy 2.484 3.492
Yellow, Polyurea 4.301 2.222
Yellow, Thermoplastic 3.151 5.133
NCHRP Project 14-20A Final Report
H - 10
Figure H-2. Failure probability curves for pavement markings.
Development of a straight-line deterioration model from condition data
The performance of the pavement marking system is modeled in the example based on retroflectivity using a
straight-line deterioration. The step-by-step process to develop this model is described as follows.
a. Extract data from the pavement marking inventory to analyze deterioration and improvement trends for all
the pavement marking sections in the inventory. For the model described in this Appendix, the minimum data
include: total length for each pavement marking section, pavement marking color, pavement marking
material, and retroreflectivity. This step is done for all the years in the inventory.
b. Deterioration rate is based on minimum retroreflectivity at the beginning of the service life, retroreflectivity
at the end of functional service life as shown before in Table H-2 (Bahar et al. 2006), and the mean service
life as shown in Table H-6. Straight-line deterioration is assumed to model the condition deterioration for six
NCHRP Project 14-20A Final Report
H - 11
combinations with two colors (white, yellow), and three pavement marking materials (epoxy, polyuria,
thermoplastic).
c. Based on retroreflectivity, the pavement marking system is divided into five condition groups: A, B, C, D, F.
Condition A, B, and C complies with the retroreflectivity standards as mandated by FHWA. Condition D
indicates that pavement markings will soon not meet the minimum retroreflectivity standard. Condition F
means that a pavement marking is below the minimum retroreflectivity threshold. The following equation is
used to model the retroflectivity changes along the service life.
𝑅𝑛 = 𝑅𝑛−1
𝑅0 − 𝑅 𝑒𝑛𝑑
𝑆𝐿
Rn = lower limit for retroreflectivity that classifies as condition category A (n=1), B (n=2), C (n=3),
D (n=4), F (n=5)
R0 = assumed retroreflectivity at the beginning of service life
Rend = minimum required retroreflectivity by FHWA
SL = expected mean service life
d. Each condition category has an associated maintenance activity. If pavement marking groups were in
condition A, B, and C no treatment is applied. Pavement marking sections in condition D and F are fully
repainted.
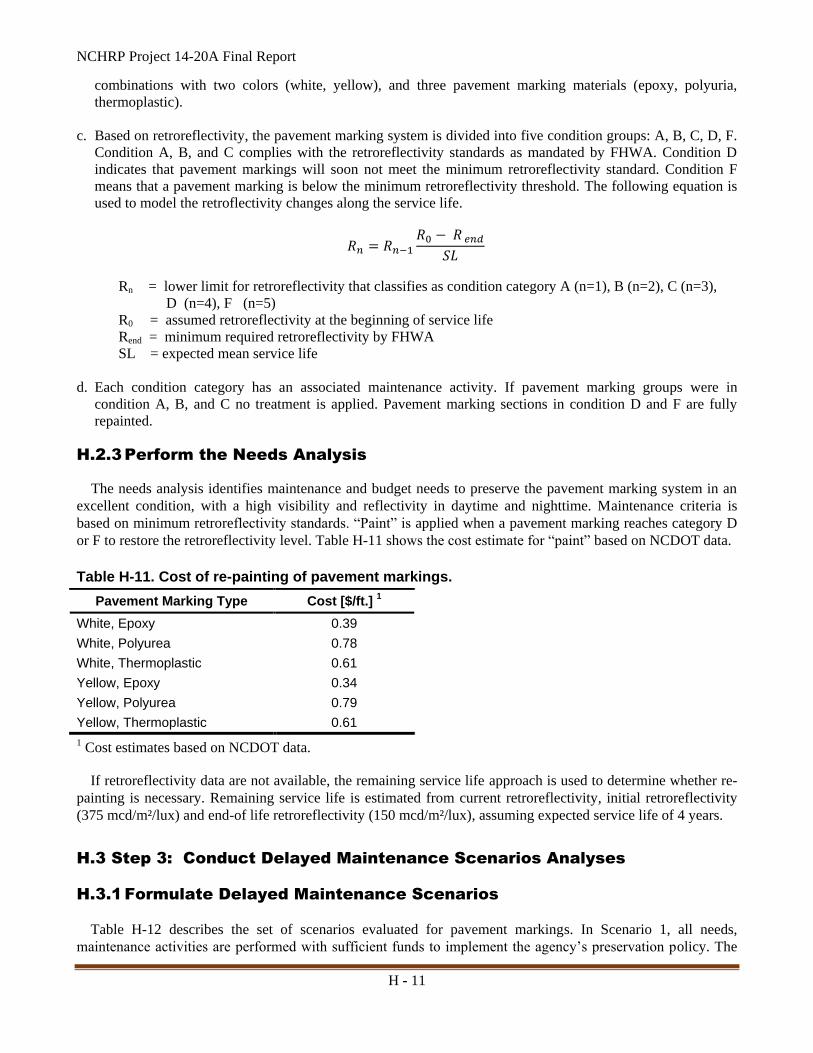
H.2.3 Perform the Needs Analysis
The needs analysis identifies maintenance and budget needs to preserve the pavement marking system in an
excellent condition, with a high visibility and reflectivity in daytime and nighttime. Maintenance criteria is
based on minimum retroreflectivity standards. “Paint” is applied when a pavement marking reaches category D
or F to restore the retroreflectivity level. Table H-11 shows the cost estimate for “paint” based on NCDOT data.
Table H-11. Cost of re-painting of pavement markings.
1 Cost estimates based on NCDOT data.
If retroreflectivity data are not available, the remaining service life approach is used to determine whether re-
painting is necessary. Remaining service life is estimated from current retroreflectivity, initial retroreflectivity
(375 mcd/m²/lux) and end-of life retroreflectivity (150 mcd/m²/lux), assuming expected service life of 4 years.
H.3 Step 3: Conduct Delayed Maintenance Scenarios Analyses
H.3.1 Formulate Delayed Maintenance Scenarios
Table H-12 describes the set of scenarios evaluated for pavement markings. In Scenario 1, all needs,
maintenance activities are performed with sufficient funds to implement the agency’s preservation policy. The
Pavement Marking Type Cost [$/ft.] 1
White, Epoxy 0.39
White, Polyurea 0.78
White, Thermoplastic 0.61
Yellow, Epoxy 0.34
Yellow, Polyurea 0.79
Yellow, Thermoplastic 0.61
NCHRP Project 14-20A Final Report
H - 12
budget from this scenario is considered as the baseline budge. Scenario 2, do nothing, evaluates the impact of
“no maintenance” on the future performance of pavement marking system and budget needs. Scenarios 3 and 4
are formulated to model delayed maintenance either by policy or by limited budget. Delayed maintenance by
policy is modeled by a delayed time cycle, therefore if a pavement marking needs maintenance in year n then
this activity is deferred by a certain number of years. Delayed maintenance by limited budget is modeled by
delayed maintenance until funds becomes available; priorities for funding are based on a priority maintenance
index calculated as a division of annual average daily traffic by the length of pavement markings in that
particular group.
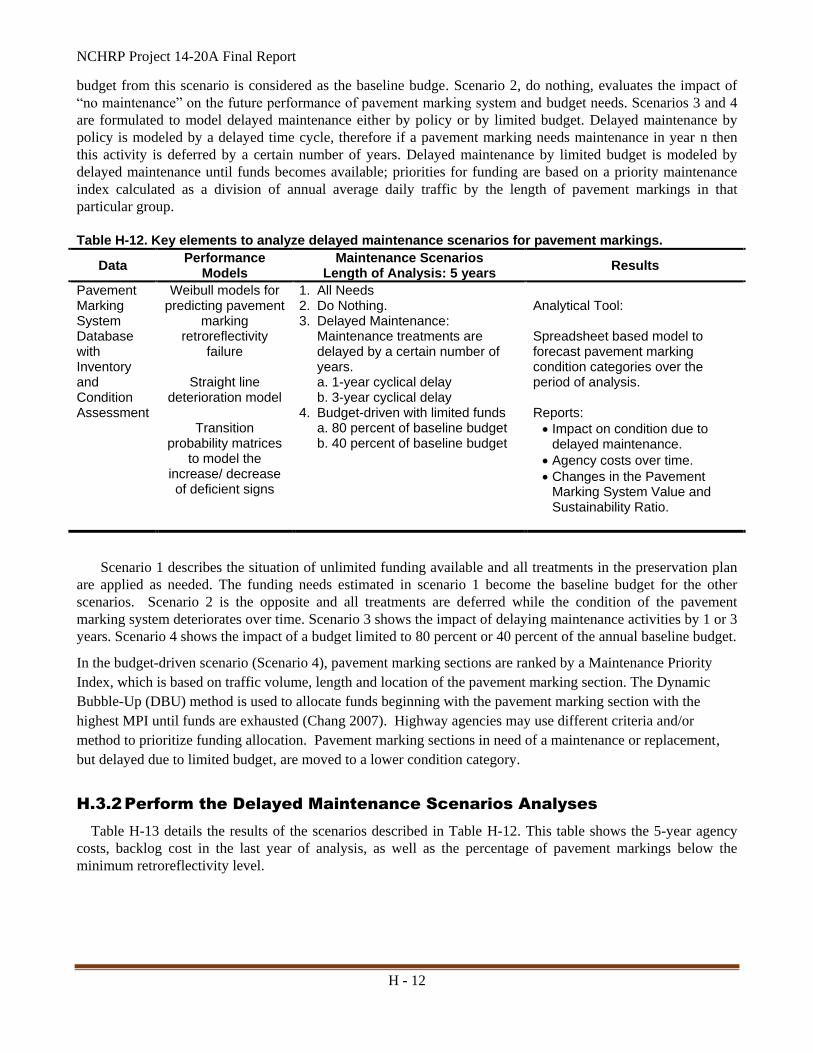
Table H-12. Key elements to analyze delayed maintenance scenarios for pavement markings.
Data Performance
Models Maintenance Scenarios
Length of Analysis: 5 years Results
Pavement Marking System Database with Inventory and Condition Assessment
Weibull models for predicting pavement
marking retroreflectivity
failure
Straight line deterioration model
Transition
probability matrices to model the
increase/ decrease of deficient signs
1. All Needs 2. Do Nothing. 3. Delayed Maintenance:
Maintenance treatments are delayed by a certain number of years. a. 1-year cyclical delay b. 3-year cyclical delay
4. Budget-driven with limited funds a. 80 percent of baseline budget b. 40 percent of baseline budget
Analytical Tool: Spreadsheet based model to forecast pavement marking condition categories over the period of analysis. Reports:
Impact on condition due to delayed maintenance.
Agency costs over time.
Changes in the Pavement Marking System Value and Sustainability Ratio.
Scenario 1 describes the situation of unlimited funding available and all treatments in the preservation plan
are applied as needed. The funding needs estimated in scenario 1 become the baseline budget for the other
scenarios. Scenario 2 is the opposite and all treatments are deferred while the condition of the pavement
marking system deteriorates over time. Scenario 3 shows the impact of delaying maintenance activities by 1 or 3
years. Scenario 4 shows the impact of a budget limited to 80 percent or 40 percent of the annual baseline budget.
In the budget-driven scenario (Scenario 4), pavement marking sections are ranked by a Maintenance Priority
Index, which is based on traffic volume, length and location of the pavement marking section. The Dynamic
Bubble-Up (DBU) method is used to allocate funds beginning with the pavement marking section with the
highest MPI until funds are exhausted (Chang 2007). Highway agencies may use different criteria and/or
method to prioritize funding allocation. Pavement marking sections in need of a maintenance or replacement,
but delayed due to limited budget, are moved to a lower condition category.
H.3.2 Perform the Delayed Maintenance Scenarios Analyses
Table H-13 details the results of the scenarios described in Table H-12. This table shows the 5-year agency
costs, backlog cost in the last year of analysis, as well as the percentage of pavement markings below the
minimum retroreflectivity level.

NCHRP Project 14-20A Final Report
H - 13
Table H-13. Summary of results for the scenario analyses for the pavement marking system.
Scenario Description
Total
Agency
Costs1
Backlog
Cost1
Percent Pavement Marking
System below Minimum
Retroreflectivity
End of Year 5 Critical Year
1
All Needs
$25.22 M $0 0 2 (Year)
2 Do Nothing $0 $16.60 M 86 86 (Year 5)
3
Delayed Maintenance
a. 1-year cyclical delay
b. 3-year cyclical delay
$15.15 M
$14.06 M
$4.48 M
$6.85 M
22
38
37 (Year 1)
50 (Year 2)
4
Budget-driven with limited
funds
a. 80 percent of baseline
budget
b. 40 percent of baseline
budget
$19.95 M
$10.04 M
$3.62 M
$9.95 M
19
51
19 (Year 5)
51 (Year 5) 1At the end of year 5.
At the beginning of the analysis, the percentage of length of pavement markings below the minimum
retroreflectivity is 29 percent. With optimal funding of $25.22 million over a 5-year period, all pavement
markings comply with the requirements. This is considered the baseline budget for the other scenarios.
In Scenario 2, where no funding is available over a 5-year period, the backlog costs increase to $16.60 million
and 86 percent of the system becomes deficient at the end of year 5.
In Scenario 3.a, when maintenance activities are delayed by 1 year, agency costs are $15.15 million and
$4.48 million are backlogged, then 22 percent of the system is deficient at the end of year 5.
In Scenario 3.b, when maintenance activities are delayed by 3 years, agency costs are $14.06 million and
$6.85 million are backlogged, then 38 percent of the system is deficient at the end of year 5.
In Scenario 4.a, when maintenance activities are delayed due to limited budget (80 percent of baseline
budget), agency costs are $19.95 million and $3.62 million are backlogged, then 19 percent of the system is
deficient at the end of year 5. In Scenario 4.b, when maintenance activities are delayed due to limited budget (40
percent of baseline budget), agency costs are $10.04 million, and $9.95 million are backlogged, then 51 percent
of the system is deficient at the end of year 5.
H.3.3 Determine the Impact of Delayed Maintenance and Report the
Consequences
To quantify the consequences of delayed maintenance, the results of delayed maintenance scenarios are
compared to the baseline scenario from the needs analysis.
Consequences on the Pavement Marking System Condition and Service Life
At the beginning of the analysis, 34 percent of pavement marking system is in condition A, 19 percent in
condition B, 11 percent in condition C, 7 percent in condition D, and 29 percent in condition F, as Figure H-3
shows.

NCHRP Project 14-20A Final Report
H - 14
Figure H-3. Pavement marking system current condition.
Figure H-4 shows the pavement marking condition categories at the end of year 5. In Scenario 1 (All Needs),
there are no assets in condition F, while for the delayed maintenance scenarios this condition group increases to
22 percent and 38 percent for 1 and 3-year delay respectively. In Scenario 2 (Do Nothing), 86 percent of the
markings fall into the F category. In Scenario 3.a (Delayed maintenance by 1 year), majority of the pavement
markings are in condition D (35 percent) and F (22 percent), while A decreases to 14 percent from initial 34
percent in year 0. In Scenario 3.b (Delayed maintenance by 3 years), 38 percent of pavement markings ends up
in condition F, only 4 percent in condition D, and 16 percent in condition A.
Figure H-4. Pavement marking system condition categories at the end of analysis period, year 5.
NCHRP Project 14-20A Final Report
H - 15
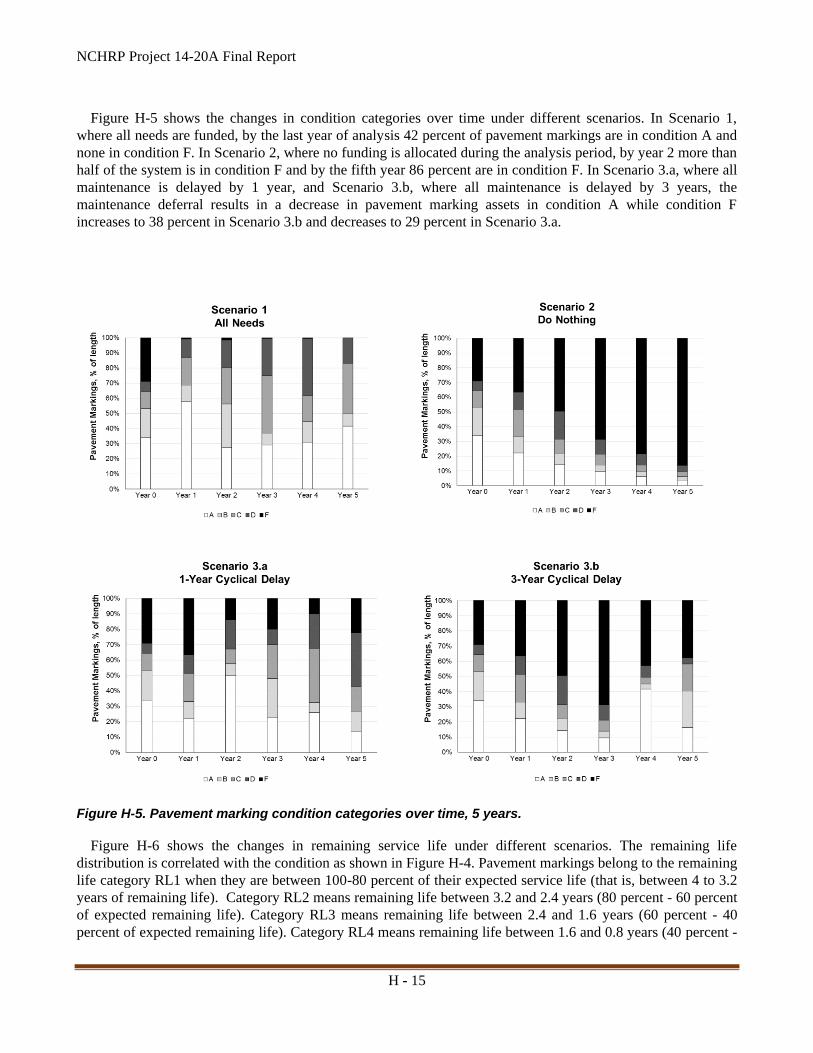
Figure H-5 shows the changes in condition categories over time under different scenarios. In Scenario 1,
where all needs are funded, by the last year of analysis 42 percent of pavement markings are in condition A and
none in condition F. In Scenario 2, where no funding is allocated during the analysis period, by year 2 more than
half of the system is in condition F and by the fifth year 86 percent are in condition F. In Scenario 3.a, where all
maintenance is delayed by 1 year, and Scenario 3.b, where all maintenance is delayed by 3 years, the
maintenance deferral results in a decrease in pavement marking assets in condition A while condition F
increases to 38 percent in Scenario 3.b and decreases to 29 percent in Scenario 3.a.
Figure H-5. Pavement marking condition categories over time, 5 years.
Figure H-6 shows the changes in remaining service life under different scenarios. The remaining life
distribution is correlated with the condition as shown in Figure H-4. Pavement markings belong to the remaining
life category RL1 when they are between 100-80 percent of their expected service life (that is, between 4 to 3.2
years of remaining life). Category RL2 means remaining life between 3.2 and 2.4 years (80 percent - 60 percent
of expected remaining life). Category RL3 means remaining life between 2.4 and 1.6 years (60 percent - 40
percent of expected remaining life). Category RL4 means remaining life between 1.6 and 0.8 years (40 percent -

NCHRP Project 14-20A Final Report
H - 16
20 percent of expected remaining life). Finally, category RL5 is for pavement markings with less than 20
percent of their service life.
Figure H-7 shows that when no funding is allocated, then by year 2, 50 percent of pavement markings are in
condition F, below the FHWA requirements. Scenario 3.a results in 22 percent of pavement markings below
minimum retroreflectivity at the end of five years. Scenario 3.b follows a similar trend as Scenario 2 in the first
3-year deferral period reaching 69 percent of pavement markings below minimum retroreflectivity (condition
category F), then the percentage goes down to 38 percent.
Figure H-6. Pavement marking system remaining service life over time, 5 years.

NCHRP Project 14-20A Final Report
H - 17
Figure H-7. Percentage of pavement markings below minimum retroreflectivity level.
Consequences on Future Budget Needs
If maintenance activities are delayed, not only pavement marking system condition deteriorates and system
value goes down, but also unfunded backlog accumulates. Figure H-8 shows the unfunded backlog which is $0
for Scenario 1 (All Needs), and increases up to $16.6 million for Scenario 2 (Do Nothing). The backlog for
Scenario 3.a ranges between $6.8 million and $2.1 million, while for Scenario 3.b the backlog range is up to
$13.1 million.
Figure H-8. Comparison of unfunded backlog costs over the analysis period.

NCHRP Project 14-20A Final Report
H - 18
Consequences on the Pavement Marking System Value
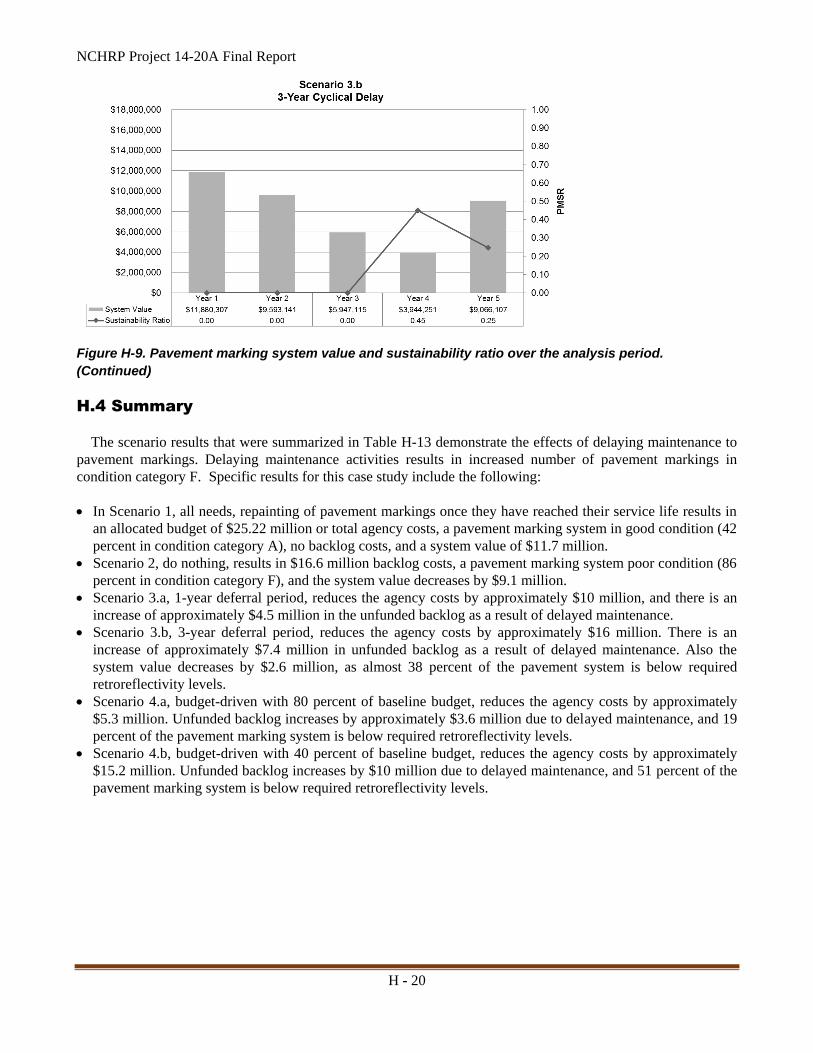
Figure H-9 shows the pavement marking system value together with the pavement marking sustainability
ratio (PMSR) over the analysis period of 5 years. PMSR indicates on a scale 0 to 1 the percentage of budget
needs that are allocated each year. In Scenario 1, all needs, the system value ranges between $11.7 and $16.1
million. In Scenario 2, where treatments are performed during the analysis period, the system value goes down
to $2.6 million. In Scenario 3.a, where maintenance activities are delayed by 1 year, the system value recovers
after the drop in year 2 and stays around $12 million. In Scenario 3.b, where maintenance is delayed by 3 years,
the system value starts to recover in year 5 but only to $9 million.

NCHRP Project 14-20A Final Report
H - 19
Figure H-9. Pavement marking system value and sustainability ratio over the analysis period.
NCHRP Project 14-20A Final Report
H - 20
Figure H-9. Pavement marking system value and sustainability ratio over the analysis period.
(Continued)
H.4 Summary
The scenario results that were summarized in Table H-13 demonstrate the effects of delaying maintenance to
pavement markings. Delaying maintenance activities results in increased number of pavement markings in
condition category F. Specific results for this case study include the following:
In Scenario 1, all needs, repainting of pavement markings once they have reached their service life results in
an allocated budget of $25.22 million or total agency costs, a pavement marking system in good condition (42
percent in condition category A), no backlog costs, and a system value of $11.7 million.
Scenario 2, do nothing, results in $16.6 million backlog costs, a pavement marking system poor condition (86
percent in condition category F), and the system value decreases by $9.1 million.
Scenario 3.a, 1-year deferral period, reduces the agency costs by approximately $10 million, and there is an
increase of approximately $4.5 million in the unfunded backlog as a result of delayed maintenance.
Scenario 3.b, 3-year deferral period, reduces the agency costs by approximately $16 million. There is an
increase of approximately $7.4 million in unfunded backlog as a result of delayed maintenance. Also the
system value decreases by $2.6 million, as almost 38 percent of the pavement system is below required
retroreflectivity levels.
Scenario 4.a, budget-driven with 80 percent of baseline budget, reduces the agency costs by approximately
$5.3 million. Unfunded backlog increases by approximately $3.6 million due to delayed maintenance, and 19
percent of the pavement marking system is below required retroreflectivity levels.
Scenario 4.b, budget-driven with 40 percent of baseline budget, reduces the agency costs by approximately
$15.2 million. Unfunded backlog increases by $10 million due to delayed maintenance, and 51 percent of the
pavement marking system is below required retroreflectivity levels.
NCHRP Project 14-20A Final Report
H - 21
References
American Association of State Highway and Transportation Officials (AASHTO). 2007. Maintenance Manual
for Roadways and Bridges. 4th Edition. American Association of State Highway and Transportation
Officials, Washington, DC. Bahar, G., M. Masliah, T. Erwin, E. Tan, and E. Hauer. 2006. Pavement Marking Materials and Markers: Real-
World Relationship Between Retroreflectivity and Safety Over Time. NCHRP Web-Only Document 92. Transportation Research Board, Washington, DC.
Benz. R. J., A. M. Pike, S. P. Kuchangi, and Q. Brackett. 2009. Serviceable Pavement Marking Retroreflectivity Levels: Technical Report. Report No. FHWA/TX-09/0-5656-1. Texas Department of Transportation, Austin, TX.
Chang, C. 2007. Development of a Multi-Objective Strategic Management Approach to Improve Decisions for Pavement Management Practices in Local Agencies. Dissertation. Texas A&M University, College Station, Texas.
Colorado Department of Transportation. CDOT. 1999. Highway Maintenance Levels of Service. Manual. Prepared by Cambridge Systematics, Inc.
http://www.coloradodot.info/content/projects/ I25CimarronFinalRFP/BOOK%203- Applicable%20Standards,%20Data%20and%20Reports/Section%2018_7-24-2014_Final-
RFP/Complete_highway _maintenance_LOS_Manual_.pdf> Assessed on May 10, 2013. Federal Highway Administration (FHWA). 2009. Manual on Uniform Traffic Control Devices (MUTCD).
Federal Highway Administration, Washington, DC. Federal Highway Administration (FHWA). 2010. Summary of the MUTCD Pavement Marking Retroreflectivity
Standard. Report No. FHWA-SA-10-015. Federal Highway Administration, Washington, DC. http://safety.fhwa.dot.gov/roadway _dept/night_visib/fhwasa10015/. Accessed Feb 20,2015.
Ford, K. M., M. H. R. Arman, S. Labi, K. C. Sinha, P. D. Thompson, A. M. Shirole, and Z. Li. 2012. Estimating Life Expectancies of Highway Assets. NCHRP Report 713. Transportation Research Board, Washington, DC.
Kansas Department of Transportation (KDOT). 2002. Pavement Marking Policy. Kansas Department of Transportation, Topeka, KS.
Kopf, J. 2004. Retroreflectivity of Pavement Markings: Analysis of Retroreflectivity Degradation Curves. Report No. WA-RD 592.1. Washington State Department of Transportation, Olympia, WA.
Markow, M. J. 2007. Managing Selected Transportation Assets: Signals, Lighting, Signs, Pavement Markings, Culverts, and Sidewalks. NCHRP Synthesis 371. Transportation Research Board, Washington, DC.
Migletz, J., J. K. Fish, and J. L. Graham. 1994. Roadway Delineation Practices Handbook. Report No. FHWA-SA-93-001. Federal Highway Administration, Washington, DC.
Migletz, J., J. L. Graham, D. W. Harwood, and K. M. Bauer. 2001. Service Life of Durable Pavement Markings. Transportation Research Record 1749. Transportation Research Board, Washington, DC.
Minnesota Department of Transportation (MnDOT). 2009. Traffic Engineering Manual. Minnesota Department of Transportation, Roseville, MN.
National Highway Traffic Safety Administration (NHTSA). 2014. Traffic Safety Facts. National Highway Traffic Safety Administration, Washington, DC.
North Carolina Department of Transportation (North Carolina DOT). 2008. Pavement Condition Survey Manual. North Carolina Department of Transportation, Raleigh, NC. Available at http://www.itre.ncsu.edu/ncassetmgmtconf/downloads/NC DOTAsphaltPavementSurvey Manual.pdf (accessed August 10, 2013).
Sarasua, W., L. Bell, and W. J. Davis. 2012. Estimating the Lifecycle of Pavement Markings on Primary and Secondary Roads in South Carolina. Report No. FHWA-SC-12-01. South Carolina Department of Transportation, Columbia, SC.
Utah Department of Transportation (UDOT). 2012. Maintenance Management Quality Assurance Plus (MMQA+) Inspection Manual Utah Department of Transportation, Salt Lake City, UT.
NCHRP Project 14-20A Final Report
H - 22
Weinkein, D., R. Branham, and V. Ginder. 2002. Pavement Marking Management System Research Projects. District 7. Missouri Department of Transportation, Joplin, MO.
Zimmerman, K. A. 2015. Maintenance Quality Assurance Field Inspection Practices. NCHRP Synthesis No.
470. Transportation Research Board, Washington, DC