Embed Size (px)
Citation preview

NCHRP 25-25 Task 79
Final Report
NCHRP 20-65 Task 53
Independent Cost
Estimates for Design
and Construction of
Rural and Small Urban
Transit Facilities
October 31, 2014
TRANSPORTATION RESEARCH BOARD
NAS-NRC
LIMITED USE DOCUMENT

NCHRP 25-25 Task 79
blank page

NCHRP 25-25 Task 79
ACKNOWLEDGEMENTS
This study was conducted for the AASHTO Standing Committee on Public Transportation, with
funding provided through the National Cooperative Highway Research Program (NCHRP). The
NCHRP is supported by annual voluntary contributions from the state departments of
transportation. Project 20-65 is intended to fund quick response studies on behalf of Standing
Committee on Public Transportation. Dr. Stuart Anderson, Texas A&M University, was the
Principal Investigator (PI) for this study. Dr. Keith Molenaar, University of Colorado, and Dr.
Clifford Schexnayder, Arizona State University, were the Co-PIs. The work was guided by a
technical working group. The project was managed by Gwen Chisholm Smith, Project Manager,
Cooperative Research Programs.
DISCLAIMER
The opinions and conclusions expressed or implied are those of the research agency that
performed the research and are not necessarily those of the Transportation Research Board or its
sponsoring agencies. This report has not been reviewed or accepted by the Transportation
Research Board Executive Committee or the Governing Board of the National Research Council.

NCHRP 25-25 Task 79
blank page

NCHRP 20-65 Task 53 NCHRP 25-25 Task 79
I
EXECUTIVE SUMMARY
Most organizations that develop and deliver capital projects have a continuing program of
projects. While large projects tend to have more visibility in these programs small projects, when
combined, often result in a substantial percentage of the total construction budget within a
program. Overruns in many small projects can lead to program overruns and hence be just as
problematic as overruns on a few large projects.
Estimating design and construction costs in a consistent, reliable, and accurate way is critical for
an organization since the information generated is the basis for: projecting program funds,
prioritizing projects by financial analysis, determining required funds, and providing a baseline
for project control. This research focused on cost estimating methods and database development
Design and Construction of Rural and Small Urban Transit Facilities which are usually small,
numerous, and geographically dispersed.
In order to address these problems, the National Cooperative Highway Research Program
(NCHRP) funded the research to provide guidance to state transit agencies in assisting their sub-
recipients with preparing accurate design and construction cost estimates. The products of the
study include a cost estimating database and an estimating prototype tool for rural and small
urban transit facilities. The cost estimating database and prototype tool can support conceptual
estimating in planning phase. This document is a research report that is independent with the cost
estimating database and prototype tool. Please refer to the Introduction and User’s Guide in the
prototype tool for more information before using the prototype tool.
The objectives of this study were to determine the distinct characteristics of rural and small
urban transit facilities, collect actual historical costs data, and develop a cost database and a
prototype tool to assist agencies with preparing conceptual estimates. Limitations of this research
and recommendation for future research were explicitly described at the end of this report.

NCHRP 20-65 Task 53 NCHRP 25-25 Task 79
II
blank page
NCHRP 20-65 Task 53 NCHRP 25-25 Task 79
III
TABLE OF CONTENTS
Page
EXECUTIVE SUMMARY ........................................................................................................................ I
TABLE OF CONTENTS ........................................................................................................................ III
LIST OF FIGURES ................................................................................................................................... V
LIST OF TABLES .................................................................................................................................. VII
CHAPTER 1 INTRODUCTION .............................................................................................................. 1
BACKGROUND ................................................................................................................................... 1
PROBLEM STATEMENT ..................................................................................................................... 3
RESEARCH QUESTIONS .................................................................................................................... 3
RESEARCH OBJECTIVES ................................................................................................................... 4
RESEARCH TASKS .............................................................................................................................. 4
ORGANIZATION OF THE STUDY ..................................................................................................... 6
CHAPTER 2 LITERATURE REVIEW .................................................................................................. 7
REVIEW OF THE TRANSIT FACILITY INDUSTRY IN RURAL AND SMALL URBAN AREAS ........ 7
COST ESTIMATING .......................................................................................................................... 10
RISK MANAGEMENT ........................................................................................................................ 19
CHAPTER SUMMARY ....................................................................................................................... 23
CHAPTER 3 RESEARCH METHODOLOGY .................................................................................... 25
METHODOLOGY .............................................................................................................................. 25
CHAPTER SUMMARY ....................................................................................................................... 31
CHAPTER 4 TELEPHONE INTERVIEW .......................................................................................... 33
INTERVIEW PROTOCOL .................................................................................................................. 33
INTERVIEW PROCESS ..................................................................................................................... 33
INTERVIEW RESULTS ...................................................................................................................... 34
INTERVIEW RESULTS SUMMARY .................................................................................................. 37
CHAPTER SUMMARY ....................................................................................................................... 38
CHAPTER 5 ONLINE SURVEY ........................................................................................................... 39
SURVEY PROTOCOL ........................................................................................................................ 39

NCHRP 20-65 Task 53 NCHRP 25-25 Task 79
IV
SURVEY PROCESS ............................................................................................................................ 42
SURVEY DATA ANALYSIS ................................................................................................................ 43
CHAPTER SUMMARY ....................................................................................................................... 56
CHAPTER 6 DEVELOPMENT OF COST ESTIMATING DATABASE AND PROTOTYPE
TOOL FOR RURAL AND SMALL URBAN TRANSIT FACILITIES .............................................. 57
COST ESTIMATING DATABASE DEVELOPMENT ......................................................................... 57
COST ESTIMATING PROTOTYPE TOOL DEVELOPMENT ........................................................... 59
REVIEW OF THE COST ESTIMATING TOOL ................................................................................. 75
STEPS OF COST ESTIMATION PRACTICE AND COST ESTIMATION MANAGEMENT ............. 77
LIMITATION OF THE RESEARCH .................................................................................................. 83
CHAPTER 7 GUIDELINES OF REVIEWING COST ESTIMATES ............................................... 85
PROCESS OF REVIEWING COST ESTIMATES .............................................................................. 85
REVIEW ESTIMATE BASIS DETERMINED BY THE ESTIMATOR ................................................ 87
REVIEW BASE ESTIMATE DETERMINED BY THE ESTIMATOR ................................................. 87
REVIEW RISKS AND CONTINGENCY DETERMINED BY THE ESTIMATOR .............................. 88
REVIEW AND APPROVE ESTIMATE ............................................................................................... 88
REVIEW COMMUNICATION APPROACHES ................................................................................. 89
CHAPTER 8 CONCLUSIONS ................................................................................................................ 91
CONCLUSIONS ................................................................................................................................. 91
RECOMMENDATIONS FOR FUTURE RESEARCH ........................................................................ 92
REFERENCES .......................................................................................................................................... 95
APPENDIX A ............................................................................................................................................ 97
APPENDIX B .......................................................................................................................................... 101
APPENDIX C .......................................................................................................................................... 105
APPENDIX D .......................................................................................................................................... 115
APPENDIX E .......................................................................................................................................... 125
APPENDIX F .......................................................................................................................................... 133
APPENDIX G .......................................................................................................................................... 141
APPENDIX H .......................................................................................................................................... 145

NCHRP 20-65 Task 53 NCHRP 25-25 Task 79
V
LIST OF FIGURES
Page
Figure 1 Screen Capture of Input Page of Cost Estimating Model for Buildings Developed by the
AACEI (http://www.aacei.org/resources/PCEM.shtml). .............................................................. 15
Figure 2 Screen Capture of Estimates Report (generated through the AACEI’s Cost Estimating
Model for Buildings)..................................................................................................................... 16
Figure 3 Screen Capture of New Project Wizard Adopted from the DProfiler Overview/ 2012
Preview (http://www.beck-technology.com/dprofiler.html). ........................................................ 17
Figure 4 Screen Capture of Model Modification Adopted from Lachmi Khemlani (2008)’s
DProfiler: A "Macro" BIM Solution. ............................................................................................ 17
Figure 5 Screen Capture of an Estimate Adopted from Lachmi Khemlani (2008)’s DProfiler: A
"Macro" BIM Solution. ................................................................................................................. 18
Figure 6 Example of Probability × Impact Matrix Adopted from the NCHRP Report 658
(Molenaar et al. 2010). .................................................................................................................. 20
Figure 7 The Three Tier Approach Process to Estimate Project Contingency Adopted "A risk-
based approach to contingency estimation in highway project development” (Molenaar and
Wilson 2009) ................................................................................................................................. 20
Figure 8 Sliding-scale Contingency for Noncomplex Projects Adopted from “Sliding-Scale
Contingency for Project Development Process” (Olumide et al. 2010). ...................................... 22
Figure 9 Research Process ............................................................................................................ 26
Figure 10 Survey Process.............................................................................................................. 42
Figure 11 Plot of the Normalized Construction Cost and Project Size......................................... 48
Figure 12 Construction Cost Analysis: Regress plot and Statistical Report of Straight Line
Regression ..................................................................................................................................... 48
Figure 13 Percentage of Construction Cost for each Construction System (Combination I) ....... 50
Figure 14 Percentage of Construction Cost for each Construction System (Combination II) ...... 51
Figure 15 Design Cost vs. Project Size ......................................................................................... 54
Figure 16 Design Cost Analysis: Regress plot and Statistical Report of Straight Line Regression
....................................................................................................................................................... 54
Figure 17 Frequency of the Risk Factors ...................................................................................... 56
Figure 18 Cost Database - Basic Project Information and Project Duration ................................ 58
Figure 19 Cost Database - Project Cost Information .................................................................... 58

NCHRP 20-65 Task 53 NCHRP 25-25 Task 79
VI
Figure 20 Cost Database - Percent of Construction Cost for Each Construction System ............ 59
Figure 21 (A) Screen Capture of the Cost Estimating Prototype Tool – Introduction ................. 60
Figure 22 (A) Screen Capture of the Cost Estimating Prototype Tool – User's Guide ................ 64
Figure 23 (A) Screen Capture of the Cost Estimating Prototype Tool – Project Information ...... 67
Figure 24 (A) Screen Capture of the Cost Estimating Prototype Tool – Estimates Report .......... 69
Figure 25 (A) Screen Capture of the Cost Estimating Prototype Tool – Estimates Details ......... 72
Figure 26 (A) Screen Capture of ABC Project –Project Information ........................................... 79
Figure 27 (A) Screen Capture of ABC Project –Estimates Report ............................................... 81
Figure 28 Screen Capture of ABC Project –Estimates Details ..................................................... 83
Figure 29 Cost Estimating Process Derived from the AASHTO Practical Guide to Estimating
(2011). ........................................................................................................................................... 86

NCHRP 20-65 Task 53 NCHRP 25-25 Task 79
VII
LIST OF TABLES
Page
Table 1 AACEI Cost Estimate Classification ............................................................................... 11
Table 2 Unit Cost of Transit Facilities .......................................................................................... 35
Table 3 Descriptions of Survey Sections ...................................................................................... 40
Table 4 Descriptions of the Shortened Survey ............................................................................. 42
Table 5 Survey Design and Construction Cost Data .................................................................... 45
Table 6 Construction Cost Data .................................................................................................... 47
Table 7 Summary of Design Cost Estimating Methods................................................................ 51
Table 8 Design Cost Data ............................................................................................................. 53
Table 9 Regions and Location Adjustment Factors ...................................................................... 63
Table 10 Location Adjustment Factor ........................................................................................ 133
Table 11 Steps of Cost Estimating Process................................................................................. 145

NCHRP 20-65 Task 53 NCHRP 25-25 Task 79
VIII
blank page
NCHRP 20-65 Task 53
1
CHAPTER 1
INTRODUCTION
BACKGROUND
Rural and small urban transit facility projects are relatively small in scope and dollar value,
numerous, and also geographically dispersed in small communities. It is difficult to estimate the
design and construction costs for such projects because of:
Variations in functions and project size.
Different amenities associated with the facilities.
Possible renovation of existing facilities.
Lack of historical cost data.
Unique risk factors impacting cost (e.g. remote location or lack of competition).
Absence of structured estimating processes.
Extensive research has been performed and provides many technical and managerial references
for estimating the cost of large urban construction projects. Selected research provides both
“strategic focus” and “how to” focus. NCHRP Report 574 provides Guidance for Cost
Estimation and Management for Highway Projects During Planning, Programming, and
Preconstruction. It is a Guidebook that identifies internal and external cost escalation factors and
recommends appropriate global estimation strategies. Applications of methods for relevant
strategies and tools to implement methods also provided for each phase of project development:
planning, programming and preliminary design, final design, and implementation. The
Guidebook also describes the cost estimating and cost management processes in terms of nine
general steps. The technical reference manual on cost estimating and cost management produced
for the Minnesota Department of Transportation (Minnesota Department of Transportation Cost
Estimation Improvement and Organizational Improvement for Project, Phases III and IV)
describes the estimating procedures in detail.

NCHRP 20-65 Task 53
2
Recent research specific to rural projects includes NCHRP Project 20-65 Task 40, “Construction
Management Practices for Rural Projects.” The report address issues such as construction
administration, engineering, operation, and safety; cost estimation; scheduling; quality control
and assurance; and claims and disputes based on proven management strategies. It does not
cover cost estimating processes and methodologies for rural transit projects.
There is a lack of compiled cost information or databases to support estimation of rural and small
urban transit facilities. Many factors are the causes of this situation. First, few research projects
have been conducted on collection of cost data for these types of facilities. Second, the functions
and scopes of these facilities vary. For example, some facilities in rural and small urban areas
serve as operations and maintenance buildings while some are constructed in order to facilitate
passengers but these can be combined with operations facilities. The garage space can be
relatively larger if the fleet size is large. According to the number of passengers served, the
passenger facilities may vary from unsheltered bus stops to transit terminals, or to transit centers.
Third, the facilities can involve new facilities but correspondingly the project maybe renovation
and improvement works. Last, rural transit projects can receive funding from different sources
and be administered by different agencies that may require that funding receivers to follow
different cost management procedures. Section 5311, the Federal Transit Administration’s (FTA)
formula assistance program for rural providers, is administered by the state departments of
transportation (DOTs) while tribal transit providers, receive funding from grant programs
directly, including Section 5307 urbanized area funds, Section 5309 bus and bus facilities
discretionary program funds, and Section 5311 (c), tribal transit program funds. These funding
programs are directly administered and managed by the FTA.
Without a good cost database of rural and small urban transit facility project cost, it is difficult to
prepare consistent, reliable, and accurate cost estimates. Therefore, there is a need to study the
unique characteristics of rural and small urban transit facility projects, establish a sound and
structured historical cost database for design and construction, and develop a corresponding tool
to facilitate the estimating process. The scope of this report covers these three issues.

NCHRP 20-65 Task 53
3
PROBLEM STATEMENT
The Federal Transit Administration (FTA) requires all state agencies receiving federal funding
for the design and construction of rural and small urban transit facilities submit independent cost
estimates from their sub-recipients for both design and construction as part of the application and
grant implementation process.
There appears to be no local or national standard methodology or criteria for developing
independent cost estimates associated with the design or construction of these types of transit
facilities at the application stage. The objective of this research is to produce guidance for use by
state transit agencies in assisting their sub-recipients with preparing and reviewing accurate
design and construction cost estimates.
RESEARCH QUESTIONS
The research questions for this research included:
Characteristics and classification of rural and small urban transit facilities
Based on functional types, how are the rural and small urban transit facilities classified?
What are prevalent functional type or types?
How do locations of rural and small urban projects impact the design and construction of
these facilities? What are the differences between rural and small urban transit facilities?
For each functional type, what is the typical project size in square foot (sf) either an
average or a range? What is the typical project cost either an average or a range?
Cost estimating database and tool
What historical cost data does a state agency capture from bids or construction to support
estimation of design and construction costs of future projects? If cost data is captured,
does the agency have a database of these costs available? Where does the database reside,
field offices or central location?
NCHRP 20-65 Task 53
4
What are the practical cost estimating methods and tools that have a history of success
within the transit facility industry, such as scoping documents, summarized estimating
steps, etc.?
How to use a historical cost estimating database developed in this research to support
estimating design and construction costs of rural and small urban transit facilities?
Risk assessment
What are the typical risks for these projects considering functional type?
How can these risks be accounted in the project cost estimates and schedule?
RESEARCH OBJECTIVES
The main objectives were to define the characteristics of rural and small urban transit facilities,
develop an appropriate cost database of historical relevant cost elements, and create a prototype
tool to support conceptual estimating process for these facilities. This research had the following
three sub-objectives:
Identify the current estimating practice in transit facility industry.
Study the characteristics of available databases and create regression models for
predicting project design and construction costs.
Incorporate the cost estimating prototype tool to facilitate cost estimation.
RESEARCH TASKS
In order to achieve objectives stated above, this research included the following five tasks:
Task 1 Conduct a review of recently designed and constructed rural and small urban
transit facilities throughout the United States
The objective of Task 1 was to determine the characteristics of rural and small urban transit
facilities and to understand the extent of the state of practice. Literature review and telephone
NCHRP 20-65 Task 53
5
interview were conducted to collect key information related to typical types and sizes of
facilities, location characteristics, and the availability of historical cost data for design and
construction. The interview results confirmed or made corrections for findings from the literature
review.
Task 2 Scan of Rural and Small Urban Transit Facilities
The objective of Task 2 was to collect data and information concerning rural transit facilities: to
identify at a minimum: 1) size and type of facility designed and constructed, 2) amenities
provided, 3) location of facility, 4) any unusual conditions, and 5) actual costs of design and
construction. An online survey was used to collect this data on a project level.
Task 3 Develop a database of actual costs
The objective of Task 3 was to develop a database of design and construction costs of rural and
small urban transit facilities. The historical cost data collected was input into a MS ExcelTM
database and normalized to the national average in year of 2014 by using the “City Cost Index”
and “Historical Cost Index” in the 2014 version R.S. Means Building Construction Cost Data
manual.
Task 4 Develop a cost estimating methodology to support conceptual estimating
The objective of Task 4 was to develop a cost estimating prototype tool using MS ExcelTM
based
on statistical analysis of the cost database developed in the previous task. A regression analysis
was conducted to determine the relationship between cost and project size. This the regression
function was built in the created prototype tool to predict project cost. The research background,
instructions, and estimate report and details were also provided in this tool.
Task 5 Develop cost estimating reviewing guidelines and prepare a Research Report
The objective of Task 5 was to develop guidelines to support a cost estimating reviewing process
for rural and small urban transit facilities and complete the research report following the NCHRP
guidelines. The guidelines of cost estimating reviewing process are provided in Chapter 7.

NCHRP 20-65 Task 53
6
ORGANIZATION OF THE STUDY
This report consists of seven chapters. Chapter 1 sets the context of the research background
along with the problem statement, research questions, research objectives, and research tasks.
Chapter 2 focuses on the literature review concerning characteristics of transit facility projects in
rural and small urban areas, cost estimating databases and tools, and risk management practices.
Chapter 3 describes the research methods, including telephone interview, online survey, survey
data analysis, development of cost estimating database and prototype tool, and review of the
prototype tool. Chapter 4 provides information on the telephone interview protocol preparation,
interview processes, and interview results. Chapter 5 discusses the survey protocols development,
survey process, and results of data analysis. Chapter 6 presents the development of cost
estimating database, prototype tool, and estimating steps for rural and small urban transit
facilities. Limitations of the prototype tool are also addressed at the end of the chapter. Chapter 7
provides guidelines of reviewing cost estimates for rural and small urban transit facility projects.
Finally, Chapter 8 states study conclusions and discusses the recommendations for future
research.

NCHRP 20-65 Task 53
7
CHAPTER 2
LITERATURE REVIEW
A literature review was conducted to acquire knowledge about the types of transit facilities in
rural and small urban areas and to determine current cost estimating practices of the agencies
responsible for these facilities. The literature review was necessary to support the design of
interview and survey protocols and to provide insights for the development of the cost estimating
prototype tool. The key words used to search the literature included definitions of rural and small
urban areas, transit facility functions and characteristics, cost estimating methodology, and risk
identification tools and measurement methods.
The following databases were surveyed a part of the literature review:
Transportation Research Board’s Transportation Research Information Systems (TRIS).
Academic engineering databases, such as Engineering Village 2.
Academic business databases, such as EBSCO Business Source Complete and
Management and Organizational Studies.
ASCE Civil Engineering database.
General internet search engine - Google Scholar.
Selected transportation agency’ websites.
Metropolitan Transportation Commission’s online library.
REVIEW OF THE TRANSIT FACILITY INDUSTRY IN RURAL AND SMALL URBAN
AREAS
According to the definition given by the FTA (Dye Management Group 2001), a rural area is
defined in two ways by the U.S. Department of Transportation. The first definition is an area
with less than 5,000 people. The second definition is that rural is an area outside of metropolitan
areas and the population is less than 50,000 people. Researchers interested in the transit facility

NCHRP 20-65 Task 53
8
industry can choose either definition according to their research needs. Hallowell et al. (2012)
considered rural as areas with a population of less than 50,000 people. Hallowell and colleagues’
research identified cost estimating challenges, including the lack of historical data, remote
locations, and less competition. To overcome these existing challenges, the researchers suggested
many strategies and resources, such as state agency cost catalogues and detailed cycle time
spreadsheets for equipment, material, and labor. In addition, contractors are a resource for
gathering historical data and bid histories. Although the report pointed to examples of transit
facilities that could include bus stations, administrative buildings, and storage facilities, there
were no classifications according to facilities’ functions.
According to the Texas Rural Transportation Plan (Texas Department of Transportation 2012),
transit facilities are categorized into three major groups:
1. Operations and Maintenance
Administration
General Purpose
Maintenance
Vehicle Storage
2. Large Passenger Facilities
Park and Ride
Terminal or Garage
Transit Center
3. Small Passenger Facilities
Sheltered Bus Stop
Unsheltered Bus Stop
Sign-only Bus Stop
Both new and renovated facilities are considered in the capital investment of rural transit projects.
The cost of renovating a facility is 75 percent of building a new facility of the same type. For the
bus stops listed above, Texas A&M Transportation Institute developed per bus stop cost. For
other types of facilities, the estimated per square foot cost is based on the Texas Department of

NCHRP 20-65 Task 53
9
Transportation Public Transportation Division’s database of historical capital cost per square
foot.
The Architectural and Engineering Design for a Transit Operating and Maintenance Facility
(American Public Transportation Association 2010) , also known as Recommend Practice,
includes the steps necessary to implement a new bus transit facility project, basic scope
information required as part of a request for proposal (RFP) procurement, and an example of a
scope of services procurement document. In this Recommend Practice, facility types are
classified as:
Level I: As primary service facility providing running maintenance and storage, activities
performed in the facilities include fueling, washing, fare collection, light bulb
replacement, and fuel level checks.
Level II: Secondary maintenance facility is often called an inspection garage. Activities
conducted in this type of facility include light maintenance, engine tune-ups, lubrications,
inspections, tire change, brake repair, minor body work, as well as activities performed in
Level I.
Level III: Third level maintenance facility provides all kinds of vehicle maintenance,
including engine and transmission rebuilding, testing, major body repairs, painting, as
well as activities that can be conducted in Level I and Level II.
Intercity bus transportation also plays an important role in smaller communities and rural areas
due to its accessibility and affordable price for the local residents (KFH Group et al. 2002). The
intercity transit industry is a private for-profit industry that offers scheduled passenger service
and a number of services, including package express, charter, and tour services. Intermodal and
multimodal terminals facilitate the coordination of the intercity bus services in both rural and
urban areas (Fravel 2003). Regarding intercity transit facilities, the capital projects can be new
intercity bus stations, intermodal facilities, administrative offices, and passenger amenities. The
scope of facility projects can vary greatly, from low-cost repairs, ramps, or signs to major
intermodal facilities in urban locations (Fravel and Barboza Jr 2011).

NCHRP 20-65 Task 53
10
The Rural Transit Program Manual (Office of Transit, Ohio Department of Transportation 2012)
was developed to assist rural transit services in compliance with all applicable Federal and Ohio
Department of Transportation (ODOT)’s requirements. The manual discusses the determination
of the need for rural transit and rural transit facilities’ implementation, use, maintenance, and
operation. A series of documents were prepared by ODOT to support facility feasibility study,
scoping process, acquisition, and the construction process. The manual recommends four steps
for facility construction which are shown in Appendix A. The Rural Transit Program Manual
also states that design costs are normally limited to six percentage of the estimated construction.
Based on the evaluation of existing rural transit facilities in Ohio, a report concerning rural
transit facility prototypes was developed by Brown & Bills Architects. This report addresses
guidelines for designing rural transit facilities from three aspects: General Design Guidelines,
Site Guidelines, and Building Guidelines. Considering limited funding and lower operation and
maintenance costs after construction, the building guidelines suggest rural transit facility should
be constructed in a simple and elegant but economic manner (Brown & Bills Architects 2012). In
order to build sustainable facilities, the report requires general design and site selection of rural
transit facilities meet Leadership in Energy and Environmental Design (LEED) rating of Silver
or higher.
COST ESTIMATING
According to the recommended practice of Association for the Advancement of Cost
Engineering International (AACEI), cost estimates for building construction can be categorized
into five classes (Christensen 2011). The classes are determined by the level of project definition
maturity which is usually defined as a percentage of complete definition. The classification,
maturity level, end usage of each class, and expected accuracy ranges are shown in Table 1.

NCHRP 20-65 Task 53
11
Table 1 AACEI Cost Estimate Classification
Estimate
Class
Maturity Level
of Project
Definition
(Expressed as %
of complete
definition)
End Usage
(Typical purpose of
estimate)
Methodology
(Typical
estimating
method)
Expected Accuracy
Range
(Typical variation
in low and high
ranges1,
L- Low Range
H – High Range)
Class 5 0% to 2% Functional area or
concept screening
Square foot
(square meter)
factoring,
parametric
models, judgment,
or analogy
L: -20% to -30%
H: +30% to +50%
Class 4 1% to 15% Schematic design or
concept study
Parametric
models, assembly
driven models
L: -10% to -20%
H: +20% to +30%
Class 3 10% to 40%
Design development,
budget authorization,
feasibility
Semi-detailed unit
costs with
assembly level
line items
L: -5% to -15%
H: +10% to +20%
Class 2 30% to 70%
Control or
bid/tender, semi-
detailed
Detailed unit cost
with forced
detailed take-off
L: -5% to -10%
H: +5% to +15%
Class 1 50% to 100%
Check estimate or
pre bid/tender,
change order
Detailed unit cost
with detailed
take-off
L: -3% to -5%
H: +3% to +10%
Adapted from the Association for the Advancement of Cost Engineering International’s AACE International
Recommended Practice No. 56R-08: Cost Estimate Classification System, 2012.
As project definition levels evolve and more information becomes known, the expected estimate
accuracy increases and accuracy range decreases. Besides project definition, there are systemic
risks affecting estimate accuracy, such as project complexity, quality of reference cost estimating
data, quality of assumptions used when preparing the estimate, and estimating techniques utilized.
1 The +/- value represents typical percentage variation of actual cost from the cost estimate after
application of contingency for given scope. The typical confidence level is a 50/50 chance of falling
within the accurancy ranges.

NCHRP 20-65 Task 53
12
Cost Estimating Databases
The R.S. Means Building Construction Cost Data manual is a primary and authoritative
reference source of building cost information. Means tracks cost records from more than 900
cities in the U.S. and selected locations in Canada. A wide range of other key information is
provided in the manual, including productivity rates, crew composition, and contractor overhead
and profit rates. The manual facilitates estimation of either commercial and industrial projects or
large multi-family housing projects from the planning stage to bid preparation.
For the purpose of preliminary and intermediate budget preparation and feasibility
determinations, data in the square foot cost section of the manual can be used. Projects data from
locations across the United State are collected to develop the square foot cost at the national
average level, and therefore, estimators’ judgment and caution should be exercised when the
square foot data is used. If more precision is needed, the latest edition of the R.S. Means Square
Foot Costs manual would be a better reference. However, the square foot cost data in the
manuals does not reflect characteristics of rural and small urban transit facilities of small size
and in remote locations.
When more design details are available, the cost data in the unit price section of the manual can
be used to prepare the estimate. The unit price section gives average prices for thousands of
items. The unit cost data is divided into the 50 divisions based on the CSI MasterFormat system.
In the reference section, additional information is provided about construction equipment rental
costs, crew listings, historical cost indexes, city cost indexes, location factors, and a change order
process.
City cost indexes and historical cost indexes are important references when comparing projects
located in different areas and constructed in different times. According to the R.S. Means (2014),
“a city cost index number is a percentage ratio of a specific city’s cost to the national average
cost of the same item at a stated time period.” Therefore, cost in one city can be adjusted to cost
in another city and national average cost by using the following two equations:
Index for City A
Index for City B× Cost in City B = Cost in City A,

NCHRP 20-65 Task 53
13
and Specific City Cost
City Index Number× 100 = National Average Cost.
Cost can be adjusted by using historical cost indexes and the following:
Index for Year A
Index for Year B× Cost in Year B = Cost in Year A.
City Cost Indexes provide data for a number of cities in the U.S. and Canada. For those cities
and locations that were not sampled, the manual suggests the cost index for a nearby city with
similar economic characteristics be used. However, this suggestion lacks statistical validation.
Migliaccio et al. (2013) compared different methods of estimating city indexes. Frist, they
conducted a Moran’s test within the Geographic Information System (GIS). The test showed
significant auto-correlation between proximity and City Cost Index values in R.S. Means, which
confirmed the method suggested by R.S. Means. Regarding methods to estimate cost indexes of
cities not sampled by R.S. Means, the researchers compared methods suggested by R.S. Means
with two alternative methods. One is called conditional nearest neighbor (CNN) which entails
selecting the cost index of the nearest location listed in the City Cost Indexes within the same
state as the location not included in the City Cost Indexes. This method considers the impacts of
regulations and policies on construction costs. The other is called State Average (ST AVG)
which entails taking average of city indexes within a state and using the average as location
adjustment factors for cities not sampled. For each city in the City Cost Index, assuming a city’s
index was not available, the researchers used those three methods to estimate the index.
Conducting analysis on the difference between the estimates and actual cost indexes, the
researchers found the estimate error of CNN had the smallest range and the lowest mean, median,
standard deviation, and variance, which indicates the CNN method produces better estimates.
The CNN method was used in this study.

NCHRP 20-65 Task 53
14
Cost Estimating Tools
Early in the project life cycle when there are many unknowns about a project’s definition,
parametric estimating models are usually used for the purpose of concept screening or schematic
design. A parametric cost estimating model consists of one or more cost estimating relationships
that are usually developed from regression analysis of historical cost data. The cost estimating
relationships convert technical and/or project parameters into estimates. However, the accuracy
and validity of these estimates is limited since the cost estimating relationships are built on many
assumptions. The estimate results are often prepared following the Construction Specification
Institute (CSI)'s Uniformat, which allows the design team to evaluate alternatives with ease
(Manfredonia et al. 2010).
AACEI developed a parametric model for cost and value assessments (Association for the
Advancement of Cost Engineering International 2014). This model supports estimation of
building construction and design for offices, warehouses, industrial buildings, and labs that are
steel or concrete structures with up to seven stories. The user needs to input parameters, such as
floor area, floor height, number of floors, and percent of area as office. The screen captures of
the input page are shown in Figure 1. Then, once the calculate button is clicked, an approximate
building cost estimate, is shown in a browser window having two major sections. The costs
include all labor, material, and contractor overhead and profits, excluding site improvements,
furnishings, production equipment, and contingency. The estimates of a dummy project are
shown in Figure 2.

NCHRP 20-65 Task 53
15
Figure 1 Screen Capture of Input Page of Cost Estimating Model for Buildings Developed by the
AACEI (http://www.aacei.org/resources/PCEM.shtml).

NCHRP 20-65 Task 53
16
Figure 2 Screen Capture of Estimates Report (generated through the AACEI’s Cost Estimating
Model for Buildings).
DProfiler, developed by Beck Technology, integrates a conceptual three dimension model with
the process of cost estimating during planning and conceptual design phases. This has been
widely used by architecture, engineering, and construction firms (Khemlani 2008). DProfiler
uses R.S. Means cost database information that can be updated quarterly in order to capture the
most current cost data if the users pay a maintenance and support program fee. When a user can
starts a project in DProfiler, there are two important variables besides the project details. The
first of these is the zip code for the project location so the estimated cost can be adjusted to an
appropriate local cost from the national average. The second is the building type. Using building
type, the application automatically enables corresponding cost data to be applied to the
components of the model. Figure 3 shows the screen capture for a new project. The user can
create, modify, and remove components based on the requirements of design. Figure 4 shows the
modification of a model. When estimating the cost of each component, the user can either use the
default R.S. Means cost data or input adjusted unit costs. The calculation formulas can also be
modified based on the user’s specific need. Figure 5 shows the screen capture of an estimate. The
estimates report can be generated in the format of CSI MasterFormat or UniFormat. The model
information can be exported into multiple formats, such as PDF, DPC, and XLS.

NCHRP 20-65 Task 53
17
Figure 3 Screen Capture of New Project Wizard Adopted from the DProfiler Overview/ 2012
Preview (http://www.beck-technology.com/dprofiler.html).
Figure 4 Screen Capture of Model Modification Adopted from Lachmi Khemlani (2008)’s
DProfiler: A "Macro" BIM Solution.

NCHRP 20-65 Task 53
18
Figure 5 Screen Capture of an Estimate Adopted from Lachmi Khemlani (2008)’s DProfiler: A
"Macro" BIM Solution.
At later stages of design, a more precise estimate can be performed based on the actual quantities
of the building components specified by the project drawings. A quantity take-off program is
usually used at this stage. Programs, such as On-Screen Takeoff, Paydirt, Constructware, and
іSqFt, are commonly used in the construction industry. These program translates and export
dimension and quantity data directly from the project plans into an estimating system, such as
MS ExcelTM
. Then, detailed calculations can be performed in the estimating system. The quantity
take-off software enables the estimator to prepare an accurate estimate in an efficient way.

NCHRP 20-65 Task 53
19
RISK MANAGEMENT
Many uncertainties are associated with project development. Project participants may fail to
identify the uncertainties and make appropriate adjustment to an estimate, which gives rise to
project cost overruns. In order to address this problem, NCHRP Report 658, Guidebook on Risk
Analysis Tools and Management Practices to Control Transportation Project Costs (Molenaar et
al. 2010) discusses a series of systematic tools and management practices for use in risk
identification, assessment/analysis, mitigation and planning, allocation, and monitoring and
control. The Guidebook explains risk priority ranking processes through risk analysis workshops.
Once the prioritization of risks is completed, available resources for analysis, planning, and
mitigation can be best allocated. One of the best tools to facilitate the risk ranking is a
Probability × Impact Matrix used for qualitative risk evaluation. Each risk factor’s frequency and
impact on project implementation are combined in a matrix. Combinations can be categorized as:
1) high risk; 2) moderate risk; and 3) low risk. Risks are prioritized based on the results of
matrixes, and therefore, the project team can assign resources to the risks having the highest
potential adverse impact on the project. An example of a Probability × Impact Matrix is shown in
Figure 6.

NCHRP 20-65 Task 53
20
Figure 6 Example of Probability × Impact Matrix Adopted from the NCHRP Report 658
(Molenaar et al. 2010).
Molenaar and Wilson (2009) developed a three-tier approach process to estimate contingency
based on risk analysis for highway projects. Their three-tier process is shown in Figure 7.
Risk Analysis Type ContingencyComplexity
Figure 7 The Three Tier Approach Process to Estimate Project Contingency Adopted "A risk-
based approach to contingency estimation in highway project development” (Molenaar and
Wilson 2009)
Project complexity is categorized as follows: 1) non-complex projects; 2) moderately complex
projects; and 3) most complex projects. Based on the determination of project complexity, three
tiers of risk analysis and contingency estimating methods are selected. The three tiers are:
Type I - risk identification and percentage contingency: for non-complex projects, a list of risks
needs to be developed and contingency is estimated as a percentage of project cost.
NCHRP 20-65 Task 53
21
Type II - qualitative risk analysis and identified contingency items: for moderately complex
projects, a Probability × Impact matrix analysis tool is recommended to rank project risks. Then,
expected values of risks (the product of probability of occurrence of risks and cost impact on the
project) with high ranking will complement the contingency calculated in the Type I analysis.
Type III - quantitative risk analysis and contingency management: for most complex projects, a
risk analysis workshop to identify project risks is conducted and project cost and appropriate
contingency are estimated by the workshop team members. It is important to keep project risk
factors and estimated contingency updated across the project development process.
Baseline estimates and contingency are two major components of a project estimates. Baseline
estimates cover the development of estimated costs for all components of a project, exclusive of
project contingency. This might be thought of as the bricks and mortar part of the estimate.
Contingency is set to address project uncertainties and risks. The sum of the baseline estimate
and the contingency provides the total estimate of project cost. As project definition becomes
clear and information of cost elements is available, the baseline estimates increase while the
contingency portion should decrease. Regarding contingency estimating method, Olumide et al.
(2010) utilized the Delphi study to collect a group of experts’ opinions in contingency estimating
for highway projects and a top-down sliding-scale contingency estimating technique was
developed. The method considers project complexity and the impact of different project
development phases on project cost estimates. The method produces a range of contingency
value. According to project complexity, project type is classified into three categories: most
complex, moderately complex, and noncomplex. For each type of project, percent contingency
decreases across the phases of project development with low, most likely, and high values
provided for each phase. For example, for noncomplex projects, the sliding-scale contingency is
shown in Figure 8.

NCHRP 20-65 Task 53
22
Figure 8 Sliding-scale Contingency for Noncomplex Projects Adopted from “Sliding-Scale
Contingency for Project Development Process” (Olumide et al. 2010).
AACEI’s recommended general principles on contingency estimating include the following
methods (Hollmann 2008):
Expert judgment - Contingency should be estimated based on the estimators’ experience and
judgment on risk management and qualitative and quantitative analysis results.
Predetermined method - for each AACE International’s estimate class stated in Table 1 on
Page 11, contingency should be estimated as a single value or a range.
Simulation analysis – the simulation analysis method determines project specific risks and
generates probabilistic output. Both expert judgment and Monte Carlo simulation process are
required. Monte Carlo simulation is computational probabilistic calculations that use random
number generators to draw samples from probability distributions (Anderson et al. 2007). In this
case, Monte Carlo simulation is used to identify the effect of multiple uncertainties on the total
project cost. One of common method is called range estimating. A range estimate represents a
statement of project cost variability and conveys uncertainties in earlier stages of project
development. First, a cost model that defines a total estimate at a certain level of detail should be
determined. The model should consider all cost elements that have a significant impact on total
cost estimates. Then, the project team assigns a range and distribution for each cost element and
determines the correlations between cost elements. Finally, a Monte-Carlo or similar simulation

NCHRP 20-65 Task 53
23
should be run based on ranges and distributions of the cost elements. The simulation results
support the estimates by providing a total estimate’s distribution and related data, such as mean,
median, and standard deviation of the estimate.
Parametric modeling - a parametric model is generated from a multi-variable regression
relationship which is found through analysis of quantified risk factors against cost escalation of
historical projects. Once a risk factor is quantified by the project team, estimates, such as a most
likely value and a range of cost, can be derived from the parametric model.
Since each method has both advantages and disadvantages, the report pointed out that the best
approach is to utilize more than two methods to estimate cost of risk factors. Expert judgment is
a fundamental estimating method and should be combined with any other methods. Analysis
results of a parametric model may provide reference on developing a pre-determined estimating
method.
CHAPTER SUMMARY
Through the literature review, classifications of rural and small urban transit facilities are defined.
Project development process, estimating practices, and prototype of those facilities used by
ODOT were reviewed. Those resources provided insight for developing interview and survey
protocols. Cost estimating techniques, database, and cost estimating tools used in the
construction industry were reviewed. Finally, risk analysis and contingency estimating were
studied.

NCHRP 20-65 Task 53
24
blank page

NCHRP 20-65 Task 53
25
CHAPTER 3
RESEARCH METHODOLOGY
A clear research methodology ensures that the research objectives of this study are achieved in a
systematic, logical, and effective way. The research methodology of this study included a
literature review, telephone interviews, a survey, and survey data analysis. Based on the analysis,
a cost estimating prototype tool was developed and tested.
METHODOLOGY
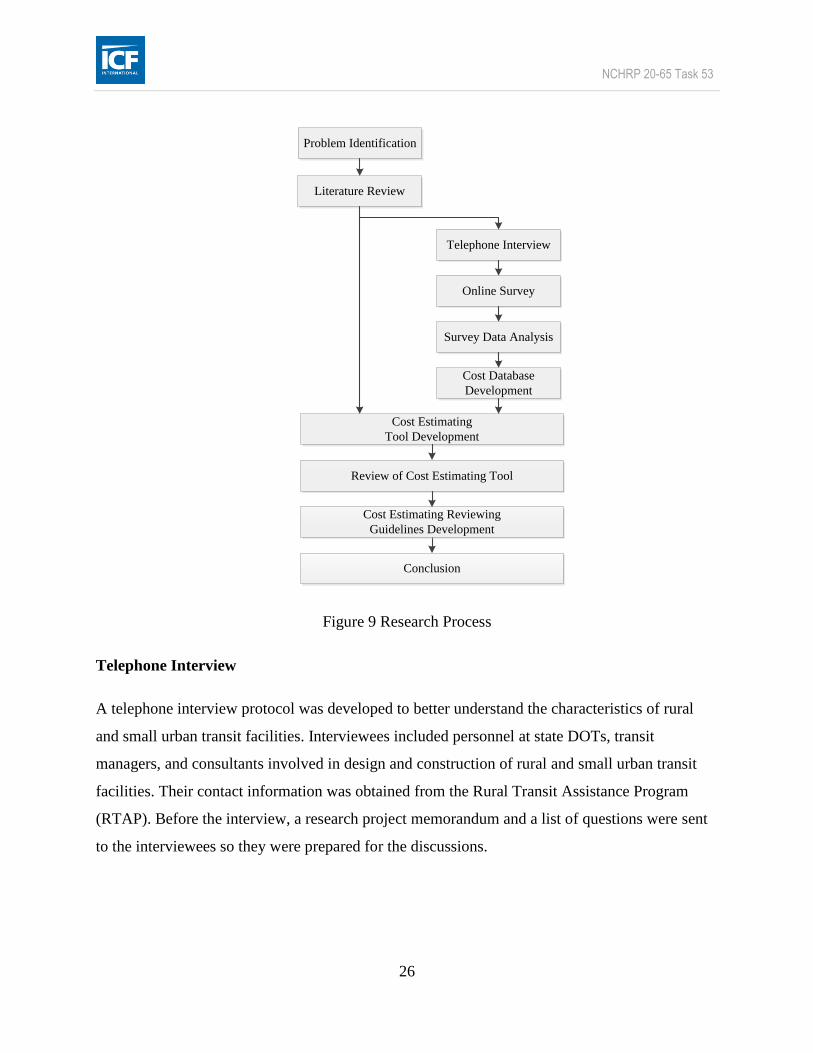
The logic of development of this research is shown in Figure 9. The problem identification and
literature review discussed in the previous chapters are fundamental to the development of the
telephone interview and survey protocols and estimating prototype tool.
NCHRP 20-65 Task 53
26
Problem Identification
Literature Review
Telephone Interview
Online Survey
Survey Data Analysis
Cost Database
Development
Cost Estimating
Tool Development
Conclusion
Review of Cost Estimating Tool
Cost Estimating Reviewing
Guidelines Development
Figure 9 Research Process
Telephone Interview
A telephone interview protocol was developed to better understand the characteristics of rural
and small urban transit facilities. Interviewees included personnel at state DOTs, transit
managers, and consultants involved in design and construction of rural and small urban transit
facilities. Their contact information was obtained from the Rural Transit Assistance Program
(RTAP). Before the interview, a research project memorandum and a list of questions were sent
to the interviewees so they were prepared for the discussions.

NCHRP 20-65 Task 53
27
Telephone Interview Summarization
The summarization of interviews results reflects the typical characteristics of rural and small
urban transit facilities suggested by the interviewees. For example, the descriptions of risk
factors were aggregated based on all interviewees’ inputs. In addition, typical unit prices for
different facility types provided by the interviewees was normalized into the national average in
2014. The results of interviews assisted the design of the survey questions.
Online Survey
Based on the literature review and telephone interview results, survey questions were developed
to collect specific historical design and construction costs data from transit agencies. The survey
provided the initial input to the cost estimating database and was designed to capture data from
the following key information:
Size and type of facilities
Different facilities features
Locations of facilities
Actual design costs
Actual construction costs
Design schedule (start and finish)
Construction schedule (start and finish)
Unusual conditions surrounding the projects
Major facilities component costs of construction
The pilot survey protocols in PDF format were sent to three transit managers, two DOTs
personnel, and two consultants. The feedback from this pre-test was important for revising the
survey. After the survey protocol was finalized, the online survey was developed via Texas
A&M Transportation Institute’s online survey tool. Potential participants included state DOTs’
Section 5311 program managers, transit managers, and consultants. Email addresses were
provided by RTAP. With the help of personnel from RTAP, survey invitations explaining
background and objectives of the research and the online survey link were sent to potential
NCHRP 20-65 Task 53
28
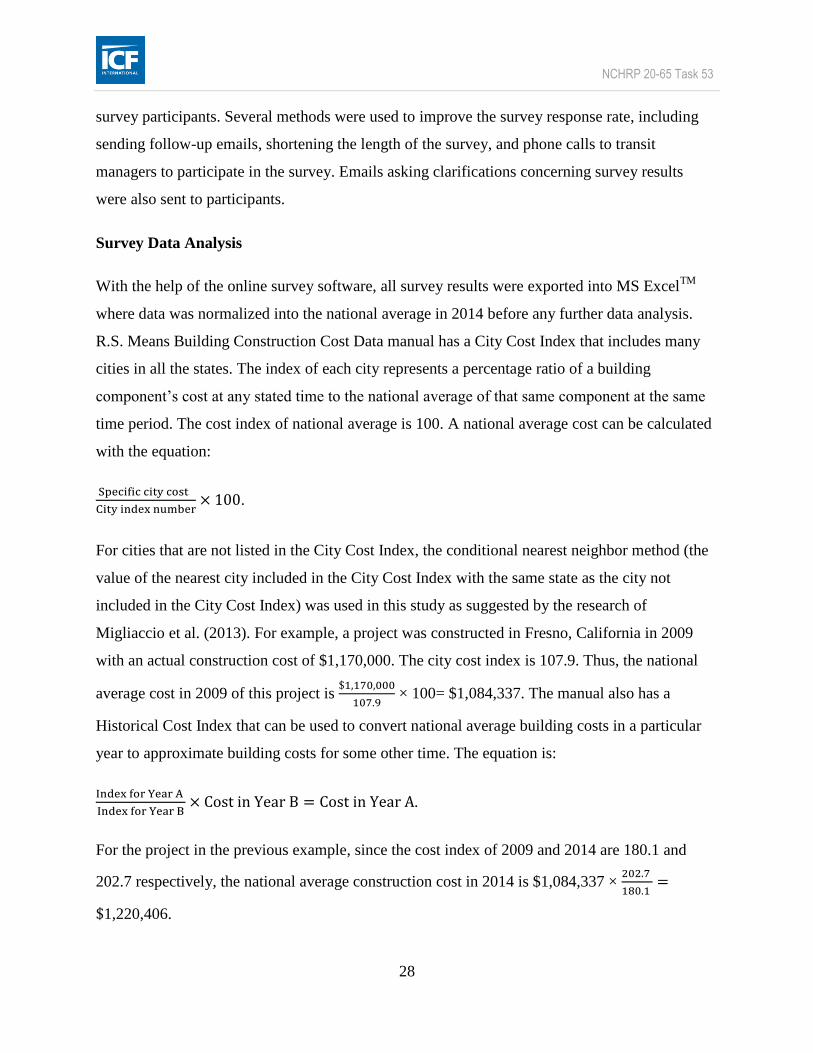
survey participants. Several methods were used to improve the survey response rate, including
sending follow-up emails, shortening the length of the survey, and phone calls to transit
managers to participate in the survey. Emails asking clarifications concerning survey results
were also sent to participants.
Survey Data Analysis
With the help of the online survey software, all survey results were exported into MS ExcelTM
where data was normalized into the national average in 2014 before any further data analysis.
R.S. Means Building Construction Cost Data manual has a City Cost Index that includes many
cities in all the states. The index of each city represents a percentage ratio of a building
component’s cost at any stated time to the national average of that same component at the same
time period. The cost index of national average is 100. A national average cost can be calculated
with the equation:
Specific city cost
City index number× 100.
For cities that are not listed in the City Cost Index, the conditional nearest neighbor method (the
value of the nearest city included in the City Cost Index with the same state as the city not
included in the City Cost Index) was used in this study as suggested by the research of
Migliaccio et al. (2013). For example, a project was constructed in Fresno, California in 2009
with an actual construction cost of $1,170,000. The city cost index is 107.9. Thus, the national
average cost in 2009 of this project is $1,170,000
107.9 × 100= $1,084,337. The manual also has a
Historical Cost Index that can be used to convert national average building costs in a particular
year to approximate building costs for some other time. The equation is:
Index for Year A
Index for Year B× Cost in Year B = Cost in Year A.
For the project in the previous example, since the cost index of 2009 and 2014 are 180.1 and
202.7 respectively, the national average construction cost in 2014 is $1,084,337 × 202.7
180.1 =
$1,220,406.

NCHRP 20-65 Task 53
29
In John’s Macintosh Program (known as JMP, a statistical analysis system), regression analysis
was performed at 90% confidence level (10% significance level) to determine the relationship
between design cost and project size, and the relationship between construction cost and project
size. In order to prove the necessity of a regression model, a hypothesis test should be conducted.
The null hypothesis (𝐻0) was that no regression model was needed, and the alternative
hypothesis (𝐻1) was that a straight line regression model was required. Therefore, if the p-value
of the test is less than significance level (10%), then the null hypothesis should be rejected. That
is, a regression model is needed.
In order to evaluate fit of the regression model, the value of R-square should be checked. R-
square is calculated as a ratio of a model’s sum of square and total sum of squares. A large R-
square value (close to 1.00) indicates a close fit of the data to the estimated line.
In the database, different combinations of administration, operations, maintenance facility, and
vehicle storage were classified into categories. For each combination of facilities, the percentage
of construction cost for each construction system was calculated by taking the average of the
survey responses. For example, for projects which are combinations of four types of facilities
(administration, operation, maintenance, and vehicle storage), seven people provided gross
percentages for building sitework. Average value of the percentages was taken. The results of
average percentages provided a reference for estimating a percentage breakdown for each
construction system in cost estimating prototype tool.
Cost Database Development
The survey data for park and ride, shelter bus stops, un-shelter bus stops, and sign-only bus stops
was incomplete or very limited. Therefore, the historical cost data collected to develop this
database covers only those facilities in the administration, operations, maintenance, and vehicle
storage. Generally speaking, administration, operations, maintenance facilities, and vehicle
storage were combined in most of the projects included in the database.
In the cost database, the classification of building elements is the same as the standards of
American Society for Testing and Materials (ASTM)’ UNIFORMAT II. Acting as a checklist for
the cost estimating process, the standardized classification can facilitate communications among

NCHRP 20-65 Task 53
30
project participants (e.g. transit operators, state DOTs staff, and consultants). The database
includes project location, project type, mid-point of design time, mid-point of construction time,
design cost (estimated and actual), construction cost (estimated and actual), percentage of
construction cost for each construction system, and contingency percentage.
Cost Estimating Prototype Tool Development
The development of the cost estimating prototype tool received continuous help and consulting
from two experts in the field of cost estimating. The prototype tool was developed in MS
ExcelTM
based on the survey cost data analysis results. Once the user input basic project
information, such as project location, size, and the mid-point of design and construction year,
this tool will provide the user with the estimated design and construction costs and contingency
values. Based on the research of Olumide et al. (2010), contingency percentage is estimated with
low, most likely, and high values. The ranges of contingency percentage of survey and interview
results were used to estimate low, most likely, and high values of contingency percentages.
Review of the Cost Estimating Prototype Tool
A review of the cost estimating prototype tool was conducted. The cost estimating experts first
reviewed and tested the prototype tool. Then, both an evaluation questionnaire and the cost
estimating prototype tool were sent to people who participated in the telephone interview and/or
online survey. Results of the review helped to improve clarity of the instruction and friendliness
of operation setting.
Cost Estimating Reviewing Guidelines Development
The basis of the cost estimating review guidelines for rural and small urban transit facilities was
derived from previous cost estimating research. The guidelines covers cost estimating processes
and a checklist of questions for each step of cost estimating process. The review guidelines aim
at ensuring that the cost estimating review process be performed in a systematic and consistent
manner.

NCHRP 20-65 Task 53
31
CHAPTER SUMMARY
This chapter discussed the research process and research methods used in the study. Details
concerning telephone interview and online survey are presented in Chapters 4 and 5. The process
of developing cost estimating database and prototype is discussed in Chapter 6. The cost
estimating review guidelines are provided in Chapter 7.

NCHRP 20-65 Task 53
32
blank page

NCHRP 20-65 Task 53
33
CHAPTER 4
TELEPHONE INTERVIEW
INTERVIEW PROTOCOL
As an additional source to conduct a review of recently designed and constructed rural and small
urban transit facilities, a telephone interview process was a useful method for gaining
information. A structured interview protocol was developed based on the findings obtained from
the literature review. It included 13 questions covering five main areas of rural and small urban
transit facilities which are:
Difference between rural and small urban transit facility projects;
Typical size;
Typical design and construction costs;
Availability of historical cost databases and checklists of critical estimate items;
Typical risk factors and contingency estimation.
The duration of each interview was about one hour. Appendix B contains a copy of the project
memorandum and interview questions.
INTERVIEW PROCESS
Thirteen potential interviewees, including five DOT personnel, two consultants, and six transit
managers, were selected. These professionals were located in different regions in the United
States. Sending out interview invitations via emails was the first step in the interview process.
Six people, including three DOT personnel, two consultants, and one transit manager, expressed
their willingness of participating in the interview. The project memorandum and the interview
protocol were sent via emails to these individuals several days prior to the scheduled interview.
This enabled the participants to review the protocol and prepare for the interview questions. The
memorandum included the research background, expectations, instructions, and confirmed date

NCHRP 20-65 Task 53
34
and time of the interview. The research background covered the purpose and products of this
research. The expectations and instructions outlined the key information of interest of the
interview, understanding the typical characteristics of rural and small urban transit facilities. The
estimated interview duration was provided to the interview participants at the end of the
memorandum.
INTERVIEW RESULTS
The interview results cover seven aspects which were summarized in this section. Inputs from
DOTs’ personnel, transit mangers, and consultants were aggregated to reflect typical
characteristics of rural and small urban transit facilities.
Differences between Rural and Small Urban Transit Facilities
In small urban areas, transit facilities, such as maintenance buildings and indoor garages, are
usually larger due to higher volume of passengers. Further, land is usually difficult to acquire to
construct a transit facility. Small facilities, such as passenger shelters, are dominantly located in
the urban areas. Although FTA’s funding is often 80-20 split where 80 percent goes to urban
transit facility projects and 20 percent goes to rural projects, lack of funding for rural transit
facilities is one of major causes of project delays.
Typical Project Size
Various factors have an impact on the size of a transit facility project, including employee ratio,
fleet size, types of maintenance work performed, fleet mileage, the availability of funding,
location, and the project complexity.
The size range of an administration office was found to be from 2,500 to 3,000 square foot. The
size of a bus shelter can vary from 50 to 150 square foot. The typical range of an operation and
maintenance facilities is about 8,000 to 13,000 square foot. The size range of a vehicle storage
building is from 8,000 to 12,000 square foot. The size of a transit complex (including
administration, storage, and garage) can range from 12,000 to 20,000 square foot.

NCHRP 20-65 Task 53
35
Typical Design and Construction Cost
The cost of rural and small urban transit facilities varies based on the following factors: project
location; the features of facilities; change orders; soil conditions; geological conditions; weather
conditions; environmental mitigation requirements; the application of the LEED rating system;
the involvement of expansion and transformation of existing buildings; and legislative rules (i.e.,
Buy America Act compliance).
Generally speaking, the total cost of a rural or small urban transit facility is between 2 to 4
million dollars. The cost can range from 8 to 24 million dollars if a project is located in a west
coast area. The cost range of a para-transit facility2 is 12 to 16 million dollars. Table 2 shows unit
cost of different types of facilities. With more features added, the unit cost would be higher.
Table 2 Unit Cost of Transit Facilities
Facility Type Unit Cost
Administration $150-$200/square foot
Maintenance $300/square foot (the cost depends on what kind maintenance
service is performed.)
Open Bus Storage $125-$250/square foot
The Availability of Historical Cost Data
It seems few state DOTs or transit agencies maintain their own historical cost databases. They
tend to hire consulting firms to perform certain tasks on their behalf, such as preparing and
reviewing estimates and checking change orders for projects. However, consulting firms have
different databases for building construction, mechanical, electrical, plumbing, landscape, and
equipment. Both R.S. Means Building Construction Cost Data manual and their own cost
databases are used by the cost engineers of the consultants. Cost analysis is also conducted by
cost engineers to identify reasons for cost overruns or underruns.
2 Para-transit is an alternative mode of flexible passenger transportation that does not follow fixed routes
or schedules.

NCHRP 20-65 Task 53
36
The Availability of Checklist of Critical Estimate Items
Cost engineers in consulting firms maintain checklists of critical estimate items updated as
current as possible. Design engineers help estimators maintain and update cost data. The ODOT
has a guidance report to support design and estimation process for rural and small urban transit
facilities. Although state DOTs do not have checklists of critical estimate items, they hire
consulting firms to perform an independent estimating review and track reasons behind delays
and cost overruns.
Typical Risk Factors
According to the interviewees, the typical risk factors associated with rural and small urban
transit facilities are:
Higher transportation expenses: construction in remote areas increases transportation
expenses and need to pay travel time.
Soil conditions: contaminated soil or unexpected soil conditions.
Buy America Act compliance: materials made in the United State must be used.
Weather conditions: extreme weather, such as icy winters, heavy rains, and hurricanes.
Unexpected underground conditions: buried debris and unexpected utilities.
Funding availability: construction of rural transit facilities is often delayed because of
funding constraints.
Increased scope: continuous incrementally changes in project scope.
Environmental risk: new information required for permits or changes of environmental
regulations.
Neighborhood complaints: major complaints concerning noise and dust control can cause
a lengthy construction delay.
Archaeological impact: if relics are found on the site, construction is often suspended
until relics are protected or removed.
Lack of competition: lack of competition (i.e., the number of bidders per project) will
increase bids, which gives rise to higher project cost.

NCHRP 20-65 Task 53
37
Contingency Estimation
Contingency is set according to project type, size, location, and project characteristics. However,
sometimes the contingency is not sufficient to cover all the unknown factors, such as weather
conditions, soil conditions, site location, or needed change orders. According to the interviewees
from state DOTs, 10 to 15 percent of construction cost is often suggested as an appropriate
contingency. Design firms usually work with contractors to set feasible contingency (percentage
of construction cost) for design and construction.
INTERVIEW RESULTS SUMMARY
The interview results reveal the following characteristics of rural and small urban transit
facilities:
Project size and costs varies due to different facility types, location, and facility features.
Project risks were identified, such as soil conditions, Buy America Act compliance, and
unexpected underground conditions.
In order to address project risks, contingency is estimated as percentage of construction
cost, however, risks are seldom tied directly to the amount of contingency.
Lack of funding for rural facilities often gives rise to project delays.
DOTs and transit agencies often lack expertise in estimating design and construction
costs and they therefore depend on the estimates provided by consulting firms.
NCHRP 20-65 Task 53
38
CHAPTER SUMMARY
This chapter discussed the interview protocol development and interview process. Then, results
of interview were summarized. The collected qualitative data obtained from telephone interviews
was useful input when developing survey protocol.

NCHRP 20-65 Task 53
39
CHAPTER 5
ONLINE SURVEY
SURVEY PROTOCOL
The main objective of the survey was to collect historical project specific cost data from the State
DOTs, transit agencies, and consulting firms. The data was collected on rural and small urban
transit facilities. The cost data served the purpose of developing a cost estimating database and a
tool to support estimates preparation. The survey protocol included 11 main sections:
Background
Survey Instruction
Survey Declaration
Respondent Information
General Project Information
Characteristics of the Project
Cost Estimating
Schedule
Risk
Change Orders
Other
The background section served as a memorandum to explain the research objectives, contact
information of the research team, and the deadline for completion of the online survey. The
survey instruction section described certain interested types of transit facilities that were
designed and constructed in the last five years. The survey declaration was developed aimed at
confirming that the participants had basic knowledge related to the cost estimating practices for
rural and small urban transit facility projects and voluntarily consent to participate in the survey.
Participants’ email addresses were asked in case that further clarification was needed at the end

NCHRP 20-65 Task 53
40
of survey declaration section. Table 3 shows the detailed descriptions of the other survey
sections.
Table 3 Descriptions of Survey Sections
Section Description
Respondent Information The name and type the agencies that constructed transit
facilities
General Project
Information Project location;
Design schedule (start and finish);
Construction schedule (start and finish);
Funding source(s);
Project delivery method; and
Design and construction contract type.
Characteristics of the
Project Type and size of facilities
Different facilities features and elements
Cost Estimating The types of historical cost database used to
prepare the estimates
Actual/ estimated design costs
Actual/estimated construction costs
The percentages of construction cost for major
construction systems
Estimating methods for design and construction
Influential factors in cost estimating process
Schedule Actual/ estimated design schedule
Actual/estimated construction schedule
Reasons for delays.
Risk Methods to estimate the construction contingency
Unusual conditions surrounding the projects
Change Orders The reasons for change orders and their financial
impacts on the projects
Other Lessons about estimating process learned from this
project.
Before sending the survey to practitioners in the rural and small urban transit facility industry,
the survey protocol was pre-tested in October, 2013. A copy of the pilot survey is provided in
Appendix C. Three transit managers and one DOT personnel participated in the pilot survey. The
feedback from the pilot survey revealed the respondents had difficulties in locating actual
historical cost data and completing the open-ended questions on cost estimating, scheduling, and
risks sections. Some transit operators lacked cost estimating expertise and they relied on the

NCHRP 20-65 Task 53
41
estimates provided by consulting firms. Therefore, the survey protocol was re-designed by
changing the open-ended questions to multiple choice questions. The multiple choice questions
were tailored from the results of the interviews and pilot surveys. For example, risk factors, such
as unexpected underground conditions, soil conditions, and environmental issues, were
mentioned by interviewees and then added as choices in a question asking the reasons for cost
overruns. A copy of the refined survey is provided in Appendix D.
Survey invitations were sent on November 6, 2013 to 52 state DOT personnel who manage
public transit facility funding programs and 323 transit managers and consultants across the
United States. The contact information of these potential participants was provided by the RTAP.
Follow-up survey requests were sent to the same group of people on November 26, 2013.
Unfortunately, there were only nine surveys submitted by respondents, which was much fewer
than expected. This probably resulted from the following reasons: a limited number of transit
facilities constructed in the rural and small urban areas in recent years; difficulty of respondents
in accessing project data; respondents’ having limited time to complete the survey; and
respondents lacking cost estimating knowledge. In order to further reduce the difficulty of
completing the survey and improve the response rate, the survey structure was changed and the
size of the survey was reduced. A copy of the shortened survey is provided in Appendix E. The
descriptions of the main body of the shortened survey are shown in Table 4.

NCHRP 20-65 Task 53
42
Table 4 Descriptions of the Shortened Survey
Section Description
Respondent Information The name and type the agencies that constructed transit
facilities
General Project
Information Project location;
Funding source(s);
Project delivery method; and
Design and construction contract type.
Characteristics of the
Project Type and size of facilities
Different facilities features and elements
Cost Estimating The types of historical cost database used to prepare the
estimates
Estimating methods for design and construction
Actual/ estimated design costs
Actual/estimated construction costs
Reasons for cost overruns in the project.
The percentages of construction cost for major construction
systems
Schedule Actual design schedule
Actual construction schedule
Risk Major risk factors
Methods to estimate the construction contingency
Change Orders The reasons for change orders and their financial impacts on
the projects
Other The availability of the cost estimating database and willing
to share
SURVEY PROCESS
The survey process is shown in Figure 10.
2nd Round
Survey
(shortened
version)
Survey
DevelopmentSurvey
Revising
Survey
RevisingPilot
Survey
1st Round
Survey
Follow-up
Invitation
Follow-up
Invitation
Figure 10 Survey Process

NCHRP 20-65 Task 53
43
While the second round survey was distributed, telephone calls to 25 transit mangers across the
United State were made to encourage them to participate in the online survey. In order to collect
more cost data, invitations of the shortened survey were distributed among 1,055 transit
managers and consultants excluding the 323 people contacted during the first round survey. The
contact information of the 1,055 people was again provided by RTAP from its database. Follow-
up invitation emails for the shortened survey were sent on February 7, 2014. Unfortunately, there
were only 13 responses to the shortened survey at the end of February, 2014. Therefore, there
were 26 surveys submitted by respondents including four pilot surveys. Clarification requests
were sent through emails if the respondents did not provide actual design and construction costs
and design and construction schedules (start and finish data). Only one transit manager replied
and provided a design and construction schedule for the project.
SURVEY DATA ANALYSIS
Table 5 shows 26 projects’ original design and construction costs data collected through the
online survey. Different types of facilities are combined in most of the projects. Only one project
includes one type of facility (operation). 11 out of the 26 projects consist of two or three types of
facilities (e.g. administration and operations, or administration, operations, and vehicle storage).
Among the 11 projects, one project was a renovation project. Nine projects include four types of
facilities (administration, operations, maintenance, and vehicle storage). Two projects are
concerning small passenger facilities (shelter bus stop and/or sign only bus stop). Three projects
include not only administration, operations, maintenance, vehicle storage, but also passenger
facilities (e.g. park and ride, shelter bus stop, un-shelter bus stop, and sign-only bus stop). Thus,
the data was incomplete concerning park and ride, shelter bus stop, un-shelter bus stop, and sign-
only bus stop. The cost data that can be used to conduct the analysis only covers those new
facilities construction in the administration, operations, maintenance, and vehicle storage.
However, years of design and/or construction of eight projects were not provided by respondents.
Constructions of two projects were not completed till the respondents’ submitting the surveys.
Then, design and/or construction costs of these ten projects could not be converted to the year of

NCHRP 20-65 Task 53
44
2014. Eleven projects’ estimated and/or actual design costs were missing and eight projects
lacked estimated and/or actual construction costs. Therefore, survey data analysis was conducted
based on limited amount of design and construction cost data.

NCHRP 20-65 Task 53
45
Table 5 Survey Design and Construction Cost Data

NCHRP 20-65 Task 53
46
Table 5 Survey Design and Construction Cost Data (Continued)

NCHRP 20-65 Task 53
47
Before further data analysis, all design and construction cost data normalization was normalized
by performing the following two steps. First, all actual design and construction cost data was
adjusted from various locations to national average costs by using the City Cost Index in R.S.
Means Building Construction Cost Data manual. For locations not included in the City Cost
Index, the conditional nearest neighbor (CNN) method was used to estimate cost indexes. Then,
the national average costs were adjusted from any previous years to 2014 using the Historical
Cost Index in the manual.
Construction Cost Estimating
Table 6 shows estimated, actual, and normalized construction cost data available to conduct an
analysis. Facility types cover administration, operations, maintenance, and vehicle storage.
Table 6 Construction Cost Data
The number of projects in construction cost analysis is 12. The range of normalized construction
cost is from $129,813 to $8,586,186 and the mean value is $2,437,699. The plot of the
normalized construction cost and project size is shown in Figure 11. Regression analysis was

NCHRP 20-65 Task 53
48
performed to identify the relationship between the normalized construction cost and project size
for rural and small urban transit facilities.
Figure 11 Plot of the Normalized Construction Cost and Project Size
The normalized data was fitted with a straight line regression model at 90% confidence level.
The regression plot and statistical summary are shown in Figure 12.
Figure 12 Construction Cost Analysis: Regress plot and Statistical Report of Straight Line
Regression

NCHRP 20-65 Task 53
49
Let construction cost and project size be Y and X respectively. At 90% confidence level, the
straight line regression model is Y = 172.6989 X (X >0).
In order to prove the necessity of the model, hypothesis test was conducted at 90% confidence
level. The hypotheses are shown as follows:
𝐻0: There is no linear relationship between project size and construction cost.
𝐻1: There is a positive linear relationship between project size and construction cost.
According to the statistic report above, the p-value is <0.0001 < α=0.1. Null hypothesis should
be rejected. That is, a straight line regression model is needed. The R square = 𝑆𝑆𝑚𝑑𝑒𝑜𝑙
𝑆𝑆𝑡𝑜𝑡𝑎𝑙 =
1.3637e+14
1.4494e+14 = 0.940872085, which indicates that the straight line regression model is a good fit
for the normalized construction cost data.
Percentage of Construction Cost for Each Construction System
In this study, the classification of building elements followed the ASTM Uniformat II. There are
six major group elements: 1) substructure, 2) shell, 3) interiors, 4) services, 5) equipment and
furnishings, and 6) special construction and demolition. According to survey results,
administration, operations, maintenance facilities, and vehicle storage were combined in most of
the rural and small urban transit projects. Assuming that various combinations of facility types
give rise to a different percentage of construction cost for each construction system, projects
were categorized into the following two groups: projects including four types of facilities
(administration, operation, maintenance, and vehicle storage), and projects including two or three
of those facility types (e.g. administration and operation).
If the project is a combination of four types of facilities (administration, operation, maintenance,
and vehicle storage), the percentage breakdown for each construction system is shown in Figure
13. If the project includes two or three types of those facilities mentioned above, the percentage
breakdown for each construction system is shown in Figure 14.

NCHRP 20-65 Task 53
50
Compared with the first combination, the second combination only has similar percentages of
substructure and special construction and demolition. Possible reasons of the differences are as
follows:
Larger percentage of building sitework construction cost of the first combination might
be due to the necessity of more site mechanical utilities (e.g. water supply and fueling
distribution) and more site electrical utilities (e.g. electrical distribution and site lighting)
if there are more types of facilities involved in a project.
Larger percentages of interior and equipment and furnishings construction costs of the
first combination might be due to the necessity of more wall, floor, and ceiling finishes,
interior doors, partitions, and furnishings constructions if more facility types are included
in a project.
Larger percentages of shell and services construction costs of the second combination
might be due to the fact that projects including operation, maintenance, and/or vehicle
storage might require more heating, ventilation, and air conditioning (HVAC), plumbing,
and electrical constructions to ensure services or activities can be performed safely and
efficiently.
Figure 13 Percentage of Construction Cost for each Construction System (Combination I)
20.02%
12.85%
29.21%
13.27%
17.97%
5.67% 1.00%
Building Sitework
Substructure
Shell
Interior
Services
Equipment
Special Construction &
Demolition
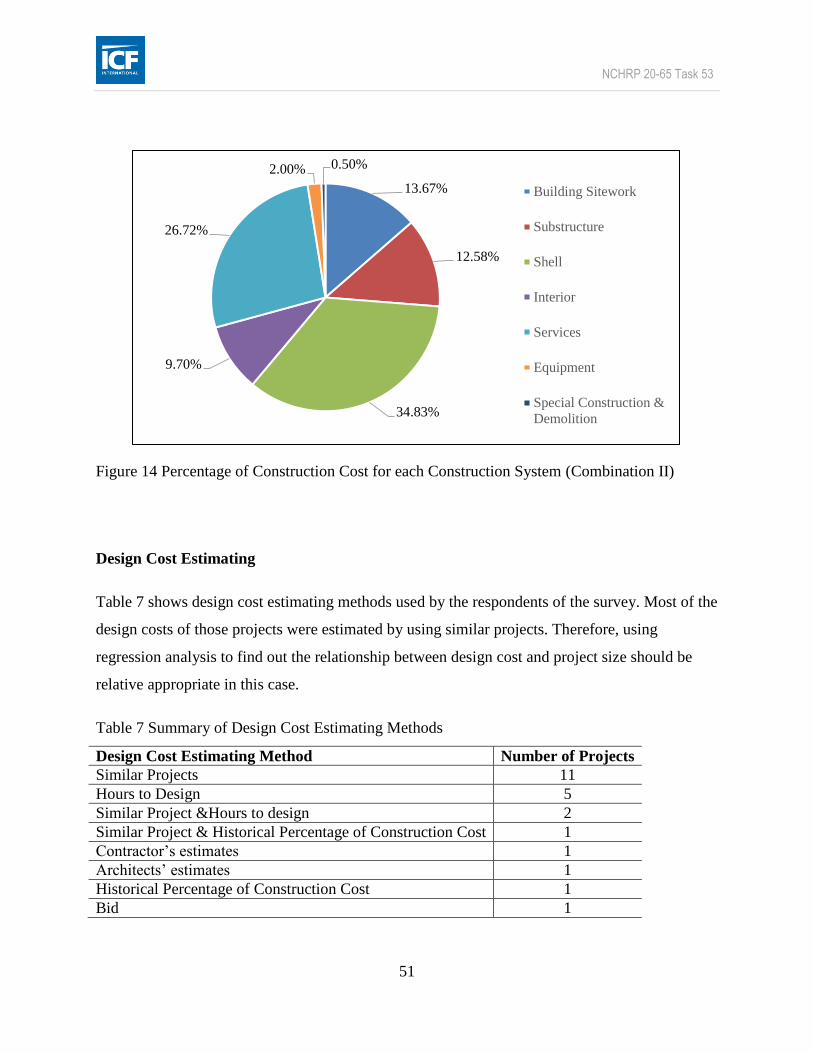
NCHRP 20-65 Task 53
51
Figure 14 Percentage of Construction Cost for each Construction System (Combination II)
Design Cost Estimating
Table 7 shows design cost estimating methods used by the respondents of the survey. Most of the
design costs of those projects were estimated by using similar projects. Therefore, using
regression analysis to find out the relationship between design cost and project size should be
relative appropriate in this case.
Table 7 Summary of Design Cost Estimating Methods
Design Cost Estimating Method Number of Projects
Similar Projects 11
Hours to Design 5
Similar Project &Hours to design 2
Similar Project & Historical Percentage of Construction Cost 1
Contractor’s estimates 1
Architects’ estimates 1
Historical Percentage of Construction Cost 1
Bid 1
13.67%
12.58%
34.83%
9.70%
26.72%
2.00% 0.50%
Building Sitework
Substructure
Shell
Interior
Services
Equipment
Special Construction &
Demolition

NCHRP 20-65 Task 53
52
Table 8 shows estimated, actual, and normalized design cost data available to perform a data
analysis. For projects that lacked actual design cost, their estimated design costs were assumed to
be the same as the actual design costs. The number of projects in design cost analysis is 14. The
normalized design cost ranges from $ 16,190 to $2,632,715 and the mean value is $ 706,533.
The plot of design cost vs. project size is shown in Figure 15.

NCHRP 20-65 Task 53
53
Table 8 Design Cost Data

NCHRP 20-65 Task 53
54
Figure 15 Design Cost vs. Project Size
The normalized design cost data was fitted with a straight line regression model with 90%
confidence level. The regression plot and statistical summary are shown in Figure 16.
Figure 16 Design Cost Analysis: Regress plot and Statistical Report of Straight Line Regression
Let design cost and project size be Z and X respectively. At 90% confidence level, the straight
line regression model is Z = 31.635567 X (X >0). In order to prove the necessity of this model,
hypothesis test was conducted at 90% confidence level. The hypotheses are shown as follows:
𝐻0: There is no linear relationship between project size and design cost.
𝐻1: There is a positive linear relationship between project size and design cost.
NCHRP 20-65 Task 53
55
According to the statistic report above, the p-value is 0.0001 < α=0.1. Null hypothesis should be
rejected. That is, a straight line regression model is needed. The R square = 𝑆𝑆𝑚𝑑𝑒𝑜𝑙
𝑆𝑆𝑡𝑜𝑡𝑎𝑙 =
1.6421e+13
1.8027e+13=
0.910911411, which indicates that the straight line regression model is a good fit for the
normalized design cost data.
Risk Analysis
The frequency of the risk factors stated by survey participants is shown in Figure 17. Soil
conditions and unexpected underground conditions are two the most frequent risk factors and
most interviewees also suggested these two risks. Contaminated soil, buried debris, and
unexpected utilities can increase project cost and also cause unanticipated delay during
construction. Compared with the interview results concerning risks, the survey respondents also
considered risks factors, including high project complexity, omissions and errors in design, and
shortage of construction materials. Not recognizing a project’s high complexity will cause some
criteria for a project not to be met during the decision process and contingency will not be
estimated at a proper level. Design omissions and errors and shortage of construction materials
can cause cost overruns and construction delays. However, the survey respondents did not think
the archeological requirements of local government as a risk.
Although some respondents suggested risk factors in the survey, their projects did not experience
cost overruns. The reasons might be that there was sufficient contingency in the estimated
construction cost or project control plans were carried out effectively by the project management
teams.

NCHRP 20-65 Task 53
56
Figure 17 Frequency of the Risk Factors
Contingency Estimating
Although 21 out 26 respondents stated that a percentage of construction cost was used to
estimate contingency, only eight of them provided the percentages they used. Contingency
percentage provided by the respondents ranges from 4% to 15%. The average contingency is
9.5%, and median of contingency is 10%.
CHAPTER SUMMARY
This chapter first summarizes the survey protocol development and survey process. Then,
regression functions to predict design and construction costs were identified and verified. Risk
factors and contingency estimating for rural and small urban transit facility projects were
discussed at the end of this chapter. The analysis results supported the development of cost
estimating database and prototype tool.
0
1
2
3
4
5
6
7
8
9

NCHRP 20-65 Task 53
57
CHAPTER 6
DEVELOPMENT OF COST ESTIMATING DATABASE AND PROTOTYPE TOOL
FOR RURAL AND SMALL URBAN TRANSIT FACILITIES
COST ESTIMATING DATABASE DEVELOPMENT
After gathering and classifying actual historical cost data through surveys, all data were input
into a MS ExcelTM
spreadsheet and were adjusted to national average cost in 2014 by using the
2014 version R.S. Means Building Construction Cost Data manual. The database is limited by
the amount of cost data collected through the online survey. The facility types covered in this
database include administration, operation, maintenance, and vehicle storage, but the types
exclude passenger facility (small and large), park and ride, bus stop (shelter and unshelter), and
sign only bus stop. Most projects in the database are combinations of administration, operation,
maintenance, and vehicle storage. The cost estimating database was constructed excluding land
acquisition and had the following features:
Basic Project Information: city, state, the mid-point of design time (Month/Year), the
mid-point of construction time (Month/Year), location (rural/small urban), and facility
type.
Project Duration: Design duration (Month) and construction duration (month).
Cost Information: project size (sf), estimated design cost ($), estimated construction cost
($), actual design cost ($), and actual construction cost ($)
Percentage of construction cost for each construction system: building sitework (%),
substructure (%), shell (%), interiors (%), equipment & furnishings (%), and special
construction & demolition (%).
Screen captures of the database are shown in Figure 18, Figure 19, and Figure 20.

NCHRP 20-65 Task 53
58
Figure 18 Cost Database - Basic Project Information and Project Duration
Figure 19 Cost Database - Project Cost Information
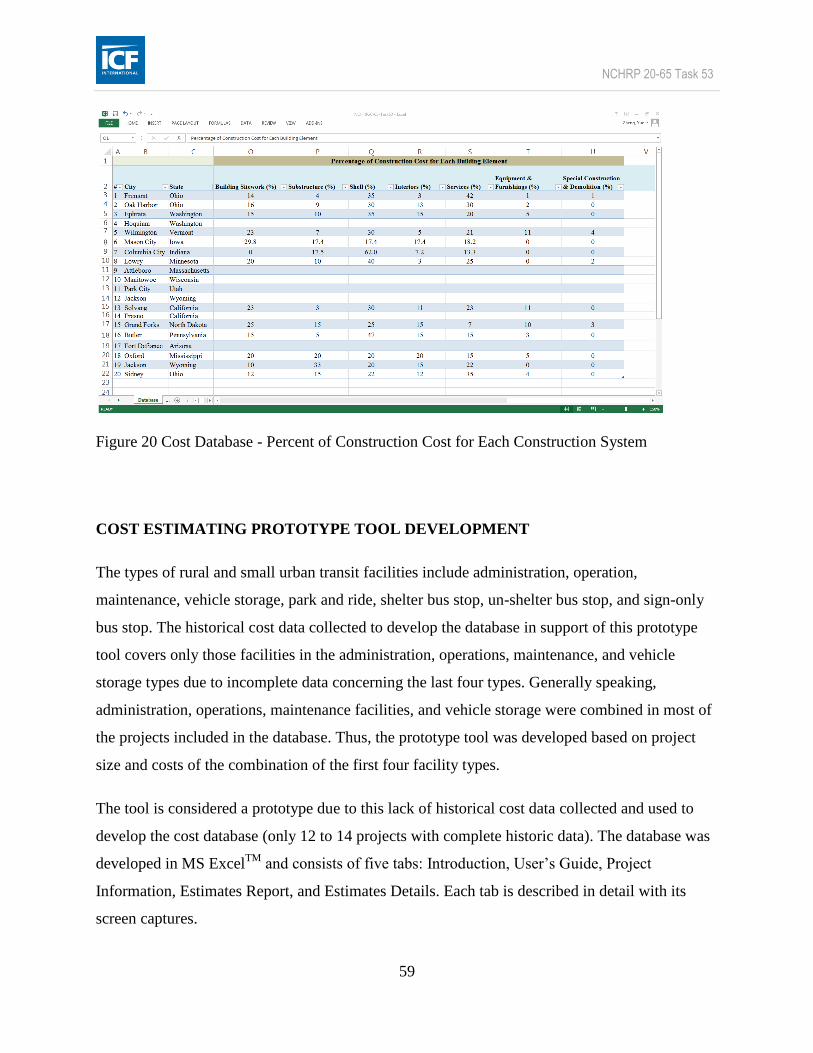
NCHRP 20-65 Task 53
59
Figure 20 Cost Database - Percent of Construction Cost for Each Construction System
COST ESTIMATING PROTOTYPE TOOL DEVELOPMENT
The types of rural and small urban transit facilities include administration, operation,
maintenance, vehicle storage, park and ride, shelter bus stop, un-shelter bus stop, and sign-only
bus stop. The historical cost data collected to develop the database in support of this prototype
tool covers only those facilities in the administration, operations, maintenance, and vehicle
storage types due to incomplete data concerning the last four types. Generally speaking,
administration, operations, maintenance facilities, and vehicle storage were combined in most of
the projects included in the database. Thus, the prototype tool was developed based on project
size and costs of the combination of the first four facility types.
The tool is considered a prototype due to this lack of historical cost data collected and used to
develop the cost database (only 12 to 14 projects with complete historic data). The database was
developed in MS ExcelTM
and consists of five tabs: Introduction, User’s Guide, Project
Information, Estimates Report, and Estimates Details. Each tab is described in detail with its
screen captures.

NCHRP 20-65 Task 53
60
Introduction
The cost estimating prototype tool is a MS ExcelTM
file. Once the user opens the tool, the
“Introduction” tab will be shown. In order to ensure the tool works properly, the user is required
to read the introduction with care before starting the user’s cost estimate process. The screen
captures of the introduction section are shown in Figure 21.
Figure 21 (A) Screen Capture of the Cost Estimating Prototype Tool – Introduction

NCHRP 20-65 Task 53
61
Figure 21 (B) Screen Capture of the Cost Estimating Prototype Tool – Introduction (Continued)
As the first section of the estimating tool, the introduction section introduces the research
background, the objectives of the cost estimating prototype tool, types of facilities considered,
tips of navigation and document saving, and copyright.
User’s Guide
The “User’s Guide” tab explains tips for using the tool. The tips include five aspects: how to
navigate the tool, how to save and print the estimate results, how to input project information,
how to set variables (e.g. inflation rate, contingency percentage, and location adjustment factor),
and how to interpret the estimate report.
The tool supports cost estimating from year 2015 to 2025. The tool suggests the user should
carefully evaluate any estimates made using this tool after the five year mark (after 2020). The
user can either choose the default inflation rate (2.5 percent) or input a value based on their

NCHRP 20-65 Task 53
62
knowledge of local economic condition. The default inflation rate was set after consulting two
experts in cost estimating.
In this prototype tool, contingency is estimated as percentage of construction cost. The user can
either choose the default percentage range or input a contingency percent based on their
knowledge about the project scope, uncertainties, such as site conditions, and other project
characteristics that may influence a project’s costs. The default range of contingency is from 10
percent to 25 percent and most likely contingency percentage is 15 percent. The default
contingency percentages were set by the experts in cost estimating based on the results of
interview and online survey and their estimating experience. Before setting contingency, the tool
recommends the user should assess the risk factors listed in the tool to ensure that sufficient
amount of contingency is estimated.
As for the location adjustment factor, the estimating prototype tool has ten regions within the
United States according to Office of Management and Budget (OMB) Circular A-105
(Wikipedia 2014). For each region, 20 cities, including metropolis and small cities, were selected
and cost indices of those cities from 2014 version R.S. Means Building Construction Cost Data
manual utilized to calculate the location factor. The chosen cities, population, and cities’ indexes
are attached in Appendix F. The location adjustment factor for each region is listed in Table 9.
The index of national average is 100. The prototype tool uses the equation below to adjust design
and construction costs from the national average to any particular region.
Cost at national average
100× Region′s index number

NCHRP 20-65 Task 53
63
Table 9 Regions and Location Adjustment Factors
Region's Name
Location
Factor
Region I: Connecticut, Maine, Massachusetts, New Hampshire, Rhode Island,
Vermont 103.1
Region II: New Jersey, New York, Puerto Rico, Virgin Islands 107.6
Region III: Delaware, District of Columbia, Maryland, Pennsylvania, Virginia,
West Virginia 96.0
Region IV: Alabama, Florida, Georgia, Kentucky, Mississippi, North Carolina,
South Carolina, Tennessee 80.3
Region V: Illinois, Indiana, Michigan, Minnesota, Ohio, Wisconsin 99.5
Region VI: Arkansas, Louisiana, New Mexico, Oklahoma, Texas 83.3
Region VII: Iowa, Kansas, Missouri, Nebraska 91.6
Region VIII: Colorado, Montana, North Dakota, South Dakota, Utah,
Wyoming 86.7
Region IX: Arizona, California, Hawaii, Nevada 102.0
Region X: Alaska, Idaho, Oregon, Washington 102.1
The screen captures of this section are shown in Figure 22. After reading the tips, the user can go
to the “Project Information” tab by clicking the “Continue” button.

NCHRP 20-65 Task 53
64
Figure 22 (A) Screen Capture of the Cost Estimating Prototype Tool – User's Guide

NCHRP 20-65 Task 53
65
Figure 22 (B) Screen Capture of the Cost Estimating Prototype Tool – User's Guide (Continued)

NCHRP 20-65 Task 53
66
Figure 22 (C) Screen Capture of the Cost Estimating Prototype Tool – User's Guide (Continued)
Project Information
The “Project Information” tab enables the user to input the project information necessary to
generate an estimate report: agency name/type; project name/owner; project construction
location; estimated mid-point of the design and construction duration; order of magnitude of
project size (sf); inflation rate; contingency percent; and date. The screen captures of this tab are
shown in Figure 23. For the user’s reference, the tool provides the user default values for the
inflation rate and contingency percent (lower boundary, most likely, and upper boundary).
However, users can also input the values of those variables based on their knowledge about the
project. To facilitate the user to estimate a proper range of contingency percent, a
recommendation is provided. Figure 23-B and C show the screen captures of the
recommendation. After completing the project information, the user can go to the “Estimates
Report” tab to review the estimate results by clicking the “Calculate and Continue” button.

NCHRP 20-65 Task 53
67
Figure 23 (A) Screen Capture of the Cost Estimating Prototype Tool – Project Information

NCHRP 20-65 Task 53
68
Figure 23 (B) Screen Capture of the Cost Estimating Prototype Tool – Project Information
(Continued)
Figure 23 (C) Screen Capture of the Cost Estimating Prototype Tool – Project Information
(Continued)
Estimates Report
The “Estimate Report” tab generates the estimates based on the user’s input. Estimates
information includes base construction cost ($), range of contingency ($), range of total
construction cost ($), design cost ($), construction cost for each construction system. The
construction base estimate and design cost, exclusive of project contingency, are estimated by
using the regression functions described in Chapter 5. The sum of base construction cost and
contingency comprises a total construction cost.
The screen captures of this tab are shown in Figure 24. The user can print the report by clicking
the “Print” button at the top of the screen. To review estimates details, the user should click
“Continue” to go to the “Estimates Details” tab.

NCHRP 20-65 Task 53
69
Figure 24 (A) Screen Capture of the Cost Estimating Prototype Tool – Estimates Report

NCHRP 20-65 Task 53
70
Figure 24 (B) Screen Capture of the Cost Estimating Prototype Tool – Estimates Report
(Continued)

NCHRP 20-65 Task 53
71
Figure 24 (C) Screen Capture of the Cost Estimating Prototype Tool – Estimates Report
(Continued)
Estimates Details
The “Estimates Details” tab provides the user the detailed calculations of an estimate and the
historical index information. The user can also review the location factor for each region, risk
factors, and any comments the user inputs in the “Project Information” tab. The screen captures
of this tab are shown in Figure 25. For future reference, the user can print information in this tab
by clicking “Print” button.

NCHRP 20-65 Task 53
72
Figure 25 (A) Screen Capture of the Cost Estimating Prototype Tool – Estimates Details

NCHRP 20-65 Task 53
73
Figure 25 (B) Screen Capture of the Cost Estimating Prototype Tool – Estimates Details
(Continued)

NCHRP 20-65 Task 53
74
Figure 25 (C) Screen Capture of the Cost Estimating Prototype Tool – Estimates Details
(Continued)

NCHRP 20-65 Task 53
75
Figure 25 (D) Screen Capture of the Cost Estimating Prototype Tool – Estimates Details
(Continued)
REVIEW OF THE COST ESTIMATING TOOL
The purpose of the review was to ensure the self-explanation, functionality, and user-friendliness
of the prototype tool. The prototype tool was not tested for accuracy of its estimates due to the
limited database. Throughout the cost estimating prototype tool development, two cost
estimating experts provided persistent help and reviewed and tested the prototype tool. They

NCHRP 20-65 Task 53
76
recommended the contingency be estimated as a range with high, most likely, and low value
rather than a specific value during conceptual estimating phase. Therefore, contingency
estimating method suggested by Olumide et al. (2010) was used in this estimating prototype tool.
The default range of contingency in the tool was set based on their estimating expertise and the
interview and survey results. The default inflation rate was determined based on the experts’
judgment on the economic conditions and prediction of labor and material costs of the building
construction industry. The projects were classified into two categories after consulting the
experts. The reasons for the classification are that administration, operation, maintenance, and
vehicle storage are combined in most of the projects collected through the online survey and
different combinations have different percentage breakdown for each construction system. In this
way, the difference of percentage breakdown of different combinations can be reflected to some
degree. The Introduction and User’s Guide tabs were also revised based on the experts’
comments.
The protocol, including a research memorandum and a list of questions, was sent to reviewers for
comments and suggestions. The protocol is provided in Appendix G. Both the protocol and
prototype tool were sent to two DOTs personnel and three transit mangers through emails on
May 16, 2014. Follow-up emails were sent on May 28, 2014. One response from a transit
manger was received. The respondent did not experience any difficulty in navigating through the
tool, understanding the user’s guide, and completing the project information section. The
estimate details section was helpful for the respondent to understand adjustment factors and
calculations of design and construction costs.
Moreover, an ExcelTM
file including a list of rural transit facility projects constructed in Texas
was provided by the Texas Transpiration Institute (TTI). Project size, year of construction,
location, and cost were included in the file. However, these file does not explicitly explain what
the cost represents (e.g. total construction cost, design costs, or estimated total construction
costs). Assuming the cost listed in the file are total construction cost, the projects were used to
evaluate the appropriateness of the construction cost estimates produced by the prototype tool.
Default inflation rate and range of contingency percentage were used in the evaluation test.
Although some construction cost estimates calculated by the prototype tool have similar order of
magnitude with the costs provided in the TTI’s file, other estimates had great differences. The
NCHRP 20-65 Task 53
77
difference might be due to the fact that the costs in the file were not exact total construction costs
or there might have been some mistakes when the TTI documented the project cost data.
STEPS OF COST ESTIMATION PRACTICE AND COST ESTIMATION
MANAGEMENT
The steps of cost estimation practice and cost estimation management were developed based on
the guidance in NCHRP Project 8-49, “Procedures for Cost Estimation and Management for
Highway Projects during Planning, Programming, and Preconstruction” and the “Minnesota
Department of Transportation Cost Estimation Improvement and Organizational Improvement
for Project, Phases III and IV”. Although both guidebooks are focused on highway cost
estimation and cost estimation management, the descriptions for each step are generic and
applicable to facilitating the development of rural and small urban transit facility estimates. The
five-step estimating process initiated by Anderson et al. (2007) is provided as follows:
Determine Estimate Basis (e.g. project scope, location, unique characteristics)
Prepare Base Estimate (techniques and tools, historical database, adjustment factors)
Determine Risk and Set Contingency (uncertainty in estimate basis and base estimate to
determine the dollar amount of cost contingency)
Review and Approve Estimate (structured approach to verify completeness, estimate data
used, documentation, accountability for estimate)
Communicate Estimate (convey basis, assumptions, uncertainty)
Appendix H shows the descriptions for each cost estimation step. The cost estimating prototype
tool in the research can facilitate all the estimating steps mentioned above. For example, a transit
agency referred to as “ABC” in this research needs to construct a transit complex, including
administration and maintenance facilities. A conceptual estimate of this project should be
prepared by following the five-step estimating process above.
First, when determining the estimate basis of this project, the transit manager should define and
document the project concept definition (e.g. project size, location, and descriptions of key

NCHRP 20-65 Task 53
78
works) and site characteristics. After determining the estimate basis, the transit manger should
input the following key information into the estimating prototype tool: project size (e.g. 6000
square foot); location (e.g. Butler, Pennsylvania); facilities function and features (e.g.
administration and maintenance); and site characteristics (e.g. the site used to be an old depot,
and therefore the underground conditions would potentially increase construction cost.
Second, in order to prepare base estimate, the transit manger should select an appropriate
estimating approach and a tool supporting conceptual cost estimating. Assumptions, such as
inflation rate, should be made in this step. In this case, the transit manager selects the cost
estimating prototype tool developed in this research and inputs assumptions into the prototype
tool, such as the estimated mid-point of design year (e.g. 2015), the estimated mid-point of
construction year (e.g. 2016), and inflation rate (e.g. 3.0%).
Third, project risks should be determined in order to set contingency. The transit manager should
identify potential risks, such as unexpected underground and weather conditions, and document
these in the prototype tool. For a low complexity project, percentages of construction cost are
used to estimate the range of contingency. The transit manager defines contingency as follows:
lower boundary (e.g. 10%), most likely contingency percentage (e.g. 15%), and upper boundary
(e.g. 20%). Clicking the “Calculate and Continue” button, the estimate report will be provided.
The screen captures of the Project Information section are shown in Figure 26.
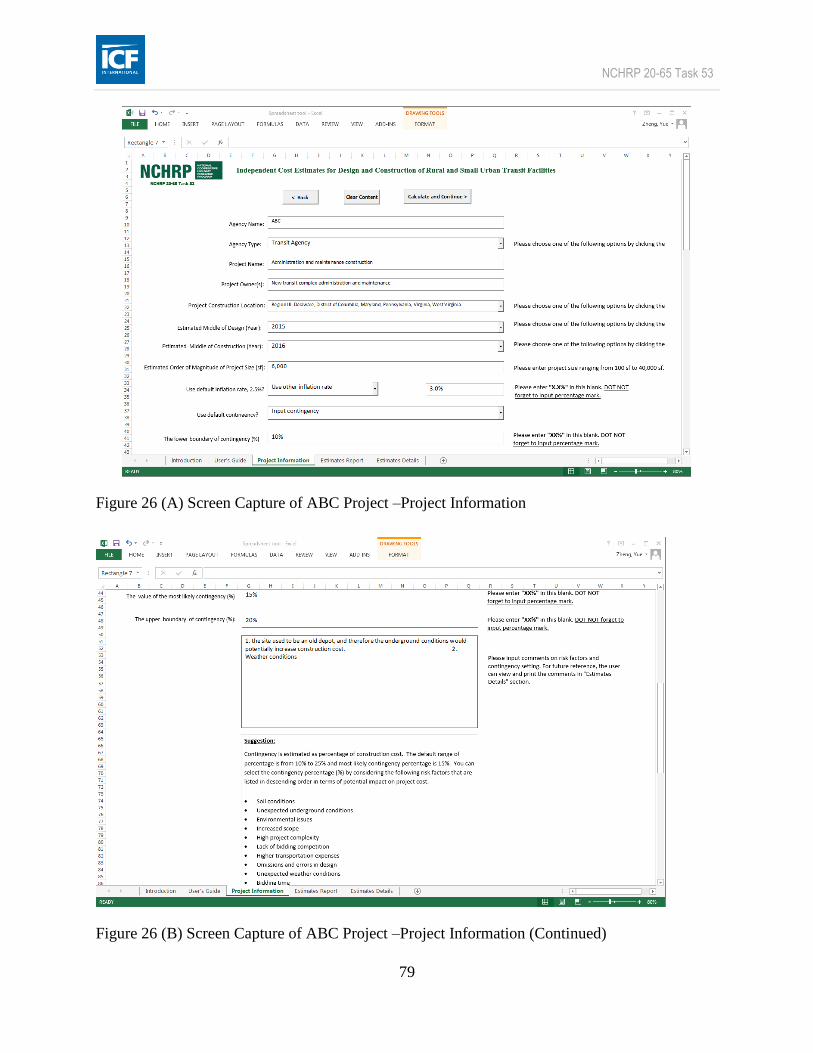
NCHRP 20-65 Task 53
79
Figure 26 (A) Screen Capture of ABC Project –Project Information
Figure 26 (B) Screen Capture of ABC Project –Project Information (Continued)

NCHRP 20-65 Task 53
80
Figure 26 (C) Screen Capture of ABC Project –Project Information (Continued)
Fourthly, appropriateness and completeness of the estimate should be reviewed and verified. In
this instance, the transit manager should review and check the Estimates Report and calculation
details presented by the prototype tool. Screen captures of the Estimates Report and Estimates
Details are shown in Figure 27 and Figure 28.
Last, in order to communicate the estimates, the transit mangers can print the estimate report and
estimate details that convey estimate basis, assumptions, and project risks.

NCHRP 20-65 Task 53
81
Figure 27 (A) Screen Capture of ABC Project –Estimates Report

NCHRP 20-65 Task 53
82
Figure 27 (B) Screen Capture of ABC Project –Estimates Report (Continued)

NCHRP 20-65 Task 53
83
Figure 28 Screen Capture of ABC Project –Estimates Details
LIMITATION OF THE RESEARCH
The cost estimating database and prototype tool only support conceptual estimating during
schematic development phase since this is the level of historical cost data collected. Both the cost
estimating database and prototype tool were constructed based on the actual historical cost data

NCHRP 20-65 Task 53
84
available for rural and small urban transit facilities. The following factors might give rise to lack
of data:
A limited number of transit facilities were constructed in the rural and small urban areas
in the last five years.
Majority of the potential survey participants in the contacts database provided by the
RTAP are state DOTs personnel and transit managers. Many seem to lack the cost
estimating knowledge to complete survey or the data simply not kept.
Respondents have difficulty in accessing projects’ design and construction cost data.
Division of public transit program of state DOTs and transit agencies have experience
staff shortages, and therefore DOTs personnel and transit mangers did not have time to
complete the online survey.
However, the database of relevant cost elements and the estimating prototype tool can be
improved by performing further larger scale of data collection with extended amount of time.
Design consultants and contractors would be another source for historical cost data.

NCHRP 20-65 Task 53
85
CHAPTER 7
GUIDELINES OF REVIEWING COST ESTIMATES
This chapter covers guidelines of reviewing cost estimates from an owner’s prospective. The
basis of the guidelines for rural and small urban transit facilities was tailored from previous
research: NCHRP Project 20-07/Tasks 278 and 308, “The American Association of State
Highway and Transportation Officials (AASHTO) Practical Guide to Estimating;” NCHRP
Project 8-49, “Procedures for Cost Estimation and Management for Highway Projects during
Planning, Programming, and Preconstruction;” and the “Minnesota Department of
Transportation Cost Estimation Improvement and Organizational Improvement for Project,
Phases III and IV.” The cost estimating processes developed in those previous research projects
have a history of success in preparing consistent, reliable, and accurate estimates at any phase in
the project development process. Since the process is generic, it is applicable to development of
rural and small urban transit facilities as well. Moreover, reviewing estimates by following
guidelines provided in this chapter will ensure the quality of estimates. The review guidance
follows the five steps shown in the generic cost estimating process provided in Figure 29.
PROCESS OF REVIEWING COST ESTIMATES
A cost estimating reviewer should check the following five general aspects:
Did the project meet all regulations of FTA? For additional information and regulations
of FTA, please refer to Circular C 4220.1F: Third Party Contracting Guidance (FTA,
2013) and Project and Construction Management Guidelines (FTA, 2011)
Did the estimator clearly follow a structured cost estimating process such as that depicted
in terms of the flow chart in Figure 29?
Were all key inputs taken into consideration and clearly documented by the estimator
(e.g., historical data; market conditions; cost estimating techniques and tools; macro
environment; and information from third-party)?

NCHRP 20-65 Task 53
86
Were assumptions determined and documented clearly by the estimator?
Is there a Project Cost Estimate File available that contains all the information relevant to
preparing a project cost estimate (see questions 1 to 3)?
Approved Cost
Estimate Package
Project Definition
(Major Parameters, Schematics,
Preliminary Plans, Final Plans)
Project Characteristics
(Location, Type, and
Complexity)
Financial Groups
Inputs/Requirements
Historical Data
Determine
Estimate Basis
Cost
Estimating
Technique and
Tools
Input from
3rd Party
Macro
Environment
Market
Conditions
Prepare Base Estimate
Determine
Risk/Contingency
Review and
Approve Estimate
Determine Estimate
Communication
Approach
Cost Estimate
Communication
Package
Input
Step
Database
Document
Legend
Figure 29 Cost Estimating Process Derived from the AASHTO Practical Guide to Estimating
(2011).

NCHRP 20-65 Task 53
87
REVIEW ESTIMATE BASIS DETERMINED BY THE ESTIMATOR
Reviewing the estimate basis serves the purpose of ensuring that all information required to
prepare a cost estimate is collected and clearly documented. This step includes the following
aspects:
Is the scope of the project clearly defined including what is included in the scope and
what is not included in the scope?
Has the estimator visited the future construction site to determine the existing conditions
and any potential site access issues?
Is the technical scope for the estimate consistent with the regulatory requirements and
constraints (i.e., permit conditions, regulations)?
Has the estimator asked for, and been provided with, clarifications from the design team,
local stakeholders or appropriate permitting agencies, where necessary?
Has an estimate file (or report) been prepared to document the estimate basis (i.e.,
drawing numbers and dates, specifications, quotes, etc.)?
Has a list of key assumptions, clarifications and exclusions been prepared to document
what is not yet design or known about the project?
REVIEW BASE ESTIMATE DETERMINED BY THE ESTIMATOR
When reviewing the most likely cost estimate (base estimate) without contingency, the following
aspects should be considered:
Were appropriate estimating methods used in relation to the available scope information,
historical cost data, and other references used by the estimator (e.g., conceptual, bid-
based, cost-based, and risk-based estimating methods),?
Were assumptions and calculations documented clearly?
Were estimate components identified, measured, and quantified correctly by the estimator?
Are the categories summarized in an estimating tool (e.g., spreadsheets) consistent with
the components of the total project cost estimate? Are the calculations in the back up
correct?

NCHRP 20-65 Task 53
88
Were the estimating assumptions and base cost estimate summary and details clearly
documented?
REVIEW RISKS AND CONTINGENCY DETERMINED BY THE ESTIMATOR
In order to review risks and contingency determined by the estimator, the reviewer should
consider the following aspects:
What is the contract type of the project? According to the FTA, typical contract types
may include, but are not limited to, firm fixed price and cost reimbursement. However,
cost plus a percentage of cost and percentage of construction cost are prohibited. Time
and materials contracts can be used only when no other contract type is suitable and a
ceiling price is confirmed.
Does the estimate explicitly identify a contingency amount?
Does the estimate file (or report) clearly justify the basis of the contingency estimate?
Is there a list of key assumptions, clarifications and exclusions that address project
unkowns and project risks (see also Determine Estimate Basis)?
Has the estimate been reviewed for any contingency “buried” in line items or not
explicitly identified?
Has the final contingency estimate has been compared to other contingency estimates on
similar projects?
Is lack of bidding competition a potential risk factor in the project? For example, when a
single proposal is received, which is considered as one without price competition, the
estimated contingency is recommended to be increased.
REVIEW AND APPROVE ESTIMATE
Before an estimate is released to both internal and external project stakeholders, it should be
reviewed and approved. This step includes the following aspects:
Does the estimate cover all the project scope as known at the time of the estimate?
NCHRP 20-65 Task 53
89
Are cost estimating methods and historical cost data applications consistent with the
scope definition?
Are the estimate basis, assumptions, allowances, unknowns, contingencies, and changes
from previous estimates documented in the final estimate package in a clear and concise
manner?
Were the estimating documents in the Project Estimate File reviewed?
Has the cost estimate been approved by the appropriate level of management?
REVIEW COMMUNICATION APPROACHES
This step ensures the cost estimates to be a vehicle for succinctly and clearly conveying key
project information to both internal and external project stakeholders. The following aspects
should be considered:
Does the estimating package include major features of the project, specialty features, and
features that have been considered?
Were key assumptions, allowances, unknowns, and contingencies identified and
documented?
Are the estimating spreadsheets and diagrams in the estimating package comprehensive
and clearly depicting the cost estimate for the project?

NCHRP 20-65 Task 53
90
blank page

NCHRP 20-65 Task 53
91
CHAPTER 8
CONCLUSIONS
This chapter provides summary of conclusions that were drawn from this study and
recommendations for future research with respect to this topic.
CONCLUSIONS
This research included a literature review, telephone interviews, and an online survey. A cost
estimating database was constructed based on historical cost data collected through the survey.
Analysis of historical cost data was the basis for development of cost estimating prototype tool.
The general conclusions include:
Project design and construction costs depends on various factors, such as facility types,
project size, location, and facility features.
Many construction projects for rural and small urban transit facilities were suspended or
delayed due to lack of funding.
Most transit projects in rural and small urban areas include more than one type of facility.
State DOTs and transit agencies rely on the estimates prepared by consultants. State
DOTs hire consultants to perform independent cost estimates reviews.
Both design and construction costs are estimated based on similar projects. Regression
functions of design and construction costs were obtained through regression analysis, and
the functions were used in the cost estimating prototype tool to predict future design and
construction costs at conceptual estimating phase.
Risk factors were identified through telephone interviews, and the frequency of the risk
factors were obtained from the online survey.
In order to address project risks, contingency is estimated as percentage of construction
cost. The ranges of contingency percentage given by the interviewees and survey results

NCHRP 20-65 Task 53
92
provided reference on determining the default contingency range for cost estimating
prototype tool.
RECOMMENDATIONS FOR FUTURE RESEARCH
A cost estimating database and a prototype tool were developed based on actual historical cost
data collected via the online surveys. Further research should be conducted in order to capture
addition data through the following approaches:
First, it is necessary to target a greater number of practitioners with cost estimating expertise who
are involved in rural and small urban transit facility projects, especially design consultants and
contractors that may provide historical data.
Second, as an alternative to collecting cost data through a survey, a Delphi process can be
performed. The candidates of the Delphi study can be personnel at state DOTs who are in charge
of funding distribution of rural capital programs, transit mangers having knowledge of cost
estimating, and consultants having experience in design and construction of transit facilities in
rural and small urban areas. In order to ensure consistency in sample size, it is better that all the
experts can respond to each round of the Delphi surveys.
Third, through the online survey, it was found that most rural and small urban transit projects
were the combinations of many types of facilities, such as administration, operation,
maintenance, and vehicle storage. Therefore, in the future data collection process, it may be
better to ask the survey participants to provide size and cost for each type of facilities in one
project so that an estimating tool can be developed to support estimates for each type of facilities.
Fourth, the survey data was incomplete concerning park and ride, shelter bus stops, un-shelter
bus stops, and sign-only bus stops. Efforts in collecting data on the cost of those types of
facilities should be made in the future.

NCHRP 20-65 Task 53
93
Lastly, cost and schedule impacts of each risk factor should be asked in the survey so risk factors
can be quantified, and thereby risk analysis and management for rural and small urban transit
facilities could be better structured.

NCHRP 20-65 Task 53
94
blank page

NCHRP 20-65 Task 53
95
REFERENCES
American Public Transportation Association (APTA). (2010). “Architectural and engineering design
for a transit operating and maintenance facility.” Rep. No. APTA BTS-BMF-RP-001-11, American
Public Transportation Association, Washington, DC.
Anderson, S. D., Molenaar, K. R., and Schexnayder, C. J. (2007). “Guidance for cost estimation and
management for highway projects during planning, programming, and preconstruction.”
Transportation Research Board National Research, Washington, DC.
Association for the Advancement of Cost Engineering International (AACEI). (2014). “Cost
Estimating Model for Buildings.”
<http://www.aacei.org/resources/BuildingModel.shtml#AboutTheModel> (May 20, 2014).
Brown & Bills Architects. (2012). “Rural transit facility prototype for Ohio Department of
Transportation Office of Transportation.”
<http://www.dot.state.oh.us/Divisions/Planning/Transit/Documents/Rural%20Transit%20Manual/Ru
ral%20Transit%20Manual%20Revised%202012/Rural%20Facility%20Prototype%20Report.pdf>
(Jan. 10, 2014).
Bredehoeft, P. R., Jr. (2012). “Cost estimate classification system.” Association for the Advancement
of Cost Engineering International (AACEI) Recommended Practice No. 56R-08, AACEI,
Morgantown, WV.
Dye Management Group, Inc. (2001). “Planning for transportation in rural areas.” Federal Highway
Administration in Cooperation with the Federal Transit Administration, Bellevue, WA.
Federal Transit Administration (2011). “Project and Construction Management Guidelines.”
<http://www.fta.dot.gov/FTA_Project_and_CM_Guidelines_-_July_2011_Update_12-01-26.pdf>
(Oct. 13, 2014)
Federal Transit Administration (2013). “Circular C 4220.1F: Third Party Contracting Guidance.”
<http://www.fta.dot.gov/legislation_law/12349_8641.html> (Oct. 13, 2014)
Fravel, F. D. (2003). “Intercity bus links: moving into new territory.” TR News, No.225,
Transportation Research Board National Research, Washington, DC, 24-29.
Fravel, F. D., and Barboza, R. Jr., (2011). “Analysis of state rural intercity bus strategies:
requirements for utilization of S. 5311 (f) Funding.” Transportation Research Board National
Research, Washington, DC.
Hallowell, M., Tran, D., and Molenaar, K. (2012). “Construction management practices for rural
projects.” Transportation Research Board National Research, Washington, DC.

NCHRP 20-65 Task 53
96
Hollmann, J. K. (2008). “Contingency estimating ‐ general principals TCM framework: 7.6 – Risk
Management.” AACEI Recommended Practice No. 40R-08, AACEI, Morgantown, WV.
KFH Group, Inc. (2002). “Effective approaches to meeting rural intercity bus transportation needs.”
Transportation Research Board National Research, Washington, DC.
Khemlani, L. (2008). “DProfiler: A ‘macro’ BIM solution.”
<http://www.aecbytes.com/review/2008/DProfiler.html> (Oct. 20, 2014, 2013).
Manfredonia, B., Majewski, J. P., and Perryman, J. J. (2010). “Cost estimating.”
<http://www.wbdg.org/design/dd_costest.php> (Apr. 25, 2014).
Migliaccio, G., Zandbergen, P., and Martinez, A. (2013). “Empirical comparison of methods for
estimating location cost adjustments factors.” J. Manage. Eng., 10.1061/(ASCE)ME.1943-
5479.0000240, 04014037.
Molenaar, K. R., Anderson, S. D., and Schexnayder, C. J. (2010). “Guidebook on risk analysis tools
and management practices to control transportation project costs.” Transportation Research Board
National Research, Washington, DC.
Molenaar, K. R., and Wilson, C. R. (2009). “A risk-based approach to contingency estimation in
highway project development.” Proc., 2009 Construction Research Congress—Building a
Sustainable Future, 786-795.
Office of Transit, Ohio Department of Transportation. (2012). “Rural transit facility prototype for
Ohio Department of Transportation Office of Transit.”
<https://www.dot.state.oh.us/Divisions/Planning/Transit/Documents/Rural%20Transit%20Manual/R
ural%20Transit%20Manual%20Revised%202012/FINAL%20ENTIRE%20MANUAL%2011-30-
12%20CMH.pdf> (Jan. 8, 2014).
Olumide, A. O., Anderson, S. D., and Molenaar, K. R. (2010). “Sliding-scale contingencies for
project development process.” Transportation Research Record 2151, Transportation Research Board,
Washington, DC, 21-27.
R.S. Means. (2014). Building construction cost data, 72nd Ed., Norwell, MA.
Texas Department of Transportation (TXDOT). (2012). “The Texas rural transportation plan.”
Transportation Planning and Programming Division, Texas Department of Transportation, Austin,
TX.
Wikipedia. (2014). “List of regions of the United States.”
<http://en.wikipedia.org/wiki/List_of_regions_of_the_United_States> (Feb. 10, 2014).
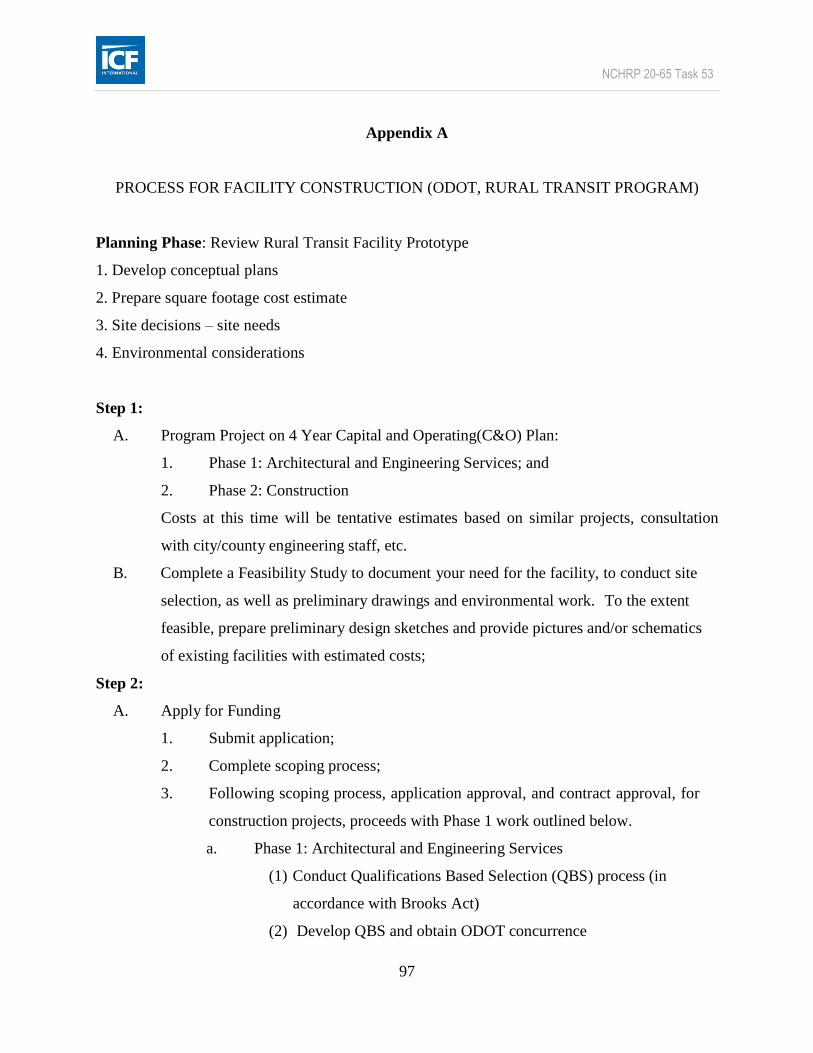
NCHRP 20-65 Task 53
97
Appendix A
PROCESS FOR FACILITY CONSTRUCTION (ODOT, RURAL TRANSIT PROGRAM)
Planning Phase: Review Rural Transit Facility Prototype
1. Develop conceptual plans
2. Prepare square footage cost estimate
3. Site decisions – site needs
4. Environmental considerations
Step 1:
A. Program Project on 4 Year Capital and Operating(C&O) Plan:
1. Phase 1: Architectural and Engineering Services; and
2. Phase 2: Construction
Costs at this time will be tentative estimates based on similar projects, consultation
with city/county engineering staff, etc.
B. Complete a Feasibility Study to document your need for the facility, to conduct site
selection, as well as preliminary drawings and environmental work. To the extent
feasible, prepare preliminary design sketches and provide pictures and/or schematics
of existing facilities with estimated costs;
Step 2:
A. Apply for Funding
1. Submit application;
2. Complete scoping process;
3. Following scoping process, application approval, and contract approval, for
construction projects, proceeds with Phase 1 work outlined below.
a. Phase 1: Architectural and Engineering Services
(1) Conduct Qualifications Based Selection (QBS) process (in
accordance with Brooks Act)
(2) Develop QBS and obtain ODOT concurrence

NCHRP 20-65 Task 53
98
(3) Select an Architecture/Engineering (A/E) firm
(4) Negotiate contract
(5) Conduct A/E work:
(a) Preliminary Design
(b) Site Selection and Environmental Work
5-b-1 Submit environmental package to ODOT for
submission to FTA
5-b-2 Following FTA concurrence, proceed with site
development. If FTA does not occur, additional
environmental work will need to be conducted, or
alternative site selected, repeated;
(6) Site Development (construction only);
(7) Prepare construction bid documents; and
(8) Submit Periodic Invoices to ODOT.
B. Construction Management Oversight (optional in Phase 1 – can be done as part of
the overall construction bid, if desired)
1. Conduct Selection Process; and
2. Development bid/proposal for project oversight services and obtain ODOT
concurrence
a. Select project manager
b. Negotiate contract.
Step 3:
1. Apply for funding for Phase 2, Construction.
1. Submit application; and
2. Following approval and contract execution with ODOT, proceed with next
steps.
2. Bid construction project
1. Negotiate contract; and
2. Monitor construction (construction manager).
3. Perform Project Oversight (Construction Manager)
1. Perform regular site visits;

NCHRP 20-65 Task 53
99
2. Oversee General Contractor (if separate from construction manager) and
subcontractors;
3. Check site work with specifications;
4. Negotiate any necessary change orders;
5. Report progress and any problems to grantee; and
6. Approve and/or submit invoices to ODOT.
Step 4:
Continue to Monitor the Project
Although ODOT will also monitor the project, it is the grantee’s responsibility to provide
project oversight and on-going monitoring.
Notes:
Section 5311 grantees can choose to conduct the A/E portion locally without Section
5311 funding. They must still follow the Brooks Act requirements as well as FTA
requirements for conducting the environmental assessment, etc. and ODOT must still
review and approve selection process and contracts.
As noted above, construction oversight can be bid separately after the A/E work is
performed and either prior to or concurrent with the construction bid process, or as part
of the overall construction bid.

NCHRP 20-65 Task 53
100

NCHRP 20-65 Task 53
101
Appendix B
INTERVIEW PROTOCOL
NCHRP 20-65-Task 53: Independent Cost Estimates for Design and Construction of Rural
and Small Urban Transit Facilities
As part of National Cooperative Highway Research Program (NCHRP) project 20-65, Task 53,
this research focuses on “Independent Cost Estimates for Design and Construction of Rural and
Small Urban Transit Facilities.” It is being conducted by the Texas A&M Transportation
Institute (TTI). The purpose of this study is to provide guidance to state transit agencies in
assisting their sub-recipients with the preparation accurate design and construction cost estimates
and processes for reviewing the estimates. A standard estimating methodology (i.e., critical
process steps) and a database of key estimate items (i.e., estimating checklists) will be developed
specifically for rural and small urban transit facilities to assist agencies in preparing cost
estimates that are consistent, reliable, and accurate. The study consists of five sub-tasks.
In order to define the scope of rural and small urban transit facilities, sub-task 1 will involve
interviews with practitioners and experts in the field. The objective of sub-task 1 is to understand
the typical characteristics of rural and small urban transit facilities. Key information of interest
includes the types and sizes of rural and small urban transit facilities, the impact of location
characteristics on the design and construction of these facilities, the availability of historical cost
data for design and construction of these facilities, and the identification of key estimating items
that can influence project costs.
You have agreed to participate in an interview on this subject to be held on DATE and TIME.
The following questions will be discussed. The interview should approximately take one hour.
The study team thanks you in advance for your participation in this effort.

NCHRP 20-65 Task 53
102
Interview Questions
1. Please provide a brief description of your experience with rural and small urban transit
facilities.
2. In your experience, what are the differences between rural and small urban transit facilities?
3. A classification of rural and small urban transit facilities, based on their functions, is provided
below:
Operations and Maintenance (Administration, General Purpose, Maintenance and Vehicle
Storage)
Large Passenger Facilities (Park and Ride, Terminal or Garage and Transit Center)
Small Passenger Facilities (Sheltered Bus Stop, Unsheltered Bus Stop and Sign-only Bus
Stop)
Are these building types consistent with the transit facilities your organization designs and
constructs? Are there other functional types not listed that the team should investigate?
4. How many projects by functional type are typically completed in a year by your agency?
(Design, Construction)
5. For each functional type what is the typical:
Project size (in units (e.g., square foot) either an average or a range)
Project cost (in dollars either an average or a range)
6. What are typical building system components for each type of facility (e.g., beginning from
the ground up, foundations, structures, exterior envelope, interior finishes, cooling and heating,
and others)?
7. What location characteristics of rural and small urban projects impact the design or
construction of these types of projects?

NCHRP 20-65 Task 53
103
8. What historical cost data does your agency capture from bids or construction to help estimate
future design and construction costs on these types of projects?
If cost data is captured, does your agency have a database of these costs available and
how detailed is the database?
Where does the data base reside (field offices or central location)?
9. What are typical risks for these projects by functional type?
10. How are these risks covered in the project estimate and schedule?
11. Do you apply contingencies to design estimates at conceptual, schematic, design
development, or construction stages and how is it developed?
12. What is a typical duration of design and construction of these projects by functional type (an
average duration or range)?
13. Do you maintain checklists of critical estimate items? Can you share these with us (in writing
or anecdotally)?

NCHRP 20-65 Task 53
104

NCHRP 20-65 Task 53
105
Appendix C
PILOT SURVEY PROTOCOL
Background
Estimating the cost of project design and construction is a challenge. At the same time
consistent, reliable, and accurate cost estimates are critically important because agencies (or
recipients of Federal funds) use estimates to make key program decisions. Early cost estimates
are often the most critical as these estimates support financial decisions to proceed with project
design and eventually construction. However, agencies must prepare these estimates when there
is limited project scope information.
Our research team is currently studying cost estimation methods for design and construction of
rural and small urban transit facilities. This study aims to provide guidance to state transit
agencies in assisting their sub-recipients with preparing and/or reviewing the accuracy of design
and construction cost estimates. Our goal is to construct an appropriate database of historical
cost elements and a standard estimating methodology to assist agencies in developing their cost
estimates.
Dr. Stuart Anderson, Texas A&M University, is the Principal Investigator (PI) for this study.
Dr. Keith Molenaar, University of Colorado, and Dr. Clifford Schexnayder, Arizona State
University, are the Co-PIs. Our contact information is:
Dr. Stuart Anderson: 979-845-2407, [email protected],
Dr. Keith Molenaar: 303-735-4276, [email protected],
Dr. Clifford Schexnayder: 202-997-7246, [email protected].
The research team requests that this questionnaire be completed by DATE. The questionnaire is
voluntary and research team will hold the data collected in strict confidence as follows:
Participating in this survey is voluntary.
The data provided by participants in this questionnaire will be confidential and used only
for research purposes.
Provided data will not be communicated in any form to any organization other than
authorized academic researchers and designated staff members working on the project.
To protect the confidentiality of individuals submitting data, only aggregated data will be
presented and published in the report to the National Cooperative Highway Research
Program or presentations.
Survey Instruction
This research project focuses on transit facility projects serving rural areas with population of
less than 50,000 people and/or small urban areas with population of 50,000 to 199,999 people.
These transit facility projects might have one or more of the following functionalities:

NCHRP 20-65 Task 53
106
Operations and maintenance facilities (administration, general purpose, maintenance, and
vehicle storage),
Large passenger facilities (park and ride, terminal or garage, transit center, and intercity
bus terminal),
Small passenger facilities (sheltered bus stop, unsheltered bus stop, and sign-only bus
stop).
If your agency has constructed any types of the above facilities in the past five years, we do
appreciate your participation in this study.
Survey Declaration
I understand the above information and voluntarily consent to participate in the project
entitled NCHRP Project 20-65/Task 53 - Independent Cost Estimates for Design and
Construction of Rural and Small Urban Transit Facilities.
☐ Yes
☐ No (Please Cancel the Survey)
Completion of the following questionnaire requires basic knowledge related to cost
estimating practices for rural and small urban transit facility projects. Please select the
continue option below if you have this knowledge. If this is not your area of expertise, select
the cancel option and kindly forward the questionnaire to an appropriate colleague.
☐ Continue
By selecting continue, I acknowledge that my answers may be anonymously used as part of
this study.
We are asking for your email so we may contact you if we need to clarify your responses and
to copy you on the results of this study when completed.
☐ Please do not contact me with the results
☐ I am available for additional questions
Respondent Information
First Name:
Last Name:
Agency Name:
Agency Type:
☐ Department of Transportation
☐ Transit Agency
☐ Consultant

NCHRP 20-65 Task 53
107
☐ Other (Please Explain) _________________
Organization Unit and/or Job Title:
State where you are employed:
Email Address:
How many years have you been involved with rural and small urban transit facility projects?
General Project Information
Project Name:
Project Owner(s):
Funding Source(s):
Primary Designer: ___________________________________________________
Prime Contractor: ___________________________________________________
Project Delivery Method:
☐ Design-Bid-Build
☐ Design-Build
☐ Construction Manager at Risk
☐ Other (Please Explain) _________________
Design Contract Type:
☐ Lump Sum Contract (based on % of estimated construction costs)
☐ Unit Price (based on Design Hours times Hourly Rate)
☐ Cost Plus a Fee
☐ Incentive Contracts
☐ Other (Please Explain) _________________
Construction Contract Type:
☐ Unit Price Contract
☐ Lump Sum Contract
☐ Cost Plus a Fee
☐ Incentive Contracts
☐ Other (Please Explain) _________________
Project Construction Location:

NCHRP 20-65 Task 53
108
☐Rural Transit facility (Rural transit projects tend to be relatively small in scope
(i.e., often less than $2,000,000) and located in areas with a population of less
than 50,000 people.)
☐Small Urban Transit Facility (Urban transit projects often cost more than
$2,000,000 and located in areas with a population of 50,000 to 199,999 people.)
☐Urban Transit Facility (Urban transit projects often cost more than $2,000,000
and located in areas with a population of more than 200,000 people.)
Characteristics of the projects
1. Which of the following classifications best describes the project in question? (Please select
as many as apply.)
☐ Administration
☐ Operations
☐ Maintenance
☐ Vehicle Storage
☐ Large Passenger Facilities
☐ Small Passenger Facility
☐ Park and ride
☐ Shelter bus stop
☐ Un-shelter bus stop
☐ Sign-only bus stop
☐ Other (Please Explain) _________________
2. What is the total size of the project in square foot (sf)? ___________
3. What were the main facility systems and elements? (Please select as many as apply.)
Building Sitework
☐ Site Preparation
☐ Site Improvements
☐ Site Mechanical Utilities
☐ Site Electrical Utilities
☐ Other Site Construction
Substructure
☐ Foundations
☐ Basement Construction (Basement Excavation, Basement Walls)
Shell
☐ Super Structure
☐ Exterior Enclosure
☐ Roofing
Interiors

NCHRP 20-65 Task 53
109
☐ Interior Construction
☐ Stairs
☐ Interior Finishes
Services
☐ Conveying (Elevators & Lifts, Escalators & Moving Walks, Other Conveying
Systems)
☐ Plumbing
☐ HVAC
☐ Fire Protection
☐ Electrical
Equipment & Furnishings
☐ Equipment
☐ Furnishings
Special Construction & Demolition
☐ Special Construction
☐ Selective Building Demolition
☐ Other (Please Explain) ______________
Cost Estimating
4. What type of historical cost database was used to prepare the cost estimate?
☐In-House Database
☐Published Database (e.g. RS Means)
☐Both In-House and Published Databases
☐Cost Data from Similar Projects
☐Other (Please Explain) _______________
5. Would you share your agency’s cost database with us?
☐ Yes
☐ No
6. If you are part of Department of Transportation or Transit Agency, do you have a formal
process to review the cost estimates prepared by consultants and contractors?
☐ Yes
☐ No
7. Please provide the final estimated and actual cost for the design and construction phase of
the project.
Estimated Cost ($) Actual Cost ($)

NCHRP 20-65 Task 53
110
Design Cost _________________ _________________
Construction Cost _________________ _________________

NCHRP 20-65 Task 53
111
8. Please provide the cost percentages of the following construction systems.
System Cost (%)
Building Sitework (Site Preparation, Site Improvements,
Site Mechanical Utilities, Site Electrical Utilities, Other Site
Construction)
_________________
Substructure (Foundations, Basement Construction) _________________
Shell (Superstructure, Exterior Enclosure, Roofing) _________________
Interiors (Interior Construction, Stairs, Interior Finishes) _________________
Services (Conveying, Plumbing, HVAC, Fire Protection,
Electrical) _________________
Equipment & Furnishings (Equipment, Furnishings) _________________
Special Construction & Demolition (Special Construction,
Selective Building Demolition) _________________
100%
9. What method was used to estimate the design cost?
☐ Similar Projects
☐ Hours to Design
☐ Historical Percentage of Construction Cost
☐ Other (Please Explain) _______________
10. What method was used to estimate the Construction cost?
☐ Similar Projects
☐ Historical Bid Data
☐ Other (Please Explain) ________________
11. What were the major scope and site related factors that you considered when preparing the
estimate for design cost for this project?
12. What were the major scope and site related factors that you considered when preparing the
estimate for construction cost for this project?

NCHRP 20-65 Task 53
112
13. If there were costs overruns for the project, what were the main reasons? If not, what were
the success factors?
Schedule
14. Please provide the estimated/actual schedule for the design and construction phase of the
project.
Months Actual Months
Design Schedule _________________ _________________
Construction Schedule _________________ _________________
15. Was there any delay in the planning, permitting, design, construction or startup process?
☐ Yes
☐ No
16. If yes, what were the main reasons? If not, what were the success factors in this project?
17. What were the major difficulties when developing a schedule for this project?
Risk
18. Was any type of formal risk management process used on this project (e.g., risk
identification workshop, maintenance of a risk register, etc.)?
☐ Yes
☐ No
19. If yes, please explain how the risk management process supported the cost estimating
process.
20. What method was used to estimate the construction contingency?
☐ Percentage of Construction Cost
☐ Review of Project Risks and Bottom-Up Contingency Estimate
☐ Other (Please Explain) _______________
21. What were the unique risk factors of this project that impacted project cost?

NCHRP 20-65 Task 53
113
Change Orders
22. Were there any design change orders?
☐ Yes
☐ No
23. If yes, how did the change orders impact design cost? ($) _______________
24. Were there any construction change orders?
☐ Yes
☐ No
25. If yes, how did the change orders impacted construction cost? ($) ___________
26. Were there any disputes and claims in this project?
☐ Yes
☐ No
27. If yes, in which area?
☐ Construction documents
☐ Subsurface conditions
☐ Change orders
☐ Delays
☐ Accelerated Schedules
☐Other (Please Explain) _______________
Other
28. Were there any problems with the site conditions of this project?
☐ Yes
☐ No
29. If yes, please explain_______________
30. If you could convey one lesson learned about estimating this project to future estimators,
what would it be?
31. If possible, please attach the summary of project cost estimate file.

NCHRP 20-65 Task 53
114
blank page

NCHRP 20-65 Task 53
115
Appendix D
THE FIRST ROUND SURVEY PROTOCOL
Background
Estimating the cost of project design and construction is a challenge. At the same time
consistent, reliable, and accurate cost estimates are critically important because agencies (or
recipients of Federal funds) use estimates to make key program decisions. Early cost estimates
are often the most critical as these estimates support financial decisions to proceed with project
design and eventually construction. However, agencies must prepare these estimates when there
is limited project scope information.
Our research team is currently studying cost estimation methods for design and construction of
rural and small urban transit facilities. This study aims to provide guidance to state transit
agencies in assisting their sub-recipients with preparing and/or reviewing the accuracy of design
and construction cost estimates. Our goal is to construct an appropriate database of historical
cost elements and a standard estimating methodology to assist agencies in developing their cost
estimates.
Dr. Stuart Anderson, Texas A&M University, is the Principal Investigator (PI) for this study.
Dr. Keith Molenaar, University of Colorado, and Dr. Clifford Schexnayder, Arizona State
University, are the Co-PIs. Our contact information is:
Dr. Stuart Anderson: 979-845-2407, [email protected],
Dr. Keith Molenaar: 303-735-4276, [email protected],
Dr. Clifford Schexnayder: 202-997-7246, [email protected].
The research team requests that this questionnaire be completed by DATE. The questionnaire is
voluntary and research team will hold the data collected in strict confidence as follows:
Participating in this survey is voluntary.
The data provided by participants in this questionnaire will be confidential and used only
for research purposes.
Provided data will not be communicated in any form to any organization other than
authorized academic researchers and designated staff members working on the project.
To protect the confidentiality of individuals submitting data, only aggregated data will be
presented and published in the report to the National Cooperative Highway Research
Program or presentations.
Survey Instruction
This research project focuses on transit facility projects serving rural and/or small urban areas
with population of less than 200,000 people. These transit facility projects might have one or
more of the following functionalities:

NCHRP 20-65 Task 53
116
Operations and maintenance facilities (administration, general purpose, maintenance, and
vehicle storage),
Large passenger facilities (park and ride, terminal or garage, transit center, and intercity
bus terminal),
Small passenger facilities (sheltered bus stop, unsheltered bus stop, and sign-only bus
stop).
If your agency has constructed any types of the above facilities in the past five years, we do
appreciate your participation in this study.
Survey Declaration
I understand the above information and voluntarily consent to participate in the project
entitled NCHRP Project 20-65/Task 53 - Independent Cost Estimates for Design and
Construction of Rural and Small Urban Transit Facilities.
☐ Yes
☐ No (Please Cancel the Survey)
Completion of the following questionnaire requires basic knowledge related to cost
estimating practices for rural and small urban transit facility projects. Please select the
continue option below if you have this knowledge. If this is not your area of expertise, select
the cancel option and kindly forward the questionnaire to an appropriate colleague.
☐ Continue
By selecting continue, I acknowledge that my answers may be anonymously used as part of
this study.
We are asking for your email so we may contact you if we need to clarify your responses and
to copy you on the results of this study when completed.
Email Address:
☐ Please do not contact me with the results
☐ I am available for additional questions
Respondent Information
Full Name:
Agency Name:
Agency Type:
☐ Department of Transportation
☐ Transit Agency
☐ Consultant

NCHRP 20-65 Task 53
117
☐ Other (Please Explain) _________________
Organization Unit and/or Job Title:
How many years have you been involved with rural and small urban transit facility projects?
General Project Information
Project Name:
Project location (City, State): ______
Start of design (month/year): ______
Start of construction (month/year): _______
Project Owner(s):
Funding Source(s):
☐ Federal program 5309
☐ Federal program 5310
☐ Federal program 5311
☐ Federal program 5316
☐ Federal program 5317
☐ The American Recovery and Reinvestment Act’s funding
☐ Funding provided by state DOT
☐ Other (Please Explain) _________________
Project Delivery Method:
☐ Design-Bid-Build
☐ Design-Build
☐ Construction Manager at Risk
☐ Other (Please Explain) _________________
Design Contract Type:
☐ Lump Sum Contract (based on % of estimated construction costs)
☐ Unit Price (based on Design Hours times Hourly Rate)
☐ Cost plus Fee (Cost Reimbursement)
☐ Incentive Contracts
☐ Other (Please Explain) _________________
Construction Contract Type:

NCHRP 20-65 Task 53
118
☐ Unit Price Contract
☐ Lump Sum Contract
☐ Cost plus Fee (Cost Reimbursement)
☐ Incentive Contracts
☐ Other (Please Explain) _________________
Project Construction Location:
☐Rural Transit facility (Rural transit projects tend to be relatively small in scope
(i.e., often less than $2,000,000) and located in areas with a population of less
than 50,000 people.)
☐Small Urban Transit Facility (Urban transit projects often cost more than
$2,000,000 and located in areas with a population of 50,000 to 199,999 people.)
☐Urban Transit Facility (Urban transit projects often cost more than $2,000,000
and located in areas with a population of more than 200,000 people.)
Characteristics of the projects
1. Which of the following classifications best describes the project in question? (Please select
as many as apply.)
☐ Administration
☐ Operations
☐ Maintenance
☐ Vehicle Storage
☐ Large Passenger Facilities
☐ Small Passenger Facility
☐ Park and ride
☐ Shelter bus stop
☐ Un-shelter bus stop
☐ Sign-only bus stop
☐ Other (Please Explain) _________________
2. What is the total size of the project in square foot (sf)? ____________
3. What were the main facility systems and elements? (Please select all that apply.)
Building Sitework
☐ Site Preparation
☐ Site Improvements
☐ Site Mechanical Utilities
☐ Site Electrical Utilities
☐ Other Site Construction

NCHRP 20-65 Task 53
119
Substructure
☐ Foundations
☐ Basement Construction (Basement Excavation, Basement Walls)
Shell
☐ Super Structure
☐ Exterior Enclosure
☐ Roofing
Interiors
☐ Interior Construction
☐ Stairs
☐ Interior Finishes
Services
☐ Conveying (Elevators & Lifts, Escalators & Moving Walks, Other Conveying
Systems)
☐ Plumbing
☐ HVAC
☐ Fire Protection
☐ Electrical
Equipment & Furnishings
☐ Equipment
☐ Furnishings
Special Construction & Demolition
☐ Special Construction
☐ Selective Building Demolition
☐ Other (Please Explain) ______________
Cost Estimating
4. What type of historical cost database was used to prepare the cost estimate?
☐In-House Database
☐Published Database (e.g. RS Means)
☐Both In-House and Published Databases
☐Cost Data from Similar Projects
☐Other (Please Explain) _______________
5. Would you share your agency’s cost database with us?
☐ Yes
☐ No
6. If you are part of Department of Transportation or Transit Agency, do you have a formal
process to review the cost estimates prepared by consultants and contractors?
☐ Yes

NCHRP 20-65 Task 53
120
☐ No
7. Please provide the final estimated and actual cost for the design and construction phase of the
project.
Estimated Cost ($) Actual Cost ($)
Design Cost _________________ _________________
Construction Cost _________________ _________________
8. Please provide the percentages of construction cost for the following construction systems.
Construction Cost
(%)
Building Sitework (Site Preparation, Site Improvements,
Site Mechanical Utilities, Site Electrical Utilities, Other Site
Construction)
_________________
Substructure (Foundations, Basement Construction) _________________
Shell (Superstructure, Exterior Enclosure, Roofing) _________________
Interiors (Interior Construction, Stairs, Interior Finishes) _________________
Services (Conveying, Plumbing, HVAC, Fire Protection,
Electrical) _________________
Equipment & Furnishings (Equipment, Furnishings) _________________
Special Construction & Demolition (Special Construction,
Selective Building Demolition) _________________
100%
9. What method was used to estimate the design cost?
☐ Similar Projects
☐ Hours to Design
☐ Historical Percentage of Construction Cost (What is the percentage? ____%)
☐ Other (Please Explain) _______________
10. What method was used to estimate the Construction cost?
☐ Similar Projects
☐ Historical Bid Data
☐ Other (Please Explain) ________________
11. If there were cost overruns for the project, what were the main reasons?

NCHRP 20-65 Task 53
121
☐ Environmental issues
☐ Unexpected underground conditions
☐ Soil conditions
☐ Archeological requirements
☐ Unexpected weather conditions (i.e., snow, hurricanes)
☐ Increased scope
☐ Lack of bidding competition
☐ Bidding time
☐ Complaint from neighborhood
☐ Project complexity
☐ Higher transportation expenses
☐ Omissions and errors in design
☐ Other (Please Explain) _______________
12. If there were no cost overruns for the project, what were the success factors?
☐ Hire an experienced construction consultant to perform cost estimating
☐ Advice from State DOT
☐ Good weather conditions (i.e. mild winter)
☐ Good and experienced contractors
☐ Low project complexity
☐ No change orders
☐ No claims and disputes
☐ Additional funding provided
☐ Other (Please Explain) _______________
Schedule
13. Please provide the estimated/actual schedule for the design and construction phase of the
project.
Estimated Months Actual Months
Design Schedule _________________ _________________
Construction Schedule _________________ _________________
14. Was there any delay in the planning, permitting, design, construction or startup process?
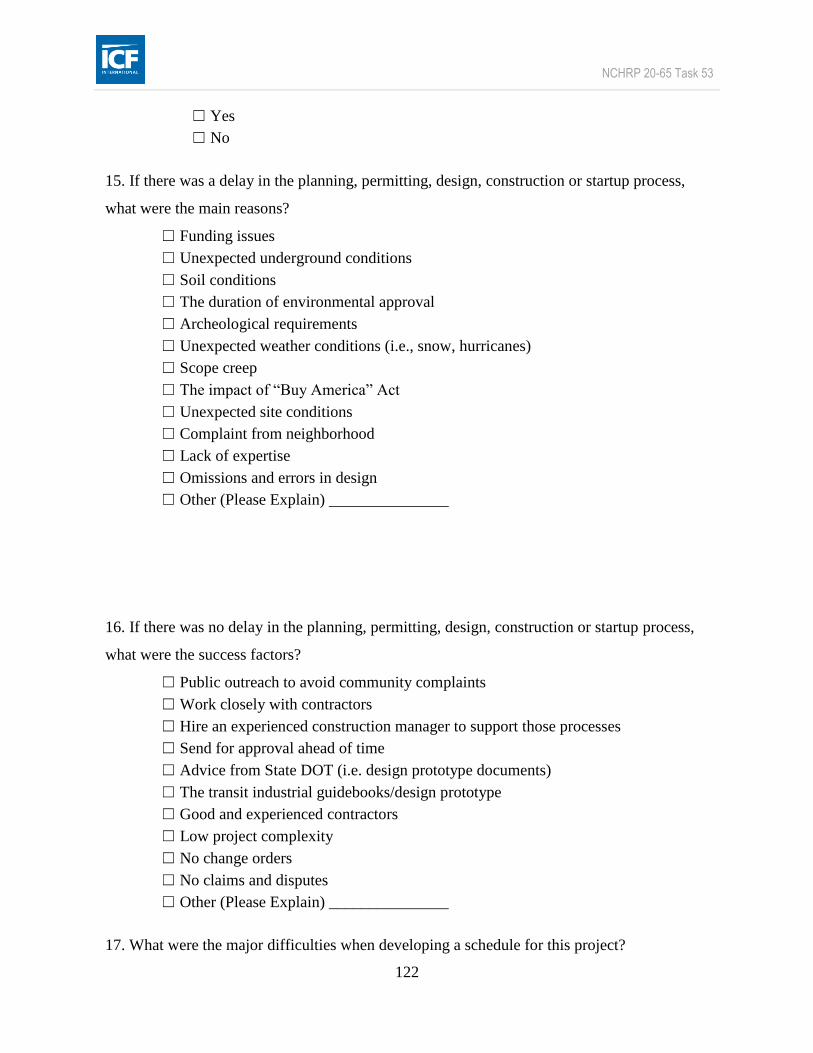
NCHRP 20-65 Task 53
122
☐ Yes
☐ No
15. If there was a delay in the planning, permitting, design, construction or startup process,
what were the main reasons?
☐ Funding issues
☐ Unexpected underground conditions
☐ Soil conditions
☐ The duration of environmental approval
☐ Archeological requirements
☐ Unexpected weather conditions (i.e., snow, hurricanes)
☐ Scope creep
☐ The impact of “Buy America” Act
☐ Unexpected site conditions
☐ Complaint from neighborhood
☐ Lack of expertise
☐ Omissions and errors in design
☐ Other (Please Explain) _______________
16. If there was no delay in the planning, permitting, design, construction or startup process,
what were the success factors?
☐ Public outreach to avoid community complaints
☐ Work closely with contractors
☐ Hire an experienced construction manager to support those processes
☐ Send for approval ahead of time
☐ Advice from State DOT (i.e. design prototype documents)
☐ The transit industrial guidebooks/design prototype
☐ Good and experienced contractors
☐ Low project complexity
☐ No change orders
☐ No claims and disputes
☐ Other (Please Explain) _______________
17. What were the major difficulties when developing a schedule for this project?

NCHRP 20-65 Task 53
123
☐ Funding issues
☐ Contractors’ previous design and construction experience
☐ Project complexity
☐ Scope creep
☐ The impact of “Buy America” Act
☐ Lack of expertise
☐ Other (Please Explain) _______________
Risk
18. What were the major risk factors of this project?
19. Was any type of formal risk management process used on this project (e.g., risk
identification workshop, maintenance of a risk register, etc.)?
☐ Yes
☐ No
20. If yes, please explain how the risk management process supported the cost estimating
process.
☐ Risk identification workshops
☐ Maintenance of risk register
☐ Risk assessment workshops (both quantitative and qualitative analyses)
☐ Hire expert modelers
☐ Risk mitigation workshops
☐ Other (Please Explain) _______________
21. What method was used to estimate the construction contingency?
☐ Percentage of Construction Cost (What is the percentage? _____%)
☐ Review of Project Risks and Bottom-Up Contingency Estimate
☐ Other (Please Explain) ______________
Change Orders
22. Were there any design change orders?

NCHRP 20-65 Task 53
124
☐ Yes
☐ No
23. If yes, how did the change orders impact design cost? ($) _______________
24. Were there any construction change orders?
☐ Yes
☐ No
25. If yes, how did the change orders impacted construction cost? ($) ___________
26. Were there any disputes and claims in this project?
☐ Yes
☐ No
27. If yes, in which area?
☐ Construction documents
☐ Subsurface conditions
☐ Change orders
☐ Delays
☐ Accelerated Schedules
☐Other (Please Explain) _______________
Other
28. If you could convey one lesson learned about estimating this project to future estimators,
what would it be?

NCHRP 20-65 Task 53
125
Appendix E
THE SHORTENED SURVEY
Background
Our research team is currently studying cost estimation methods for design and construction of
rural and small urban transit facilities. This study aims to provide guidance to state transit
agencies in assisting their sub-recipients with preparing and/or reviewing the accuracy of design
and construction cost estimates. Our goal is to construct an appropriate database of historical
cost elements and a standard estimating methodology to assist agencies in developing their cost
estimates.
Dr. Stuart Anderson, Texas A&M University, is the Principal Investigator (PI) for this study.
Dr. Keith Molenaar, University of Colorado, and Dr. Clifford Schexnayder, Arizona State
University, are the Co-PIs. Our contact information is:
Dr. Stuart Anderson: 979-845-2407, [email protected],
Dr. Keith Molenaar: 303-735-4276, [email protected],
Dr. Clifford Schexnayder: 202-997-7246, [email protected].
The research team requests that this questionnaire be completed by DATE. The questionnaire is
voluntary and research team will hold the data collected in strict confidence as follows:
Participating in this survey is voluntary.
The data provided by participants in this questionnaire will be confidential and used only
for research purposes.
Provided data will not be communicated in any form to any organization other than
authorized academic researchers and designated staff members working on the project.
To protect the confidentiality of individuals submitting data, only aggregated data will be
presented and published in the report to the National Cooperative Highway Research
Program or presentations.
Survey Instruction
This research project focuses on transit facility projects serving rural and/or small urban areas
with population of less than 200,000 people. These transit facility projects might have one or
more of the following functionalities:
Operations and maintenance facilities (administration, general purpose, maintenance, and
vehicle storage),

NCHRP 20-65 Task 53
126
Large passenger facilities (park and ride, terminal or garage, transit center, and intercity
bus terminal),
Small passenger facilities (sheltered bus stop, unsheltered bus stop, and sign-only bus
stop).
If your agency has constructed any types of the above facilities in the past five years, we do
appreciate your participation in this study.
We are asking for your email so we may contact you if we need to clarify your responses and
to copy you on the results of this study when completed.
Email Address:
☐ Please do not contact me with the results
☐ I am available for additional questions
Respondent Information
Full Name:
Agency Name:
Agency Type:
☐ Department of Transportation
☐ Transit Agency
☐ Consultant
☐ Other (Please Explain) _________________
Organization Unit and/or Job Title:
How many years have you been involved with rural and small urban transit facility projects?
General Project Information
Project Name:
Project location (City, State): ______
Project Owner(s):
Funding Source(s):
☐ Federal program 5309
☐ Federal program 5310
☐ Federal program 5311
☐ Federal program 5316
☐ Federal program 5317

NCHRP 20-65 Task 53
127
☐ The American Recovery and Reinvestment Act’s funding
☐ Funding provided by state DOT
☐ Other (Please Explain) _________________
Design Contract Type:
☐ Lump Sum Contract (based on % of estimated construction costs)
☐ Unit Price (based on Design Hours times Hourly Rate)
☐ Cost plus Fee (Cost Reimbursement)
☐ Incentive Contracts
☐ Other (Please Explain) _________________
Construction Contract Type:
☐ Unit Price Contract
☐ Lump Sum Contract
☐ Cost plus Fee (Cost Reimbursement)
☐ Incentive Contracts
☐ Other (Please Explain) _________________
Project Construction Location:
☐Rural Transit facility (Rural transit projects tend to be relatively small in scope
(i.e., often less than $2,000,000) and located in areas with a population of less
than 50,000 people.)
☐Small Urban Transit Facility (Urban transit projects often cost more than
$2,000,000 and located in areas with a population of 50,000 to 199,999 people.)
☐Urban Transit Facility (Urban transit projects often cost more than $2,000,000
and located in areas with a population of more than 200,000 people.)
Characteristics of the projects
1. Which of the following classifications best describes the project in question? (Please select
as many as apply.)
☐ Administration
☐ Operations
☐ Maintenance
☐ Vehicle Storage
☐ Large Passenger Facilities
☐ Small Passenger Facility

NCHRP 20-65 Task 53
128
☐ Park and ride
☐ Shelter bus stop
☐ Un-shelter bus stop
☐ Sign-only bus stop
☐ Other (Please Explain) _________________
2. What is the total size of the project in square foot (sf)? ____________
3. What were the main facility systems and elements? (Please select all that apply.)
Building Sitework
☐ Site Preparation
☐ Site Improvements
☐ Site Mechanical Utilities
☐ Site Electrical Utilities
☐ Other Site Construction
Substructure
☐ Foundations
☐ Basement Construction (Basement Excavation, Basement Walls)
Shell
☐ Super Structure
☐ Exterior Enclosure
☐ Roofing
Interiors
☐ Interior Construction
☐ Stairs
☐ Interior Finishes
Services
☐ Conveying (Elevators & Lifts, Escalators & Moving Walks, Other Conveying
Systems)
☐ Plumbing
☐ HVAC
☐ Fire Protection
☐ Electrical
Equipment & Furnishings
☐ Equipment
☐ Furnishings
Special Construction & Demolition
☐ Special Construction
☐ Selective Building Demolition
☐ Other (Please Explain) ______________
Cost Estimating

NCHRP 20-65 Task 53
129
4. What method was used to estimate the design cost?
☐ Similar Projects
☐ Hours to Design
☐ Historical Percentage of Construction Cost (What is the percentage? ____%)
☐ Other (Please Explain) _______________
5. What method was used to estimate the Construction cost?
☐ Similar Projects (if No please skip question #6
☐ Historical Bid Data (if Yes please answer question #6)
☐ Other (Please Explain) ________________
6. What type of historical cost database was used to prepare the cost estimate?
☐In-House Database
☐Published Database (e.g. RS Means)
☐Both In-House and Published Databases
☐Cost Data from Similar Projects
☐Other (Please Explain) _______________
7. If you are part of Department of Transportation or Transit Agency, do you have a formal
process to review the cost estimates prepared by consultants and contractors?
☐ Yes
☐ No
8. Please provide the final estimated and actual cost for the design and construction phase of the
project (gross number).
Estimated Cost ($) Actual Cost ($)
Design Cost _________________ _________________
Construction Cost _________________ _________________
9. If there were cost overruns for the project, what were the main reasons?

NCHRP 20-65 Task 53
130
☐ Environmental issues
☐ Unexpected underground conditions
☐ Soil conditions
☐ Archeological requirements
☐ Unexpected weather conditions (i.e., snow, hurricanes)
☐ Increased scope
☐ Lack of bidding competition
☐ Bidding time
☐ Complaint from neighborhood
☐ Project complexity
☐ Higher transportation expenses
☐ Omissions and errors in design
☐ Other (Please Explain) _______________

NCHRP 20-65 Task 53
131
10. Please provide the percentages of construction cost for the following construction systems.
Construction Cost
(%)
Building Sitework (Site Preparation, Site Improvements,
Site Mechanical Utilities, Site Electrical Utilities, Other Site
Construction)
_________________
Substructure (Foundations, Basement Construction) _________________
Shell (Superstructure, Exterior Enclosure, Roofing) _________________
Interiors (Interior Construction, Stairs, Interior Finishes) _________________
Services (Conveying, Plumbing, HVAC, Fire Protection,
Electrical) _________________
Equipment & Furnishings (Equipment, Furnishings) _________________
Special Construction & Demolition (Special Construction,
Selective Building Demolition) _________________
100%
Schedule
11. Start of design (month/year): ______
12. Completion of design (month/year):
13. Start of construction (month/year): _______
14.Completion of construction (month/year):
Risk
15. What were the major risk factors of this project?
16. What method was used to estimate the construction contingency?
☐ Percentage of Construction Cost (What is the percentage? _____%)

NCHRP 20-65 Task 53
132
☐ Review of Project Risks and Bottom-Up Contingency Estimate
☐ Other (Please Explain) ______________
Other
17. If you could convey one lesson learned about estimating this project to future estimators,
what would it be?
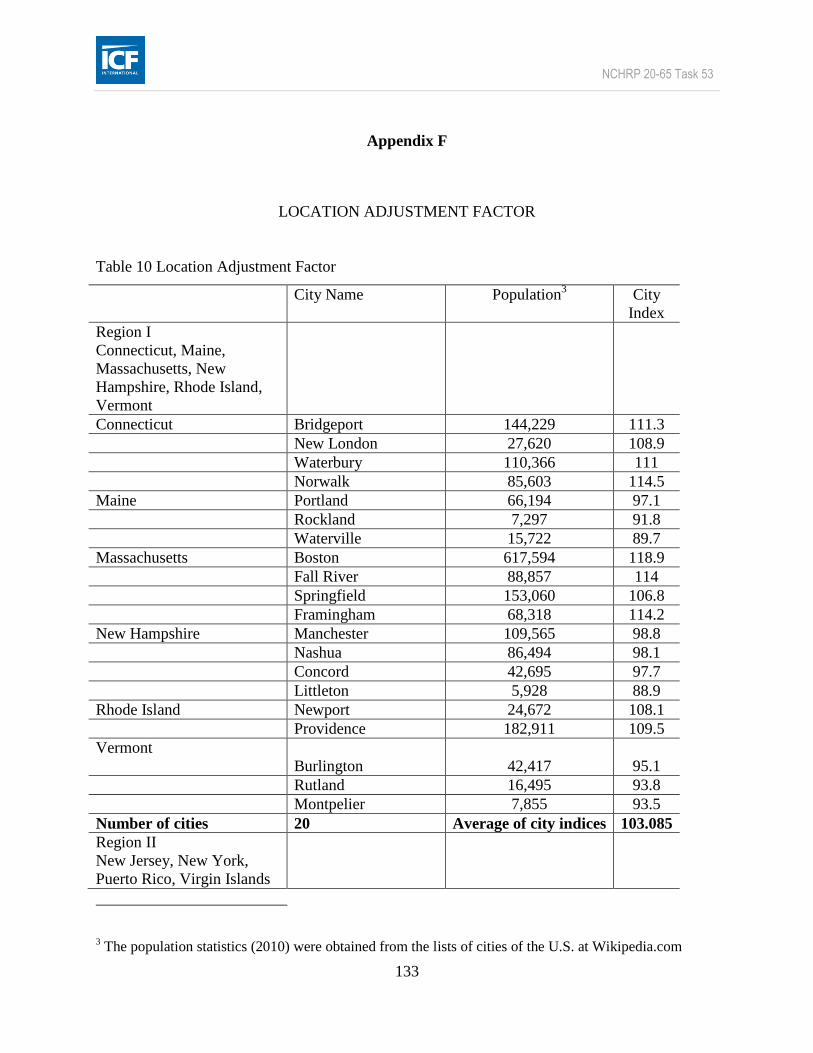
NCHRP 20-65 Task 53
133
Appendix F
LOCATION ADJUSTMENT FACTOR
Table 10 Location Adjustment Factor
City Name Population3 City
Index
Region I
Connecticut, Maine,
Massachusetts, New
Hampshire, Rhode Island,
Vermont
Connecticut Bridgeport 144,229 111.3
New London 27,620 108.9
Waterbury 110,366 111
Norwalk 85,603 114.5
Maine Portland 66,194 97.1
Rockland 7,297 91.8
Waterville 15,722 89.7
Massachusetts Boston 617,594 118.9
Fall River 88,857 114
Springfield 153,060 106.8
Framingham 68,318 114.2
New Hampshire Manchester 109,565 98.8
Nashua 86,494 98.1
Concord 42,695 97.7
Littleton 5,928 88.9
Rhode Island Newport 24,672 108.1
Providence 182,911 109.5
Vermont
Burlington 42,417 95.1
Rutland 16,495 93.8
Montpelier 7,855 93.5
Number of cities 20 Average of city indices 103.085
Region II
New Jersey, New York,
Puerto Rico, Virgin Islands
3 The population statistics (2010) were obtained from the lists of cities of the U.S. at Wikipedia.com

NCHRP 20-65 Task 53
134
New Jersey
Newark 277,140 114.7
Atlantic City 39,558 110.9
Elizabeth 124,969 112.7
Trenton 124,969 112.7
New Brunswick 55,181 113.1
Jersey City 247,597 112.6
Paterson 146,199 113.3
Vineland 60,724 110.5
Hackensack 43,010 112.5
Summit 21,457 112.3
New York Albany 97,660 102
New York 8,244,910 133.1
Jamestown 31,020 93.1
Elmira 29,204 97.2
Mount Vernon 67,780 117.8
Glens Falls 14,728 94.4
Syracuse 145,151 98.8
Watertown 27,423 96.2
Poughkeepsie 32,790 113
Puerto Rico Puerto Rico 3,725,789 80.4
Number of cities 20 Average of city indices 107.565
Region III
Delaware, District of
Columbia, Maryland,
Pennsylvania, Virginia,
West Virginia
Delaware Wilmington 71,305 104.5
Newark 31,618 104.2
Dover 36,560 104.6
District of Columbia N/A
Maryland
Baltimore 619,493 93.2
Cumberland 20,739 90.9
Salisbury 30,484 83.4
Elkton 15,443 90
Pennsylvania
Philadelphia 1,526,006 115.4
Pittsburgh 305,704 102.9
Reading 88,082 100.1
York 43,718 97.9
Virginia
Norfolk 245,782 87.4

NCHRP 20-65 Task 53
135
Portsmouth 96,470 85.3
Richmond 210,309 87.7
Winchester 26,881 92.3
Fairfax 23,461 93.7
West Virginia
Charleston 51,400 97.9
Huntington 49,138 99.2
Martinsburg 17,227 93.9
Romney 1,848 95.7
Number of cities 20 Average of city indices 96.01
Region IV
Alabama, Florida, Georgia,
Kentucky, Mississippi,
North Carolina, South
Carolina, Tennessee
Alabama Anniston 23,106 82.5
Mobile 195,111 84.8
Selma 20,756 77.2
Florida Jacksonville 823,316 85
Pensacola 51,923 84.8
Tampa 335,709 91.1
Georgia Atlanta 443,775 88.2
Columbus 197,872 84.6
Statesboro 29,779 80
Kentucky Louisville 597,337 92.5
Somerset 11,196 88.5
Mississippi Columbus 23,640 79.6
Jackson 173,514 84.4
North Carolina Charlotte 731,424 82.3
Rocky Mount 57,477 78.4
South Carolina Columbia 130,591 80.8
Aiken 29,627 86
Tennessee Memphis 655,155 87.8
Chattanooga 171,279 86.5
Cookeville 31,010 81.5
Number of cities 20 Average of city indices 84.325
Region V
Illinois, Indiana, Michigan,
Minnesota, Ohio, Wisconsin
Illinois Bloomington 76,610 103.8
Kankakee 27,537 111.2
Chicago 2,695,598 118.4

NCHRP 20-65 Task 53
136
Indiana Columbus 787,033 90.5
Fort Wayne 253,691 89.9
Washington 11,739 90.7
Michigan Detroit 713,777 103.7
Muskegon 38,401 92
Jackson 33,534 96.6
Minnesota Minneapolis 382,578 109.7
St. Cloud 65,842 106.6
Windom 4,646 95.2
Mankato 39,309 99.9
Ohio Columbus 787,033 95.6
Lima 38,771 95
Marion 36,837 90.9
Wisconsin Madison 233,209 100.6
Green Bay 104,057 98.9
Lancaster 3,868 96.2
Milwaukee 594,833 104.5
Number of cities 20 Average of city indices 99.495
Region VI
Arkansas, Louisiana, New
Mexico, Oklahoma, Texas
Arkansas Little Rock 193,524 83.7
Fayetteville 76,899 75.7
Hot Springs 35,193 77.1
Harrison 12,943 76.2
Louisiana New Orleans 343,829 88.3
Lafayette 120,623 83.8
Monroe 48,815 81
Thibodaux 14,566 85
New Mexico Albuquerque 555,417 88.5
Farmington 45,854 88.7
Socorro 9,051 87.4
Tucumcari 5,363 88.6
Oklahoma Oklahoma City 599,476 84.9
Tulsa 391,906 82.9
Woodward 12,051 83.1
Ponca City 25,387 81.3
Texas Houston 2,160,821 87.5
Dallas 1,241,162 85.7
Bryan 78,061 81.5
Victoria 64,376 75
Number of cities 20 Average of city indices 83.295
Region VII

NCHRP 20-65 Task 53
137
Iowa, Kansas, Missouri,
Nebraska
Iowa Des Moines 203,433 93.7
Cedar Rapids 126,326 93.6
Burlington 25,663 88.7
Creston 7,834 89.4
Sibley 2,798 80.9
Kansas Wichita 385,577 86.4
Kansas City 147,268 98.7
Topeka 127,939 86.3
Salina 48,045 87.2
Hays 20,993 85.5
Missouri St. Louis 319,294 103.7
Kansas City 459,787 104.8
Rolla 19,559 96.9
Sikeston 16,318 95.1
Joplin 50,150 92.3
Nebraska Omaha 421,570 91.3
Alliance 8,499 88.6
Grand Island 49,989 90.7
McCook 7,652 87.5
Norfolk 24,332 90.3
Number of cities 20 Average of city indices 91.58
Region VIII
Colorado, Montana, North
Dakota, South Dakota,
Utah, Wyoming
Colorado Alamosa 8,780 90.6
Denver 600,158 94
Greeley 92,889 90.1
Montana Great Falls 58,505 92.6
Wolf Point 2,621 90.5
Billings 106,954 92.2
Helena 28,190 90.7
North Dakota Fargo 105,549 88
Jamestown 15,427 77.5
Williston 14,716 82.6
South Dakota Sioux Falls 153,888 82.9
Watertown 21,482 78.4
Mitchell 15,254 77.5
Utah Salt Lake City 186,440 88
Price 8,715 85.4

NCHRP 20-65 Task 53
138
Logan 48,174 87.6
Wyoming Cheyenne 59,466 86.3
Rawlins 9,259 87.2
Wheatland 3,627 85
Rock Springs 23,036 87.5
Number of cities 20 Average of city indices 86.73
Region IX
Arizona, California, Hawaii,
Nevada
Arizona Phoenix 1,445,632 89.5
Show Low 10,660 88.8
Tucson 520,116 88
Kingman 28,068 87.4
Flagstaff 65,870 89.4
Berkeley 112,580 117.2
Stockton 291,707 108.6
California Los Angeles 3,792,621 108
Oxnard 197,899 106.8
Redding 89,861 110
Salinas 150,441 110.5
San Luis Obispo 45,119 105.5
Hawaii Hilo 43,263 116.6
Honolulu 390,738 119.1
States & Poss. Guam 159,358 100.8
Nevada Las Vegas 589,317 104.9
Reno 227,511 97.3
Carson City 55,439 97.3
Elko 18,546 93.1
Ely 4,288 101.3
Number of cities 20 Average of city indices 102.005
Region X
Alaska, Idaho, Oregon,
Washington
Alaska Anchorage 291,826 119.8
Fairbanks 31,535 119.9
Juneau 31,275 120.1
Ketchikan 8,050 126.1
Idaho Boise 205,671 91.5
Coeur d'Alene 44,137 97.7
Idaho Falls 56,813 89.6
Lewiston 31,894 99.3
Pocatello 54,255 91.7
Oregon Bend 76,639 99.8
Eugene 156,185 99.6

NCHRP 20-65 Task 53
139
Portland 583,776 100.1
Vale 1,874 91.7
Medford 74,907 99.4
Washington Clarkston 7,229 92.8
Olympia 46,478 101.1
Seattle 608,660 104.3
Tacoma 198,397 102
Yakima 91,067 99.9
Wenatchee 31,925 96.1
Number of cities 20 Average of city indices 102.125

NCHRP 20-65 Task 53
140

NCHRP 20-65 Task 53
141
Appendix G
TOOL REVIEW PROTOCOL
As part of National Cooperative Highway Research Program (NCHRP) project 20-65, Task 53,
this research focuses on the development of “Independent Cost Estimates for Design and
Construction of Rural and Small Urban Transit Facilities.” The work is being conducted by the
Texas A&M Transportation Institute (TTI). The research products include a database of
historical cost elements and a cost estimating tool. The purpose of the cost estimating tool is to
assist state transportation agencies (STAs) with the distribution and management of funding for
rural and small urban facilities. It should also assist transit operators when they apply for funds
from rural transit assistance program. This cost estimating prototype tool was developed based
on the limited amount of valid historical cost data currently available.
The research team thanks you for your previous participation in the interview and (or) online
survey. Now the research team is inviting you to review the prototype tool by estimating a
project and provide us your suggestions on revising the tool by answering the following
questions. It would be appreciated if you can send us your feedback by DATE
Again, the research team thanks you for your time and feedback in advance.
1. Is it easy to navigate the tool by following the instructions provided? If you have any difficulty,
please explain the issue and provide your suggestions for improvement.
2. Do you think the User’s Guide is self-explanatory and comprehensive? Did you have any
difficulty in understanding how to set the following variables?

NCHRP 20-65 Task 53
142
• Inflation factor,
• Location adjustment factor, and
• Contingency (%)
Do you think the default values are appropriate? Please list any difficulties you experienced.
3. Did you have any difficulty in completing the project information section? Do you think the
suggestion and instruction concerning the contingency setting are helpful?
4. Do you think the estimates report clearly shows you the base construction estimates,
contingency range, total construction cost, design cost, and construction cost for each
construction system? If you have any suggestions, please list here.
5. Do you think the Estimates Details section is helpful for you to understand the adjustment
factors and calculations of the construction and design costs? If there was any cause for
confusion, please list your suggestions for correcting the situation below.
6. If more actual cost data is captured and there is a more refined differentiation of types of
facilities with the appropriate cost data, would the cost estimating tool be helpful for your agency?
☐ Yes

NCHRP 20-65 Task 53
143
☐ No
Please explain the reasons below.

NCHRP 20-65 Task 53
144

NCHRP 20-65 Task 53
145
Appendix H
COST ESTIMATING PROCESS
Table 11 shows the five steps of cost estimating process with descriptions.
Table 11 Steps of Cost Estimating Process
Cost Estimation Step Description
Determine Estimate Basis Document project type and scope, including
scope documents;
drawings that are available (defining percent
engineering and design completion);
project design parameters;
project complexity;
unique project location characteristics; and
disciplines required to prepare the cost estimate.
Prepare Base Estimate Prepare estimate, including
documentation of estimate assumptions, types of
cost data, and adjustments to cost data;
application of appropriate estimation techniques,
parameters, and cost data consistent with level of
scope definition;
coverage of all known project elements;
coverage of all known project conditions; and
checking of key ratios to ensure that estimates are
consistent with past experience.
Determine Risk and Set
Contingency
Identify and quantify areas of uncertainty related to
project knowns and unknowns,
potential risks associated with these uncertainties,
and
appropriate level of contingency congruent with
project risks.
Review and Approve Estimate Review estimate basis and assumptions, including
methods used to develop estimate parameters (e.g.,
quantities) and associated costs;
completeness of estimate relative to the project
scope;
application of cost data, including project-specific
adjustments;
reconciliation of current estimates with the baseline

NCHRP 20-65 Task 53
146
estimate (explain differences); and
preparation of an estimation file that compiles
information and data used to prepare the project
estimate.
Approve estimate include:
review of current project scope and estimate basis;
securing of approvals from appropriate management
levels;
approval of current estimates, including any changes
from previous estimates; and
release of estimate for its intended purpose and use.
Determine Estimate
Communicate Estimate
Communication approach is dependent upon the stakeholder
who is receiving the information, but should consider
mechanism for communicating the cost estimate for
its intended purpose,
level of uncertainty to be communicated in the
estimate given the information
upon which it is based, and
mechanism to communicate estimate to external
parties.