Embed Size (px)
Citation preview

NCHRP 08-36, Task 131 Transportation Data Integration to Develop Planning Performance Measures
Richard Margiotta and Dan Krechmer Cambridge Systematics, Inc. 100 Cambridge Park Drive, Suite 400 Cambridge, MA 02140
and
Bill Eisele Texas Transportation Institute
May 2017
The information contained in this report was prepared as part of NCHRP Project 08-36, Task 119, National Cooperative Highway Research Program (NCHRP). Special Note: This report IS NOT an official publication of the NCHRP, the Transportation Research Board or the National Academies.

Acknowledgements
This study was conducted for the AASHTO Standing Committee on Planning with funding provided through the National Cooperative Highway Research Program (NCHRP) Project 08-36, Research for the AASHTO Standing Committee on Planning. The NCHRP is supported by annual voluntary contributions from the state Departments of Transportation. Project 08-36 is intended to fund quick response studies on behalf of the Standing Committee on Planning. The report was prepared by Richard Margiotta of Cambridge Systematics with assistance from Bill Eisele of the Texas Transportation Institute. The work was guided by a technical working group that included the following:
• Marc S. Birnbaum, California DOT;
• Dr. Sundar Damodaran, Ontario Ministry of Transportation;
• James L. Hubbell, Mid-America Regional Council;
• Jessie X. Jones, Arkansas SHTD;
• Praveen Pasumarthy, Cambridge Systematics;
• Elizabeth Robbins, Washington State DOT;
• Marc D. Williams, Texas DOT; and
• Dr. Matthew Hardy, AASHTO (Liaison).
The project was managed by Larry Goldstein, NCHRP Senior Program Officer.
Disclaimer
The opinions and conclusions expressed or implied are those of the research agency that performed the research and are not necessarily those of the Transportation Research Board or its sponsoring agencies. This report has not been reviewed or accepted by the Transportation Research Board Executive Committee or the Governing Board of the National Research Council.

NCHRP 08-36, Task 131 Transportation Data Integration to Develop Planning Performance Measures
Cambridge Systematics, Inc. i
Table of Contents
1.0 Introduction ........................................................................................................................................ 1-1
1.1 Background ................................................................................................................................ 1-1 1.2 Project Purpose ......................................................................................................................... 1-1
2.0 Literature Review ............................................................................................................................... 2-1
2.1 Approach .................................................................................................................................... 2-1 2.2 Findings ..................................................................................................................................... 2-1 2.3 Scan of Practice ......................................................................................................................... 2-4
3.0 Practices for Nontraditional Performance Measures and Data Integration ................................. 3-1
3.1 Introduction ................................................................................................................................ 3-1 3.2 Summary of Findings ................................................................................................................. 3-1 3.3 Compendium of Nontraditional Planning Performance Measures ............................................ 3-3 3.4 Compendium of Nontraditional/Innovative Performance Measures Currently in Use ............... 3-7 3.5 Case Study: Use of Nontraditional Mobility Performance Measures and Data Integration .... 3-18 3.6 Data Challenges for Nontraditional Performance Measures ................................................... 3-19
4.0 Future Research Needs ..................................................................................................................... 4-1
4.1 Introduction ................................................................................................................................ 4-1 Appendix A. References for the Literature Review .................................................................................. A-1
Appendix B. Summary of Literature Review ............................................................................................. B-1
Appendix C. Use of Nontraditional Planning Performance Measures by Selected Agencies ............. C-1 Appendix D. State of the Practice – Nontraditional Planning Performance Measures ........................ D-1
D.1 FHWA Performance Outcomes beyond the Mainstream Peer Exchange ................................. D-1 D.2 Sustainability Performance Measures for Transportation .......................................................... D-3 D.3 Well Measured: Developing Indicators for Sustainable and Livable Transport Planning
(2016) ......................................................................................................................................... D-5 D.4 Innovative Tools and Data Sources for Mobility and Accessibility .......................................... D-13 D.5 Total Peak-Period Travel Time ................................................................................................ D-14 D.6 TOol using STAcked Data – TOSTADA .................................................................................. D-15
Appendix E. Comparison of Two Emerging Performance Measures ..................................................... E-1
E.1 Total Peak-Period Travel Time .................................................................................................. E-1 E.2 Urban Macroscopic Network Accessibility Indicator .................................................................. E-1 E.3 Comparison between the Two Performance Measures ............................................................ E-1 E.4 Conclusions ............................................................................................................................... E-4

NCHRP 08-36, Task 131 Transportation Data Integration to Develop Planning Performance Measures
Cambridge Systematics, Inc. iii
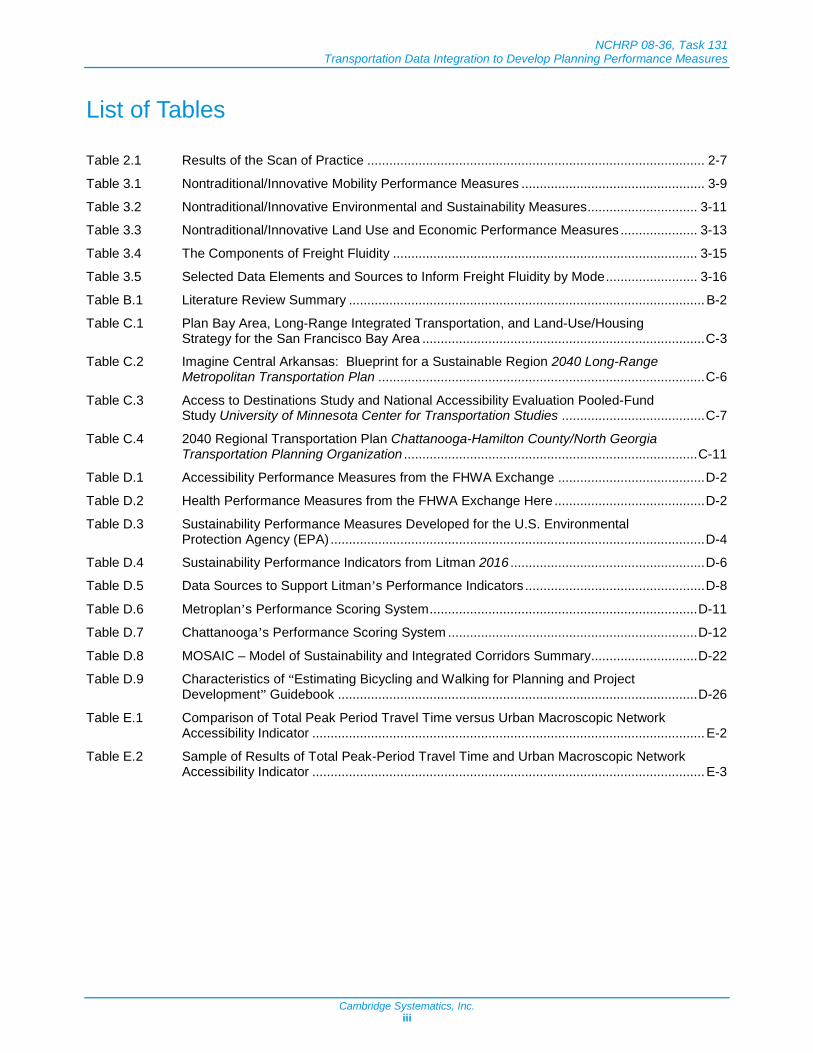
List of Tables
Table 2.1 Results of the Scan of Practice ............................................................................................ 2-7
Table 3.1 Nontraditional/Innovative Mobility Performance Measures .................................................. 3-9
Table 3.2 Nontraditional/Innovative Environmental and Sustainability Measures .............................. 3-11 Table 3.3 Nontraditional/Innovative Land Use and Economic Performance Measures ..................... 3-13
Table 3.4 The Components of Freight Fluidity ................................................................................... 3-15
Table 3.5 Selected Data Elements and Sources to Inform Freight Fluidity by Mode ......................... 3-16
Table B.1 Literature Review Summary ................................................................................................. B-2
Table C.1 Plan Bay Area, Long-Range Integrated Transportation, and Land-Use/Housing Strategy for the San Francisco Bay Area ............................................................................. C-3
Table C.2 Imagine Central Arkansas: Blueprint for a Sustainable Region 2040 Long-Range Metropolitan Transportation Plan ......................................................................................... C-6
Table C.3 Access to Destinations Study and National Accessibility Evaluation Pooled-Fund Study University of Minnesota Center for Transportation Studies ....................................... C-7
Table C.4 2040 Regional Transportation Plan Chattanooga-Hamilton County/North Georgia Transportation Planning Organization ................................................................................ C-11
Table D.1 Accessibility Performance Measures from the FHWA Exchange ........................................ D-2
Table D.2 Health Performance Measures from the FHWA Exchange Here ......................................... D-2
Table D.3 Sustainability Performance Measures Developed for the U.S. Environmental Protection Agency (EPA) ...................................................................................................... D-4
Table D.4 Sustainability Performance Indicators from Litman 2016 ..................................................... D-6 Table D.5 Data Sources to Support Litman’s Performance Indicators ................................................. D-8
Table D.6 Metroplan’s Performance Scoring System ......................................................................... D-11
Table D.7 Chattanooga’s Performance Scoring System .................................................................... D-12
Table D.8 MOSAIC – Model of Sustainability and Integrated Corridors Summary ............................. D-22 Table D.9 Characteristics of “Estimating Bicycling and Walking for Planning and Project
Development” Guidebook .................................................................................................. D-26
Table E.1 Comparison of Total Peak Period Travel Time versus Urban Macroscopic Network Accessibility Indicator ........................................................................................................... E-2
Table E.2 Sample of Results of Total Peak-Period Travel Time and Urban Macroscopic Network Accessibility Indicator ........................................................................................................... E-3


NCHRP 08-36, Task 131 Transportation Data Integration to Develop Planning Performance Measures
Cambridge Systematics, Inc. v
List of Figures
Figure 2.1 Planning Uses of Archived Data Operations ........................................................................ 2-2 Figure 3.1 Data Input for the “Next Generation” of Informed Performance Measures ......................... 3-5
Figure D.1 Bexar County Example of TOSTADA ................................................................................. D-16
Figure D.2 Tom Green County Example of TOSTADA ........................................................................ D-16 Figure D.3 External-to-External Trips Results All Vehicles .................................................................. D-19 Figure D.4 External-to-External Trips Results Noncommercial Vehicles ............................................. D-20
Figure D.5 External-to-External Trips Results Commercial Vehicles ................................................... D-20
Figure E.1 Town to Town Trips in Syracuse – Total and by Trip Purpose Adapted from Reference 12 ........................................................................................................................ E-5
Figure E.2 Comparing Trip Purpose Percent Shares Adapted from Reference 12 ............................... E-6
Figure E.3 Trip Length Frequency Distribution (TLFD) Comparison Adapted from Reference 12 ........ E-7
Figure E.4 Time-of-Day Distribution Comparison .................................................................................. E-7


NCHRP 08-36, Task 131 Transportation Data Integration to Develop Planning Performance Measures
Cambridge Systematics, Inc. 1-1
1.0 Introduction
1.1 Background
Transportation planning requires comprehensive and accurate data as a foundation for its activities. Data provide a basis for understanding current problems and for forecasting future system conditions. Traditionally, data to support transportation planning have come from manual collection techniques (usually as a sample) and approximations from model output. While many of these traditional sources are still used, transportation planners are beginning to leverage emerging data sources to assist with planning activities and investment decisions.
The field of transportation data has undergone a transformation in the last decade. Additional and different types of data have become widely available from both agency and commercial sources. Technological advances, combined with the entry of private firms into the data market, have greatly shifted the landscape of transportation data from more traditional network systems (e.g., road count data) and survey samples to wider coverage, including vehicle probes, Bluetooth roadside monitoring equipment, cell phones, license plate readers, smartcards, electronic tolling sensors, and smartphone applications. Additionally, advances in data collection technology also have made available much more data related to asset management and safety.
With this deluge of data has come growing pains for transportation analysts, who are struggling to keep up with the advances. For example, the sheer volume of data is commonly overwhelming to analysts who are not trained in the specialized software and analysis skills needed to deal with very large datasets. Further, new forms of data have not been fully integrated into other agency data systems and technical processes. With shrinking budgets, a focus on performance-based planning, and the availability of a large array of data, agencies need to seek ways to make their data analysis systems more efficient.
1.2 Project Purpose
The project had multiple objectives: 1) to examine the current state of transportation data integration with an emphasis on performance measurement data; 2) to document the current use of nontraditional performance measures in transportation planning, and 3) to identify future research for developing guidance on nontraditional performance measures and the data used to support them.


NCHRP 08-36, Task 131 Transportation Data Integration to Develop Planning Performance Measures
Cambridge Systematics, Inc. 2-1
2.0 Literature Review
2.1 Approach
The research team investigated the current state-of-the-practice in transportation data integration among state departments of transportation (DOT), metropolitan planning organizations (MPO), council of governments (COG), research institutions, universities, and companies in the private sector from an electronic search of the literature. (Appendix A shows the references). The research team performed a detailed review of 46 resources of particular interest, and developed a spreadsheet matrix to serve as a summary of the literature. (A summary of the literature review appears in this section with additional detail provided in Appendix B.)
The purpose of the matrix is for users to gain knowledge on existing sources of data integration, and to understand the potential for nontraditional and emerging datasets to meet transportation’s planning needs. The matrix was developed based on two concepts: 1) defining performance measures planning agencies are using, and 2) identifying sources that are related to potential planning applications. Each piece of literature was reviewed and broken down into different topics: data sources, data category, planning function, spatial scope, temporal scope, performance measures, methodology synopsis, data gaps, and emerging concepts.
Data sources are broken into two subcategories: 1) existing data sources (data that public and private sectors currently use), and 2) emerging data sources (new forms of data that are emerging as a result of data integration). Data category consists of the types of data that agencies are using for their planning applications. Spatial and temporal scopes are each broken into different categories: Datasets/Systems (data specifics and how the data are being, or may be, integrated); Scope (the scope of the study and specific geolocations and timelines); and Tools (the types of tools being used to conduct the studies). Performance measures are the results derived from the study. Methodology synopsis is the methodology or process used to conduct the studies. Data gaps are the faults or errors in the collected data, and the emerging concepts are the questions and further studies as a result of the studies.
2.2 Findings
The overall findings and reoccurring themes found in the literature are described below by subject area.
What New Forms of Data Are Agencies Using for Planning Functions?
Currently, transportation agencies are integrating existing data sources to form new types of data, such as Hazardous Spacing Index [2]; Normalized Hazardous Spacing Index [2]; Geospatial Ecological Data [6]; and Performance metrics [46]. Transportation-related data sources, as well as the geospatial, ecological, built environment, cultural, and social data sources [6], are of high relevance to meeting current and future transportation needs.
Data Category and Planning Function
To identify data function, the data were split into categories. The data categories initially included Intelligent Transportation Systems (ITS)-Generated Traffic Data, Incident Data and Work Zone Data, and Weather Data. In some cases, the data discovered through the literature review did not fit into these specified

NCHRP 08-36, Task 131 Transportation Data Integration to Develop Planning Performance Measures
Cambridge Systematics, Inc. 2-2
categories, and a new category was created. Created data categories include Operations Data, Infrastructure Data, Safety Data, and Demographic Data. From the data category information, the planning function of the data is determined, as shown in the “middle column” of Figure 2.1. Asset management and Land Use Models are planning functions identified, which were not initially included in Figure 2.1.
Figure 2.1 Planning Uses of Archived Data Operations
What Datasets and Systems Are Being Integrated or Need to be integrated?
It is clear from the review of various references that there is a greater need to integrate a wide variety of disparate data sources and individual data warehouses into central databases [16] [23] [27] [34][41] [45]. Identifying what datasets and systems can be integrated will inform the most efficient approaches in transportation data integration practices, such as integration of global positioning systems (GPS) and Inertial Navigation Systems (INS) data [8]; Bluetooth and vehicle identification data (VID) data [10]; TransCAD,

NCHRP 08-36, Task 131 Transportation Data Integration to Develop Planning Performance Measures
Cambridge Systematics, Inc. 2-3
VISTA, and VISSIM data [13]; Automatic Vehicle Location (AVL) and Automated Fare Collection (AFC) data [15]; infrastructure, collision, and traffic data [26]; cash, trauma, and seatbelt data [34]; and land use and transportation data [41].
Scope, Specific Geolocation, and Timeline
The study scopes ranged from the small scale – arterial corridor in Portland, Oregon [33]; and highway section in the Ile-de-France region, France [35] to the higher level scale, such as regional, statewide [18] [20] [21] [25] [40] [42] [43] [45] [46], nationwide [6] [16] [38], and international [2] [15] [17] [35] [36] [37] geolocations. In certain references, various districts and municipalities in states were used as a means to gather a greater understanding at the state level. Texas DOT conducted workshops and surveys for independent district offices to identify statewide needs for integrating freight data information and developing an Integrated Freight Database [4]. Requested by California Department of Transportation’s (Caltrans), surveys were sent out to the various states around the country to understand what integration methods were most successful to shape their own data integration model [11]. From an international-level scale, the studies included countries, such as the Republic of Korea, Poland, Australia, New Zealand, Canada, and the United Kingdom. Such international practices were insightful in providing measurements for the various transportation data and promising for integrating the real-time transportation data.
What Performance Measures Are Being Derived from the Data?
The majority of the reviewed references consisted of deriving new models or improving on existing models to most effectively integrate data. Researchers from Hanyang University derived a Hazardous Spacing Index and a Normalized Spacing Index to measure traffic safety [2]. Researchers from Gdansk University of Technology developed a blueprint to serve as a means of switching to an activity-based model and an integrated land use and transportation model [8]. Researchers from Oklahoma State University sought to identify areas where data could be integrated through a data-sharing partnership between private and public sectors [9]. Some of the references did not derive a new model per se, but instead produced ideas to determine ways to integrate data in the most effective way. An example of this can be seen in Hall’s study [7], where a peer exchange was held to explore the current best practices for integrating spatial and business data.
In other studies, the main objective was to derive relationships, such as in the study [11], where Caltrans’ gathered Bluetooth information to derive a relationship between not-in-service bus and car travel time, and a relationship between in-service bus and car travel time.
Throughout the review of sources, it can be seen that, while some cases sought to derive new models, others sought to derive relationships and ideas to find the most effective way to integrate data.
Processing Methods Used to Integrate the Data Systems
The methodologies varied for each reference, but they all sought to achieve the same goal. Advanced information technologies included integrated database [4] [5] [6], both massive [16] and searchable [21], such as the Albuquerque Metropolitan Planning Area (AMPA) Regional ITS Architecture performed by Mid-Region Council of Governments (MRCOG) ITS Subcommittee [44] and the prototype Texas Freight Data Conceptual Architecture proposed by the Center for Transportation Research at the University of Texas at Austin [43]; integrated platforms, such as the platform equipped with the integrating existing and emerging technologies in Australia [36], the on-line platform – Hellenic Institute of Transport PORTAL (HIT PORTAL), which collects, processes, and analyses traffic-related datasets [38], and the Tennessee Roadway

NCHRP 08-36, Task 131 Transportation Data Integration to Develop Planning Performance Measures
Cambridge Systematics, Inc. 2-4
Information Management System (TRIMS) [32]; geographic information system (GIS)-based solutions [18] [19], such as the GIS tools adopted by Texas A&M Transportation Institute (TTI) across bridge, congestion, freight value, pavement, and crash risk data [46]; Web Applications [19], such as the three-tiered Data and Information Integration Framework for Highway Project Decision-Making [9], and a set of “Ds Analysis Modules” for integrating land use and transportation planning data in California [12]; as well as the statistics and machine-learning techniques [33] [41], such as Voronoi Diagrams [34], Hypothesis Testing (Chi-Square Testing) [34], Univariate and ordered Probit models [35], MATLAB script [42], and the matching algorithms [40].
Some references described methodologies, such as surveys [23], workshops [9], peer exchanges [17], and other options, to determine current conditions as well as future needs. With these strategies, transportation agencies are able to integrate relevant data and information, not only spatial and temporal, but also quantitative and qualitative.
Data Gaps
Technical challenges include insufficient data samples [2] [5] [10] [25] [28] [36] [46]; poor quality or biased data [2] [30] [34] [35]; incompatible data sources [12] [43]; inconsistencies across the existing public and commercial databases [4] [45]; and lack of centralized data storage [19].
Organizational challenges include outdated data collection methods and data delivery practices [21]; lack of skilled data analysts and experts [39]; unreusable and inadequate practices [41] [44]; and weak partnerships across various transportation agencies [29] [30].
Emerging Concepts
With the integration of data comes the emergence of new concepts and a deeper understanding of the transportation system. Many of the concepts include the need for further investigation and integration for more precise and accurate results. It should be noted that much of the data needed to answer many of the transportation questions are available for agencies, but the primary challenge is how to integrate the data so it is most effective. In addition, specialized analysts need to be trained to deal with the large datasets that are presented to them. There is often a lack of technical expertise to deal with the complexity and size of the datasets.
2.3 Scan of Practice
Planning agency documents were obtained to examine innovative uses of data and data integration techniques. These included transportation plans of various kinds (e.g., Long-Range Transportation Plans (LRTP)) and special studies. The review is documented in Table 2.1.
In general, the types of data used support the functions that are most important to an individual agency. Not surprisingly, we found the use of data focused on developing mobility performance measures (e.g., congestion and reliability). This activity is new to most planning agencies because data has been available – activities such as performance measures to support the Congestion Management Process (CMP) had previously been cobbled together with a mixture of modeling results and small sample data. Data for mobility measures come from a variety of sources, including travel time data from vendors (e.g., INRIX and HERE), such as the National Performance Management Research Data Set (NPMRDS), supplied at no charge by

NCHRP 08-36, Task 131 Transportation Data Integration to Develop Planning Performance Measures
Cambridge Systematics, Inc. 2-5
the Federal Highway Administration (FHWA)). These data are collected from vehicle probes by the vendors. The following agency-collected mobility data also are collected:
• Speed and volume data from traffic management centers (TMC). Some agencies also use incident data from TMCs.
• Bluetooth detectors (especially common on signalized arterials).
Integration of mobility data (travel time, speed, volume, and incident data used for mobility performance measures) with traditional data, historically cited as a major barrier to effective use of new data sources, appears to be common now. The main issue has been matching the georeferencing used by different datasets; the process of matching the datasets geographically is known as conflation. Advances in GIS technology, as well as the accumulation of more experience and skills by agency staff and their contractors, have enabled integration. However, we observe that not all agencies are at this level – we intentionally selected agencies for study based on a general sense of their data sophistication. It is likely that many smaller agencies do not possess the skill set and technical tools to achieve integration.
Also, once the integration is achieved, the sheer volume of new data is often overwhelming, and specialized software is needed to conduct analysis. Examples of software for analysis of large datasets include the Statistical Analysis System (SAS), R, Tableau, and custom scripts using advanced programming tools such as Python and SQL Server. Many agencies do not have in-house staff with the experience with the tools needed to conduct analysis. Some of the agencies interviewed do in fact have one or more staff with the requisite skills (Freeway and Arterial System of Transportation (FAST) in Nevada and the Maricopa Council of Governments (MAG)). However, it is not clear if they purposely sought out personnel with these skills, or if their personnel hired for other reasons happened to have the skills. Guidance on how to acquire the data integration and analysis skills is one area for further research in Task 5.
Some agencies are relying on third parties to provide data integration and analysis. The University of Maryland’s Regional Integration of Intelligent Transportation Systems (RITIS) tool performs these functions. RITIS already has vendor travel time data loaded for the I-95 Corridor Coalition states. Agencies supply other data to RITIS, such as incidents and work zones. The data are then integrated (conflated) internally. RITIS is focused on developing mobility performance measures from historical data. It is not clear how it will be expanded to meet other planning needs, especially forecasting. Agencies may have separate applications that require integration of land use, safety, and travel demand model data. For example, the Hillsborough, Florida Planning Commission (the Tampa MPO) has conflated crash data with their travel demand model network for doing safety forecasting.


NCHRP 08-36, Task 131 Transportation Data Integration to Develop Planning Performance Measures
Cambridge Systematics, Inc. 2-7
Table 2.1 Results of the Scan of Practice
Agency Data Type/Examples Sources Measures Developed Uses of the Measures Data Management How Integrated
with Other Sources? Future Plans? Maryland State Highway Administration (SHA)
Congestion Indices Inrix, TOC data Planning Time Index, Travel Time Index, Cost of Congestion.
Mapping of reliability measures, ranking of congested corridors and bottlenecks.
Use Inrix data and RITIS visualization tools. Detailed volume data comes from SHA office of Planning.
RITIS is primary integration tool. Detailed volume data comes from SHA office of Planning. Coordination with Baltimore and DC area MPOs assures consistency in reporting across the region.
Maryland SHA Freight Impacts Inrix, ATRI, TOC data Freight Congestion Index and Cost of Congestion.
Identification of freight bottlenecks.
Uses same traffic and volume data as for congestion indices.
Integrated in similar fashion to Congestion indices.
University of Maryland/Maryland SHA
MOSAIC Model Model inputs include traffic data, land use, demographic/economic, roadway geometry
Travel time savings and reliability, crash rate and severity, economic impact, livability (index of relative proximity of compatible land uses), noise, aesthetics, emissions, greenhouse gas (GHG), fuel consumption.
Ability to develop benefit/cost evaluation across modes or for multimodal projects.
Input data are included in database along with GIS layers, allowing project impacts in a specific corridor or location to be identified.
Developed as stand-alone research project. Eventually intended to support selection process for multimodal projects.
Additional development and further research scheduled.
North Central Texas Council of Governments (NCTCOG)
Accessibility Measures GIS, Census data, land use, transportation system data
Accessibility measures for environmental justice populations, low-income populations, and minority ethnic groups – jobs accessible by auto (30 min) and transit (60 min).
Project impacts on low-income, environmental justice and minority populations.
Part of NCTCOG databases. Integrated with environmental analysis for comprehensive evaluation criteria.
Washington DOT Aggregate congestion summaries and travel time on major corridors, detailed breakdown by time of day and segment
Operations center detection data, planning data, transit agency ridership and schedule data
Delay, travel time by mode (including high-occupancy vehicle (HOV)) and corridor, transit vehicle occupancy, park-and-ride occupancy, roadway capacity freed by transit, GHG emissions – both total and saved by transit. Accessibility measure includes access to jobs. Time saved by ferry users.
Document congestion, travel times and impacts of transit, and HOV use on the system. Provide baseline for multimodal corridor improvement studies.
Data collected from multiple sources, managed and compiled by team of Washington DOT data scientists. Methodology documented in corridor evaluation data handbook.
Provide input to results Washington Strategic Plan.
Delaware Valley Regional Planning Commission (RPC)
Performance measures for operations planning
Travel time and incident data. TMC data and Traffic.com.
Travel time, reliability, incident duration. Static measures of deployment.
Gauging success of current operations plan.
Developing Regional Integrated Multimodal Information Sharing (RIMIS) software, which will consolidate legacy systems and provide “one-stop” location for performance measures. System will have interface to TMCs and allow compilation of real-time data.
RIMIS is being developed as main integration tool to tie regional traffic data together across Pennsylvania and New Jersey portions of the region.
FAST Southern Nevada System operations performance measures
System operations data from TMC and logged incident data
Advanced reliability score that measures the type and extent of congestion, taking background traffic and seasonality and day of the week into account.
Predict levels of congestion and likelihood of incidents. Supports deployment of resources for incident management and special events.
Traffic data form Nevada DOT and incident management data are combined in the FAST dashboard.
The Dashboard serves as an integration tool that provides information to the public, analysis of operational strategies, and data for project planning.
The Integrated Transportation Reliability Program (ITRP) is an initiative that is designed to develop and implement specific operational projects and strategies based on the performance measures.


NCHRP 08-36, Task 131 Transportation Data Integration to Develop Planning Performance Measures
Cambridge Systematics, Inc. 2-9
Table 2.1 Results of the Scan of Practice (continued)
Agency Data Type/Examples Sources Measures Developed Uses of the Measures Data Management How Integrated
with Other Sources? Future Plans? Southern California Association of Governments (SCAG)
Real-time operational data Three systems (IEN, RITIS, and Performance Measurement System (PeMS)) that exchange real-time operational data and provide the basis for traveler information services
Travel time and reliability measures.
Support arterial traffic management strategies, improve traffic operations along multijurisdictional corridors, and improve emergency response coordination.
The three systems noted all combine information from multiple sources, including ITS devices and probe data.
RITIS currently is serving as the base system for development of an Archived Data Management Service (ADMS) that will store 3 years’ worth of historical data from all participating agencies.
The ADMS will be used to support regional- and corridor-level planning efforts, and provide input for funding applications. The system will also be used to develop performance measures for a future Express Lane operations.
Minnesota DOT Freeway operations data on congestion and travel times
ITS system data, including travel speed based on volume, capacity, and intersection control
Target travel speed – what users should expect at different times.
Evaluate performance on Interregional Corridor System (IRC).
Consolidate data from Twin Cities and region and statewide speed data to develop performance measures.
Mid-Region COG (Albuquerque)
Arterial corridor operations data Bluetooth and radar detectors, monitoring of signal progression
Speed differential (posted actual), volume, and safety data.
Performance data are combined into a measure that is used to develop rankings for arterial corridor improvements.
Various options for data management are still being explored at regional level.
Strategy for sharing data across region being developed through Concept of Operations (ConOps) process.
Operational scenarios have been developed for refinement of operational strategies.
MAG Freeway and arterial operations data
NPMRDS data, freeway management system
Hourly speed, throughput, duration of congestion, travel time index, graphic measures of delay and duration.
Congestion monitoring, programming for congestion management, freeway life-cycle program, and transportation alternatives program.
Data combined into ranking system for freeway management projects.
Developed procedures for integration and quality control of NPMRDS and freeway management data. Have consolidated Transportation Data Management System with visual interface that allows performance measures to be derived from archived data.
New data sources are still being integrated into the Transportation Data Management System.
Los Angeles County Metropolitan Transportation Authority (LA Metro)
Travel demand models, environmental data, mapping, socioeconomic data
Travel demand models, GIS, California Enviro Screening System
Range of measures for highway projects covering mobility, economic impacts, safety, accessibility, sustainability, and cost effectiveness. Categories are same for transit projects, but specific PMs differ slightly.
Ranking projects for long-range plan.
Scoring system developed for each measure and combined for aggregate project score.
Metropolitan Transportation Commission (MTC) (Bay Area)
Land use, air quality data Integrated Transport and Health Impacts Model, which combines travel demand model, GIS, and spreadsheet to evaluate health impacts
Carbon monoxide (CO) and particulate emissions, housing of 100% of all income groups, active transportation participation, percentage of resident income used for housing and transportation, vehicle miles traveled (VMT), non-single-occupancy vehicle (SOV) share.
Compare benefit-cost for long-range projects across modes and incorporate health impacts.
Combined travel demand model, GIS, and health impact model.
Combined travel demand model, GIS, and health impact model.
Implementation of “compelling case” criteria for projects that do not perform well.


NCHRP 08-36, Task 131 Transportation Data Integration to Develop Planning Performance Measures
Cambridge Systematics, Inc. 3-1
3.0 Practices for Nontraditional Performance Measures and Data Integration
3.1 Introduction
This chapter has two parts:
1. A Compendium of nontraditional/innovative performance measures currently in use at transportation agencies, including how they are developed and applied. The Compendium was developed by compiling the results into a consistent format, as well as reexamining practices of several leading agency practices; use of nontraditional measures is rapidly evolving in the field. Appendix D presents the details of the work undertaken for the Compendium.
2. A case study highlighting the use of nontraditional mobility performance measures and data integration methods.
3.2 Summary of Findings
The current state of the practice in using nontraditional planning performance measures is characterized primarily by project evaluation measures for assessing a wide variety of potential impacts that go beyond the traditional performance categories of mode-specific travel times, safety, and user costs. These project-level measures/criteria are linked to agency performance goals, but quantitative measures and supporting data to track progress toward those goals are lacking or not well formed. Some agencies have plans to put monitoring systems in place (e.g., Oregon’s PORTAL system), but none of them seems sophisticated enough to capture performance metrics, such as equity (e.g., number of disadvantaged population or transit-dependent population served per square-mile; number of households at risk of displacement).
Agencies are expanding the set of performance measures used for project evaluations and areawide monitoring. It is clear that the traditional set of measures focused on congestion, safety, and infrastructure condition are insufficient to meet the needs of agencies. Visions, goals, and objectives set by agencies are broadening to include areas, such as social equity, sustainability, economic development, and livability; and performance measures to monitor progress in these areas are being developed and tested. In general, there is a recognition that transportation investments affect the overall quality of life in an area and must be viewed within that context, rather than narrowly focused on the first order impacts on users.
A dizzying array of nontraditional project-level performance measures has been proposed by past research and is being used by some agencies. A compilation of these measures by performance category, as well as the methodologies and data used to develop them, should be made; noting that in many cases actual data have not been identified or only loosely alluded to by the agencies. Special attention should be paid to reconciling the sustainability measures developed by previous National Cooperative Highway Research Program (NCHRP) efforts, Environmental Protection Agency (EPA), and the Institute for Sustainable Infrastructure. It appears to us that the larger MPOs are on the vanguard of this movement for using nontraditional performance measures (e.g., sustainability, housing, equity, broad environmental impacts). We suspect that at least some of this activity will find its way to smaller MPOs and state DOTs, especially in terms of evaluating specific projects. There may or may not be strategic goals set in these performance areas for the smaller MPOs and state DOTs, as there is in the larger MPOs, but criteria for project

NCHRP 08-36, Task 131 Transportation Data Integration to Develop Planning Performance Measures
Cambridge Systematics, Inc. 3-2
evaluations will most certainly be expanded beyond the traditional travel time and user costs paradigm. We note that many nontraditional goal areas are difficult to implement at the state level, where the state has little or no say in land use decisions. On the other hand, several DOTs have established VMT reduction goals, either at the project level, or as a statewide goal (e.g., Caltrans and Oregon DOT).
The impact that qualitative nontraditional project performance measures can have on areawide performance is largely unknown. While forecasting models can readily predict the impact of transportation projects on traditional performance categories, such as travel time, safety, and emissions, no such capability exists for the nontraditional measures. Establishing the linkage between project and areawide performance is required so that agencies can adjust their qualitative scoring schemes. For example, “how much can we affect the areawide sustainability measure by undertaking this group of projects?”
We found that transportation agencies use the term “performance measures” to apply to both the tracking of areawide trends and for the evaluation of potential projects. Historically, the term “measures of effectiveness” (MOE) has been used in reference to evaluations. With the recent emergence of performance management, the tendency is to call all measures “performance measures.” However, a distinction exists that is important: monitoring trends through direct measurement, as compared to modeling expected impacts, are different in both perspective (past versus future) and mechanics (empirical versus analytical). The same measures can be used for both functions, but their development is different.
Concepts and measures also are evolving within traditional impact areas. Mobility measurement, which has traditionally been confined to how highway facilities or transit systems function, is now shifting its perspective to how users experience the system for complete trips. This shift is enabled by the emergence of probe speed data that are greatly improving the accuracy and spatial coverage of performance measures for mobility analysis. The “next big thing” in transportation data seems to be maturing origin-destination (O/D) datasets, especially those that include origin-destination travel times.
The vision for the “next generation” of informed performance measures is the integration of: 1) transportation system data, 2) O/D data, and 3) travel behavior data sources. Transportation system data from traditional sources always will be important, and they continue to improve. Currently, probe-based O/D data are now coming to market as evidenced by the examples shown in Task 3. In the future, improved traveler behavior data is desirable to understand where travelers would like to go (as opposed to how they did travel, given the existing transportation system).
The current state of the practice in using nontraditional planning performance measures is characterized primarily by project evaluation measures for assessing a wide variety of potential impacts that go beyond the traditional performance categories of mode-specific travel times, safety, and user costs. These project-level measures/criteria are linked to agency performance goals, but quantitative measures and supporting data to track progress toward those goals is lacking or not well formed. They are developed primarily through the use of models or qualitative assessments during the project development process. Some agencies have plans to put monitoring systems in place, but none of them seems sophisticated enough to capture performance metrics, such as equity (e.g., number of disadvantaged population or transit-dependent population served per square-mile; number of households at risk of displacement).
The nontraditional measures used for project evaluation are most often imbedded within a multiple criteria ranking system. Scores are assigned to each performance measure, then a composite score is used to rank alternatives within projects, as well as to rank programs of projects. In terms of data integration, GIS technologies are widely used to join data from disparate sources and to conduct spatial analyses.

NCHRP 08-36, Task 131 Transportation Data Integration to Develop Planning Performance Measures
Cambridge Systematics, Inc. 3-3
Nontraditional project evaluation measures are a significant first step as agencies broaden their view of what “performance” is. However, monitoring performance at a more global level also is required (e.g., areawide monitoring). By examining trends in areawide performance, the effect of overall programs can be assessed and redirected. An analogy would be in pavement management. Selecting the type of pavement improvement occurs at the project level, but these decisions affect how the overall system performs. Likewise, one criterion on which mobility investment decisions may be made is improved access for low-income households, but it is still useful to know what the global trends are.
It must be pointed out that areawide trends are affected by many factors, not just transportation investments. For example, congestion trends are highly influenced by demand changes, which are driven by external factors, such as fuel price and general economic conditions. These external factors are outside the control of transportation agencies, yet it is still useful to monitor areawide trends because agencies need to understand how their customers (users) are affected. Further, many MPOs are part of broader general planning agencies that may have nontransportation investment programs and policies.
3.3 Compendium of Nontraditional Planning Performance Measures
Nine agencies were scanned for innovative measures, including the following:
1. MTC, California (San Francisco Bay Area).
2. SCAG, California (Los Angeles area).
3. Washington DOT.
4. Delaware Valley RPC; Pennsylvania/New Jersey (Philadelphia area).
5. NCTCOG, Texas (Dallas area).
6. Portland Metro (Oregon).
7. Metroplan (Little Rock, Arkansas).
8. Chattanooga-Hamilton County/North Georgia Transportation Planning Organization.
9. LA Metro, California.
Some innovative measures being implemented by other agencies were identified in the recent FHWA handbook (Supporting Performance-Based Planning and Programming through Scenario Planning, FHWA HEP-16-068, June 2016). These agencies include:
• Champaign-Urbana Urbanized Area Transportation Study, Illinois;
• Fresno Council of Governments, California; and
• Hillsborough County MPO, Florida.
Innovative performance measures can be categorized in numerous ways, but based on the reviews, the team has selected the following categories for the Compendium:
• Mobility;
• Safety;
• Environment/Sustainability; and
• Economic Development/Land Use.

NCHRP 08-36, Task 131 Transportation Data Integration to Develop Planning Performance Measures
Cambridge Systematics, Inc. 3-4
Health is the subject of many of the newer measures being used and can be considered a subset of Environmental measures or a category of its own. Appendix C presents the details on agencies’ use of nontraditional performance measures.
Mobility
New and more detailed data on speed and travel time has enabled mobility measures to evolve from those based primarily on volume, periodic speed and delay runs, and level of service. Continuous speed data have been available for some time in large urban areas from ITS systems, and more recently have been expanded geographically by private vendors who use various technologies and crowdsourcing techniques to monitor speed and delay. These sources have enabled agencies to measure mobility on more facilities and in greater detail. Estimates of delay hours and indices, such as planning time, buffer time, and travel time, have become more common and are used on both a regional and corridor basis. The main source of innovation identified has been in the application of delay measures to specific corridors and measures that relate specifically to the users, such as time lost per vehicle or commuter. Drilling in on specific areas impacted by delay and congestion will help to refine proposed strategies and regional plans and congestion management plans.
It should be pointed out that most of the performance measures used for congestion and mobility are based on the fundamental measurements of travel time or speed. With a few additional data items, such as free-flow/ideal travel time, segment or trip length, and VMT, a large array of performance measures can be created. These include such measures as delay, travel time indices, measures of reliability (which can be related to the distribution of travel times or on-time arrivals), accessibility, and measures related to duration and extent of congestion. This large set of measures can appear overwhelming, but at their core is travel time or speed. However, the measures have been crafted to reveal different facets of mobility, hence, the need to maintain a suite of measures. A primary or “flagship” measure can be used for communicating the general state of mobility, but using additional measures provides greater insight.
Accessibility (the ease with which the population can access jobs and services) is becoming a major aspect of mobility performance. However, direct measurement of accessibility – the actual travel times users experience in accessing opportunities – has not yet been achieved. Instead, accessibility measures are derived from either regional travel demand models or through subjective assessments. New forms of O/D data are just now becoming available from private vendors that should enable development of empirical accessibility measures, as well as other types of trip-based measures. However, widespread use will wait until the profession gains experience with validating and processing these data.
The North Central Texas Council of Governments (NCTCOG) is developing accessibility measures for environmental justice populations, low-income populations, and minority ethnic groups – jobs accessible by auto (30 minutes) and transit (60 minutes). Historically, accessibility measures have been developed with travel demand models for future year forecasts, and this is how NCTCOG uses them. However, it is now possible to develop them for past trend analysis by using empirical travel time data (as discussed above) rather than model estimates, integrated with land use data. Florida DOT conducted a pilot study of this approach using empirical travel time and land use data from the Miami-Dade region. The technique was to conflate the vendor travel time data with the region’s travel demand mode to provide access to land use data. Accessibility measures can be thought of as an advanced form of mobility measures, and we expect accessibility trends/monitoring to become more widespread in the near future.

NCHRP 08-36, Task 131 Transportation Data Integration to Develop Planning Performance Measures
Cambridge Systematics, Inc. 3-5
Many agencies are beginning to use probe speed data for mobility monitoring. Probe speed data greatly improve the accuracy and spatial coverage of performance measures for mobility analysis conducted by agencies. The “next big thing” in transportation data seems to be maturing origin-destination datasets, especially those that include origin-destination travel times.
The vision for the “next generation” of informed performance measures is the integration of: 1) transportation system data, 2) O/D data, and 3) travel behavior data sources. Figure 3.1 illustrates the three elements of data input for the “next generation” of informed performance measures. Currently, probe-based O/D data are now coming to market. In the future, improved traveler behavior data is desirable to understand where travelers would like to go (as opposed to how they did travel, given the existing transportation system).
Figure 3.1 Data Input for the “Next Generation” of Informed Performance Measures
Development of freight accessibility measures has lagged behind those for passenger travel, even though a wide range of general freight performance measures have been defined. For example, the National Cooperative Freight Research Program (NCFRP) Report 10 offers a comprehensive list of freight performance measures, but none is related to accessibility.1 A recent study for the Tampa Bay, Florida region reviewed freight measures in use at peer locations around the country, but again none dealt strictly with freight accessibility.2
1 Proctor, Gordon et al., 2011, Performance Measures for Freight Transportation, NCFRP Report 10, Transportation Research Board, http://onlinepubs.trb.org/onlinepubs/ncfrp/ncfrp_rpt_010.pdf.
2 Florida Department of Transportation, 2014, Freight System Performance Measures for the Tampa Bay Region, http://tampabayfreight.com/wp-content/uploads/FreightWhitePaper_PerformanceMeasures.pdf.

NCHRP 08-36, Task 131 Transportation Data Integration to Develop Planning Performance Measures
Cambridge Systematics, Inc. 3-6
SHRP 2 Project C11 developed a methodology for assessing the market access impacts of potential projects.3 The study found that:
Some transportation projects have the effect of expanding the breadth of destinations that can be served by same-day truck deliveries from a given business location, or the breadth of area from which a business can reasonably expect to draw customers and workers. These effects are often represented as changes in the effective size or the effective density of the customer market and labor market available to the firm. Expansion of the customer delivery market can enable scale economies in production and delivery processes. Similarly, expansion of the worker labor market can enable scale economies through better matching of specialized business needs and specialized worker skills, and it also can enable more innovation through greater interaction of complementary firms and their employees.
One of the two tools developed was related to freight accessibility. It uses an effective density metric with a spatial decay factor to assess access from a firm to buyers and suppliers. It is meant to be used in conjunction with an area’s travel demand model, and it uses changes in O/D travel times as the basis for its calculations. It is a predictive tool, and not a performance monitoring application. In theory, this process could be duplicated using a network of actual travel times (instead of modeled ones) to produce the market access metric, but the implementation and maintenance of such a system require considerable effort.
Safety
No innovative measures for safety were identified in the scan conducted. Most agencies continue to use traditional measures, such as number of crashes or crash rates per VMT, to identify facilities and locations where improvements are needed. Rates are generally tracked by type of facility. It should be noted that some agencies place the innovative measures of transportation impact on health in the safety category. Most, however, treat them as environmental measures.
Environment/Sustainability
More sophisticated measures of environment and sustainability are being used for both reporting purposes and for project screening and selection. GIS applications are helping agencies provide greater granularity in these measures, but they also face challenges in incorporating these measures into Congestion Management Plans, Long-Range Plans, and other project-oriented documents. Measures can be difficult to explain to the public and decision-makers, and costly to update on a frequent basis.
Health
An important recent development has been the incorporation of health-related measures into the planning process. These include both measures that address the impacts of transportation-related air pollutants; and impacts of projects and actions designed to encourage active transportation options, such as bicycling and walking. The first category has been in use for some time, but the ability to measure more accurately has been enhanced by GIS technology and closer coordination between health and transportation agencies, especially in California. Measures related to active transportation (e.g., walking and cycling) are becoming
3 Economic Development Research Group et al., 2014, Development of Tools for Assessing Wider Economic Benefits of Transportation, Transportation Research Board, http://onlinepubs.trb.org/onlinepubs/shrp2/SHRP2_S2-C11-RW-1.pdf.

NCHRP 08-36, Task 131 Transportation Data Integration to Develop Planning Performance Measures
Cambridge Systematics, Inc. 3-7
common in reporting and planning activities, but still are limited by the difficulty in collecting data on these modes. An additional measure involves proximity of populations, particularly those in low-income areas, to parks and green spaces.
Land Use and Economic Development
The interaction of land use and economic development with transportation is becoming a topic of greater interest due to multiple factors. Stated goals to reduce congestion and encourage alternate modes of transportation are contained in virtually all transportation planning efforts, and there has been greater focus on land use as a way to accomplish those goals. Land use and economic activity change slowly over time, making many of these measures more appropriate for long-range planning efforts. The other key areas of economic impact are on equity, and agencies are developing measures that target the impact of transportation investments on equity and accessibility. These may be more appropriately categorized under a heading of “Economic Opportunity.” In many cities, transit investments are encouraging gentrification, which may reduce some of the accessibility benefits that would otherwise be gained. Another planning goal is guiding new development into existing centers and infill parcels, with strategies that have both environmental and economic benefits. Note that improving economic opportunity does not necessarily maximize economic output.
3.4 Compendium of Nontraditional/Innovative Performance Measures Currently in Use
Tables 3.1 through 3.3 present the results of the review of agencies’ use on nontraditional performance measures. (More detail may be found in Appendix D.) The work of LA Metro and the Bay Area’s MTC are representative of what we found:
• LA Metro uses a range of measures beyond traditional mobility measures to evaluate projects, including economic impacts, safety, accessibility, sustainability, and cost effectiveness. To develop these measures, their travel demand model is integrated with other data sources, including the CalEnviroScreen model, a screening methodology that can be used to help identify California communities that are disproportionately burdened by multiple sources of pollution. Like NCTCOG, accessibility also is a major performance category, but only for evaluating potential projects via modeling, not for continuous monitoring. Sustainability and Quality of Life also are major performance areas for evaluating projects, but the exact measures have not been published as of this writing. A case study documenting how this integration is achieved and how it works in detail would be an item for further research.
• Likewise, MTC uses a range of environmental, social, and economic performance measures to evaluate projects for their 2040 LRTP. They use the Integrated Transport and Health Impacts Model, which combines a travel demand model, GIS, and spreadsheets to evaluate health impacts. Targets are set for the Plan as a whole, including:
– House 100 percent of the region’s projected growth by income level without displacing current low-income residents. Based on project location, level of projected housing growth, and level of housing, irrespective of mode.
– Direct all nonagricultural development within existing urban footprint. Dependent on whether project consumes open space or not, and whether it is in the “urban core.”
NCHRP 08-36, Task 131 Transportation Data Integration to Develop Planning Performance Measures
Cambridge Systematics, Inc. 3-8
– Decrease by 10 percent share of low-income household income consumed by housing/transportation. If transit, this is based on proportion of low-income ridership, or proportion of the region’s low-income that it serves. Projects that do not remove a low-cost transport option receive 0, projects that do are scored negative.
– Increase share of affordable housing in priority development/transit areas by 15 percent. The score is dependent on project location; the amount of affordable (moderate, low, very low) housing built; and it passes through a prioritized development area.
– Reduce share of low-income households in areas that are at risk of displacement. Based on whether project serves low-/moderate-income area that is at risk or undergoing displacement. Risk is determined using data from University of California Berkeley’s Urban Displacement project.
– Increase by 35 percent the number of middle wage jobs. Based on whether project itself adds short-term (construction) or long-term (operator) jobs.
– Transportation System Effectiveness. This category includes several of the more traditional mobility performance measures:
» Increase nonauto mode share by 10 percentage points (to 26 percent of trips);
» Decrease automobile VMT per capita by 10 percent;
» Increase local road pavement condition index (PCI) to 75 or better; and
» Decrease distressed lane-miles of state highways to less than 10 percent of total lane-miles.
Two useful tools were identified for integrating nontraditional performance measures into planning applications:
1. The MOSAIC tool is a cost-effective application to select the best corridor-level improvement option, particularly in the early phases of the long-range transportation planning process.
2. As a scenario planning tool, Capital Area Metropolitan Planning Organization (CAMPO) Demographic Allocation Tool is replicable and quantitative. Equipped with a GIS-based computer program, it allows for integration with the travel demand model for multiple growth scenarios.
An emerging performance concept in the freight area is freight fluidity. Freight fluidity “is a broad term referring to the characteristics of a multimodal freight network in a geographic area of interest, where any number of specific modal data elements and performance measures are used to describe the network performance (including costs and resiliency) and quantity of freight moved (including commodity value) to inform decision-making.”4
Implementing freight fluidity requires multimodal data across the entire freight network, including information on origins and destinations of freight movements by mode (i.e., supply chains). It includes an understanding of how “fluid” the supply chains are – in terms of mobility, reliability, and resiliency. There also is a need for information on the quantity of goods moved (e.g., volume, weight, value – and by commodity type) throughout the network to understand flows and to weight performance measures across the supply chain. The resiliency of the freight network is critical to shippers and carriers, and is included as another element within freight fluidity performance. Tables 3.4 and 3.5 present information on how to measure freight fluidity.
4 Eisele, Bill, Defining Freight Fluidity: A Framework for Implementation in Maryland and Beyond, prepared for Maryland State Highway Administration by the Texas A&M Transportation Institute, December 23, 2014.

NC
HR
P 08-36, Task 131
Transportation Data Integration to D
evelop Planning Perform
ance Measures
Cam
bridge Systematics, Inc.
3-9
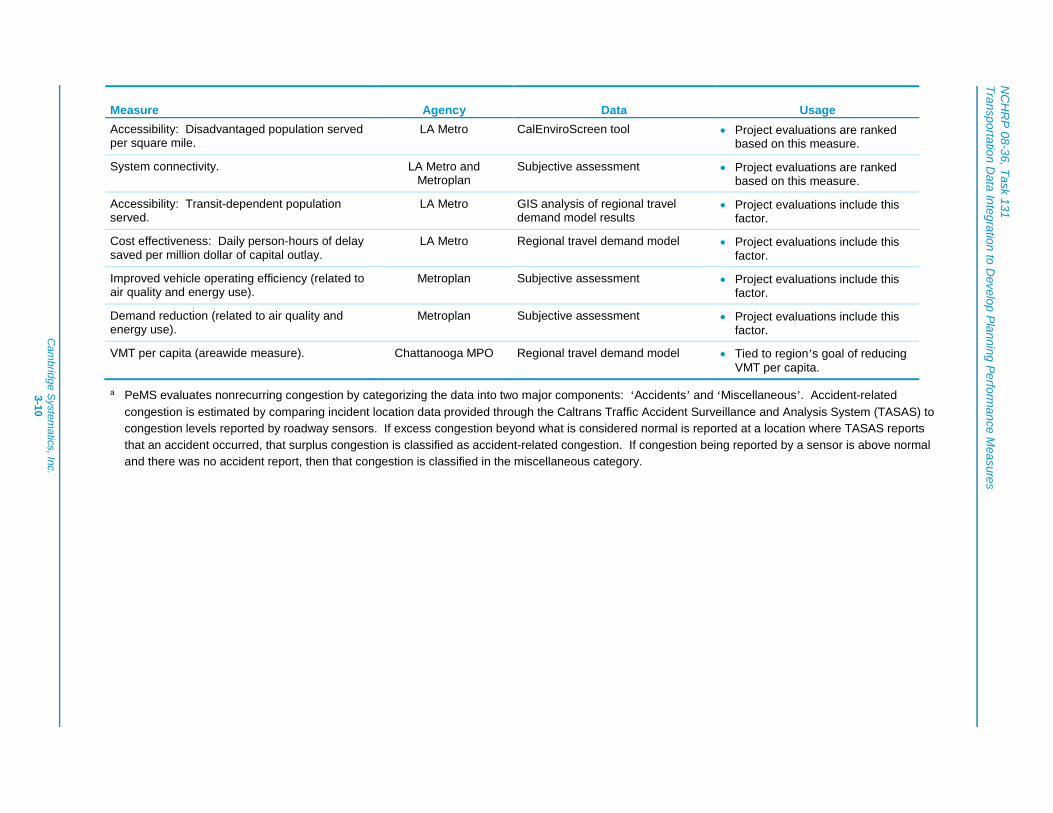
Table 3.1 Nontraditional/Innovative Mobility Performance Measures
Measure Agency Data Usage High existing transit usage – (3 or more bus runs in urban areas, 2 or more bus runs in suburban areas during peak periods, or rail station with 500 or more boardings.
Delaware Valley RPC Transit schedules and ridership data, GIS to identify usage area
• Prioritize transit infrastructure improvements, ITS improvements for transit, Transit Signal Priority projects, Transit Oriented-Development; and
• Recommend route modifications.
Region commute time planning area with region divided into Core cities, mature suburbs, and growing suburbs.
Delaware Valley RPC U.S. Census • Measure success in concentrating employment closer to residential areas; and
• Measure impact of sprawl on the transportation system.
Miles traveled in congestion – consistent delay defined as speed less than 35 mph on a specific freeway segment for greater than 15 minutes. Segments aggregated to develop measure.
MTC MTC/Caltrans PeMS Congested Mileage Analysis
• Vital signs” performance measurement program.
Delay per capita and per worker on major freeway corridors. Congestion defined as speed less than 35 mph on a specific freeway segment for greater than 15 minutes.
MTC INRIX for congestion data, Census and Bureau of Labor Statistics for population and employment data
• “Vital signs” performance measurement program.
Accessibility: number of jobs within 30 minutes (car) and 45 minutes (transit).
MTC Regional travel demand model • Project evaluations are ranked based on this measure.
Highway nonrecurrent delay for mixed-flow and HOV lanes. Delay caused by incidents, weather, planned closures, special events, or other atypical patterns.
SCAG Caltrans PeMSa • Part of Performance Measures Plan adopted for support of Sustainable Communities Strategy for 2035 Regional Transportation Plan (RTP).
Lost lane miles for highways, and percent seat miles utilized for transit to measure percent utilization of regional transportation system during peak period.
SCAG Caltrans PeMS • Part of Performance Measures Plan adopted for support of Sustainable Communities Strategy for 2035 RTP.
Network miles within Urban Growth Boundary exceeding congestion threshold in Mobility Policy.
Portland Metro Metro Travel Forecast Model • Needs assessment and project impact for Metropolitan Transportation Plan.
NC
HR
P 08-36, Task 131
Transportation Data Integration to D
evelop Planning Perform
ance Measures
Cam
bridge Systematics, Inc.
3-10
Measure Agency Data Usage Accessibility: Disadvantaged population served per square mile.
LA Metro CalEnviroScreen tool • Project evaluations are ranked based on this measure.
System connectivity. LA Metro and Metroplan
Subjective assessment • Project evaluations are ranked based on this measure.
Accessibility: Transit-dependent population served.
LA Metro GIS analysis of regional travel demand model results
• Project evaluations include this factor.
Cost effectiveness: Daily person-hours of delay saved per million dollar of capital outlay.
LA Metro Regional travel demand model • Project evaluations include this factor.
Improved vehicle operating efficiency (related to air quality and energy use).
Metroplan Subjective assessment • Project evaluations include this factor.
Demand reduction (related to air quality and energy use).
Metroplan Subjective assessment • Project evaluations include this factor.
VMT per capita (areawide measure). Chattanooga MPO Regional travel demand model • Tied to region’s goal of reducing VMT per capita.
a PeMS evaluates nonrecurring congestion by categorizing the data into two major components: ‘Accidents’ and ‘Miscellaneous’. Accident-related congestion is estimated by comparing incident location data provided through the Caltrans Traffic Accident Surveillance and Analysis System (TASAS) to congestion levels reported by roadway sensors. If excess congestion beyond what is considered normal is reported at a location where TASAS reports that an accident occurred, that surplus congestion is classified as accident-related congestion. If congestion being reported by a sensor is above normal and there was no accident report, then that congestion is classified in the miscellaneous category.

NC
HR
P 08-36, Task 131
Transportation Data Integration to D
evelop Planning Perform
ance Measures
Cam
bridge Systematics, Inc.
3-11
Table 3.2 Nontraditional/Innovative Environmental and Sustainability Measures
Measure Agency Data Usage Prioritize transportation investment in less-sensitive environmental areas.
Delaware Valley RPC Green Infrastructure Screening Toola
Used as screening tool in both Long-Range Plan and Congestion Management Plan.
Premature deaths due to long-term exposure to particulate matter.
SCAG, MTC Estimated by California Air Resources Board based on monitored or modeled PM concentrations (SCAG) California Health Survey (MTC)
Performance measures for RTP.
Share of regional population that lives within walkable distance to a park – defined as one-half-mile distance.
SCAG SCAG GIS database Performance measures for RTP.
Homes within one-half mile of regional trail system.
Portland Metro Regional Land Information System (RLIS) and U.S. Census
Performance Measure for Long-Range Plan nonmotorized element.
Number of projects that intersect high-value environmental habitat.
Portland Metro RLIS Performance Measure for Long-Range Plan nonmotorized element.
Vulnerability to Sea Level Rise – share of population living in vulnerable areas.
MTC NOAA Sea Level Rise Maps, San Francisco Bay Conservation and Development Commission Sea Level Rise Maps, U.S. Censusd
Tracking of vulnerability of existing and new developments.
Climate Change Impacts – breakdown of population by demographic group for areas potentially impacted by substandard housing, sea level rise, and wildfire risk.
SCAG SCAG Integrated Growth Forecast, CalFIRE, National Oceanic and Atmospheric Administration Coastal Services Center
Establishing baseline for future RTP evaluation.
Health Impact Assessment (HIA) –correlation of obesity rates and transportation accessibility factors.b
Champaign-Urbana Urban Transportation
Study (CUUATS)
CUUATS transportation inventory data, Champaign Community Health Improvement Plan and Community Health Surveys, U.S. Census
Input to Long-Range Plan and Vision.
Integrated Transportation and Health Model.c Fresno COG, MTC Census data, travel time data, established causal relationships between physical activity, air pollution, and travel behaviors to specific health outcomes
Reporting and general evaluation of transportation alternatives.
Access to parks and recreation facilities. LA Metro Subjective assessment Project evaluations include this factor.

NC
HR
P 08-36, Task 131
Transportation Data Integration to D
evelop Planning Perform
ance Measures
Cam
bridge Systematics, Inc.
3-12
Measure Agency Data Usage Support for active transportation. LA Metro Subjective assessment Project evaluations include this
factor.
Noise impacts. LA Metro Noise model linked to regional travel demand model results
Project evaluations include this factor.
Enhancement of: access/quality of transit, walking, and/or cycling.
Metroplan Subjective assessment Project evaluations include this factor.
a Capacity projects are assigned a buffer, sized according to roadway classification and whether or not new right-of-way is created for a project. Buffers are overlaid with 10 key environmental data layers, including DVRPC’s Greenspace Network and Conservation Focus Areas. Data layers are “rasterized” into a grid and the value of the cells within a project’s buffer area are summed to produce a cumulative score. This analysis provides an early indication of potential relative environmental impacts. http://www.dvrpc.org/Green/.
b Obesity rates were generally lower in neighborhoods that had higher population density, better land use mix, higher accessibility to jobs and services, and better transit connectivity. Based on the results of the HIA, a health index was developed that was used to rate the built environment variables of different planning areas in terms of their impact on levels of physical activity and local health. http://lrtp.cuuats.org/lrtp-main_011615_reduced_6-public-health/.
c. http://www.cedar.iph.cam.ac.uk/research/modelling/ithim/. d Projected areas of inundation were developed by BCDC at one-foot intervals ranging from one foot to six feet of sea level rise. To determine the impacts
on historical and current populations, inundation areas were overlaid on a U.S. Census shapefile of 2010 Census tracts using Census Bureau population data. Because census tracts can extend beyond the coastline, the baseline scenario of zero feet was used to determine existing sea level coverage of census tracts. Sea level rise refers to the change from this level, and the area of the tract was determined by measuring the component of the tract area not currently under water. This area, rather than the total tract area, was used as the denominator to determine the percentage of the census tract that is inundated under future sea level rise projection scenarios. When at least 10 percent of tract land area are inundated with a given sea level, its residents are considered to be affected by sea level rise. http://www.vitalsigns.mtc.ca.gov/vulnerability-sea-level-rise.

NC
HR
P 08-36, Task 131
Transportation Data Integration to D
evelop Planning Perform
ance Measures
Cam
bridge Systematics, Inc.
3-13
Table 3.3 Nontraditional/Innovative Land Use and Economic Performance Measures
Measure Agency Data Usage Acreage of Greenfield Land Development. MTC Department of Conservation
Farmland Monitoring and Mapping Program GIS and U.S. Censusa
Vital Signs Reporting Web Site.
Percent of income spent on housing and transportation.
SCAG U.S. Bureau of Labor Statistics, American Community Survey
Reporting on change from previous year, RTP.
Land Consumption. SCAG Department of Conservation Farmland Monitoring and Mapping Program GIS
Reporting on change from previous year, RTP.
Share of regional growth in High Quality Transit Areas.
SCAG American Community Survey, SCAG GIS database, SCAG Integrated Growth Model
Reporting on change from previous year, RTP.
Additional jobs added as a result of improved competitiveness from transportation investments.
SCAG REMI Economic Model Reporting on change from previous year, RTP.
Distribution of travel time savings and travel distance reductions by demographic group (low-income, minority).
SCAG National Household Transportation Surveys (NHTS), SCAG Integrated Growth Forecast, Regional Travel Demand Model
RTP Environmental Justice evaluation.
Gentrification and displacement – historical and projected demographic trends for areas around rail stations.
SCAG High Quality Transit Areas (HQTA)b, U.S. Census, NHTS
Establishing baseline for future RTP evaluation.
Centers, Infill and Redevelopment and Emerging Growth land use categories – identifying whether transit investments are serving these areas.
Delaware Valley RPC GIS, Transit system data Plan evaluation with first investment priority to centers, second to infill and redevelopment, and third to emerging growth areas.
Improved job access per square mile. LA Metro GIS analysis of regional travel demand model results
Project evaluations are ranked based on this measure.
Dollars invested in transportation projects in disadvantaged communities.
LA Metro CalEnviroScreen tool Project evaluations are ranked based on this measure.

NC
HR
P 08-36, Task 131
Transportation Data Integration to D
evelop Planning Perform
ance Measures
Cam
bridge Systematics, Inc.
3-14
Measure Agency Data Usage Job access per fixed guideway transit station. LA Metro GIS analysis of regional travel
demand model results Project evaluations are ranked based on this measure.
Complement compact mixed use development. Metroplan Subjective assessment Project evaluations are ranked based on this measure.
a For regional and local data, FMMP maps the extent of “urban and built-up” lands, which generally reflect the developed urban footprint of the region. The footprint is defined as land occupied by structures with building density of at least 1 unit to 1.5 acres. Uses include residential, industrial, commercial, construction, institutional, public administration, railroad and other transportation yards, cemeteries, airports, golf courses, sanitary landfills, sewage treatment, water control structures, and other developed purposes. To determine the amount of greenfield development (in acres) occurring in a given two-year period, the differences in urban footprint GIS layers are computed on a county and city level. FMMP makes slight refinements to urban boundaries over time, so changes in urban footprint +/-100 acres are not regionally significant. Reductions in a city’s urban footprint is often due to these refinements, although the creation of new parks or open space on previously developed is also a potential cause. http://www.vitalsigns.mtc.ca.gov/greenfield-development.
b High Quality Transit Areas refer to transportation corridors within one-half mile of a major transit route that feature peak commute period service frequencies of 15 minutes or less. http://scagrtpscs.net/Documents/2016/final/f2016RTPSCS_PerformanceMeasures.pdf.

NC
HR
P 08-36, Task 131
Transportation Data Integration to D
evelop Planning Perform
ance Measures
Cam
bridge Systematics, Inc.
3-15
Table 3.4 The Components of Freight Fluidity
Components Description Selected Suggested Measures/Considerationsa
Performance How well are the links/nodes and network operating? Where are there bottlenecks in the system?
• Mobility (e.g., travel time, total delay, delay per mile, travel time index) • Reliability (e.g., planning time index) • Costsb (associated with delay, unreliability, wasted fuel)
How well does the system (infrastructure, users, agencies) react to disruptions (i.e., how resilient is the system)?
Resiliencyc has 4 aspects: 1. Robustness (ability to withstand disruption, measured in time) 2. Rapidity (time to respond and recover) 3. Redundancy (alternate route [capacity] availability/access within a certain
travel time) 4. Resourcefulness (ability and time to mobilize needed resources)
Quantity How much freight is moved (and where)? • ● Volume (e.g., number of trucks, railcars, twenty-foot equivalent units (TEU))
• ● Weight (e.g., pounds, tonnage) • ● Commodity Valueb
a These are selected measures and considerations. These measures are ideally obtained by mode and by commodity for complete freight network evaluation.
b Costs in the “performance” component and value in the “quantity” component capture the economic impact of freight fluidity. c Resiliency is an element of the “performance” component because current system resiliency is captured in measures of mobility, reliability, and
associated costs. Note that the “4 Rs” (robustness, rapidity, redundancy, resourcefulness) of resiliency can typically be expressed in time, hence, delay and associated cost measures. Resiliency is included in the freight fluidity framework here because it is critical for efficient goods movement during system disruptions. Evaluating and improving transportation system resiliency during disruptions serve to better understand and improve performance during challenging times of goods movement.
Source: Reference (4).

NC
HR
P 08-36, Task 131
Transportation Data Integration to D
evelop Planning Perform
ance Measures
Cam
bridge Systematics, Inc.
3-16
Table 3.5 Selected Data Elements and Sources to Inform Freight Fluidity by Mode
Characteristic Truck (Highway)
Mode
Rail Water Air Pipeline Transloada
Performance (data to characterize performance of the freight network). Transit timeb (speed data) (including border processing time and harbor transit time, where applicable)
• ATRI, INRIX, other private companies
• NPMRDS • Roadway
sensors/systems (highway, border processing)
• Rail companies (CSX/NS)
• ww.railroadpm.org (Association of American Railroads)
• On-line resources (Lloyd’s List intelligence)
• Ocean carrier web sites
• U.S. Army Corps of Engineers
• Pilots and marine exchangesc
• www.marinetraffic.com
• Automatic Information System (AIS)d
• Drewry and Journal of Commercee
• Major freight carriers, airlines
• Major carriers/shippers of gas and petroleum products and other products
• Facility/carrier data at major facilities, centers
Dwell timesa,b
(for transloads by mode)
• Facility/carrier data at major facilities, centers
• Rail terminal dwell times
• www.railroadpm.org (Association of American Railroads)
• Terminal operators • Port authorities • On-line resources
(GT Nexus, Zepol) • Commissions for
specific commodities
• U.S. Army Corps of Engineers
• www.marinetraffic.com
• AISd • Drewry and Journal
of Commercee
• Major freight carriers, airlines
• Major carriers/shippers of gas and petroleum products and other products
• Facility/carrier data at major facilities, centers
Resiliency of supply chain: Robustness Rapidity
• Trucking companies
• Shippers
• Rail companies (CSX/NS)
• Shippers
• Water transport companies
• Shippers
• Air carriers • Shippers
• Major carriers/shippers of gas and petroleum
• Facility/carrier data at major facilities, centers (i.e.,
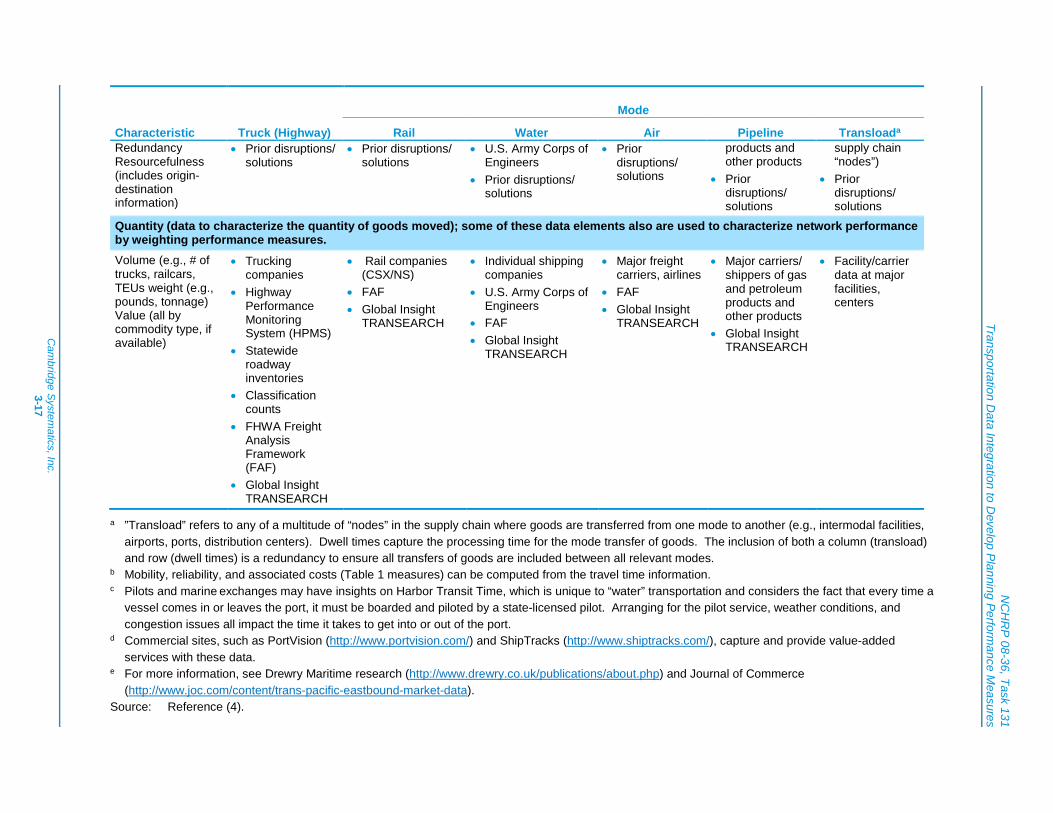
NC
HR
P 08-36, Task 131
Transportation Data Integration to D
evelop Planning Perform
ance Measures
Cam
bridge Systematics, Inc.
3-17
Characteristic Truck (Highway)
Mode
Rail Water Air Pipeline Transloada
Redundancy Resourcefulness (includes origin-destination information)
• Prior disruptions/solutions
• Prior disruptions/solutions
• U.S. Army Corps of Engineers
• Prior disruptions/solutions
• Prior disruptions/solutions
products and other products
• Prior disruptions/solutions
supply chain “nodes”)
• Prior disruptions/solutions
Quantity (data to characterize the quantity of goods moved); some of these data elements also are used to characterize network performance by weighting performance measures. Volume (e.g., # of trucks, railcars, TEUs weight (e.g., pounds, tonnage) Value (all by commodity type, if available)
• Trucking companies
• Highway Performance Monitoring System (HPMS)
• Statewide roadway inventories
• Classification counts
• FHWA Freight Analysis Framework (FAF)
• Global Insight TRANSEARCH
• Rail companies (CSX/NS)
• FAF • Global Insight
TRANSEARCH
• Individual shipping companies
• U.S. Army Corps of Engineers
• FAF • Global Insight
TRANSEARCH
• Major freight carriers, airlines
• FAF • Global Insight
TRANSEARCH
• Major carriers/shippers of gas and petroleum products and other products
• Global Insight TRANSEARCH
• Facility/carrier data at major facilities, centers
a ”Transload” refers to any of a multitude of “nodes” in the supply chain where goods are transferred from one mode to another (e.g., intermodal facilities, airports, ports, distribution centers). Dwell times capture the processing time for the mode transfer of goods. The inclusion of both a column (transload) and row (dwell times) is a redundancy to ensure all transfers of goods are included between all relevant modes.
b Mobility, reliability, and associated costs (Table 1 measures) can be computed from the travel time information. c Pilots and marine exchanges may have insights on Harbor Transit Time, which is unique to “water” transportation and considers the fact that every time a
vessel comes in or leaves the port, it must be boarded and piloted by a state-licensed pilot. Arranging for the pilot service, weather conditions, and congestion issues all impact the time it takes to get into or out of the port.
d Commercial sites, such as PortVision (http://www.portvision.com/) and ShipTracks (http://www.shiptracks.com/), capture and provide value-added services with these data.
e For more information, see Drewry Maritime research (http://www.drewry.co.uk/publications/about.php) and Journal of Commerce (http://www.joc.com/content/trans-pacific-eastbound-market-data).
Source: Reference (4).

NCHRP 08-36, Task 131 Transportation Data Integration to Develop Planning Performance Measures
Cambridge Systematics, Inc. 3-18
3.5 Case Study: Use of Nontraditional Mobility Performance Measures and Data Integration
Introduction
Mobility is defined as the ability to move between different destinations, while accessibility is defined as the number of destination opportunities. Mobility and accessibility are not theoretically synonymous. It is critical to conceptualize the relationship between various performance measures, such as mobility and accessibility, to understand these differences.
Multimodal performance measures should be established because they can capture the full extent of transportation system efficiency. It is vital that transportation agencies develop reliable and flexible multimodal performance measures to improve multimodal transportation investment decision-making.
This case study documents: 1) the comparison of two emerging performance measures regarding their assessment of the transportation system, Total Peak-Period Travel Time and Urban Macroscopic Network Accessibility Indicator; 2) the documentation of an expanded case study, Using Cellphone O/D Data for Regional Travel Model Validation, on its use of O/D data; and 3) the demonstration of an innovative application for data integration in Texas, TOSTADA (TOol using STAcked DAta). The analysis presented here is an extension of the one presented in the Task 3 technical memorandum.
The analysis is in three parts: 1) the comparison of two emerging performance measures regarding their assessment of the transportation system, Total Peak-Period Travel Time and Urban Macroscopic Network Accessibility Indicator; 2) the documentation of an expanded case study, Using Cellphone O/D Data for Regional Travel Model Validation, on its use of O/D data; and 3) the demonstration of the innovative application for data integration in Texas, TOSTADA (the TOol using STAcked Data). The overarching goal of this documentation is a focus on the data sources and how they can be used to meet planning needs, and to provide cursory guidance on the information technology tools that can be used to achieve integration.
Appendix E presents the technical details of the case study.
Case Study Key Findings
• The total peak-period travel time (TPPTT) performance measure allows an in-depth mode comparison and system assessment. Though automobile travel is the primary mode here based on the methodology assumptions, future work will focus on bringing in additional modes as multimodal data sources become available.
• Regarding the TPPTT performance measure, through developing data collection methods and technologies, it is anticipated that multimodal data will become available (e.g., bicycle travel time, pedestrian travel time, and telecommuting travel time) to fill existing multimodal data gaps. Though not mature yet, an approach such as the TPPTT that can integrate multiple modes provides a promising method for comprehensive assessment of the transportation system.
• As the first systematic approach using “consistent cumulative opportunity measurements” for metropolitan areas, the Urban Macroscopic Network Accessibility Indicator enables potential comparison of intra-metropolitan accessibility using “observed network speeds and measured network circuities.”
NCHRP 08-36, Task 131 Transportation Data Integration to Develop Planning Performance Measures
Cambridge Systematics, Inc. 3-19
• Regarding the Urban Macroscopic Network Accessibility Indicator performance measure, consistent geographical boundaries and employment densities are adopted in the research study. Differentiating accessibility by breaking down jobs by type can be a next step to better evaluate the accessibility. Computing accessibility for other transportation modes can be an extension (e.g., bicycle and pedestrian) for further consideration. Besides transportation modes, nonwork destinations (e.g., commercial, educational, and recreational destinations) also matter for evaluating the accessibility. New data sources are expected to yield informative results in the future.
• One of the applications of AirSage cellular origin-destination data is model validation. The Syracuse Metropolitan Transportation Council (SMTC) Travel Model is one example. When comparing town-to-town trips, the correlation between AirSage trips and the Model trips is more robust for total trips than trips by trip purposes. Comparison by trip purposes suggests that AirSage is more suitable for model validation at aggregated levels.
• The emerging approach in Texas, the TOol using STAcked DAta (TOSTADA), incorporates various factors (congestion, safety, pavement condition, bridge condition, and freight value) to “provide a comprehensive and consistent level of information.” Individual data map layers are visually stacked, using a GIS tool, to demonstrate the concept of integrating information about congestion, safety, pavement condition, bridge quality, and freight value. Information can be viewed through color-coded maps with scales, indicating the changing status of performance. A variety of factor-specific elements can be shown through the changes of color display between map layers. This allows for improved investment decision-making by aligning all roadway information together.
3.6 Data Challenges for Nontraditional Performance Measures
It is clear that obtaining data to support nontraditional performance measures presents challenges to practitioners. As a result, many of the new measures are qualitative in nature and are used as part of a scoring procedure. The next advancement in nontraditional performance measures is to transition from qualitative to quantitative measurement.
The current generation of vendor-supplied O/D data (i.e., the general demand for travel between origins and destination) offers great potential for supporting planning performance measures. These data represent the demand for travel between origins and destinations. AirSage cellular O/D data are emerging as a promising data source for next-generation travel demand models. INRIX and StreetLight Data are two acknowledged O/D data analysis tool providers in the U.S. Products such as INRIX InsightsTM Trips and StreetLight InSight® provide source of O/D data and trip matrices. Bluetooth has emerged as a potential means of collecting external travel survey data by agencies. So far, a combination of Bluetooth, cellular, and GPS appears to be the best approach for external travel survey data collection to capture traveler behaviors.
The availability of O/D travel-time data from vendors is a very recent event, and agencies have very little experience with them. These data are based on GPS and time measurements derived from individual vehicles. The data is referred to by a number of names: “paths,” “traces,” “trajectories,” “breadcrumbs,” and “waypoints” have all been used. The marketplace for O/D data is still maturing, and providers are not consistent in terms of:
NCHRP 08-36, Task 131 Transportation Data Integration to Develop Planning Performance Measures
Cambridge Systematics, Inc. 3-20
• How a “trip” is defined;
• How long the dwell time is before a trip is terminated; and
• What quality control has been applied to the data.
Team member TTI currently is conducting a research project for FHWA, entitled “New Technology Sources for Origin-Destination (O/D) Data.” This project is examining how these data can be used to support transportation modeling, but the lessons learned also are relevant for performance measurement. As of this writing, a report is unavailable, but a webinar has been recorded.5 With regard to GPS and time measurements from probe vehicles, the authors caution:
• GPS traces are available only when users turn on navigation session, particularly for the mobile application;
• Noncommercial GPS users may not immediately activate navigation session and may have intermittent use;
• Unlike cellular data, data sources can be biased towards specific user groups, such as freight vehicles;
• Data providers generally apply anonymization techniques in time and/or space to ensure privacy:
– First and last minutes of driving may be removed, and
– Provider also may scramble unique device IDs periodically.
Beyond new sources of O/D data, data challenges for supporting quantification for each major category of nontraditional performance measures can be identified as follows:
• Multimodal mobility performance measures. Identifying a single measure or small set of measures that can be used for the performance of multiple modes on an equal basis has been elusive. So-called multimodal measures in common use are actually specific to individual modes, which makes comparing the user experience across modes impossible. The major problem here is lack of data on the movement of individual travelers, mainly in terms of travel times. (Data on the demand for bicycle and pedestrian modes also is a major data gap.) Historically, travel time measurements have been taken at the facility level, and most recently at the vehicle level. Data on movements at the person-level are needed to support true multimodal performance measurement.
• Accessibility. Opportunities at the origin and destination of a trip are needed in addition to the travel time for a trip. New data sources for O/D patterns are becoming available, but nothing is known about the nature of the trip, especially the type of trip (e.g., work, shopping, recreational) and the type of traveler (e.g., commuter, low-income, business).
• Health. Data on the general health of individuals in a region are available, but are under the purview of nontransportation agencies. The challenge here is to build a collaborative effort with health mission agencies so that data sharing can ensue.
5 http://www.fhwa.dot.gov/planning/tmip/community/webinars/summaries/20160512/index.cfm.

NCHRP 08-36, Task 131 Transportation Data Integration to Develop Planning Performance Measures
Cambridge Systematics, Inc. 3-21
• Sustainability. Definitions of what constitutes “sustainability” vary from environmental impacts to broader cultural and economic impacts. Some of the references reviewed here cite the availability of data for sustainability measures, but in some cases no proof exists that the data could in fact be used for locally derived performance program. For some aspects of sustainability, new data collection is required to support potential measures, especially in the areas of ecosystem impacts, waste generation, and resource consumption.


NCHRP 08-36, Task 131 Transportation Data Integration to Develop Planning Performance Measures
Cambridge Systematics, Inc. 4-1
4.0 Future Research Needs
4.1 Introduction
Based on the critical gaps identified in earlier phases of the project, four Research Needs Statements (RNS) have been prepared. These RNSs will serve as the basis for future projects. They are presented as stand-alone projects, but they could be bundled into fewer but larger projects. The four RNSs are:
1. Incorporating Origin-Destination Data into Mobility Performance Measurement;
2. Development of Multimodal Measures for Mobility Performance Measurement;
3. Development of Nontraditional Performance Measures for Economic Accessibility; and
4. Development of Nontraditional Performance Measures for Land Use and Sustainability.

NCHRP 08-36, Task 131 Transportation Data Integration to Develop Planning Performance Measures
Cambridge Systematics, Inc. 4-2
Proposed Research Needs Statement #1 I. Problem Number 2017-xxx
II. Problem Title Incorporating Origin-Destination Data into Mobility Performance Measurement
III. Research Problem Statement New and more detailed data on speed and travel time has enabled mobility measures to evolve from those based primarily on volume, periodic speed and delay runs, and level of service. Continuous speed data have been available for some time in large urban areas from ITS systems, and more recently have been expanded geographically by private vendors who use various technologies and crowdsourcing techniques to monitor speed and delay. These sources have enabled agencies to measure mobility on more facilities and in greater detail. Estimates of delay hours and indices, such as planning time, buffer time, and travel time, have become more common and are used on both a regional and corridor basis. The main source of innovation identified has been in the application of delay measures to specific corridors and measures that relate specifically to the users, such as time lost per vehicle or commuter. Drilling in on specific areas impacted by delay and congestion will help to refine proposed strategies and regional plans and congestion management plans.
Most of the performance measures used for congestion and mobility are based on the fundamental measurements of travel time or speed. With a few additional data items, such as free-flow/ideal travel time, segment or trip length, and vehicle-miles of travel, a large array of performance measures can be created. These include such measures as delay, travel time indices, measures of reliability (which can be related to the distribution of travel times or on-time arrivals), accessibility, and measures related to duration and extent of congestion.
Accessibility (the ease with which the population can access jobs and services) is becoming a major aspect of mobility performance. However, direct measurement of accessibility – the actual (experienced) travel times users experience in accessing opportunities – has not yet been achieved. Instead, accessibility measures are derived from either regional travel demand models or through subjective assessments. New forms of origin-destination (O/D) data are just now becoming available from private vendors that should enable development of empirical accessibility measures, as well as other types of trip-based measures. Widespread use will wait until the profession gains experience with validating and processing these data. However, in the short-term research can be useful in determining how to integrate these sources of O/D data with other, more established data sources, and what measures can be generated that would help agencies to better evaluate their performance with regard to mobility-related goals and objectives.

NCHRP 08-36, Task 131 Transportation Data Integration to Develop Planning Performance Measures
Cambridge Systematics, Inc. 4-3
IV. Literature Search and Project Summary to Date Earlier memoranda developed for this task documented the current status of efforts to develop empirical O/D data sources. These include:
• Task 2 of this project included an extensive literature search on integrated data sources, including origin-destination data. Most sources identified were from modeled or simulated data.
• Task 3 of this project documented current methods being used to obtain real-time origin-destination data. These included Bluetooth, GPS, and cellular technology, as well as survey data.
• Task 4 of this project identified nontraditional/innovative performance measures currently in use by agencies and methodologies used to develop them.
V. Research Objective The overall objective of this proposed study is to develop guidance on how empirical origin-destination data can be used to enhance current and new mobility performance measures. Specific guidance is needed on the following topics:
• Use of O/D data to create current measures, such as travel time delay and various travel time indices;
• Breakdown of measures by market segment and/or geographic area;
• Development of new measures related specifically to O/D data;
• Use of O/D data in refinement of travel demand and simulation models currently used in performance measure estimation;
• Data collection/acquisition costs; and
• Data management needs and technical skills required.
Proposed tasks include the following:
1. Conduct update of literature search summarized in the NCHRP 8-36 Task 131 to identify recent research and developments in estimation of empirical Origin-Destination data.
2. Conduct scan of vendor products for O/D estimation, evaluate capabilities, and interview product users. Identify planned or proposed improvements to products.
3. Based on findings of Task 2, identify potential impacts of new and emerging technologies, such as DSRC and 5G on quality of O/D information.
4. Review existing mobility performance measures, and identify opportunities for incorporation of O/D data into specific measures.
5. Identify potential new or modified mobility measures that could be developed through use of O/D data, especially accessibility.
NCHRP 08-36, Task 131 Transportation Data Integration to Develop Planning Performance Measures
Cambridge Systematics, Inc. 4-4
6. Conduct two test case studies using O/D data. One case study will use incorporate O/D data into a current mobility performance measure, while the other will test a new measure using similar data. The case studies should provide step-by-step calculation guidance for performance measure development.
7. Summarize the results of case studies and implications for performance measurement and use of O/D data.
8. Develop recommendations for agency use of O/D data in mobility performance measurement.
9. Identify future research needs for next phase development.
VI. Estimate of Problem Funding and Research Period
Recommended Funding:
$100,000 per year
Research Period:
24 months
VII. Urgency, Payoff Potential, and Implementation This research project was developed by the NCHRP Task 8-36 Task 131. States and MPOs currently are faced with challenges in meeting requirements for Moving Ahead for Progress in the 21st Century (MAP-21), but procedures for some aggregate measures are well-developed. For planning and evaluation purposes, agencies would like measures that more closely map to the customer experience and greater integration of O/D data into performance measurement provides the opportunity to do this. Standards will be extremely useful in resolving many of the issues related to system data integration, compilation, and reporting.
This project was identified as a High Priority project by SCOP membership because of the current MAP-21 performance management requirements and concerns over broader data collection, management, and analysis issues.
The potential benefits of this research include the following:
1. Performance measures based on O/D data will enable agencies to better determine the impacts of congestion and proposed solutions on specific user markets.
2. O/D data can help agencies better determine the needs of transportation-disadvantaged groups, and the impacts of specific projects and proposals on their mobility.
3. O/D data can help in the calibration and validation of simulation models, and enable those models to provide a more accurate representation of customer experience.
4. The proposed research will raise the awareness that O/D is available and can be used to improve performance measurement.

NCHRP 08-36, Task 131 Transportation Data Integration to Develop Planning Performance Measures
Cambridge Systematics, Inc. 4-5
Proposed Research Needs Statement #2 I. Problem Number 2017-xxx
II. Problem Title Development of Multimodal Measures for Mobility Performance Measurement
III. Research Problem Statement Task 4 of this project included two case studies that addressed the need to look at mobility and accessibility measures in a more comprehensive manner, including evaluation of multiple modes of travel. Mobility is defined as the ability to move between different destinations while accessibility is defined as the number of destination opportunities. Mobility and accessibility are not theoretically synonymous. It is critical to conceptualize the relationship between various performance measures, such as mobility and accessibility, to understand these differences.
Multimodal performance measures should be established because they can capture the full extent of transportation system efficiency. It is vital that transportation agencies develop reliable and flexible multimodal performance measures to improve multimodal transportation investment decision-making. Performance measures using multiple modes need to be carefully considered in light of agency objectives. For example, strategies that shift auto users to transit and/or nonmotorized modes may increase overall travel time and reduce average speed. There are clearly other benefits, however, in the areas of safety, air quality, quality of life, and health. Thus, there are challenges in mixing quantitative and qualitative measures in addition to the fact that amount and quality of data may vary greatly for different measures.
This case study introduced in Task 2 and developed in Task 3 involved the comparison of two emerging performance measures regarding their assessment of the transportation system, Total Peak-Period Travel Time and Urban Macroscopic Network Accessibility Indicator, and [3] the demonstration of an innovative application for data integration in Texas, TOSTADA (TOol using STAcked DAta). The proposed research will build on these and other efforts to identify a set of potential multimodal performance measures, assess their compatibility with current agency goals and objectives, and evaluate the feasibility of integrating them with current measures.
IV. Literature Search and Project Summary to Date As noted above, earlier memoranda developed for this task documented literature, background research, and case studies that addressed the potential implementation of multimodal performance measures. These include:
• Task 2 of this project involved an extensive literature search, including information on data sources that could support multimodal performance measures and their potential integration into the planning process. Most sources identified were from modeled or simulated data.
• Task 3 of this project identified a series of multimodal performance measures and case studies that demonstrated their application. In particular, the Texas A&M Transportation Institute (TTI) reported the

NCHRP 08-36, Task 131 Transportation Data Integration to Develop Planning Performance Measures
Cambridge Systematics, Inc. 4-6
total peak-period travel time (TPPTT) in the 2012 Urban Mobility Report.6 The measure uses a weighted average (by mode share) of trip travel times during the morning and evening peak periods for individual modes.7 Average peak-period travel time is calculated for an individual mode, and then integrated into the updated TPPTT. The TPPTT performance measure allows an in-depth mode comparison and further impact assessment.
• Task 4 of this project included expanded versions of case studies that incorporated multimodal performance measures, including the TPPTT performance measure identified above.
V. Research Objective The overall objective of this proposed study is to advance the development of meaningful mobility and accessibility performance measures that incorporate and integrate multiple modes of transportation. These measures should be designed to help agencies to better identify transportation needs and evaluate the impact of proposed projects on all transportation users. Benefits will allow better assessment of transportation needs and impacts of different market segments, including transportation-disadvantaged groups.
Proposed tasks include the following:
1. Conduct update of literature search summarized in the NCHRP 8-36 Task 131 to identify recent research and developments related to multimodal performance measures.
2. Conduct in-depth interviews with a sample of agencies that are either implementing or attempting to implement multimodal performance measures. Interviews will identify which measures are being used or tested, and data sources being used and needs/gaps. Needs and gaps will include data, analytical tools, and technical skills.
3. Based on the results of Tasks 1 and 2, conduct a scan of technologies and analytical tools that can provide improved data to support multimodal measures. Examples would include technologies for obtaining better count data for nonmotorized users.
4. Summarize multimodal performance measured identified, including data and analytical tools required for support. Identify common needs and gaps that must be filled to encourage wider use.
5. Identify potential multimodal measures that could be developed and applied with emerging data sources and technologies.
6. Conduct two test case studies multimodal performance measures, incorporating both mobility- and accessibility-related measures.
6 Schrank, D., B. Eisele, and T. Lomax, T. 2012. TTI’s 2012 urban mobility report. Texas A&M Transportation Institute. The Texas A&M University System.
7 Lasley, P. 2015. Expanding Your Toolbox of Performance Measures at a Low Cost: A Total Peak-Period Travel Time Using Existing and Available Data. In Transportation Research Board 94th Annual Meeting (No. 15-4292).
NCHRP 08-36, Task 131 Transportation Data Integration to Develop Planning Performance Measures
Cambridge Systematics, Inc. 4-7
7. Summarize the results of case studies and implications for development and implementation of multimodal performance measures.
8. Develop guidelines for agency use of multimodal performance measures.
9. Identify future research needs for next phase development.
VI. Estimate of Problem Funding and Research Period
Recommended Funding:
$150,000 per year
Research Period:
12 months
VII. Urgency, Payoff Potential, and Implementation This research project was developed by the NCHRP Task 8-36 Task 131. States and MPOs currently are faced with challenges in meeting requirements for MAP-21, but procedures for some aggregate measures are well-developed. Performance measures are focused heavily on highway users with many agencies developing more sophisticated transit measures as well. New probe data sources have been particularly helpful in developing highway measures. There is, however, room for improvement; and there is still very little data available on nonmotorized modes, even though usage is increasing rapidly in many areas. In addition, agencies are in the early stages of integrating this information for mobility and accessibility measures.
The potential benefits of this research include the following:
1. Agencies will gain a better understanding of how multimodal measures can be developed in their planning process. The project will raise awareness of these measures and how they can help agencies support investment decisions.
2. Agencies will improve their ability to evaluate the impacts of nonmotorized modes, which can provide benefits in terms of public health, congestion relief, and air quality. Improved evaluation will help to support implementation of more projects.
3. Vendors supplying data to agencies will have better information on agency needs and where gaps exist in data collection and analysis.
4. The work will help lead to more meaningful measures of mobility and accessibility that reflect the customer experience of all system users in an equitable manner.

NCHRP 08-36, Task 131 Transportation Data Integration to Develop Planning Performance Measures
Cambridge Systematics, Inc. 4-8
Proposed Research Needs Statement #3 I. Problem Number 2017-xxx
II. Problem Title Development of Nontraditional Performance Measures for Economic Accessibility
III. Research Problem Statement Economic Accessibility
There has been increasing interest among planning agencies in measures of economic accessibility. These measures help agencies identify how well the transportation system is performing in providing access to jobs, education, and other economic opportunities. While mobility measures can provide average travel times and their reliability, economic access measures are intended to go deeper and identify populations and geographic areas that may be disadvantaged in termed of access due to lack of system connections, such as limited or indirect transit service. The ability of low-income residents to reach job opportunities in suburban locations is of particular concern.
Congestion Management Plans and Long-Range Plans are beginning to incorporate these measures, including measures such as population within a specific distance of transit routes (usually one-quarter mile) or travel time to specific major employments centers from residential areas. While these measures can be helpful in identifying potential gaps and needs, they are relatively static and do not provide a full picture of economic accessibility. Measures that go farther in doing this can be complex and require extensive amounts of data and sophisticated analytical tools. Advances in computer power and the increasing sophistication of GIS tools, however, have made these measures more feasible to develop, update, and communicate to decision-makers and the public. More agencies are now attempting to implement them and utilize them in investment decisions, but many still struggle with the data collection and processing requirements; and these challenges are exacerbated by personnel turnover and lack of training.
It is critical that both data and analytic procedures for both monitoring trends in and the forecasting of economic accessibility be identified. Guidance on how to develop input data and apply methods needs to be specified.
Transportation is now widely recognized as a key component in supporting workforce training and development. As the labor force ages, new effort is needed to make sure individuals in transportation disadvantaged communities have reasonable access to a range of economic opportunities, including education and training. This project will support that effort by identifying best practices in development and implementation of economic accessibility performance measures, and will provide guidance to agencies wishing to establish a measurement program for economic accessibility.

NCHRP 08-36, Task 131 Transportation Data Integration to Develop Planning Performance Measures
Cambridge Systematics, Inc. 4-9
IV. Literature Search and Project Summary to Date As noted above, earlier memoranda developed for this task documented literature, background research, and case studies that addressed the potential implementation of multimodal performance measures. These include the following:
• Task 2 of this project involved an extensive literature search, including information on data sources that could support nontraditional measures, such as economic accessibility and their potential integration into the planning process. Most sources identified were from modeled or simulated data.
• Task 3 of this project identified a series of nontraditional performance measures both recommended and in use by agencies, as well as case studies that focused on simultaneous application of multiple performance measures.
• Task 4 of this project included expanded versions of case studies that incorporated multimodal performance measures. A compendium of nontraditional performance measures is provided, including those related to economic accessibility. Examples of these include:
– Region commute time planning area with region divided into Core cities, mature suburbs, and growing suburbs (Delaware Valley Regional Planning Commission);
– Number of jobs within 30 minutes (car) and 45 minutes (transit) (Metropolitan Transportation Commission – San Francisco Bay Area);
– Percent of income spent on housing and transportation (Southern California Association of Governments (SCAG)); and
– Distribution of travel time savings and travel distance reductions by demographic group (low-income, minority) (Southern California Association of Governments).
V. Research Objective The overall objective of this proposed study is to advance the development of meaningful economic accessibility measures. These measures should be designed to help agencies to better conduct baseline assessments of current economic accessibility, use these measures to identify transportation needs, and evaluate the impact of proposed projects on all transportation users by market segment.
Proposed tasks include the following:
1. Conduct update of literature search summarized in the NCHRP 8-36 Task 131 to identify recent research and developments related to economic accessibility performance measures.
2. Conduct in-depth interviews with a sample of agencies that are either implementing or attempting to implement economic accessibility performance measures. Agencies identified to date include Delaware Valley Planning Commission, Metropolitan Transportation Commission, LA Metro, Southern California Association of Governments, and Little Rock Metroplan. Additional agencies will be identified as part of this task. Interviews will identify which measures are being used or tested, data sources being used, data processing techniques, and software and needs/gaps. Needs and gaps will include data, analytical tools, and technical skills.

NCHRP 08-36, Task 131 Transportation Data Integration to Develop Planning Performance Measures
Cambridge Systematics, Inc. 4-10
3. Based on the results of Tasks 1 and 2, conduct a scan of technologies and analytical tools that can provide improved data to support economic accessibility measures. These will focus on use of GIS and economic data, along with new sources of transportation system data.
4. Summarize economic accessibility performance measured identified including data and analytical tools required for support. Identify common needs and gaps that must be filled to encourage wider use.
5. Identify potential economic accessibility measures that could be developed and applied with emerging data sources and technologies.
6. Conduct two test case studies with economic accessibility measures, incorporating both mobility and economic data. These case studies may build on some of the agency measures already being developed or may be new case studies. This will be determined after the scan and interviews conducted in Tasks 1 and 2.
7. Summarize the results of case studies and implications for development and implementation of economic accessibility performance measures.
8. Develop guidelines for agency use of economic accessibility performance measures.
9. Identify future research needs for next phase development.
VI. Estimate of Problem Funding and Research Period
Recommended Funding:
$150,000 per year
Research Period:
12 months
VII. Urgency, Payoff Potential, and Implementation This research project was developed by the NCHRP Task 8-36 Task 131. Economic accessibility measures are becoming more important to agencies in justifying capital investment in both highway and transit projects. While increasing amounts of data are available to develop these measures, tools and technical skills are still lacking. It is not currently clear which measures are most meaningful or can be sustained and updated on a regular basis. It also is important that these measures be comprehensible to decision-makers and those in the general public who are active in transportation planning. Agencies can benefit from guidance on how to develop these measures and apply them in the planning and capital investment process.
The potential benefits of this research include the following:
1. Agencies will gain a better understanding of how economic accessibility measures can be developed in their planning process. The project will raise awareness of these measures, why they are helpful in achieving transportation goals and objectives, and how they can help agencies support investment decisions.

NCHRP 08-36, Task 131 Transportation Data Integration to Develop Planning Performance Measures
Cambridge Systematics, Inc. 4-11
2. Agencies will improve their ability to evaluate the economic impacts of proposed transportation improvements, particularly on specific markets and transportation-disadvantaged populations. Improved evaluation will help to support implementation of projects that provide economic benefit, and document those benefits.
3. The research will identify what data sources can be used in developing economic accessibility performance measures, along with gaps/needs in the data area.

NCHRP 08-36, Task 131 Transportation Data Integration to Develop Planning Performance Measures
Cambridge Systematics, Inc. 4-12
Proposed Research Needs Statement #4 I. Problem Number 2017-xxx
II. Problem Title Development of Nontraditional Performance Measures for Land Use and Sustainability
Research Problem Statement
There has been increasing interest among planning agencies in measuring the impacts of transportation on land use and sustainability. Agencies recently have shown an interest in looking at the impacts of transportation on land use, with an eye toward helping encourage development and redevelopment that reduces congestion and vehicle-miles of travel and encourages use of alternate modes. Part of this interest is in promoting better health by providing safer and more convenient opportunities for walking and bicycling; and improved access to recreational facilities, including parks, playgrounds, and trail facilities. Traditionally, sustainability and environmental measures have focused on measurable impacts, particularly air quality and noise. More detailed environmental analysis, such as impact on wetlands and wildlife, has been conducted at the project level and part of environmental assessments and impacts statements. There has recently been interest in adopting these types of measures at the planning level, although at a lesser level of detail. Additional measures, such as impact on recreational areas and preservation of agricultural and other open lands, also are being considered.
There is a number of considerations in development and applications of these measures. Land use and sustainability impacts can change slowly over time, and the impacts on the transportation system may take somewhat longer. For example, it can take a number of years to fully build out a transit-oriented developments, and then additional time for users to adjust their transportation choices. As a result, the schedule for updating these measures will differ. These measures, like some other nontraditional measures, rely on the use of GIS tools and a combination of environmental, land use, demographic, and transportation system data. They can thus can be complex and require extensive amounts of data, as well as sophisticated analytical tools. Much of the information needed comes from agencies outside the transportation realm, thus, requiring interagency coordination and the ability to exchange large datasets. Advances in computer power and the increasing sophistication of GIS tools, however, have made these measures more feasible to develop, update, and communicate to decision-makers and the public. More agencies are now attempting to implement them and utilize them in investment decisions, but many still struggle with the data collection and processing requirements, and these challenges are exacerbated by personnel turnover and lack of training. This project will support that effort by identifying best practices in development and implementation of land use and sustainability performance measures, and will provide guidance to agencies wishing to set up and apply these measures as part of the planning process.
NCHRP 08-36, Task 131 Transportation Data Integration to Develop Planning Performance Measures
Cambridge Systematics, Inc. 4-13
III. Literature Search and Project Summary to Date As noted above, earlier memoranda developed for this task documented literature, background research, and case studies that addressed the potential implementation of multimodal performance measures. These include the following:
• Task 2 of this project involved an extensive literature search, including information on data sources that could support nontraditional measures related to land use and sustainability and their potential integration into the planning process. Most sources identified were from modeled or simulated data.
• Task 3 of this project identified a series of nontraditional performance measures both recommended and in use by agencies, as well as case studies that focused on simultaneous application of multiple performance measures.
• Task 4 of this project included expanded versions of case studies that incorporated multimodal performance measures. The Task Report noted that “More sophisticated measures of environment and sustainability are being used for both reporting purposes and for project screening and selection. GIS applications are helping agencies provide greater granularity in these measures, but they also face challenges in incorporating these measures into Congestion Management Plans, Long-Range Plans, and other project-oriented documents. Measures can be difficult to explain to the public and decision-makers and costly to update on a frequent basis.” A compendium of nontraditional performance measures is provided, including those related to land use and sustainability. Examples of these include:
– Premature deaths due to long-term exposure to particulate matter (Metropolitan Transportation Commission – San Francisco Bay Area);
– Share of regional population that lives within walkable distance to a park – defined as one-half-mile distance (Southern California Council of Governments);
– Health Impact Assessment (HIA) – correlation of obesity rates and transportation accessibility factors8 (Champaign-Urbana Urban Area Transportation Study); and
– Number of projects that intersect high-value environmental habitat (Portland Metro).
IV. Research Objective The overall objective of this proposed study is to advance the development of meaningful land use and sustainability measures that can be applied at the plan development level. Specifically, guidance on what measures should be used and standard procedures for developing them will be developed, including data requirements, scoring methods, and presentation in planning documents
8 Obesity rates were generally lower in neighborhoods that had higher population density, better land use mix, higher accessibility to jobs and services, and better transit connectivity. Based on the results of the HIA, a health index was developed that was used to rate the built environment variables of different planning areas in terms of their impact on levels of physical activity and local health. http://lrtp.cuuats.org/lrtp-main_011615_reduced_6-public-health/.

NCHRP 08-36, Task 131 Transportation Data Integration to Develop Planning Performance Measures
Cambridge Systematics, Inc. 4-14
Proposed tasks include the following:
1. Conduct update of literature search summarized in the NCHRP 8-36 Task 131 to identify recent research and developments related to land use and sustainability performance measures.
2. Conduct in-depth interviews with a sample of agencies that are either implementing or attempting to implement economic accessibility performance measures. Agencies identified to date include Southern California Association of Governments, Metropolitan Transportation Commission (San Francisco Bay Area), Portland (Oregon) Metro, and Champaign-Urbana Urban Area Transportation Study. Additional agencies will be identified as part of this task; and may include agencies or nonprofit groups that address questions related to health, environment, and transportation. Interviews will identify which measures are being used or tested, data sources being used, data processing techniques, and software needs/gaps. Needs and gaps will include data, analytical tools, and technical skills.
3. Based on the results of Tasks 1 and 2, conduct a scan of technologies and analytical tools that can provide improved data to support economic accessibility measures. Innovative techniques, such as use of Strava9 data, have helped planners to obtain a better idea of nonmotorized mode usage. These will focus on use of GIS and environmental data, along with new sources of transportation system and demographic data.
4. Summarize land use and sustainability performance measures identified, including data and analytical tools required for support. Identify common needs and gaps that must be filled to encourage wider use.
5. Identify potential land use and sustainability accessibility measures that could be developed and applied with emerging data sources and technologies.
6. Conduct two test case studies, one with land use-related measures and one focusing on sustainability/health measures, incorporating both mobility and economic data. These case studies may build on some of the agency measures already being developed or may be new case studies. This will be determined after the scan and interviews conducted in Tasks 1 and 2.
7. Summarize the results of case studies and implications for development and implementation of economic accessibility performance measures.
8. Develop guidelines for agency use of land use and environmental performance measures.
9. Identify future research needs for next phase development.
9 https://www.strava.com/.

NCHRP 08-36, Task 131 Transportation Data Integration to Develop Planning Performance Measures
Cambridge Systematics, Inc. 4-15
V. Estimate of Problem Funding and Research Period
Recommended Funding:
$100,000 per year
Research Period:
24 months
VI. Urgency, Payoff Potential, And Implementation This research project was developed by the NCHRP Task 8-36 Task 131. Land use and environmental measures are becoming more important to agencies in justifying capital investment in a variety of projects including nonmotorized projects. There is increasing interest in understanding the impact of land use decisions on transportation system user choices, including both location decisions and modal choice. While increasing amounts of data are available to develop these measures, tools and technical skills are still lacking. It is not currently clear which measures are most meaningful or can be sustained and updated on a regular basis. It also is important that these measures be comprehensible to decision-makers and those in the general public who are active in transportation planning. Agencies can benefit from guidance on how to develop these measures and apply them in the planning and capital investment process.
The potential benefits of this research include the following:
1. Agencies will gain a better understanding of how land use and environmental measures can be developed in their planning process. The project will raise awareness of these measures, why they are helpful in achieving transportation goals and objectives, and how they can help agencies support investment decisions.
2. Agencies will improve their ability to evaluate the land use and environmental impacts of proposed transportation improvements, particularly on land use/development decisions and transportation-disadvantaged populations. Improved evaluation will help to support implementation of projects that enhance environmental quality and health.
3. The research will identify what data sources can be used in developing land use/environmental accessibility performance measures, along with gaps/needs in the data area.


NCHRP 08-36, Task 131 Transportation Data Integration to Develop Planning Performance Measures
Cambridge Systematics, Inc. A-1
Appendix A. References for the Literature Review [1] Woldesenbet, A., H. D. Jeong, and H. Park, H. (2015). Framework for Integrating and Assessing Highway Infrastructure Data. Journal of Management in Engineering, 32(1), 04015028.
[2] Park, H., S. Jung, and C. Oh. (2015). Developing Novel Performance Measures of Traffic Safety by Integrating RWIS and VDS Data. In Transportation Research Board 94th Annual Meeting (No. 15-2684).
[3] Chen, C. H. P., Y. Wang, L. Yue, and G. A. Naylor. (2015). Management and Integration of Data and Travel Demand Modeling at the Santa Clara County Congestion Management Agency. In Transportation Research Board 94th Annual Meeting (No. 15-1383).
[4] Seedah, D., A. Cruz-Ross, B. Sankaran, P. La Fountain, P. Agarwal, H. Kim, and C. M. Walton. (2014). Integrating public and private data sources for freight transportation planning (No. FHWA/TX-14/0-6697-CTR-1).
[5] Kruse, C. J., A. Protopapas, D. Bierling, L. E. Olson, B. Wang, and M. Khodakarami. (2014). Integrating MTS Commerce Data with Multimodal Freight Transportation Performance Measures to Support MTS Maintenance Investment Decision-Making (No. Project NCFRP-42).
[6] International, ICF. (2014). Integration of National-Level Geospatial Ecological Tools and Data. SHRP 2 Report (No. S2-C40A-RW-1)
[7] Hall, J. P. (2013). Integrating Spatial and Business Data for Improved Decisions: A Peer Exchange: May 4-5, 2013, Boise, Idaho. Transportation Research Board.
[8] Bikonis, K., and J. Demkowicz. (2013). Data Integration from GPS and Inertial Navigation Systems for Pedestrians in Urban Area. TransNav: International Journal on Marine Navigation and Safety of Sea Transportation, 7(3).
[9] Lewis, M., and A. Woldesenbet. Data and Information Integration Framework for Highway Project Decision-Making. No. OTCREOS11. 1-30-F. 2013.
[10] Kieu, L. M., A. Bhaskar, and E. Chung. (2012). “Bus and car travel time on urban networks: integrating bluetooth and bus vehicle identification data.”
[11] CTC & Associates LLC. 2012. Integrating Transit Data into State Highway Planning. California Department of Transportation, Division of Research and Innovation. (OCLC 904296626).
[12] Walters, J., C. Breiland, G. Jimenez, and R. Lee. (2012). Improved Data and Tools for Integrated Land Use-Transportation Planning in California.
[13] Duthie, J., N. R. Juri, C. L. Melson, C. M. Pool, and S. Boyles. (2012). Guidebook on DTA Data Needs and Interface Options for Integration into the Planning Process (No. 0-6657-P1).
[14] Hunter, M., R. Fujimoto, A. Guin, J. Laval, D. Henclewood, W. Suh, and P. Chari. (2012). Real Time Estimation of Arterial Travel Time and Operational Measures Through Integration of Real Time Fixed Sensor Data and Simulation (No. FHWA-GA-12-0901).

NCHRP 08-36, Task 131 Transportation Data Integration to Develop Planning Performance Measures
Cambridge Systematics, Inc. A-2
[15] Duhindan, N., and S. Robinson. (2012). Integration of AVL and AFC Data for Network Planning. In 19th ITS World Congress.
[16] Pack, M. L. (2011). The Integration of Multi-State Clarus Data into Real-time and Archived RITIS Data Visualization Tools (No. FHWA-JPO-12-008).
[17] Pooley, C., D. Whyatt, M. Walker, G. Davies, P. Coulton, and W. Bamford. (2010). Understanding the school journey: integrating data on travel and environment. Environment and Planning A, 42(4), 948-965.
[18] Guo, J. Y., and S. Gandavarapu. (2010). Data Integration and Partnership for Statewide Transportation Planning (No. WHRP 10-02).
[19] Chiao, K. A., and X. Jin. (2010). New York Transportation Information Gateway: Integrating Planning Data, Models, and Visualization Tools. In Transportation Research Board 89th Annual Meeting (No. 10-1174).
[20] Li, Y., N. Koncz, and J. Overman. (2009). Analysis and Integration of Spatial Data for Transportation Planning (No. FHWA/TX-09/0-5696-1). Texas Transportation Institute, Texas A&M University System.
[21] Figliozzi, M., and K. A. Tufte. (2009). Prototype for freight data integration and visualization using online mapping software: Issues, applications, and implications for data collection procedures. In Transportation Research Board 88th Annual Meeting (No. 09-3820).
[22] Adams, T. M. (2008). Synthesis of Best Practices for the Development of an Integrated Data and Information Management Approach. No. MRUTC 03-02.
[23] Pollack, J. (2008). IRRIS® Technology: A Data Integration, Analysis, and Visualization Tool to Support ITS Operations. In 15th World Congress on Intelligent Transport Systems and ITS America’s 2008 Annual Meeting.
[24] Hranac, R. (2008). Data Systems to Support Integrated Corridor Management. In 15th World Congress on Intelligent Transport Systems and ITS America’s 2008 Annual Meeting.
[25] Xiong, D., F. Zhao, L. F. Chow, and S. Chung. (2007). Integrating Data and Models for Analysis of Freight Movements on Multimodal Transportation Systems for Florida (No. BD-015-13).
[26] Szrejber, G., A. Hadayeghi, B. Malone, and J. Reid. (2007). Tools for Improving Safety. Integration of Data Capture, Storage, Safety Analysis, and GIS in Collision Reduction. In ITE 2007 Annual Meeting and Exhibit.
[27] Schill, K. (2006). Migrating from Data Silos to Data Consolidation: An Evaluation of Integration Solutions. In 2006 Bus and Paratransit Conference.
[28] Guin, A. (2014). Integrating Intersection Traffic Signal Data Into a Traffic Monitoring Program (No. FHWA-GA-14-1310).
[29] Scopatz, R., Y. Zhou, A. Wojtowicz, D. Carter, S. Smith, and P. Harrison. (2014). Michigan Roadsoft: Integration of State and Local Safety Data (No. FHWA-SA-14-035).

NCHRP 08-36, Task 131 Transportation Data Integration to Develop Planning Performance Measures
Cambridge Systematics, Inc. A-3
[30] Scopatz, R., Y. Zhou, A. Wojtowicz, D. Carter, S. Smith, and P. Harrison. (2014). Wisconsin Information System Local Roads: State and Local Data Integration (No. FHWA-SA-14-037).
[31] Scopatz, R., Y. Zhou, A. Wojtowicz, D. Carter, S. Smith, and P. Harrison. (2014). Ohio Location-Based Response System: State and Local Data Integration (No. FHWA-SA-14-036).
[32] Scopatz, R., Y. Zhou, A. Wojtowicz, D. Carter, S. Smith, and P. Harrison. (2014). Tennessee Roadway Information System: State and Local Data Integration (No. FHWA-SA-14-038).
[33] Bell, K. E., M. A. Figliozzi, A. Y. Bigazzi, and A. Moore. (2014). Identification and Characterization of PM2.5 and VOC Hot Spots on Arterial Corridor by Integrating Probe Vehicle, Traffic, and Land Use Data. In Transportation Research Board 93rd Annual Meeting (No. 14-5660).
[34] Agarwal, S., A. Sancheti, R. Khaddar, and P. Kachroo. (2013). Geospatial Framework for Integration of Transportation Data Using Voronoi Diagrams. In Transportation Research Board 92nd Annual Meeting (No. 13-5378).
[35] Christoforou, Z., S. Cohen, and M. G. Karlaftis. (2012). Integrating real-time traffic data in road safety analysis. Procedia-Social and Behavioral Sciences, 48, 2454-2463.
[36] Wix, R. 2012. Integration of existing and emerging data collection technologies in Australia.
[37] Bell, M., F. Galatioto, G. Hill, and P. Rose. (2011). Using an integrated data platform to evaluate the environmental impact of events and ITS interventions. In 18th ITS World Congress.
[38] Georgia, A., M. Morfoulaki, and E. Mitsakis. (2008). An Online Portal for Integrated Transportation Data Management and Processing. In 15th World Congress on Intelligent Transport Systems and ITS America’s 2008 Annual Meeting.
[39] Lewis, M., and A. Woldesenbet. (2013). Data and Information Integration Framework for Highway Project Decision-Making (No. OTCREOS11. 1-30-F).
[40] Cheng, Y., S. T. Parker, and B. Ran. (2013). Enhanced Analysis of Crashes in the Proximity of Work Zones through Integration of Statewide Crash Data with Lane Closure System Data. Information Systems, 19, 20.
[41] Wang, L., and K. Kim. (2014). Continuous Data Integration for Land Use and Transportation Planning and Modeling. National Institute for Transportation and Communities. (NITC-RR-581).
[42] Buttlar, W. G., and M. S. Islam. (2014). Integration of Smart-Phone-Based Pavement Roughness Data Collection Tool with Asset Management System (No. NEXTRANS Project No. 098IY04).
[43] Center for Transportation Research, The University of Texas at Austin. (2014). Integration of Data Sources to Optimize Freight Transportation in Texas. Texas Department of Transportation. (0-6697-CTR-P2).
[44] Masek, N. P. (2011). Successful Integration of ITS in the Regional Transportation Planning Process. The Mid Region Council of Governments: Coordinated ITS Project planning, maintaining the Regional Architecture and ITS Infrastructure Data Integration Using GIS. In 18th ITS World Congress.

NCHRP 08-36, Task 131 Transportation Data Integration to Develop Planning Performance Measures
Cambridge Systematics, Inc. A-4
[45] Pendyala, R. M. (2003). Data Integration Procedures in Support of Statewide Transportation Modeling and Planning Processes. Florida Department of Transportation.
[46] Schrank, D., and T. Lomax. (2014). TOol using STAcked DAta(TOSTADA): Final Report. Transportation Policy Research Center Report PRC 14-27-F. Texas A&M Transportation Institute.

NCHRP 08-36, Task 131 Transportation Data Integration to Develop Planning Performance Measures
Cambridge Systematics, Inc. B-1
Appendix B. Summary of Literature Review

NC
HR
P 08-36, Task 131
Transportation Data Integration to D
evelop Planning Perform
ance Measures
Cam
bridge Systematics, Inc.
B-2
Table B.1 Literature Review Summary
Title Synopsis Data Category Planning Function Data Gaps Emerging concepts Framework for Integrating and Assessing Highway Infrastructure Data
Integrate highway infrastructure data and assess the level of effective use of data to generate information and support management decisions from a holistic network viewpoint through HIDI.
ITS-Generated Traffic Data/Safety Data/Work Zone Data
Asset Management/Safety Planning
N/A N/A
Developing Novel Performance Measures of Traffic Safety by Integrating RWIS and VDS Data
Estimate spacing levels as performance measures of traffic safety to provide valuable safety-related information so road users can actively avoid traffic accidents.
ITS-Generated Traffic Data/Safety Data/Work Zone Data/Weather Data
Safety Planning/Traffic Monitoring
Increased data collection for reliable KNN parameters; Use LOHSI to define high-risk conditions.
Investigate other weather-related factors, such as traffic volume for further safety measurements.
Management and Integration of Data and Travel Demand Modeling at the Santa Clara County Congestion Management Agency
Develop and maintain a countywide travel demand model used for estimating future transportation needs and impacts caused by growth in population and jobs.
All All N/A Working document to be updated as priorities and technologies change.
Integrating Public and Private Data Sources for Freight Transportation Planning
Explore the feasibility of an outreach effort of data integration between the private and public sectors to ensure adequate freight planning and funding of transportation infrastructure at the state and local levels.
ITS-Generated Traffic Data/Safety Data/Work Zone Data
Travel Demand Forecasting Models/Performance Monitoring/Safety Planning/Advanced Models
Limitations identified in existing public and commercial databases. Databases do not provide on in-city or zip code O/D trips; privately owned Transearch database provides information at the county level, but the actual source of data is unknown due to proprietary reasons.
Rigorous outreach to public and private sectors, and follow-up effort to sustain the success of any freight data sharing partnership; cooperative relationships with trade associations and industry experts; funding to sustain the program and cover cost of operations;
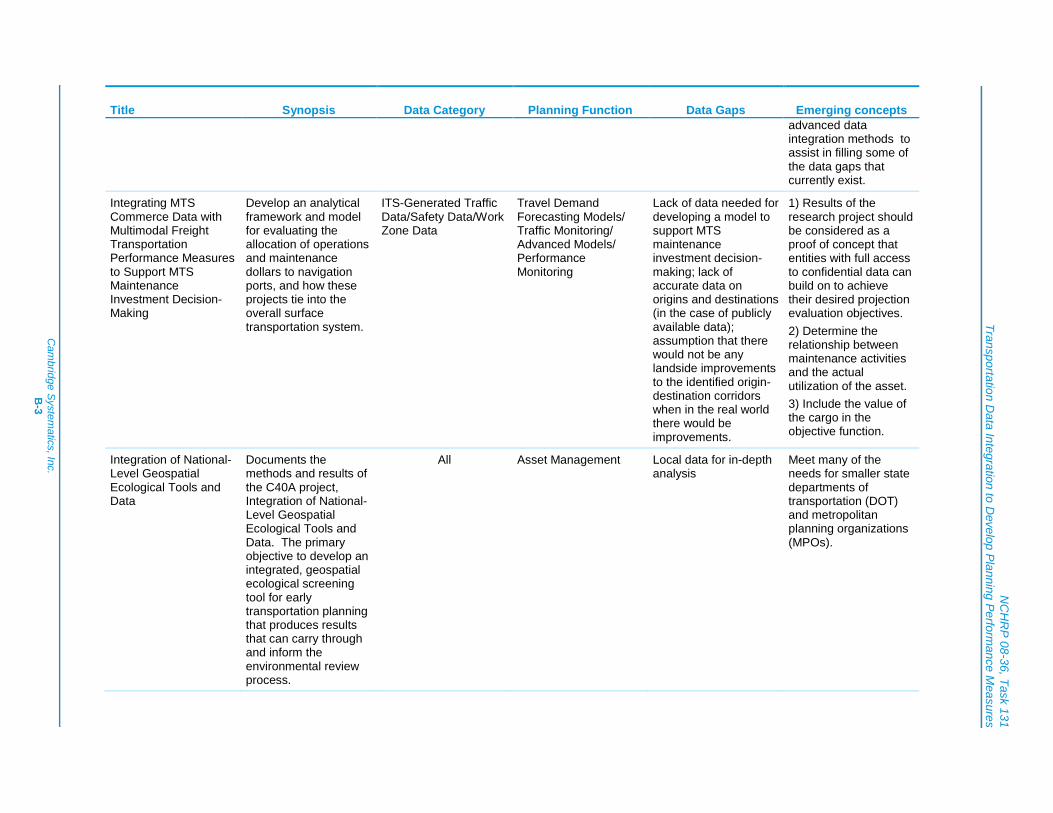
NC
HR
P 08-36, Task 131
Transportation Data Integration to D
evelop Planning Perform
ance Measures
Cam
bridge Systematics, Inc.
B-3
Title Synopsis Data Category Planning Function Data Gaps Emerging concepts advanced data integration methods to assist in filling some of the data gaps that currently exist.
Integrating MTS Commerce Data with Multimodal Freight Transportation Performance Measures to Support MTS Maintenance Investment Decision-Making
Develop an analytical framework and model for evaluating the allocation of operations and maintenance dollars to navigation ports, and how these projects tie into the overall surface transportation system.
ITS-Generated Traffic Data/Safety Data/Work Zone Data
Travel Demand Forecasting Models/Traffic Monitoring/Advanced Models/Performance Monitoring
Lack of data needed for developing a model to support MTS maintenance investment decision-making; lack of accurate data on origins and destinations (in the case of publicly available data); assumption that there would not be any landside improvements to the identified origin-destination corridors when in the real world there would be improvements.
1) Results of the research project should be considered as a proof of concept that entities with full access to confidential data can build on to achieve their desired projection evaluation objectives. 2) Determine the relationship between maintenance activities and the actual utilization of the asset. 3) Include the value of the cargo in the objective function.
Integration of National-Level Geospatial Ecological Tools and Data
Documents the methods and results of the C40A project, Integration of National-Level Geospatial Ecological Tools and Data. The primary objective to develop an integrated, geospatial ecological screening tool for early transportation planning that produces results that can carry through and inform the environmental review process.
All Asset Management Local data for in-depth analysis
Meet many of the needs for smaller state departments of transportation (DOT) and metropolitan planning organizations (MPOs).

NC
HR
P 08-36, Task 131
Transportation Data Integration to D
evelop Planning Perform
ance Measures
Cam
bridge Systematics, Inc.
B-4
Title Synopsis Data Category Planning Function Data Gaps Emerging concepts Integrating Spatial and Business Data for Improved Decisions: A Peer Exchange
Explore the current best practices for integrating spatial and business data and, establish strategies to overcome existing barriers to implementing these solutions.
All All N/A Capability Maturity Model for the Integration and Use of Geospatial and Business Data; Spatial Portrayal of Performance Measures; Peer exchange of aligning data systems to communicate with decision-makers supporting risk-based asset management.
Data Integration from GPS and Inertial Navigation Systems for Pedestrians in Urban Area
Integrate EKF with GPS/INS systems, for pedestrians in an urban area, to mitigate for INS drifts, GPS outages, dense multipath effect and other individual problems associated with the sensors.
ITS-Generated Traffic Data/Incident Data/Work Zone Data
Travel Demand Forecasting Models/Performance Monitoring/Safety Planning/Advanced Models
Long-term GPS outage is not considered; System performance gaps for the GPS, such as weak signal, obstruction in urban areas due to tall buildings and other obstacles.
Future work will focus on the improvement of the localization accuracy in long-term operations.
Data and Information Integration Framework for Highway Project Decision-Making
Integrate data, information, and decision-making in highway project and illustrate the relationship between data, information, and decision-making.
Infrastructure Data/Safety Data
Asset Management/Safety Planning
Scope of the study is limited to the technical aspects of three case studies over the life-cycle of highway projects. A well-documented path supported with data analysis was missing. The preconstruction database has a relatively well-developed system compared to the construction database, but there is a gap in terms of converting the
Skilled data analysts and/or experts to analyze data and convert these data into information and knowledge to integrate data, information, and decision-making. A database system that can address potential users.

NC
HR
P 08-36, Task 131
Transportation Data Integration to D
evelop Planning Perform
ance Measures
Cam
bridge Systematics, Inc.
B-5
Title Synopsis Data Category Planning Function Data Gaps Emerging concepts collected data to information.
Bus and car travel time on urban networks: integrating Bluetooth and bus vehicle identification data
Exploring the relationship between not-in-service bus and car travel time as well as the relationship between in-service bus and car travel.
ITS-Generated Traffic Data
Traffic Monitoring/Travel Demand Forecasting Models/Performance Monitoring/Advanced Models
The number of VID samples is not large since VID sensors only identify the bus passing by. The sample size is not enough for the B&W or MAD filter to be applied.
The paper explores the relationship between bus and car travel times and the results are very promising. The researchers are currently analyzing the whole Brisbane network to generalize the findings.
Integrating Transit Data into State Highway Planning
Integrate transit data into its processes for planning and managing the state highway system in the most effective manner by analyzing methods of other transportation agencies.
All All A lack of literature directly discussing the challenges of integrating transit data into planning for a state highway system as a whole. States with large transit systems did not respond to the survey. Unable to reach Nevada and Rhode Island – two of the few survey states to incorporate transit data into state highway planning-for follow-up interviews.
Explore FTIS, which integrates more than 20 years of NTD data.
Improved Data and Tools for Integrated Land Use-Transportation Planning in California
Detailed report on the built environment and travel survey data for over 200,000 specific locations in California, and this data is incorporated into scenario/ sketch planning tools and travel demand forecasting models.
ITS-Generated Traffic Data/Safety Data/Work Zone Data
Traffic monitoring/Travel Demand Forecasting Models/Performance Monitoring/Safety Planning/Advanced Models
Most travel demand forecasting (TDF) models have significant “blind spots” regarding connectivity offered by local circulation networks, walking environments, and land uses. These blind spots include circulation network,
The study serves as a template and important initial step toward an ongoing process of systematized analysis of transportation and land use interactions as updated data becomes available in the future. Potential applications of the results of this project are conducting regional integrated

NC
HR
P 08-36, Task 131
Transportation Data Integration to D
evelop Planning Perform
ance Measures
Cam
bridge Systematics, Inc.
B-6
Title Synopsis Data Category Planning Function Data Gaps Emerging concepts walking environment, and density/clustering.
Blueprint planning; complying with California’s Sustainable Communities and Climate Protection Act of 2008 (SB 375), required for all California metropolitan planning organizations; and preparing local General and Specific Community Plans and transportation system plans that incorporate smart growth or sustainable communities strategies.
Guidebook on DTA Data Needs and Interface Options for Integration into the Planning Process
Information on the input data required for dynamic traffic assignment, methods, and benefits of linking together macroscopic, mesoscopic, and microscopic models, and potential ways of integrating DTA into the traditional four-step planning model.
ITS-Generated Traffic Data
Traffic Monitoring/Travel Demand Forecasting Models/Performance Monitoring/Advanced Models
Limited research and exploration of integrating DTA into the transportation planning process.
The use of dynamic traffic assignment in transportation planning process is growing and presents limitless possibilities and the potential for more efficient systems in the future.
Real Time Estimation of Arterial Travel Time and Operational Measures Through Integration of Real Time Fixed Sensor Data and Simulation
The feasibility of integrating real-time data streams with an arterial simulation to support an arterial performance monitoring system, to increase the efficiency in facility utilization by enabling more informed decisions in use and management of
ITS-Generated Traffic Data/Safety Data/Work Zone Data
Traffic monitoring/Travel Demand Forecasting Models/Performance Monitoring/Safety Planning/Advanced Models
Multiple paths are picked up if Bluetooth locations are not carefully selected. Adjacent (freeway lanes) are less likely to be obstructed from the side-fire ALPR camera, resulting in potential bias to adjacent lane speed.
As all tested technology is point detection based, it is critical that any deployment covers the full extent of anticipated work zone related congestion area.

NC
HR
P 08-36, Task 131
Transportation Data Integration to D
evelop Planning Perform
ance Measures
Cam
bridge Systematics, Inc.
B-7
Title Synopsis Data Category Planning Function Data Gaps Emerging concepts Georgia’s transportation facilities.
Integration of AVL and AFC Data for Network Planning
Process of how AVL and AFC data are being integrated and show how this can yield useful information for network planning.
ITS-Generated Traffic Data
Travel Demand Forecasting Models/Performance Monitoring
Estimation of alighting points at trip level, as well as the aggregation levels
Real-time, on bus integration of AVL/AFC data at bus stop level
The Integration of Multi-State Clarus Data into Real-time and Archived RITIS Data Visualization Tools
Integrate all Clarus Data into the Regional Integrated Transportation Information System (RITIS) for real-time situational awareness and historical safety data analysis.
Weather Data Safety Planning Efforts related to convincing every single state DOT to share their RWIS information.
RITIS is able to cheaply and quickly integrate all RWIS data into a highly visible platform. Users are able to review agency RWIS data, develop data visualization applications, add RWIS data into ongoing research projects, and discover new possibilities.
Understanding the school journey: integrating data on travel and environment
Use innovative methods to examine the complexity of the school journey, and to relate it to exposure to air pollution and engagement with the environment through which children pass.
ITS-Generated Traffic Data
Air Quality Models/Safety Planning
Conceptual gap between quantitative and qualitative methods in research on travel behavior.
Participatory GIS
Data Integration and Partnership for Statewide Transportation Planning
Investigate the data availability, accessibility, and interoperability issues arisen from the statewide transportation planning activities undertaken at Wisconsin DOT and identify possible approaches for
All All Information Dissemination; Centralized Data Platform; Data Access Tool for Long-Range Planning; Data Standardization.
Examine the data-related barriers experienced by the transportation planning staff at the Wisconsin DOT, and to identify data integration approaches for overcoming these barriers.

NC
HR
P 08-36, Task 131
Transportation Data Integration to D
evelop Planning Perform
ance Measures
Cam
bridge Systematics, Inc.
B-8
Title Synopsis Data Category Planning Function Data Gaps Emerging concepts addressing these issues.
New York Transportation Information Gateway: Integrating Planning Data, Models, and Visualization Tools
Present an intelligent, integrated and user-friendly modeling system that integrates relevant data and information from multiple sources, provides user (decision-maker)-friendly tools to support various planning activities, and promotes effective communication among stakeholders, including the public.
All All Lacking centralized data storage and standardized data collection/management practices.
Emphasis of planning process today is to facilitate collective design and interactions among stakeholders.
Analysis and Integration of Spatial Data for Transportation Planning
Describe the work completed to develop a catalog of spatial data sources available to transportation planning agencies in Texas.
All All As information systems advance, the need to provide effective data integration/exchange protocols and procedures to reduce redundancy and data collection costs is becoming more important.
A catalog of spatial data sources available to transportation planning agencies in Texas.
A Prototype for Freight Data Integration and Visualization Using Online Mapping Software: Issues, Applications, and Implications for Data Collection Procedures
Present the issues surrounding the integration and visualization of freight data using Internet-based mapping applications.
ITS-Generated Traffic Data
Traffic Monitoring/Performance Monitoring
Outdated data collection methods and data delivery; data quality issues, including justifiable statements of uncertainty and error.
An intuitive application that requires a minimal learning curve yet provides powerful geographic and contextual metadata.
Synthesis of Best Practices for the Development of an Integrated Data and
Seek to identify relevant metrics for performance measurement and the underlying factors and
All Asset Management Technical and organizational challenges in building integrated data and information systems to
Business-driven efforts towards data integration.

NC
HR
P 08-36, Task 131
Transportation Data Integration to D
evelop Planning Perform
ance Measures
Cam
bridge Systematics, Inc.
B-9
Title Synopsis Data Category Planning Function Data Gaps Emerging concepts Information Management Approach
best practices that contribute to successful approaches.
provide high-quality information for supporting analysis, control, and decision-making in asset management.
IRRIS Technology: A Data Integration, Analysis, and Visualization Tool to Support ITS Operations
Introduce an innovative geospatial Web portal that supports data integration and sharing, transportation operations, freight mobility, logistics, asset tracking, collaboration, transportation security, and incident management.
ITS-Generated Traffic Data
All Prior to IRRIS, a single integrating tool did not exist that integrated static transportation infrastructure data and near-real-time information for the global management and deployment of cargo shipments.
Integrating the data into one interface to enable users to perform a variety of functions.
Data Systems to Support Integrated Corridor Management
Analyze the methodologies and technologies appropriate to corridor management applications.
ITS-Generated Traffic Data
All Legacy Toolset Weaknesses: Expensive, Nontransferable, Age quickly.
Integrated Corridor Management (ICM)
Integrating Data and Models for Analysis of Freight Movements on Multimodal Transportation Systems for Florida
Develop the Florida Multimodal Network (FMN), an integrated multimodal network for Florida that combines airway linkages, highways, railways, waterways, and intermodal facilities.
ITS-Generated Traffic Data
Traffic Monitoring Lack of data on transportation networks, O/D flows, cost, delay, and capacity of the intermodal facilities, etc.
Characterization of the mode preference of the multimodal transportation system; Improvement of the flow loading process when multimodal freight flows are assigned to the network.
Tools for Improving Safety. Integration of Data Capture, Storage, Safety Analysis, and GIS in Collision Reduction
Present the project which incorporates the infrastructure, collision, and traffic volume data maintained by the Region Municipalities, with the Traffic Engineering Software
ITS-Generated Traffic Data
Safety Planning Expensive and time consuming for identifying and conducting detailed engineering studies of candidate improvement sites with limited funding.
Capable of identifying, planning, designing, prioritizing, and implementing safety-related projects.

NC
HR
P 08-36, Task 131
Transportation Data Integration to D
evelop Planning Perform
ance Measures
Cam
bridge Systematics, Inc.
B-10
Title Synopsis Data Category Planning Function Data Gaps Emerging concepts (TES) and the state-of-the-art “Safety Performance” quantitative traffic safety analysis.
Migrating from Data Silos to Data Consolidation: An Evaluation of Integration Solutions
Evaluate the integration solutions for the transit industry.
All All Data Silos Integrating the individual data warehouses into one central database.
Integrating Intersection Traffic Signal Data into a Traffic Monitoring Program
Evaluate the feasibility of integrating intersection traffic signal data into a traffic monitoring program.
ITS-Generated Traffic Data
Traffic Monitoring Classification data not available through the intersection signal detector data; Validation of the data via short-term counts recommended.
Usability of intersection signal detector data for traffic monitoring.
Michigan Roadsoft: Integration of State and Local Safety Data
Present the Michigan Roadsoft system for local roadway data and analysis.
Infrastructure Data/Safety Data
Asset Management/Safety Planning
Local agencies varied widely in their level of access to IT support, software tools, and analytic capabilities for managing roadway assets.
User-driven program.
Wisconsin Information System Local Roads: State and Local Data Integration
Present the Wisconsin Information System for Local Roads (WISLR) project for safety and asset management.
Infrastructure Data/Safety Data
Asset Management/Safety Planning
A duplication of data being inventoried between Wisconsin DOT and local governments. Additionally, local agencies inventoried roads within their jurisdiction more frequently than Wisconsin DOT.
Recommend to promote data sharing, improve access, and reduce duplication of effort.
Ohio Location Based Response System: State and Local Data Integration
Present the Ohio Location Based Response System (LBRS) which integrates State and
Infrastructure Data/Safety Data
Asset Management/Safety Planning
Higher accuracy crash data provided on the major routes from the Ohio State Highway Patrol, but inconsistent
Successful integration of the local road addressing and mile posting into the state system.
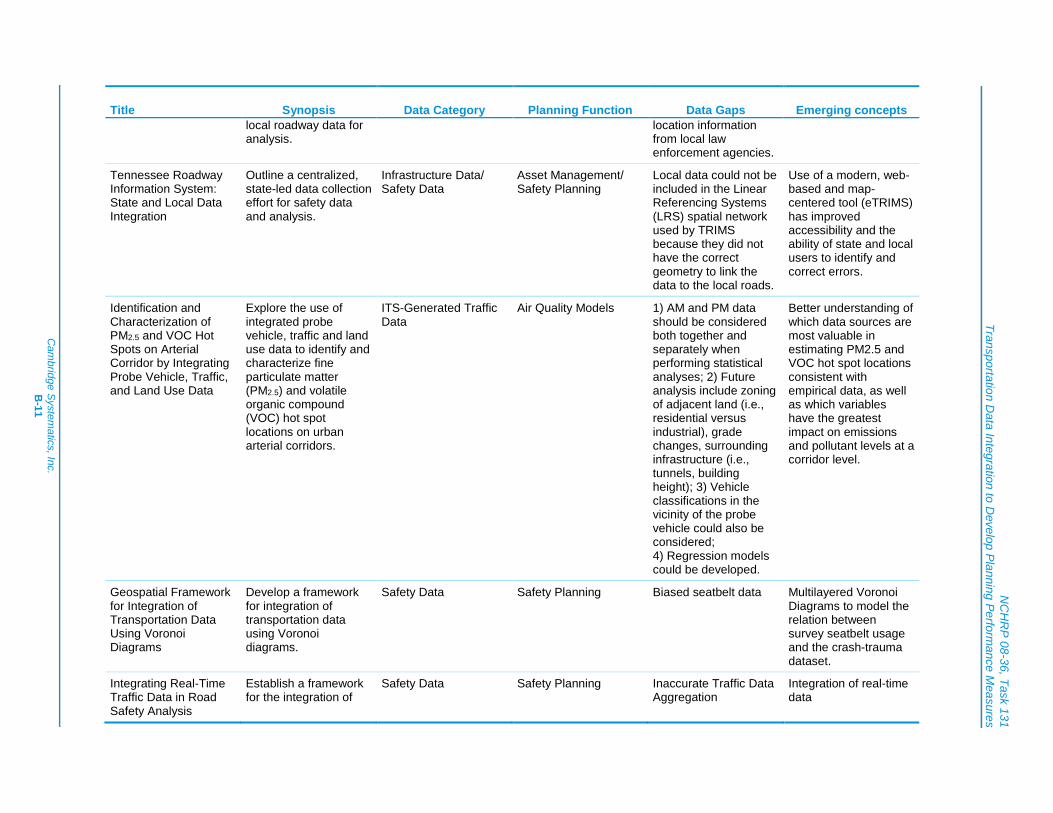
NC
HR
P 08-36, Task 131
Transportation Data Integration to D
evelop Planning Perform
ance Measures
Cam
bridge Systematics, Inc.
B-11
Title Synopsis Data Category Planning Function Data Gaps Emerging concepts local roadway data for analysis.
location information from local law enforcement agencies.
Tennessee Roadway Information System: State and Local Data Integration
Outline a centralized, state-led data collection effort for safety data and analysis.
Infrastructure Data/Safety Data
Asset Management/Safety Planning
Local data could not be included in the Linear Referencing Systems (LRS) spatial network used by TRIMS because they did not have the correct geometry to link the data to the local roads.
Use of a modern, web-based and map-centered tool (eTRIMS) has improved accessibility and the ability of state and local users to identify and correct errors.
Identification and Characterization of PM2.5 and VOC Hot Spots on Arterial Corridor by Integrating Probe Vehicle, Traffic, and Land Use Data
Explore the use of integrated probe vehicle, traffic and land use data to identify and characterize fine particulate matter (PM2.5) and volatile organic compound (VOC) hot spot locations on urban arterial corridors.
ITS-Generated Traffic Data
Air Quality Models 1) AM and PM data should be considered both together and separately when performing statistical analyses; 2) Future analysis include zoning of adjacent land (i.e., residential versus industrial), grade changes, surrounding infrastructure (i.e., tunnels, building height); 3) Vehicle classifications in the vicinity of the probe vehicle could also be considered; 4) Regression models could be developed.
Better understanding of which data sources are most valuable in estimating PM2.5 and VOC hot spot locations consistent with empirical data, as well as which variables have the greatest impact on emissions and pollutant levels at a corridor level.
Geospatial Framework for Integration of Transportation Data Using Voronoi Diagrams
Develop a framework for integration of transportation data using Voronoi diagrams.
Safety Data Safety Planning Biased seatbelt data Multilayered Voronoi Diagrams to model the relation between survey seatbelt usage and the crash-trauma dataset.
Integrating Real-Time Traffic Data in Road Safety Analysis
Establish a framework for the integration of
Safety Data Safety Planning Inaccurate Traffic Data Aggregation
Integration of real-time data

NC
HR
P 08-36, Task 131
Transportation Data Integration to D
evelop Planning Perform
ance Measures
Cam
bridge Systematics, Inc.
B-12
Title Synopsis Data Category Planning Function Data Gaps Emerging concepts real-time traffic data in road safety analysis.
Integration of existing and emerging data collection technologies in Australia
Provide a brief history of the development of automated pavement condition equipment by ARRB Group culminating in the ARRB Hawkeye system, which was designed to allow the integration of both existing and emerging technologies into its data collection and processing platforms.
Infrastructure Data Asset Management Need for additional pavement condition data to better manage the road networks and evaluation of new technologies that meet the needs of the various users.
Vehicle-mounted pavement condition monitoring systems or automated pavement data collection using a vehicular platform.
Using an Integrated Data Platform to Evaluate the Environmental Impact of Events and ITS Interventions
Provide an overview of the Newcastle University Integrated Database and Assessment Platform of monitored and modeled traffic, meteorological conditions and pollution (air and noise) data and presents results from its application in a demand responsive control area in the UK.
ITS-Generated Traffic Data
Air Quality Models Difficulties arise in evaluating impacts of actions and interventions taken by Local Authorities because the traditional air quality models are not sufficiently sensitive to the subtle changes in the traffic flow regimes on city streets that result from ITS.
N/A
An Online Portal for Integrated Transportation Data Management and Processing
Present the PORTAL of the Centre for Research and Technology Hellas – Hellenic Institute of Transport (HIT PORTAL). HIT PORTAL is a web-based, user-oriented on-line platform that supports all transport-
All All Traffic management still comprises a problem.
A web-based, user-oriented on-line platform that supports all transport-related entities in their various activities, by providing online services and transport related data via the web.

NC
HR
P 08-36, Task 131
Transportation Data Integration to D
evelop Planning Perform
ance Measures
Cam
bridge Systematics, Inc.
B-13
Title Synopsis Data Category Planning Function Data Gaps Emerging concepts related entities in their various activities.
Data and Information Integration Framework for Highway Project Decision-Making
Develop a three-tiered framework to integrate data and information that ultimately supports decision-making over the life cycle of highway projects.
All All Huge gap in integrating data, information, and decision-making, including the lack of skilled data analysts and/or experts to analyze data and convert these data into information and knowledge; and the lack of database systems that can address potential users’ need.
Developing an enterprise wide ontology-based framework for the highway industry.
Enhanced Analysis of Crashes in the Proximity of Work Zones through Integration of Statewide Crash Data with Lane Closure System Data
Integrate Lane Closure System Data with Statewide Crash Data using the Wisconsin Lane Closure System (WisLCS)
Safety Data/Work Zone Data
Safety Planning Work zone information systems could include some spatial and temporal buffering for reporting and monitoring purpose.
Enhancing signing and implementing ITS lane control devices upstream and downstream from the work zone would be a cost effective way to improve work zone safety.
Continuous Data Integration for Land Use and Transportation Planning and Modeling
Develop a continuous approach and reusable tools for data integration by focusing on bringing interdisciplinary methods to make the best use of available data in land use and transportation.
ITS-Generated Traffic Data
Travel Demand Forecasting Models
Current practice of data development in most planning agencies is largely ad-hoc and unreusable. Traditional practice adopted by most planning agencies of updating datasets as a one-off effort at long intervals is very costly and increasingly challenged.
There is vast number of alternative machine-learning approaches available and largely under-studied.

NC
HR
P 08-36, Task 131
Transportation Data Integration to D
evelop Planning Perform
ance Measures
Cam
bridge Systematics, Inc.
B-14
Title Synopsis Data Category Planning Function Data Gaps Emerging concepts Integration of Smart-Phone-Based Pavement Roughness Data Collection Tool with Asset Management System
Develop an android-based cellphone application to collect pavement roughness data while driving.
Infrastructure Asset Management Shortcomings and expenses associated with current pavement roughness measurement systems.
It is hoped that the approach can be used to significantly reduce the cost of acquiring pavement roughness data for agencies and to reduce user costs for the traveling public by providing more robust feedback regarding route choice and its effect on estimated vehicle maintenance cost and fuel efficiency, and eventually perhaps even a measure of safety.
Integration of Data Sources to Optimize Freight Transportation in Texas
Develop a strategy for collecting and integrating available freight data; explore the feasibility of entering into a data sharing partnership with the freight community; develop a prototype Freight Data Architecture; Advise Texas DOT on the cost-effectiveness of acquiring and maintaining a freight data sharing partnership.
ITS-Generated Traffic Data
Traffic Monitoring Numerous freight data sources exist but are found to be incompatible.
Through advanced data integration methods, it is possible to overlay publicly available data sources to assist in filling some existing data gaps.
Successful Integration of ITS in the Regional Transportation Planning Process. The Mid-Region Council of Governments (MRCOG): coordinated ITS Project
Experience at MRCOG of the successful integration of ITS into the MRCOG MPO’s transportation planning process.
ITS-Generated Traffic Data
All The current process was inadequate resulting in many of the ITS components being “undetected” in the planning and programming process. This gap was also
Coordination among ITS stakeholders at the planning, policy, and technical levels provides critical benefit to ensure that ITS is deployed in a fully integrated manner.
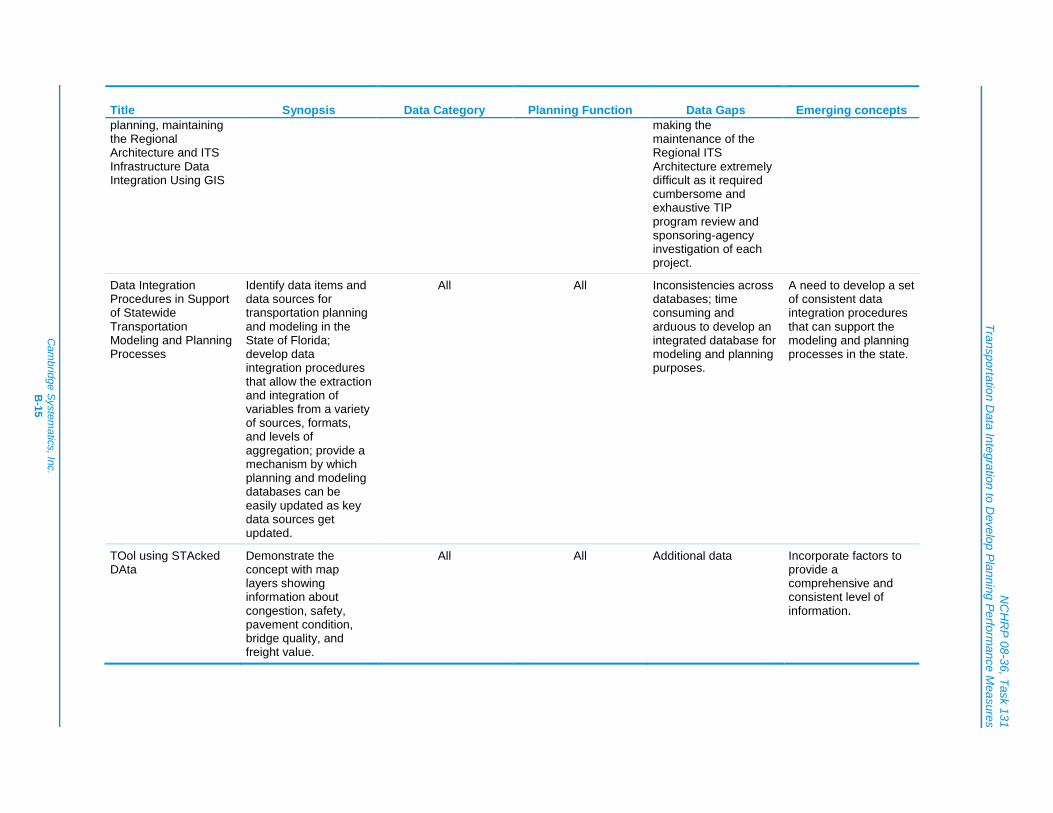
NC
HR
P 08-36, Task 131
Transportation Data Integration to D
evelop Planning Perform
ance Measures
Cam
bridge Systematics, Inc.
B-15
Title Synopsis Data Category Planning Function Data Gaps Emerging concepts planning, maintaining the Regional Architecture and ITS Infrastructure Data Integration Using GIS
making the maintenance of the Regional ITS Architecture extremely difficult as it required cumbersome and exhaustive TIP program review and sponsoring-agency investigation of each project.
Data Integration Procedures in Support of Statewide Transportation Modeling and Planning Processes
Identify data items and data sources for transportation planning and modeling in the State of Florida; develop data integration procedures that allow the extraction and integration of variables from a variety of sources, formats, and levels of aggregation; provide a mechanism by which planning and modeling databases can be easily updated as key data sources get updated.
All All Inconsistencies across databases; time consuming and arduous to develop an integrated database for modeling and planning purposes.
A need to develop a set of consistent data integration procedures that can support the modeling and planning processes in the state.
TOol using STAcked DAta
Demonstrate the concept with map layers showing information about congestion, safety, pavement condition, bridge quality, and freight value.
All All Additional data Incorporate factors to provide a comprehensive and consistent level of information.


NCHRP 08-36, Task 131 Transportation Data Integration to Develop Planning Performance Measures
Cambridge Systematics, Inc. C-1
Appendix C. Use of Nontraditional Planning Performance Measures by Selected Agencies


NCHRP 08-36, Task 131 Transportation Data Integration to Develop Planning Performance Measures
Cambridge Systematics, Inc. C-3
Table C.1 Plan Bay Area, Long-Range Integrated Transportation, and Land-Use/Housing Strategy for the San Francisco Bay Area
Targets
Qualitative Assessment Criteria
Application Strong
Support Moderate Support
Minimal Impact Moderate Adverse
Strong Adverse
House 100 percent of the region’s projected growth by income level without displacing current low-income residents and with no increase in in-commuters over the Plan baseline year
1 POINT = Project serves a jurisdiction that did both of the following: • Approved at least 40 percent of
its RHNA by income level between 1999 and 2014 for at least three income categories
• Planned to grow by more than 20 percent in Plan Bay Area between 2015 and 2040
0.5 POINT = Project serves a jurisdiction that did both of the following: • Approved at least 40 percent
of its RHNA by income level between 1999 and 2014 for at least two income categories
• Planned to grow by 10 percent to 20 percent in Plan Bay Area between 2015 and 2040
0 POINT = Project serves a jurisdiction that did one of the following: • Approved at least 40 percent of
its RHNA by income level between 1999 and 2014 for at least three income categories
• Planned to grow by more than 20 percent in Plan Bay Area between 2015 and 2040
-0.5 POINT = Project serves a jurisdiction that did both of the following: • Approved at least 40 percent of
its RHNA by income level between 1999 and 2014 for one income category
• Planned to grow by 10 percent to 20 percent in Plan Bay Area between 2015 and 2040
-1 POINT = Project serves a jurisdiction that did both of the following: • Approved at least 40 percent of
its RHNA by income level between 1999 and 2014 for one income category
• Planned to grow by less than 10 percent in Plan Bay Area between 2015 and 2040
Project serves a jurisdiction that did both of the following: • Approved at least 40 percent of
its RHNA by income level between 1999 and 2014 for zero income categories
• Planned to grow by less than 20 percent in Plan Bay Area between 2015 and 2040
• Rating dependent on project location, level of housing unit growth in Plan Bay Area, and RHNA permitting progress by income level
• RHNA progress is based on share of housing units permitted for four categories:
– Very low income, low income, moderate income, and above moderate income
• RHNA progress calculated for the previous two RHNA cycles – 1999 to 2006 and 2007 to 2014
• Plan Bay Area housing unit growth calculated between 2015 and 2040
• Thresholds chosen such that regional performance is “moderate support”
• Project service area determined by considering project type, location, and travel demand
Reduce adverse health impacts associated with air quality, road safety, and physical inactivity by 10 percent
1 POINT = • Likely to cause large shift to
nonauto modes Example: Regional transit project that encourages more walk to transit trips
0.5 POINT = • Likely to cause a moderate shift
to nonauto modes Example: Local transit project
0 POINT = • Likely to result in minimal change
to nonauto mode share Examples: Interchange improvements, boulevard widening with cycle tracks, highway operational projects
-0.5 POINT = • Likely to moderately increase
auto mode share or auto trips
-1 POINT = • Likely to significantly increase auto
mode share or auto trips
• Highway widening projects receive adverse impact • Transit, bike, ped projects receive minimal to strong support • Access to urban parks or provision of green space are
considered when determining the increase in nonauto trips
Bonus 0.5 point if project • Is primarily a road safety project
Direct all nonagricultural development within the urban footprint (existing urban development and urban growth boundaries)
1 POINT = • Does not consume open space
or agricultural land • Significantly promotes
development within urban growth boundaries
Example: BART frequency increase
0.5 POINT = • Does not consume open space
or agricultural land • Increases access to agricultural
land • Moderately promotes
development within urban growth boundaries
Example: Freeway ITS strategies on freight network
0 POINT = • Does not consume open space
or agricultural land • Does not improve access to
agricultural land Example: Road realignment within existing right-of-way
-0.5 POINT = • Consumes moderate amount of
open space or agricultural land Example: Road widening outside existing right-of-way
-1 POINT = • Consumes significant areas of
open space or agricultural land • Worsens access to agricultural
land Example: New facility through existing open space
• Rating dependent on project location • Same criteria as Plan Bay Area
Decrease by 10 percent the share of lower-income residents’ household income consumed by transportation and housing
1 POINT = • Transit project that improves
service for an operator whose low-income ridership is over 40 percent of its ridership
• Transit project for an operator that serves more than 10 percent of the region’s low-income riders
0.5 POINT = • Transit project that improves
service for an operator that serves between 0.5 percent and 10 percent of the region’s low-income riders
• Road project with a significant low-cost option, such as HOV lanes, transit, bicycle, or pedestrian component; and that serves a Community of Concern
0 POINT = • Does not remove a low-cost
transportation option Example: Highway projects that do not provide low-cost options
-0.5 POINT = Moderately: • Reduces transportation choices
for low- and middle-income residents
• Increases transportation cost for low-income households
-1 POINT = Significantly: • Reduces transportation choices
for low- and middle-income residents
• Increases transportation cost for low-income households
Example: Congestion pricing without transit improvements
• Highway projects that do not include bike, ped, or transit components would receive a minimal score. These projects assumed to minimally affect low-cost travel options.


NCHRP 08-36, Task 131 Transportation Data Integration to Develop Planning Performance Measures
Cambridge Systematics, Inc. C-5
Table C.1 Plan Bay Area, Long-Range Integrated Transportation, and Land-Use/Housing Strategy for the San Francisco Bay Area (continued)
Targets
Qualitative Assessment Criteria
Application Strong
Support Moderate Support
Minimal Impact Moderate Adverse
Strong Adverse
Increase the share of affordable housing in PDAs, TPAs, or high-opportunity areas by 15 percent
1 POINT = • Serves a PDA, TPA, or HOA • A jurisdiction that permitted more
than 50 percent of its RHNA allocation for affordable housing in the last two RHNA cycles (1999-2014)
0.5 POINT = • Serves a PDA, TPA, or HOA • A jurisdiction that permitted
between 30 and 50 percent of its RHNA allocation for affordable housing in the last two RHNA cycles
0 POINT = • Serves a PDA, TPA, or HOA • A jurisdiction that permitted
between 25 and 30 percent of its RHNA allocation for affordable housing in the last two RHNA cycles
• Does not serve a PDA, TPA, or HOA
-0.5 POINT = • Serves a PDA, TPA, or HOA • A jurisdiction that permitted
between 20 and 25 percent of its RHNA allocation for affordable housing in the last two RHNA cycles
-1 POINT = • Serves a PDA, TPA, or HOA • A jurisdiction that permitted less
than 20 percent of its RHNA allocation for affordable housing in the last two RHNA cycles
• Rating dependent on project location and share of affordable units permitted in the last two RHNA cycles (1999 to 2014), irrespective of mode
• Thresholds chosen such that regional performance is “moderate support”
• Project service area determined by considering project type, location, and travel demand
Reduce the share of low- and moderate-income renter households in PDAs, TPAs, or high-opportunity areas that are at an increased risk of displacement to 0 percent
No project is anticipated to reduce the risk of displacement.
No project is anticipated to reduce the risk of displacement
0 POINT = Project serves a jurisdiction that has both of the following: • Does not plan to significantly
grow in Plan Bay Area (more than 20 percent)
• Is not currently undergoing displacement
• Does not serve a PDA, TPA, or HOA
-0.5 POINT = Project serves a jurisdiction that has one of the following: • Planned to significantly grow in
Plan Bay Area (more than 20 percent)
• Currently undergoing displacement
-1 POINT = Project serves a jurisdiction that has both of the following: • Planned to significantly grow in
Plan Bay Area (more than 20 percent)
• Currently undergoing displacement
• Rating dependent on project location, whether a project serves a high-growth area, and the level of existing displacement for low-income and moderate-income households within a project’s service area
• An area currently is undergoing displacement if it is displacement typologies two through four for both lower-income and moderate- to high-income tracts per the Regional Early Warning System definitions (REWS). For map, see: http://www.urbandisplacement.org/map#.
• Project service area determined by considering project type, location, and travel demand
Increase the share of jobs accessible within 30 minutes by auto or within 45 minutes by transit by 20 percent in congested conditions
1 POINT = Significantly: • Decreases travel time during AM
and PM commute hours • Serves a regional or subregional
job center Examples: Regional transit, regional highway congestion relief
0.5 POINT = Moderately: • Decreases travel time during AM
and PM commute hours • Serves a regional or subregional
job center Example: Local transit, minor roadway project
0 POINT = Minimally: • Decreases travel time during AM
and PM commute hours • Does not serve a regional or
subregional job center Example: Interchange project
-0.5 POINT = Moderately: • Increases travel time
-1 POINT = Significantly: • Increases travel time
• Rating dependent on project location and level of travel time improvement
• Transit capacity projects assumed to support accessibility to job centers
Increase by 35 percent the number of jobs in predominantly middle-wage industries)
1 POINT = • Project itself adds both significant
short-term and long-term jobs to the region
Example: Transit capital project that increases demand for operators, ITS projects
0.5 POINT = • Project itself adds short-term jobs
to the region • Project adds moderate amount of
long-term jobs Example: Highway construction project, transit frequency project, bus construction project
0 POINT = • Has no effect on the number of
jobs Example: Bike/ped projects, transit efficiency project
-0.5 POINT = Moderately: • Reduces the number of
transportation-related jobs required
Example: Operations project replaced by automated vehicles
-1 POINT = Significantly: • Reduces the number of
transportation-related jobs required
• Rating dependent on project type and type of job creation associated with the project (long versus short term)
• Project that reduces the need for transportation-related jobs would receive a moderate to strong adverse score
Reduce per-rider transit delay due to aged infrastructure by 100 percent
1 POINT = Significantly: • Improves transit asset condition Example: Funding of vehicle replacement
0.5 POINT = Moderately: • Improves transit asset condition Example: Expansion project that funds vehicle replacement
0 POINT = • Does not explicitly include
components to improve transit asset condition
Example: Expansion project that does not include vehicle replacement
No project would be anticipated to generate an adverse impact by worsening transit asset condition
No project would be anticipated to generate an adverse impact by worsening transit asset condition
• Projects receive moderate to strong support if they include specific roadway or transit replacement or rehabilitation
• Minimal impact assumed for projects that add inventory
References: MTC Vital Signs. Plan Bay Area: Final Performance Assessment Report (July 2013). Updated Criteria Table – DRAFT.

NC
HR
P 08-36, Task 131
Transportation Data Integration to D
evelop Planning Perform
ance Measures
Cam
bridge Systematics, Inc.
C-6
Table C.2 Imagine Central Arkansas: Blueprint for a Sustainable Region 2040 Long-Range Metropolitan Transportation Plan
Goal Area Evaluation Criteria Description Scoring Methodology Goal 1: Economic Growth and Vitality; and Goal 2: Quality Corridors and Transportation Choice
Freight and/or Passenger Intermodal Connectivity
Does the project enhance connectivity of two or more modes?
20 points = Four modes 14 points = Three modes 6 points = Two modes 0 points = One mode
Goal 1: Economic Growth and Vitality; and Goal 5: Healthy and Safe Communities
Safety Does the project address a high-crash location (motorized or nonmotorized)?
20 points = Directly addresses 10 points = Indirectly addresses 0 points = Does not address
Goal 2: Quality Corridors and Transportation Choice; and Goal 5: Healthy and Safe Communities
Choice in Transportation and Complete Streets
Does the project enhance access or quality of transit, walking, and/or cycling opportunities, which can contribute to complete streets, lower household transportation cost, and increased physical activity?
30 points = Full Implementation/Regional Scale 20 points = Local Scale 10 points = Some Elements 0 points = No
Goal 2: Quality Corridors and Transportation Choice; and Goal 4: Land Development and Housing
Connectivity Does the project enhance connectivity to a major activity center (downtown, town center, campus, hospital/wellness center, sports complex, etc.) via alternative routes?
20 points = Yes 0 points = No
Goal 3: Environment Quality and Sustainable Energy; Goal 4: Land Development and Housing; and Goal 5: Healthy and Safe Communities
Compact, Mixed-Use, and Reduced Impacts on Environmentally Sensitive Lands
Does the project complement compact, mixed-use development consistent with the development framework in the Vision and/or reduces land consumption and impervious surface?
30 points = Yes 20 points = Somewhat 0 points = No
Goal 3: Environment Quality and Sustainable Energy; and Goal 5: Healthy and Safe Communities
Air Quality and Energy Efficiency
Is the project likely to improve air quality and/or reduce energy consumption (through improved efficiency or reduced demand)?
20 points = Significantly/Directly 10 points = Somewhat/Indirectly 0 points = No
Goal 4: Land Development and Housing Complementary Land Use Does the corresponding local government have complementary plans and development practices in place?
10 points = Yes 0 points = No/Don’t Know
Goal 4: Land Development and Housing Existing Neighborhoods Does the project support an existing neighborhood through improved local infrastructure (i.e., sidewalks) or improved access?
20 points = Directly 10 points = Indirectly 0 points = No/Unknown
References: 2040 Long-Range Metropolitan Transportation Plan: Project Evaluation Results. 2040 Long-Range Metropolitan Transportation Plan: Project Priorities. Imagine Central Arkansas: Proposed Plan Amendment 1 – DRAFT.

NCHRP 08-36, Task 131 Transportation Data Integration to Develop Planning Performance Measures
Cambridge Systematics, Inc. C-7
Table C.3 Access to Destinations Study and National Accessibility Evaluation Pooled-Fund Study University of Minnesota Center for Transportation Studies
Measure Source Data
Preparation Calculation
Method Ranking
Methodology Potential
Applications Number of jobs that can be reached within various travel time thresholds by auto
• Street network data was extracted from the Census TIGER/line files.
• Employment data was obtained from the U.S. Census Bureau.
National Evaluation Pooled-Fund Study: • TomTom’s MultiNet and Speed Profile
datasets will be used instead. These datasets provide road network and historical speed information with coverage of the entire U.S., from freeways to local streets.
The extracted networks for the metropolitan areas were cleaned to include just the road features based on the Feature Class Codes (FCC) for the line segments provided in the Census TIGER/Line files. They were further cleaned using TransCAD software to eliminate nodes that served no topological purpose, and to combine the resulting links.
Urban Macroscopic Network Accessibility Indicator: Accessibility calculations will rely on detailed travel time calculations for both driving and transit, which will be implemented using commercially available, GPS-based speed measurements and published transit schedules. In general, the method used here is to identify a representative traveler facing a series of rings around his or her location. The rings (sometimes called time bands or isochrones) are the amount of distance that can be covered in a fixed amount of time given observed network speeds and observed network circuities. The employment of the region is averaged and spread evenly across these areas. The accessibility is the number of jobs that can be reached in each subsequent ring, constrained by total employment in the city.
• Rankings are determined by a weighted average of accessibility, giving a higher weight to closer jobs. Jobs reachable within ten minutes are weighted most heavily, and jobs are given decreasing weight as travel time increases up to 60 minutes.
• Based on this measure, the ten metro areas that provide the greatest average accessibility to jobs by auto are Los Angeles, San Francisco, New York, Chicago, Minneapolis, San Jose, Washington, Dallas, Boston, and Houston.
• Performance Management. Accessibility evaluation can directly measure a fundamental goal of transportation: connecting people to useful destinations. By tracking accessibility over time, state DOTs, MPOs, and transit agencies can better understand how well their transportation network support this goal. Accessibility evaluation can be applied to MAP-21 performance goals related to congestion, reliability, and sustainability.
• Scenario Evaluation and Analysis. Transportation planning organization can use accessibility evaluation to help select between project alternatives and to prioritize investments. Because they incorporate land use information, accessibility metrics can provide a more comprehensive picture of how investments will change users’ ability to reach destinations.
• Transportation and Land Use Research. Accessibility calculations can provide a valuable data source for transportation and land use research. Researchers at the University of Minnesota have employed accessibility in models of mode choice and other aspects of travel behavior, linked accessibility to residential property values, and used accessibility to explore the spatial relationship between jobs and worker locations.
• Transportation Equity. Detailed accessibility evaluation can help reveal how the costs and benefits of transportation investments are distributed over space and society. Understanding the accessibility characteristics of different origins and destinations can help agencies make equitable decisions in transportation planning.
• The Access Across America project builds on earlier work sponsored by the Minnesota DOT and the University of Minnesota’s Center for Transportation Studies (CTS). The Access to Destinations project laid the groundwork for detailed accessibility evaluation.
Number of jobs that can be reached within various travel time thresholds by transit
• U.S. Census TIGER 2010 datasets: blocks, core-based statistical areas (CBSA).
• U.S. Census Longitudinal Employer-Household Dynamics (LEHD) 2011 Origin-Destination. Employment Statistics (LODES):
• OpenStreetMap (OSM) North America extract, retrieved April 2014.
• General Transit Feed Specification (GTFS) schedule data from transit operators, various dates.
• Digital schedule datasets, published by transit agencies across the country, describe the minute-by-minute arrivals and departures of buses, trains, streetcars, and ferries. These schedules are combined with pedestrian network data from OpenStreetMap to calculate door-to-door travel times for transit trips. Travel time calculations were performed using OpenTripPlanner software.
1. Divide CBSAs into analysis zones for efficient parallelization.
2. Construct unified pedestrian-transit network graph for each analysis zone.
GTFS Data Integration Issues: • Inconsistent digital publication practices
across transit operators, causing challenges for systematic retrieval of GTFS datasets
• Not all transit operators release their GTFS datasets to the public.
• Validating that crowdsourced GTFS datasets have not been tampered with.
1. For each Census block, calculate travel time to all other blocks within 60 kilometers for each departure time at one-minute intervals.
2. Calculate cumulative opportunity accessibility to jobs for each block and departure time using thresholds of 10, 20,…, 60 minutes.
3. Average accessibility for each block over 7:00 a.m. to 9:00 a.m. period.
4. Average accessibility for each CBSA over all blocks, weighting by number of workers in each block.
5. Calculate weighted ranking for each metropolitan area.
Metropolitan area rankings are based on an average of person-weighted job accessibility for each metropolitan area over the six travel time thresholds (10, 20, 30, 40, 50, and 60 minutes). In the weighted average of accessibility, destinations reachable in shorter travel times are given more weight. A negative exponential weighting factor is used, following Levinson and Kumar (1994). Based on this measure, the 10 metro areas that provide the greatest average accessibility to jobs by transit are New York; San Francisco; Los Angeles; Washington, D.C.; Chicago; Boston; Philadelphia; Seattle; Denver; and San Jose.


NCHRP 08-36, Task 131 Transportation Data Integration to Develop Planning Performance Measures
Cambridge Systematics, Inc. C-9
Table C.3 Access to Destinations Study and National Accessibility Evaluation Pooled-Fund Study (continued) University of Minnesota Center for Transportation Studies
Measure Source Data
Preparation Calculation
Method Ranking
Methodology Potential
Applications Number of jobs that can be reached within various travel time thresholds by walking
1. U.S. Census TIGER 2010 datasets: blocks, core-based statistical areas (CBSA).
2. U.S. Census Longitudinal Employer-Household Dynamics (LEHD) 2011 Origin-Destination.
3. Employment Statistics (LODES). 4. OpenStreetMap (OSM) North America
extract, retrieved April 2014. 5. American Community Survey Reports:
walking mode share, 2008 to 2012. 6. Walk Score 2014. A walkability ranking
service and data platform managed by Redfin, a realtor aggregating service; calculated based on proximity to services in various categories, with a distance-decay weighting function, and on pedestrian friendliness factors, such as population density and built environment (road) metrics.
1. Construct pedestrian travel network graph for each CBSA.
Data Integration Issues: • Not all cities had available walk score values,
and thus had to be excluded from the correlations.
• Not all cities had available walk mode share values, and also had to be excluded from the correlations.
1. For each Census block, calculate travel time to all other blocks within a 5-kilometer radius for a single departure time.
2. Calculate cumulative opportunity accessibility to jobs for each block, using thresholds of 10, 20,…, 60 minutes.
3. Average accessibility for each CBSA over all blocks, weighting by number of workers in each block.
4. Calculate weighted ranking for each metropolitan area.
5. Calculate correlations between person-weighted accessibility, walk mode share, and walk score.
Metropolitan area rankings are based on an average of person-weighted job accessibility for each metropolitan area over the six travel time thresholds (10, 20, 30, 40, 50, and 60 minutes). In the weighted average of accessibility, destinations reachable in shorter travel times are given more weight. A negative exponential weighting factor is used, following Levinson and Kumar (1994). Based on this measure, the 10 metro areas that provide the greatest average accessibility to jobs by walking are New York; San Francisco; Los Angeles; Chicago; Washington, D.C.; Seattle; Boston; Philadelphia; San Jose; and Denver.
References: University of Minnesota: National Accessibility Evaluation Pooled-Fund Study. NCHRP: Study Detail View. Access Across America: Auto Methodology. Access Across America: Transit 2014 Methodology. Access Across America: Walking 2014 Methodology.


NCHRP 08-36, Task 131 Transportation Data Integration to Develop Planning Performance Measures
Cambridge Systematics, Inc. C-11
Table C.4 2040 Regional Transportation Plan Chattanooga-Hamilton County/North Georgia Transportation Planning Organization
Performance Measure Category
2040 RTP Objectives
Systems-Level Measure Project-Level Measure Evaluation Tool/Approach
Scale 1 Weight: Within Community
Scale 2 Weight: Community to Region
Scale 3 Weight: Region to Region
Environmental Sustainability
• Incentivize complete streets projects. • Support desired community character
Support healthy, safe communities. • Promote safe connections to community
resources.
• VMT per capita • Project reduces VMT. • Travel demand model for roadway capacity projects.
• Off-model calculator for all other project types.
30 20 10
• Project promotes nonmotorized access to community resources.
• Points will be calculated (Yes/No) based on review of project scope, along with cross-check, to identify if project directly connects or serves: active transportation facility, healthy food location, health care facility, and public/private school (K-12).
• Project is in keeping with community character
• Points will be calculated (Yes/No) based on review of applicable land use plan in place.
System Reliability • Expand set of travel options. • Encourage connected, multimodal network. • Improve system operations. • Incentivize corridor protection plans.
• Mode split • Project located on facility with corridor protection plan
• Points will be awarded (Yes/No) if corridor, access, or other demand management plan in place for project facility.
15 15 10
• Project fills gap in existing system • Points will be awarded (Yes/No) if project fills gap or provides connection within existing or planned bike, ped, or transit system as identified through GIS-based Bicycle Gap Analysis, Pedestrian Gap Analysis, and Transit Gap Analysis.
• Project improves efficiency through ITS • Points will be awarded (Yes/No) based on review of project scope.
References: Chattanooga 2040 RTP Performance-Framework: Balancing Regional and Comm.


NCHRP 08-36, Task 131 Transportation Data Integration to Develop Planning Performance Measures
Cambridge Systematics, Inc. D-1
Appendix D. State of the Practice – Nontraditional Planning Performance Measures
D.1 FHWA Performance Outcomes beyond the Mainstream Peer Exchange
On June 20, 2014, the Transportation Research Board’s (TRB) Statewide Multimodal Planning Committee, in partnership with the Federal Highway Administration (FHWA) and the American Association of State Highway Transportation Officials (AASHTO), held a one-day peer exchange on ‘beyond the mainstream’ performance measures in Scottsdale, Arizona. Approximately 30 practitioners from over 20 states participated in the discussions regarding performance measures for quality-of-life concerns.10 Three performance areas were explored: 1) accessibility, 2) economic development, and 3) health. One transportation agency in each area gave presentations on their activities. However, there was very little activity noted among even the presenting agencies; most of the exchange was focused on “what we should be doing,” not “what we are doing.” Tables D.1 through D.2 show the performance measures that were formulated during the Exchange for Accessibility and Health. Specific measures were not formulated for Economic Development, presumably because of lack of previous experience in this area. However, some general guidelines for Economic Development were identified.
Long-Range Planning/Strategy Development
Key nontraditional outcome measures could incorporate:
• Jobs;
• GDP;
• Workforce; and
• Measures of Economic Competitiveness.
A locally specific process was envisioned to arrive at suitable economic development performance measures, as follows:
• Align with strategic initiatives (varies by location, politics, etc.);
• Align with cluster/industry transportation needs;
• Leads to traditional measures such as access to markets, access to workforce, or access to a resource; and
• Leads to travel time metrics or wage-related metrics.
Project Prioritization
Key nontraditional outcome measures could include:
• Job “creation” (jobs added or retained as a result of a transportation improvement).
10 https://www.planning.dot.gov/Peer/Arizona/scottsdale_6-20-14_performance_outcomes_summary.pdf.

NCHRP 08-36, Task 131 Transportation Data Integration to Develop Planning Performance Measures
Cambridge Systematics, Inc. D-2
Table D.1 Accessibility Performance Measures from the FHWA Exchange
Application Accessibility/Connectivity Long-Range Planning/Strategy Development
• Percent growth occurring in transit shed. • Number of jobs within X distance of transit stations. • Person carrying capacity of the transportation system, particularly during peak period
(especially). • Mode Share. • Investment in facilities (e.g., miles of sidewalk or sidewalk added)/network connectivity. • Travel time. • Worker Shed (Expands access to workforce for an employment center).
Project Prioritization • Number of jobs accessible by car within 30 minutes during peak periods. • Change in person carrying capacity of the investment in the transportation system,
particularly at peak period. • Change in network connectivity. • Worker Shed (Improves worker shed for a job center). • Average commute time.
Monitoring • Number of jobs accessible by car within 30 minutes during peak periods. • Walkscore. • TransitScore. • Time series in peak-period person carrying capacity. • Average commute time by census block. • Travel time. • Worker Shed (Improves worker shed for a job center).
Table D.2 Health Performance Measures from the FHWA Exchange Here
Application Health Long-Range Planning/Strategy Development
• Number of new: – On-street bike facilities. – Trails. – Sidewalks.
• Presence of policies and programs that educate or encourage active transportation. • Americans with Disabilities Act (ADA) compliance of the pedestrian system. • Sidewalks on both sides of street. • Level of sidewalk investment. • Presence of TDM program. • Percentage of population with access to bike/ped facilities. • Percentage of population within X distance of health facility, and healthy food sources.
Project Prioritization • Integration of multimodal elements in proposed projects. • Connectivity to multimodal systems. • Percentage of population with access to bike/ped facilities.
Monitoring • Percentage of population with access to bike/ped facilities. • Improved health and lower incidence of preventable disease. • Money spent on health care. • Number of children walking or biking to school. • Number of bike lanes and ADA ramps.
NCHRP 08-36, Task 131 Transportation Data Integration to Develop Planning Performance Measures
Cambridge Systematics, Inc. D-3
The difficulties in implementing these performance measures are apparent. First, many imply that new data collection systems would have to be developed; it is difficult to integrate data that does not exist. The Exchange did not address the data availability issue, an indication that the state of the practice is still developing.
More importantly, transportation’s influence on these areas is only one of many. Accessibility has probably the strongest link to transportation improvements, but, in addition to travel conditions, the spacing of opportunities, as determined by land use, is an equal factor. Economic development relies heavily on capital formation, and community health is determined by a wide range of factors. In addition, measurement challenges exist in the health area in terms of demonstrating a causal relationship between transportation improvements and health outcomes. On the positive side, it was noted that health datasets maintained by health agencies could have applications in transportation planning. A peer exchange with health agencies could help provide some of this information.
D.2 Sustainability Performance Measures for Transportation
NCHRP Report 708: A Guidebook for Sustainability Performance Measurement for Transportation Agencies (2011)11
The report notes in its introduction: “Many transportation agencies are recognizing the importance of sustainability, in terms of concern for the environment, community health and vitality, and economic development, now and into the future. However, these agencies often struggle to apply sustainability in their core activities.” It lays out the rationale for incorporating sustainability, and the principles that should be applied to developing a sustainability program. Appendix B of the report offers suggestions for sustainability performance measures; many of which are traditional measures for mobility, safety, security, air quality, and economic development. However, performance measures for several goal areas related directly to sustainability are offered:
• Ecosystems;
• Waste generation; and
• Resource consumption.
However, there is no indication that the sustainability measures were in use at the time by planning agencies. Also, the data to support the measures is not defined. Finally, some of the measures seem somewhat obtuse and hard to quantify; for example:
• Change in the amount of waste generated by type, weight, and/or volume;
• Change in the amount of waste diverted (from landfill) by type, weight, and/or volume; and
• Change in the amount of priority habitat areas exposed to high levels of transportation noise/light (due to operational improvements).
11 http://onlinepubs.trb.org/onlinepubs/nchrp/nchrp_rpt_708.pdf.

NCHRP 08-36, Task 131 Transportation Data Integration to Develop Planning Performance Measures
Cambridge Systematics, Inc. D-4
EPA Guide to Sustainable Transportation Performance Measures (2011)12
This guidebook describes 12 performance categories for measuring transportation sustainability. Each category has suggested metrics that can be used, as shown in Table D.3. The guidebook discusses supporting data very briefly, and provides examples of how agencies have used the measures, but many of the examples are developed through modeling and not measurement.
Table D.3 Sustainability Performance Measures Developed for the U.S. Environmental Protection Agency (EPA)
Performance Category
Recommended Metrics (Measures)
Transit accessibility
• Percent of daily/peak-period trips (origins and destinations) starting or ending within one-quarter mile of a transit stop.
• Percent of population and employment within 0.4 mile of transit. • Households within 5 miles of park-and-ride lots or major transit centers. • Share of population with good transit-job accessibility (100,000+ jobs within 45 minutes). • Number of households within a 30-minute transit ride of major employment centers. • Percentage of work and education trips accessible in less than 30 minutes transit travel time. • Percentage of workforce that can reach their workplace by transit within one hour with no more
than one transfer.
Bicycle and pedestrian mode share
• Bicycle mode share (bicycle trips divided by total trips). • Pedestrian mode share (pedestrian trips divided by total trips).
Vehicle miles traveled (VMT) per capita
• VMT per capita. • Light-duty VMT per capita. • VMT per employee.
Carbon intensity • Total transportation Carbon Dioxide (CO2) emissions per capita. • Passenger transportation CO2 emissions per capita • Heavy-duty vehicle CO2 emissions per capita.
Mixed land uses • Ratio of jobs to housing. • Index of population and employment mix in a study area.
Transportation affordability
• Annual cost of transportation relative to annual income.
Benefits by income group
• Work trip travel time. • Nonwork trip travel time. • Travel time to key destinations. • Travel time for some specific trip types (shopping and recreation). • Travel time to specific major activity centers. • Average distance to the nearest transit stop. • Availability of nighttime service. • Availability of low-cost transit options. • Frequency of service. • Degree of crowding. • Number and quality of bus shelters.
12 https://www.epa.gov/sites/production/files/2014-01/documents/sustainable_transpo_performance.pdf.

NCHRP 08-36, Task 131 Transportation Data Integration to Develop Planning Performance Measures
Cambridge Systematics, Inc. D-5
Performance Category
Recommended Metrics (Measures)
Land consumption • Acreage of sensitive lands (e.g., parkland, habitat) on which new transportation infrastructure is built.
• Number of residential units and square feet of nonresidential space near agricultural and natural resource lands.
• Number of lane miles of roadways, amount of square footage of buildings, and number of parking spaces in park-and-ride lots.
• Amount of new housing and jobs in Greenfields. • Acres of land consumed per residential unit. • Acres of farmland converted to development.
Bicycle and pedestrian activity and safety
• Bicycles per day. • Pedestrians per day. • Bicycle crashes per 1,000 cyclists. • Pedestrian crashes per 1,000 pedestrians.
Bicycle and pedestrian level of service (LOS)
• Bicycle LOS (grade A-F). • Pedestrian LOS (grade A-F).
Average vehicle occupancy
• Average vehicle occupancy.
Transit productivity • Average weekday transit boardings per vehicle revenue hour. • Average transit boardings per vehicle revenue-mile. • Average annual transit boardings per route-mile. • Passenger miles traveled per vehicle revenue-mile.
D.3 Well Measured: Developing Indicators for Sustainable and Livable Transport Planning (2016)13
In a very recent document, Litman summarizes numerous previous studies on performance measures (he uses the term “performance indicators”) for sustainability and livability. The number and type of measures in these past studies are expansive, and Litman distills them into a workable set by goal area (Table D.4). He does provide the best connection yet between measures and supporting data (Table D.5), and observes the following:
• Much of the data required for these indicators may be available through existing sources, such as censuses and consumer surveys, travel surveys, and other reports. Some data can be collected during regular planning activities. For example, travel surveys and traffic counts can be modified to better account for alternative modes, and to allow comparisons between different groups (e.g., surveys can include questions to categorize respondents). Some indicators require special data that may require additional resources to collect.
13 Litman, Todd, Well Measured: Developing Indicators for Sustainable and Livable Transport Planning, Victoria Transport Policy Institute, May 11, 2016, http://www.vtpi.org/wellmeas.pdf.

NCHRP 08-36, Task 131 Transportation Data Integration to Develop Planning Performance Measures
Cambridge Systematics, Inc. D-6
Table D.4 Sustainability Performance Indicators from Litman 2016
Sustainability Goals Objectives Performance Indicators I. Economic
Economic productivity • Transport system efficiency. • Transport system integration. • Maximize accessibility. • Efficient pricing and incentives.
• Per capita GPD and income. • Portion of budgets devoted to transport. • Per capita congestion delay. • Efficient pricing (road, parking, insurance,
fuel, etc.). • Efficient prioritization of facilities (roads and
parking).
Economic development
• Economic and business development. • Access to education and employment opportunities.
• Support for local industries.
Energy efficiency • Minimize energy costs, particularly petroleum imports.
• Per capita transport energy consumption. • Per capita use of imported fuels.
Affordability • All residents can afford access to basic (essential) services and activities.
• Availability and quality of affordable modes (walking, cycling, ridesharing, and public transport).
• Portion of low-income households that spend more than 20 percent of budgets on transport.
Efficient transport operations
• Efficient operations and asset management maximizes cost efficiency.
• Performance audit results. • Service delivery unit costs compared with
peers. • Service quality.
II. Social
Equity/fairness • Transport system accommodates all users, including those with disabilities, low incomes, and other constraints.
• Transport system diversity. • Portion of destinations accessible by people
with disabilities and low income.
Safety, security, and health
• Minimize risk of crashes and assaults, and support physical fitness.
• Per capita traffic casualty (injury and death) rates.
• Human exposure to harmful pollutants. • Portion of travel by walking and cycling.
Community development
• Help create inclusive and attractive communities. Support community cohesion.
• Land-use mix. • Walkability and bikability. • Quality of road and street environments.
Cultural heritage preservation
• Respect and protect cultural heritage. Support cultural activities.
• Preservation of cultural resources and traditions.
• Responsiveness to traditional communities.

NCHRP 08-36, Task 131 Transportation Data Integration to Develop Planning Performance Measures
Cambridge Systematics, Inc. D-7
Sustainability Goals Objectives Performance Indicators III. Environmental
Climate protection • Reduce global warming emissions. • Mitigate climate change impacts.
• Per capita emissions of global air pollutants (Co2, CFCs, CH4, etc.)
Prevent air pollution • Reduce air pollution emissions. • Reduce exposure to harmful pollutants.
• Per capita emissions of local air pollutants (PM, VOCs, NOx, CO, etc.).
• Air quality standards and management plans.
Prevent noise pollution
• Minimize traffic noise exposure. • Traffic noise levels.
Protect water quality and minimize hydrological damages
• Minimize water pollution. • Minimize impervious surface area.
• Per capita fuel consumption. • Management of used oil, leaks, and
stormwater. • Per capita impervious surface area.
Open space and biodiversity protection
• Minimize water pollution. • Encourage more compact development. • Preserve high-quality habitat.
• Per capita land devoted to transport facilities.
• Support for smart growth development. • Policies to protect high-value farmlands and
habitat.
IV. Good Governance and Planning
Integrated, comprehensive, and inclusive planning
• Planning process efficiency. • Integrated and comprehensive analysis. • Strong citizen engagement. • Lease-cost planning (The most overall
beneficial policies and projects are implemented.).
• Clearly defined goals, objectives, and indicators.
• Availability of planning information and documents.
• Portion of population engaged in planning decisions.
• Range of objectives, impacts, and options considered.
• Transport funds can be spent on alternative modes and demand management if most beneficial overall.

NCHRP 08-36, Task 131 Transportation Data Integration to Develop Planning Performance Measures
Cambridge Systematics, Inc. D-8
Table D.5 Data Sources to Support Litman’s Performance Indicators
Economic Personal mobility (annual person-kilometers and trips) and vehicle travel (annual vehicle-kilometers), by mode (nonmotorized, automobile, and public transport).
BTS, FHWA, and LTS.
Freight mobility (annual tonne-kilometers) by mode (truck, rail, ship, and air).
BTS, FHWA, and LTS.
Land-use density (people and jobs per unit of land area). Census.
Average commute travel time and reliability. Census, LTS, and TTI.
Average freight transport speed and reliability. BTS, FHWA, and LTS. See FHWA, 2006 for more discussion of freight performance indicators.
Per capita congestion costs. TTI (Per capita costs should be used rather than the Congestion Index).
Total transport expenditures (vehicles, parking, roads, and transit services).
BLS (vehicle and transit expenditures), APTA (transit expenditures). Other sources needed for tolls, parking, and other expenditures.
Quality (availability, speed, reliability, safety, and prestige) of nonautomobile modes (walking, cycling, ridesharing, and public transit).
LTS and APTA. Other sources needed to improve multimodal performance indicators, particularly for nonmotorized modes (walking and cycling).
Number of services within 10-minute walk, and job opportunities within 30-minute commute of residents.
Walkscore, Census, LTS, and regional Geographic Information System (GIS) analysis.
Portion of households with Internet access. Census, NTIA.
Social Trip to school mode share (nonmotorized preferred) LTS. This may require special survey questions.
Per capita traffic crash and fatality rates. FHWA, NHTSA, APTA.
Quality of transport for disadvantaged people (disabled, low incomes, children, etc.).
LTS. This generally requires special survey questions.
Affordability (portion of household budgets devoted to transport, or combined transport and housing).
BLS, HTAI, LTS.
Overall transport system satisfaction rating (based on objective user surveys).
LTS. This generally requires special survey questions.
Universal design (transport system quality for people with disabilities and other special needs).
LTS. This generally requires special survey questions.
Portion of residents who walk or bicycle sufficiently for health (15 minutes or more daily).
LTS. This generally requires special survey questions.
Portion of children walking or cycling to school. LTS. This generally requires special survey questions.
Degree cultural resources are considered in transport planning.
Requires special analysis of planning process.
Housing affordability in accessible locations. HTAI, local GIS analysis.
Transit affordability. APTA, LTS.
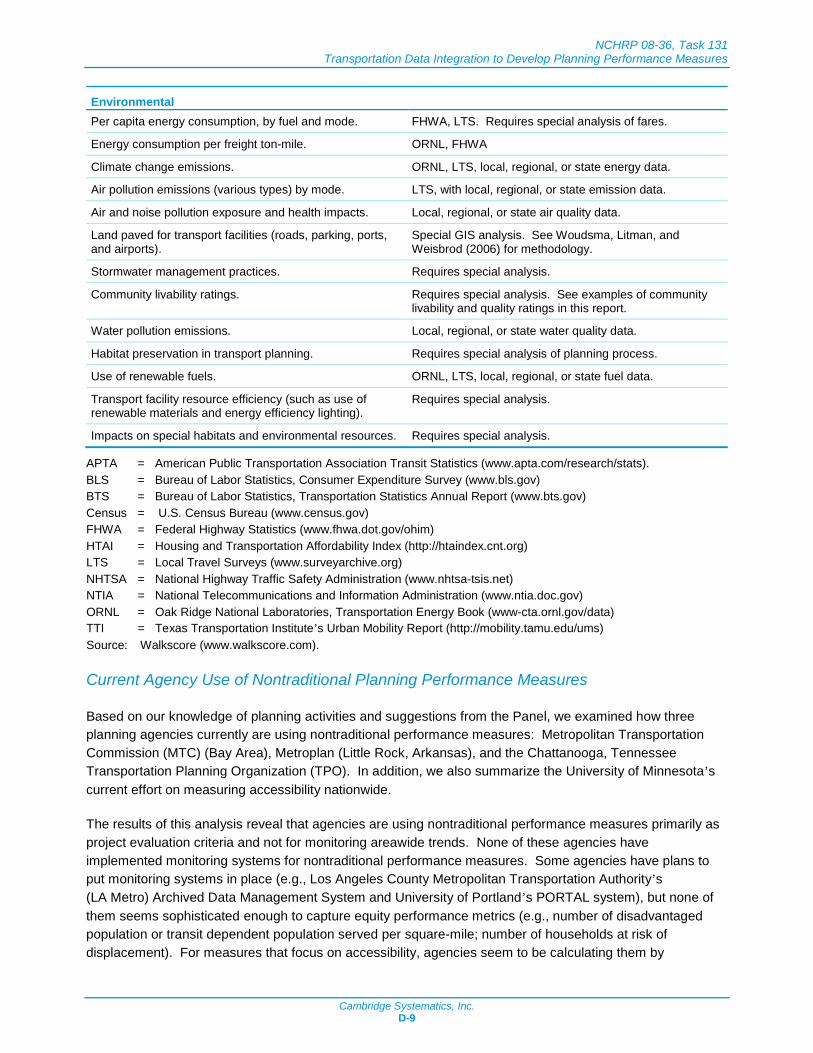
NCHRP 08-36, Task 131 Transportation Data Integration to Develop Planning Performance Measures
Cambridge Systematics, Inc. D-9
Environmental Per capita energy consumption, by fuel and mode. FHWA, LTS. Requires special analysis of fares.
Energy consumption per freight ton-mile. ORNL, FHWA
Climate change emissions. ORNL, LTS, local, regional, or state energy data.
Air pollution emissions (various types) by mode. LTS, with local, regional, or state emission data.
Air and noise pollution exposure and health impacts. Local, regional, or state air quality data.
Land paved for transport facilities (roads, parking, ports, and airports).
Special GIS analysis. See Woudsma, Litman, and Weisbrod (2006) for methodology.
Stormwater management practices. Requires special analysis.
Community livability ratings. Requires special analysis. See examples of community livability and quality ratings in this report.
Water pollution emissions. Local, regional, or state water quality data.
Habitat preservation in transport planning. Requires special analysis of planning process.
Use of renewable fuels. ORNL, LTS, local, regional, or state fuel data.
Transport facility resource efficiency (such as use of renewable materials and energy efficiency lighting).
Requires special analysis.
Impacts on special habitats and environmental resources. Requires special analysis.
APTA = American Public Transportation Association Transit Statistics (www.apta.com/research/stats). BLS = Bureau of Labor Statistics, Consumer Expenditure Survey (www.bls.gov) BTS = Bureau of Labor Statistics, Transportation Statistics Annual Report (www.bts.gov) Census = U.S. Census Bureau (www.census.gov) FHWA = Federal Highway Statistics (www.fhwa.dot.gov/ohim) HTAI = Housing and Transportation Affordability Index (http://htaindex.cnt.org) LTS = Local Travel Surveys (www.surveyarchive.org) NHTSA = National Highway Traffic Safety Administration (www.nhtsa-tsis.net) NTIA = National Telecommunications and Information Administration (www.ntia.doc.gov) ORNL = Oak Ridge National Laboratories, Transportation Energy Book (www-cta.ornl.gov/data) TTI = Texas Transportation Institute’s Urban Mobility Report (http://mobility.tamu.edu/ums) Source: Walkscore (www.walkscore.com).
Current Agency Use of Nontraditional Planning Performance Measures
Based on our knowledge of planning activities and suggestions from the Panel, we examined how three planning agencies currently are using nontraditional performance measures: Metropolitan Transportation Commission (MTC) (Bay Area), Metroplan (Little Rock, Arkansas), and the Chattanooga, Tennessee Transportation Planning Organization (TPO). In addition, we also summarize the University of Minnesota’s current effort on measuring accessibility nationwide.
The results of this analysis reveal that agencies are using nontraditional performance measures primarily as project evaluation criteria and not for monitoring areawide trends. None of these agencies have implemented monitoring systems for nontraditional performance measures. Some agencies have plans to put monitoring systems in place (e.g., Los Angeles County Metropolitan Transportation Authority’s (LA Metro) Archived Data Management System and University of Portland’s PORTAL system), but none of them seems sophisticated enough to capture equity performance metrics (e.g., number of disadvantaged population or transit dependent population served per square-mile; number of households at risk of displacement). For measures that focus on accessibility, agencies seem to be calculating them by

NCHRP 08-36, Task 131 Transportation Data Integration to Develop Planning Performance Measures
Cambridge Systematics, Inc. D-10
combining multiple sources of data such as Census data (e.g., employment data) and data to which they already have access such as travel times from travel demand models (not measured travel times).
The details of the performance measure systems used by these agencies are in the Appendix A.
Metropolitan Transportation Commission (MTC)
MTC’s efforts are focused on the development of the Plan Bay Area 2040, a state-mandated, integrated long-range transportation, land-use, and housing plan. They have adopted a combination of areawide performance measures (stated as “targets”) and evaluation criteria for assessing projects. The combined performance measure/targets are:
• House 100 percent of the region’s projected growth by income level without displacing current low-income residents and with no increase in in-commuters over the Plan baseline year;
• Reduce adverse health impacts associated with air quality, road safety, and physical inactivity by 10 percent;
• Direct all nonagricultural development within the urban footprint (existing urban development and urban growth boundaries);
• Decrease by 10 percent the share of lower-income residents’ household income consumed by transportation and housing;
• Increase the share of affordable housing in PDAs, TPAs, or high-opportunity areas by 15 percent;
• Reduce the share of low- and moderate-income renter households in PDAs, TPAs, or high-opportunity areas that are at an increased risk of displacement to 0 percent;
• Increase the share of jobs accessible within 30 minutes by auto, or within 45 minutes by transit by 20 percent in congested conditions;
• Increase by 35 percent the number of jobs in predominantly middle-wage industries; and
• Reduce per-rider transit delay due to aged infrastructure by 100 percent.
Each proposed project for the Plan is evaluated against these targets using a qualitative scoring system that assigns points depending on whether the project has a positive or negative effect on the target.
Metroplan (Little Rock, Arkansas)
Metroplan uses a qualitative scoring mechanism to assess potential projects based on the measures in Table D.6.

NCHRP 08-36, Task 131 Transportation Data Integration to Develop Planning Performance Measures
Cambridge Systematics, Inc. D-11
Table D.6 Metroplan’s Performance Scoring System
Freight and/or Passenger Intermodal Connectivity
Does the project enhance connectivity of two or more modes?
Safety Does the project address a high-crash location (motorized or nonmotorized)?
Choice in Transportation and Complete Streets
Does the project enhance access or quality of transit, walking, and/or cycling opportunities, which can contribute to complete streets, lower household transportation cost, and increased physical activity?
Connectivity Does the project enhance connectivity to a major activity center (downtown, town center, campus, hospital/wellness center, sports complex, etc.) via alternative routes?
Compact, Mixed-Use, and Reduced Impacts on Environmentally Sensitive Lands
Does the project complement compact, mixed-use development consistent with the development framework in the Vision, and/or reduces land consumption and impervious surface?
Air Quality and Energy Efficiency
Is the project likely to improve air quality and/or reduce energy consumption (through improved efficiency or reduced demand)?
Complementary Land-Use Does the corresponding local government have complementary plans and development practices in place?
Existing Neighborhoods Does the project support an existing neighborhood through improved local infrastructure (i.e., sidewalks) or improved access?
Access to Destinations Study and National Accessibility Evaluation Pooled-Fund Study, University of Minnesota Center for Transportation Studies
Accessibility is becoming more commonplace as a travel time-based performance measure in planning agencies. Part of the reason for this is the complaint that measures based solely on travel time tend to make highway improvements look more favorable than investments in alternative modes and land use.
This study highlights the new emphasis placed on nontraditional performance measures by the profession. Its predecessor study focused on accessibility in the Minneapolis region and found:
While congestion has been worsening, the ease of reaching destinations has been getting better almost everywhere in the region – especially by automobile. Accessibility has improved also via walking, biking, and public transit. The greatest increases in access occurred in the developing edges of the region. Although some new roads were added and others were improved, land-use changes and increased development densities explain most of the accessibility improvement.
Based on these findings, it is not difficult to understand the interest in accessibility by planning agencies. The cost of transportation system improvements has increased dramatically, reducing the ability to influence travel conditions solely by this means. Moreover, because accessibility captures land use effects, it is relevant to planning agency goals that go beyond infrastructure performance to quality of life.
The University of Minnesota study is using only one measure, but computed separately by mode: number of jobs that can be reached within various travel time thresholds by: 1) auto, 2) transit, and 3) walking. What is useful about this study is its ambitious scale (national) and its methodology: accessibility calculations are based on detailed travel time calculations for both driving and transit, which are implemented using

NCHRP 08-36, Task 131 Transportation Data Integration to Develop Planning Performance Measures
Cambridge Systematics, Inc. D-12
commercially available, global positioning system (GPS)-based speed measurements and published transit schedules.
Chattanooga TPO
Even planning agencies from medium-sized urban areas are starting to use nontraditional measures. The Chattanooga TPO uses a tiered system that monitors performance at the system level, and ties them to related project evaluation measures/criteria (Table D.7)
Table D.7 Chattanooga’s Performance Scoring System
Systems-Level Measure Project-Level Measure VMT per capita • Project reduces VMT.
• Project promotes nonmotorized access to community resources. • Project is in keeping with community character.
Mode split • Project located on facility with corridor protection plan. • Project fills gap in existing system. • Project improves efficiency through intelligent transportation system (ITS).
EnvisionTM Framework for Sustainable Infrastructure
An intriguing activity uncovered by the project team during this task is the Envision framework. Envision was created by a strategic alliance of the Zofnass Program for Sustainable Infrastructure at the Harvard University Graduate School of Design and the Institute for Sustainable Infrastructure (ISI). It is designed as a project assessment tool and to offer guidance for sustainable infrastructure design. It can be used directly in the decision-making process, or just to document the technical project assessment process in a transparent way.14 It is meant to cover all forms of physical infrastructure, including roads, bridges, pipelines, railways, airports, dams, levees, landfills, and water treatment systems.
The core of the Envision framework is its “Checklist,” a tool that scores projects on several qualitative factors. The framework has five major categories, which are further decomposed into the following subcategories:
1. Quality of Life. Purpose, Well-being, Community;
2. Leadership. Collaboration, Management, Planning;
3. Resource Allocation. Materials, Energy, Water;
4. Natural World. Siting, Land and Water, Biodiversity; and
5. Climate and Risk. Emissions, Resilience.
14 http://sustainableinfrastructure.org/.

NCHRP 08-36, Task 131 Transportation Data Integration to Develop Planning Performance Measures
Cambridge Systematics, Inc. D-13
Each category has a series of yes/no questions that create the score. Each question has very structured guidance on what would comprise a “yes” answer. Appendix D shows the checklist questions for each category.
The ISI offers certification for professionals who wish to implement the framework. They also offer validation services for Envision analyses undertaken by others. Finally, projects that receive exceptional scores can be submitted for awards to ISI. Port Metro Vancouver’s Low-Level Road project was the first transportation project to receive an ISI Envision-verified sustainable infrastructure rating system award:
The Low-Level Road Project involved the realignment and elevation of approximately 2.6 kilometers of the Low-Level Road in North Vancouver, British Columbia, and providing space for two new rail tracks. The project also eliminated three existing road and rail crossings, and provided direct access to major port terminals. In addition, the project addressed safety, recreation, and noise challenges associated with port operations along the Low-Level Road, including the reconfiguration of three intersections and improved lanes for cyclists. The project also involved the continuation of the Spirit Trail pedestrian walkway, including structures over two creeks and an overpass.15
D.4 Innovative Tools and Data Sources for Mobility and Accessibility
Introduction
Mobility is defined as the ability to move between different destinations, while accessibility is defined as the number of destination opportunities. The destination opportunities are also referred to activity sites (destinations) reachable within a given travel distance, or travel time.
Both mobility and accessibility consider all transportation modes, including mobility substitutes, such as telecommuting. Accessibility is a much broader concept not only focusing on the connections between modes (intermodality), but also recognizing the social and environmental costs (externalities) of transportation.
Mobility and accessibility are not synonymous. Impacts of improvements on mobility and accessibility vary dramatically at different spatial locations. It is critical to conceptualize the relationship between various performance measures, such as mobility and accessibility, to understand these differences. This is an area of future research need.
Traditional performance measures focus on unimodal performance rather than multimodal performance. This is not always the “fault” of the measure, but rather a reflection of multimodal data limitations. Whenever possible, multimodal performance measures should be used because they offer greater benefits over unimodal performance measures. Multimodal performance measures should be established because they can capture the full extent of transportation system efficiency.
Given the current level of transportation planning implementation, transportation agencies have little experience in terms of applying multimodal performance measures. While performance measures for individual modes exist, there is a need for a comprehensive and integrated approach to multimodal
15 http://sustainableinfrastructure.org/envision/project-awards/low-level-road/.

NCHRP 08-36, Task 131 Transportation Data Integration to Develop Planning Performance Measures
Cambridge Systematics, Inc. D-14
performance measures. It is vital that transportation agencies develop reliable and flexible multimodal performance measures to improve multimodal transportation investment decision-making.
D.5 Total Peak-Period Travel Time
The Texas A&M Transportation Institute (TTI) reported the total peak-period travel time (TPPTT) in the 2012 Urban Mobility Report. (1)
Due to limitations identified in existing databases, previous TPPTT estimates did not include minor roads (collector and local streets). However, the updated TPPTT in the 2012 report incorporates two primary categories (major roads and minor roads) grouped from the full roadway classifications (freeways, arterial, collector, and local streets) in terms of automobile travel times. (2)
The measure uses a weighted average (by mode share) of trip travel times during the morning and evening peak periods for individual modes. Average peak-period travel time is calculated for an individual mode, and then integrated into the updated TPPTT. See the following equations. (3)
The improvement of this performance measure allows an in-depth mode comparison and further impact assessment. Average travel time during peak periods for individual modes can be compared in the preliminary analysis phase. Impacts that an individual mode has on other modes can be examined through observing the percentage change of reduction in travel time by the alternative mode compared to the baseline travel time by the primary mode. Though automobile travel is the primary mode here based on the methodology assumption, future work will focus on bringing in additional modes as multimodal data sources become available.
Total Peak-PeriodTravel Timeper Traveler(Minutes Per
Traveler)
=
∑ �Travel Time
by Mode(Minutes per Traveler)
× Mode Share(Peak-Period Travelers) �
Total Peak− Period Travelers
(Eq. 1)
Peak UncongestedTravel Time
(Person-Hours) =
1UncongestedTravel Speed
× Daily
Vehicle-Milesof Travel
× 1.25 Personsper Vehicle (Eq. 2)
Peak-PeriodDaily Delay
(Person-Hours) = ��
Vehicle-Milesof Travel
Actual Speed� — �Vehicle-Miles
of TravelUncongested Speed�� × 1.25 Persons
per Vehicle (Eq. 3)
Daily Peak Period
Travel Time perAuto Traveler(Minutes per
Auto Traveler)
=
⎝
⎜⎜⎜⎜⎛�
Major RoadPeak Delay
(Person-Hours) +
Minor RoadPeak Delay
(Person-Hours)�+ �
Major RoadPeak Uncongested
Travel Time(Person-Hours)
+
Minor RoadPeak Uncongested
Travel Time(Person-Hours)
�
Auto Travelers
⎠
⎟⎟⎟⎟⎞
× 60 Minutesper Hour (Eq. 4)

NCHRP 08-36, Task 131 Transportation Data Integration to Develop Planning Performance Measures
Cambridge Systematics, Inc. D-15
Through developing data collection methods and technologies, it is anticipated that multimodal data will become available (e.g., bicycle travel time, pedestrian travel time, telecommuting travel time) to fill existing multimodal data gaps. Though not mature, an approach such as the TPPTT that can integrate multiple modes provides a promising method for comprehensive assessment of the transportation system.
D.6 TOol using STAcked Data – TOSTADA
The TOol using STAcked DAta (TOSTADA) project, sponsored by the Texas Legislature, was conducted by the Texas A&M Transportation Institute (TTI) within the Policy Research Center (PRC). (4)
The emerging approach in Texas (the concept of TOSTADA) incorporates various factors to “provide a comprehensive and consistent level of information.” (4) Individual data map layers are visually stacked, using a GIS tool to demonstrate the concept of integrating information about congestion, safety, pavement condition, bridge quality, and freight value. Information can be viewed through color-coded maps with scales indicating the changing status of performance. This allows for improved investment decision-making by aligning all roadway information together.
Data to power the TOSTADA come from the following sources: (4)
• Texas DOT’s Roadway/Highway Network (RHiNo) geodatabase roadway network;
• INRIX traffic message channel (TMC) network;
• Texas DOT’s Crash Records Information System (CRIS);
• Texas DOT’s Pavement Management Information System (PMIS) database;
• Texas DOT’s Bridge Inspection Database;
• Texas DOT’s Bridge Inventory File database; and
• Bureau of Transportation Statistics (BTS) and FHWA’s Freight Analysis Framework (FAF) database.
Figure D.1 and Figure D.2 show examples of GIS maps produced by TOSTADA, demonstrating the color-coded roadway conditions for two counties. The analyst can easily use the color-coded roadway stick-diagrams to identify specific grades of roadway conditions.
The TOSTADA project is for concept demonstration only. This initial step of the tool developing process only produced preliminary analysis results of a limited number of factors. Additional data will be incorporated into TOSTADA when they are available.

NCHRP 08-36, Task 131 Transportation Data Integration to Develop Planning Performance Measures
Cambridge Systematics, Inc. D-16
Figure D.1 Bexar County Example of TOSTADA
Figure D.2 Tom Green County Example of TOSTADA
AirSage Cellular Origin-Destination Data
AirSage is the largest provider of cellular origin-destination data in the U.S. Through partnerships with the nation’s largest wireless carriers, AirSage has exclusive access to mobile device signaling data. Cellular-signal data points are first captured when the mobile devices are active on the cellular network, and then converted into real-time location data by extracting the time and location. AirSage aggregates the cellular-signal data points (with time and location attributes) into origin-destination data using Wireless Signal Extraction (WiSE™) technology.
The first application of AirSage cellular origin-destination data is trip matrix data preparation or trip matrices development. The Idaho Statewide Travel Demand Model (STDM) is an example. STDM is developed by the Idaho Transportation Department (ITD) as part of ITD’s data-driven, performance-based Investment Corridor Analysis Planning System (ICAPS). (5)(6)(7) Two key requirements of the model are: 1) to forecast the network LOS from the supply perspective, and 2) to estimate the auto and truck volumes (including external traffic) from the demand perspective. (5)(6)(7)
Due to the difficulties in external travel data collection, previous efforts typically relied on the traffic counts. Cellular origin-destination data are used to synthesize the trip matrix data. In the O/D matrix estimation phase, trip matrix data are input into the model to generate the number of trips, an indicator of travel demand. Trips are coded as Home-Based Work (HBW), Home-Based Other (HBO), Non-Home-Based (NHB), and Resident versus visitor (Visitor NHB) according to the locations of home and work anchor.

NCHRP 08-36, Task 131 Transportation Data Integration to Develop Planning Performance Measures
Cambridge Systematics, Inc. D-17
Cellular origin-destination data in this case are requested for a 750 x 750 super zone coverage area on a daily time period in September 2013. Various Census datasets are used to expand the sampled trips for the population and employment matching purposes.
The second application of AirSage cellular origin-destination data is model validation. The Syracuse Metropolitan Transportation Council (SMTC) Travel Model is an example. SMTC is a regional travel model, developed by SMTC for the Metropolitan Planning Area (which includes the City of Syracuse in Onondaga County and portions of Madison and Oswego Counties). (8) The SMTC Travel Model is designed as a traditional, four-step model with built-in TransCAD software packages and GIS components. Cellular origin-destination data in this case are collected on a daily time period in October 2013 by selected time periods (AM peak, PM peak, and off-peak) and trip purposes (HBW, HBO, and NHB). (8)
In the model validation phase, comparisons across various dimensions are conducted. Through comparison by trip purposes, the AirSage model shows stronger capability of identifying Home-Based Other (HBO) trips than Home-Based Work (HBW) trips and Non-Home-Based (NHB) trips, compared to National Capital Region Transportation Planning Board (TPB) model, and Mobile Area Transportation Study (MATS) model. (8)(9) Comparison by trip purposes suggests that AirSage is more suitable for model validation at aggregated levels. (8)(9)
For special zones of interest, AirSage fails to capture a substantial amount of trips due to the clustering algorithms used to define trip purposes. Comparisons for time-of-day partitions and trip length frequency distribution are performed as well. Results show both similarities and variations among different trip purposes. (8)(9)
When using AirSage cellular origin-destination data, the following factors should be carefully considered: (8)(9)
• Level of aggregation;
• Purpose of trips;
• Average trip length;
• Size of external zones;
• Time of data collection;
• Time-of-day partitions;
• Trip length frequency distribution; and
• Demographic components.
The third application of AirSage cellular origin-destination data is exogenous trip estimation. Staff from the National Capital Region Transportation Planning Board (TPB) and Metropolitan Washington Council of Governments (MWCOG) have conducted a preliminary evaluation of the cellular origin-destination data as a basis for exogenous trip estimation. (10) For a TPB (four-step travel model) modeled area, various AirSage parameters are selected for its external catchment areas. Results of external trips by purpose show reasonable travel patterns and consistent trip generators using AirSage cellular origin-destination data. (10) However, AirSage cellular origin-destination data does not show consistency at either the traffic analysis zone (TAZ) level of analysis or the district level of analysis. (10)
Factors, including travel mode, auto occupancy, and vehicle classification, etc., are still missing from the current data aggregation and processing process. (8) Thus, AirSage cannot be treated as a replacement but a supplement for traditional four-step travel demand models. Though highly sampled with inherent uncertainty, AirSage cellular origin-destination data are emerging as a promising data source for next-generation travel demand models. (10)

NCHRP 08-36, Task 131 Transportation Data Integration to Develop Planning Performance Measures
Cambridge Systematics, Inc. D-18
INRIX InsightsTM Trips and StreetLight InSight® Origin-Destination Data
INRIX and StreetLight Data are two acknowledged origin-destination data analysis tool providers in the U.S. Products such as INRIX InsightsTM Trips (11) and StreetLight InSight® (12) provide source of origin-destination data and trip matrices.
An example project using these data sources was sponsored by the Napa County Transportation and Planning Agency (NCTPA), and performed by Fehr & Peers. The Napa County Travel Behavior Study was conducted to refine the Napa-Solano Travel Demand Model (NSTDM) and update the Countywide Transportation Plan. (13) It was an opportunity to “integrate innovative data collection methods with enhancements to traditional methods to offer an unprecedented look into travel behavior in Napa County.” (13)
The study approach utilized five data collection methods, and combined results from the five data collection methods to provide a comprehensive dataset. The five data collection methods were Vehicle Classification Counts; Winery Regression Analysis; License Plate Matching; Survey (In-Person Winery, Vehicle Intercept, and Online Employer Survey); and Mobile Device Data.
Mobile device data were initially obtained from INRIX and StreetLight Data “over a 61-day period from September 1, 2013 to October 31, 2013 for the entire State of California.” (13) “Home Zone” and “Work Zone” for each mobile device were determined. Trip purposes were identified using demographic data and land use data from the Napa-Solano Travel Demand Model (NSTDM).
A number of 434 wineries and additional subdivisions were also added to NSTDM TAZ system to offer a final geographic layer with 685 TAZs and 6 external gateways. Attributes of observed trips included day of week, time of day, vehicle-type (personal automobile and commercial vehicle), and trip-type (internal and external).
Data obtained by StreetLight Data were refined using the other four data collection methods to generate a robust dataset: (13)
• Traffic Counts. Used to provide control totals;
• Winery Regression Analysis. Used to provide total winery trip generation data;
• License Plate Matching. Used to refine trip purpose and trip type; and
• Surveys. Used to refine origin and destinations, trip purpose, and trip type.
Derived from GPS data, the following StreetLight InSight® Metrics were also used by Fehr & Peers to support the project: (12)
• Transportation Analysis Zone (TAZ) Origin-Destination Matrix;
• Select Link Origin-Destination and Internal/External Matrix; and
• Select Link for Routing.
Sophisticated algorithms were used to create the trip distribution matrix (derived from 206,152 sample trips) with paired origin/destination coordinates and observed time periods. Results indicated that 74,400 (36 percent) trips were external trips and 6,700 trips (9 percent) were pass-through trips. The remaining 125,052 (55 percent) internal trips were compared with the MTC Travel Demand Model.

NCHRP 08-36, Task 131 Transportation Data Integration to Develop Planning Performance Measures
Cambridge Systematics, Inc. D-19
TTI Bluetooth Origin-Destination Data and INRIX GPS Origin-Destination Data
Bluetooth (BT) has emerged as a potential means of collecting external travel survey data along with other new technologies. The Texas A&M Transportation Institute (TTI) has conducted a pilot study to compare external trips developed using Bluetooth to the same external trips developed using cellular data and GPS data. The study area was the Tyler Area Metropolitan Planning Organization (MPO), Smith County, Texas, in spring 2014. Researchers focused on the identification of external trips (external-external trips, external-internal trips, and internal-external trips) to determine the viable use of different data sources in Texas DOT’s external travel surveys.
Bluetooth data were collected for two weeks from April 1 to April 14, 2014. Tuesdays, Wednesdays, and Thursdays’ data were used to generate the “average weekday trips” parameter. AirSage cellular data were collected for four weeks from March 21 to April 24, 2014. A large sample size of poor positional accuracy data was acquired. Cellular data capture area was a minimum 500 meters x 500 meters coverage zone. INRIX GPS data were collected for three months from February 24 to May 9, 2014. A small sample size of good positional accuracy data was acquired. GPS data capture area was a sample 10 miles x 10 miles buffer around Smith County.
Comparisons of BT-data, cellular-data, GPS-data, and travel-survey-data are shown in Figure D.3 through Figure D.5 for varied vehicle types: (14)
Figure D.3 External-to-External Trips Results All Vehicles

NCHRP 08-36, Task 131 Transportation Data Integration to Develop Planning Performance Measures
Cambridge Systematics, Inc. D-20
Figure D.4 External-to-External Trips Results Noncommercial Vehicles
Figure D.5 External-to-External Trips Results Commercial Vehicles
For external-to-external trips for all vehicles, BT data show a higher comfort level in trip identification. (14) For external-to-external trips for commercial vehicles, GPS data show a higher comfort level in trip identification. (14) But GPS data are biased towards commercial vehicles with over-represented number of commercial vehicle trips. For external-to-external trips for resident versus visitor (Visitor NHB), cellular data show a higher comfort level in trip identification. (14) However, cellular data are not able to discern vehicle type or mode. Thus, both Cellular data and GPS data can be benchmarked against BT data.
With improving and evolving technologies, high-quality external travel survey data will be collected. So far, a combination of Bluetooth (BT), cellular, and GPS appears to be the best approach for external travel survey data collection to capture traveler behaviors.

NCHRP 08-36, Task 131 Transportation Data Integration to Develop Planning Performance Measures
Cambridge Systematics, Inc. D-21
MOSAIC – Model of Sustainability and Integrated Corridors
A Model of Sustainability and Integrated Corridors (MOSAIC) was developed to support the Sustainability Initiative proposed by the Maryland DOT – State Highway Administration (SHA) through the Comprehensive Highway Corridors (CHC) program. (15) Integrated into the Maryland SHA Enterprise GIS (eGIS) system, MOSAIC is a high-level, user-friendly application with quantitative sustainability models. It is designed to “estimate the sustainability impact of multimodal highway corridor improvement options and select the most sustainable corridor improvement option for the transportation planning process.” (19) (20)
Funded by the Maryland DOT SHA, the research project, titled “Comprehensive Highway Corridor Planning with Sustainability Indicators” (16)(17)(18)(19)(20), (21), delivers two final products: 1) Spreadsheet MOSAIC (Volume 1, Volume 2, and Volume 3); and 2) MOSAIC-eGIS System (Highway eGIS-MOSAIC and Multimodal eGIS-MOSAIC) over three phases. (16)(17)(20)
Phase 1of the project “defines a comprehensive set of sustainability indicators, including six categories (mobility, safety, energy and emissions, natural resources, socioeconomic impact, and cost); and more than 30 indicators.”(16) A comprehensive set of sustainability indicators is defined by the research team; and the staff members, along with the project liaisons after an extensive review of the current practices. The sustainability indicators adopted are listed in Table D.8.

NC
HR
P 08-36, Task 119
Transportation Data Integration to D
evelop Planning Perform
ance Measures
Cam
bridge Systematics, Inc.
D-22
Table D.8 MOSAIC – Model of Sustainability and Integrated Corridors Summary
Sustainability Categories
Sustainability Indicators Indicator Elements
Performance Measures and Tools
Reference Lists
Performing Agencies
Mobility Travel Time Savings • General purpose lanes • Managed lanes • Bus/Truck only lanes • LRT
Traffic Control Delay at Intersections; Level of Services at Intersections
Highway Capacity Manual (HCM), 2000
TRB of the National Academies of Science (NAS)
Speed Estimation Based on Daily Traffic Volume per Lane
Urban Mobility Report (UMR), 2007
Texas A&M Transportation Institute (TTI)
Travel Reliability
Reliability Index; Travel Time Index
Urban Mobility Report (UMR), 2007
Texas A&M TTI
Safety Crash Rates • Roadway • Intersection • Corridor
Safety Performance Function (SPF)
Highway Safety Manual, 2010
FHWA
Crash Severity
Crash Modification Factors (CMF)
Highway Safety Manual, 2010
FHWA
Socioeconomic Impact
Economic Impact
Effective Density (ED) Wider Economic Benefits and Impacts on GDP Study, 2005
U.K. Department of Transport
Productivity elasticity (ElP)
Productivity and the Density of Economic Activity, 1996
Ciccone and Hall’s density elasticity
Livability • Land-use compatibility • Transportation
accessibility
Noise
Aesthetics • Facilities’ compatibility • Land-use attractiveness • Visual appeal • Historical road and sites
protection
On-line Survey

NC
HR
P 08-36, Task 131
Transportation Data Integration to D
evelop Planning Perform
ance Measures
Cam
bridge Systematics, Inc.
D-23
Sustainability Categories
Sustainability Indicators Indicator Elements
Performance Measures and Tools
Reference Lists
Performing Agencies
Natural Resources
Various types of Natural Resources
Corridor roadway, intersection geometry and GIS shapefiles using ArcGIS
Buffer Distances for each Improvement Alternative
Maryland SHA
Energy and Emissions
Pollution Emissions
MOVES2010a (Motor Vehicle Emission) Simulator
National Emission Trends (NET) Database
U.S. EPA
Greenhouse gas Emissions
MOVES2010a (Motor Vehicle Emission) Simulator
National Emission Trends (NET) Database
U.S. EPA
Fuel Consumption
MOVES2010a (Motor Vehicle Emission) Simulator
Transportation Energy Data Book: Edition 30
U.S. EPA
Cost Cost for General Purpose Lanes
Cost Estimation Highway Development
Project Information, 2010
Maryland SHA
Highway Construction Cost Estimating Manual, 2009
Maryland SHA
Cost for Other Alternatives
Cost Estimation Financially Constrained
Long-Rang Transportation Plan (LRTP) for 2040
National Capital Region Transportation Planning Board (TPB)
I-70 Dedicated Truck Lanes Feasibility Study
Indiana DOT in partnership with Missouri, Illinois, and Ohio DOTs

NCHRP 08-36, Task 131 Transportation Data Integration to Develop Planning Performance Measures
Cambridge Systematics, Inc. D-24
Phase 2 of the project “extends the quantitative evaluation of sustainability indicators to additional multimodal corridor improvement options, including high-occupancy vehicle (HOV) lane, high-occupancy toll (HOT) lane, bus rapid transit/bus-only lane, light-rail transit, truck-only lane, express toll lane, and road diet.” (17) A pivot-point model and incremental logit mode model are used to generate the updated mode share parameters for alternative highway corridor improvement options. Impact analysis runs for each MOSAIC module based on users’ customized criteria. A final corridor-level impact score will be computed after weighting the averages of section-level impact scores. Table D.8 illustrates MOSAIC technical contents.
Phase 3 of the project “focuses on the model calibration/validation and additional model enhancement.” (18) U.S. 15 and U.S. 29 were selected for the model calibration/validation purpose. Comparison indicates that calculated MOSAIC travel-time data are consistent with collected INRIX travel-time data during peak- and off-peak periods. So no further enhancement was needed.
The development of MOSAIC is a joint effort between the Maryland SHA staff members and the University of Maryland (UMD) research team. The MOSAIC is noted as a cost-effective application to select the best corridor-level improvement option, particularly in the early phases of the long-range transportation planning process.
Analytic Tools for Nonmotorized Travel Demand Estimation
A National Cooperative Highway Research Program (NCHRP) Project (Report 770), titled “Estimating Bicycling and Walking for Planning and Project Development: A Guidebook,” (22), a multiyear research project that supports bicycle and pedestrian planning, is being conducted to develop robust and responsive analytic tools for estimating bicycling and walking travel demand. (22)(23) A thorough review of research on bicycle and pedestrian travel suggests two mainstream categories of the current analytic tools: 1) travel demand models and 2) facility demand models. However, realistic analytic tools available for nonmotorized travel demand estimation are limited due to reliability of available data, variability of geographic scale, level of spatial aggregation, etc.
In response to the issues that arose from the empirical findings, the research team has proposed a comprehensive, choice-based modeling framework. The concept of accessibility is seen as an effective measure of utility, and a central premise in the choice-based modeling framework. It is critical to capture the essence of nonmotorized travel at a fine level of spatial resolution (parcel level of detail) than at a coarse level of spatial resolution (TAZ level of aggregation). Thus, the use of GIS is introduced to measure the accessibility of nonmotorized travel.
Two completely new analytic tools: 1) Tour-Based Bicycle and Pedestrian Model developed in Seattle; and 2) GIS-based Walk-Accessibility Model developed in the Arlington County, Virginia. Portion of the Washington, D.C. metro-area is recommended for practitioners in the “Estimating Bicycling and Walking for Planning and Project Development: A Guidebook.” (22)
Highlights for the Tour-Based Bicycle and Pedestrian Model include:
• Performing Agency. Puget Sound Regional Council (PSRC);
• Study Area. Seattle, Washington; and
• Model Structure. Parcel-Level Tour-Based Approach.

NCHRP 08-36, Task 131 Transportation Data Integration to Develop Planning Performance Measures
Cambridge Systematics, Inc. D-25
• Data Sources:
– Transportation network from GTFS input;
– Census; and
– Puget Sound Household Travel Survey.
Highlights for the GIS-Based Walk-Accessibility Model include:
• Performing Agency. Metropolitan Washington Council of Governments (MWCOG);
• Study Area. Arlington County, Virginia;
• Model Structure. GIS-Based Walk-Accessibility Approach;
• Data Sources:
– Transportation network by NAVTEQ;
– Regional employment by Dun & Bradstreet; and
– Regional travel survey.
In addition to the tools developed directly by the NCHRP Project 08-78 research team, other tools, identified from existing practice, are found to merit inclusion in the guidebook,” (22) including Seattle Trip-Based Model, Portland Pedestrian Model, Baltimore MoPed Model, Maryland PedContext Model, Portland Bicycle Route Choice Model and Direct Demand Model.
Characteristics of “Estimating Bicycling and Walking for Planning and Project Development” Guidebook are listed in Table D.9. Complete profiles for the analytic tools discussed in the guidebook are listed in Appendix B. Detailed information is derived from the NCHRP Project 08-78. (22)
The Capital Area Metropolitan Planning Organization (CAMPO) Regional Growth Concept (24)(25), derived from the Envision Central Texas-preferred scenario (24)(25), is used to support the objective of the tool. An iterative process is performed for growth allocation under multiple growth scenarios and concluded until user-defined criteria are met. Throughout the allocation process, data input comes from the following sources: (24)(25)
• Regional vacant land inventory;
• Texas State Data Center’s county estimates;
• Emergency 9-1-1 (E 9-1-1) phone database;
• 2005 Third Quarter Texas Workforce Commission (TWC) data;
• Unemployment insurance estimates (ES-202 data), supplemented by InfoUSA;
• Building permit and septic permit, subdivision site plans, and land use and zoning plans;
• Commercial building permits and commercial site plans; and
• Highway travel times and transit travel times.

NCHRP 08-36, Task 131 Transportation Data Integration to Develop Planning Performance Measures
Cambridge Systematics, Inc. D-26
Table D.9 Characteristics of “Estimating Bicycling and Walking for Planning and Project Development” Guidebook
Geographic Scale Planning Applications Forecasting Elements Indicators and Metrics • Regional • Corridor • Subarea • Project/Site • Facility/Point
• Scenario Planning • Smart Growth/TOD • Transit • Comp/Master Plans • Traffic Impact Mitigation • NMT Facility Planning • Safety Analysis • Equity
• Auto Ownership • Trip Generation • Distribution • Mode Choice • Assignment
• Mode Shares • Walk Trips • Bike Trips • Vehicle Trips • Transit Trips • VMT • Walk Link Volumes • Bike Link Volumes • Intersection Volumes
Trip Purposes Model Relationships
and Sensitivity Tools and Expertise Data Requirements
• Work • School • Other • Recreation • Work-based • Non-home-based
• Land Use • Nonmotorized Network • Accessibility • Sociodemographics
• Travel Modeling • GIS Tools and Expertise • Data Management • Spreadsheet Mechanics • Statistical Analysis skills
• Travel Surveys • Census Population and
Employment • Walk Link Characteristics • Transit Stop Locations • Activity Counts • Parcel-Level Land Use • All-Streets Network in GIS
format • Bike Link Characteristics • Regional Model TAZ data and
Skims
Efforts required to adequately run the model include: (24)
• Suitability Analysis and Allocation Geography;
• Assumptions for Population and Employment;
• Ratings of Attractiveness; and
• Allocation and Aggregation of Forecast Demographics.
The following data are used for the implementation of the CAMPO Demographic Allocation Tool: (25)
• 2010 Demographic Skims (created in October 2014);
• Attractor Points geographic file (created in October 2014);
• Traffic Analysis Zone (TAZ) geographic file (created in October 2014); and
• Parcel geographic file (created in October 2014, but modified and merged in January 2015).
As a scenario-planning tool, the CAMPO Demographic Allocation Tool is replicable and quantitative. Equipped with GIS-based computer program, it allows for integration with the travel demand model under

NCHRP 08-36, Task 131 Transportation Data Integration to Develop Planning Performance Measures
Cambridge Systematics, Inc. D-27
multiple growth scenarios. Future work will focus on data collection efforts, refinements of the parcel-level data, and improvements on the attractiveness parameters.


NCHRP 08-36, Task 131 Transportation Data Integration to Develop Planning Performance Measures
Cambridge Systematics, Inc. E-1
Appendix E. Comparison of Two Emerging Performance Measures
E.1 Total Peak-Period Travel Time
The Texas A&M Transportation Institute (TTI) reported the total peak-period travel time (TPPTT) in the 2012 Urban Mobility Report.16 The measure uses a weighted average (by mode share) of trip travel times during the morning and evening peak periods for individual modes.17 Average peak-period travel time is calculated for an individual mode, and then integrated into the updated TPPTT. The total peak-period travel time (TPPTT) performance measure allows an in-depth mode comparison and further impact assessment. Though automobile travel is the primary mode here based on the methodology assumptions, future work will focus on bringing in additional modes as multimodal data sources become available.
E.2 Urban Macroscopic Network Accessibility Indicator
The Department of Civil Engineering, University of Minnesota introduced the Urban Macroscopic Network Accessibility Indicator in the Access Across America: Auto 2013.18 The measure estimates the number of jobs reachable from an average point in the metro area by automobile, with more weight given to jobs reachable within 10 minutes than 20 minutes and so on. As the first systematic approach using “consistent cumulative opportunity measurements” for metropolitan areas, the Urban Macroscopic Network Accessibility Indicator enables potential comparison of intermetropolitan accessibility using “observed network speeds and measured network circuities.”[4]
E.3 Comparison between the Two Performance Measures
Since the automobile remains the most widely used transportation mode for commuting, the overall comparison between the two performance measures is evaluated from the automobile perspective. Characteristics of the two performance measures are listed in Table E.1. Sample of results for the two performance measures are derived from the 2012 Urban Mobility Report[9] and Access Across America: Auto 2013 [11] (see Table E.2).
16 Schrank, D., B. Eisele, and T. Lomax. 2012. TTI’s 2012 Urban Mobility Report. Texas A&M Transportation Institute. The Texas A&M University System.
17 Lasley, P. 2015. Expanding Your Toolbox of Performance Measures at a Low Cost: A Total Peak-Period Travel Time Using Existing and Available Data. In Transportation Research Board 94th Annual Meeting (No. 15-4292).
18 Levinson, David. 2013. Access Across America: Auto 2013. CTS 13-20 Report No. 14 in the Series: Access to Destinations. Center for Transportation Studies, University of Minnesota.

NCHRP 08-36, Task 131 Transportation Data Integration to Develop Planning Performance Measures
Cambridge Systematics, Inc. E-2
Table E.1 Comparison of Total Peak Period Travel Time versus Urban Macroscopic Network Accessibility Indicator
Performance Measure Total Peak Period Travel Time
Urban Macroscopic Network Accessibility Indicator
Title 2012 Urban Mobility Report Access Across America: Auto 2013
Date December 2012 April 2013
Performing Organization
Texas A&M Transportation Institute, Texas A&M University System
Department of Civil Engineering, University of Minnesota
Sponsoring Organization
Southwest Region University Transportation Center
Center for Transportation Studies, University of Minnesota
Definition The weighted average (by mode share) of all trip travel times during the morning and evening peak periods for each mode (including telecommuting from home)
The weighted accessibility score measured by the number of jobs reachable from an average point in the metro area by automobile, with more weight given to jobs reachable within 10minutes than 20 minutes and so on
Category Mobility primarily (but can inform accessibility) Accessibility
Methodology Time based Network based
Unit of Analysis Minutes and Rank Score and Rank
Extent of Use 101 urban areas 51 metropolitan areas
Times of Day Both morning and evening peak periods Top accessible metropolan areas can be scored and ranked by the AM and PM peak period or the average of the two
Transportation Modes
Multimodal (automobile, bicycle, pedestrian, and telecommuting)
Automobile with further extension to other modes
Automobile Demonstration Data Input Vehicle miles traveled (VMT) Street network
Travel speed Travel speed
Commuter population Employment
Data Year 2010 2010
Data Sources TomTom 2009 and 2012 Urban Mobility Report
U.S Census Bureau’s American Community Survey (ACS)
U.S Census Bureau’s ACS
Highway Performance Monitoring System (HPMS)
HPMS
National Performance Management Research Data Set (NPMRDS)
U.S Census Bureau’s Transportation Investment Generating Economic Recovery (TIGER)/Line files

NCHRP 08-36, Task 131 Transportation Data Integration to Develop Planning Performance Measures
Cambridge Systematics, Inc. E-3
Table E.2 Sample of Results of Total Peak-Period Travel Time and Urban Macroscopic Network Accessibility Indicator
Urban Areaa/ Metro Areab
Total Peak Period Travel Time (2010) Urban Macroscopic Network Accessibility Indicator (2010)
Rank Minutesc Weighted
Rankd 10
Minutes 20
Minutes 30
Minutes 40
Minutes 50
Minutes 60
Minutes Atlanta, GA 3 50 28 51 51 37 15 9 9
Boston, MA-NH-RI 6 48 9 20 18 9 6 4 4
Chicago, IL-IN 24 44 4 14 13 5 3 3 3
Dallas-Fort Worth-Arlington, TX
35 42 8 17 17 7 5 5 5
Detroit, MI 6 48 19 33 31 17 12 13 13
Los Angeles-Long Beach-S Ana, CA
6 48 1 3 2 1 1 1 2
Miami, FL 18 45 12 29 23 12 8 10 10
New York-Newark NY-NJ-CT
3 50 3 5 5 3 2 2 1
Philadelphia PA-NJ-DE-MD
18 45 14 38 34 22 11 6 6
Phoenix-Mesa, AZ 30 43 15 22 26 13 13 14 14
San Diego, CA 40 41 13 10 8 8 17 17 17
San Francisco-Oakland, CA
9 47 2 1 1 2 9 11 11
Seattle, WA 24 44 25 43 48 33 14 15 15
Washington, D.C.-VA-MD
1 53 7 16 15 6 4 7 7
a For the 2010 Census, an urban area will comprise a densely settled core of census tracts and/or census blocks that meet minimum population density requirements, along with adjacent territory containing nonresidential urban land uses, as well as territory with low population density included to link outlying densely settled territory with the densely settled core. To qualify as an urban area, the territory identified according to criteria must encompass at least 2,500 people, at least 1,500 of which reside outside institutional group quarters. The Census Bureau identifies Urbanized Areas (UA) as urban areas of 50,000 or more people.
b A metropolitan or micropolitan statistical area’s geographic composition, or list of geographic components at a particular point in time, is referred to as its “delineation.” Metropolitan and micropolitan statistical areas are delineated by the U.S. Office of Management and Budget (OMB) and are the result of the application of published standards to Census Bureau data. The standards for delineating the areas are reviewed and revised once every 10 years, prior to each decennial census. Generally, the areas are delineated using the most recent set of standards following each decennial census. Between censuses, the delineations are updated to reflect Census Bureau population estimates.
c Total travel time in minutes of peak-period road travel per auto commuter. d An average of accessibility rankings, giving a higher weight to closer jobs.
NCHRP 08-36, Task 131 Transportation Data Integration to Develop Planning Performance Measures
Cambridge Systematics, Inc. E-4
E.4 Conclusions
Regarding the total peak-period travel time (TPPTT) performance measure, through developing data collection methods and technologies, it is anticipated that multimodal data will become available (e.g., bicycle travel time, pedestrian travel time, and telecommuting travel time) to fill existing multimodal data gaps. Though not mature, an approach such as the TPPTT that can integrate multiple modes provides a promising method for comprehensive assessment of the transportation system.
Regarding the Urban Macroscopic Network Accessibility Indicator performance measure, consistent geographical boundaries and employment densities are adopted in the research study. Differentiating accessibility by breaking down jobs by type can be a next step to better evaluate the accessibility. Computing accessibility for other transportation modes can be an extension (e.g., bicycle, and pedestrian) for further consideration. Besides transportation modes, nonwork destinations (e.g., commercial, educational, and recreational destinations) also matter for evaluating the accessibility. New data sources are expected to yield informative results in the future.
Documentation of One Expanded Case Study: Using Cellphone O/D Data for Regional Travel Model Validation
AirSage is the largest provider of cellular origin-destination data in the U.S. Through partnerships with the nation’s largest wireless carriers, AirSage has exclusive access to mobile device signaling data. Cellular-signal data points are first captured when the mobile devices are active on the cellular network, and then converted into real-time location data by extracting the time and location. AirSage aggregates the cellular-signal data points (with time and location attributes) into origin-destination data using Wireless Signal Extraction (WiSE™) technology.
One of the applications of AirSage cellular origin-destination data is model validation. The Syracuse Metropolitan Transportation Council (SMTC) Travel Model is an example. SMTC is a regional travel model, developed by SMTC for the Metropolitan Planning Area (which includes City of Syracuse in Onondaga County and portions of Madison and Oswego Counties), including 1,185 internal and external zones, extends 45 miles north-south and 35 miles east-west.19 The SMTC Travel Model is designed as a traditional, four-step model with built-in TransCAD software packages and Geographical Information Systems (GIS) components.
Cellular origin-destination data in this case are collected on a daily time period in October 2013, by selected time periods (AM peak, PM peak, and off peak) and trip purposes (Home-Based Work (HBW), Home-Based Other (HBO), and Non-Home-Based (NHB)).20
In the model validation phase, comparisons across various dimensions are conducted. Figure E.1 presents the correlation of town-to-town trips in Syracuse (Total and by Trip Purposes) with the AirSage trips on the x axis and the Model trips on the y axis. Upper left in Figure E.1 shows total trips. Upper right in Figure E.1
19 Bindra, S. 2016. Using Cellphone OD Data for Regional Travel Model Validation. In Transportation Research Board 95th Annual Meeting (No. 16-6488).
20 Bindra, S., B. Grady, and J. Deshaies. 2015. Using Cellphone Origin-Destination Data for Regional Travel Model Validation, presentation presented at the 15th TRB National Transportation Planning Applications Conference, Atlantic City, New Jersey.

NCHRP 08-36, Task 131 Transportation Data Integration to Develop Planning Performance Measures
Cambridge Systematics, Inc. E-5
shows HBW trips. Lower left in Figure E.1 shows HBO trips. Lower right in Figure E.1 shows NHB trips. When comparing town-to -own trips, the correlation between AirSage trips and the Model trips is more robust for total trips than trips by trip purposes.
Figure E.1 Town to Town Trips in Syracuse – Total and by Trip Purpose Adapted from Reference 12
However, through comparison by trip purposes, the AirSage model shows stronger capability of identifying HBO trips than HBW trips and NHB trips, compared to the National Capital Region Transportation Planning Board (TPB) model and Mobile Area Transportation Study (MATS) model (See Figure E.2). 12,13 Comparison by trip purposes suggests that AirSage is more suitable for model validation at aggregated levels.12,13 Both Figure E.1 and Figure E.2 are available elsewhere for the interested reader.

NCHRP 08-36, Task 131 Transportation Data Integration to Develop Planning Performance Measures
Cambridge Systematics, Inc. E-6
Figure E.2 Comparing Trip Purpose Percent Shares Adapted from Reference 12
In this case study, for special zones of interest, AirSage fails to capture a substantial amount of trips due to the clustering algorithms used to define trip purposes. Comparisons for trip length frequency distribution (TLFD) and time-of-day partitions were performed as well. Figure E.3 presents the comparisons of Trip Length Frequency Distribution (TLFD) between total trips and trips by purposes. Figure E.4 presents the comparisons of Time-of-Day Distribution between total trips and trips by purposes. Results show both similarities and variations among different trip purposes.12,13 Both Figure E.3 and Figure E.4 are available elsewhere for the interested reader.12
Comparing the SMTC Travel Model with the AirSage cellular origin-destination data yields important conclusions. When using AirSage cellular origin-destination data, the following factors should be carefully considered when transportation agencies perform analysis of the study areas due to the clustering algorithms adopted in the process of data collection:12,13 level of aggregation, purpose of trips, average trip length, size of external zones, time of data collection, time-of-day partitions, trip length frequency distribution, and demographic components.

NCHRP 08-36, Task 131 Transportation Data Integration to Develop Planning Performance Measures
Cambridge Systematics, Inc. E-7
Figure E.3 Trip Length Frequency Distribution (TLFD) Comparison Adapted from Reference 12
Figure E.4 Time-of-Day Distribution Comparison