Embed Size (px)
Citation preview
NCES Update
Jack Buckley, Commissioner
Marilyn Seastrom, Acting Deputy Commissioner
December, 2011
Washington, DC
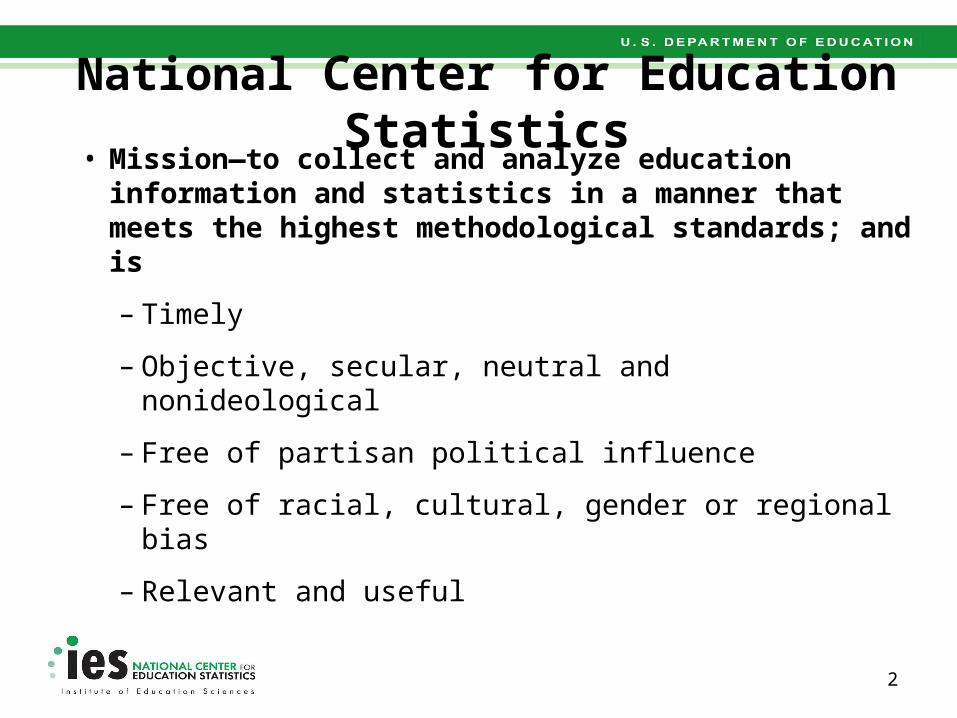
National Center for Education Statistics• Mission—to collect and analyze education information
and statistics in a manner that meets the highest methodological standards; and is
– Timely
– Objective, secular, neutral and nonideological
– Free of partisan political influence
– Free of racial, cultural, gender or regional bias
– Relevant and useful
2
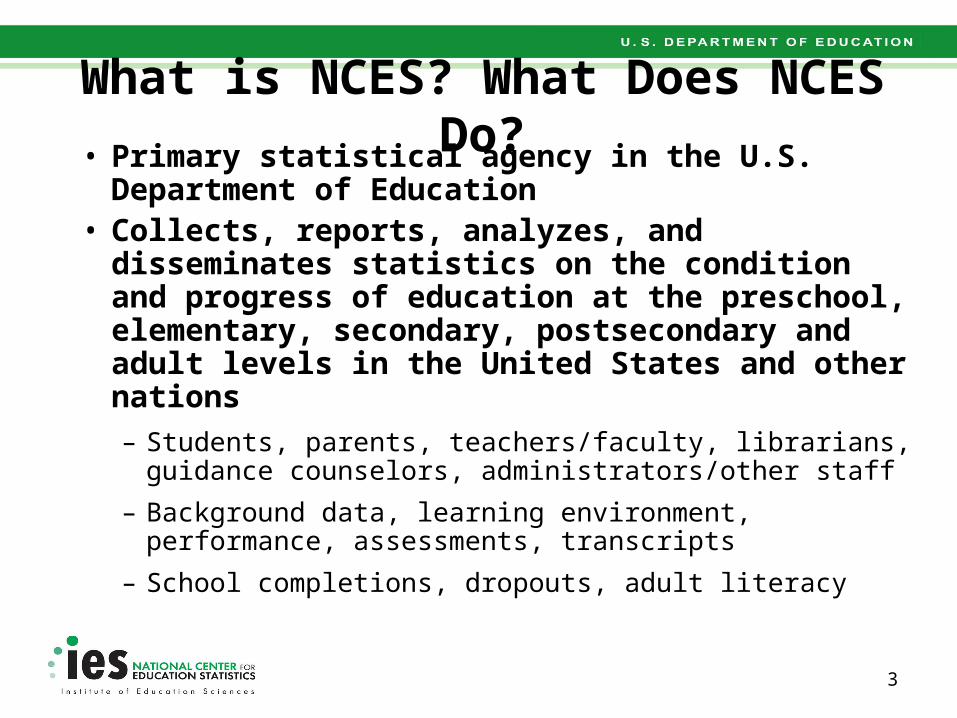
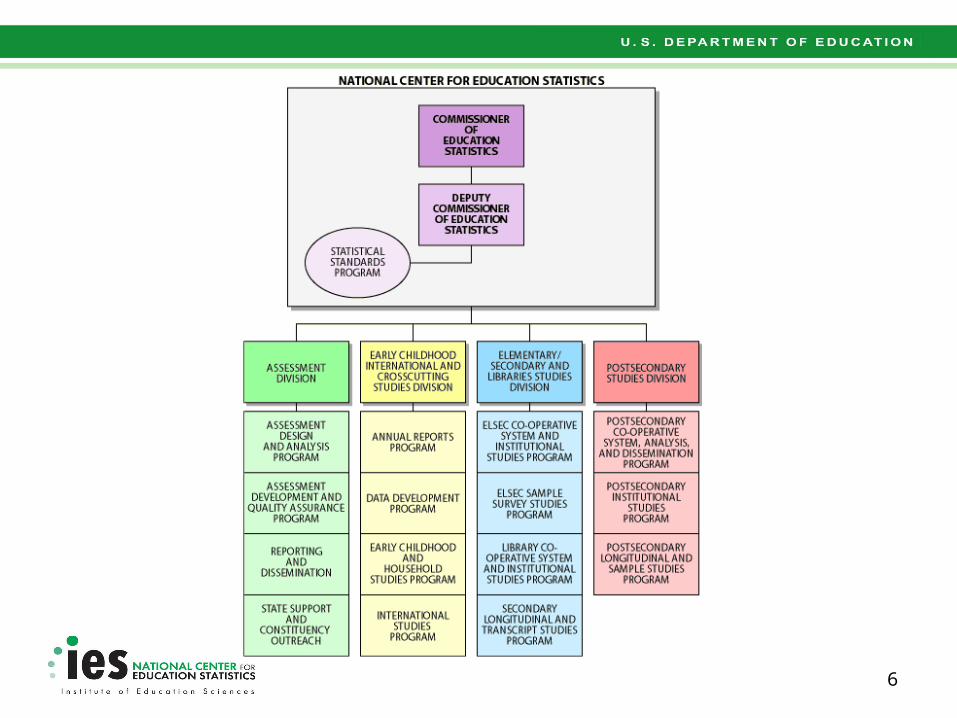
What is NCES? What Does NCES Do?• Primary statistical agency in the U.S. Department of
Education• Collects, reports, analyzes, and disseminates statistics
on the condition and progress of education at the preschool, elementary, secondary, postsecondary and adult levels in the United States and other nations– Students, parents, teachers/faculty, librarians, guidance
counselors, administrators/other staff– Background data, learning environment, performance,
assessments, transcripts– School completions, dropouts, adult literacy
3
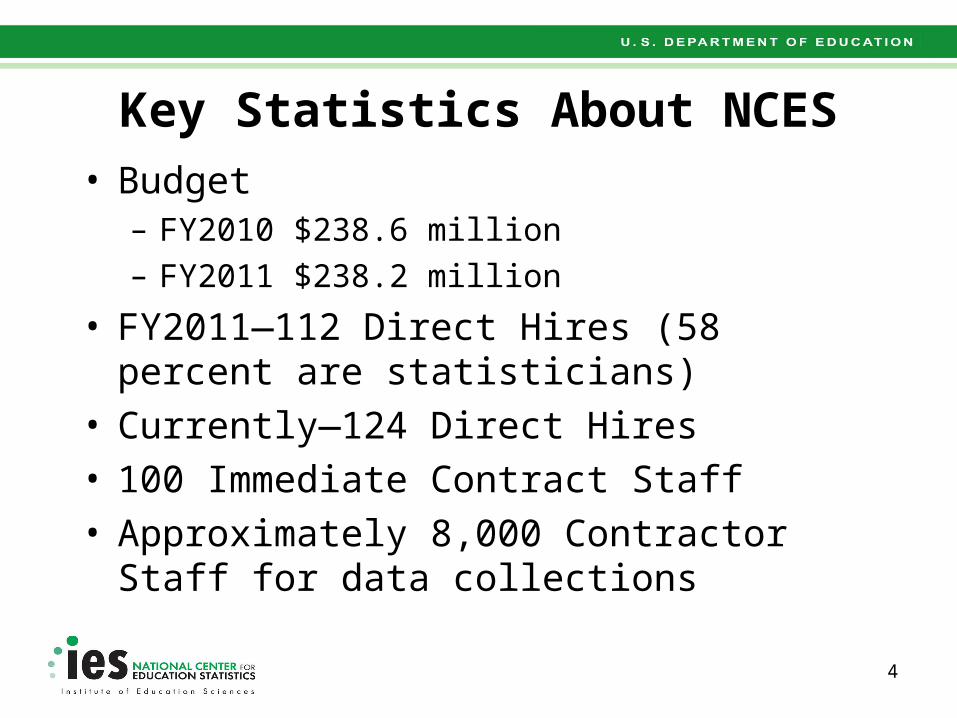
Key Statistics About NCES• Budget
– FY2010 $238.6 million– FY2011 $238.2 million
• FY2011—112 Direct Hires (58 percent are statisticians)
• Currently—124 Direct Hires • 100 Immediate Contract Staff• Approximately 8,000 Contractor Staff for data
collections
4
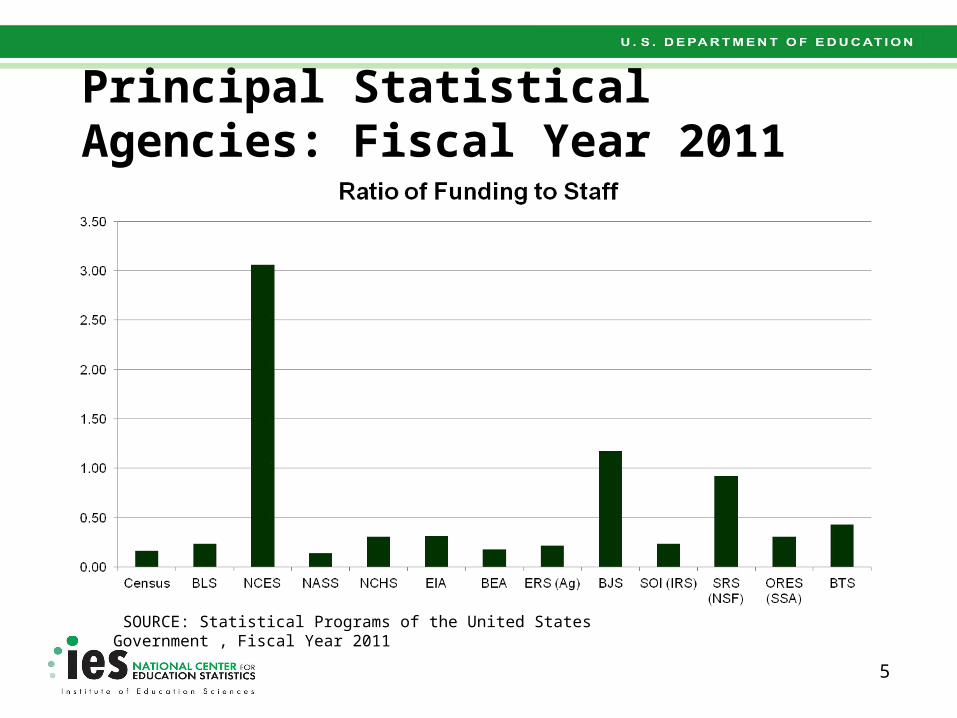
Principal Statistical Agencies: Fiscal Year 2011
5
SOURCE: Statistical Programs of the United States Government , Fiscal Year 2011
6
Commissioner’s Office Update
• State Longitudinal Data System Grant Program
• Support for Department’s Privacy Initiatives
7
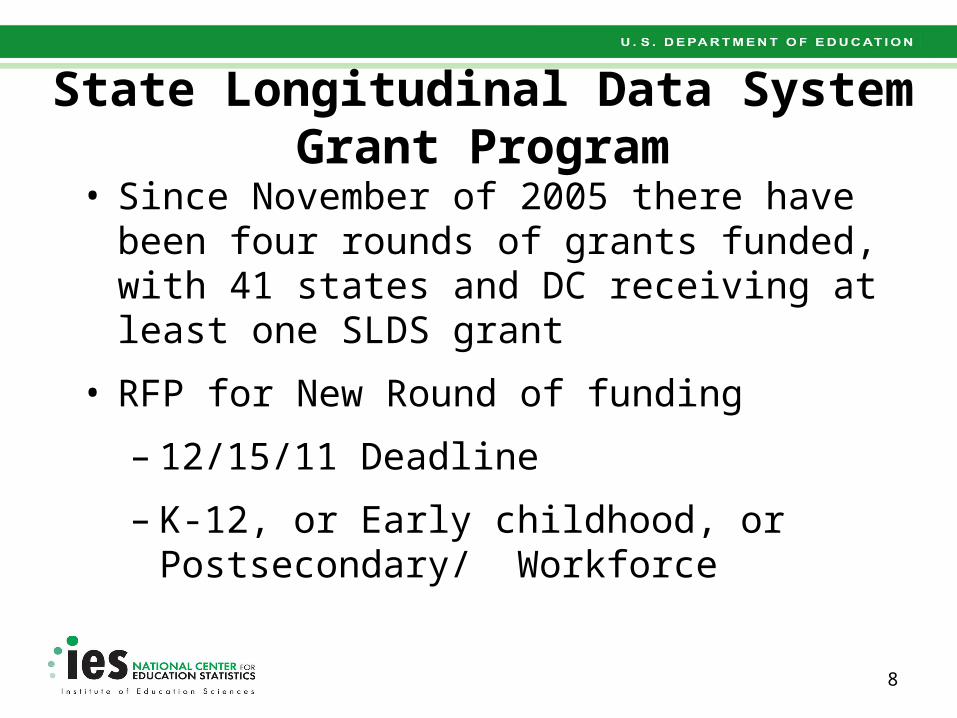
State Longitudinal Data System Grant Program
• Since November of 2005 there have been four rounds of grants funded, with 41 states and DC receiving at least one SLDS grant
• RFP for New Round of funding
– 12/15/11 Deadline
– K-12, or Early childhood, or Postsecondary/ Workforce
8
Support for Department’s Privacy Initiative
• Established and launched the Privacy Technical Assistance Center (PTAC)
• Issues technical briefs for comment to further the national conversation on the best practices for data security and privacy
9
Assessment Division Update
• State Mapping Report
• 2001 Reading and Mathematics Report Cards
10
2011 – Busiest Year in the History of NAEP
• 2009 Science Report Card• 2009 High School Transcript Study• 2010 Civics Report Card• 2010 History Report Card• 2010 Geography Report Card• 2011 Reading and Mathematics Report Card• Hispanic and White Achievement Gaps • State Mapping• State Inclusion Rates
11
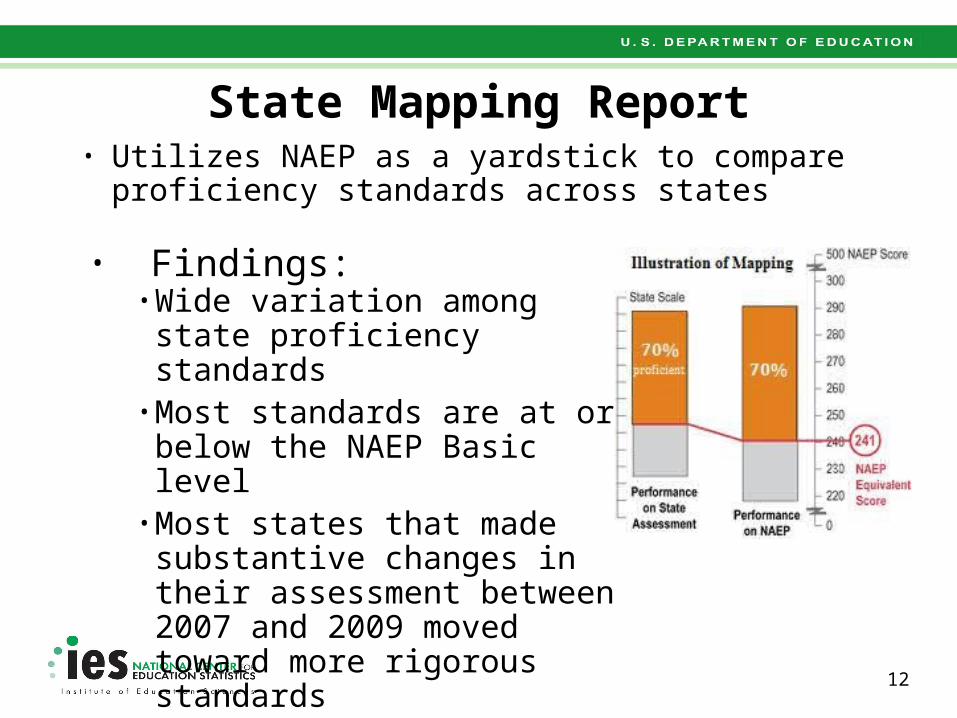
State Mapping Report• Utilizes NAEP as a yardstick to compare
proficiency standards across states
12
• Findings:• Wide variation among state proficiency standards
• Most standards are at or below the NAEP Basic level
• Most states that made substantive changes in their assessment between 2007 and 2009 moved toward more rigorous standards
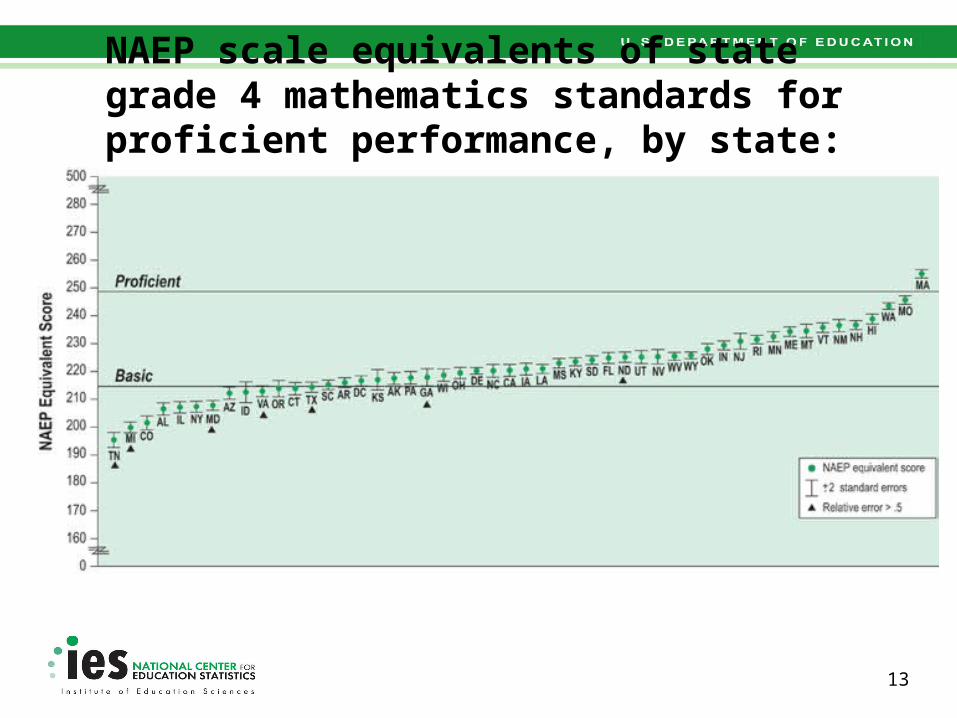
NAEP scale equivalents of state grade 4 mathematics standards for proficient performance, by state: 2009
13
November 1 Release of 2011 Reading and Mathematics Report Card
• Trend data to the 1990’s (varies by subject/grade)
• 4th- and 8th-grade state results on overall and subgroup performance and gaps
• Trial Urban district Assessment (TUDA) report will be released next week
14
Elementary and Secondary Update
• Expansion of NCES GeoMapping Application
• Schools and Staffing Survey and Related Components
15
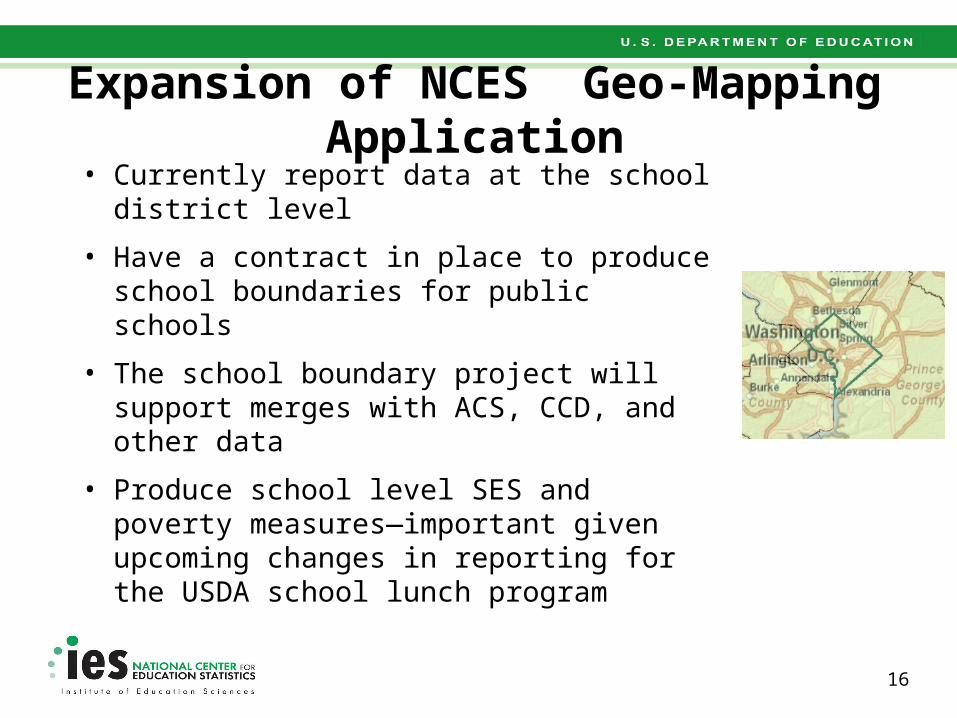
Expansion of NCES Geo-Mapping Application• Currently report data at the school district
level
• Have a contract in place to produce school boundaries for public schools
• The school boundary project will support merges with ACS, CCD, and other data
• Produce school level SES and poverty measures—important given upcoming changes in reporting for the USDA school lunch program
16
Schools and Staffing Survey System
• From its 1988 inception, SASS has had four core components: the School Questionnaire, the Teacher Questionnaire, the Principal Questionnaire, and the School District Questionnaire
• Also includes a Teacher Follow-up Survey and now a Principal Follow-up Survey
• Last conducted in 2007-08, 7th round now in data collection for the 2011-2012 school year
• Many questions and concepts are repeated over time
17
Postsecondary, Adult, and Career Education (PACE) Update
• Improving Transparency for Students, Parents, and Policy Makers
• Latest Baccalaureate and Beyond Study (B&B)
18
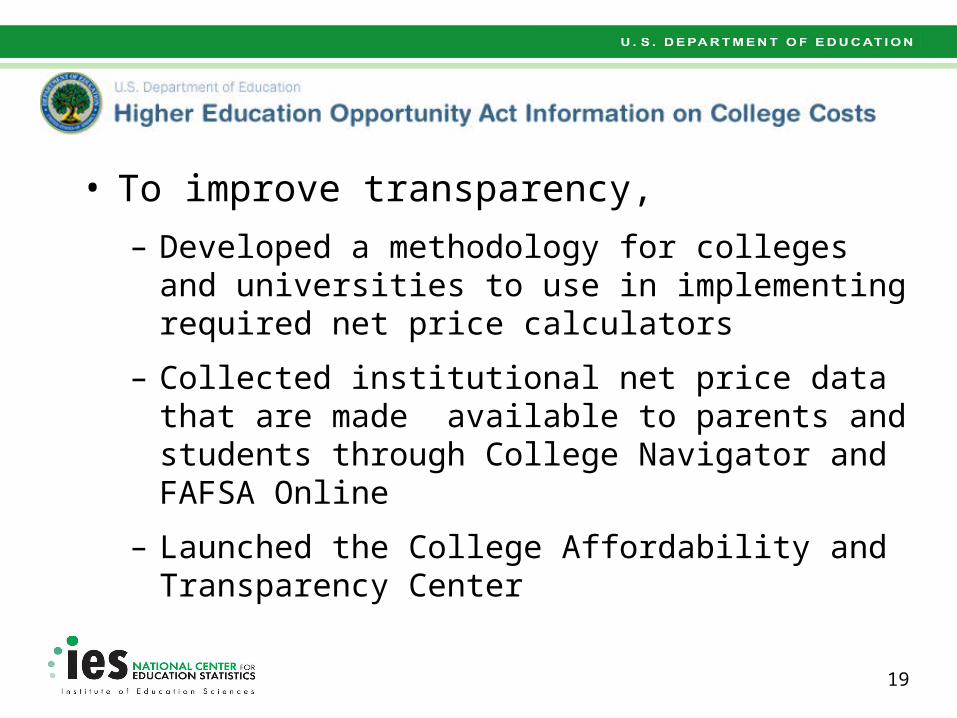
• To improve transparency,
– Developed a methodology for colleges and universities to use in implementing required net price calculators
– Collected institutional net price data that are made available to parents and students through College Navigator and FAFSA Online
– Launched the College Affordability and Transparency Center
19

College Affordability and Transparency Center
• Provides information about tuition and net prices at postsecondary institutions
• Highlights institutions with high and low tuition and fees as well as high and low net prices (the price of attendance minus grant and scholarship aid)
• Shows institutions where tuition and fees and net prices are increasing at the highest rates
20
Baccalaureate and Beyond Study
• Nationally representative cohort of 2007-08 bachelor degree graduates
– First follow-up observes graduates one year after degree completion (prior studies followed cohort for up to 10 years)
– Focus on educational debt and its repayment; education and training; and post-schooling wages and career (especially teaching)
– Upcoming release of transcript data
21
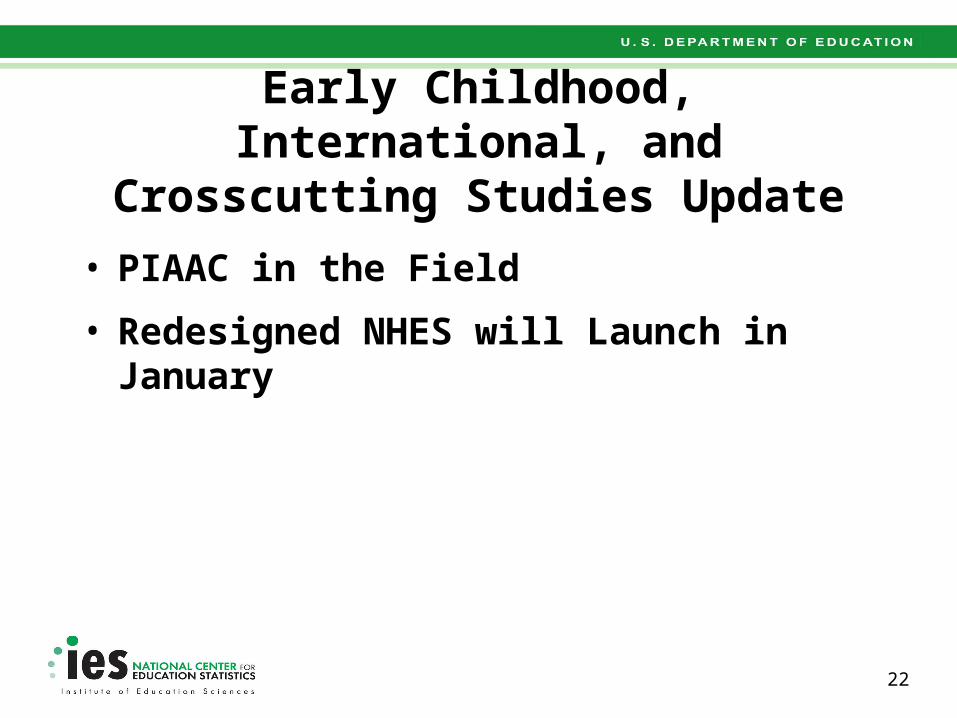
Early Childhood, International, and Crosscutting Studies Update
• PIAAC in the Field
• Redesigned NHES will Launch in January
22
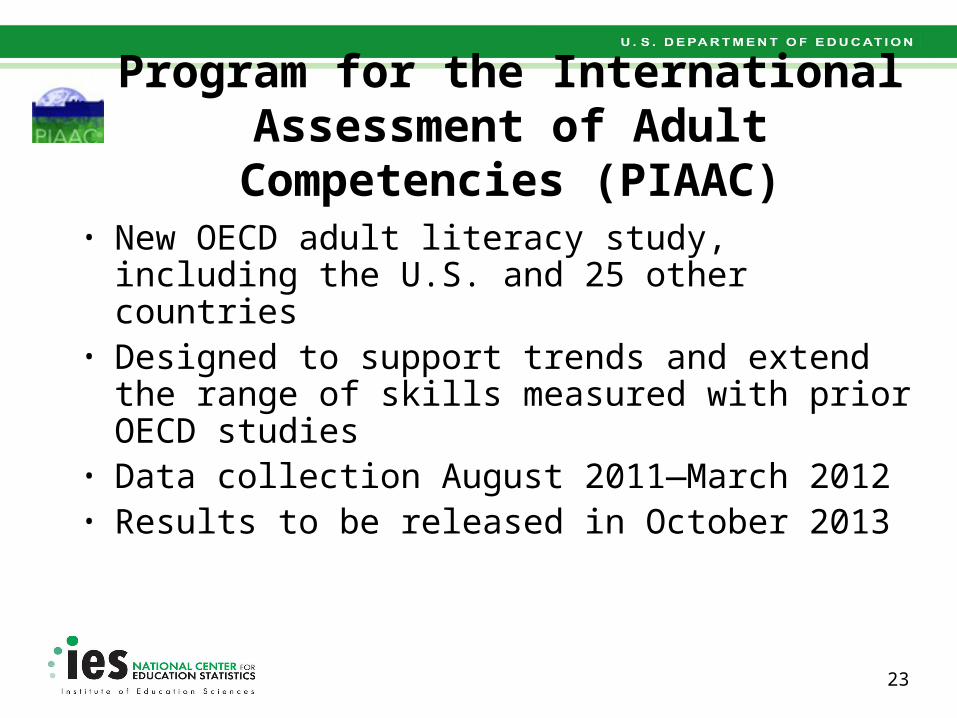
Program for the International Assessment of Adult Competencies (PIAAC)
• New OECD adult literacy study, including the U.S. and 25 other countries
• Designed to support trends and extend the range of skills measured with prior OECD studies
• Data collection August 2011—March 2012• Results to be released in October 2013
23
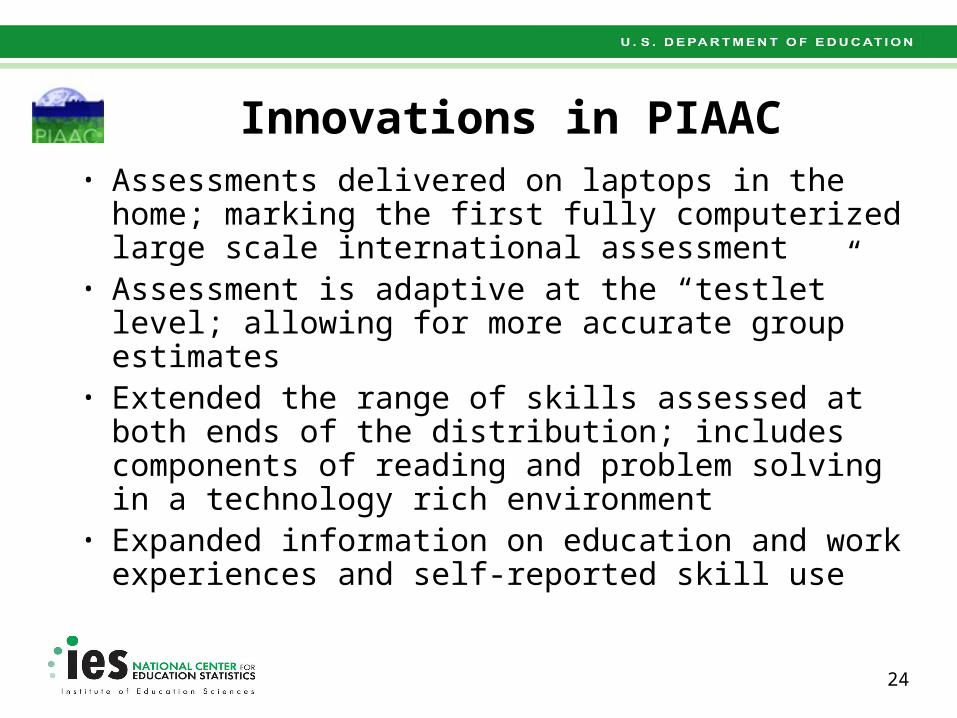
Innovations in PIAAC• Assessments delivered on laptops in the home;
marking the first fully computerized large scale international assessment
• Assessment is adaptive at the “testlet” level; allowing for more accurate group estimates
• Extended the range of skills assessed at both ends of the distribution; includes components of reading and problem solving in a technology rich environment
• Expanded information on education and work experiences and self-reported skill use
24
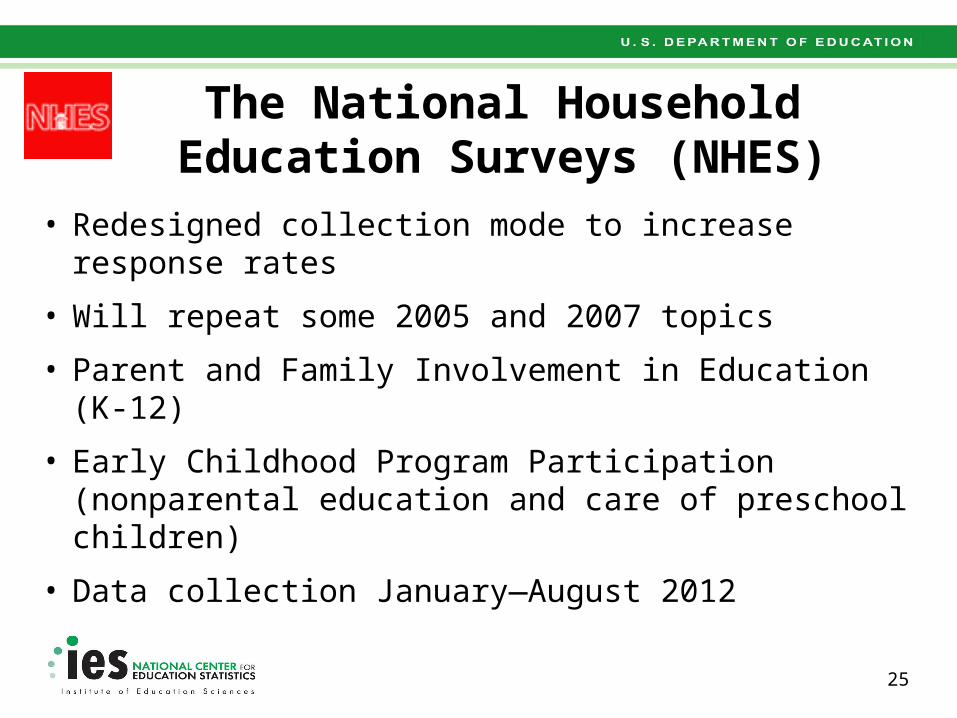
The National Household Education Surveys (NHES)
• Redesigned collection mode to increase response rates
• Will repeat some 2005 and 2007 topics
• Parent and Family Involvement in Education (K-12)
• Early Childhood Program Participation (nonparental education and care of preschool children)
• Data collection January—August 2012
25
Innovations in NHES
• Shift from land-line phone to address frame to reduce problems with sample representativeness
• Shift from phone interviews to 2-stage mail collection to improve response rates
• Collection conducted through the Census Bureau to improve response rates
• Simplified instruments in response to concerns over literacy issues and accessibility
26
New Horizons
• Improving on the Past: Longitudinal Study of Early Adolescence (LSEA)
• Innovation at NCES: NAEP-TIMSS Link
27
Improving on the Past: Longitudinal Study of Early Adolescence (LSEA)
• Nationally representative cohort of students in the middle-school years—grades 6 through 8
– First round of data collection (2016-17), following the completion of the current ECLS:K-5
– Next high school cohort would then start with 9th graders in 2019-2020
– Build links across studies using administrative data, other retrospective data, and imputations
– A slight shift to NPSAS periodicity could allow Beginning Postsecondary Study (BPS) to pick up the cohort
28
Innovation at NCES: NAEP-TIMSS Link
• Policy makers interested in international benchmarking performance of states and districts
• Direct approach is to have states/districts participate in international assessments• May not be practical due to
• Fiscal considerations• Increased testing demands
29
Innovation at NCES: NAEP-TIMSS Link• Alternative approach – benchmark performance
through statistical linking of international assessments with existing state and national assessments• Linking of NAEP and TIMSS is of particular
interest and value due to math/science content
• Administer NAEP and TIMSS 8th grade mathematics and science to samples of students in both studies
30

Innovation at NCES: NAEP-TIMSS Link
• Goals of the linking study• Estimate a link between NAEP and TIMSS at the
national level• Provide each state with an overall predicted mean
TIMSS score• Predict the percentages of students in the states who
would score above selected points on the TIMSS scale • Evaluate whether state level TIMSS results can be
successfully predicted from NAEP results without linking samples/instruments
31
NCES Contact Information
NCES website: http://nces.ed.gov/NCES newsflash: sign up at http://ies.ed.gov/newsflash/
Jack [email protected]
Marilyn [email protected]
Thank you
32